Embed Size (px)
Citation preview
Comprehensive Analysis of RNA-Seq Data
Ewing’s Sarcoma Study
Comprehensive Analysis of RNA-seq Data
— 2 —
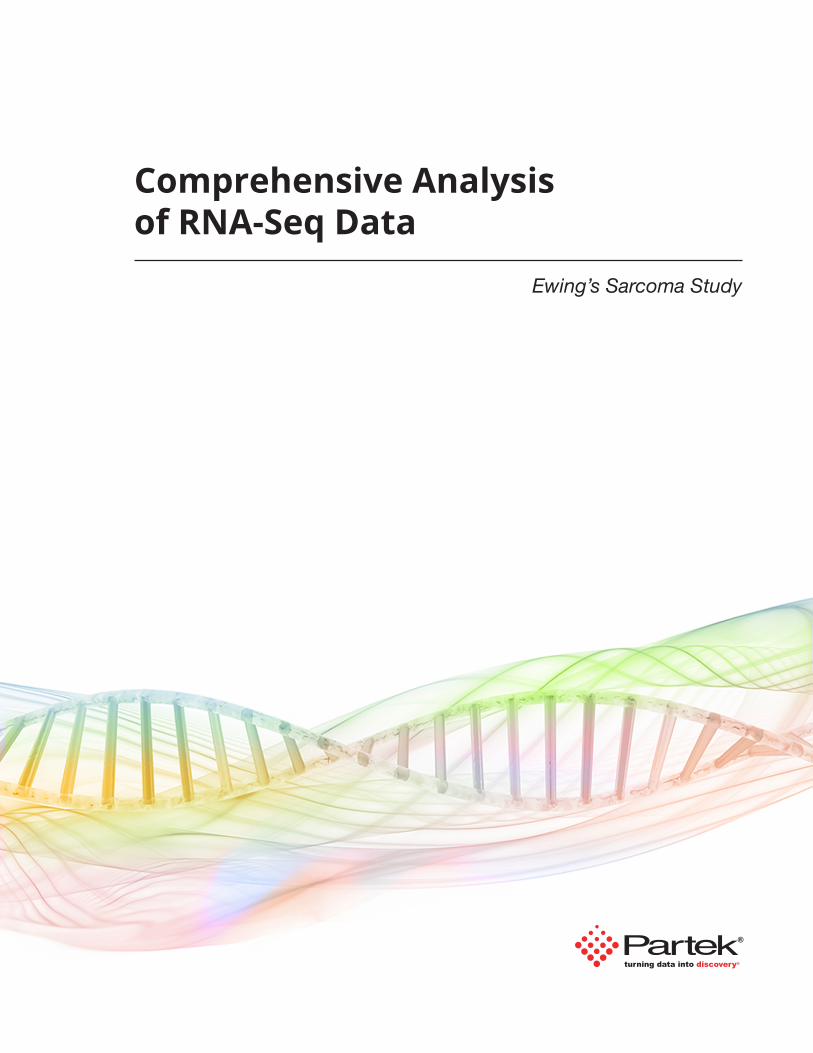
IntroductionRNA sequencing (RNA-Seq) opens the door to many new discoveries. Using RNA-Seq, exploration can be performed such as:
1. Differentialgeneexpression2. Transcript expression3. Alternative splicing4. Detect new exons, transcripts and splice variants5. Allelespecificexpression6. Coding SNPs7. Pathways and biological interpretation
This case study demonstrates the RNA-Seq analysis of a Ewing’s Sarcoma data set. The samples were sequenced on an Ion Torrent™ PGM sequencer with analysis per-formed in Partek® Flow®, Partek® Genomics Suite®, and Partek® Pathway™ software. This experiment compares two tumor cell lines derived from Ewing’s sarcoma; a primary and a metastatic cell line withnon-tumorfibroblasts,laterreferredtoas“normal”,de-rived from the same patients. Genomic changes between
normal and tumor tissue are explored, as well as the mech-anisms that turn a primary tumor metastatic allowing it to spread to other parts of the body.
Data Import and Quality Control Partek Flow is used to directly import the sequencing reads from TorrentSuite™ software via the Partek Flow Uploader which is integrated with TorrentSuite™ software. The data has three replicates for each of the three cell lines; nine samples in total are imported.
To identify if there are adaptor sequences that require trimming prior to performing alignment, the base composition histogram in figure 2 is used. Based on this graph it is deter-mined that there are no adaptor sequences to be trimmed. Additionally, Phred scores, which give an average quality score per position, are used to investigate the need to trim away reads with low quality bases. In this experiment reads aretrimmedtoexcludebasesbelowascoreof13(figure3). Trimming enables removal of sequence ends that are of low quality. Advanced trimming options allow low quality 3’ ends on a ‘per read’ basis to be removed. Each base is screened from the 3’ end until the threshold is met. Minimal approvedlengthforthereadsisspecifiedandifthetrimmingshortens the reads beyond the threshold, the reads are dis-carded.
What is Ewing’s Sarcoma?
Ewing’s sarcoma is a rare cancer that can form in bone and soft tissue. It is the second most frequent primary malignant bone cancer found in young people. Patients usually experi-ence extreme bone pain and the tumor can quickly be-come metastatic and spread quickly to the lungs, other bones,ortothebonemarrow.Theoverallfive-yearsur-vival rate for Ewing’s sarcoma is approximately 60%.
FIGURE 1: Distribution of Ewing’s Sarcoma.
FIGURE 2: Base composition histogram shows this study does not have adaptor sequences.
FIGURE 3: Phred score diagram helps identify threshold of quality reads for trimming.
Comprehensive Analysis of RNA-seq Data
— 3 —
Alignment, Quantification, and NormalizationPartek Flow, which offers a wide selection of alignment algo-rithms from which to choose, is used to align the reads. For this study the TMAP algorithm in combination with TopHat2 to capture junction read information is used. In working with next generation sequencing (NGS) data, Partek scientists have found that a combination of multiple aligners can at times im-prove results. Quantification and normalization are performed with an expectation maximization (EM) algorithm. Quantifica-tion maps all reads to the exon structure of a chosen tran-scriptome database such as RefSeq, GENCODE, Ensembl, AceView, or estimated levels of each transcript in all samples are calculated by the quantification process.
Differential Transcript ExpressionTo avoid any prior assumptions about the data, the Partek developed Gene Specific Analysis (GSA) statistical model is used. Although it is widely accepted that all genes do not be-have in the same way, are affected by the same experimental factors, or have the same data distribution, researchers have frequently applied a single statistical algorithm to all genes within their studies. In comparison, the novel GSA algorithm selects the best statistical model for each gene. This acknowl-edges the fact that each gene is influenced by different fac-tors and that each gene has a unique data distribution. Two important advantages of GSA are that it gives more statistical power through a better model fit and it provides more infor-mation about which experimental factors are influencing gene expression. This study shows that all genes do not have the same dis-tribution. Figure 4 shows 76.43% of genes exhibit a Poisson distribution, 20.73% a normal distribution (to which GLM sta-tistics are applicable), and 2.84% a negative binomial distribu-tion. The gene expression profiles in this study clearly display different distributions and benefit from applying different sta-tistical tests for differential transcript expression.
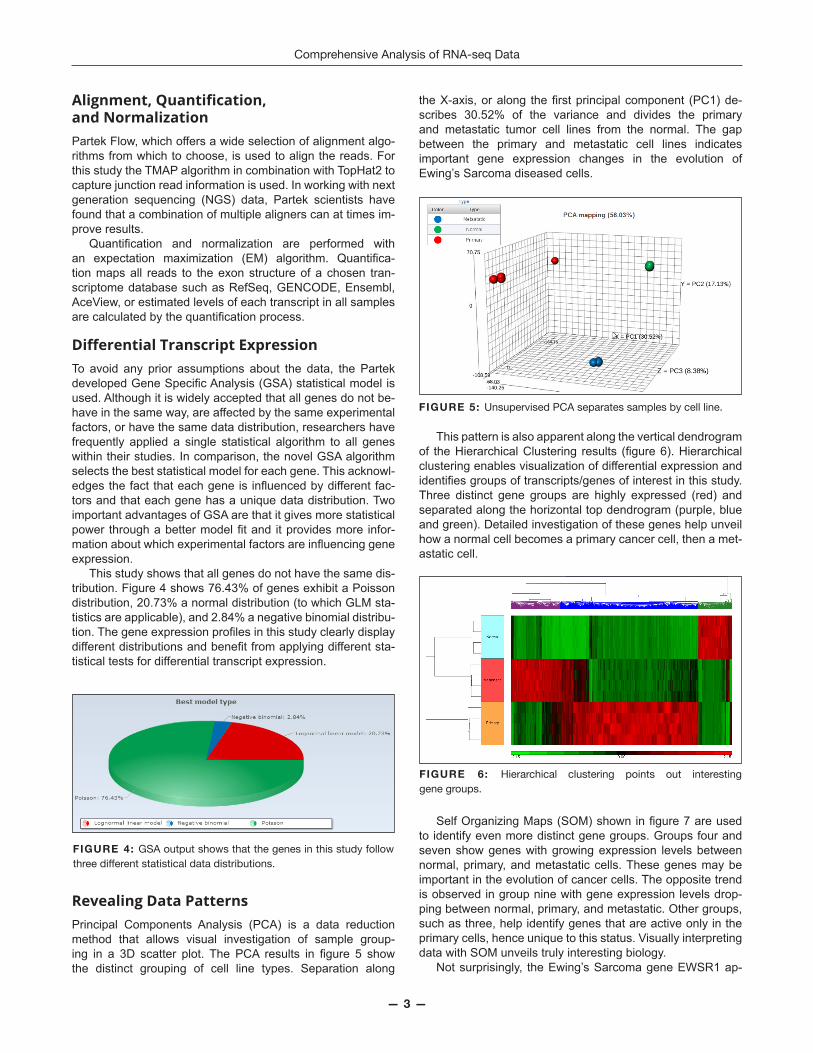
Revealing Data PatternsPrincipal Components Analysis (PCA) is a data reduction method that allows visual investigation of sample group-ing in a 3D scatter plot. The PCA results in figure 5 show the distinct grouping of cell line types. Separation along
the X-axis, or along the first principal component (PC1) de-scribes 30.52% of the variance and divides the primary and metastatic tumor cell lines from the normal. The gap between the primary and metastatic cell lines indicates important gene expression changes in the evolution of Ewing’s Sarcoma diseased cells.
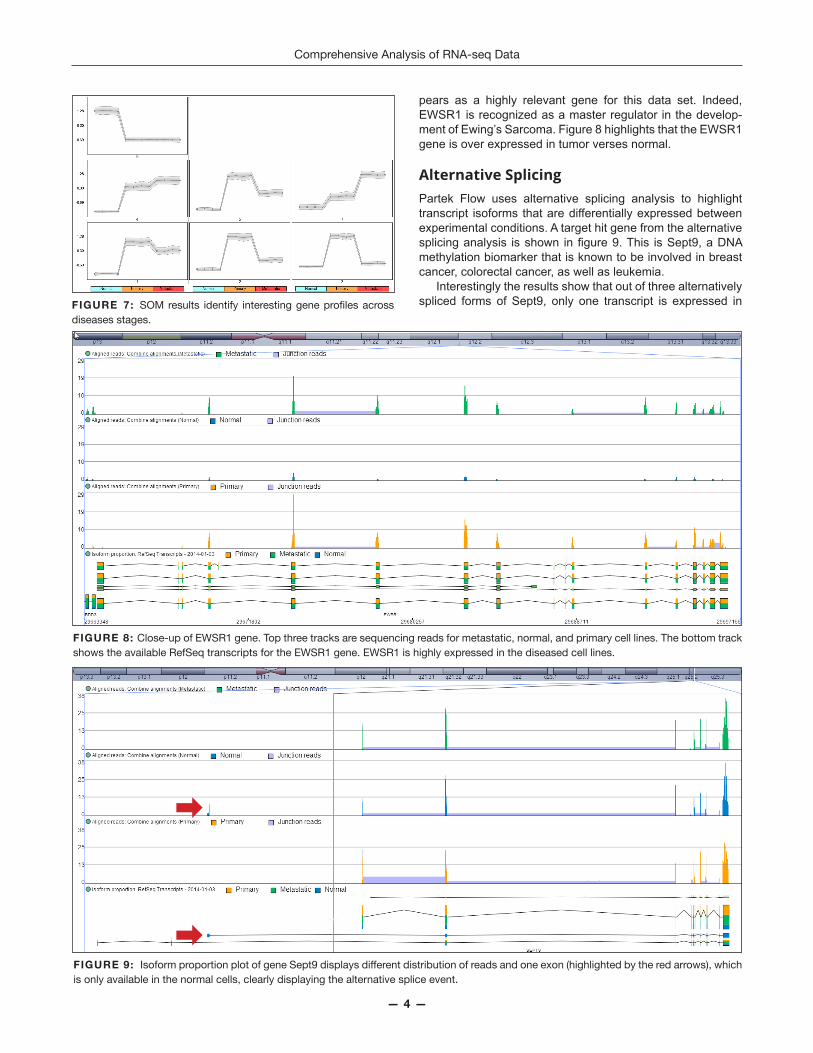
This pattern is also apparent along the vertical dendrogram of the Hierarchical Clustering results (figure 6). Hierarchical clustering enables visualization of differential expression and identifies groups of transcripts/genes of interest in this study. Three distinct gene groups are highly expressed (red) and separated along the horizontal top dendrogram (purple, blue and green). Detailed investigation of these genes help unveil how a normal cell becomes a primary cancer cell, then a met-astatic cell.
Self Organizing Maps (SOM) shown in figure 7 are used to identify even more distinct gene groups. Groups four and seven show genes with growing expression levels between normal, primary, and metastatic cells. These genes may be important in the evolution of cancer cells. The opposite trend is observed in group nine with gene expression levels drop-ping between normal, primary, and metastatic. Other groups, such as three, help identify genes that are active only in the primary cells, hence unique to this status. Visually interpreting data with SOM unveils truly interesting biology. Not surprisingly, the Ewing’s Sarcoma gene EWSR1 ap-
FIGURE 4: GSA output shows that the genes in this study follow threedifferentstatisticaldatadistributions.
FIGURE 5: Unsupervised PCA separates samples by cell line.
FIGURE 6: Hierarchical clustering points out interesting gene groups.
Comprehensive Analysis of RNA-seq Data
— 4 —
pears as a highly relevant gene for this data set. Indeed, EWSR1 is recognized as a master regulator in the develop-ment of Ewing’s Sarcoma. Figure 8 highlights that the EWSR1 gene is over expressed in tumor verses normal.
Alternative Splicing Partek Flow uses alternative splicing analysis to highlight transcript isoforms that are differentially expressed between experimental conditions. A target hit gene from the alternative splicing analysis is shown in figure 9. This is Sept9, a DNA methylation biomarker that is known to be involved in breast cancer, colorectal cancer, as well as leukemia. Interestingly the results show that out of three alternatively spliced forms of Sept9, only one transcript is expressed in
FIGURE 8: Close-up of EWSR1 gene. Top three tracks are sequencing reads for metastatic, normal, and primary cell lines. The bottom track shows the available RefSeq transcripts for the EWSR1 gene. EWSR1 is highly expressed in the diseased cell lines.
FIGURE 7: SOMresults identify interestinggeneprofilesacrossdiseases stages.
FIGURE 9: IsoformproportionplotofgeneSept9displaysdifferentdistributionofreadsandoneexon(highlightedbytheredarrows),whichis only available in the normal cells, clearly displaying the alternative splice event.
Comprehensive Analysis of RNA-seq Data
— 5 —
the normal fibroblasts (highlighted in figure 9), but not in the cancer cell lines. Further investigation is needed to determine if Sept9 could be utilized as a biomarker for Ewing’s Sarcoma.
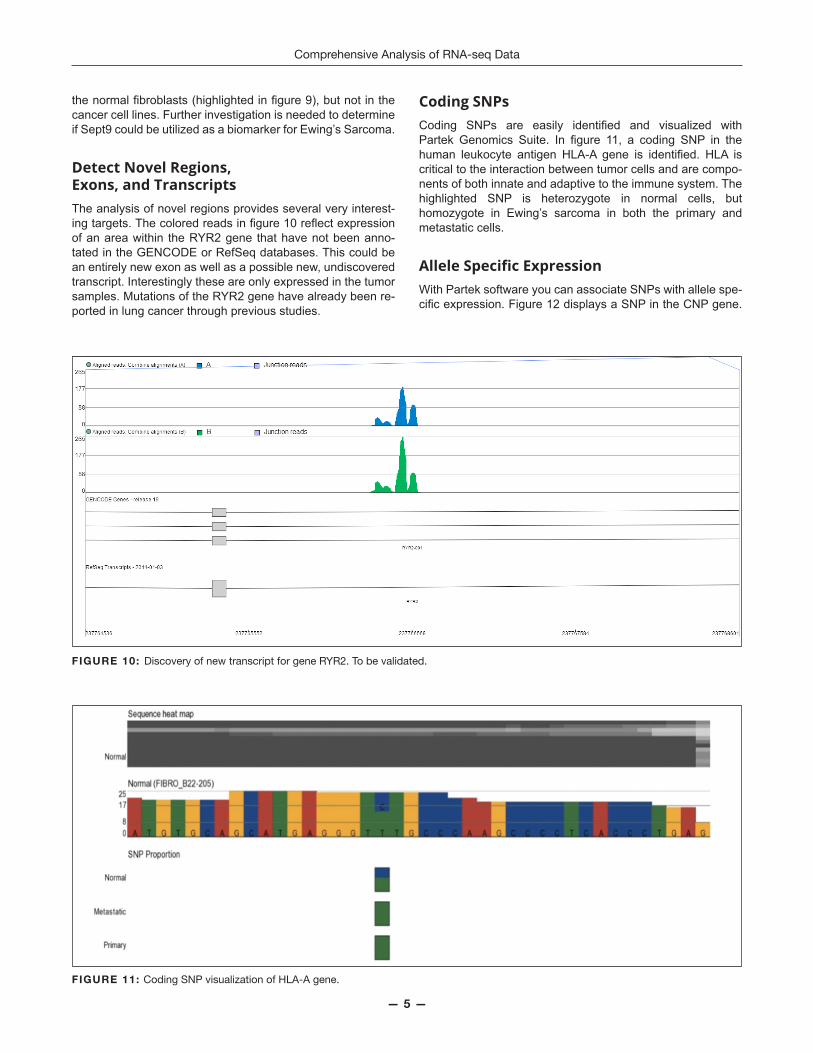
Detect Novel Regions, Exons, and TranscriptsThe analysis of novel regions provides several very interest-ing targets. The colored reads in figure 10 reflect expression of an area within the RYR2 gene that have not been anno-tated in the GENCODE or RefSeq databases. This could be an entirely new exon as well as a possible new, undiscovered transcript. Interestingly these are only expressed in the tumor samples. Mutations of the RYR2 gene have already been re-ported in lung cancer through previous studies.
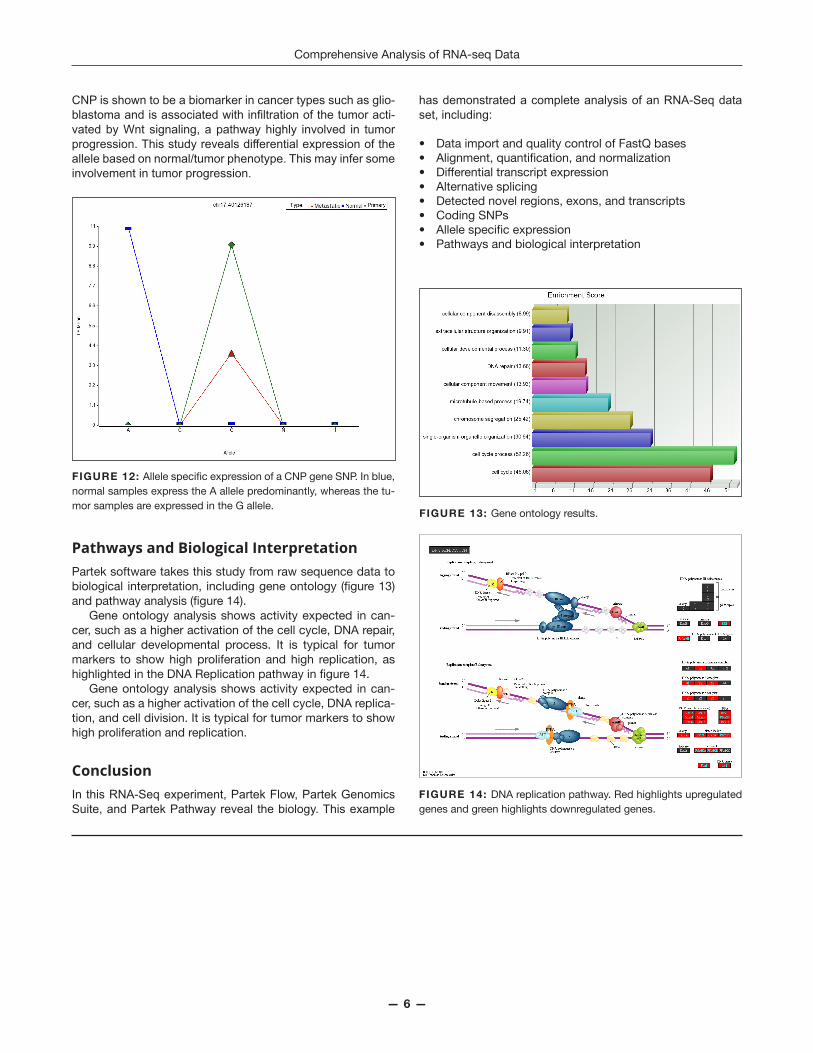
Coding SNPsCoding SNPs are easily identified and visualized with Partek Genomics Suite. In figure 11, a coding SNP in the human leukocyte antigen HLA-A gene is identified. HLA is critical to the interaction between tumor cells and are compo-nents of both innate and adaptive to the immune system. The highlighted SNP is heterozygote in normal cells, but homozygote in Ewing’s sarcoma in both the primary and metastatic cells.
Allele Specific ExpressionWith Partek software you can associate SNPs with allele spe-cific expression. Figure 12 displays a SNP in the CNP gene.
FIGURE 10: Discovery of new transcript for gene RYR2. To be validated.
FIGURE 11: Coding SNP visualization of HLA-A gene.
Comprehensive Analysis of RNA-seq Data
— 6 —
CNP is shown to be a biomarker in cancer types such as glio-blastoma and is associated with infiltration of the tumor acti-vated by Wnt signaling, a pathway highly involved in tumor progression. This study reveals differential expression of the allele based on normal/tumor phenotype. This may infer some involvement in tumor progression.
Pathways and Biological InterpretationPartek software takes this study from raw sequence data to biological interpretation, includinggeneontology (figure13)andpathwayanalysis(figure14). Gene ontology analysis shows activity expected in can-cer, such as a higher activation of the cell cycle, DNA repair, and cellular developmental process. It is typical for tumor markers to show high proliferation and high replication, as highlightedintheDNAReplicationpathwayinfigure14. Gene ontology analysis shows activity expected in can-cer, such as a higher activation of the cell cycle, DNA replica-tion, and cell division. It is typical for tumor markers to show high proliferation and replication.
ConclusionIn this RNA-Seq experiment, Partek Flow, Partek Genomics Suite, and Partek Pathway reveal the biology. This example
FIGURE 12: AllelespecificexpressionofaCNPgeneSNP.Inblue,normal samples express the A allele predominantly, whereas the tu-mor samples are expressed in the G allele.
FIGURE 13: Gene ontology results.
FIGURE 14: DNA replication pathway. Red highlights upregulated genes and green highlights downregulated genes.
has demonstrated a complete analysis of an RNA-Seq data set, including:
• DataimportandqualitycontrolofFastQbases• Alignment,quantification,andnormalization• Differentialtranscriptexpression• Alternativesplicing• Detectednovelregions,exons,andtranscripts• CodingSNPs• Allelespecificexpression• Pathwaysandbiologicalinterpretation

Copyright © 2014 Partek Incorporated. All rights reserved. Partek Genomics Suite, Partek Flow and Partek Pathway are trademarks of Partek Incorporated.
All other trademarks are property of their respective owners.
Try it Today!Download a free, no-obligation, 14-day trial of Partek software at www.partek.com. Trial software is fully functionaland supported by Partek’s friendly and knowledgeable customer support team.
Contact Us
North AmericaSales: +1 314.878.2329
Europe Sales: +44 (0) 2075 588491
Asia/Australasia Sales: +65 64789730
Partek Corporate Offices St. Louis, Missouri USA+1 314.878.2329 (office) +1 314.275.8453 (fax) www.partek.com