Embed Size (px)
Citation preview
RIVER BEND STATION
ANNUAL RADIOLOGICAL ENVIRONMENTAL
OPERATING REPORT FOR 2016
This report compiled by Brandy Bicoll of
Teledyne Brown Engineering
Reviewed By:
i orA Huffstatler Sr. HP/Chemistry Specialist
/
_ilJ11/VV~~ ). f. f 7 Shannon Peterkin
Manager - Radiation Protection
'if;J4 ~ 5-1-n-M. h I Ponzo
Manager- Chemistry
Approved By:
~~-1-1? Steven Vercelli
General Manager, Plant Operations
Table of Contents
Summary
1. Introduction
1.1. Radiological Environmental Monitoring Program
1.2. Pathways Monitored
1.3. Land Use Census
2. Interpretation and Trends of Results
2.1. Air Particulate and Radioiodine Sample Results
2.2. Thermoluminescent Dosimetry Sample Results
2.3. Water Sample Results
2.4. Shoreline Sediment Sample Results
2.5. Milk Sample Results
2.6. Food Product Sample Results
2.7. Fish and Invertebrate Sample Results
2.8. Land Use Census Results
2.9. Interlaboratory Comparison Results
3. Radiological Environmental Monitoring Program Summary
3.1. 2016 Program Results Summary
List of Tables
Table 1.1 Radiological Environmental Sampling Program
Table 2-1 Land Use Census Results
Table 3.1 Radiological Environmental Monitoring Program Summary
1
5
5
5
5
15
15
15
16
16
16
17
17
17
18
22
22
6
20
24
List of Figures
Figure 1-1 Exposure Pathways
Figure 1-2 Sample Collection Sites - Near Field
Figure 1-3 Sample Collection Sites - Far Field
Figure 2-1 TLD Indicator vs Control Data
Figure 2-2 Gross Beta Indicator Results
List of Attachments
Attachment 1-7 Data Tables
Attachment 1.1 Air Particulate and Charcoal Cartridges
Attachment 2.1 Therm:oluminescent Dosimeters (TLD)
Attachment 3.1 Surface Water
Attachment 4.1 Groundwater
Attachment 5.1 Shoreline Sediment
Attachment 6.1 Food Products
Attachment 7.1 Fish
Attachment 8 Teledyne Brown Engineering's Interlaboratory Comparison
Program Tables·
ii
12
13
14
21
21
31
32
36
37
41
42
43
46
47
Summary
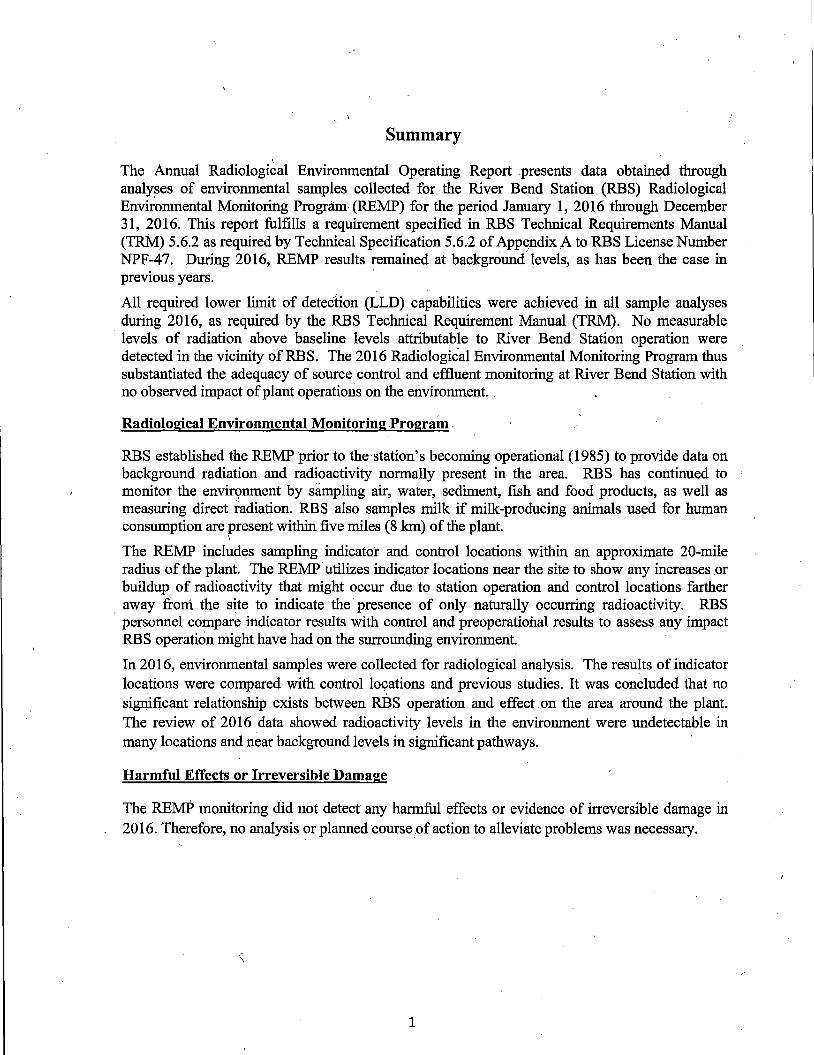
The Annual Radiological . Environmental Operating Report presents data obtain~d through analyses of environmental samples collected for the River Bend Station (RBS) Radiological Envrr'.onmental Monitoring Program (REMP) for the period January 1, 2016 through December 31, 2016. This report fulfills a requirement specified in RBS Technical Requirements Manual (TRM) 5.6.2 as required by Technical Specification 5.6.2 of App~ndix .A to RBS License Number NPF-47. During 2016, REMP results remained at background' levels, as has been the case in previous years.
All required lower limit of detection (LLD) capabilities were achieved in all sample analyses during 2016, as required by the RBS Technical Requirement Manual (TRM). No measurable
· levels of radiation above baseline levels attributable to River Bend Station operation were detected in the vicinity of RBS. The 2016 Radiological Environmental Monitoring Program thus substantiated the adequacy of source control and effluent monitoring at River Bend Station with no observed impact of plant operations on the environment. .
Radiological Environmental Monitoring Program.
RBS established the REMP 'prior to the·station's becoming operational (1985) to provide data on background radiation and radioactivity normally present in the area. RBS has continued to monitor the envirqnment by sampling air, water, sediment, fish and food products, as well as measuring direct radiation. RBS also samples milk if milk-producing animals used for human consumption are present within five miles (8 km) of the plant.
. I
The REMP includes sampling indicator and control locations within an approximate 20-mile radius of the plant. The REMP. utilizes indic.ator locations near the site to show any increases .or buildup of radioactivity that might occur due to station operation and control locations farther
. away froni the site to indicate the presence of only naturally occurring radioactivity. RBS personnel compare indicator results with control and preoperational results to assess any impact RBS operation might have had on the surrounding environment.
In 2016, environmental samples were collected for radiological analysis. The results of indicator locations were compared with control lo9ations and previous studies. It was concluded that no significant relationship exists between RBS operation and effect .on the area around the plant. The review of 2016 data showed radioactivity levels in the environment were undetectable in many locations and near background levels in significant pathways.
Harmful Effects or Irreversible Damage
The REMP monitoring did not detect any harmful effects or evidence of irreversible damage in 2016. Therefore, no analysis or planned course pf action to alleviate problems was necessary.
1
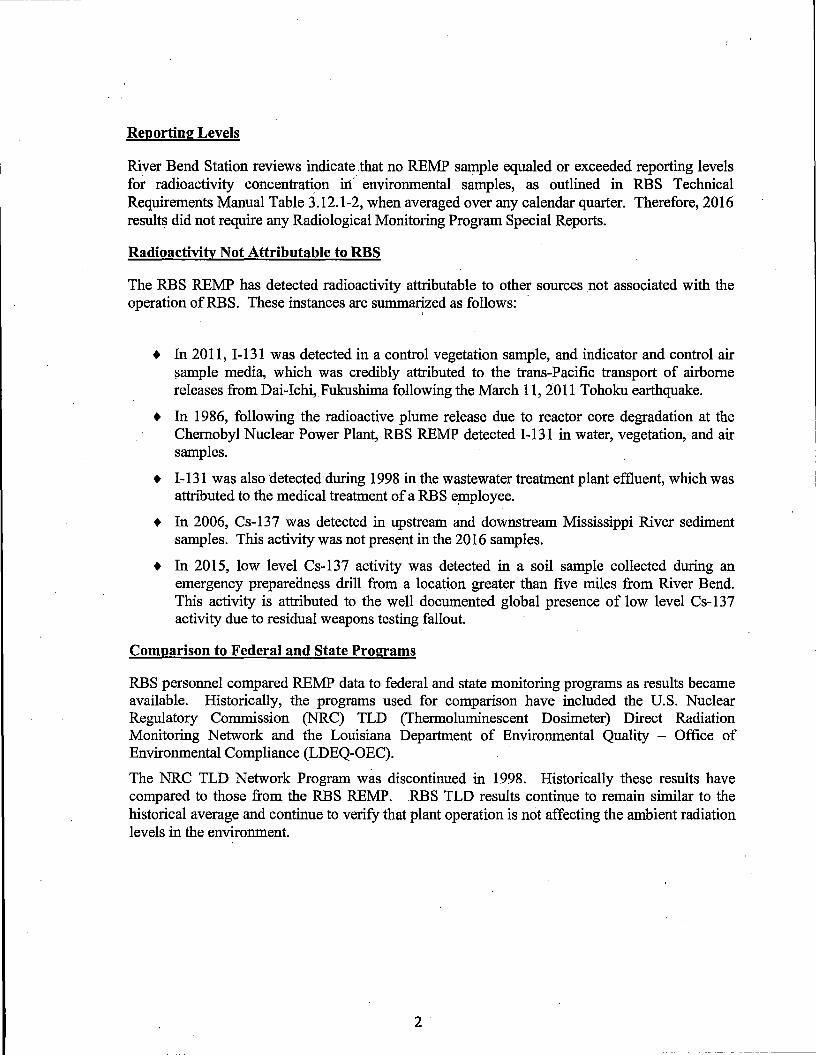
Reporting Levels
River Bend Station reviews indicate that no REMP sample equaled or exceeded reporting levels for radioactivity concentrati.on itf environmental samples, as outlined in RBS Technical Requirements Manual Table 3.12.1-2, when averaged over any calendar quarter. Therefore, 2016 results did not require any Radiological Monitoring Program Special Reports.
Radioactivity Not Attributable to RBS
The RBS REMP has detected radioactivity attributable to other sources not associated with the operation of RBS. These instances are summa~zed as follows:
• In 2011, 1-131 was detected in a control vegetation sample, and indicator and control air sample media, which was credibly attributed to the trans-Pacific transport of airborne releases from Dai-Ichi, Fukushima following the March 11, 2011 Tohoku earthquake.
+ In 1986, following the radioactive plume release due to reactor core degradation at the Chernobyl Nuclear Power Plant, RBS REMP detected 1-131 in water, vegetation, and air samples.
+ 1-131 was also detected during 1998 in the wastewater treatment plant effluent, which was attributed to the medical treatment of a RBS e.mployee.
+ In 2006, Cs-137 was detected in upstream and downstream Mississippi River sediment samples. This activity was not present in the 2016 samples.
+ In 2015, low level Cs-137 activity was detected in a soil sample collected during an emergency prepareoness drill from a location greater than five miles from River Bend. This activity is attributed to the well documented global presence of low level CsM137 activity due to residual weapons testing fallout.
Comparison to Federal and State Programs
RBS personnel compared REMP data to federal and state monitoring programs as results became available. Historically, the programs used for comparison have included the U.S. Nuclear Regulatory Commission (NRC) TLD (Thermoluminescent Dosimeter) Direct Radiation Monitoring Network and the Louisiana Department of Environmental Quality - Office of Environmental Compliance (LDEQ-OE.C).
The NRC TLD Network Program was discontinued in 1998. Historically these results have compared to those from the RBS REMP. .RBS TLD results continue to remain similar to the historical average and continue to verify that plant operation is not affecting the ambient radiation levels in the environment.
2
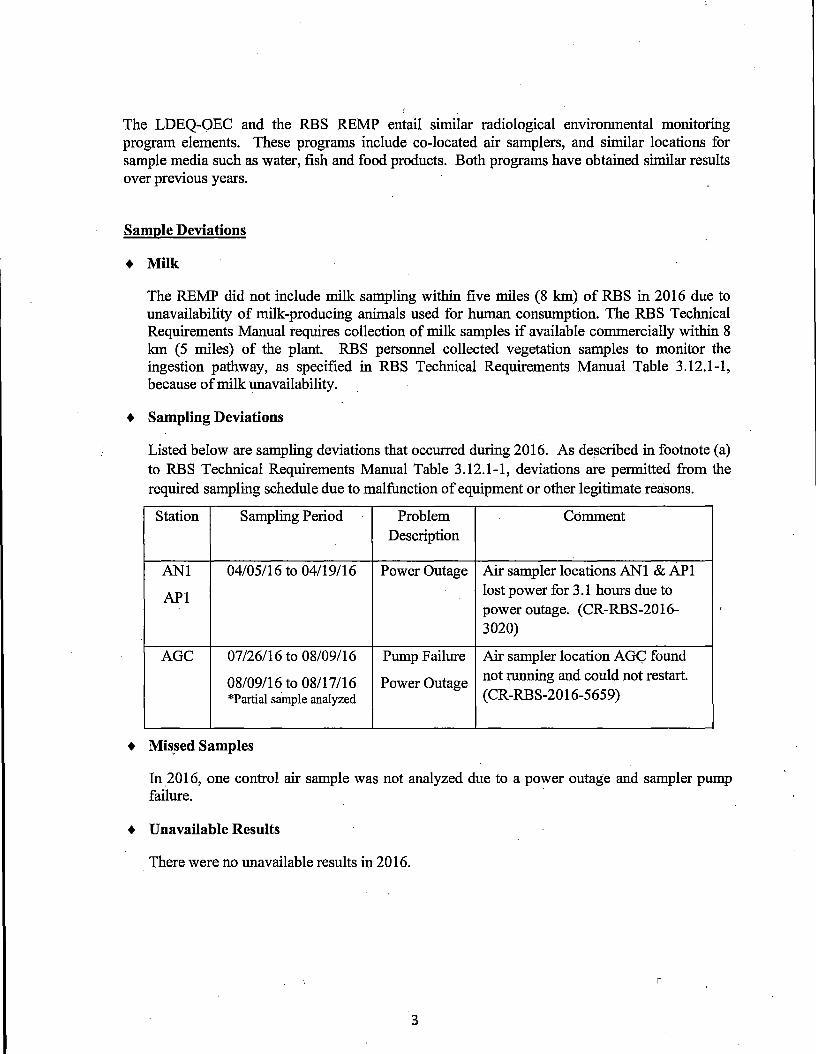
The LDEQ-OEC and the RBS REMP entail similar radiological environmental monitoring program elements. These programs include co-located air samplers, and similar locations for sample media such as water, fish and food products. Both programs have obtained similar results over previous years.
Sample Deviations
+ Milk
The REMP did not include milk sampling within five miles (8 km) of RBS in 2016 due to unavailability of milk-producing animals used for human consumption. The RBS Technical Requirements Manual requires collection of milk samples if available commercially within 8 km (5 miles) of the plant. RBS personnel collected vegetation samples to monitor the ingestion pathway, as specified in RBS Technical Requirements Manual Table 3.12.1-1, because of milk unavailability.
+ Sampling Deviations
Listed below are sampling deviations that occurred during 2016. As described in footnote (a) to RBS Technical Requirements Manual Table 3.12.1-1, deviations are permitted from the required sampling schedule due to malfunction of equipment or other legitimate reasons.
Station Sampling Period Problem Comment Description
ANl 04/05/16 to 04/19/16 Power Outage Air sampler locations ANl & APl
APl lost power for 3 .1 hours due to power outage. (CR-RBS-2016-3020)
AGC 07 /26/16 to 08/09/16 Pump Failure Air sampler location AG<;: found
08/09/16 to 08/17 /16 Power Outage not running and could not restart.
*Partial sample analyzed (CR-RBS-2016-5659)
+ Mis,sed Samples
In 2016, one control air sample was not analyzed due to a power outage and sampler pump failure.
+ Unavailable Results
There were no unavailable results in 2016.
3
Program Modifications
RBS made no modifications to the REMP during the year 2016.
Attachments
Attachments 1 through 7 contain results of air, TLD, water, sediment, fish, food products and special samples collected in 2016.· River. Bend's REMP TLDs were analyzed by Stanford Dosimetry. The Teledyne Brown Engineering Environmental Laboratory analyzed all remaining samples. Attachment 8 contains Teledyne Brown Engineering's participation in the Interlaboratory Comparison Program during the year 2016. ·
4
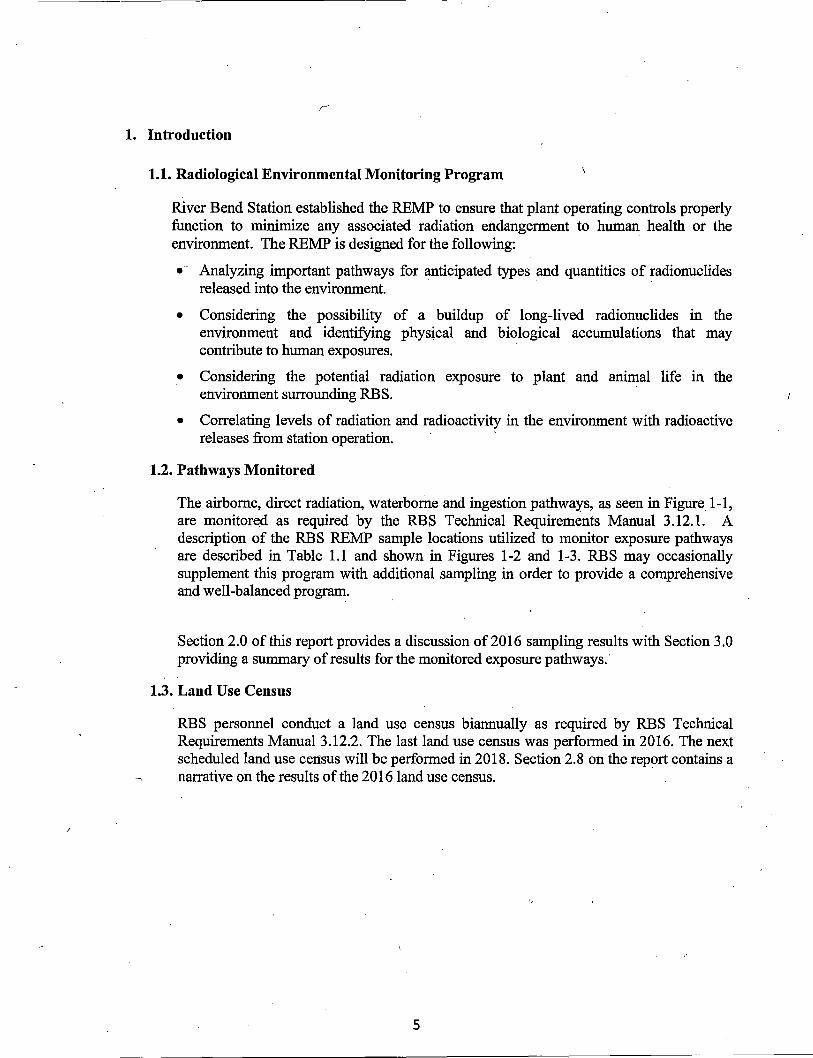
1. Introduction
1.1. Radiological Environmental Monitoring Program
River Bend Station established the REMP to ensure that plant operating controls properly function to minimize any associated radiation endangerment to human health or the environment. The REMP is designed for the following: ·
• Analyzing important pathways for anticipated types and quantities of radionuclides released into the environment. ·
• Considering the possibility of a buildup of long-lived radionuclides in the environment and identifying physical and biological accumulations that may contribute to human exposures.
• Considering the potential radiation exposure to plant and animal life in the environment surrounding RBS. ·
• Correlating levels of radiation and radioactivity in the environment with radioactive releases from station operation.
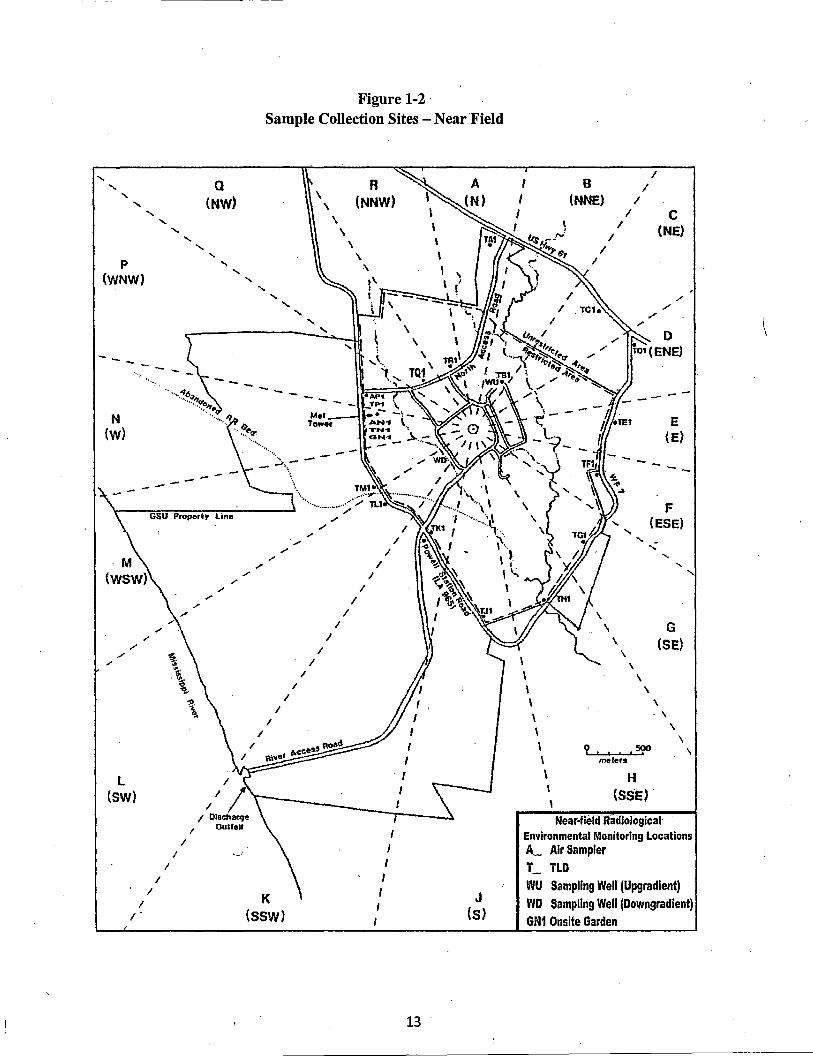
1.2. Pathways Monitored
The airborne, direct radiation, waterborne and ingestion pathways, as seen in Figure 1-1, are monitored as required by the RBS Technical Requirements Manual 3.12.1. A description of the RBS REMP sample locations utilized to monitor exposure pathways are described in Table 1.1 and shown in Figures 1-2 and 1-3. RBS may occasionally supplement this program with additional sampling in order to provide a comprehensive and well-balanced program.
Section 2.0 of this report provides a discussion of 2016 sampling results with Section 3.0 providing a summary of results for the monitored exposure pathways.·
1.3. Land Use Census
RBS personnel conduct a land use census biannually as required by RBS Technical Requirements Manual 3.12.2. The last land use census was performed in 2016. The next scheduled land use census will be performed in 2018. Section 2.8 on the report contains a narrative on the results of the 2016 land use census.
5
Exposure Pathway
Airborne
Direct Radiation
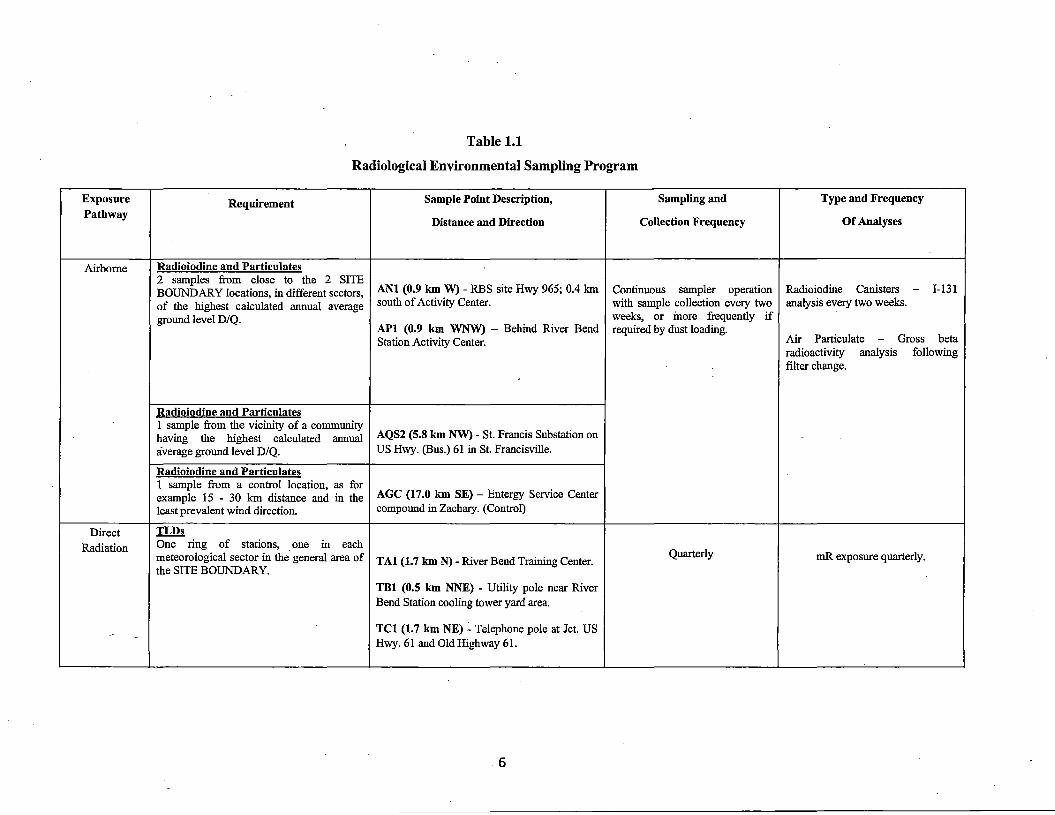
Table 1.1
Radiological Environmental Sampling Program
Requirement
Radioiodine and Particulates 2 samples from close to the 2 SITE BOUNDARY locations, in different sectors, of the highest calculated annual average ground level D/Q.
Radioiodine and Particulates I sample from the vicinity of a community having the highest calculated annual average ground level D/Q.
Radioiodine and Particulates I sample from a control location, as for example 15 - 30 Ian distance and in the least prevalent wind direction.
TLDs One ring of stations, one in each meteorological sector in the general area of the SITE BOUNDARY.
Sample Point Description,
Distance and Direction
ANl (0.9 km W) - RBS site Hwy 965; 0.4 Ian south of Activity Center.
APl (0.9 km WNW) - Behind River Bend Station Activity Center.
AQS2 (5.8 km NW) - St. Francis Substation on US Hwy. (Bus.) 61 in St. Francisville.
AGC (17.0 km SE) - Entergy Service Center compound in Zachary. (Control)
TAI (1.7 km N)-River Bend Training Center.
TBl (0.5 km NNE) - Utility pole near River Bend Station cooling tower yard area.
TCl (1.7 km NE)~ Telephone pole at Jct. US Hwy. 61 and Old Highway 61.
6
Sampling and
Collection Frequency
Gontinuous sampler operation with sample collection every two weeks, or more frequently if required by dust loading.
Quarterly
Type and Frequency
Of Analyses
Radioiodine Canisters analysis every two weeks.
1-131
Air Particulate - Gross beta radioactivity analysis following filter change.
mR exposure quarterly.
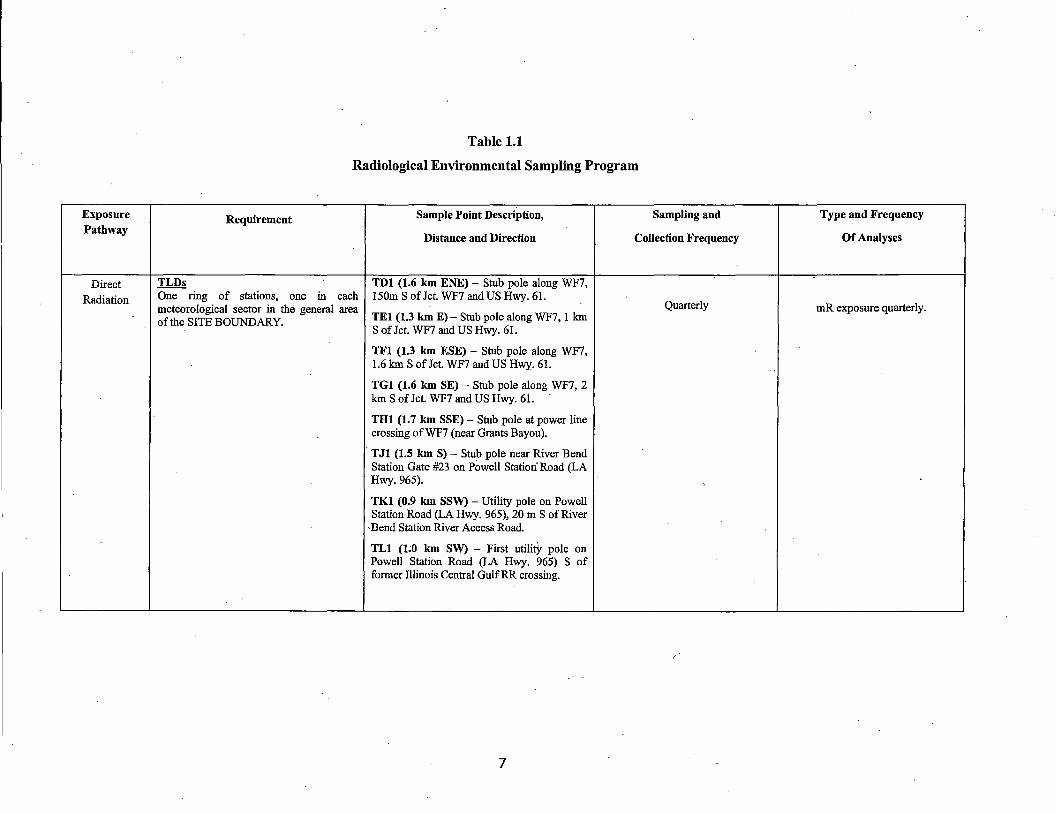
Table 1.1
Radiological Environmental Sampling Program
Exposure Requirement Sample Point Description, Sampling and Type and Frequency Pathway
Distance and Direction Collection Frequency Of Analyses
Direct TLDs TDl (1.6 km ENE) - Stub pole along WF7,
Radiation One ring of stations, one in each 150m S of Jct. WF7 and US Hwy. 61. meteorological sector in the general area Quarterly mR exposure quarterly. of the SITE BOUNDARY. TEl (1.3 km E)- Stub pole along WF7, 1 km
S of Jct. WF7 and US Hwy. 61.
TFl (1.3 km ESE) - Stub pole along WF7, -··
1.6 km S of Jct. WF7 and US Hwy. 61.
TGl (1.6 km SE) - Stub pole along WF7, 2 km S of Jct. WF7 and US Hwy. 61.
THl (1. 7 km SSE) - Stub pole at power line crossing ofWF7 (near Grants Bayou).
TJl (1.5 km S) - Stub pole near River Bend Station Gate #23 on Powell Station· Road (LA Hwy. 965). ·,
TKl (0.9 km SSW) - Utility pole on Powell Station Road (LA Hwy. 965), 20 m S of River
,Bend Station River Access Road. '
TLl (1;0 km SW) - First utilify pole on Powell Station Road (LA Hwy. 965) S of former Illinois Central Gulf RR crossing.
7
Exposure Pathway
Direct Radiation
Table 1.1
Radiological Environm.ental Sampling Program
Requirement
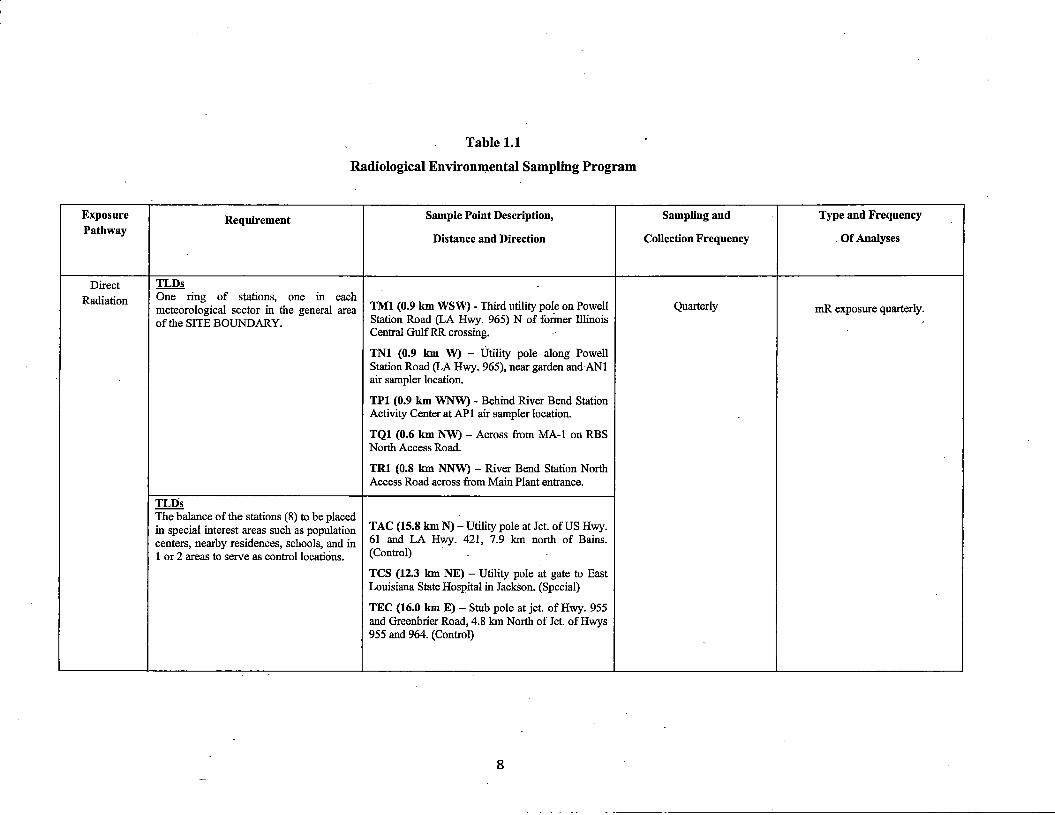
TLDs One ring of stations, one in each meteorological sector in the general area of the SITE BOUNDARY.
TLDs The balance of the stations (8) to be placed in special interest areas such as population centers, nearby residences, schools, and in 1 or 2 areas to serve as control locations.
Sample Point Description,
Distance and Direction
TMl (0.9 km WSW) - Third utility pole on Powell Station Road (LA Hwy. 965) N of foriner Illinois Central Gulf RR crossing. ,
TNl (0.9 km W) - Utility pole along Powell Station Road (LA Hwy. 965), near garden andANl air sampler location.
TPl (0.9 km WNW) - Behind River Bend Station Activity Center at APl air sampler location.
TQI (0.6 km NW)- Across from MA-1 on RBS North Access Road.
TRI (0.8 km NNW) - River Bend Station North Access Road across from Main Plant entrance.
TAC (15.8 km N)- Utility pole at Jct. ofUS Hwy. 61 and LA Hwy. 421, 7.9 km north of Bains. (Control)
TCS (12.3 km NE) - Utility pole at gate to East Louisiana State Hospital in Jackson. (Special)
TEC (16.0 km E) - Stub pole at jct. of Hwy. 955 and Greenbrier Road, 4.8 km North of Jct. ofHwys 955 and 964. (Control)
8
Sampling and
Collection Frequency
Quarterly
Type and Frequency
Of Analyses
mR exposure quarterly.
Exposure
Pathway
Direct Radiation
Waterborne
Table 1.1
Radiological Environmental Sampling Program
Requirement
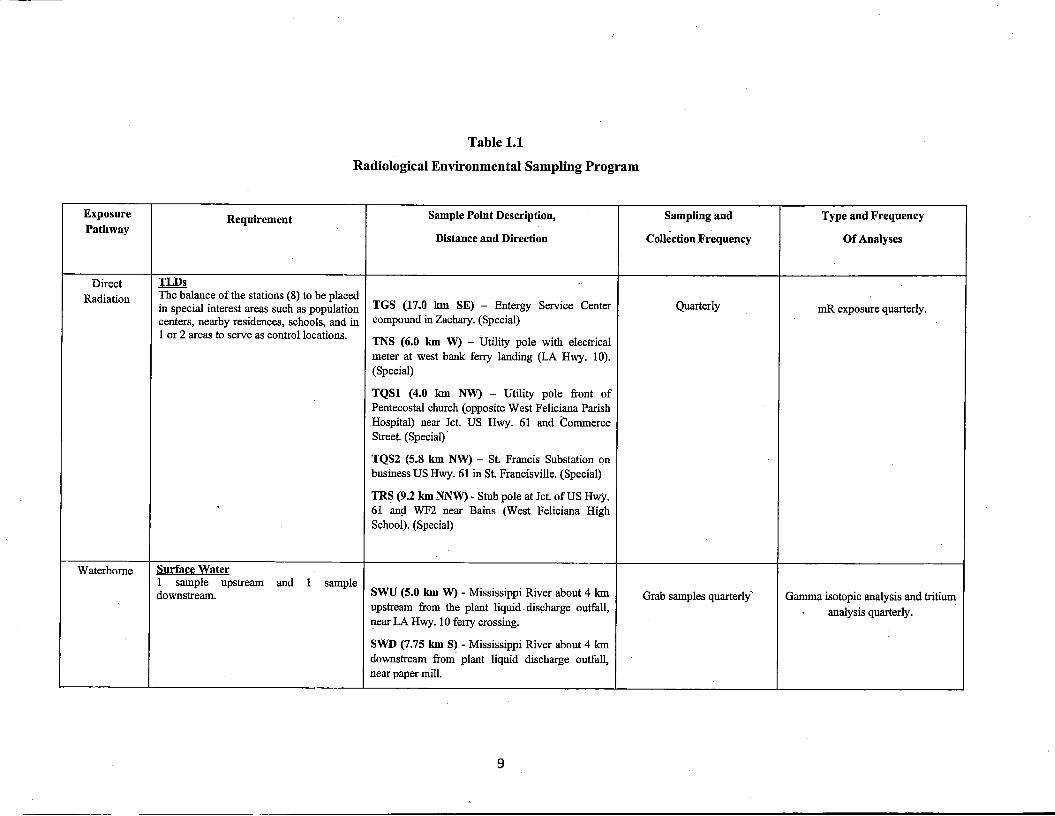
TLDs The balance of the stations (8) to be placed in special interest areas such as population centers, nearby residences, schools, and in 1 or 2 areas to serve as control locations.
Surface Water 1 sample upstream and downstream.
sample
Sample Point Description,
Distance and Direction
TGS (17.0 km SE) - Entergy Service Center compound in Zachary. (Special)
TNS (6.0 km W) - Utility pole With electrical meter at west bank feny landing (LA Hwy. IO). (Special)
TQSl (4.0 km NW) - Utility pole front of Pentecostal church (opposite West Feliciana Parish Hospital) near Jct. US Hwy. 61 and Commerce Street. (Special) ·
TQS2 (5.8 km NW) - St. Francis Substation on business US Hwy. 61 in St. Francisville. (Special)
TRS (9.2 km NNW) - Stub pole at Jct. of US Hwy. 61 an!l WF2 near Bains (West Feliciana High School). (Special)
SWU (5.0 km W) - Mississippi River about 4 km upstream from the plant liquid . discharge outfall, ':1ear LA Hwy. 10 feny crossing.
SWD (7.75 km S) - Mississippi River about 4 km downstream from. plant liquid discharge outfall, near paper mill.
9
Sampling and
Collection Frequency
Quarterly
Grab samples quarterly"
Type and Frequency
Of Analyses
mR exposure quarterly.
Gamma isotopic analysis and tritium
analysis quarterly.
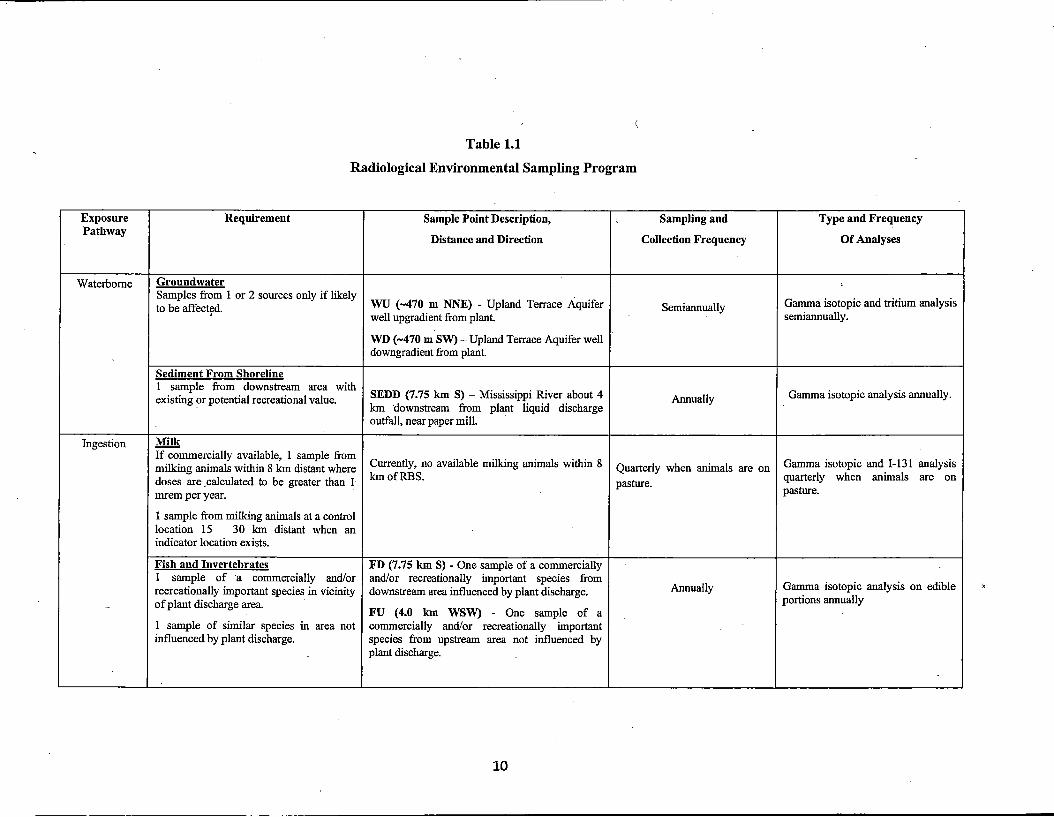
Table 1.1
Radiological Environmental Sampling Program
Exposure Requirement Sample Point Description, \ Sampling and Type and Frequency Pathway
Distance and Direction Collection Frequency Of Analyses
Waterborne Groundwater ' Samples from 1 or 2 sources only if likely
WU (-470 m NNE) - Upland Terrace Aquifer Gamma isotopic and tritium analysis to be affectrd. well upgradient from plant.
Semiannually semiannually.
WD (-470 m SW) - Upland Terrace Aquifer well downgradient from plant.
'
Sediment From Shoreline 1 sample from downstream area with
SEDD (7.75 km S) - Mississippi River about 4 Gamma isotopic analysis annually. existing or potential recreational value, km downstream from plant ii quid discharge
Annually
outfall, near paper mill.
Ingestion Milk If commercially available, 1 sample from
Currently, no available milking animals within 8 Gamma isotopic and 1-131 analysis milking animals within 8 km distant where Quarterly when animals are on doses are .calculated to be greater than 1· kmofRBS.
pasture. quarterly when animals are on
mrem per year. pasture.
1 sample from milking animals at a control location 15 - 30 km distant when an indicator location exists.
Fish and Invertebrates FD (7.75 km S) - One sample of a commercially 1 sample of a commercially and/or and/or recreationally important species from recreationally important species in vicinity downstream area influenced by plant discharge. Annually Gamma isotopic analysis on edible
- of plant discharge area. portions annually FU (4.0 km WSW) - One sample of a
1 sample of similar species in area not commercially and/or recreationally important influenced by plant discharge. species from upstream area not influenced by
plant discharge.
10
Exposure Pathway
Ingestion
Table 1.1
Radiological Environmental Sampling Program
Requirement
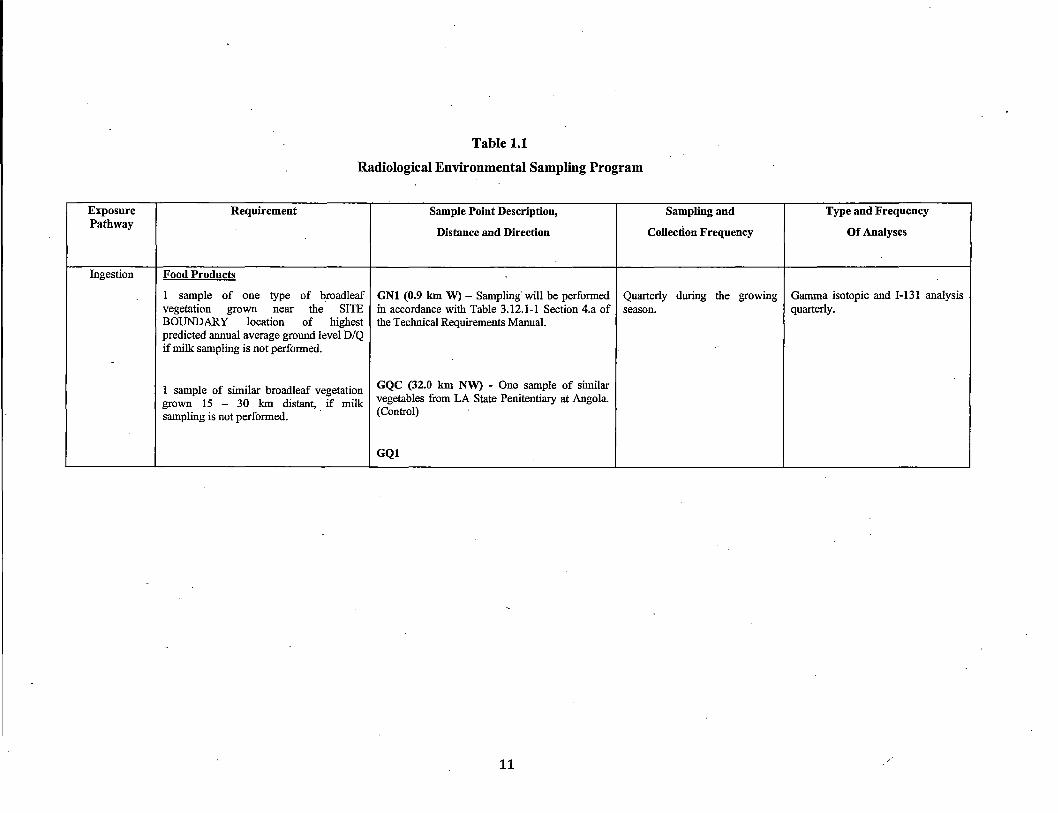
Food Products
1 sample of one type of broadleaf vegetation grown near the SITE BOUNDARY location of highest predicted annual average ground level D/Q if milk sampling is not performed.
Sample Point Description,
Distance and Direction
GNl (0.9 km W) - Sampling· will be performed in accordance with Table 3.12.1-1 Section 4.a of the Technical Requirements Manual.
1 sample of similar broadleaf vegetation GQC <32·0 km NW) - One sample of similar grown 15 _ 30 km distant, if milk vegetables from LA State Penitentiary at Angola. sampling is not performed. (Control)
GQl
11
Sampling and
Collection Frequency
Quarterly during the growing season.
Type and Frequency
Of Analyses
Gamma isotopic and I-131 analysis quarterly.
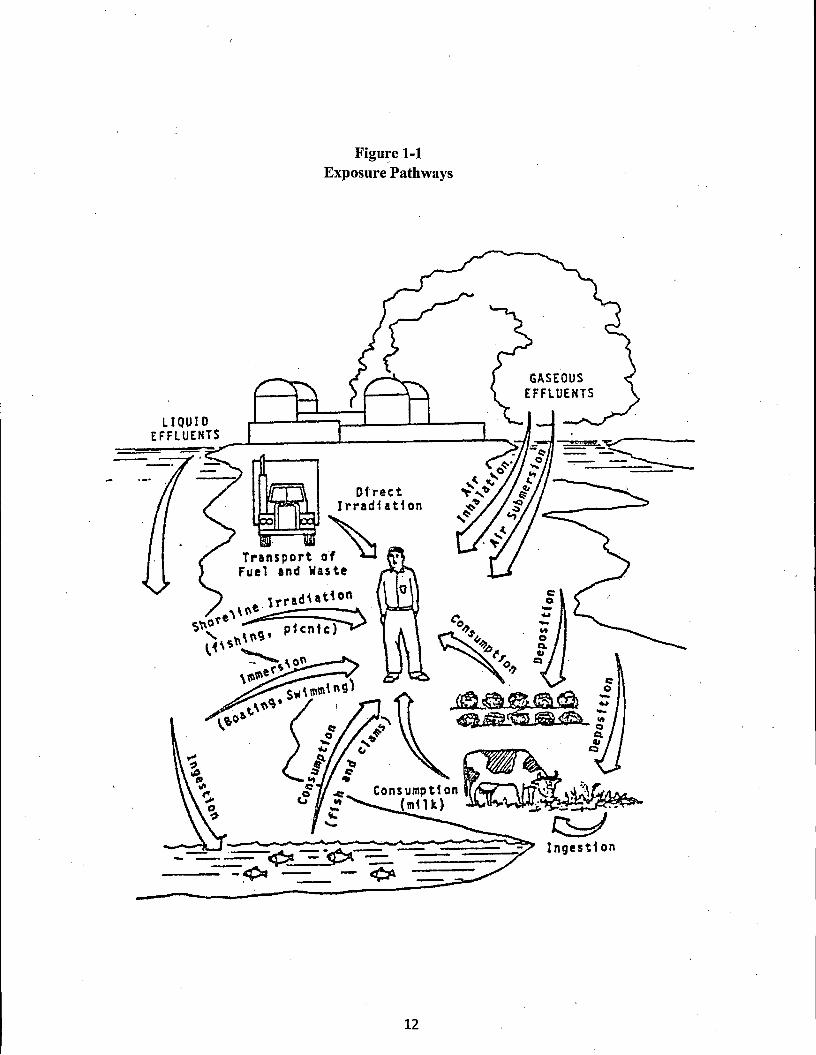
Figure 1-1 Exposure Pathw ays
Df reet I rradiat1 on
Transport 0~ Fuel and Waste
12
c: 0
.....
' ' '
p (WNW)
--
N {W)
' '
a (NW)
' ......
' .... .....
.....
GSU Propertr line
L (SW)
I
/ I
I
I '-' I
Figure 1-2 · Sample Collection Sites - Near Field
R \ (NNW) \
'
\ \
\
' ·\ ' ..... ....
.... .....
.....
-- ---···..... ..-_,,,-- '
\\ ...... . ....... ,,,. ..
''·······-·····; / 11.1 / ,,,
I I I
K (SSW) I
I I
I
I I
J (S)
13
B (NNE)
I I
I I
I
.....
\ \
\ \
I I
I c
(NE)
/ /
E {E)
--F
(ESE)
' -'
G (SE)
' \ \ \
\ \
\ . \
\ \ \
' 0 500 \ \ '""'"'" \ H \ (SSE).
' Near·fleld Radlofogical· Environmental Monitoring Locations A_ Air Sampler T_ TLD WU Sampling Well (Upgradient) WD Sampling Well (Downgradient) GN1 Onsite Garden
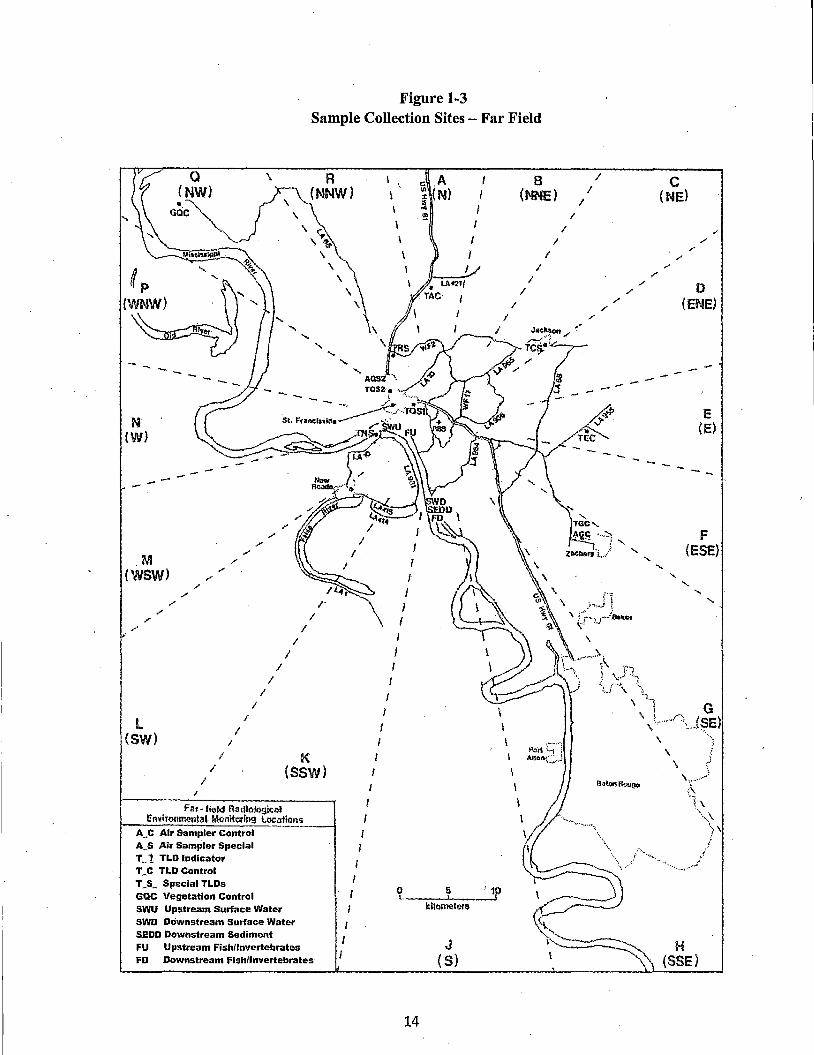
Figure 1-3 Sample Collection Sites - Far Field
N {W)
M (WSW)
l {SW)
/ /
I I
I I
I
I I
I I
/ I
FM-field Radiological
I I
r I
/
K (SSW}
Envln:inllll!nlal Monitt:ll'lll9 Loc:.itions A ... c Air Sampler Control A_S Air Sampler Special T .. ! TLD Indicator T_C TLD Control T_S_ Special TLDs GQC Vegetation Control SWU Upstream Surface Water SWD Downstream Surface Water SEDD Downstream Sediment FU Upstream Fish/Invertebrates FD Downstream Fish/Invertebrates
(
I I
I I I
I I
I
I
I I
I \ \
\
I I I I
.: .A ~ (N) ~ ...
. ·!?
I
I
I I
0 5 I 10 1.,. ___ ,__ __ --1
14
J ( S}
\
I
8 (NNE)
/ /
I
I
I I
J I
I I
/ /
/ /
--
.:·~lJ'1 \ r;:.i..r;l'hl""' \'
\
/ /
c (NE)
/
.. /
/ /
0 (ENE)
E (E)
F (ESE}
(; i'\ ·\, \
'·>, f
// •,,,, .. ~· ........
H (SSE)
2. Interpretation and Trends of Results
Table 3.1 provides a comparison of the indicator and control location mean values for the 2016 data, and indicates that the environment around the plant is unaffected by plant . . operations.
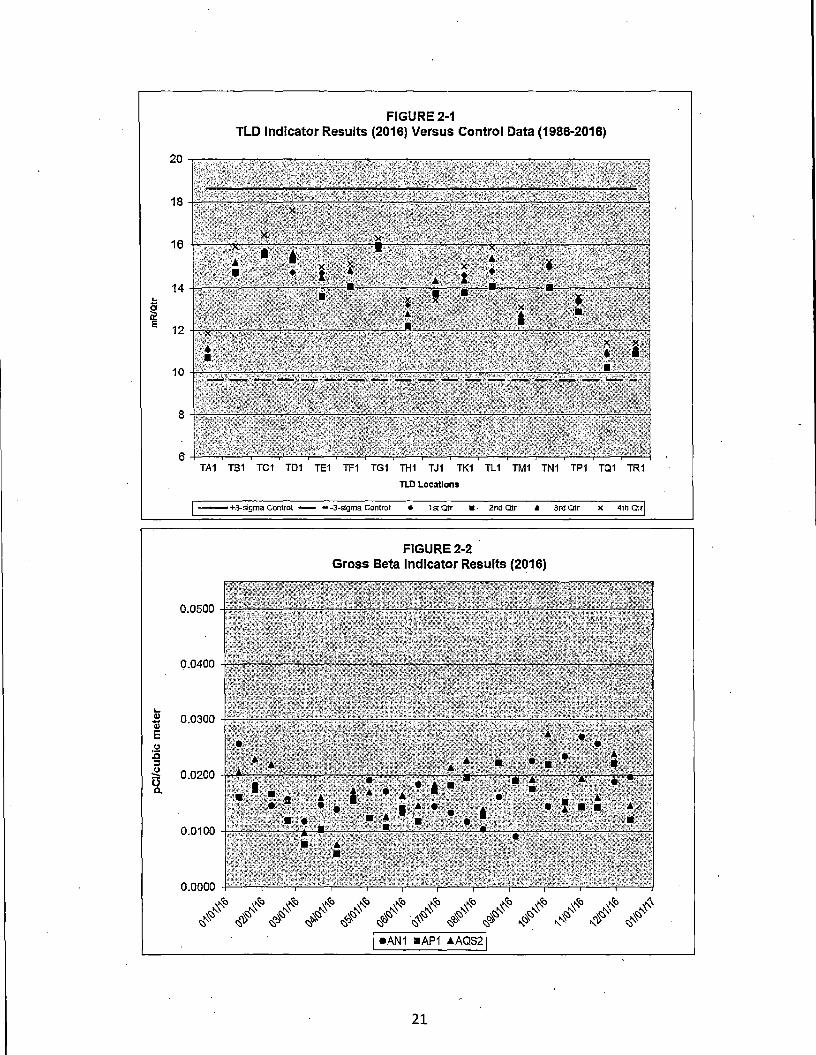
2.1. Air Particulate and Radioiodine Sample Results
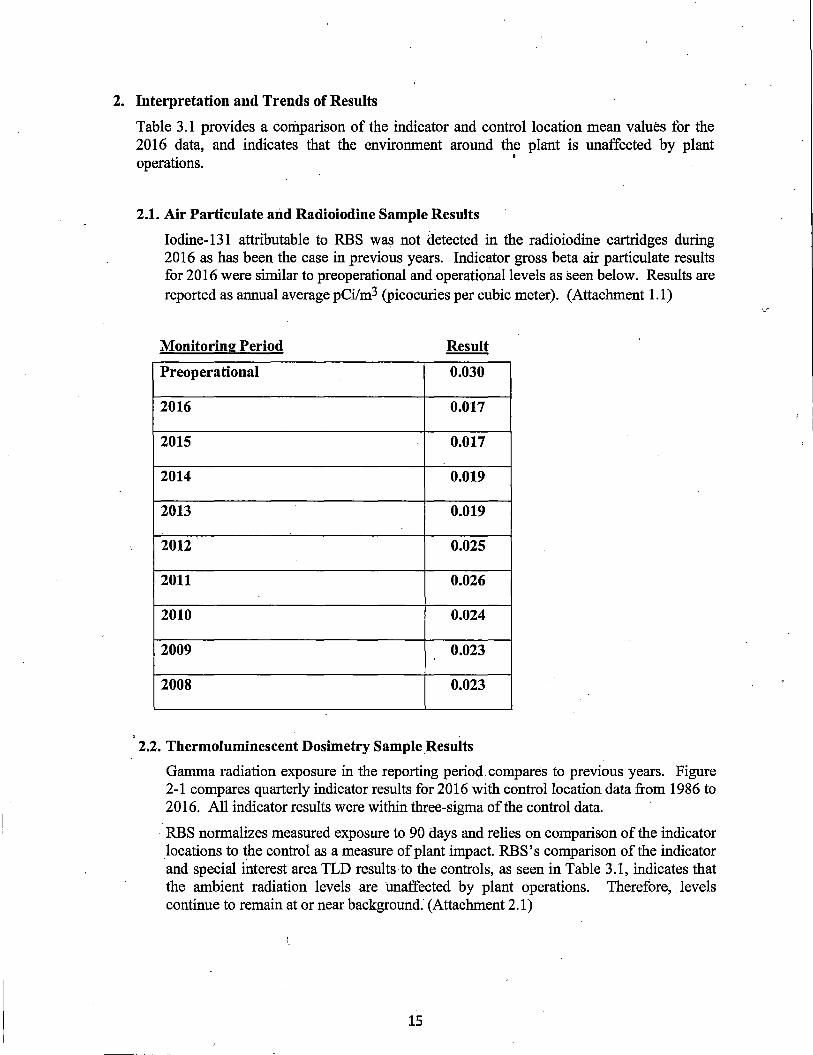
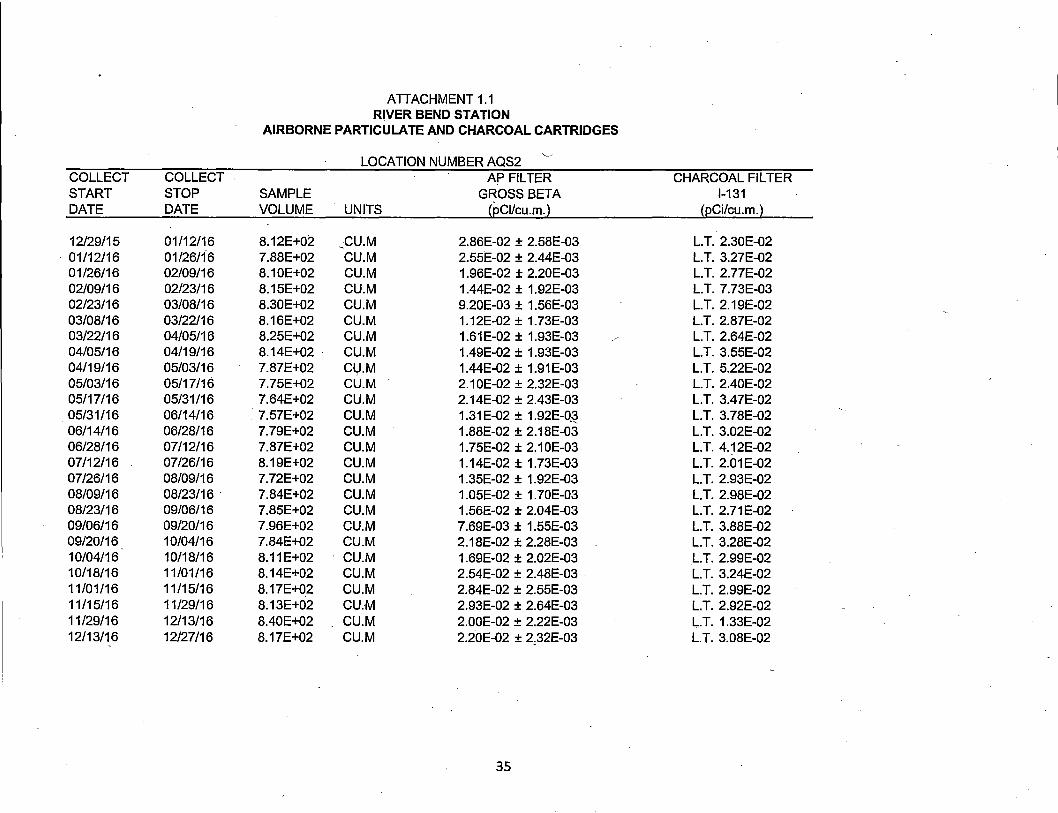
Iodine-131 attributable to RBS was not detected in the radioiodine cartridges during 2016 as has been the case in previous years. Indicator gross beta air particulate results for 2016 were similar to preoperational and operational levels as seen below. Results are reported as annual average pCifm3 (picocuries per cubic meter). (Attachment 1.1)
Monitoring Period Result
Preoperational 0.030
2016 0.017
2015 0.017
2014 0.019
2013 0.019
2012 0.025
2011 0.026
2010 0.024
2009 0.023
2008 0.023
2.2. Thermoluminescent Dosimetry Sample .Results
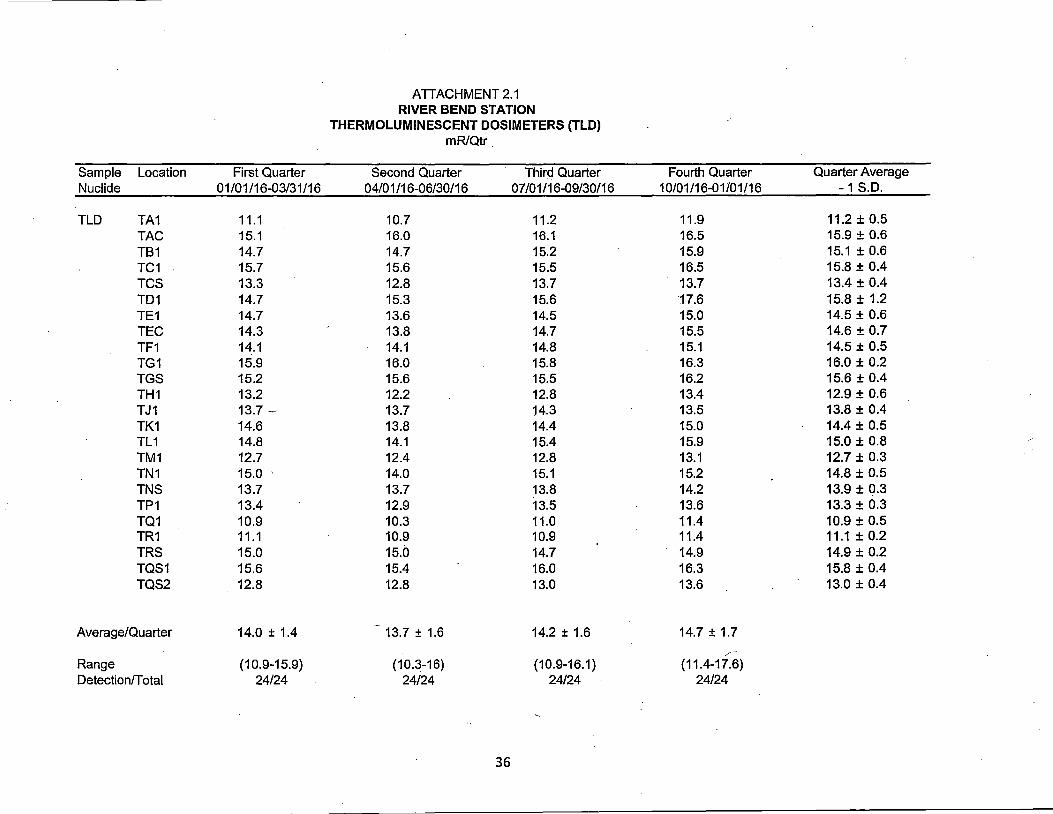
Gamma radiation exposure in the reporting period. compares to previous years. Figure 2-1 compares quarterly indicator results for 2016 with control location data from 1986 to 2016. All indicator results were within three-sigma of the control data.
· RBS normalizes measured exposure to 90 days and relies on comparison of the indicator locations to the control as a measure of plant impact. RBS's comparison of the indicator and special interest area TLD results to the controls, as seen in Table 3.1, indicates that the ambient radiation levels are ilnaffected by plant operations. Therefore, . levels continue to remain at or near background. (Attachment 2.1)
15
v
2.3. Water Sample Results
Analytical results for 2016 surface water and groundwater samples were similar to those reported in previous years.
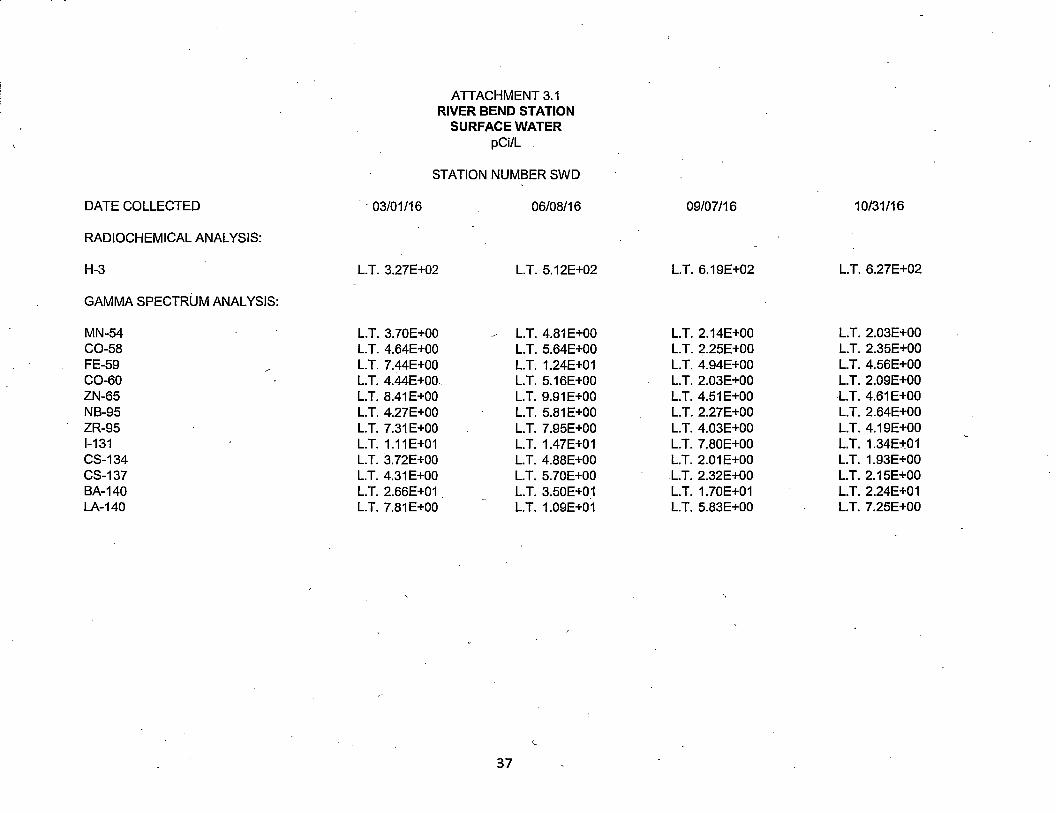
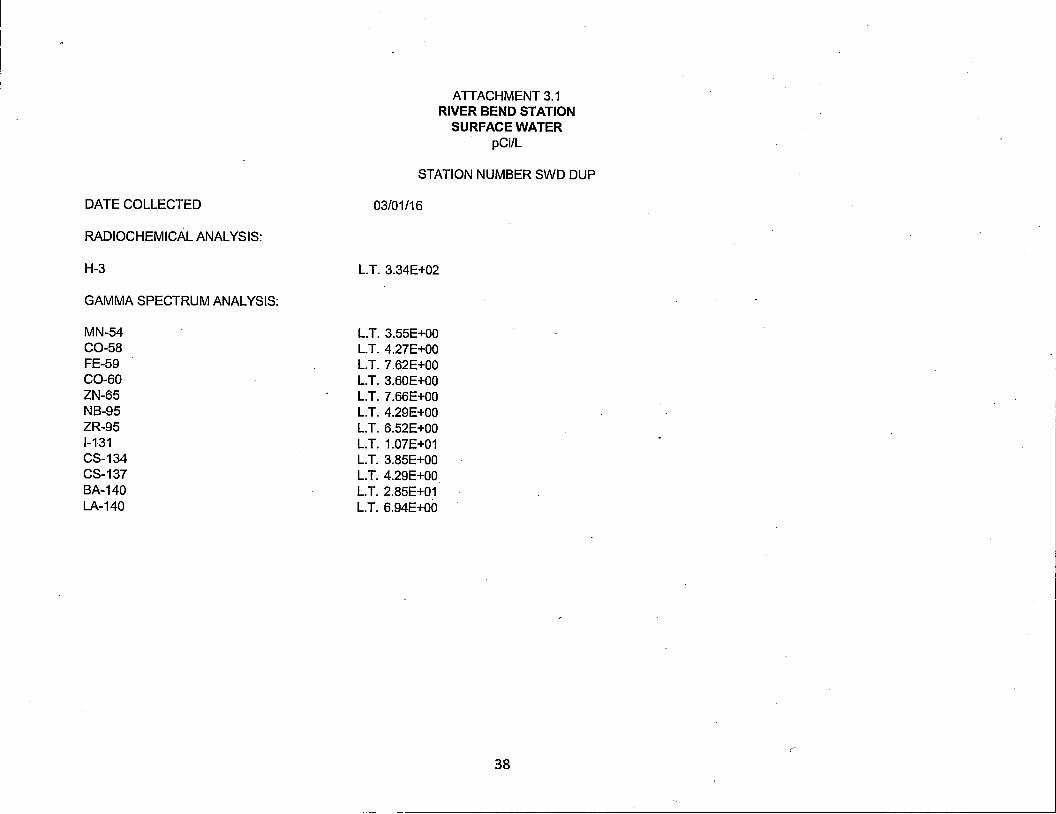
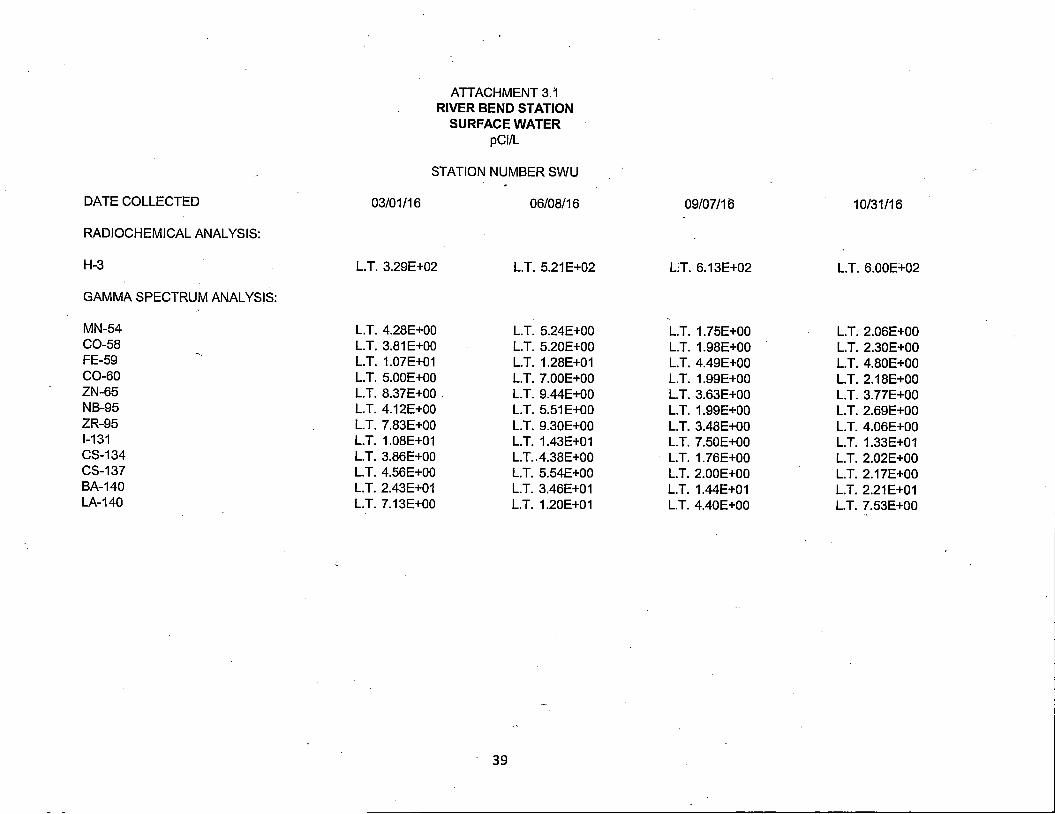
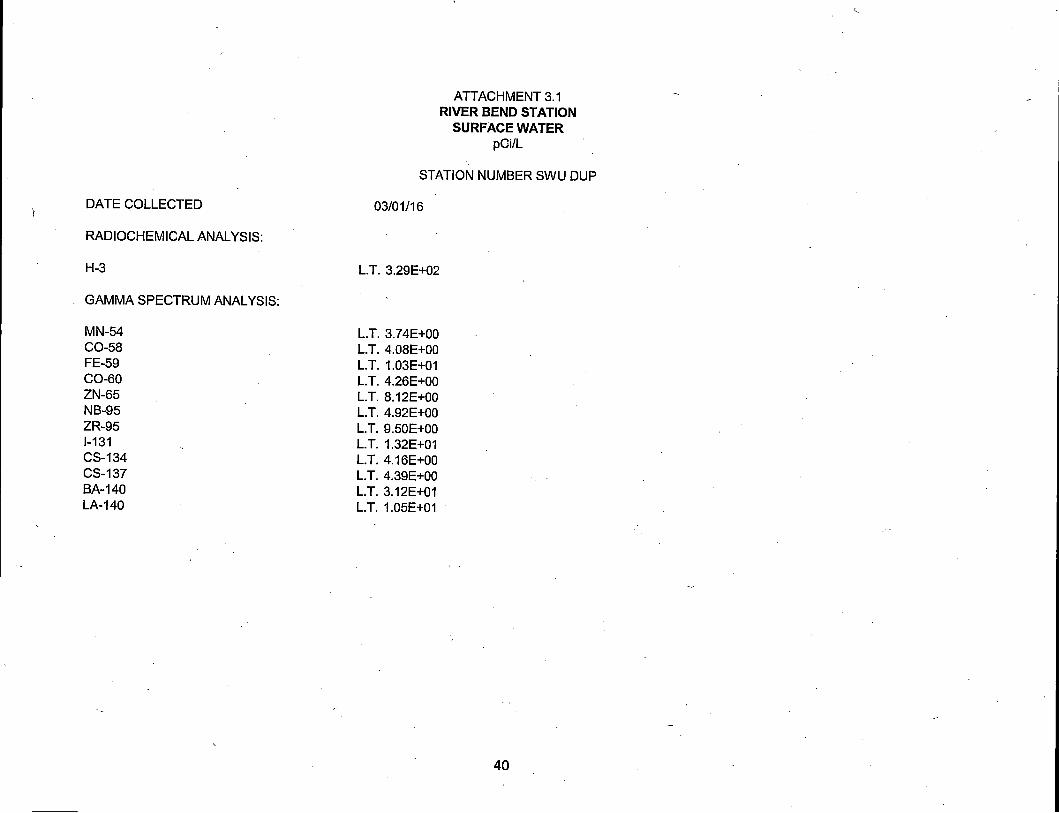
Surface water samples were collected from two locations (indicator and control) and analyzed for gamma radionuclides and tritium. Gamma radionuclides were below detectable limits at the indicator and control locations. Tritium was also below detectable limits at all locations. Listed below is a comparison of 2016 results from the indicator location as compared to the p:reoperational and previous operational years. Results are reported as annual average pCi/l (picocuries per liter). (Attachment 3.1)
Radionuclide 2016 2003 -2016 Preoperational
Gammas
Tritium
<LLD
<LLD
<LLD
<LLD
<LLD
<LLD
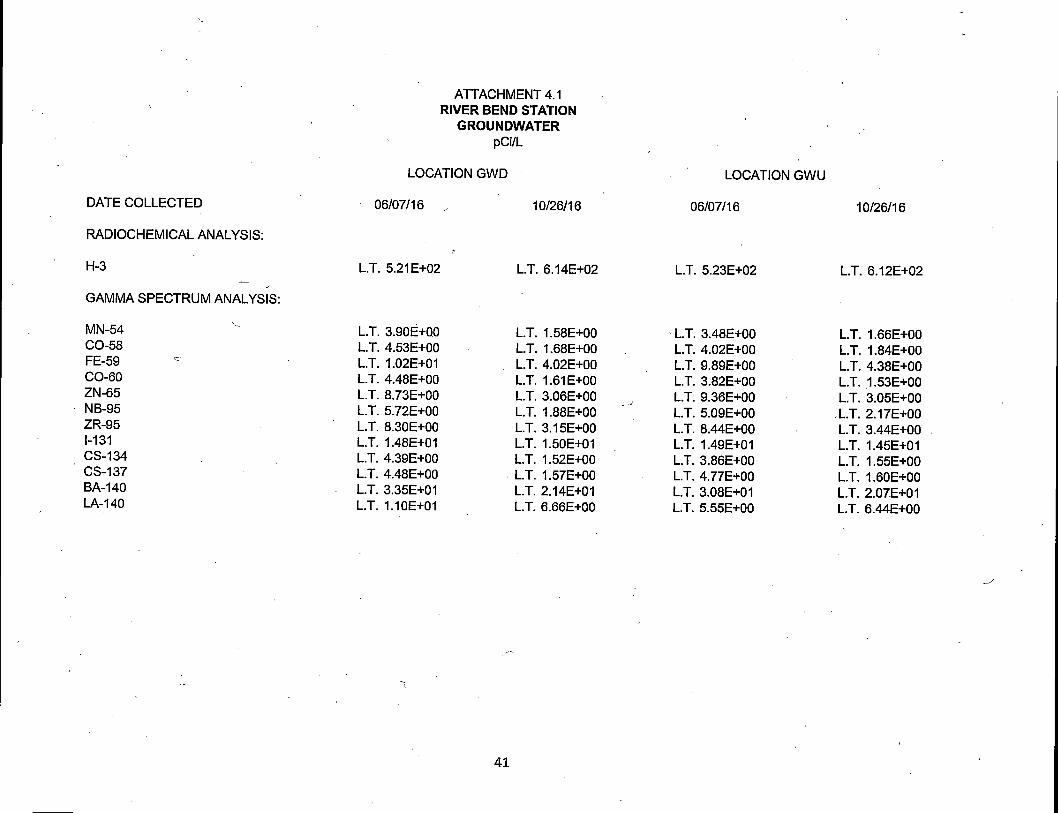
, Groundwater samples were collected from two locations (indicator and control) and analyzed for gamma radionuclides and tritium. Gamma radionuclides and tritium were below detectable limits at the indicator and control locations. Listed below is . a comparison of 2016 results from the indicator location as compared to the preoperational and previous operational years. Results are reported as annual average pCi/L (Attachment 4.1)
Radionuclide
Gammas
Tritium
. 2016 2003 -2016
<LLD <LLD
<LLD <LLD
Preoperational
<LLD
<LLD
Based on thes.e comparisons, the operation of RBS had no impact on this pathway during 2016, and levels of radionuclides monitored for this pathway continue to remain similar to those obtained in operational and preoperational years.
2.4. Shoreline Sediment Sample Results
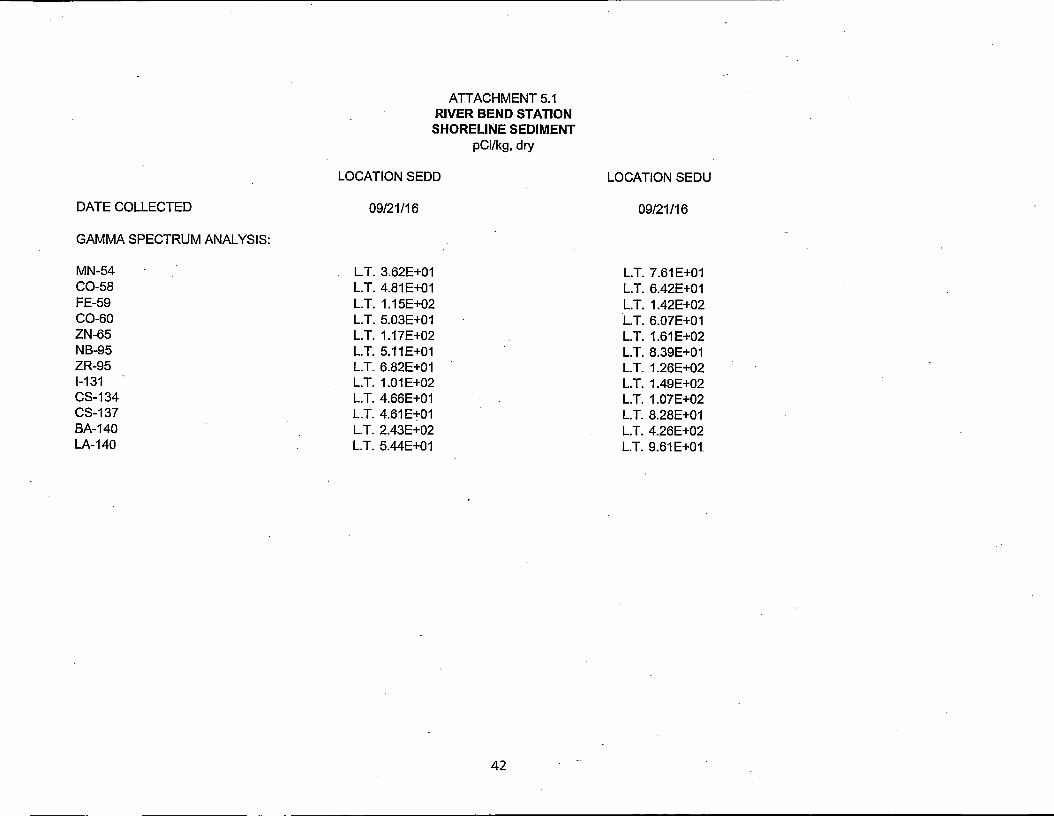
A shoreline sediment sample was collected from the indicator location in 2016 and _ analyzed for gamma radionuclides. RBS also samples a non-REMP upstream control sediment sample. A review of historical indicator and upstream sediment samples periodically shows Cs-137. No Cs-137 was indicated on the samples in 2016. Therefore, based on these measurements, RBS operations had no significant radiological impact upon the environment or public via this pathway. (Attachment 5.1)
2.5. Milk Sample Results
The REMP did not include milk sampling within five miles (8 km) of RBS in 2016 due to unavailability of milk-producing animals used for human consumption. The RBS Technical Requirements Manual requires collection of milk samples if available commercially within 8 km (5 miles) of the plant., RBS personnel collected vegetation samples to monitor the ingestion pathway, as specified in RBS Technical Requirements Manual Table 3.12.1-1, because of milk unavailability.
16
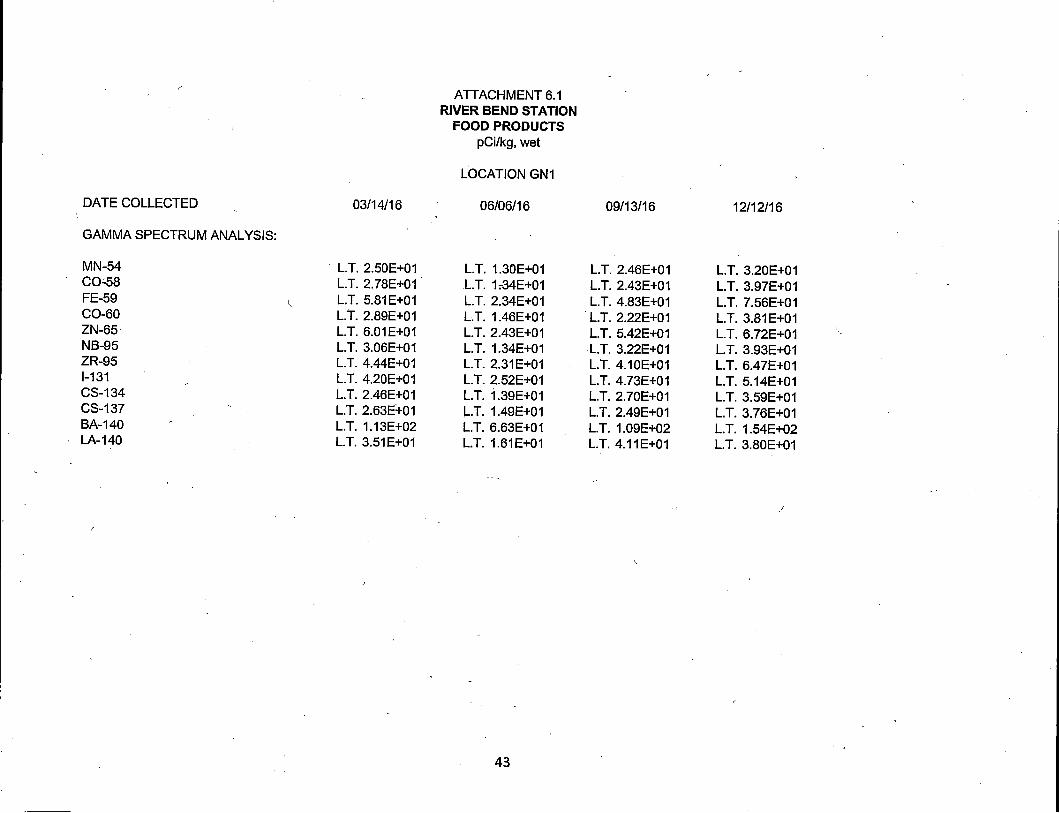
2.6. Food Product Sample Results
Food product samples were collected when available from three locations (indicator and control) in 2016 and analyzed for gamma radionuclides in accordance with Table TRM 3.12.1-1. The 2016 levels attributable to RBS remained undetectable, which is consistent with previous operational years. Therefore, since levels continue to remain at background, it can be concluded that plant operations is not impacting this pathway. (Attachment 6.1)
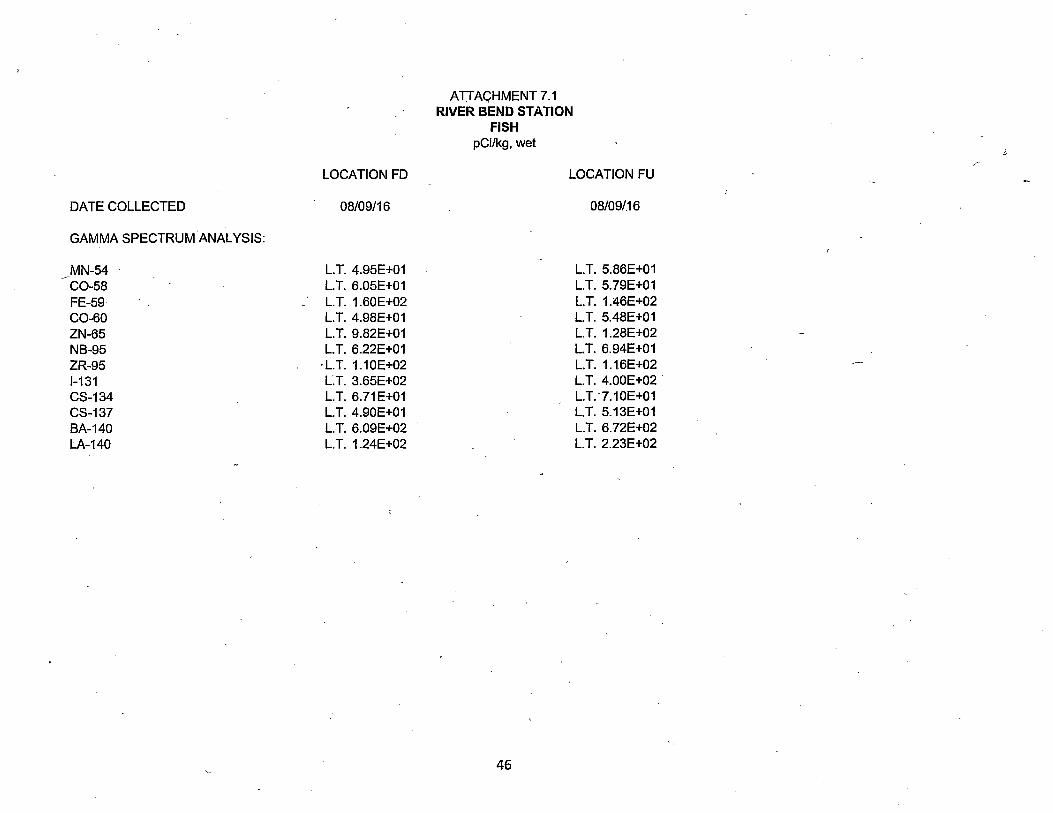
2.7. Fish and Invertebrate Sample Results
Fish samples were collected from two locations (indicator and control) and analyzed for gamma radionuclides. In 2016, gamma radionuclides were below detectable limits that were consistent with the preoperational and operational monitoring periods. Therefore, based on these measurements, RBS operations had no significant radiological impact upon the environment or public by this pathway. (Attachment 7.1)
2.8. Land Use Census Results '-
The Land Use Census was conducted in accordance with procedure-ESP-8-051, as required by Technical Requirements Manual (TRM) (TR 3.12.2).
A garden census is not conducted pursuant to the note in the TRM (TLCO 3.12.2) that allows the sampling ofbroadleafvegetation in the highest calculated average groundlevel D/Q sector near site boundary in lieu of the garden census.
The milk animal census identified no milk animals within 8 km (5 miles) of River Bend site. This information was verified by the County Agents from West Feliciana, East Feliciana, and Pointe Coupee parishes. ,
No resident census changes were noted, as indicated in Table 2.1.
No locations were identified in 2016 that would yield a calculated dose or dose commitmerit greater than those contained in the TRM (TR 3 .11 ).
Table 2.1 contains data from the most recently completed Land Use Census.
17
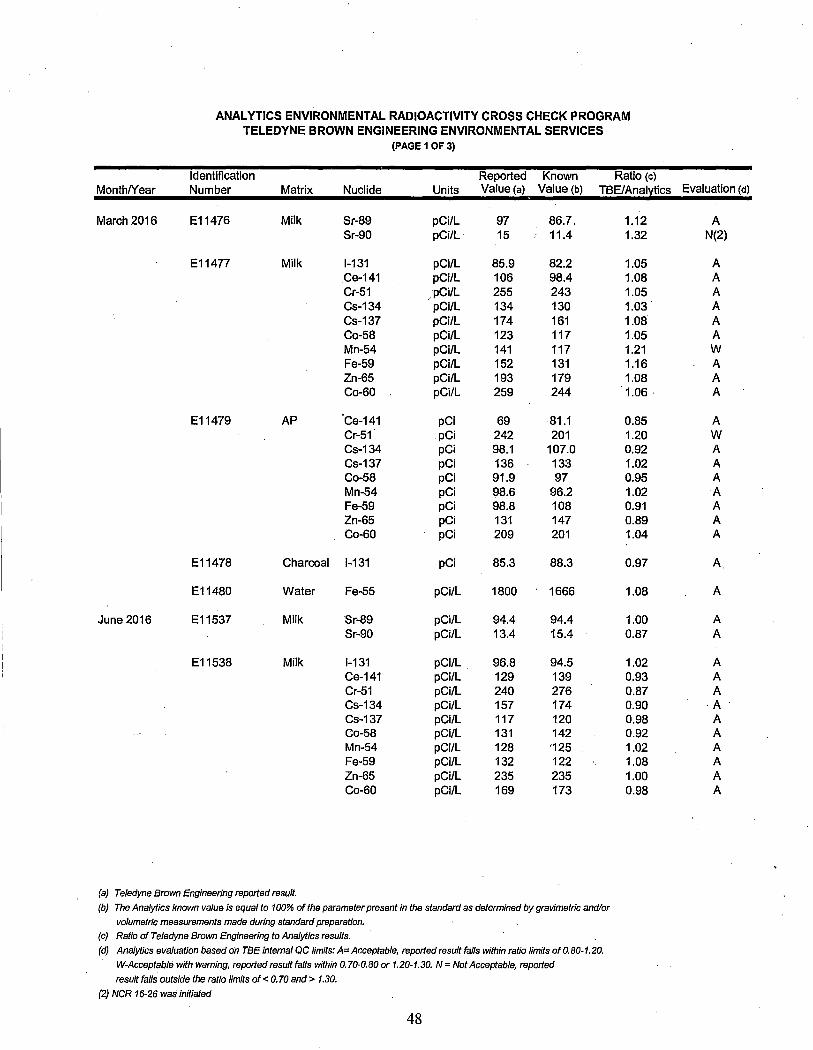
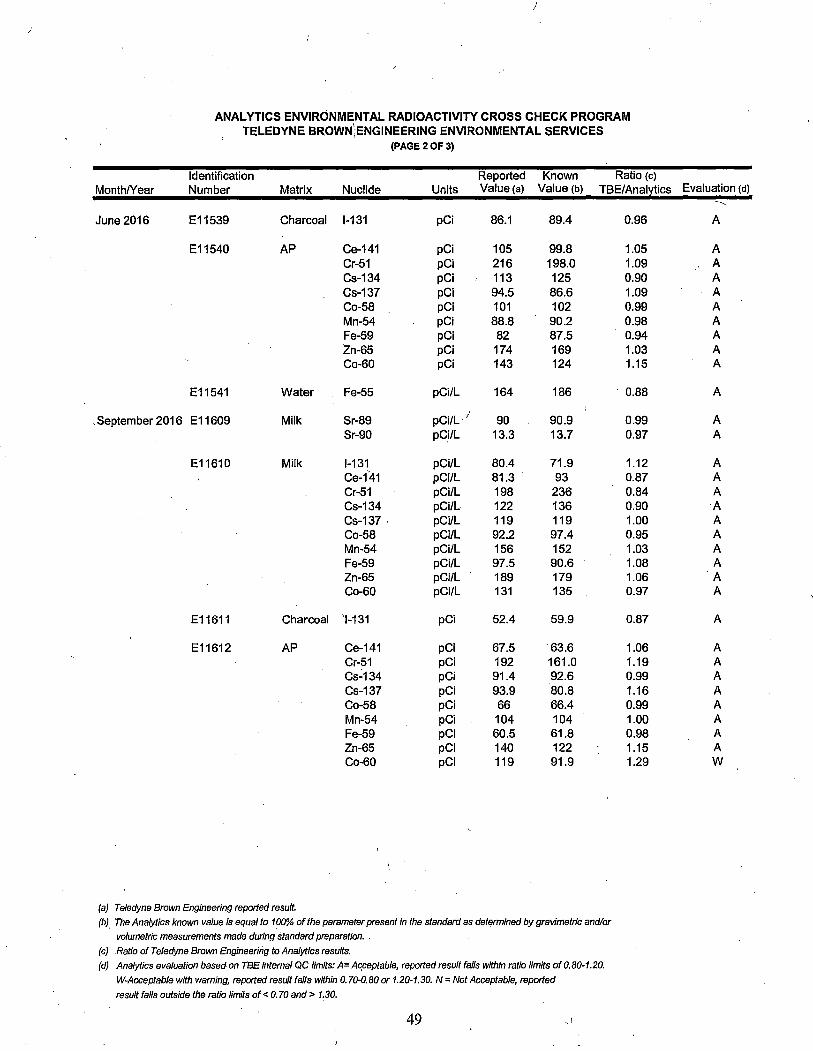
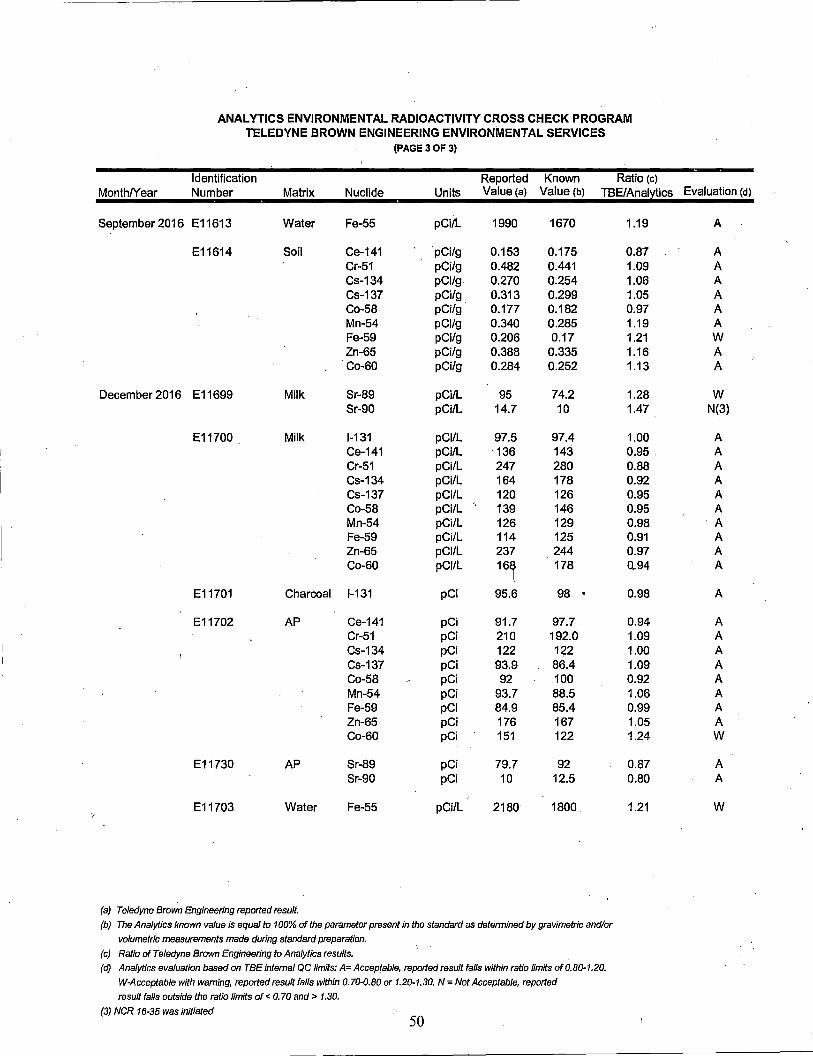
2.9. Interlaboratory Comparison Results
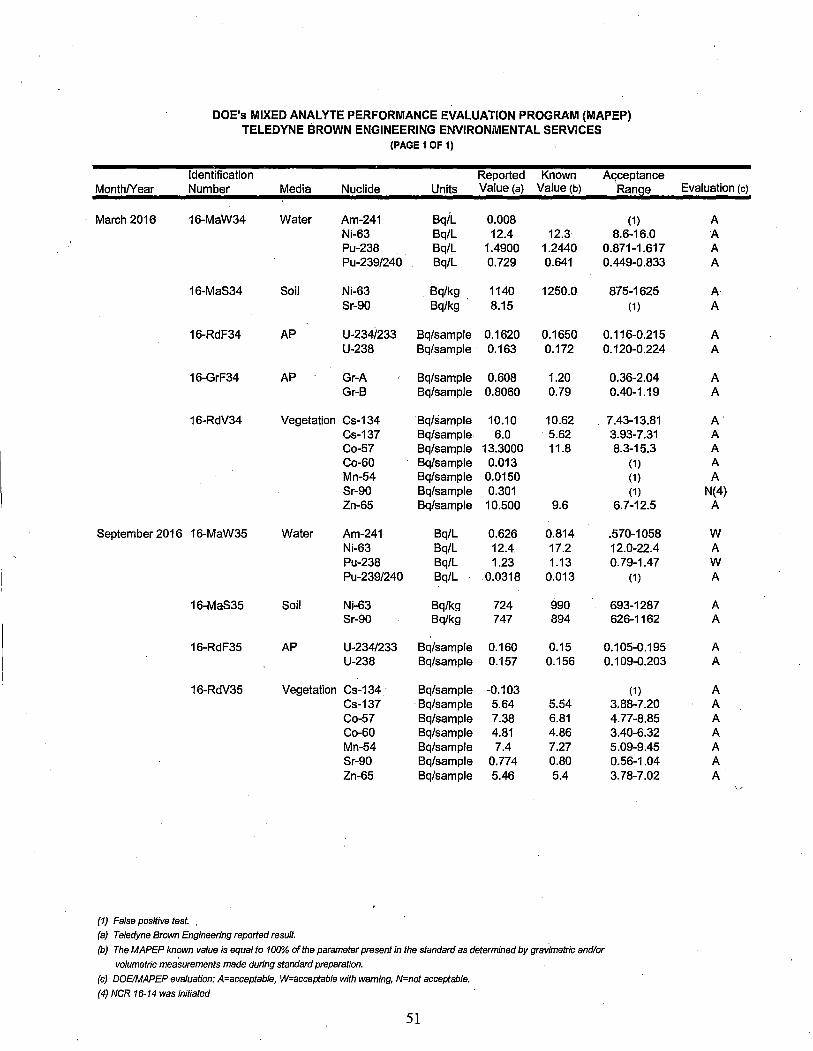
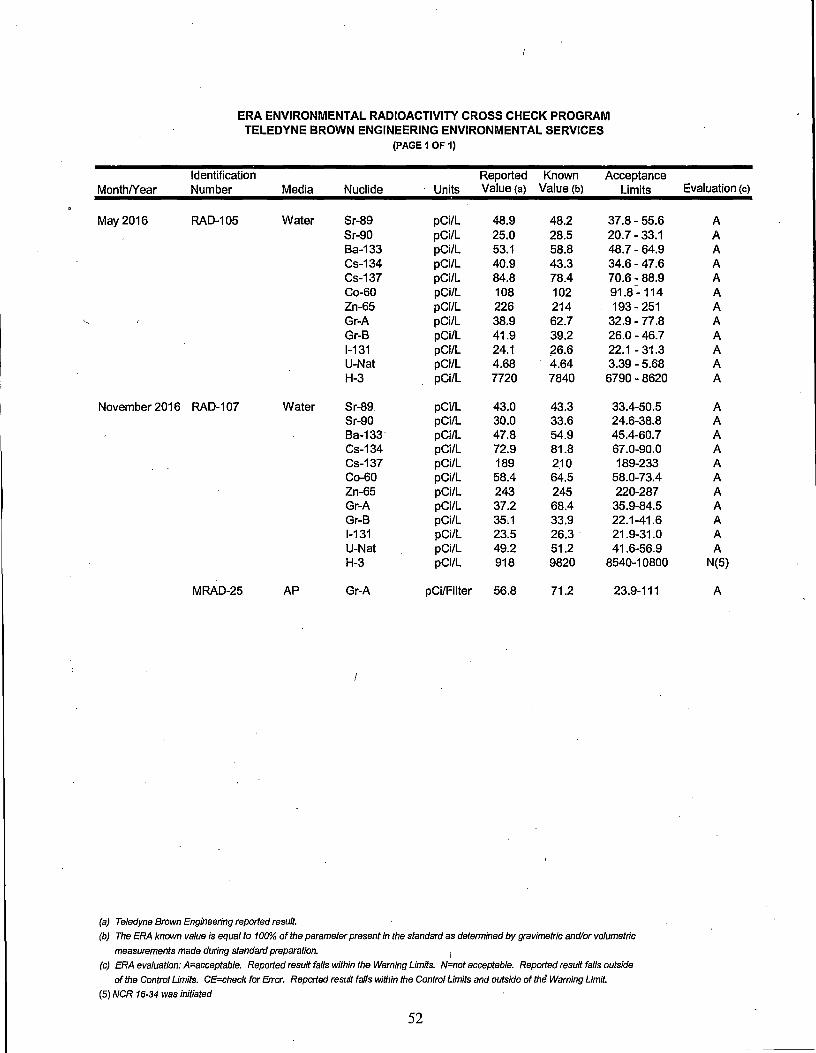
The purpose of the Interlaboratory Comparison Program (ICP) is to confirm the accuracy of results produced by Teledyne Brown Engineering. Samples of various matrices (i.e. soil, water, vegetation, air filters, and milk) are spiked with known amounts of radioactivity by commercial 'vendors of this service and by departments within the government. TBE participates in three programs. Two are commercial, Analytics Inc. and Environmental Resource Associates (ERA) and one is a government sponsored program, the Department of Energy's (DOE) Mixed Analyte Performance Evaluation Program (MAPEP). The DOE's Idaho National Engineering Laboratory administers the MAPEP. All three programs are blind performance evaluation studies in which samples with known activities are sent to TBE for analysis. Once analyzed, TBE submits the results to the respective agency for evaluation. The results of these evaluations are · published in TBE's quarterly and annual QA reports.
The 2016 Interlaboratory Comparison Program includes all contractually required matrices and analyses TBE supplies to customers' and specifically RBS' s Technical Requirements Manual 3.12.3. Attachment 8 contains these results.
In reviewing our environmental inter-laboratory crosscheck programs, we identified 1) duplication of efforts on some matrices and isotopes and 2) that we are performing crosscheck samples on some matrices and isotopes that1 we do not perform for clients. Since the DOE MAPEP is designed to evaluate the ability of analytical facilities to correctly analyze for radiological constituents representative of those at DOE sites, the needed changes were made to the MAPEP program. Therefore, the following isotopes were removed from the MAPEP program:
Soil- gamma-will be provided by Analytics twice per year in 2016.
AP - gamma - is currently provided by Analytics.
Water - gamma, H-3, Sr-90, uranium, gross alpha and gross beta currently provided by ERA. '
MAPEP evaluates non-reported (NR) analyses as failed if they were reported in the previous series.
For the TBE laboratory, 1~6 out of 160 analyses performed met the specified acceptance criteria. Four analyses did not meet the specified acceptance criteria for the following reasons and were addressed through the TBE Corrective Action Program.
Note: The Department of Energy (DOE) Mixed Analyte Performance Evaluation Program (MAPEP) samples are created to mimic conditions found at DOE sites which do not resemble typical environmental samples obtained at commercial nuclear power facilities.
1. Teledyne Brown Engineering's MAPEP March 2016 air particulate cross check sample is now being provided to TBE by Analytics. MAPEP's policy is to evaluate as failed non-reported nuclides that were reported in the previous study. NCR 16-14
18
.r
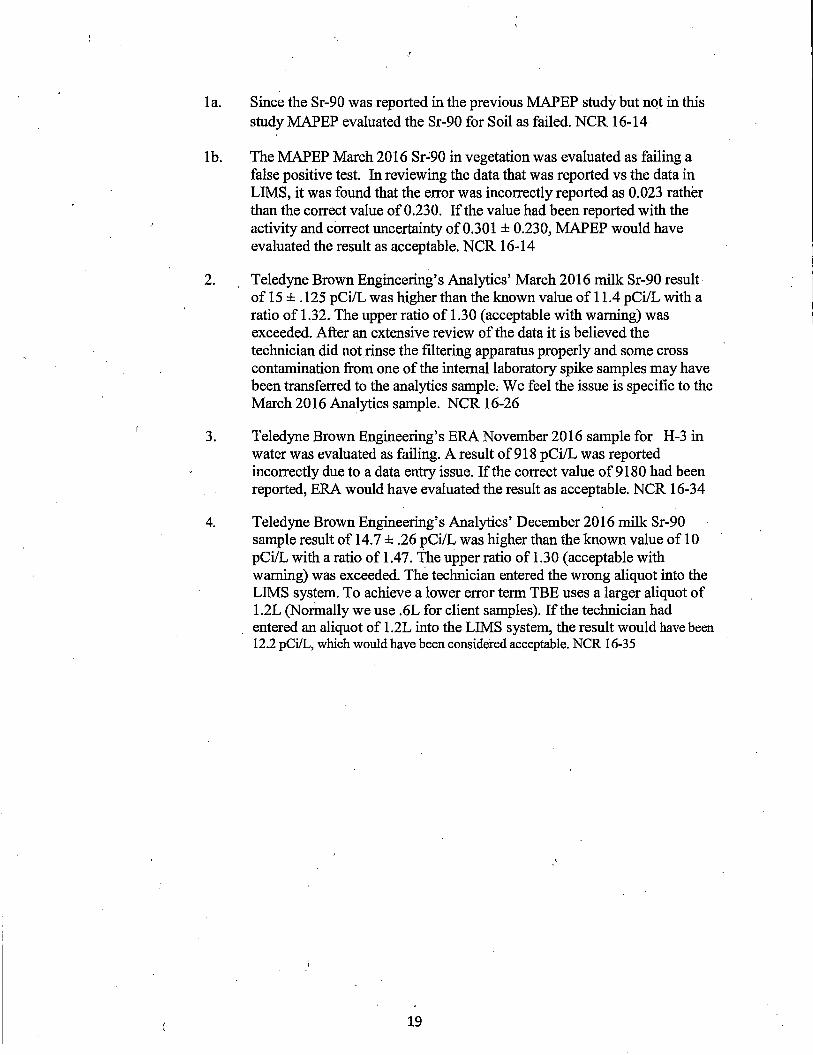
la. Since the Sr-90 was reported in the previous MAPEP study but not in this study MAPEP evaluated the Sr-90 for Soil as failed. NCR 16-14
lb. The MAPEP March 2016 Sr~90 in vegetation was evaluated as failing a false positive test. In reviewing the data that was reported vs the data in LIMS, it was found that the error was incorrectly reported as 0.023 rather than the correct value of 0.230. If the value had been reported with the activity and correct uncertainty of0.301±0.230, MAPEP would have evaluated the result as acceptable. NCR 16-14
2. Teledyne Brown Engineering's Analytics' March 2016 milk Sr-90 result of 15 ± .125 pCi/L was higher than the known value of 11.4 pCi/L with a ratio of 1.32. The upper ratio of 1.30 (acceptable with warning) was exceeded. After an extensive review of the data it is believed the technician did not rinse the filtering apparatus properly and some cross contamination from one of the internal laboratory spike samples may have been transferred to the analytics sample; We feel the issue is specific to the March 2016 Analytics sample. NCR 16-26
3. Teledyne Brown Engineering's ERA November 2016 sample for H-3 in water was evaluated as failing. A result of 918 pCi/L was reported incorrectly due to a data entry issue. If the correct value of 9180 had been reported, ERA would have evaluated the result as acceptable. NCR 16-34
4. Teledyne Brown Engineering's Analytics' December 2016 milk Sr-90 sample result of 14. 7 ± .26 pCi/L was higher than the known value of 10 pCi/L with a ratio of 1.47. The upper ratio of 1.30 (acceptable with warning) was exceeded. The technician entered the wrong aliquot into the LIMS system. To achieve a lower error term TBE uses a larger aliquot of l.2L (Normally we use .6L for client samples). If the technician had entered an aliquot of l .2L into the LIMS system, the result would have been 12.2 pCi/L, which would have been considered acceptable. NCR 16-35
19
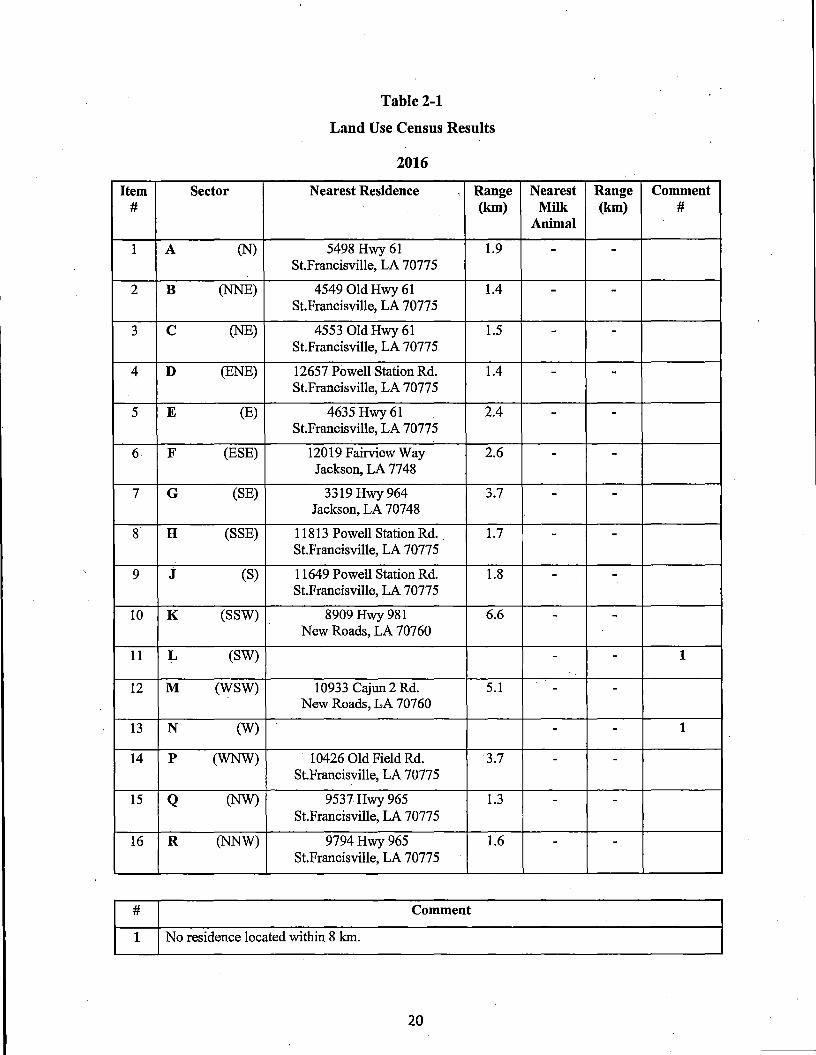
Table 2-1
Land Use Census Results
2016
Item Sector Nearest Residence •, Range Nearest Range Comment # (km) Milk (km) #
Animal
1 A (N) 5498 Hwy 61 1.9 - -St.Francisville, LA 70775
2 B (NNE) 4549 Old Hwy 61 1.4 - -St.Francisville, LA 70775
3 c (NE) 4553 Old Hwy 61 1.5 - -St.Francisville, LA 70775
4 D (ENE) 12657 Powell Station Rd. 1.4 - -St.Francisville, LA 70775
5 E (E) 4635 Hwy61 2.4 - -St.Francisville, LA 70775
6. F (ESE) 12019 Fairview Way 2.6 - -Jackson, LA 7748
7 G (SE) 3319Hwy964 3.7 - -Jackson, LA 70748
8 H (SSE) 11813 Powell Station Rd. 1.7 - -St.Francisville, LA 70775
9 j (S) 11649 Powell Station Rd. 1.8 - -St.Francisville, LA 70775
10 K (SSW) 8909Hwy981 6.6 - -New Roads, LA 70760
11 L (SW) - - 1
12 M (WSW) 10933 Cajun 2 Rd. 5.1 - -New Roads, LA 70760
13 N (W) - - 1
14 p (WNW) . 10426 Old Field Rd. 3.7 - -St.Francisville, LA 70775
15 Q (NW) 9537Hwy965 1.3 - -St.Francisville, LA 70775
16 R (NNW) 9794Hwy965 1.6 - -St.Francisville, LA 70775
# Comment
1 No residence located within 8 km.
20
... Ql
'i E u :c ::::l
:§: 0 a.
FIGURE2·1 TLD Indicator Results (2016) Versus Control Data (1986-2016)
TA1 T81 TC1 TD1 TE1 TF1 TG1 TH1 TJ1 TK1 TL 1 TM1 TN1 TP1 TQ1 TR1
no Locations
- +'3-sl.gma Control - - -3-Sigma control • ts: Qtr • 2nd Qtr A 3rd Qtr x 4th·Qtr
FIGURE2-2 Gross Beta Indicator Results (2016)
().0400
0.0300
0.0200
0.0100
21
3. Radiological Environmental Monitoring Program Summary
3.1. 2016 Program Results Summary
Table 3.1 summarizes the 2016 REMP results. RBS personnel did not use values reported as less than the lower limit of detection (<LLD) when determining ranges and means for indicator and control locations.
22
\
Table 3.1
Environmental Radiological Monitoring Program Summary
23
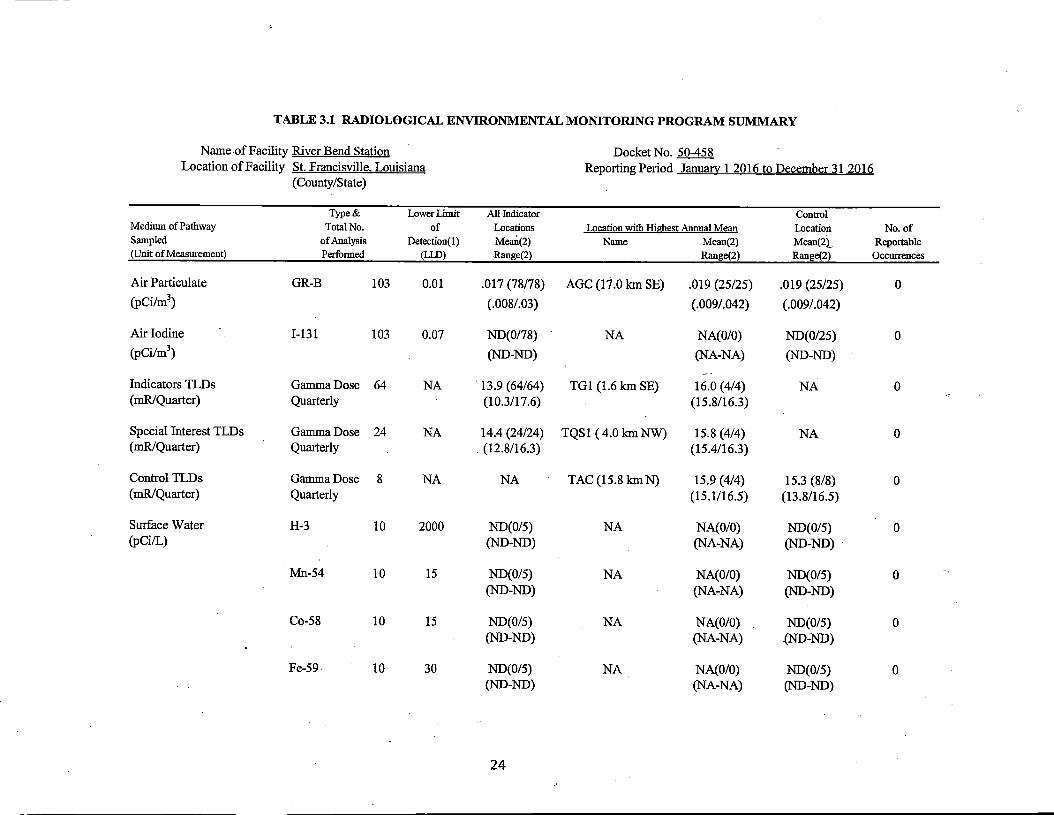
TABLE 3.1 RADIOLOGICAL ENVIRONMENTAL MONITORING PROGRAM SUMMARY
Name.ofFacility River Bend Station Docket No. 50-458 Location of Facility St. Francisville. Louisiana Reporting Period Janua[y 1 2016 to December 31 2016
(County/State)
Type& Lower Limit All Indicator Control Medium of Pathway Total No. of Locations Location with Highest Annual Mean Location No.of Sampled of Analysis Detection( 1) Mean(2) Name Mean(2) Mean(2}_ Reportable (Unit of Measurement) Performed (LID) Range(2) Range(2) Range(2) Occurrences
Air Particulate GR-B 103 0.01 .017 (78/78) AGC (17.0 km SE) .019 (25/25) .019 (25/25) 0 (pCi/m~) (,008/.03) (.009/.042) (.009/.042)
Air Iodine I-131 103 0.07 ND(0/78) NA NA(0/0) ND(0/25) 0 (pCi/m3
) (ND-ND) (NA-NA) (ND-ND)
Indicators TLDs Gamma Dose 64 NA . 13.9 (64/64) TGl (1.6 km SE) 16.0 (4/4) NA 0 (mR/Quarter) Quarterly (10.3/17.6) (15.8/16.3)
Special Interest TLDs Gamma Dose 24 NA 14.4 (24/24) TQSl ( 4.0 km NW) · 15.8 (4/4) NA 0 (mR/Quarter) Quarterly . (12.8/16.3) (15.4/16.3)
Control TLDs Gamma Dose 8 NA NA TAC (15.8 kmN) 15.9 (4/4) 15.3 (8/8) 0 (mR/Quarter) Quarterly (15.1/16.5) (13.8/16.5)
Surface Water H-3 10 2000 ND(0/5) NA NA(O/O) ND(0/5) 0 (pCi/L) (ND-ND) (NA-NA) (ND-ND) .
Mn-54 10 15 ND(0/5) NA NA(O/O) ND(0/5) 0 (ND-ND) (NA-NA) (ND-ND)
Co-58 10 15 ND(0/5) NA NA(O/O) ND(0/5) 0 (ND-ND) (NA-NA) .(ND-ND)
Fe-59 10 30 ND(0/5) NA NA(O/O) ND(0/5) 0 (ND-ND) (NA-NA) (ND-ND)
24
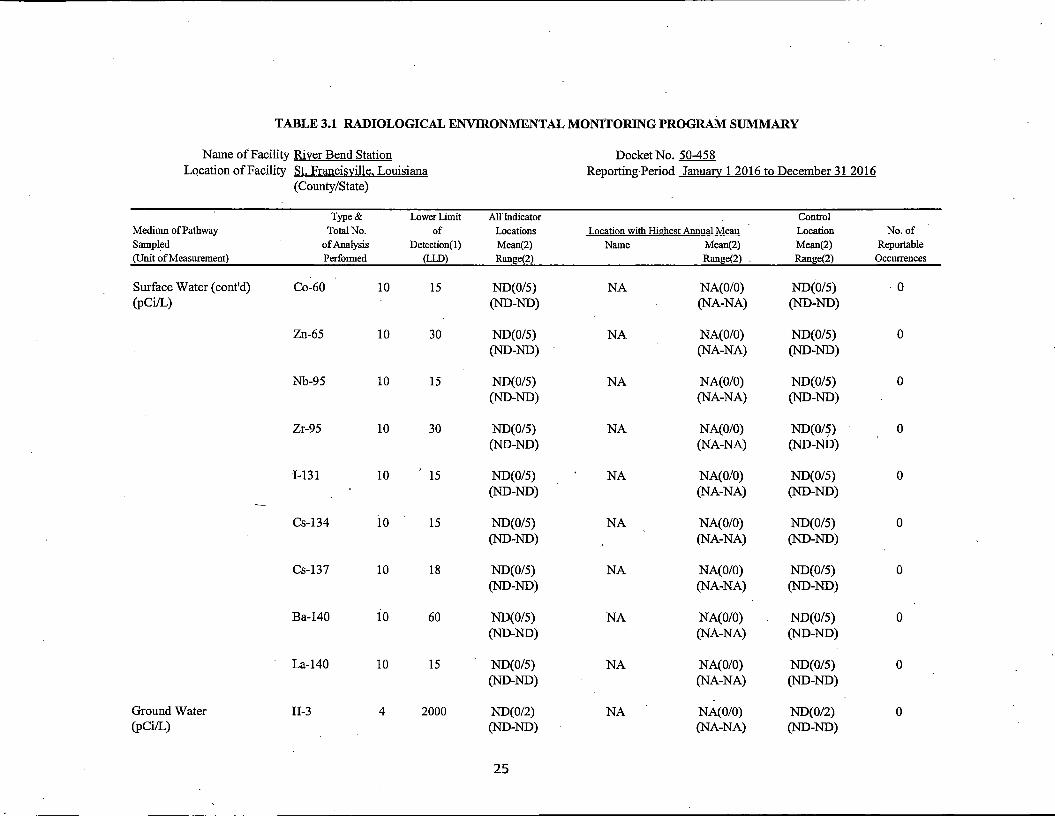
TABLE 3.1 RADIOLOGICAL ENVIRONMENTAL MONITORING PROGRAM SUMMARY
Name of Facility River Bend Station Docket No. 50-458 Location of Facility St. Francisville, Louisiana Reporting Period January 1 2016 to December 31 2016
(County/State)
Type& Lower Limit All' Indicator Control Medium of Pathway Total No. of Locations Location with Highest Annual Mean Location No.of Sampled of Analysis Detection(!) Mean(2) Name Mean(2) Mean(2) Reportable (Unit of Measurement) Performed (LLD) Range(2) Range(2) . Range(2) Occurrences
Surface Water (cont'd) Co-60 IO 15 ND(0/5) NA NA(O/O) ND(0/5) ·O (pCi/L) (ND-ND) (NA-NA) (ND-ND)
Zn-65 IO 30 ND(0/5) NA NA(O/O) ND(0/5) 0 (ND-ND) (NA-NA) (ND-ND)
Nb-95 IO 15 ND(0/5) NA NA(O/O) ND(0/5) 0 (ND-ND) (NA-NA) (ND-ND)
Zr-95 IO 30 ND(0/5) NA NA(O/O) ND(OI?) 0 (ND-ND) (NA-NA) (ND-ND)
I-131 IO 15 ND(0/5) NA NA(O/O) ND(0/5) 0 (ND-ND) (NA-NA) (ND-ND)
Cs-134 IO 15 ND(0/5) NA NA(O/O) ND(0/5) 0 (ND-ND) (NA-NA) (ND-ND)
Cs-137 IO 18 ND(0/5) NA NA(O/O) ND(0/5) 0 (ND-ND) (NA-NA) (ND-ND)
Ba-140 IO 60 ND(0/5) NA NA(O/O) ND(0/5) 0 (ND-ND) (NA-NA) (ND-ND)
La-140 IO 15 ND(0/5) NA NA(O/O) ND(0/5) 0 (ND-ND) (NA-NA) (ND-ND)
Ground Water H-3 4 2000 ND(0/2) NA NA(O/O) ND(0/2) 0 (pCi/L) (ND-ND) (NA-NA) (ND-ND)
25
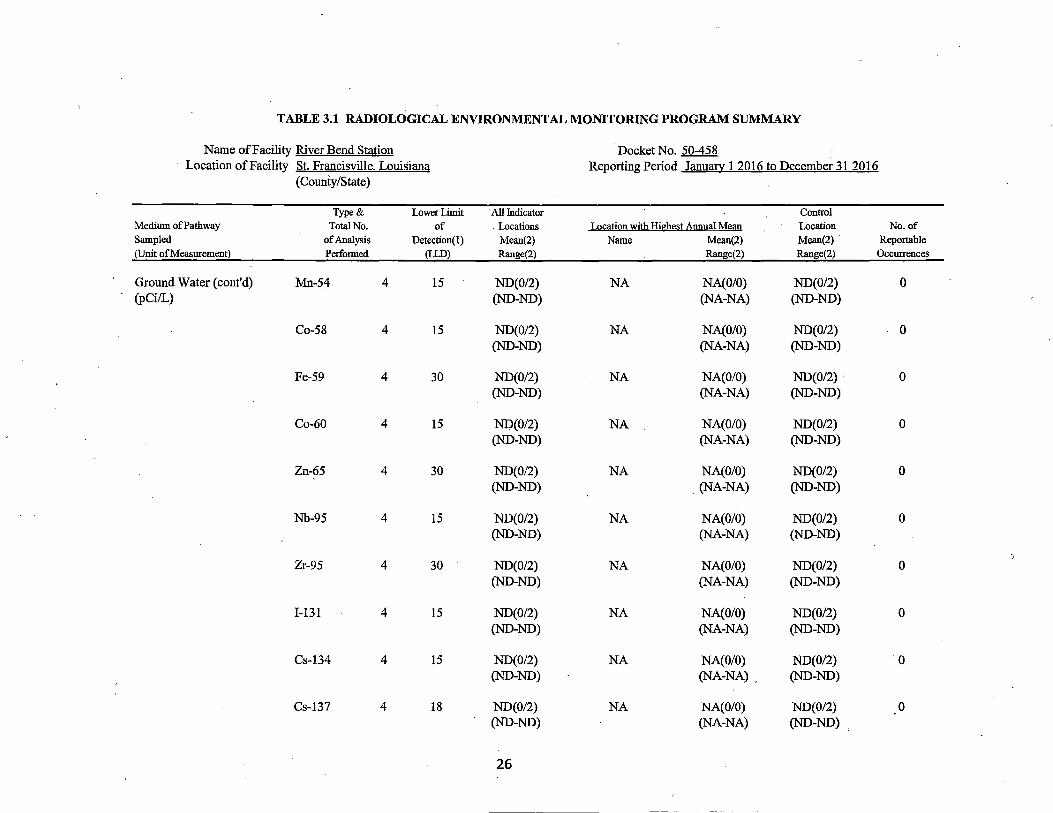
TABLE 3.1 RADIOLOGICAL ENVIRONMENTAL MONITORING PROGRAM SUMMARY
Name of Facility River Bend Station Docket No. 50-458 Location of Facility St. Francisville. Louisiana Reporting Period Janufil:Y 1 2016 to December 31 2016
(County/State)
Type& Lower Limit ·All Indicator Control Medium of Pathway Total No. of . Locations Lgcation with Highest Annual Mean Location No.of Sampled of Analysis Detection( l) Mean(2) Name Mean(2) Mean(2) · Reportable (Unit of Measurement) . Performed (LLD) Range(2) Range(2) Range(2) Occurrences
Ground Water (cont'd) Mn-54 4 15 ND(0/2) NA NA(O/O) ND(0/2) 0 .
(pCi/L) (ND-ND) (NA-NA) (ND-ND)
Co-58 4 15 ND(0/2) NA NA(O/O) ND(0/2) 0 (ND-ND) (NA-NA) (ND-ND)
Fe-59 4 30 ND(0/2) NA NA(O/O) ND(0/2) · 0 (ND-ND) (NA-NA) (ND-ND)
Co-60 4 15 ND(0/2) NA NA(O/O) ND(0/2) 0 (ND-ND) (NA-NA) (ND-ND)
Zn-65 4 30 ND(0/2) NA NA(O/O) ND(0/2) 0 (ND-ND) . (NA-NA) (ND-ND)
Nb-95 4 15 ND(0/2) NA NA(O/O) ND(0/2) 0 (ND-ND) (NA-NA) (ND-ND)
Zr-95 4 30 ND(0/2) NA NA(O/O) ND(0/2) 0 (ND-ND) (NA-NA) (ND-ND)
1-131 4 15 ND(0/2) NA NA(O/O) ND(0/2) 0 (ND-ND) (NA-NA) (ND-ND)
Cs-134 4 15 ND(0/2) NA NA(O/O) ND(0/2) ·o (ND-ND) (NA-NA). (ND-ND)
Cs-137 4 18 ND(0/2) NA NA(O/O) ND(0/2) 0 (ND-ND) (NA-NA) (ND-ND) J
26
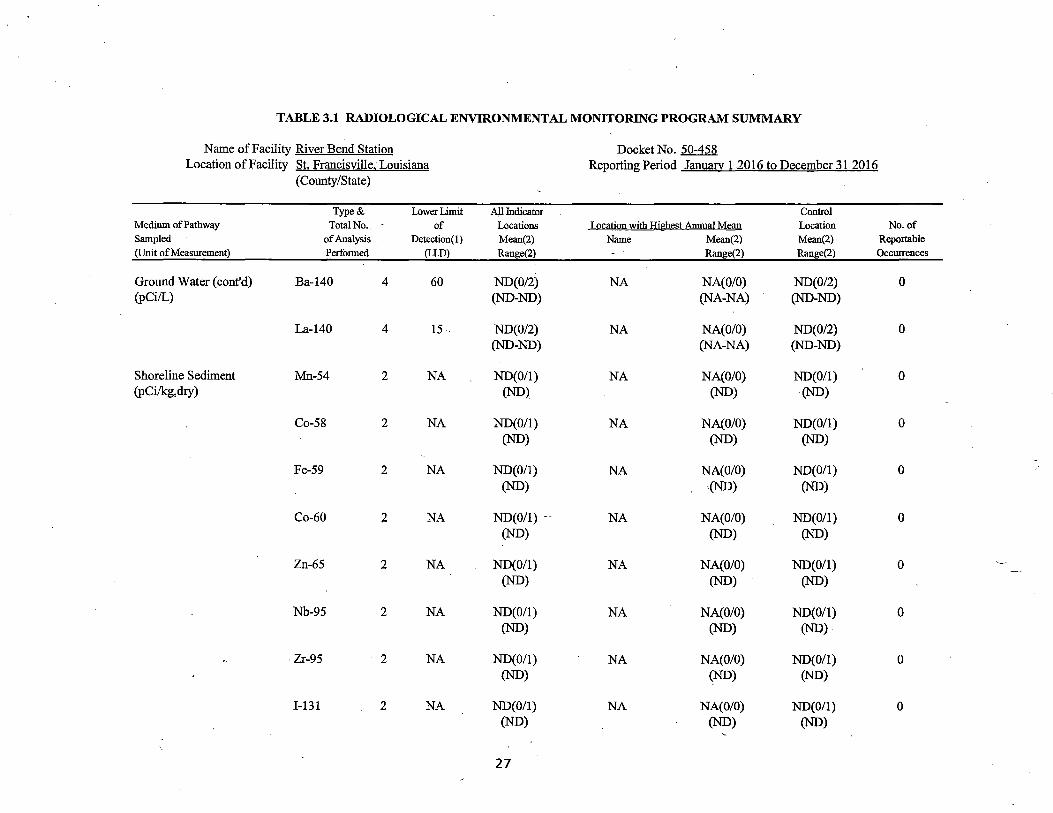
TABLE 3.1 RADIOLOGICAL ENVIRONMENTAL MONITORING PROGRAM SUMMARY
Name of Facility River Bend Station Docket No. 50-458 Location of Facility St. Francisville, Louisiana Reporting Period Januaa 1 2016 to December 31 2016
(County/State)
Type& Lower Limit AU Indicator Control Medium of Pathway TotalNo .. - of Locations Location with Hig!!est Annual Mean Location No.of Sampled of Analysis Detection( I) Mean(2) Name Mean(2) Mean(2) Reportable (Unit of Measurement) Performed (LLD) Range(2) Range(2) Range(2) Occurrences
Ground Water (cont'd) Ba-140 4 60 ND(0/2) NA NA(O/O) ND(0/2) 0 (pCi/L) (ND-ND) (NA-NA) (ND-ND)
La-140 4 15 ND(0/2) NA NA(O/O) ND(0/2) 0 (ND-ND) (NA-NA) (ND-ND)
Shoreline Sediment Mn-54 2 NA ND(O/l) NA NA(0/0) ND(0/1) 0 (pCi/kg,dry) (ND) (ND) (ND)
Co-58 2 NA ND(0/1) NA NA(O/O) ND(0/1) 0 (ND) (ND) (ND)
Fe-59 2 NA ND(O/l) NA NA(O/O) ND(0/1) 0 (ND) '(ND) (ND)
Co-60 2 NA ND(O/l) -- NA NA(O/O) ND(0/1) 0 (ND) (ND) (ND)
Zn-65 2 NA ND(0/1) NA NA(O/O) ND(O/l) 0 (ND) (ND) (ND)
Nb-95 2 NA ND(0/1) NA NA(0/0) ND(0/1) 0 (ND) (ND) (ND)
· Zr-95 2 NA ND(O/l) NA NA(O/O) ND(0/1) 0 (ND) (ND) (ND)
1-131 2 NA ND(0/1) NA NA(O/O) ND(0/1) 0 (ND) (ND) (ND)
27
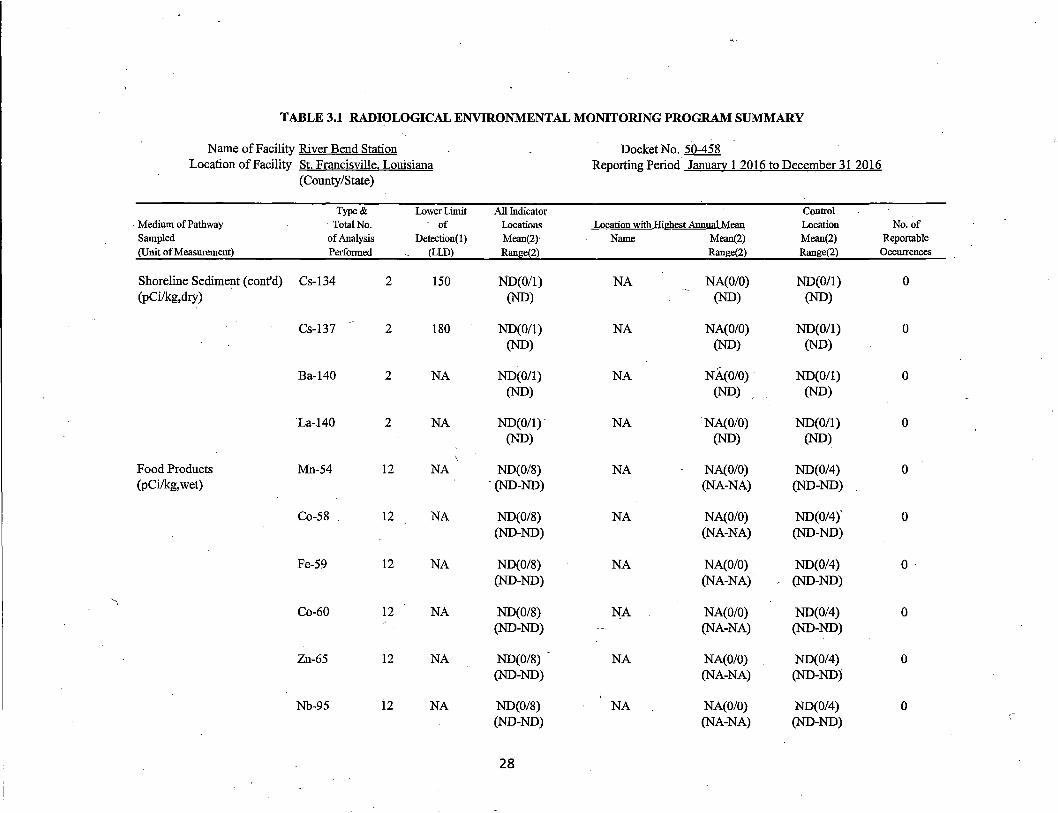
TABLE 3.1 RADIOLOGICAL ENVIRONMENTAL MONITORING PROGRAM SUMMARY
Name of Facility River Bend Station Docket No. 50-458 Location of Facility St. Francisville. Louisiana Reporting Period Januaa: 1 2016 to December 31 2016
(County/State)
Type& Lower Limit All Indicator Control Medium of Pathway · TotalNo. , of Locations Location with Highest Annual Mean Location No.of Sampled of Analysis Detection( 1) Mean(2) Name Mean(2) Mean(2) Reportable (Unit of Measurement) Performed (LLD) Range(2) Range(2) Range(2) Occurrences
Shoreline Sediment (cont'd) Cs-134 2 150 Nb(0/1) NA NA(O/O) ND(0/1) 0 (pCi/kg,dry) (ND) (ND) (ND)
Cs-137 2 180 ND(0/1) NA NA(O/O) ND(0/1) 0 (ND) (ND) (ND)
Ba-140 2 NA ND(0/1) NA NA(O/O). ND(0/1) 0 (ND) (ND) (ND)
La-140 2 NA ND(0/1) NA NA(O/O) ND(O/l) 0 (ND) (ND) (ND)
Food Products Mn-54 12 NA ND(0/8) NA NA(O/O) ND(0/4) 0 (pCi/kg, wet) -(ND-ND) (NA-NA) (ND-ND)
Co-58 . 12 NA ND(0/8) NA NA(0/0) ND(0/4)' 0 (ND-ND) (NA-NA) (ND-ND)
Fe-59 12 NA ND(0/8) NA NA(0/0) ND(0/4) O· (ND-ND) (NA-NA) (ND-ND)
"' Co-60 12 NA ND(0/8) NA NA(O/O) ND(0/4) 0 (ND-ND) (NA-NA) (ND-ND)
Zn-65 12 NA ND(0/8) NA NA(O/O) ND(0/4) 0 (ND-ND) (NA-NA) (ND-ND)
Nb-95 i2 NA ND(0/8) NA NA(O/O) ND(0/4) 0 (ND-ND) (NA-NA) (ND-ND)
28
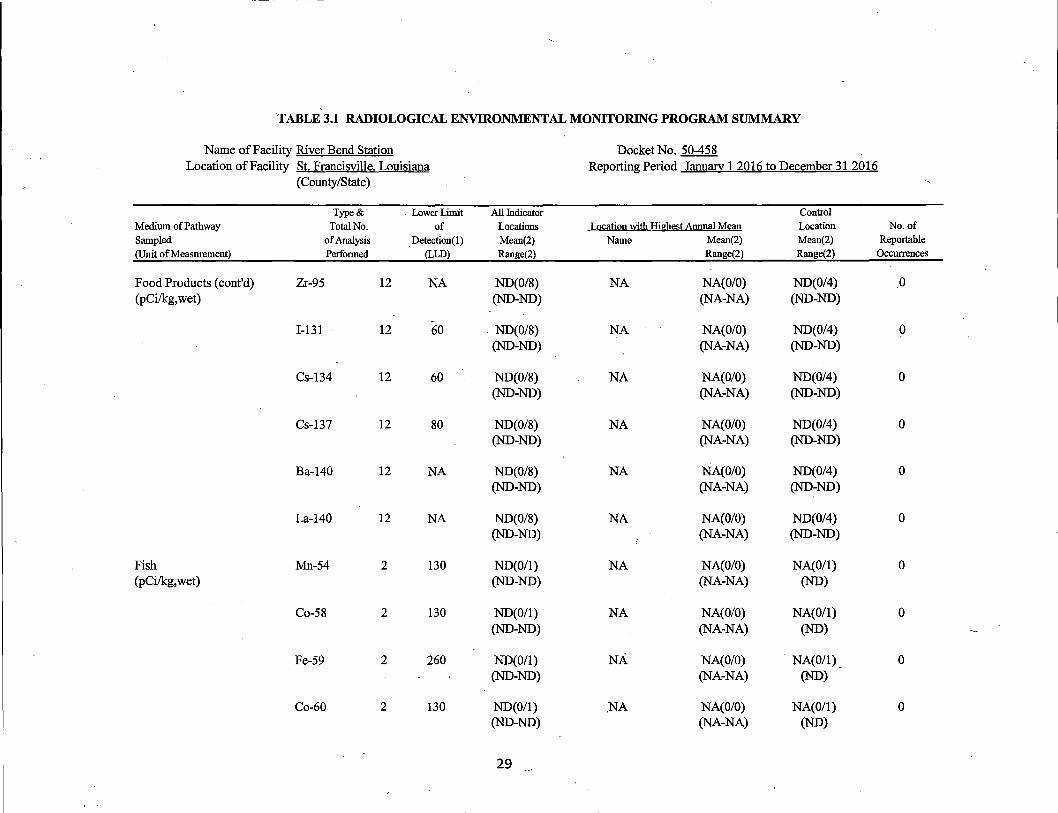
TABLE 3.1 RADIOLOGICAL ENVIRONMENTAL MONITORING PROGRAM SUMMARY
Name of Facility River Bend Station Docket No. 50-458 Location of Facility St. Francisville. Louisiana Reporting Period J anufilY 1 2016 to December 31 2016
(County/State)
Type& . Lower Limit All Indicator Control
Medium of Pathway Total No. of Locations Location. with Highest Annual Mean Location No.of
Sampled of Analysis Detection( I) Mean(2) Name Mean(2) Mean(2) Reportable
(Unit of Measurement) Performed (LLD) Range(2) Range(2) Range(2) Occurrences
Food Products (cont'd) Zr-95 12 NA ND(0/8) NA NA(O/O) ND(0/4) 0 (pCi/kg,wet) (ND-ND) (NA-NA) (ND-ND)
-1-131 12 60 . ND(0/8) NA NA(O/O) ND(0/4) 0
(ND-ND) (NA-NA) (ND-ND)
Cs-134 12 60 ND(0/8) NA NA(O/O) ND(0/4) 0 (ND-ND) (NA-NA) (ND-ND)
Cs-137 12 80 ND(0/8) NA NA(O/O) ND(0/4) 0 (ND-ND) (NA-NA) (ND-ND)
Ba-140 12 NA ND(0/8) NA NA(O/O) ND(0/4) 0 (ND-ND) (NA-NA) (ND-ND)
La-140 12 NA ND(0/8) NA NA(O/O) ND(0/4) 0 (ND-ND) (NA-NA) (ND-ND)
Fish Mn-54 2 130 ND(0/1) NA NA(O/O) NA(0/1) 0 (pCi/kg,wet) (ND-ND) (NA-NA) (ND)
Co-58 2 130 ND(0/1) NA NA(O/O) NA(0/1) 0 (ND-ND) (NA-NA) (ND)
Fe-59 2 260 ND(0/1) NA NA(O/O) NA(0/1) 0 (ND-ND) (NA-NA) (ND)
Co-60 2 130 ND(0/1) ,NA NA(O/O) NA(0/1) 0 (ND-ND) (NA-NA) (ND)
29
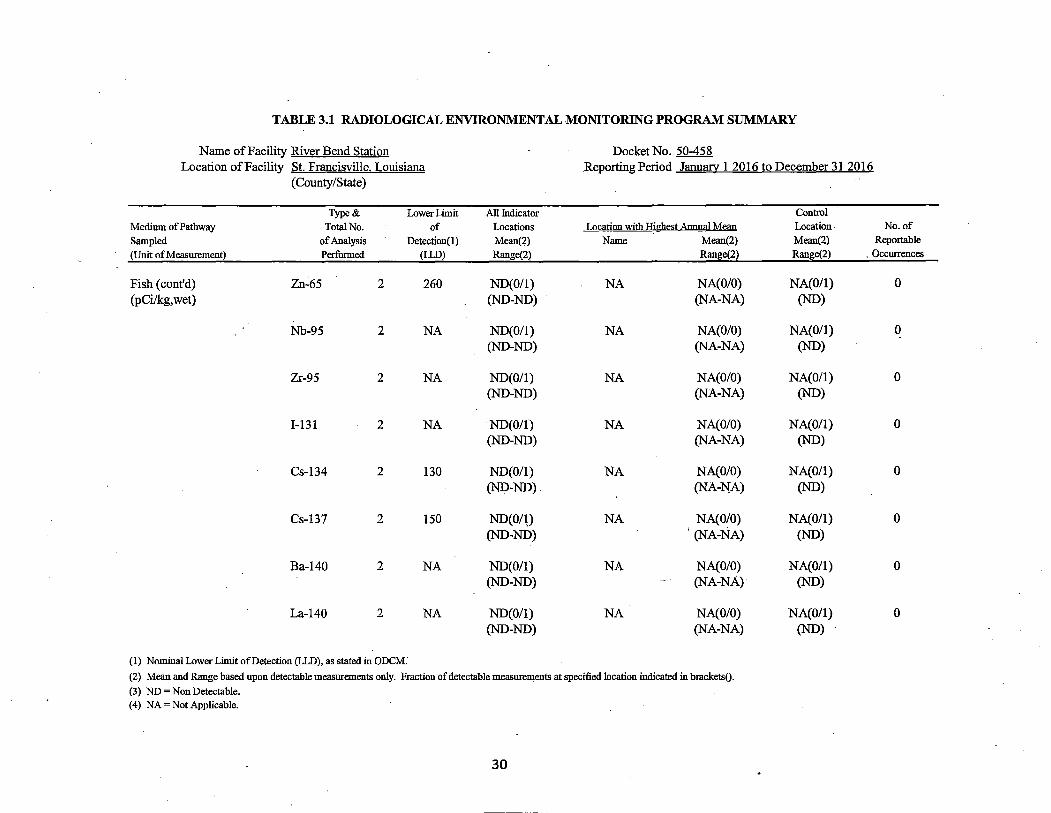
TABLE 3.1 RADIOLOGICAL ENVIRONMENTAL MONITORING PROGRAM SUMMARY
Name of Facility River Bend Station Docket No. 50-458 Location of Facility St. Francisville. Louisiana Reporting Period January 1 2016 to December 31 2016
(County/State)
Type& Lower Limit All Indicator Control
Medium of Pathway Total No. of Locations Location with Highest Annual Mean Location No.of
Sampled of Analysis Detection(l) Mean(2) Name Mean(2) Mean(2) Reportable
(Unit of Measurement) Performed (LLD) Range(2) Range(2) Range(2) . Occurrences
Fish (cont'd) Zn-65 2 260 ND(0/1) NA NA(O/O) NA(O/l) 0 (pCi/kg, wet) (ND-ND) (NA-NA) (ND)
Nb-95 2 NA ND(0/1) NA NA(O/O) NA(O/l) 0 (ND-ND) (NA-NA) (ND)
Zr-95 2 NA ND(O/l) NA NA(O/O) NA(0/1) 0 (ND-ND) (NA-NA) (ND)
1-131 . 2 NA ·ND(O/l) NA NA(O/O) NA(O/l) 0 (ND-ND) (NA-NA) (ND)
Cs-134 2 130 ND(0/1) NA NA(O/O) NA(O/l) 0 (ND-ND). (NA-l'{A) (ND)
Cs-137 2 150 ND(0/0 NA NA(O/O) NA(0/1) 0 (ND-ND) I (NA-NA) (ND)
Ba-140 2 NA ND(0/1) NA NA(0/0) NA(O/l) 0 (ND-ND) (NA-NA) (ND)
La-140 2 NA ND(0/1) NA NA(O/O) NA(0/1) 0 (ND-ND) (NA-NA) (ND)
( 1) Nominal Lower Limit of Detection (LLD), as stated in ODCM:
(2) Mean and Range based upon detectable measurements only. Fraction of detectable measurements at specified location indicated in bracketsQ.
(3) ND= Non Detectable. (4) NA= Not Applicable.
30
---- -------- ----------------
Attachment 1 through 7
Data Tables
31
-- - -----------
ATTACHMENT 1.1 RIVER BEND STATION
AIRBORNE PARTICULATE AND CHARCOAL CARTRIDGES
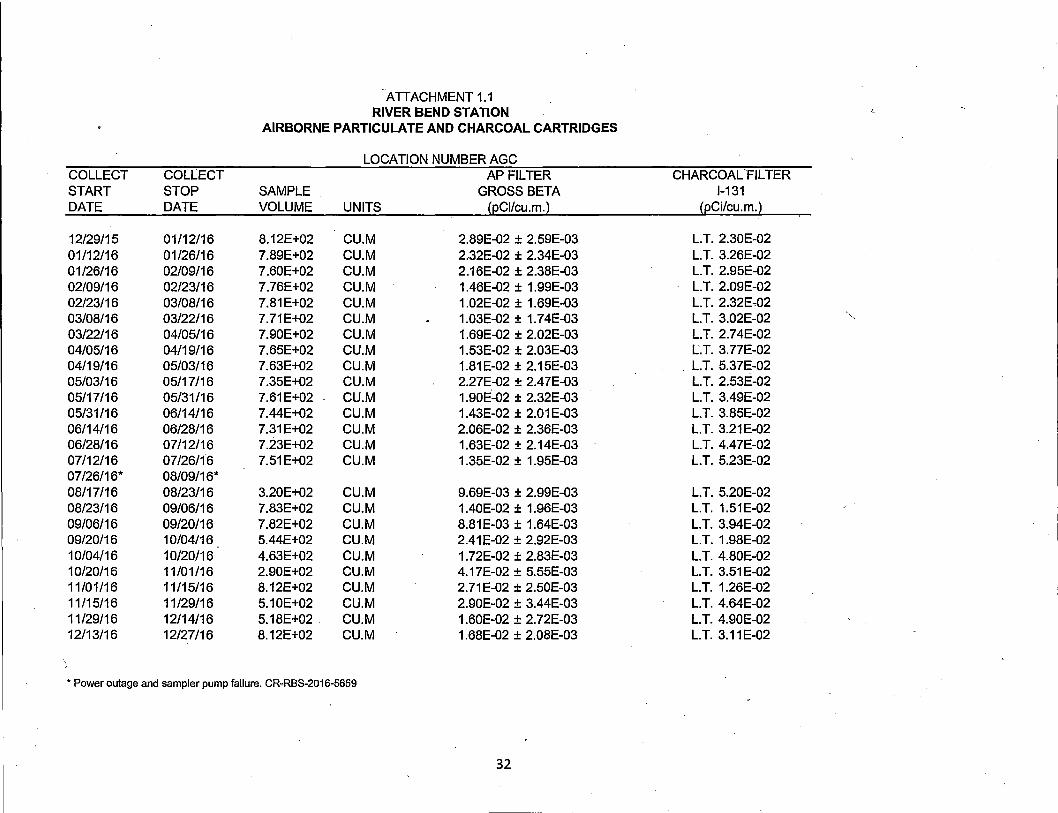
LOCATION NUMBER AGC COLLECT COLLECT AP FILTER CHARCOAL 'FILTER START STOP SAMPLE GROSS BETA 1-131 DATE DATE VOLUME UNITS (pCi/cu.m.) (pCi/cu.m.)
12/29/15 01/12/16 8.12E+02 CU.M 2.89E-02 ± 2.59E-03 LT. 2.30E-02 01/12/16 01/26/16 7.89E+02 CU.M 2 .. 32E-02 ± 2.34E-03 LT. 3.26E-02 01/26/16 02/09/16 7.60E+02 CU.M 2.16E-02 ± 2.38E-03 LT. 2.95E-02 02/09/16 02/23/16 7.76E+02 CU.M 1.46E-02 ± 1.99E-03 LT. 2.09E-02 02/23/16 03/08/16 7.81E+02 CU.M 1.02E-02 ± 1.69E-03 LT. 2.32E-02 03/08/16 03/22/16 7.71E+02 CU.M 1.03E-02 ± 1. 7 4E-03 LT. 3.02E-02 ' ,,
03/22/16 04/05/16 7.90E+02 CU.M 1.69E-02 ± 2.02E-03 LT. 2.74E-02 04/05/16 04/19/16 7.65E+02 CU.M 1.53E-02 ± 2.03E-03 LT. 3. 77E-02 04/19/16 05/03/16 7.63E+02 CU.M 1.81 E-02 ± 2.15E-03 . LT. 5.37E-02 05/03/16 05/17/16 7.35E+02 CU.M 2.27E-02 ± 2.47E-03 LT. 2.53E-02 05/17/16 05/31/16 7.61E+02 CU.M 1.90E~02 ± 2.32E-03 LT. 3.49E-02 05/31/16 06/14/16 7.44E+02 CU.M 1.43E-02 ± 2.01E-03 LT. 3.85E-02 06/14/16 06/28/16 7.31E+02 CU.M 2.06E-02 ± 2.36E-03 LT. 3.21E-02 06/28/16 07/12/16 7.23E+02 CU.M 1.63E-02 ± 2.14E-03 LT. 4.47E-02 07/12/16 07/26/16 7.51E+02 CU.M 1.35E-02 ± 1.95E-03 LT. 5.23E-02 07/26/16* 08/09/16* 08/17/16 08/23/16 3.20E+02 CU.M 9.69E-03 ± 2.99E-03 LT. 5.20E-02 08/23/16 09/06/16 7.83E+02 CU.M 1.40E-02 ± 1.96E-03 LT. 1.51E-02 09/06/16 09/20/16 7.82E+02 CU.M 8.81E-03 ± 1.64E-03 LT. 3.94E-02 09/20/16 10/04/16 5.44E+02 CU.M 2.41 E-02 ± 2.92E-03 LT. 1.98E-02 10/04/16 10/20/16 4.63E+02 CU.M 1. 72E-02 ± 2.83E-03 LT. 4.80E-02 10/20/16 11/01/16 2.90E+02 CU.M 4.17E-02 ± 5.55E-03 LT. 3.51E-02 11/01/16 11/15/16 8.12E+02 CU.M 2.71E-02 ± 2.50E-03 LT. 1.26E-02 11/15/16 11/29/16 5.10E+02 CU.M 2.90E-02 ± 3.44E-03 LT. 4.64E-02 11/29/16 12/14/16 5.18E+02 CU.M 1.60E-02 ± 2. 72E-03 LT. 4.90E-02 12/13/16 12/27/16 8.12E+02 CU.M 1.68E-02 ± 2.08E-03 LT. 3.11 E-02
*Power outage and sampler pump failure. CR-RBS-2016-5659
32
ATTACHMENT 1.1 RIVER BEND STATION
AIRBORNE PARTICULATE AND CHARCOAL CARTRIDGES
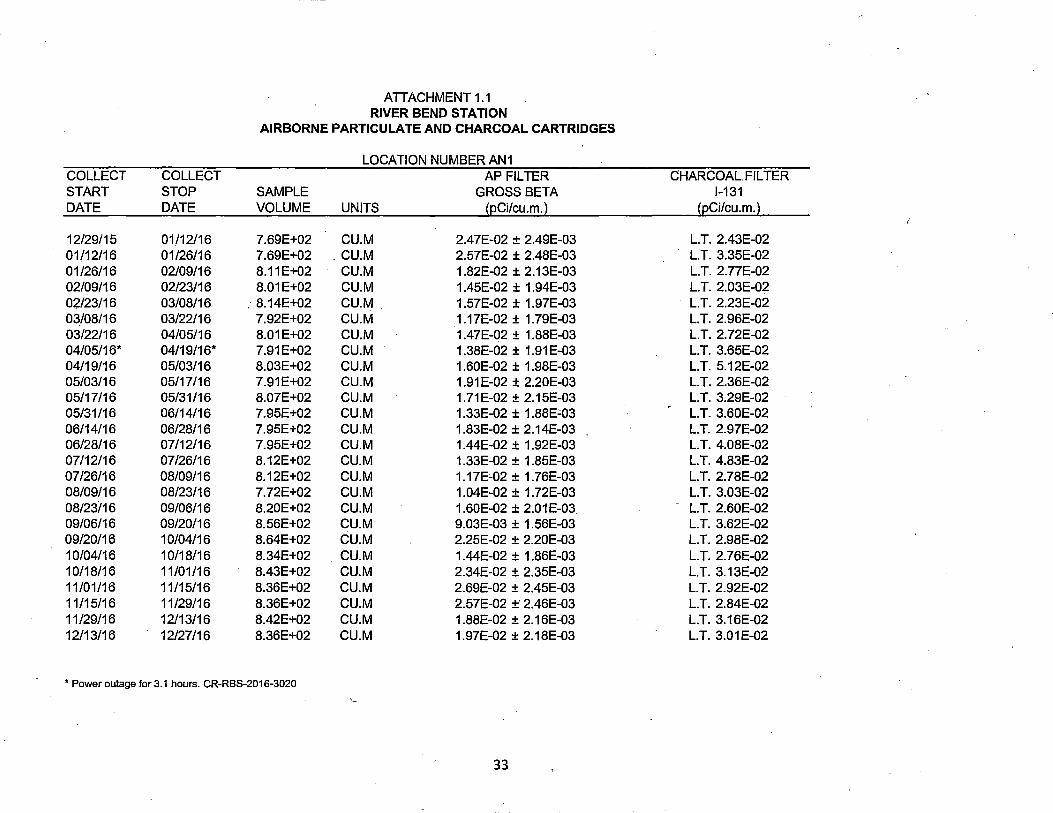
LOCATION NUMBERAN1 COLLECT COLLECT AP FILTER CHARCOAL.FILTER START STOP SAMPLE GROSS BETA 1-131 DATE DATE VOLUME UNITS (pCi/cu.m.) (pCi/cu.m.)
12/29/15 01/12/16 7.69E+02 CU.M 2.47E-02 ± 2.49E-03 LT. 2.43E-02 01/12/16 01/26/16 7.69E+02 , CU.M 2.57E-02 ± 2.48E-03 LT. 3.35E-02 01/26/16 02/09/16 8.11E+02 CU.M 1.82E-02 ± 2.13E-03 LT. 2.77E-02 02/09/16 02/23/16 8.01E+02 CU.M 1.45E-02 ± 1.94E-03 LT. 2.03E-02 02/23/16 03/08/16 . 8.14E+02 CU.M 1.57E-02 ± 1.97E-03 LT. 2.23E-02 03/08/16 03{22/16 7.92E+02 CU.M 1.17E-02 ± 1. 79E-03 LT. 2.96E-02 03/22/16 04/05/16 8.01E+02 CU.M 1.47E-02 ± 1.88E-03 LT. 2.72E-02 04/05/16* 04/19/16* 7.91E+02 CU.M 1.38E-02 ± 1.91 E-03 LT. 3.65E-02 04/19/16 05/03/16 8.03E+02 CU.M 1.60E-02 ± 1.98E-03 LT. 5.12E-02 05/03/16 05/17/16 7.91E+02 CU.M 1.91 E-02 ± 2.20E-03 LT. 2.36E-02 05/17/16 05/31/16 8.07E+02 CU.M 1.71E-02 ± 2.15E-03 LT. 3.29E-02 05/31/16 06/14/16 7.95E+02 CU.M 1.33E-02 ± 1.88E::o3 LT. 3.60E-02 06/14/16 06/28/16 7.95E+02 CU.M 1.83E-02 ± 2.14E-03 LT. 2.97E-02 06/28/16 07/12/16 7.95E+02 CU.M 1.44E-02 ± 1.92E-03 LT. 4.08E-02 07/12/16 07/26/16 8.12E+02 CU.M 1.33E-02 ± 1.85E-03 LT. 4.83E-02 07/26/16 08/09/16 8.12E+02 CU.M 1.17E~02 ± 1. 76E-03 LT. 2.78E-02 08/09/16 08/23/16 7.72E+02 CU:M 1.04E-02 ± 1. 72E-03 LT. 3.03E-02 08/23/16 09/06/16 8.20E+02 CU.M 1.60E-02 ± 2.01 E-03. LT. 2.60E-02 09/06/16 09/20/16 8.56E+02 CU.M 9.03E-03 ± 1.56E-03 LT. 3.62E-02 09/20/16 10/04/16 8.64E+02 CU.M 2.25E-02 ± 2.20E-03 LT. 2.98E-02 10/04/16 10/18/16 8.34E+02 CU.M 1.44E-02 ± 1.86E-03 LT. 2.76E-02 10/18/16 11/01/16 8.43E+02 CU.M 2.34E-02 ± 2.35E-03 LT. 3.13E-02 11/01/16 11/15/16 8.36E+02 CU.M 2.69E-02 ± 2.45E-03 LT. 2.92E-02 11/15/16 11/29/16 8.36E+02 CU.M 2.57E-02 ±' 2.46E-03 LT. 2.84E-02 11/29/16 12/13/16 8.42E+02 CU.M 1.88E-02 ± 2.16E-03 LT. 3.16E-02 12/13/16 12/27/16 8.36E+02 CU.M 1.97E-02 ± 2.18E-03 LT. 3.01 E-02
*Power outage for 3.1 hours. CR-RBS-2016-3020
33
ATTACHMENT 1.1 RIVER BEND STATION
AIRBORNE PARTICULATE AND CHARCOAL CARTRIDGES
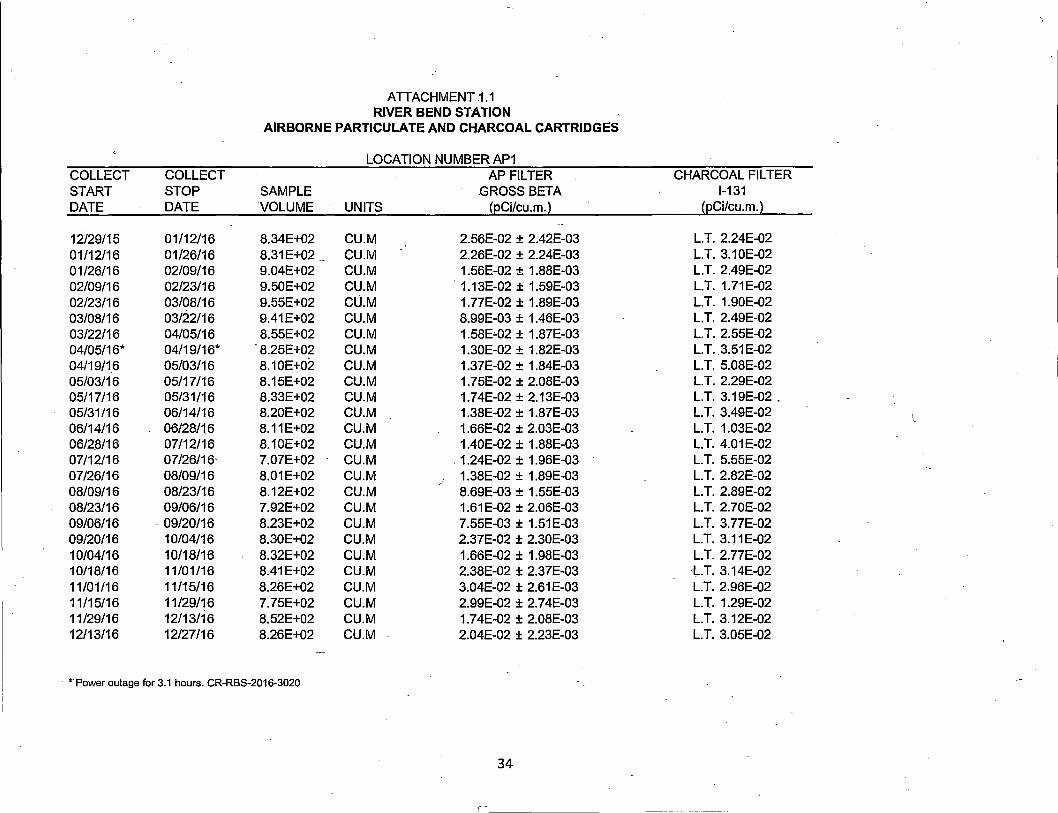
LOCATION NUMBER AP1 COLLECT COLLECT AP FILTER CHARCOAL FILTER START STOP SAMPLE GROSS BETA 1-131 DATE DATE VOLUME UNITS (pCi/cu.m.) (pCi/cu.m.)
12/29/15 01/12/16 8.34E+02 CU.M 2.56E-02 ± 2.42E-03 L.T. 2.24E-02 01/12/16 01/26/16 8.31E+02 CU.M 2.26E-02 ± 2.24E-03 L.T. 3.10E-02 01/26/16 02/09/16 9.04E+02 CU.M 1.56E-02 ± 1.88E-03 L.T. 2.49E-02 02/09/16 02/23/16 9.50E+02 CU.M 1.13E-02 ± 1.59E-03 L.T. 1.71E-02 02/23/16 03/08/16 9.55E+02 CU.M 1. 77E-02 ± 1.89E-03 L.T. 1.90E-02 03/08/16 03/22/16 9.41E+02 CU.M 8.99E-03 ± 1.46E-03 L.T. 2.49E-02 03/22/16 04/05/16 8.55E+02 CU.M 1.58E~02 ± 1.87E-03 L.T. 2.55E-02 04/05/16* 04/19/16* . 8.25E+02 CU.M 1.30E-02 ± 1.82E-03 L.T. 3.51E-02 04/19/16 05/03/16 8.10E+02 CU.M 1.37E-02 ± 1.84E-03 L.T. 5.08E-02 05/03/16 05/17/16 8.15E+02 CU.M 1.75E-02 ± 2.08E-03 L.T. 2.29E-02 05/17/16 05/31/16 8.33E+02 CU.M 1. 7 4E-02 ± 2.13E-03 L.T. 3.19E-02. 05/31/16 06/14/16 8.20E+02 CU.M 1.38E-02 ± 1.87E-03 L.T. 3.49E-02 06/14/16 06/28/16 8.11E+02 CU.M 1.66E-02 ± 2.03E-03 L.T. 1.03E-02 06/28/16 07/12/16 8.10E+02 CU.M 1.40E-02 ± 1.88E-0.3 L.T. 4.01E-02 07/12/16 07/26/16' 7.07E+02 CU.M _ 1.24E-02 ± 1.96E-03 L.T. 5.55E-02 07/26/16 08/09/16 8.01E+02 CU.M 1.38E-02 ± 1.89E-03 L.T. 2.82E-02 08/09/16 08/23/16 8.12E+02 CU.M 8.69E-03 ± 1.55E-03 L.T. 2.89E-02 08/23/16 _09/06/16 7.92E+02 CU.M 1.61E-02 ± 2.06E-03 L.T. 2.70E-02 09/06/16 - 09/20/16 8.23E+02 CU.M 7.55E-03 ± 1.51E-03 L.T. 3.77E-02 09/20/16 10/04/16 8.30E+02 CU.M 2.37E-02 ± 2.30E-03 L.T. 3.11E-02 10/04/16 '10/18/16 8.32E+02 CU.M 1.66E-02 ± .1.98E-03 L.T. 2.77E-02 10/18/16 11/01/16 8.41E+02 CU.M 2.38E-02 ± 2.37E-03 LT. 3.14E-02 11/01/16 11/15/16 8.26E+02 CU.M 3.04E-02 ± 2.61E-03 L.T. 2.96E-02 11/15/16 11/29/16 7.75E+02 CU.M 2.99E-02 ± 2. 7 4E-03 L.T. 1.29E-02 11/29/16 12/13/16 8.52E+02 CU.M 1.74E-02 ± 2.08E-03 L.T. 3.12E-02 12/13/16 12/27/16 8.26E+02 CU.M 2.04E-02 ± 2.23E-03 L.T. 3.05E-02
- •-Power outage for 3.1 hours. CR-RBS-2016-3020
34
ATTACHMENT 1.1 RIVER BEND STATION
AIRBORNE PARTICULATE AND CHARCOAL CARTRIDGES
LOCATION NUMBER AQS2 COLLECT COLLECT AP FILTER CHARCOAL FILTER START STOP SAMPLE GROSS BETA 1-131 DATE DATE VOLUME UNITS (pCi/cu.m.) (pCi/cu.m.)
12/29/15 01/12/16 8.12E+02 CU.M 2.86E-02 ± 2.58E-03 L.T. 2.30E-02 01/12/16 01/2611'6 7.88E+02 CU.M 2.55E-02 ± 2.44E-03 L.T. 3.27E-02 01/26/16 02/09/16 8.10E+02 CU.M 1.96E-02 ± 2.20E-03 L.T. 2.77E-02 02/09/16 02/23/16 8.15E+02 CU.M 1.44E-02 ± 1.92E-03 L.T. 7.73E-03 02/23/16 03/08/16 8.30E+02 CU.M 9.20E-03 ± 1.56E-03 L. T. 2.19E-02 03/08/16 03/22/16 8.16E+02 CU.M 1.12E-02 ± 1. 73E-03 L.T. 2.87E-02 03/22/16 04/05/16 8.25E+02 CU.M 1.61 E-02 ± 1.93E-03 L.T. 2.64E-02 04/05/16 04/19/16 8.14E+02 CU.M 1.49E-02 ± 1.93E-03 L.T. 3.55E-02 04/19/16 05/03/16 7.87E+02 Cl,J.M 1.44E-02 ± 1.91E-03 L.T. 5.22E-02 05/03/16 05/17/16 7.75E+02 CU.M 2.1 OE-02 ± · 2.32E-03 L.T. 2.40E-02 05/17/16 05/31/16 7.64E+02 CU.M 2.14E-02 ± 2.43E-03 L.T. 3.47E-02 05/31/16 06/14/16 7.57E+02 CU.M 1.31E-02 ± 1.92E-O_~ L.T. 3.78E-02 06/14/16 06/28/16 7.79E+02 CU.M 1.88E-02 ± 2.18E-03 L.T. 3.02E-02 06/28/16 07/12/16 7.87E+02 CU.M 1.75E-02 ± 2.10E-03 L.T. 4.12E-02 07/12/16 07/26/16 8.19E+02 CU.M 1.14E-02 ± 1. 73E-03 L.T. 2.01E-02 07/26/16 08/09/16 7.72E+02 CU.M 1.35E-02 ± 1.92E-03 L.T. 2.93E-02 08/09/16 08/23/16 . 7.84E+02 CU.M 1.05E-02 ± 1. 70E-03 L.T. 2.98E-02 08/23/16 . 09/06/16 7.85E+02 CU.M 1.56E-02 ± 2.04E-03 L.T. 2.71E-02 09/06/16 09/20/16 7.96E+02 CU.M 7.69E-03 ± 1.55E-03 L.T. 3.88E-02 09/20/16 10/04/16 7.84E+02 CU.M 2.18E-02 ± 2.28E-03 L.T. 3.28E-02 10/04/16 10/18/16 8.11E+02 CU.M 1.69E-02 ± 2.02E-03 L.T. 2.99E-02 10/18/16 11/01/16 8.14E+02 CU.M 2.54E-02 ± 2.48E-03 L.T. 3.24E-02 11/01/16 11/15/16 8.17E+02 CU.M 2.84E-02 ± 2.55E-03 L.T. 2.99E-02 11/15/16 11/29/16 8.13E+02 CU.M 2.93E-02 ± 2.64E-03 L.T. 2.92E-02 11/29/16 12/13/16 8.40E+02 CU.M 2.00E-02 ± 2.22E-03 L.T. 1.33E-02 12/13/16 12/27/16 8.17E+02 CU.M 2.20E-02 ± 2,32E-03 L.T. 3.08E-02
35
A TI ACHMENT 2.1 RIVER BEND STATION
THERMOLUMINESCENT DOSIMETERS (TLD) mR/Qtr
Sample Location First Quarter Second Quarter Third Quarter Fourth Quarter Quarter Average Nuclide 01/01/16-03/31/16 04101 /16-06/30/16 07/01/16-09/30/16 10/01/16-01/01/16 -1 S.D.
TLD TA1 11.1 10.7 11.2 11.9 11.2 ± 0.5 TAC 15.1 16.0 16.1 16.5 15.9 ± 0.6 TB1 14.7 14.7 15.2 15.9 15.1 ± 0.6 TC1 15.7 15.6 15.5 16.5 15.8 ± 0.4 TCS 13.3 12.8 13.7 13.7 13.4 ± 0.4 TD1 14.7 15.3 15.6 .17.6 15.8 ± 1.2 TE1 14.7 13.6 14.5 15.0 14.5 ± 0.6 TEC 14.3 13.8 14.7 15.5 14.6 ± 0.7 TF1 14.1 14.1 14.8 15.1 14.5 ± 0.5 TG1 15.9 16.0 15.8 16.3 16.0 ± 0.2 TGS 15.2 15.6 15.5 16.2 15.6 ± 0.4 TH1 13.2 12.2 12.8 13.4 12.9 ± 0.6 TJ1 13.7 -· 13.7 14.3 13.5 13.8 ± 0.4 TK1 14.6 13.8 14.4 15.0 14.4 ± 0.5 TL1 14.8 14.1 15.4 15.9 15.0 ± 0.8 TM1 12.7 12.4 12.8 13.1 12.7 ± 0.3 TN1 15.0 14.0 15.1 15.2 14.8 ± 0.5 TNS 13.7 13.7 13.8 14.2 13.9 ± 0.3 TP1 13.4 12.9 13.5 13.6 13.3 ± 0.3 TQ1 10.9 10.3 11.0 11.4 10.9 ± 0.5 TR1 11.1 10.9 10.9 11.4 11.1 ± 0.2 TRS 15.0 15.b 14.7 14.9 14.9 ± 0.2 TQS1 15.6 15.4 16.0 16.3 15.8 ± 0.4 TQS2 12.8 12.8 13.0 13.6 13.0 ± 0.4
Average/Quarter 14.0 ± 1.4 13.7 ± 1.6 14.2 ± 1.6 14.7 ± 1.7 ,,.....
Range (10.9-15.9) {10.3-16) (10.9-16.1) {11.4-17.6) Detection/Total 24/24 24/24 24/24 24/24
36
ATTACHMENT 3.1 RIVER BEND STATION
SURFACE WATER pCi/L
STATION NUMBER SWD
DATE COLLECTED '03/01/16 06/08/16 09/07/16 10/31/16
RADIOCHEMICAL ANALYSIS:
H-3 LT. 3.27E+02 LT. 5.12E+02 LT. 6.19E+02 LT. 6.27E+02
GAMMA SPECTRUM ANALYSIS:
MN-54 LT. 3.70E+OO LT. 4.81E+OO LT. 2.14E+OO LT. 2.03E+OO C0-58 LT. 4.64E+OO LT. 5.64E+OO LT. 2.25E+OO LT. 2.35E+OO FE-59 LT. 7.44E+OO LT. 1.24E+01 LT. 4.94E+OO LT. 4.56E+OO C0-60 LT. 4.44E+QO, _ LT. 5.16E+OO LT. 2.03E+OO LT. 2.09E+OO ZN-65 LT. 8.41 E+OO LT. 9.91E+OO LT. 4.51 E+OO LT. 4.61 E+OO NB-95 LT. 427E+OO LT. 5.81E+OO LT. 2.27E+OO LT. 2.64E+OO ZR-95 LT. 7.31 E+OO LT. 7.95E+OO LT. 4.03E+OO LT. 4.19E+OO 1-131 LT. 1.11E+01 LT. 1.47E+01 LT. 7.80E+OO LT. 1.34E±01 CS-134 LT. 3.72E+OO LT. 4.88E+OO LT. 2.01E+OO LT. 1.93E+OO CS-137 LT. 4.31E+OO LT. 5.70E+OO -LT. 2.32E+OO LT. 2.15E+OO BA-140 LT. 2.66E+01 LT. 3.50E+01 LT. 1.70E+01 LT. 2.24E+01 LA-140 LT. 7.81 E+OO LT. 1.09E+01 LT. 5.83E+OO LT. 7.25E+OO
(_
37
DATE COLLECTED
RADIOCHEMICAL ANALYSIS:
H-3
GAMMA SPECTRUM ANALYSIS:
MN-54 C0-58 FE-59 C0-60 ZN-65 NB-95 ZR-95 1-131 CS-134 CS-137 BA-140 LA-140
ATTACHMENT 3.1 RIVER BEND STATION
SURFACE WATER pCi/L
STATION NUMBER SWD DUP
03/01/16
LT. 3.34E+02
LT. 3.55E+OO LT. 4.27E+OO LT. 7.62E+OO LT. 3.60E+OO LT. 7.66E+OO LT. 4.29E+OO LT. 6.52E+OO LT. 1.07E+01 LT. 3.85E+OO LT. 4.29E+OO LT. 2.85E+01 LT. 6.94E+OO
38
ATTACHMENT 3.1 RIVER BEND STATION
SURFACE WATER pCi/L
STATION NUMBER SWU
DATE COLLECTED 03/01/16 06/08/16 09/07/16 10/31/16
RADIOCHEMICAL ANALYSIS:
H-3 LT. 3.29E+02 LT. 5.21 E+02 UT. 6.13E+02 LT. 6.00E+02
GAMMA SPECTRUM ANALYSIS:
MN-54 LT. 4.28E+OO LT. 5.24E+OO LT. 1.75E+OO LT. 2.06E+OO C0-58 LT. 3.81E+OO LT. 5.20E+OO LT. 1.98E+OO LT. 2.30E+OO FE-59 LT. 1.07E+01 LT. 1.28E+01 LT. 4.49E+OO LT. 4.80E+OO C0-60 LT. 5.00E+OO LT. 7.00E+OO LT. 1.99E+OO LT. 2.18E+OO ZN-65 LT. 8.37E+OO . LT. 9.44E+OO LT. 3.63E+OO LT. 3.77E+OO NB-95 LT. 4.12E+OO LT. 5.51 E+OO LT. 1.99E+OO LT. 2.69E+OO ZR-95 LT. 7.83E+OO LT. 9.30E+OO LT. 3.48E+OO LT. 4.06E+OO 1-131 LT. 1.08E+01 LT. 1.43E+01 LT. 7.50E+OO LT. 1.33E+01 CS-134 LT. 3.86E+OO LT .. 4.38E+OO LT. 1.76E+OO LT. 2.02E+OO CS-137 LT. 4.56E+OO LT. 5.54E+OO LT. 2.00E+OO LT. 2.17E+OO BA-140 LT. 2.43E+01 LT. 3.46E+01 LT. 1.44E+01 LT. 2.21E+01 LA-140 LT. 7.13E+OO LT. 1.20E+01 LT. 4.40E+OO LT. 7.53E+OO
39
DATE COLLECTED
RADIOCHEMICAL ANALYSIS:
H-3
GAMMA SPECTRUM ANALYSIS:
MN-54 C0-58 FE-59 C0-60 ZN-65 NB-95 ZR-95 1-131 CS-134 CS-137 BA-140 LA-140
ATTACHMENT 3.1 RIVER BEND STATION
SURFACE WATER pCi/L
STATION NUMBER SWU DUP
03/01/16
LT. 3.29E+02
LT. 3.74E+OO LT. 4.08E+OO LT. 1.03E+01 LT. 4.26E+OO LT. 8.12E+OO LT. 4.92E+OO LT. 9.50E+OO LT. 1.32E+01 LT. 4.16E+OO LT. 4.39E+OO LT. 3.12E+01 LT. 1.05E+01
40
ATTACHMENT 4.1 RIVER BEND STATION
GROUNDWATER pCi/L
LOCATION GWD LOCATION GWU
DATE COLLECTED 06/07/16 10/26/16 06/07/16 10/26/16
RADIOCHEMICAL ANALYSIS:
H-3 LT. 5.21 E+02 LT. 6.14E+02 LT. 5.23E+02 LT. 6.12E+02
GAMMA SPECTRUM ANALYSIS:
MN-54 '-LT. 3.90E+OO LT. 1.58E+OO LT. 3.48E+OO LT. 1.66E+OO
C0-58 LT. 4.53E+OO LT. 1.68E+OO LT. 4.02E+OO LT. 1.84E+OO FE-59 c·
LT. 1.02E+01 LT. 4.02E+OO LT. 9.89E+OO LT. 4.38E+OO C0-60 LT. 4.48E+OO LT. 1.61 E+OO LT. 3.82E+OO LT. 1.53E+OO ZN-65 LT. 8.73E+OO LT. 3.06E+OO LT. 9.36E+OO LT. 3.05E+OO NB-95 LT. 5. 72E+OO LT. 1.88E+OO LT. 5.09E+OO .l.T. 2.17E+OO ZR-95 LT. 8.30E+OO LT. 3.15E+OO LT. 8.44E+OO LT. 3.44E+OO 1-131 LT. 1.48E+01 LT. 1.50E+01 LT. 1.49E+01 LT. 1.45E+01 CS-134 LT. 4.39E+OO LT. 1.52E+OO LT. 3.86E+OO LT. 1.55E+OO CS-137 LT. 4.48E+OO . LT. 1.57E+OO LT. 4.77E+OO LT. 1.60E+OO BA-.140 LT. 3.35E+01 LT. 2.14E+01 LT. 3.08E+01 LT. 2.07E+01 LA-140 LT. 1.10E+01 LT. 6.66E+OO LT. 5.55E+OO LT. 6.44E+OO
41
DATE COLLECTED
GAMMA SPECTRUM ANALYSIS:
MN-54 C0-58 FE-59 C0-60 ZN-65 NB-95 ZR-95 1-131 CS-134 CS-137 BA-140 LA-140
ATTACHMENT 5.1 RIVER BEND STATION SHORELINE SEDIMENT
pCi/kg, dry
LOCATION SEDD
09/21/16
LT. 3.62E+01 LT. 4.81E+01 LT. 1.15E+02 LT. 5.03E+01 LT. 1.17E+02 LT. 5.11E+01 LT. 6.82E+01 LT. 1.01E+02 LT. 4.66E+01 LT. 4.61 E+01 LT. 2.43E+02 LT. 5.44E+01
42.
LOCATION SEDU
09/21/16
LT. 7.61E+01 LT. 6.42E+01 LT. 1.42E+02 LT. 6.07E+01 LT. 1.61E+02 LT. 8.39E+01 LT. 1.26E+02 LT. 1.49E+02 LT. 1.07E+02 LT. 8.28E+01 LT. 4.26E+02 LT. 9.61 E+01.
r ATTACHMENT 6.1
RIVER BEND STATION FOOD PRODUCTS
pCi/kg, wet
LOCATION GN1
DATE COLLECTED 03/14/16 06/06/16 09/13/16 12/12/16
GAMMA SPECTRUM ANALYSIS:
MN-54 · LT. 2.50E+01 LT. 1.30E+01 LT. 2.46E+01 LT. 3.20E+01 co~5a LT. 2.78E+01 LT. h34E+01 LT. 2.43E+01 LT. 3.97E+01 FE-59 LT. 5.81 E+01 LT. 2.34E+01 LT. 4.83E+01 LT. 7.56E+01 C0-60 LT. 2.89E+01 LT. 1.46E+01 . LT. 2.22E+01 LT. 3.81E+01 ZN-65 LT. 6.01E+01 LT. 2.43E+01 LT. 5.42E+01 LT. 6.72E+01 NB-95 LT. 3.06E+01 LT. 1.34E+01 LT. 3.22E+01 LT. 3.93E+01 ZR-95 LT. 4.44E+01 LT. 2.31E+01 LT. 4.10E+01 LT. 6.47E+01 1-131 LT. 4.20E+01 LT. 2.52E+01 LT. 4.73E+01 LT. 5.14E+01 CS-134 LT. 2.46E+01 LT. 1.39E+01 LT. 2.70E+01 LT. 3.59E+01 CS-137 LT. 2.63E+01 LT. 1.49E+01 LT. 2.49E+01 LT. 3.76E+01 BA-140 LT. 1.13E+02 LT. 6.63E+01 LT. 1.09E+02 LT. 1.54E+02 LA-140 LT. 3.51E+01 LT. 1.61 E+01 LT. 4.11E+01 LT. 3.80E+01
43

ATTACHMENT 6.1 RIVER BEND STATION
FOOD PRODUCTS pCi/kg, wet
LOCATION GQ1
DATE COLLECTED 03/14/16 06/07/16 09/13/16 12/08/16
GAMMA SPECTRUM ANALYSIS:
MN-54 LT. 3.15E+0"1 LT. 1.79E+01 LT. 2.96E+01 LT. 3.14E+01 C0-58 LT. 3.13E+01 LT. 1.54E+01 LT. 2.76E+01 LT. 2.57E+01 FE-59 LT. 5.94E+01 LT. 3.26E+01 LT. 6.39E+01 LT. 6.87E+01 C0-60 LT. 3.41E+01 LT. 1.58E+01 LT. 1.86E+01 LT. 2.81E+01 ZN-65 LT. 7.10E+01 LT. 3.84E+01 LT. 6.32E+01 LT. 6.17E+01 '-NB-95 LT. 3.69E+01 LT. 1.70E+01 LT. 3.44E+01 LT. 3.07E+01 ZR-95 LT. 6.12E+01 LT. 2.74E+01 LT. 4.23E+01 LT. 5.54E+01 1-131 LT. 4.59E+01 LT. 2.98E+01 LT. 5.76E+01 LT. 5.23E+01 CS-134 LT. 2.82E+01 LT. 1.81 E+01 LT. 3.00E+01 LT. 2.72E+01 CS-137 LT. 3.06E+01 LT. 1.74E+01 LT. 2.67E+01 LT. 3.06E+01 BA-140 LT. 1.04E+02 LT. 7.91 E+01 LT. 1.12E+02 LT. 1.24E+02 LA-140 LT. 3.56E+01 LT. 2.17E+01 LT. 4.13E+01 LT. 5.11 E+01
44

DATE COLLECTED
GAMMA SPECTRUM ANALYSIS:
MN-54 C0-58 FE-59 C0-60 ZN-65 NB-95 ZR-95 1-:-.131 CS-134 CS-137 BA-140 LA-140
j __ _
r ATTACHMENT 6.1
03/01/16
LT. 5.82E+OO LT. 5.34E+OO LT. 9.48E+OO LT. 5.96E+OO LT. 1.50E+01 LT.-6.63E+OO LT. 7.63E+OO LT. 5.75E+OO LT. 5.19E+OO LT. 5.20E+OO LT. 2.21E+01 LT. 3.93E+OO
RIVER BEND STATION FOOD PRODUCTS
pCi/kg, wet
LOCATION GQC
06/07/16
LT. 1.44E+01 LT. 1.52E+01 LT. 3.54E+01 LT. 2.28E+01 LT. 4.291=+01 LT. 1.93E+01 LT. 2.71E+01 LT. 2.60E+01 LT. 1.41E+01 LT. 1.76E+01 LT. 7.58E+01 LT. 1.98E+01
45
09/15/16
LT:-2.1 OE+01 LT. 2.34E+01 LT. 4.06E+01 LT. 2.61 E+01 LT. 4.70E+01 LT. 3.14E+01 LT. 3.82E+01 LT. 4.36E+01 LT. 1.72E+01 LT. 2.47E+01 LT. 1.26E+02 LT. 1.24E+01
12/08/16
LT. 1.47E+01 LT. 1.62E+01 LT. 2.75E+01 LT. 1.94E+01 LT. 3.00E+01 LT. 1.78E+01 . LT. 3.49E+01 LT. 2.74E+01 LT. 1.21 E+01 LT. 1.65E+01 LT. 7.15E+01 LT. 1.63E+01
DATE COLLECTED
GAMMA SPECTRUM ANALYSIS:
MN-54 C0-58 FE-59 C0-60 ZN-65 NB-95 ZR-95 1-131 CS-134 CS-137 BA-140 LA-140
LOCATION FD
08/09/16
LT. 4.95E+01 LT. 6.05E+01 LT. 1.60E+02 LT. 4.98E+01 LT. 9.82E+01 LT. 6.22E+01
·LT. 1.10E+02 LT. 3.65E+02 LT. 6.71E+01 LT. 4.90E+01 LT. 6.09E+02 L. T. 1.24E+02
ATTAGHMENT 7.1 RIVER BEND STATION
FISH pCi/kg, wet
LOCATION FU
46
08/09/16
LT. 5.86E+01 LT. 5.79E+01 LT. 1.46E+02 LT. 5.48E+01 LT. 1.28E+02 LT. 6.94E+01 LT. 1.16E+02 LT. 4.00E+02 LT. -1.10E+01 LT. 5.13E+01 LT. 6.72E+02 LT. 2.23E+02
Attachment 8
Teledyne Brown Engineering's Interlaboratory Comparison Program Tables
47
ANALYTICS ENVIRONMENTAL RADIOACTIVITY CROSS CHECK PROGRAM TELEDYNE BROWN ENGINEERING ENVIRONMENTAL SERVICES
(PAGE 1 OF3)
Identification Reported Known Ratio (c)
Month/Year Number Matrix Nuclide Units Value (a) Value (b) TSE/Analytics
March 2016 E11476 Milk Sr-89 pCi/L 97 86.7. Sr-90 pCi/L · 15 11.4
E11477 Milk 1-131 pCi/L 85.9 82.2 Ce-141 pCi/L 106 98.4 Cr-51 .PCi/L 255 243 Cs-134 pCi/L 134 130 Cs-137 pCi/L 174 161 Co-58 pCi/L 123 117 Mn-54 pCi/L 141 117 Fe-59 pCi/L 152 131 Zn-65 pCi/L 193 179 Co-60 pCi/L 259 244
E11479 AP Ce-141 pCi 69 81.1 Cr-51 pCi 242 201 Cs-134 pCi 98.1 107.0 Cs-137 pCi 136 133 Co-58 pCi 91.9 97 Mn-54 pCi 98.6 96.2 Fe-59 pCi 98.8 108 Zn-65 pCi 131 147 Co-60 pCi 209 201
E11478 Charcoal 1-131 pCi 85.3 88.3
E11480 Water Fe-55 pCi/L 1800 1666
June 2016 E11537 Milk Sr-89 pCi/L 94.4 94.4 Sr-90 pCi/L 13.4 15.4
E11538 Milk 1-131 pCi/L. 96.8 94.5 Ce-141 pCi/L 129 139 Cr-51 pCi/L 240 276 Cs-134 pCi/L 1.57 174-Cs-137 pCi/L 117 120 Co-58 pCi/L 131 142 Mn-54 pCi/L 128 ·125 Fe-59 pCi/L 132 122 Zn-65 pCi/L 235 235 Co-60 pCi/L 169 173
(a) Teledyne Brown Engineering reported result.
(b) The Analytics known value is equal to 100% of the parameter present in the standard as determined by gravimetric and/or
volumetric measurements made during standard preparation.
(c) Ratio of Teledyne Brown Engineering to Analytics results.
(d} Analytics evaluation based oil TBE internal QC limits: A= Acceptable, reported result falls within ratio limits of0.80-1.20.
W-Acceptai)Je with warning, reported result falls within 0. 70-0.80 or 1.20-1.30. N =Not Acceptable, reported
result falls outside the ratio limits of< 0. 70 and > 1.30.
(2) NCR 16-26 was initiated
48
1.12 1.32
1.05 1.08 1.05 1.03 1.08 1.05 1.21 1.16 1.08 1.06.
0.85 1.20 0.92 1.02 0.95 1.02 0.91 0.89 1.04
0.97
1.08
1.00 0.87
1.02 0.93 0.87 0.90 0.98 0.92 1.02 1.08 1.00 0.98
Evaluation (d}
A. N(2)
A A A A A A w A A A
A w A A A A A A A
A
A
A A
A A A A A A A A A A
)
ANALYTICS ENVIRONMENTAL RADIOACTIVITY CROSS CHECK PROGRAM TELEDYNE BROWN/ENGINEERING ENVIRONMENTAL SERVICES
(PAGE20F3)
Identification Reported Known Ratio (c)
Month/Year Number Matrix Nuclide Units Value(a) Value(b) TBE/Analxtics
June 2016 E11539 Charcoal 1-131 pCi 86.1 89.4
E11540 AP Ce-141 pCi 105 99.8 Cr-51 pCi 216 198.0 Cs-134 pCi 113 125 Cs-137 pCi 94.5 86.6 Co-58 pCi 101 102 Mn-54 pCi 88.8 90.2 Fe-59 pCi 82 87.5 Zn-65 pCi 174 169 Co-60 pCi 143 124
E11541 Water Fe-55 pCi/L 164 186
. September 2016 E11609 Milk Sr-89 pCi/L .J 90 90.9 Sr-90 pCi/L 13.3 13.7
E11610 Milk 1-131 pCi/L 80.4 71.9 Ce-141 pCi/L 81.3 93 Cr-51 pCi/L 198 236 Cs-134 pCi/L 122 136 Cs-137 , pCi/L 119 119 Co-58 pCi/L 92.2 97.4 Mn-54 pCi/L 156 152 Fe-59 pCi/L 97.5 90.6 Zn-65 pCi/L 189 179 Co-60 pCi/L 131 135
E11611 Charcoal 1-131 pCi 52.4 59.9
E11612 AP Ce-141 pCi 67.5 '63.6 Cr-51 pCi 192 161.0 Cs~134 pCi 91.4 92.6 Cs-137 pCi 93.9 80.8 Co-58 pCi 66 66.4 Mn-54 pCi 104 104 Fe-59 pCi 60.5 61.8 . Zn-65 pCi 140 122 Co-60 pCi 119 91.9
(a) Teledyne Brown Engineering reported result.
(bJ. The Analytics known value is equal to 100% of the parameter present in the standard as detf!rmined by gravimetric and/or
volumetric measurements made during standard preparation . .
(c) Ratio of Teledyne Brown Engineering to Analytics results.
{d) Analytics evaluation based on TBE internal QC limits: A= Acpeptable, reported result falls within ratio limits of 0.80-1.20.
W-Acceptable with warning, reported result falls within 0. 70-0.80or1.20-1.30. N =Not Acceptable, reported
result falls outside the ratio limits of< 0. 70 and > 1:30.
49
0.96
1.05 1.09 0.90 1.09 0.99 0.98 0.94 1.03 1.15
0.88
0.99 0.97
1.12 0.87 0.84 0.90 1.00 0.95 1.03 1.08 1.06 0.97
0.87
1.06 1.19 0.99 1.16 0.99 1.00 0.98 1.15 1.29
Evaluation (d)
-----A
A A A A A A A A A
A
A A
A A A A A A A A
.A
A
A
A A A A A A A A w
ANALYTICS ENVIRONMENTAL RADIOACTIVITY CROSS CHECK PROGRAM TELEDYNE BROWN ENGINEERING ENVIRONMENTAL SERVICES
(PAGE 30F 3)
Identification Reported Known Ratio (c) Month/Year Number Matrix Nuclide Units Value(a) Value (b) TSE/Analytics
September 2016 E11613 Water Fe-55 pCi/L 1990 1670
E11614 Soil Ce-141 .pCi/g 0.153 0.175 Cr-51 pCi/g 0.482 0.441 Cs-134 pCi/g 0.270 0.254 Cs-137 pCi/g 0.313 o.299 Co-58 pCi/g 0.177 0.182 Mn-54 pCi/g 0.340 0.285 Fe-59 pCi/g 0.206 0.17 Zn-65 pCi/g 0.388 0.335
. Co-60 pCi/g 0.284 0.252
December 2016 E11699 Milk Sr-89 pCi/L 95 74.2 Sr-90 pCi/L 14.7 10
E11700 Milk 1-131 pCi/L 97.5 97.4 Ce-141 pCi/L · 136 143 Cr-51 pCi/L 247 280 Cs-134 pCi/L 164 178 Cs-137 pCi/L 120 126 Co-58 pCi/L 139 146 Mn-54 pCi/L 126 129 Fe-59 pCi/L 114 125 Zn-65 pCi/L 237 244 Co-60 pCi/L 168 178
I E11701 Charcoal 1-131 pCi 95.6 98 . E11702 AP Ce-141 pCi 91.7 97.7
Cr-51 pCi 210 192.0 Cs-134 pCi 122 1~2 Cs-137 pCi 93.9 86.4 Co-58 pCi 92 100 Mn-54 pCi 93.7 88.5 Fe-59 pCi 84.9 85.4
· Zn-65. pCi 176 167 Co-60 pCi 151 122
E11730 AP Sr-89 pCi 79.7 92 Sr-90 pCi 10 12.5
E11703 Water Fe-55 pCi/L 2180 1800
(a) Teledyne Brown Engineering reported result.
(b) The Analytics known value is equal to 100% of the parameter present in the standard as determined by gravimetric and/or
volumetric measurements made (luring standard preparation.
(c) Ratio of Teledyne Brown Engineering to Analytics results.
(d) Analytics evaluation based on TBE internal QC limits: A= Acceptable, reported result falls within ratio limits of 0. 80-1.20.
W-Acceptab/e with warning, reported result falls within 0. 70-0.80 or 1.20-1.30. N =Not Acceptable, reported
result falls outside the ratio limits of< 0. 70 and > 1.30.
(3) NCR 16-35 was initiated 50
1.19
0.87 1.09 1.06 1.05 0.97 1.19 1.21 1.16 1.13
1.28 1.47
1.00 0.95. 0.88 0.92 0.95 0.95 0.98 0.91 0.97 Q.94
0.98
0.94 1.09 1.00 1.09 0.92 1.06 0.99 1,05 1.24
0.87 0.80
1.21
Evaluation (d)
A
A A A A A A w A A
w N(3)
A A A A A A A A A A
A
A A A A A A A A w
A A
w
DOE's MIXED ANALYTE PERFORMANCE EVALUATION PROGRAM (MAPEP) TELEDYNE BROWN ENGINEERING ENVIRONMENTAL SERVICES
(PAGE 1OF1)
Identification Reported Known Aqceptance Month/Year Number Media Nuclide Units Value (a} Value (b) Ran~e
March 2016 16-MaW34 Water Am-241 SqiL 0.008 (1)
Ni-63 Sq/L 12.4 12.3 8.6-16.0 Pu-238 Sq/L 1.4900 1.2440 0.871-1.617 Pu-239/240 Sq/L 0.729 0.641 0.449-0.833
16-MaS34 Soil Ni-63 Sq/kg 1140 1250.0 875-1625 Sr-90 Sq/kg 8.15 (1)
16-RdF34 AP U-234i233 Sq/sample 0.1620 0.1650 0.116-0.215 U-238 Sq/sample· 0.163 0.172 0.120-0.224
16-GrF34 AP Gr-A Sq/sample 0.608 1.20 0.36-2.04 Gr-S Sq/sample 0.8060 0.79 0.40-1.19
16-RdV34 Vegetation Cs-134 Sq/sample 10.10 10.62 7.43-13.81 Cs-137 Sq/sample 6.0 5.62 3.93-7.31 Co-57 Sq/sample 13.3000 11.8 8.3-15.3 Co-60 Sq/sample 0.013 (1)
Mn-54 Sq/sample 0.0150 (1)
Sr-90 Sq/sample 0.301 (1)
Zn-65 Sq/sample 10.500 9.6 6.7-12.5
September 2016 16-MaW35 Water Am-241 Sq/L 0.626 0.814 .570-1058 Ni-63 Sq/L 12.4, 17.2 12.0-22.4 Pu-238 Sq/L 1.23 1.13 0.79-1.47 Pu-239/240 Sq/L 0.0318 0.013 (1)
16-MaS35 Soil Ni-63 Sq/kg 724 990 693-1287 Sr-90 Sq/kg 747 894 626-1162
16-RdF35 AP U-234/233 Sq/sample 0.160 0.15 0.105-0.195 U-238 Sq/sample 0.157 0.156 0.109-0.203
16-RdV35 Vegetation Cs-134 · Sq/sample -0.103 (1)
Cs-137 Sq/sample 5.64 5.54 3.88-7.20 Co-57 Sq/sample 7.38 6.81 4.77-8.85 Co-60 Sq/sample 4.81 4.86 3.40-6.32 Mn-54 Sq/sample 7.4 7.27 5.09-9.45 Sr-90 Sq/sample 0.774 0.80 0.56-1.04 Zn-65 Sq/sample 5.46 5.4 3.78-7.02
(1) False positive test. .
(a) Teledyne Brown Engineering reported result.
(b) The MAPEP known value is equal to 100% of the parameter present in the standard as determined by gravimetric and/or
volumetric measurements made during standard preparation.
(c) DOEIMAPEP evaluation: A=acceptable, W=acceptable with warning, N=not acceptable.
(4) NCR 16-14 was initiated
51
Evaluation (c)
A ·A A A
A A
A A
A A
A A A A A
N(4) A
w A w A
A A
A A
A A A A A A A
v
'-,
ERA ENVIRONMENTAL RADIOACTIVITY CROSS CHECK PROGRAM TELEDYNE BROWN ENGINEERING ENVIRONMENTAL SERVICES
(PAGE 1OF1)
Identification Reported Known Acceptance Month/Year Number Media Nuclide Units Value (a) Value (b) Limits
May 2016 RAD-105 Water Sr-89 pCi/L 48.9 48.2 37.8- 55.6 Sr-90 pCi/L 25.0 28.5 20.7 - 33.1 8a-133 pCi/L 53.1 58.8 48.7- 64.9 Cs-134 pCi/L 40.9 43.3 34.6-47.6 Cs-137 pCi/L 84.8 78.4 70.6- 88.9 Co-60 pCi/L 108 102 91.8~ 114 Zn-65 pCi/L 226 214 193 - 251 Gr-A pCi/L 38.9 62.7 32.9- 77.8 Gr-8 pCi/L 41.9 39.2 26.0-46.7 1-131 pCi/L 24.1 ~6.6 22.1 - 31.3 U-Nat pCi/L 4.68 4.64 3.39-5.68 H-3 pCi/L 7720 7840 6790-8620
November 2016 RAD-107 Water Sr-89. pCi/L 43.0 43.3 33.4-50.5 Sr-90 pCi/L 30.0 33.6 24.6-38.8 8a-133 pCi/L 47.8 54.9 45.4-60.7 Cs-134 pCi/L 72.9 81.8 67.0-90.0 Cs-137 pCi/L 189 2.10 189-233 Co-60 pCi/L 58.4 64.5 58.0-73.4 Zn-65 pCi/L 243 245 220-287 Gr-A pCi/L 37.2 68.4 35.9-84.5 Gr-8 pCi/L 35.1 33.9 22.1-41.6 1-131 pCi/L 23.5 26.3. 21.9-31.0 U-Nat pCi/L 49.2 51.2 41.6-56.9 H-3 pCi/L 918 9820 8540-10800
MRAD-25 AP Gr-A pCi/Filter 56.8 71.2 23.9-111
(a) Teledyne Brown Engineering reported result.
(b) The ERA known value is equal to 100% of the parameter present in the standard as determined by gravimetric and/or volumetric
measurements made during standard preparation. i (c) ERA evaluation: A=acceptable. Reported result falls within the Warning Limits. N=not acceptable. Reported result falls outside
of the Control Limits. CE=check for Error. Reported result falls within the Control Limits and outside of the Warning Limit.
(5) NCR 16-34 was initiated
52
Evaluation (c)
A A A A A A A A A A A A
A A A A A A A A A A A
N(5)
A'