Embed Size (px)
Citation preview
University of Massachusetts AmherstScholarWorks@UMass Amherst
Water Reports Water Resources and Extension
2017
River and Stream Power Assessment ReportIncluding Culvert and Bridge VulnerabilityAnalysis: Deerfield River Basin, Massachusetts andVermontJames G. MacBroomMilone & MacBroom, Inc.
Roy SchiffMilone & MacBroom, Inc.
Jessica LouisosMilone & MacBroom, Inc.
Follow this and additional works at: https://scholarworks.umass.edu/water_reports
Part of the Civil Engineering Commons, Environmental Engineering Commons, EnvironmentalIndicators and Impact Assessment Commons, Geomorphology Commons, Hydraulic EngineeringCommons, Hydrology Commons, Natural Resources Management and Policy Commons, and theTransportation Engineering Commons
This Article is brought to you for free and open access by the Water Resources and Extension at ScholarWorks@UMass Amherst. It has been acceptedfor inclusion in Water Reports by an authorized administrator of ScholarWorks@UMass Amherst. For more information, please [email protected].
MacBroom, James G.; Schiff, Roy; and Louisos, Jessica, "River and Stream Power Assessment Report Including Culvert and BridgeVulnerability Analysis: Deerfield River Basin, Massachusetts and Vermont" (2017). Water Reports. 4.Retrieved from https://scholarworks.umass.edu/water_reports/4
Copyright 2017 Milone & MacBroom, Inc.
RIVER AND STREAM POWER ASSESSMENT REPORT INCLUDING CULVERT AND BRIDGE
VULNERABILITY ANALYSIS
DEERFIELD RIVER BASIN MASSACHUSETTS AND VERMONT
HUC 01080203
December 30, 2014 (Revised April 4, 2017)
MMI #4297-03
Prepared for:
University of Massachusetts Amherst, Massachusetts
and Massachusetts Department of Transportation
Prepared by:
MILONE & MACBROOM, INC. 99 Realty Drive
Cheshire, Connecticut 06410 (203) 271-1773
www.miloneandmacbroom.com
RIVER AND STREAM POWER ASSESSMENT REPORT DEERFIELD RIVER BASIN – MASSACHUSETTS AND VERMONT DECEMBER 2014 (REVISED APRIL 4, 2017) TC-i
TABLE OF CONTENTS Page Preface 1.0 River Assessment .................................................................................................................. 1 1.1 Introduction ................................................................................................................... 1 1.2 River Assessment Methodology .................................................................................... 1 1.3 Fluvial Assessments ...................................................................................................... 2 1.4 Equilibrium and Adjustments ........................................................................................ 3 2.0 Deerfield Watershed .............................................................................................................. 5 2.1 Bedrock Geology ......................................................................................................... 8 2.2 Surficial Geology ........................................................................................................ 8 2.3 Deerfield River ............................................................................................................ 9 2.4 Flood Insurance Studies ............................................................................................. 16 3.0 Hydrology ............................................................................................................................ 17 3.1 Introduction ............................................................................................................... 17 3.2 Long-Term USGS Gauging Stations ......................................................................... 18 3.3 Channel Forming Discharges .................................................................................... 19 3.4 Flood Frequency Analysis ......................................................................................... 20 3.5 Hurricane Irene .......................................................................................................... 21 3.6 FEMA Hydrology ...................................................................................................... 22 3.7 Annual Peak Flood Flow Trends ................................................................................ 23 3.8 Sediment Yield ........................................................................................................... 24 4.0 Fluvial Assessment .............................................................................................................. 25 4.1 Channel Classification ................................................................................................ 25 4.2 Channel Slope ............................................................................................................. 26 4.3 Channel Alignment and Pattern .................................................................................. 27 4.4 Bankfull Width Channel Dimensions ......................................................................... 30 4.5 Stream Power .............................................................................................................. 32 4.6 Geomorphic Changes ................................................................................................. 42 4.7 Geomorphic Assessment Conclusion ......................................................................... 43 5.0 Floodplains .......................................................................................................................... 45 5.1 Introduction ................................................................................................................. 45 5.2 Flood Inundation Mapping .......................................................................................... 47 5.3 High Water Marks and Historic Floods ...................................................................... 49 5.4 National Flood Insurance Program Floodplain Maps ................................................. 49 5.5 Surficial Geology Maps .............................................................................................. 50 5.6 Soil Survey Data for Floodplain Mapping ................................................................. 52
RIVER AND STREAM POWER ASSESSMENT REPORT DEERFIELD RIVER BASIN – MASSACHUSETTS AND VERMONT DECEMBER 2014 (REVISED APRIL 4, 2017) TC-ii
5.7 River Corridor Floodplain Mapping ........................................................................... 54 5.8 Floodplain Vegetation Mapping ................................................................................. 55 5.9 Floodplain Stream Power Classification .................................................................... 55 5.10 Floodplain Adjustments .............................................................................................. 59 5.11 Floodplain Summary .................................................................................................. 60 6.0 Management Issues ............................................................................................................... 62 6.1 Introduction ............................................................................................................... 62 6.2 Regulated Flows ........................................................................................................ 63 6.3 Bypass Segments ....................................................................................................... 63 6.4 Fish Passage ............................................................................................................... 63 6.5 Recreation .................................................................................................................. 64 6.6 Floodplain Mapping .................................................................................................. 65 6.7 Conclusion ................................................................................................................. 65 7.0 Culvert and Bridge Vulnerability Analysis .......................................................................... 66 7.1 Introduction ................................................................................................................ 66 7.2 Methods ...................................................................................................................... 66 7.3 Results ........................................................................................................................ 70 7.4 Discussion ................................................................................................................... 81 Appendix A - Geomorphic Segmentation and Descriptions ......................................................... 85 References ................................................................................................................................... 117
TABLES 2-1 Hydrologic Unit Codes (HUC) .............................................................................................. 7 3-1 Long-term Gauging Stations ................................................................................................ 18 3-2 Mean Monthly Flow ............................................................................................................. 18 3-3 Estimated Channel Forming Discharges Comparison ......................................................... 20 3-4 Peak Flood Flows ................................................................................................................. 21 3-5 Hurricane Irene Peak Flows ................................................................................................. 22 3-6 100-Year Flood Flows .......................................................................................................... 23 4-1 Segment Classification ......................................................................................................... 26 4-2 Mean Channel Slope Calculations (Alluvial Segments) ...................................................... 27 4-3 Deerfield River Bankfull Widths ......................................................................................... 31 4-4 Comparison of Bankfull Widths at USGS Gauges .............................................................. 32 4-5 Summary of Selected Geomorphic Activity as a Result of Hurricane Irene, August 2011 . 43 7-1 Vulnerability Analysis Project Team ................................................................................... 66 7-2 Structure Damage Codes ...................................................................................................... 67
RIVER AND STREAM POWER ASSESSMENT REPORT DEERFIELD RIVER BASIN – MASSACHUSETTS AND VERMONT DECEMBER 2014 (REVISED APRIL 4, 2017) TC-iii
FIGURES 1-1 Deerfield River Watershed Map* .......................................................................................... 6 2-1 Deerfield River Profile ......................................................................................................... 12 2-2 Major Dams and USGS Gauges* ......................................................................................... 13 5-1 Surficial Geology* ............................................................................................................... 46 7-1 Vulnerability Screen Variable Scoring ................................................................................ 69 7-2 Overall Vulnerability Screen Results ................................................................................... 70 7-3 Specific Stream Power vs. Resistance Results ..................................................................... 71 7-4 Structure Width Results ....................................................................................................... 71 7-5 Change in Slope Results ....................................................................................................... 71 7-6 Sediment Continuity Results ................................................................................................ 71 7-7 Structure Alignment Results ................................................................................................ 71 7-8 Specific Stream Power Comparison ..................................................................................... 72 7-9 Number of Damaged Structures by Specific Stream Power ................................................ 73 7-10 Percentage of Damaged Structures by Specific Stream Power ........................................... 73 7-11 Percent of Damaged Structures by Dominant Bed Particle Size ........................................ 74 7-12 Specific Stream Power Full and Interquartile Range by Dominant Bed Particle Size ....... 74 7-13 Specific Stream Power vs. Dominant Bed Particle Size, Data Colored by Damage .......... 75 7-14 Specific Stream Power Full and Interquartile Range by Dominant Bed Particle Size, Damaged Structures Only ................................................................................................... 76 7-15 Number of Structures by Structure Width/Channel Bankfull Width .................................. 76 7-16 Percentage of Damaged Structures by Structure Width/Channel Bankfull Width ............. 77 7-17 Specific Stream Power vs. Damage Code, Data Colored by Structure Width/Channel Bankfull Width (%) ............................................................................................................. 77 7-18 Percent of Damaged Structures by Difference Between Local Channel Slope and Structure Slope .................................................................................................................... 78 7-19 Specific Stream Power vs. Damage Code, Data Colored by Structure Width/Channel Bankfull Width ................................................................................................................... 78 7-20 Percent of Damage Structures by Structure Alignment Relative to Channel ..................... 79 7-21 Specific Stream Power vs. Damage Code, Data Colored by Structure Alignment Relative to Channel ............................................................................................................ 79 7-22 Bankfull Width Comparison ............................................................................................... 80 7-23 Slope Comparison ............................................................................................................... 81 7-24 Slope and Stream Order Comparison .................................................................................. 81 A Culvert and Bridge Vulnerability ......................................................................... Rear Pocket * Figures 1-1, 2-2, and 5-1 are reproduced from the Deerfield River Assessment, 2004-2008, prepared by Massachusetts Office of Executive Affairs.
RIVER AND STREAM POWER ASSESSMENT REPORT DEERFIELD RIVER BASIN – MASSACHUSETTS AND VERMONT DECEMBER 2014 (REVISED APRIL 4, 2017)
PREFACE The authors would like to thank the entire project team for their generous help in conducting this study including collecting field data, developing the extensive data base, discussing means and methods, and helping to assess the findings. Special thanks go to the following people:
Christine Hatch, Benjamin P. Werner, Marie-Francous Hatte, Noah Slovin, Nicole Gillett, Steve Mabee, Paula Sturdevant Rees, Scott Jackson, Katie MacArthur, Erin Rodgers, Colin Lawson, Eve Vogel, Jerry Schoen, and John Gartner
Submitted by James G. MacBroom, Roy Schiff, and Jessica Louisos
RIVER AND STREAM POWER ASSESSMENT REPORT DEERFIELD RIVER BASIN – MASSACHUSETTS AND VERMONT DECEMBER 2014 (REVISED APRIL 4, 2017)
PAGE 1
1.0 RIVER ASSESSMENT 1.1 Introduction This geomorphic assessment of Deerfield River in western Massachusetts and southern Vermont has been prepared by Milone & MacBroom, Inc. (MMI) on behalf of the University of Massachusetts as part of its "Farms, Floods, and FGM" project, funded by the United States Department of Agriculture – National Institute of Food and Agriculture National Integrated Water Quality Program (USDA – NIFA NIWQP) program. This project is a broad-based geomorphic assessment of the Deerfield River and its adjacent riparian corridor to define its characteristics, processes, and management issues. The river channel is used extensively for hydroelectric power generation and recreation, with agricultural land uses on the floodplains. This river assessment focuses upon temporal river processes and resulting features rather than the more common assessment of local cross section forms and characteristics that change after annual floods. The Deerfield River has been found to be remarkably stable with moderate specific stream power (SSP) except in highly contracted segments, and the few large floodplains are more prone to sediment deposition rather than dynamic migratory channels or avulsions. In contrast, several larger tributaries have steep gradients and narrow confined valleys that lead to high stream power and dramatic geomorphic changes during floods. Consequently, the anticipated hydrologic effects of climate change will be more acute along the tributaries than the main stem. The second part of this project included developing a Geographic Information System (GIS)-based model to compute specific stream power and using the results to help predict culvert and bridge vulnerability of failure. This vulnerability screening tool uses remote sensing data and a regression equation to predict hydrology and channel reach slope and a prediction of channel and structure condition that is compared to a field inventory of culverts. The purpose of the vulnerability screen analysis is to help identify the potential for channel and structural risk at culverts due to erosion, sedimentation, debris, and flooding. Vulnerable structures can then be ranked by priority for subsequent on-site investigation. 1.2 River Assessment Methodology Conventional stream assessments focus upon use of remote sensing data and a visual inspection of existing channel conditions, with qualitative comments on channel defects and adjustments, with little or no quantitative evaluation of hydrology, floodplains, or river mechanics. In contrast, for this project, MMI uses a "hydro-morphology" approach, similar to European and the River Styles procedures that evaluate a series of nested spatial scales that include the watershed hydrology, valley form and confinement, floodplain, and then the actual main river channel and its major tributaries. Watersheds are complicated places with many variables to be considered. The hydro-morphology system assessment includes the role of independent variables such as runoff patterns, peak flows, and geologic conditions, plus valley slope and confinement, followed by the resulting dependent elements of geomorphic change including channel pattern,
RIVER AND STREAM POWER ASSESSMENT REPORT DEERFIELD RIVER BASIN – MASSACHUSETTS AND VERMONT DECEMBER 2014 (REVISED APRIL 4, 2017)
PAGE 2
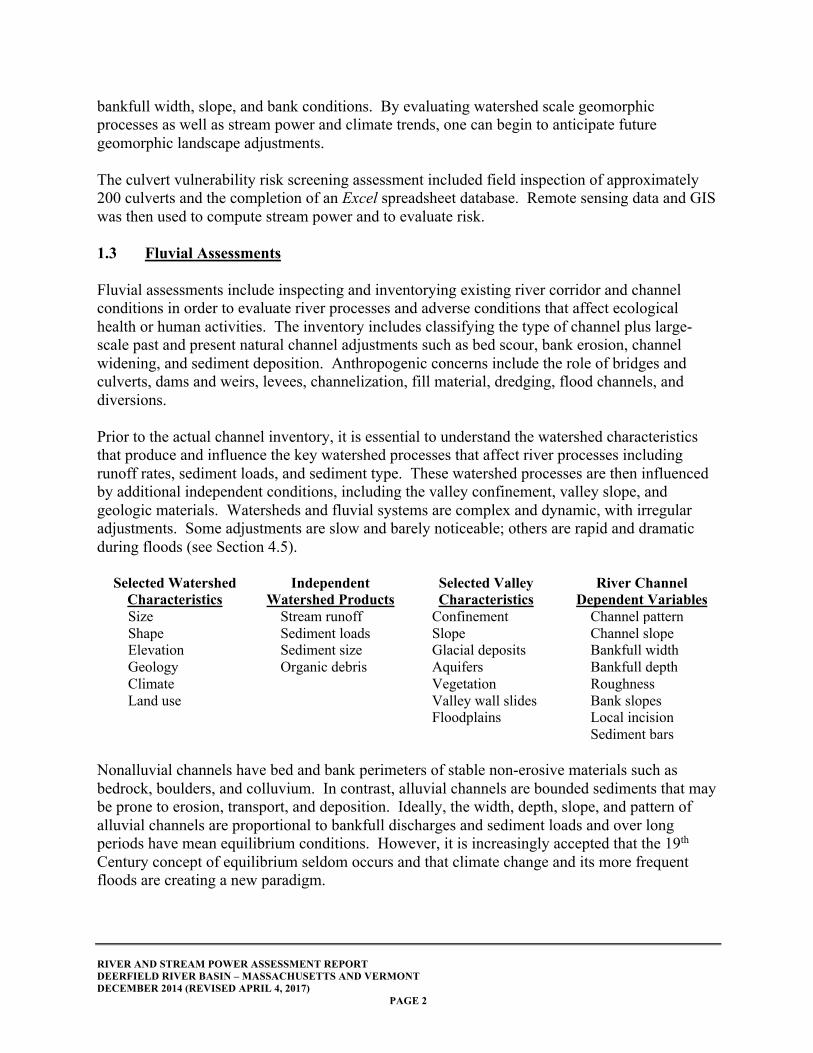
bankfull width, slope, and bank conditions. By evaluating watershed scale geomorphic processes as well as stream power and climate trends, one can begin to anticipate future geomorphic landscape adjustments. The culvert vulnerability risk screening assessment included field inspection of approximately 200 culverts and the completion of an Excel spreadsheet database. Remote sensing data and GIS was then used to compute stream power and to evaluate risk. 1.3 Fluvial Assessments Fluvial assessments include inspecting and inventorying existing river corridor and channel conditions in order to evaluate river processes and adverse conditions that affect ecological health or human activities. The inventory includes classifying the type of channel plus large-scale past and present natural channel adjustments such as bed scour, bank erosion, channel widening, and sediment deposition. Anthropogenic concerns include the role of bridges and culverts, dams and weirs, levees, channelization, fill material, dredging, flood channels, and diversions. Prior to the actual channel inventory, it is essential to understand the watershed characteristics that produce and influence the key watershed processes that affect river processes including runoff rates, sediment loads, and sediment type. These watershed processes are then influenced by additional independent conditions, including the valley confinement, valley slope, and geologic materials. Watersheds and fluvial systems are complex and dynamic, with irregular adjustments. Some adjustments are slow and barely noticeable; others are rapid and dramatic during floods (see Section 4.5).
Selected Watershed Characteristics
Independent Watershed Products
Selected Valley Characteristics
River Channel Dependent Variables
Size Stream runoff Confinement Channel pattern Shape Sediment loads Slope Channel slope Elevation Sediment size Glacial deposits Bankfull width Geology Organic debris Aquifers Bankfull depth Climate Vegetation Roughness Land use Valley wall slides Bank slopes Floodplains Local incision
Sediment bars Nonalluvial channels have bed and bank perimeters of stable non-erosive materials such as bedrock, boulders, and colluvium. In contrast, alluvial channels are bounded sediments that may be prone to erosion, transport, and deposition. Ideally, the width, depth, slope, and pattern of alluvial channels are proportional to bankfull discharges and sediment loads and over long periods have mean equilibrium conditions. However, it is increasingly accepted that the 19th Century concept of equilibrium seldom occurs and that climate change and its more frequent floods are creating a new paradigm.
RIVER AND STREAM POWER ASSESSMENT REPORT DEERFIELD RIVER BASIN – MASSACHUSETTS AND VERMONT DECEMBER 2014 (REVISED APRIL 4, 2017)
PAGE 3
Changes in discharges, sediment loads, sediment sizes, and tectonic factors can lead to adjustments in channel and corridor characteristics, the most common driving force being rare flood flows and human activities. Some channels are more sensitive to change than others due to their confinement, slope, or boundary materials. The Active River Area This report focuses upon just two elements of the Active River Area – the channel and its floodplain. The Active River Area that influences river form and processes is larger than just the channel and floodplain. It has been described by The Nature Conservancy as including those places where river-related processes occur (Smith et al., 2008). The specific components of the Active River Area include:
1) Material contribution areas – are sources of river inputs, including headwater streams and near bank overland flow areas
2) Meander belt zones – areas where channels migrate over time
3) Floodplains – sedimentary areas subject to periodic inundation and composed of modern sediment
4) Terraces – former floodplains formed by rivers and created by past events and which may
still be inundated by rare flood events and still support floodplain species
5) Riparian wetlands – low gradient areas with hydric or alluvial soils related to adjacent streams and supporting riparian water-tolerant vegetation
1.4 Equilibrium and Adjustments Alluvial rivers that are formed in modern sediments are able to adjust their channel width, depth, and slope in proportion to their flood flows and sediment loads. Undersized channels with high velocities are prone to scour, and oversized channels have low velocities and tend to fill due to sediment deposition. River channels subject to steady conditions tend to approach equilibrium dimensions that are in balance with their peak flows and loads. In contrast, steep mountain rivers that are still adjusting their grade and valleys are less likely to be in equilibrium. During the 20th Century, the equilibrium concept was used in reference to channels' short-term cycles; today, we consider "equilibrium" to have spatial and temporal aspects such as annual cycles for alluvial sand channels and decadal/century cycles for gravel bed channels and floodplains. River channels respond slowly to external stress, and reported floods or watershed changes may prevent equilibrium from occurring. There is growing concern that the current cycle of increasing precipitation and runoff will deter equilibrium conditions and void those river management strategies that assume equilibrium. For example, there may not be enough time

RIVER AND STREAM POWER ASSESSMENT REPORT DEERFIELD RIVER BASIN – MASSACHUSETTS AND VERMONT DECEMBER 2014 (REVISED APRIL 4, 2017)
PAGE 4
lapse between floods for rivers to adjust back toward equilibrium, and great floods can cause landslides, mass failures, and boulder transport that is irreversible. Rivers and their floodplains adjust their geometry in response to changes in watershed hydrology or sediment load. Channel adjustments may include scour and erosion that alter width or depth, sediment deposition, changes in bed gradient, and modified alignment and pattern. Floodplain adjustments also occur, including aggradation or scour from channel migration or avulsion. Sediment deposition frequently occurs during large floods, burying the previous floodplain surface. Specific human activities that may lead to channel or floodplain adjustments include forest clearing, drainage, filling wetlands, channel realignment, and undersized bridges and culverts. Drastic adjustments are associated with channelization, dams, and use of levees. Classic river adjustments include both horizontal and vertical channel modifications and, in extreme cases, may alter floodplain and valley form.
Fluvial Adjustments
Horizontal Vertical Floodplain
Channel width Channel slope Topography Meander migration Channel incision Side channels Avulsions Aggradation Oxbows Floodplain linkages Degradation Vegetation Braiding Bank height Riparian wetlands
Bank failures Local scour Natural levees
RIVER AND STREAM POWER ASSESSMENT REPORT DEERFIELD RIVER BASIN – MASSACHUSETTS AND VERMONT DECEMBER 2014 (REVISED APRIL 4, 2017)
PAGE 5
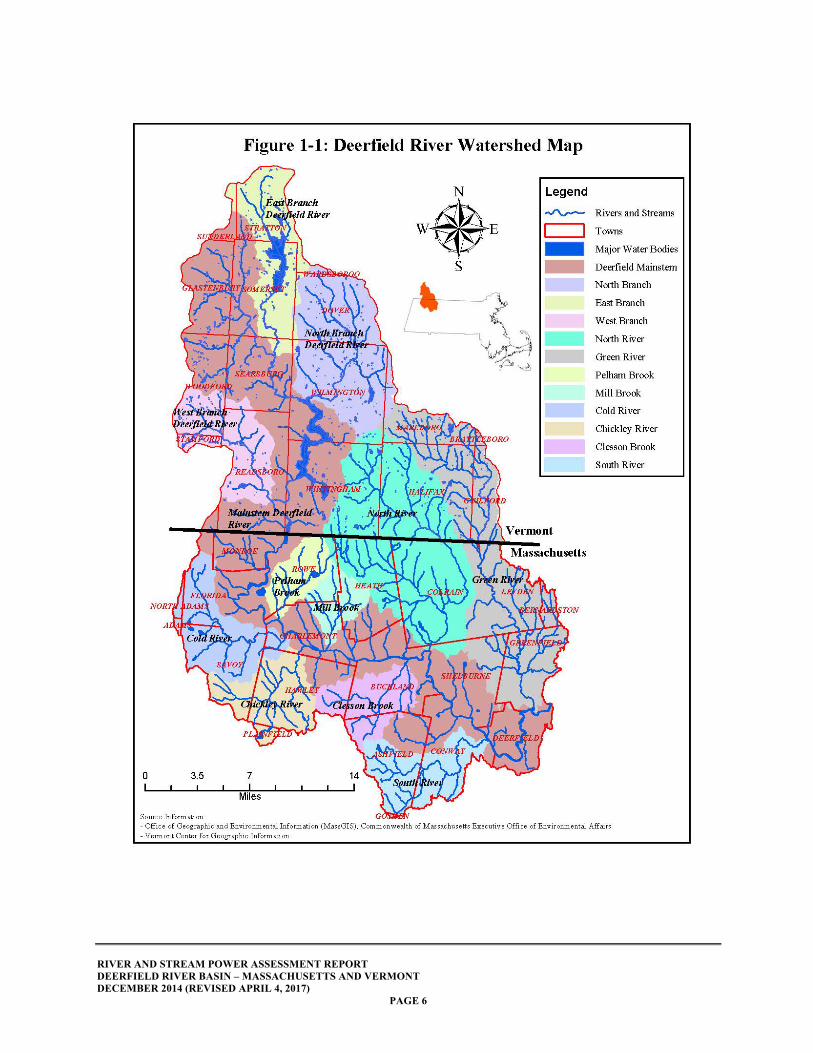
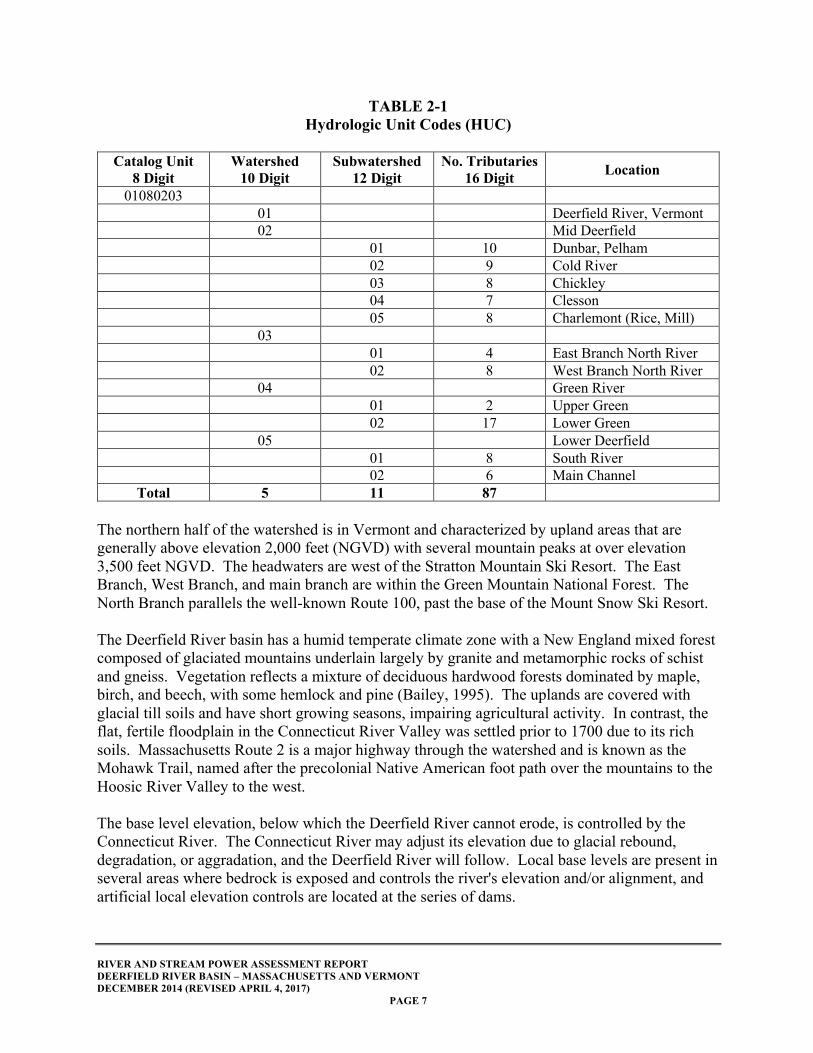
2.0 DEERFIELD WATERSHED The Deerfield River watershed (see Figure 1-1) is located in the Berkshire highlands region (Franklin County) of northwestern Massachusetts and in the southern part of Vermont. It is tributary to the Connecticut River, the largest river in New England. It is the drainage area from which water and sediment is supplied to the main stem river channel. It is largely of rural forested area with small farms and villages with moderate development in downstream areas near the Connecticut River Valley. It has a total area of 665 square miles divided between 318 square miles in Vermont and 347 square miles in Massachusetts. Water quality is a critical part of ecological evaluations. The watershed's water quality is discussed in detail in separate Vermont and Massachusetts "Deerfield River Watershed Assessment Reports" by state agencies and is not repeated here in detail. The river has a class B water quality designation in most sections indicating that it is suitable for human contact recreation (swimming, boating, wading) as well as habitat for fish and wildlife. There are a few local concerns about fecal coliform and metals and the influence of solid waste landfills. Portions of the Green River are impaired. The national system of hydrologic unit codes (HUC) was established by the U.S. Geological Survey (USGS) in order to map and identify the nation's watersheds. The HUC serves as the equivalent of a postal "zip" code that provides a unique identification for each watershed. Massachusetts has 183 of the 12-digit subwatershed scale basins. The Deerfield River basin HUC is 01080203, at the 8-digit accounting unit scale, which is also the state planning basin number. It is further designated with 5 of the 12-long digit cataloging units and many 16-digit tributary codes. The watershed is contiguous with the Hoosic River basin on the west, Westfield River basin to the south, and Connecticut River basin to the east. In Vermont, the north side of the Deerfield River basin abuts the West River basin. The full HUC designations are in Table 2-1.
RIVER AND STREAM POWER ASSESSMENT REPORT DEERFIELD RIVER BASIN – MASSACHUSETTS AND VERMONT DECEMBER 2014 (REVISED APRIL 4, 2017)
PAGE 6
RIVER AND STREAM POWER ASSESSMENT REPORT DEERFIELD RIVER BASIN – MASSACHUSETTS AND VERMONT DECEMBER 2014 (REVISED APRIL 4, 2017)
PAGE 7
TABLE 2-1 Hydrologic Unit Codes (HUC)
Catalog Unit
8 Digit Watershed
10 Digit Subwatershed
12 Digit No. Tributaries
16 Digit Location
01080203 01 Deerfield River, Vermont 02 Mid Deerfield 01 10 Dunbar, Pelham 02 9 Cold River 03 8 Chickley 04 7 Clesson 05 8 Charlemont (Rice, Mill) 03 01 4 East Branch North River 02 8 West Branch North River 04 Green River 01 2 Upper Green 02 17 Lower Green 05 Lower Deerfield 01 8 South River 02 6 Main Channel
Total 5 11 87 The northern half of the watershed is in Vermont and characterized by upland areas that are generally above elevation 2,000 feet (NGVD) with several mountain peaks at over elevation 3,500 feet NGVD. The headwaters are west of the Stratton Mountain Ski Resort. The East Branch, West Branch, and main branch are within the Green Mountain National Forest. The North Branch parallels the well-known Route 100, past the base of the Mount Snow Ski Resort. The Deerfield River basin has a humid temperate climate zone with a New England mixed forest composed of glaciated mountains underlain largely by granite and metamorphic rocks of schist and gneiss. Vegetation reflects a mixture of deciduous hardwood forests dominated by maple, birch, and beech, with some hemlock and pine (Bailey, 1995). The uplands are covered with glacial till soils and have short growing seasons, impairing agricultural activity. In contrast, the flat, fertile floodplain in the Connecticut River Valley was settled prior to 1700 due to its rich soils. Massachusetts Route 2 is a major highway through the watershed and is known as the Mohawk Trail, named after the precolonial Native American foot path over the mountains to the Hoosic River Valley to the west. The base level elevation, below which the Deerfield River cannot erode, is controlled by the Connecticut River. The Connecticut River may adjust its elevation due to glacial rebound, degradation, or aggradation, and the Deerfield River will follow. Local base levels are present in several areas where bedrock is exposed and controls the river's elevation and/or alignment, and artificial local elevation controls are located at the series of dams.
RIVER AND STREAM POWER ASSESSMENT REPORT DEERFIELD RIVER BASIN – MASSACHUSETTS AND VERMONT DECEMBER 2014 (REVISED APRIL 4, 2017)
PAGE 8
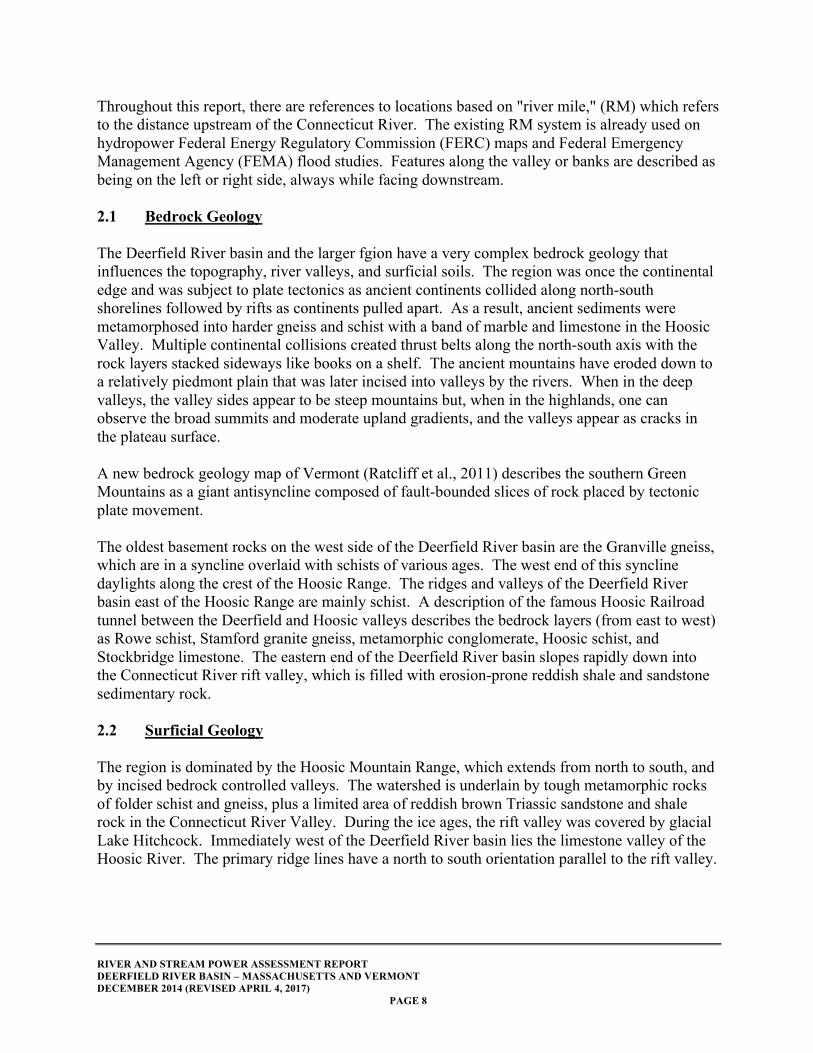
Throughout this report, there are references to locations based on "river mile," (RM) which refers to the distance upstream of the Connecticut River. The existing RM system is already used on hydropower Federal Energy Regulatory Commission (FERC) maps and Federal Emergency Management Agency (FEMA) flood studies. Features along the valley or banks are described as being on the left or right side, always while facing downstream. 2.1 Bedrock Geology The Deerfield River basin and the larger fgion have a very complex bedrock geology that influences the topography, river valleys, and surficial soils. The region was once the continental edge and was subject to plate tectonics as ancient continents collided along north-south shorelines followed by rifts as continents pulled apart. As a result, ancient sediments were metamorphosed into harder gneiss and schist with a band of marble and limestone in the Hoosic Valley. Multiple continental collisions created thrust belts along the north-south axis with the rock layers stacked sideways like books on a shelf. The ancient mountains have eroded down to a relatively piedmont plain that was later incised into valleys by the rivers. When in the deep valleys, the valley sides appear to be steep mountains but, when in the highlands, one can observe the broad summits and moderate upland gradients, and the valleys appear as cracks in the plateau surface. A new bedrock geology map of Vermont (Ratcliff et al., 2011) describes the southern Green Mountains as a giant antisyncline composed of fault-bounded slices of rock placed by tectonic plate movement. The oldest basement rocks on the west side of the Deerfield River basin are the Granville gneiss, which are in a syncline overlaid with schists of various ages. The west end of this syncline daylights along the crest of the Hoosic Range. The ridges and valleys of the Deerfield River basin east of the Hoosic Range are mainly schist. A description of the famous Hoosic Railroad tunnel between the Deerfield and Hoosic valleys describes the bedrock layers (from east to west) as Rowe schist, Stamford granite gneiss, metamorphic conglomerate, Hoosic schist, and Stockbridge limestone. The eastern end of the Deerfield River basin slopes rapidly down into the Connecticut River rift valley, which is filled with erosion-prone reddish shale and sandstone sedimentary rock. 2.2 Surficial Geology The region is dominated by the Hoosic Mountain Range, which extends from north to south, and by incised bedrock controlled valleys. The watershed is underlain by tough metamorphic rocks of folder schist and gneiss, plus a limited area of reddish brown Triassic sandstone and shale rock in the Connecticut River Valley. During the ice ages, the rift valley was covered by glacial Lake Hitchcock. Immediately west of the Deerfield River basin lies the limestone valley of the Hoosic River. The primary ridge lines have a north to south orientation parallel to the rift valley.
RIVER AND STREAM POWER ASSESSMENT REPORT DEERFIELD RIVER BASIN – MASSACHUSETTS AND VERMONT DECEMBER 2014 (REVISED APRIL 4, 2017)
PAGE 9
Much of the Deerfield River's channel is incised into narrow bedrock valleys surrounded by steep hillsides, leaving little space for bottom lands. As a result, the Deerfield River, and especially its undammed tributaries, can have rapid runoff and flash floods with limited wetlands and natural water retention. The combination of shallow bedrock, steep slopes, and glacial till soils also influences agricultural activities, much of which is limited to floodplain and terrace area soils. The entire Deerfield River basin was covered by glaciers several times, scraping soil off hilltops and leaving a mantle of glacial till. The till has a random mixture of sand and gravel mixed with silt, clay, and rocks, creating a dense nutrient-poor soil. Many valley bottoms received fluvial sediments from upland areas that formed stratified drift and level floodplains along the large rivers. Holocene and Pleistocene sediments with large rounded boulders and cobbles are found in old terraces. The stratified drift outwash deposits of sand and gravel lie in the valley bottoms and form the outer limits of modern floodplains. Portions of the original postglacial drift have eroded, leaving high and low terraces along the valley edges that often correspond to active agricultural land uses. Rivers flowing across the stratified drift may further incise channels and have lateral meander movement that reworks the old sediment, plus modern alluvium will be deposited. The younger geologic floodplains may be used to approximate flood hazard areas and supplement FEMA floodplain maps that are based upon hydraulic engineering analysis (see Section 5.0 of this report). Vermont and Massachusetts surficial geology maps depicting stratified drift were compiled from individual USGS topographic quadrangle maps, then digitized and combined. Surficial geology maps depict little stratified drift in Vermont where the Deerfield River is largely confined in narrow valleys or impounded. A narrow band of stratified drift is mapped along the Deerfield River downstream of the Hoosic tunnel area becoming a little wider in Charlemont and Buckland and narrowing in Conway. The most significant stratified drift deposit is along the Green River in Greenfield and along the town of Deerfield floodplain, which also has mapped modern alluvium. Narrow bands of stratified drift extend to the North River in Colrain, the South River in Conway, Clesson Brook in Buckland, and Chickley River in Hawley. The USGS has explored several of the stratified drift deposits in terms of groundwater sources and hydrogeology characteristics (Friesz, 1996). The North River and South River deposits were reworked by Hurricane Irene while the Cold River and Chickley River fine-grain bed deposits were removed. 2.3 Deerfield River
2.3.1 Introduction The main channel flows in a southerly direction through narrow, confined valleys in its Vermont sector and then generally flows southeasterly through Franklin County, Massachusetts, as a
RIVER AND STREAM POWER ASSESSMENT REPORT DEERFIELD RIVER BASIN – MASSACHUSETTS AND VERMONT DECEMBER 2014 (REVISED APRIL 4, 2017)
PAGE 10
slightly entrenched gravel and cobble bed river to the Connecticut River at Greenfield. The river length is 76 miles with a fall of 1,700 feet. Major tributaries include the North River, Green River, Cold River, Pelham Brook, Mill Brook, Chickley River, Clesson Brook, and South River. For most of its length, the Deerfield River is incised with steep-sided bedrock valleys that likely follow ancient fault zones. The 1846 Gazetteer of Massachusetts by John Haywood describes the river as "a beautiful and important Indian Stream" that is rapid with precipitous banks. The surrounding piedmont-like uplands have mild gradients and a rolling surface with broad summits. Streams generally drain along northwest and southeast axes. The area of subwatersheds is available in Wandle (1984) and digital GIS files.
Key Subwatersheds
Basin Area, Square Miles
Comments
East Branch (VT) 36.9 Rural, GMNF, Somerset Reservoir North Branch (VT) 55.9 Rural, GMNF West Branch (VT) 31.8 Short, steep, whitewater sports North River 92.9 Cold-water fishery, agricultural land Green River 89.8 Class A watershed, then urban area, downstream region Cold River 31.7 Steep, clean, provides recreation, gorge Pelham Brook 13.7 Narrow step valley Mill Brook 15 Acid mine drainage, nonsupport status Chickley River 27.4 State forest, recent channelization and restoration Clesson Brook 21.2 Landfill, aquatic life alert South River 26.3 303(d) list, agricultural, downstream gorge
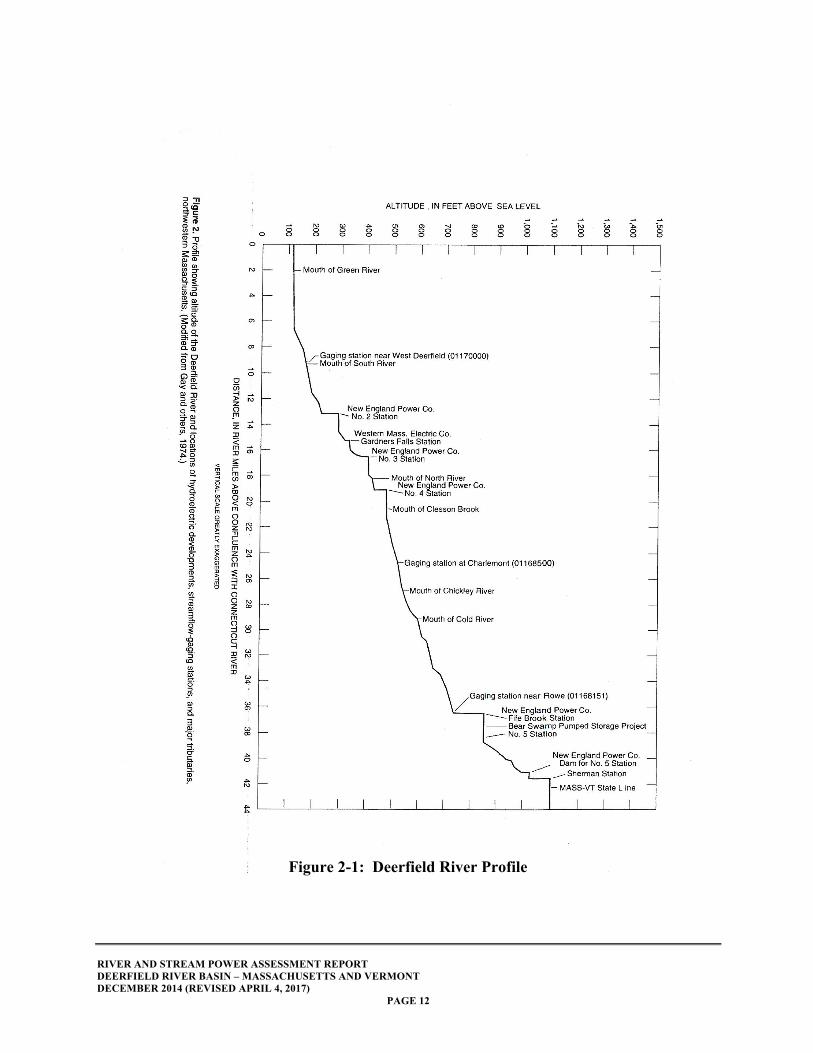
GMNF = Green Mountain National Forest The two largest tributaries, North River and Green River, are near the downstream end of the basin and have limited influence. The latter is located near the Deerfield River confluence with the Connecticut River and shares the same gap through a basalt ridge. Several tributaries are semiconfined to fully confined with limited floodplains. 2.3.2 River Gradient Rivers receive their energy for transporting water and sediment from gravitational forces, which are reflected in the river gradient. The river's longitudinal profile is a graphical plot of the river bed elevation versus distance and is a critical tool in understanding river hydraulics, sediment transport, and stream power (see Figure 2-1). The classic river channel gradient usually declines from its narrow, rocky headwaters to a broad, meandering, low-gradient channel at its mouth. The Deerfield River main channel has an elevation drop of approximately 1,700 feet in 75 miles with an average gradient of 23 feet per mile (see Figure 2-2). Its longitudinal profile generally has the classic "concave up" shape with steep headwaters and an increased gradient near the downstream quarter point from Clesson Brook to South River where the Deerfield River cuts down into the side of the Connecticut River rift valley. However, bedrock grade controls and

RIVER AND STREAM POWER ASSESSMENT REPORT DEERFIELD RIVER BASIN – MASSACHUSETTS AND VERMONT DECEMBER 2014 (REVISED APRIL 4, 2017)
PAGE 11
dams create a somewhat irregular profile. The final 7 miles of the Deerfield River lie across the flat Connecticut River lowlands. This profile type is very similar to the nearby Westfield and Farmington Rivers, which also have headwaters in the western highlands with hydroelectric plants located where they down cut through basalt dikes into the rift valley. For most of its length, the Deerfield River is bedrock controlled. Even the main valley with its alluvial channel from dam #4 near Shelburne Falls to the Route 2 bridge west of Shelburne has a few bedrock outcrops that provide vertical and horizontal confinements. The river slope and waterfalls led to its early development with water-powered industries and 20th Century hydroelectric power generation. The river profile includes waterfalls, many whitewater rapids, long runs with pools and riffles, and several reaches with a low-gradient meandering channel.
RIVER AND STREAM POWER ASSESSMENT REPORT DEERFIELD RIVER BASIN – MASSACHUSETTS AND VERMONT DECEMBER 2014 (REVISED APRIL 4, 2017)
PAGE 12
Figure 2-1: Deerfield River Profile
RIVER AND STREAM POWER ASSESSMENT REPORT DEERFIELD RIVER BASIN – MASSACHUSETTS AND VERMONT DECEMBER 2014 (REVISED APRIL 4, 2017)
PAGE 13
RIVER AND STREAM POWER ASSESSMENT REPORT
DEERFIELD RIVER BASIN – MASSACHUSETTS AND VERMONT
DECEMBER 2014 (REVISED APRIL 4, 2017)
PAGE 14
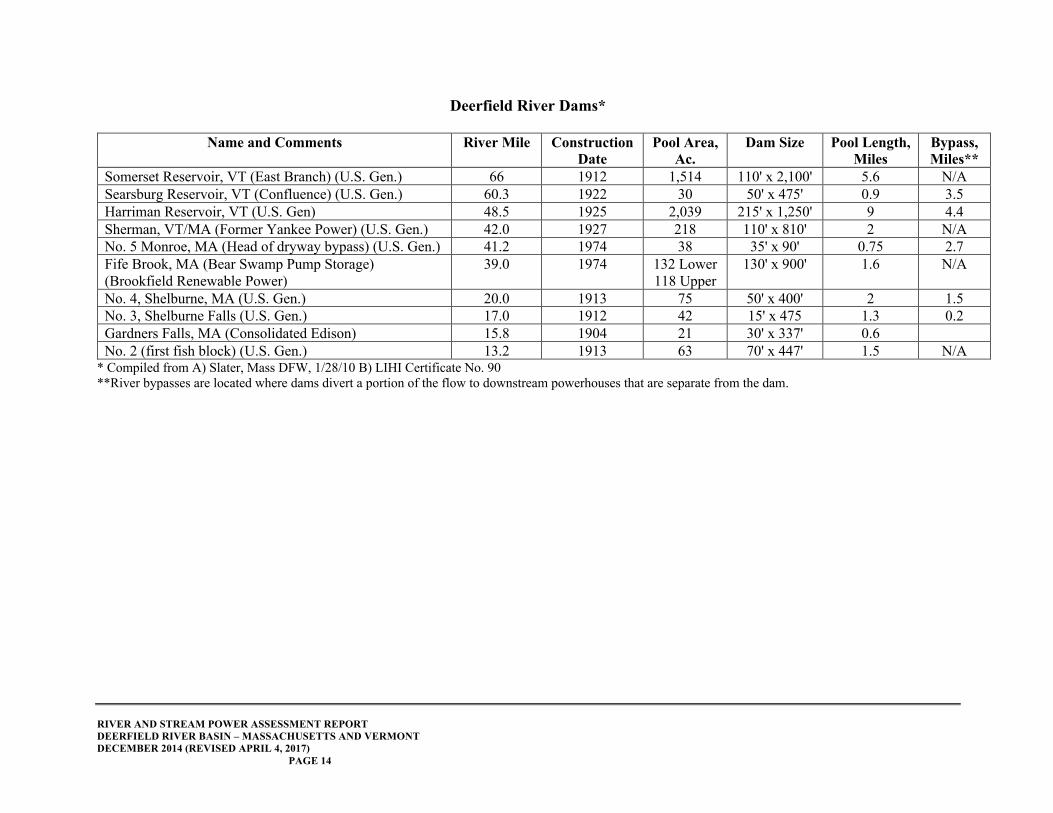
Deerfield River Dams*
Name and Comments River Mile Construction
Date
Pool Area,
Ac.
Dam Size Pool Length,
Miles
Bypass,
Miles**
Somerset Reservoir, VT (East Branch) (U.S. Gen.) 66 1912 1,514 110' x 2,100' 5.6 N/A Searsburg Reservoir, VT (Confluence) (U.S. Gen.) 60.3 1922 30 50' x 475' 0.9 3.5 Harriman Reservoir, VT (U.S. Gen) 48.5 1925 2,039 215' x 1,250' 9 4.4 Sherman, VT/MA (Former Yankee Power) (U.S. Gen.) 42.0 1927 218 110' x 810' 2 N/A No. 5 Monroe, MA (Head of dryway bypass) (U.S. Gen.) 41.2 1974 38 35' x 90' 0.75 2.7 Fife Brook, MA (Bear Swamp Pump Storage) (Brookfield Renewable Power)
39.0 1974 132 Lower 118 Upper
130' x 900' 1.6 N/A
No. 4, Shelburne, MA (U.S. Gen.) 20.0 1913 75 50' x 400' 2 1.5 No. 3, Shelburne Falls (U.S. Gen.) 17.0 1912 42 15' x 475 1.3 0.2 Gardners Falls, MA (Consolidated Edison) 15.8 1904 21 30' x 337' 0.6 No. 2 (first fish block) (U.S. Gen.) 13.2 1913 63 70' x 447' 1.5 N/A
* Compiled from A) Slater, Mass DFW, 1/28/10 B) LIHI Certificate No. 90 **River bypasses are located where dams divert a portion of the flow to downstream powerhouses that are separate from the dam.
RIVER AND STREAM POWER ASSESSMENT REPORT DEERFIELD RIVER BASIN – MASSACHUSETTS AND VERMONT DECEMBER 2014 (REVISED APRIL 4, 2017)
PAGE 15
2.3.3 Habitat The Deerfield River and its major tributaries have outstanding habitat and support a wide range of aquatic species. The river is particularly known for its trout populations and is popular for recreational fishing despite flow modifications. The hydropower releases actually enhance fishing due to summer flow augmentation with cold reservoir water. Wild rainbow, brook, and brown trout plus stocked fish provide year-round opportunities. The river corridor is listed as a "Priority Habitat" for state-listed endangered species including oscillated darter, 12-spotted tiger beetle, Stygian shadow dragon, and longnose sucker plus several rare plants. The river is popular for whitewater rafting and canoeing in the 17-mile reach below Fife dam and from Charlemont to Shelburne Falls. Whitewater kayaking is also found in the area of Zoar Gap and in the Cold River. Class I waters are found in the Deerfield Meadows reach approaching the Connecticut River confluence. The Massachusetts portion of the Deerfield River has a Class B water quality designation. It is suitable for supporting fish and other aquatic species and for water contact recreation such as swimming and whitewater boating. Historically, the river has had high dissolved oxygen levels but low alkalinity. Locally, sanitary landfills may affect water quality during low flows along Pelham Brook, Clesson Brook, and North River. Mill Brook has had reports of high acidity from old sulfur mines in Rowe. 2.3.4 Hydroelectric Facilities The river gradient, shallow water, and Salmon Falls in the village of Shelburne Falls preclude commercial navigation on the Deerfield River but enables extensive hydroelectric power generation and regulated flows for whitewater recreational boating. The river has 10 hydroelectric dams and generating stations along its length plus the Bear Swamp pump storage facility connected to the Fife Brook dam. Three large dams and their reservoirs are located in Vermont and serve as seasonal storage systems to generate power plus regulate flow to seven downstream hydroelectric dams. The storage reservoirs are at Somerset, Searsburg, and Harriman. The hydroelectric dams were relicensed based upon a 1994 FERC agreement with coordinated water management, including minimum flow releases, providing 84 megawatts (MW) of electricity. The former Yankee Rowe Nuclear Power Station was the third commercial unit in the United States and was located along the Deerfield River next to the Sherman dam at the Vermont/Massachusetts border. The plant was in use from 1960 to 1992 and has been fully decommissioned and removed. Some of the hydroelectric facilities include long "bypass" river segments where most flow is diverted from the river and into power station canal and/or pipe headraces that convey water from the dams to power stations. Minimum flows are maintained in the bypass segments for
RIVER AND STREAM POWER ASSESSMENT REPORT DEERFIELD RIVER BASIN – MASSACHUSETTS AND VERMONT DECEMBER 2014 (REVISED APRIL 4, 2017)
PAGE 16
fisheries and recreation, but the dam release rates may rapidly change based on operational conditions. The improved water quality, scheduled flow releases, and rural character make the Deerfield River a popular recreation area. It is well known for whitewater boating, fishing, and public parks and forests. The nine power facilities operated by TransCanada are licensed by the FERC as project No. 2323, and the separate Gardners Falls site is FERC No. 2334. The last dam constructed was the Fife Brook dam associated with the Bear Swamp pump storage facility. The lower dam has pumps that force water to the hilltop storage reservoir for later release during peak hours, generating up to 600 MW. Each of the dams poses a potential flood risk and is inspected under FERC guidance. They have Emergency Action Plans that are referred to in the Town of Deerfield 2011 Multihazard Mitigation Plan. 2.4 Flood Insurance Studies FEMA Flood Insurance Studies (FIS) prepared as part of the National Flood Insurance Program (NFIP) are an invaluable source of information on the nation's rivers and are available for some of the towns in the Deerfield River basin. The reports contain important information on the rivers' hydrology, flood history, floodprone areas, and longitudinal profiles of selected rivers. They also contain information on computed floodwater elevations, cross section velocities, and floodway data. The flood insurance maps that accompany the FIS define the boundaries of floodprone areas and regulated floodway areas that are essential to convey floodwaters (see Section 5.3). Fill material encroachments are banned from designated floodways. The Flood Insurance Rate Maps (FIRMs) are used to establish insurance rates and building elevations. FIS are available for the selected rivers in the following communities:
Town Date Buckland 1979
Charlemont 1980 Colrain 1980 Conway 1979 Deerfield 1980 Greenfield 1980 Shelburne 1980
As part of this project, the designated floodplain boundaries have been digitized into a combined GIS layer map (see Section 5.4).
RIVER AND STREAM POWER ASSESSMENT REPORT DEERFIELD RIVER BASIN – MASSACHUSETTS AND VERMONT DECEMBER 2014 (REVISED APRIL 4, 2017)
PAGE 17
3.0 HYDROLOGY 3.1 Introduction Watershed hydrology, in particular the peak flood flows, is the primary factor influencing river processes. Understanding watershed hydrology and its trends is an essential part of river assessments. The Deerfield River basin has a pleasant four-season climate with mild summers and cold winters. Annual precipitation ranges from 53 inches in the upper watershed at Searsburg, Vermont, to 45 inches in Greenfield, with a fairly uniform annual distribution. Precipitation events range from summer thunderstorms to continental frontal systems, with rare coastal tropical storms such as the 1938 hurricane and 2011 remnants of Hurricane Irene. Surface water hydrology refers to the movement of runoff through the watershed including its spatial and temporal distribution over time. Runoff includes the dry weather "base flow" from groundwater discharges at seeps and springs plus reservoir release and snowmelt, and runoff from excess precipitation. Long-term National Oceanic and Atmospheric Administration (NOAA) data on regional climate demonstrates a steady rise in mean annual precipitation, consistent with other Northeastern states. The long-term mean annual precipitation in the Deerfield River watershed is 45 inches, but some recent years have had up to 60 inches. Flow rates in the main stem of the Deerfield River are regulated by the large upstream storage reservoirs in Vermont plus the smaller pools at the downstream hydroelectric dams. The storage reservoirs are used to capture and retain excess runoff from the wet winter and spring months and later release it to generate electricity during the drier summer season. The smaller pools at the individual generator stations appear to be drawn upon to meet daily and weekly peak-hour electrical needs. As a result, flow rates and water levels may rapidly change on an hourly basis. The FERC License for the Fife Brook dam near the Massachusetts border requires a minimum flow release of 125 cubic feet per second (cfs) for the protection of fisheries, plus timed supplemental flows for whitewater boating. During the summer recreation season, daytime flow releases are often between 800 and 1,000 cfs, with off-peak flows of 125 to 200 cfs. The 125 cfs release is insufficient for boating over most riffles. Recreational activities are timed to match flow releases. In Massachusetts, the USGS operates two active stream gauging stations on the Deerfield River plus along three tributaries measuring daily flow rates as well as peak flows. There are no active USGS gauges in the Vermont portion of the watershed. The stations provide an invaluable record of the watershed hydrology. Additional partial duration stations are also located in the watershed with shorter records.
RIVER AND STREAM POWER ASSESSMENT REPORT DEERFIELD RIVER BASIN – MASSACHUSETTS AND VERMONT DECEMBER 2014 (REVISED APRIL 4, 2017)
PAGE 18
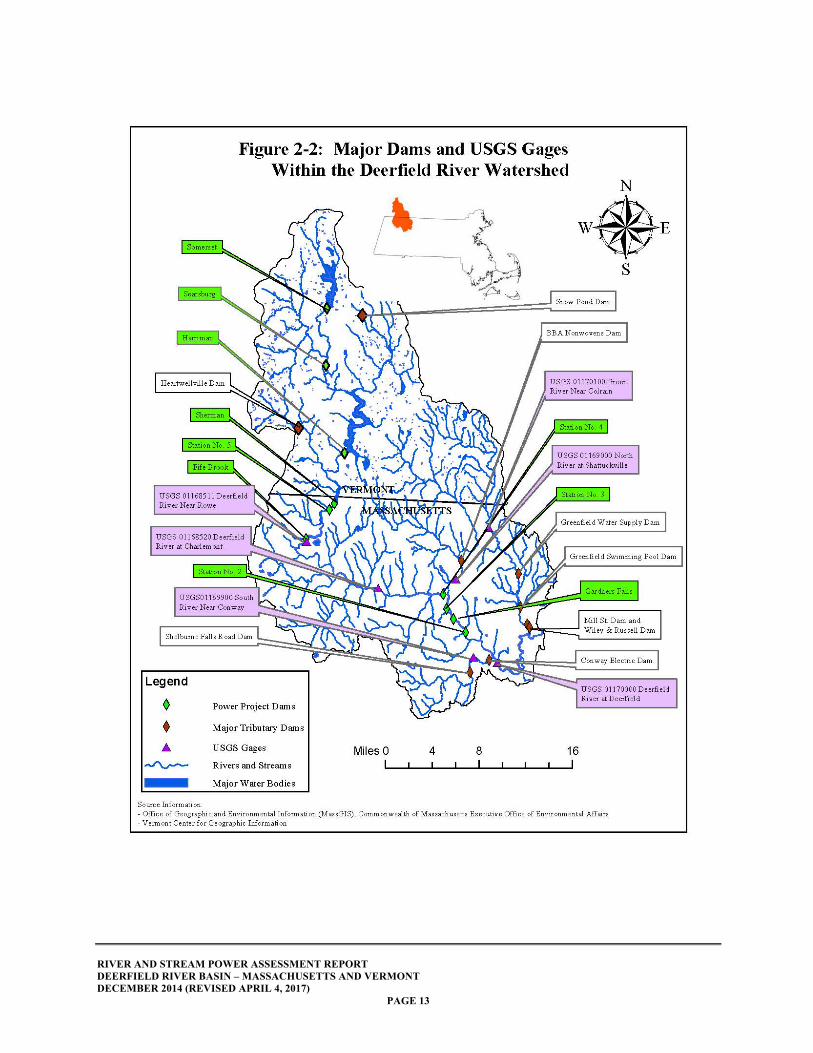
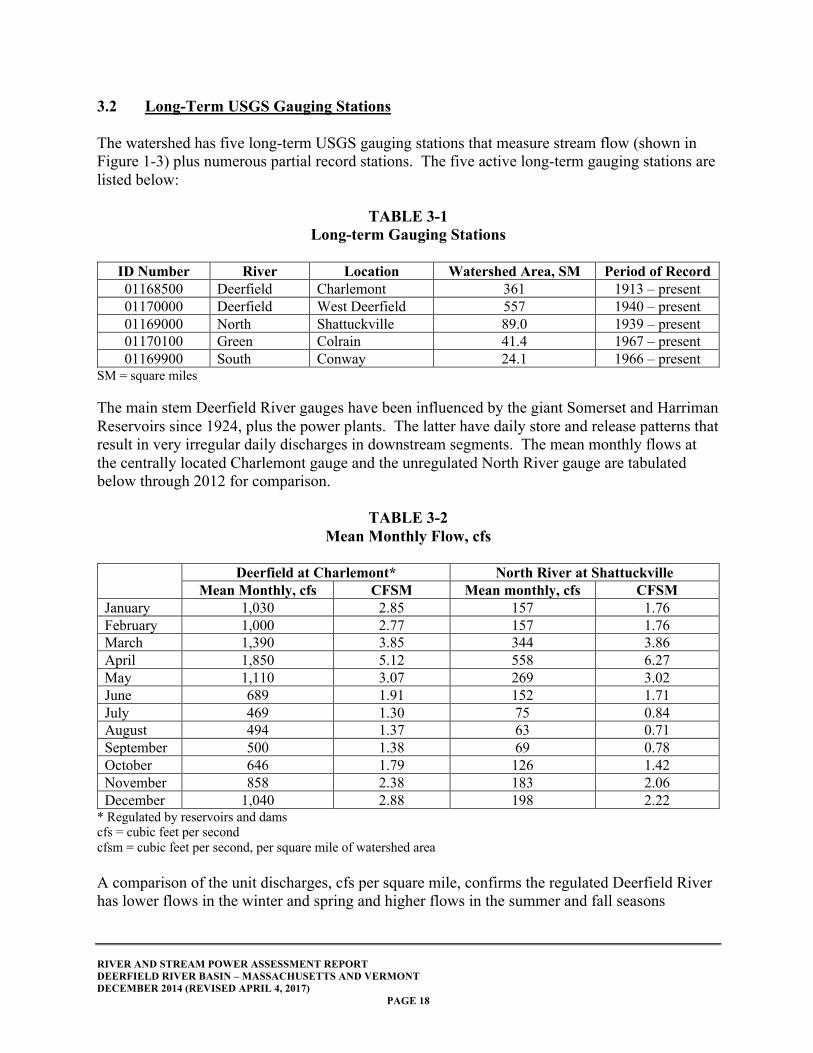
3.2 Long-Term USGS Gauging Stations The watershed has five long-term USGS gauging stations that measure stream flow (shown in Figure 1-3) plus numerous partial record stations. The five active long-term gauging stations are listed below:
TABLE 3-1 Long-term Gauging Stations
ID Number River Location Watershed Area, SM Period of Record 01168500 Deerfield Charlemont 361 1913 – present 01170000 Deerfield West Deerfield 557 1940 – present 01169000 North Shattuckville 89.0 1939 – present 01170100 Green Colrain 41.4 1967 – present 01169900 South Conway 24.1 1966 – present
SM = square miles The main stem Deerfield River gauges have been influenced by the giant Somerset and Harriman Reservoirs since 1924, plus the power plants. The latter have daily store and release patterns that result in very irregular daily discharges in downstream segments. The mean monthly flows at the centrally located Charlemont gauge and the unregulated North River gauge are tabulated below through 2012 for comparison.
TABLE 3-2 Mean Monthly Flow, cfs
Deerfield at Charlemont* North River at Shattuckville
Mean Monthly, cfs CFSM Mean monthly, cfs CFSM January 1,030 2.85 157 1.76 February 1,000 2.77 157 1.76 March 1,390 3.85 344 3.86 April 1,850 5.12 558 6.27 May 1,110 3.07 269 3.02 June 689 1.91 152 1.71 July 469 1.30 75 0.84 August 494 1.37 63 0.71 September 500 1.38 69 0.78 October 646 1.79 126 1.42 November 858 2.38 183 2.06 December 1,040 2.88 198 2.22
* Regulated by reservoirs and dams cfs = cubic feet per second cfsm = cubic feet per second, per square mile of watershed area A comparison of the unit discharges, cfs per square mile, confirms the regulated Deerfield River has lower flows in the winter and spring and higher flows in the summer and fall seasons
RIVER AND STREAM POWER ASSESSMENT REPORT DEERFIELD RIVER BASIN – MASSACHUSETTS AND VERMONT DECEMBER 2014 (REVISED APRIL 4, 2017)
PAGE 19
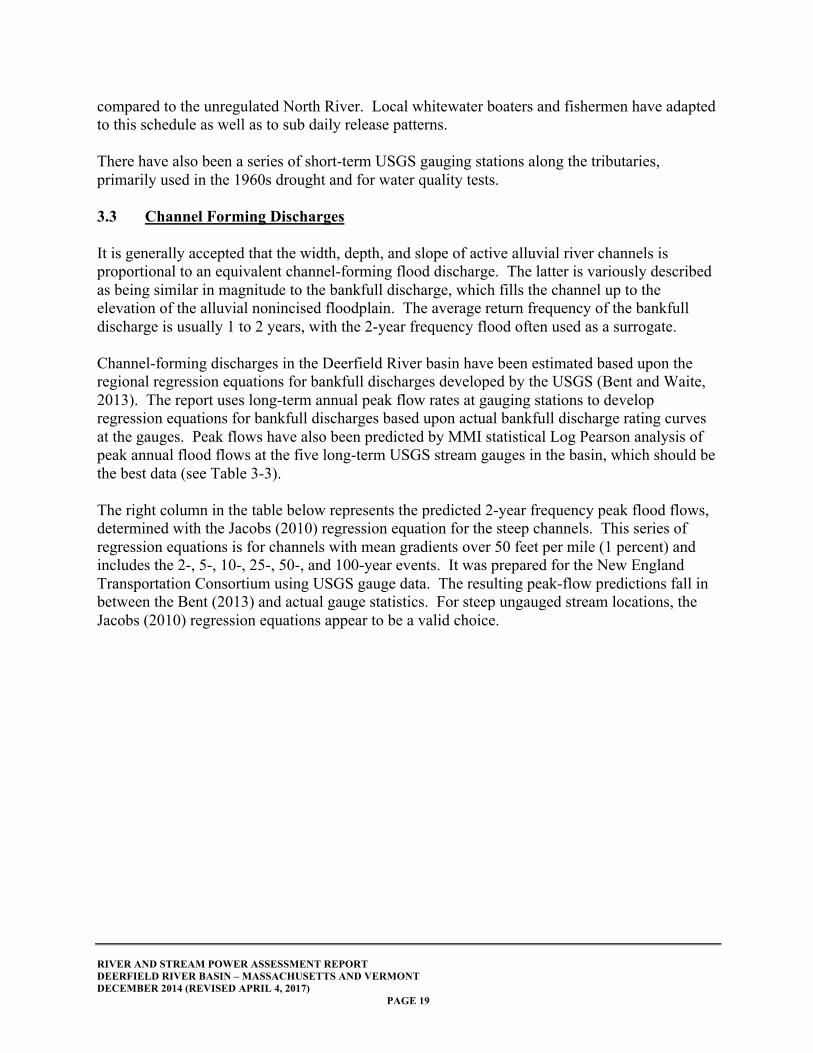
compared to the unregulated North River. Local whitewater boaters and fishermen have adapted to this schedule as well as to sub daily release patterns. There have also been a series of short-term USGS gauging stations along the tributaries, primarily used in the 1960s drought and for water quality tests. 3.3 Channel Forming Discharges It is generally accepted that the width, depth, and slope of active alluvial river channels is proportional to an equivalent channel-forming flood discharge. The latter is variously described as being similar in magnitude to the bankfull discharge, which fills the channel up to the elevation of the alluvial nonincised floodplain. The average return frequency of the bankfull discharge is usually 1 to 2 years, with the 2-year frequency flood often used as a surrogate. Channel-forming discharges in the Deerfield River basin have been estimated based upon the regional regression equations for bankfull discharges developed by the USGS (Bent and Waite, 2013). The report uses long-term annual peak flow rates at gauging stations to develop regression equations for bankfull discharges based upon actual bankfull discharge rating curves at the gauges. Peak flows have also been predicted by MMI statistical Log Pearson analysis of peak annual flood flows at the five long-term USGS stream gauges in the basin, which should be the best data (see Table 3-3). The right column in the table below represents the predicted 2-year frequency peak flood flows, determined with the Jacobs (2010) regression equation for the steep channels. This series of regression equations is for channels with mean gradients over 50 feet per mile (1 percent) and includes the 2-, 5-, 10-, 25-, 50-, and 100-year events. It was prepared for the New England Transportation Consortium using USGS gauge data. The resulting peak-flow predictions fall in between the Bent (2013) and actual gauge statistics. For steep ungauged stream locations, the Jacobs (2010) regression equations appear to be a valid choice.
RIVER AND STREAM POWER ASSESSMENT REPORT DEERFIELD RIVER BASIN – MASSACHUSETTS AND VERMONT DECEMBER 2014 (REVISED APRIL 4, 2017)
PAGE 20
TABLE 3-3 Estimated Channel Forming Discharges Comparison, cfs
USGS Gauge Station USGS Regional Regression EQ
(Bent, 2013)
Listed USGS Bankfull Q at Gauge(2)
Statistical Gauge Analysis, 2-Year Frequency Flood(3) Jacobs 2-Year
Regression Eq. (2010) USGS up to
2009(2) MMI up to
2013 Deerfield River at Charlemont (1)
4,121 N/A N/A 10,943 10,540
Deerfield River at West Deerfield (1)
5,829 N/A N/A 16,032 14,134
North River 1,345 3,070 4,895 4,718 3,025 South River 471 1,710 1,937 1,906 950 Green River 729 2,110 2,450 2,268 1,469
(1) Regulated by upstream dams (2) As reported in Bent, 2013 (3) Based upon MMI statistical analysis of gauge data The above channel-forming discharge data reveals a surprisingly wide spread between the peak flood flows determined by regional regression equations and the statistical analysis of gauge data. Even a simple visual observation of the plotted annual peak flows at the gauges indicates they are much higher than the values predicted by the USGS regional regression equation. However, the statistical 2-year frequency peak flows are more similar to the actual individual bankfull discharges reported by USGS at the gauges. The statewide regression equations may yield lower estimates because the Berkshires are a mountainous area with high precipitation. The USGS Bent (2013) report indicates the Berkshires do have above-average runoff but that there were insufficient gauges to break it out as a separate region. The USGS did do a multiple regression analysis in search of physical parameters without finding the source of residuals. However, we note that the Berkshire basins have high elevations and slopes plus shallow bedrock. The actual bankfull discharges measured at the gauge rating curves are also substantially higher than the regional data at the three unregulated stations (North, South, and Green Rivers). It appears that the use of the Massachusetts regression equations (Bent, 2013) for design of culverts, bridges, or channels in the Deerfield River basin could lead to underperformance. Similarly, the use of bankfull discharges based on long-term field indicators in reference segments may also lead to erroneous results. MMI has found similar conditions with the use of bankfull regression equations and indicators in the Catskill Mountain region of New York compared to actual gauge data. 3.4 Flood Frequency Analysis The current USGS stream gauge annual peak-flow data was accessed via the internet and imported to the U.S. Army Corps of Engineers (USACE) Hydrologic Engineering Center's Statistical Software Package (HEC-SSP) computer model to evaluate peak flood discharge
RIVER AND STREAM POWER ASSESSMENT REPORT DEERFIELD RIVER BASIN – MASSACHUSETTS AND VERMONT DECEMBER 2014 (REVISED APRIL 4, 2017)
PAGE 21
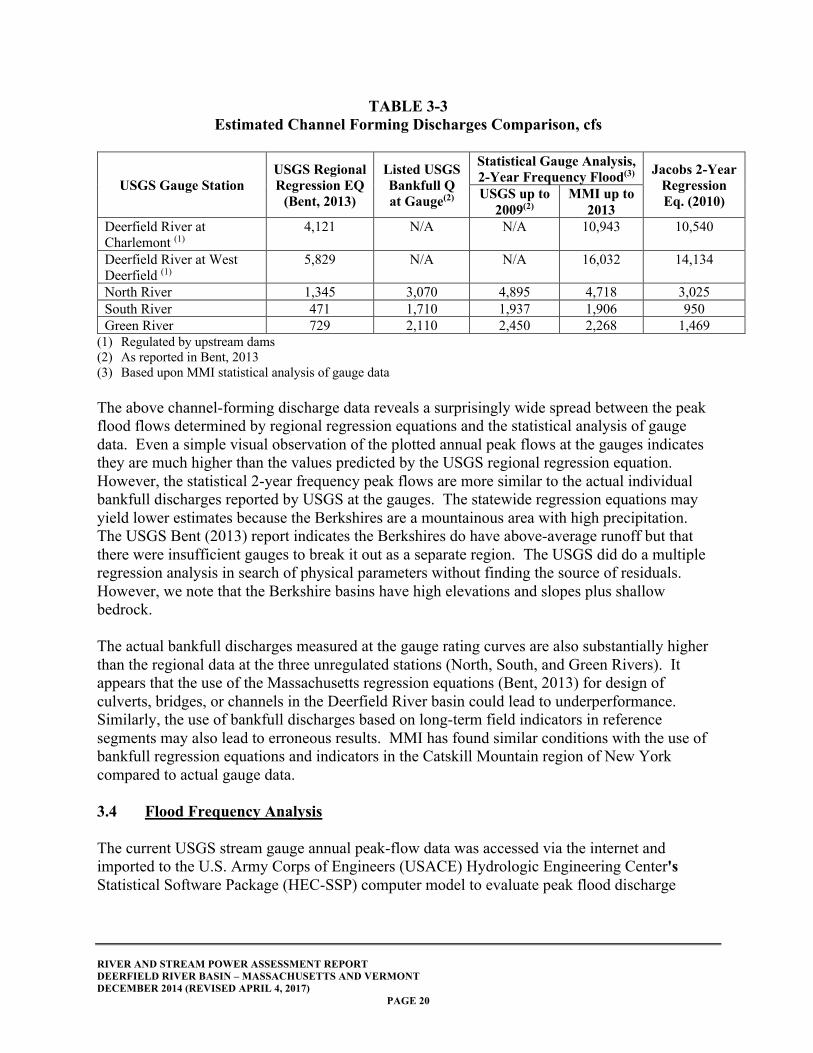
versus frequencies. The statistical analysis was conducted at the long-term stations using the standard Log Pearson procedures as per interagency Bulletin 17B.
TABLE 3-4 Peak Flood Flows, cfs
Statistical Analysis of Gauge Data
Gauge Return Frequency, Years Ratio
Q100/Q2 2 10 50 100 500 Deerfield at Charlemont* 10,943 25,096 44,371 54,965 86,573 5.0 Deerfield at West Deerfield* 16,032 33,900 60,918 76,853 128,301 4.79 North River 4,718 11,523 23,005 30,232 55,137 6.41 Green River 2,268 4,943 9,561 12,519 22,948 5.52 South River 1,906 4,684 9,475 12,531 23,225 6.57
*Regulated by upstream dams The ratio between the 100-year frequency flood and the 2-year flood is shown in the right column of Table 3-4. The representative ratio in the Northeast is typically about 5 and is a useful "rule of thumb" for estimating the 100-year flood when only the bankfull or 2-year flood is known. This ratio also supports use of river corridor conservation areas that are four to six times wider than the bankfull channel width. 3.5 Hurricane Irene Hurricane Irene struck the Northeast on August 28, 2011, and caused extensive damage in New York and Vermont and moderate to severe damage in western Massachusetts but spared the eastern part of the state. Irene dropped 4 to 9 inches of rain in the Berkshires and led to the flood of record at some Deerfield River basin gauges. Floods along the Cold River in Florida created havoc, washing out sections of Route 2 and creating landslides and mudslides that blocked the river and delivered huge sediment quantities downstream, and portions of Zoar Road were washed out along the Deerfield River. Floodplains along the middle segments of the Deerfield River were then inundated and were left covered with a layer of white sandy sediment, and local farmers lost crops of corn and potato. Route 112 had to be closed due to washouts in both Colrain and Buckland, and sections of Charlemont and Buckland were evacuated as the Deerfield River rose in the lower basin behind the Shelburne Falls dam. There was extensive flooding in the town of Deerfield including damage at the Deerfield Academy, Route 5, the Upper Road Stillwater Bridge, I-91, which was closed for inspection and scour repairs, and widespread crop loss on the north and south meadows floodplain. The Chickley River washed out a section of Route 8A in Hawley, Massachusetts, and eroded its channel, resulting in 5 miles of channelization as work crews sought to repair damages. The latter work included dredging, realignment, stone bank lining, and berms that then had to be mitigated due to damages to this former cold-water fishery.
RIVER AND STREAM POWER ASSESSMENT REPORT DEERFIELD RIVER BASIN – MASSACHUSETTS AND VERMONT DECEMBER 2014 (REVISED APRIL 4, 2017)
PAGE 22
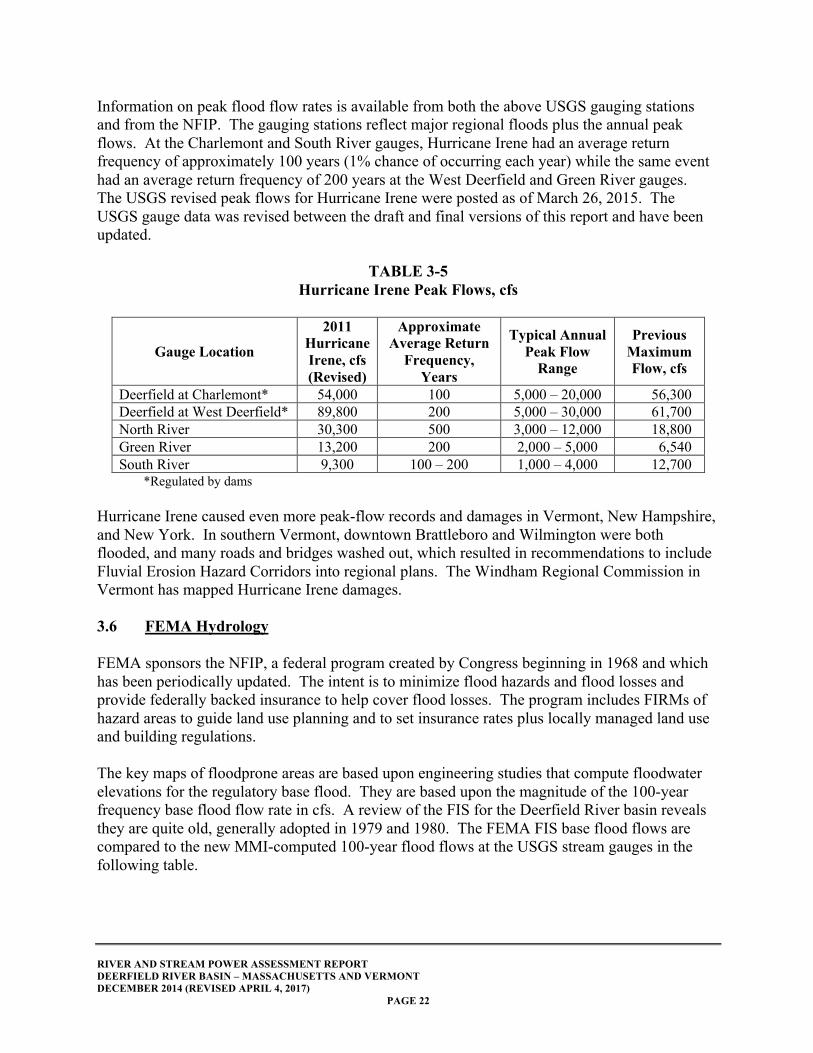
Information on peak flood flow rates is available from both the above USGS gauging stations and from the NFIP. The gauging stations reflect major regional floods plus the annual peak flows. At the Charlemont and South River gauges, Hurricane Irene had an average return frequency of approximately 100 years (1% chance of occurring each year) while the same event had an average return frequency of 200 years at the West Deerfield and Green River gauges. The USGS revised peak flows for Hurricane Irene were posted as of March 26, 2015. The USGS gauge data was revised between the draft and final versions of this report and have been updated.
TABLE 3-5 Hurricane Irene Peak Flows, cfs
Gauge Location
2011 Hurricane Irene, cfs (Revised)
Approximate Average Return
Frequency, Years
Typical Annual Peak Flow
Range
Previous Maximum Flow, cfs
Deerfield at Charlemont* 54,000 100 5,000 – 20,000 56,300 Deerfield at West Deerfield* 89,800 200 5,000 – 30,000 61,700 North River 30,300 500 3,000 – 12,000 18,800 Green River 13,200 200 2,000 – 5,000 6,540 South River 9,300 100 – 200 1,000 – 4,000 12,700
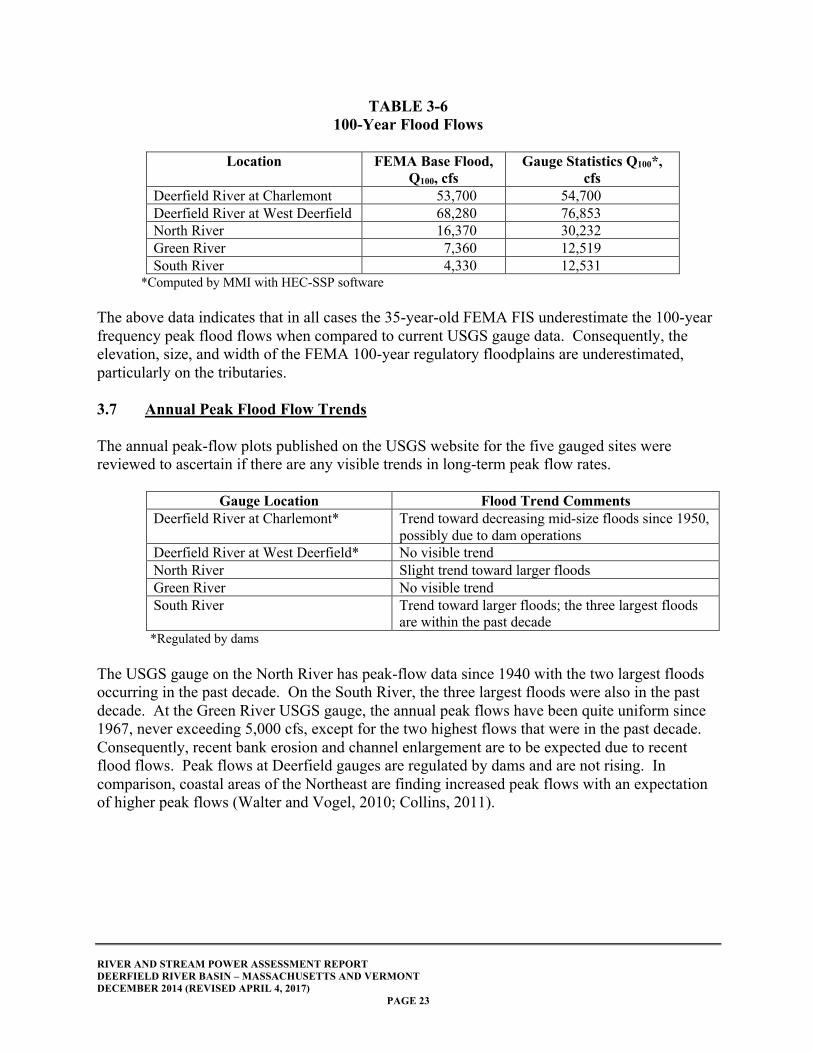
*Regulated by dams Hurricane Irene caused even more peak-flow records and damages in Vermont, New Hampshire, and New York. In southern Vermont, downtown Brattleboro and Wilmington were both flooded, and many roads and bridges washed out, which resulted in recommendations to include Fluvial Erosion Hazard Corridors into regional plans. The Windham Regional Commission in Vermont has mapped Hurricane Irene damages. 3.6 FEMA Hydrology FEMA sponsors the NFIP, a federal program created by Congress beginning in 1968 and which has been periodically updated. The intent is to minimize flood hazards and flood losses and provide federally backed insurance to help cover flood losses. The program includes FIRMs of hazard areas to guide land use planning and to set insurance rates plus locally managed land use and building regulations. The key maps of floodprone areas are based upon engineering studies that compute floodwater elevations for the regulatory base flood. They are based upon the magnitude of the 100-year frequency base flood flow rate in cfs. A review of the FIS for the Deerfield River basin reveals they are quite old, generally adopted in 1979 and 1980. The FEMA FIS base flood flows are compared to the new MMI-computed 100-year flood flows at the USGS stream gauges in the following table.
RIVER AND STREAM POWER ASSESSMENT REPORT DEERFIELD RIVER BASIN – MASSACHUSETTS AND VERMONT DECEMBER 2014 (REVISED APRIL 4, 2017)
PAGE 23
TABLE 3-6 100-Year Flood Flows
Location FEMA Base Flood,
Q100, cfs Gauge Statistics Q100*,
cfs Deerfield River at Charlemont 53,700 54,700 Deerfield River at West Deerfield 68,280 76,853 North River 16,370 30,232 Green River 7,360 12,519 South River 4,330 12,531
*Computed by MMI with HEC-SSP software The above data indicates that in all cases the 35-year-old FEMA FIS underestimate the 100-year frequency peak flood flows when compared to current USGS gauge data. Consequently, the elevation, size, and width of the FEMA 100-year regulatory floodplains are underestimated, particularly on the tributaries. 3.7 Annual Peak Flood Flow Trends The annual peak-flow plots published on the USGS website for the five gauged sites were reviewed to ascertain if there are any visible trends in long-term peak flow rates.
Gauge Location Flood Trend Comments Deerfield River at Charlemont* Trend toward decreasing mid-size floods since 1950,
possibly due to dam operations Deerfield River at West Deerfield* No visible trend North River Slight trend toward larger floods Green River No visible trend South River Trend toward larger floods; the three largest floods
are within the past decade *Regulated by dams The USGS gauge on the North River has peak-flow data since 1940 with the two largest floods occurring in the past decade. On the South River, the three largest floods were also in the past decade. At the Green River USGS gauge, the annual peak flows have been quite uniform since 1967, never exceeding 5,000 cfs, except for the two highest flows that were in the past decade. Consequently, recent bank erosion and channel enlargement are to be expected due to recent flood flows. Peak flows at Deerfield gauges are regulated by dams and are not rising. In comparison, coastal areas of the Northeast are finding increased peak flows with an expectation of higher peak flows (Walter and Vogel, 2010; Collins, 2011).
RIVER AND STREAM POWER ASSESSMENT REPORT DEERFIELD RIVER BASIN – MASSACHUSETTS AND VERMONT DECEMBER 2014 (REVISED APRIL 4, 2017)
PAGE 24
3.8 Sediment Yield Most of the Deerfield River basin (upstream of I-91) is in a hard bedrock region underlain by tough glacial till soils and currently covered by mixed hardwood and softwood forests. There are no known long-term sediment measurement stations, and the numerous dams along the main stem interrupt sediment transport. Based on regional data for similar watersheds, the mean annual natural sediment yield would be expected to be in the range of 30 to 100 tons per square mile per year (MacBroom, 2014). Except for wash loads of fine silt and clay, little coarse sediment would be expected to pass the Fife dam and upstream structures. Thus, the bedload yield from 263 of the total 665-square-mile watershed is minimal except during great floods. Yellen et al. (2014) have estimated the Deerfield River basin's suspended sediment yield during Hurricane Irene to have been 875 tons per square mile, extremely high due to the mobilization of hill slope soils during this rare flood. The bedload sediments that create channel bars and contribute to the channel form are usually a small portion of the total sediment load, in the range of 10 to 20 percent. The dams along the Deerfield River in Vermont are expected to trap and retain most bedload sediment that approaches them plus a fraction of the bed material size suspended load. Portions of South River are incised, and the channel is currently degrading and removing old impounded sediment from mill dam sites (Field, 2013). The Cold River and Chickley River are both degrading and were observed to be major sediment sources, and from that area downstream, the Deerfield River has large attached lateral bars, confluence bars, and a delta going into Reservoir 4. This sediment-rich segment does not have bank erosion and is not degrading, confirming its sediment load is from the tributaries. Limited sand and fine sediment is found along the Deerfield River except in Charlemont and along Deerfield Meadows. The moderate to high flows flush fines through the system and are still removing terrace deposits in the tributaries. The Deerfield River bed is generally armored, and the rounded cobbles tend to form loose clusters on riffles without imbrication. The bed is coarser than the banks. The steep coarse riffles downstream of Zoar Gap and in the Cold River include larger rounded boulders over 2 feet in diameter that will be stable except in another catastrophic flood. The many mass bank failures and landslides along Cold River and Pelham Brook provide a source for this coarse material.
RIVER AND STREAM POWER ASSESSMENT REPORT DEERFIELD RIVER BASIN – MASSACHUSETTS AND VERMONT DECEMBER 2014 (REVISED APRIL 4, 2017)
PAGE 25
4.0 FLUVIAL ASSESSMENT A Phase I-Level Fluvial Assessment has been performed along the Deerfield River and portions of major tributaries. The tributaries generally have steep-sided confined valleys and serve as a collection area for surface runoff and sediment, conveying material to the mid-watershed transport segments of the Deerfield River, with discontinuous lateral floodplains in the less confined valleys. The final downstream region in Deerfield has a broad alluvial unconfined floodplain due to sediment deposition and the backwater from the Connecticut River. This river assessment includes the normal stream classification process plus a preliminary evaluation of the channel's "river mechanics," which quantifies and links river form and process. It addresses channel classification, channel slope, alignment and pattern, and bankfull channel dimensions. A separate Phase II-Level Fluvial Assessment of the South River has been prepared by John Field including a detailed on-the-ground site inventory. 4.1 Channel Classification Geomorphic classifications are used herein to describe the current condition of the Deerfield River using several standard methods. The river is divided into relatively homogenous segments with uniform hydrology between major tributaries and land features and inspected. The segments are classified using the Rosgen classification system Table 4-1 (Rosgen, 2006; Rosgen, 1994), Montgomery and Buffington (M&B) (1993), and River Styles (Brierley and Friars, 2005) and described in Appendix A. The Rosgen classification identifies channel form via visual inspection and basic measurements of sinuosity, slope, entrenchment ratio, width to depth ratio, and bed substrate size. This simple empirical system is widely used and is a preferred method used by the Vermont Agency of Natural Resources (VTANR) and the New York Department of Environmental Protection (NYDEP) as well as for Natural Channel Design (NCD). It is heavily influenced by 1950s through 1960s USGS (Leopold, Wolman) literature and predates modern hydrology and hydraulic techniques. NCD is best used for natural equilibrium alluvial systems, so application is limited along the Deerfield River by the high percentage of channel confinement and current impounded conditions. It does not address the impact of major flood events, floodplain types, or stability. The M&B classification (1993, 1997) system was developed in and for mountainous areas based upon a qualitative assessment of sediment processes. The primary metrics are channel slope and sediment bed forms that create profile elements. The M&B classification does not address floodplain or low-gradient meandering channel types. The River Styles classification and river assessment system by Australians Gary Brierley and Kirstie Fryirs is noted for its spatial hierarchy from watersheds to microhabitats and its linkage to modern stream power quantitative analysis. River Styles is related to the Nanson floodplain classification system and is being used by MMI to assess floodplain dynamics with stream power. It can be used to predict the geomorphic effect of temporal changes in hydrology. A modified version has been adopted by the European Commission.
RIVER AND STREAM POWER ASSESSMENT REPORT DEERFIELD RIVER BASIN – MASSACHUSETTS AND VERMONT DECEMBER 2014 (REVISED APRIL 4, 2017)
PAGE 26
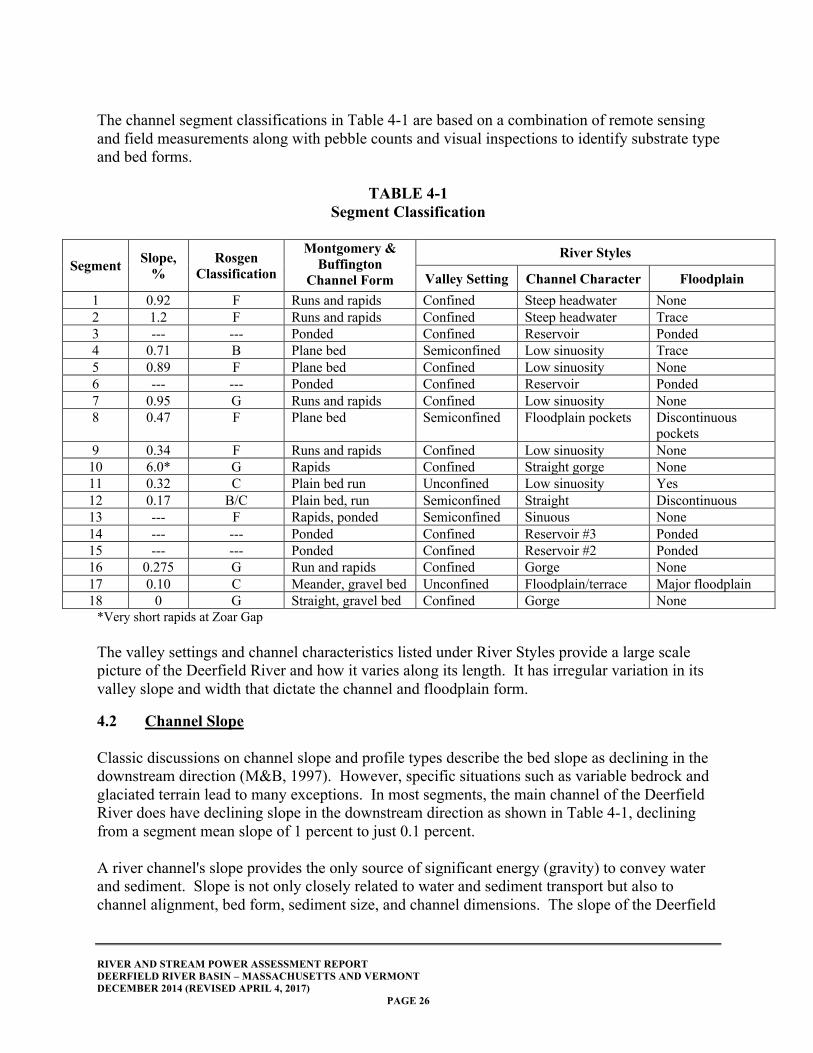
The channel segment classifications in Table 4-1 are based on a combination of remote sensing and field measurements along with pebble counts and visual inspections to identify substrate type and bed forms.
TABLE 4-1 Segment Classification
Segment Slope, %
Rosgen Classification
Montgomery & Buffington
Channel Form
River Styles
Valley Setting Channel Character Floodplain
1 0.92 F Runs and rapids Confined Steep headwater None 2 1.2 F Runs and rapids Confined Steep headwater Trace 3 --- --- Ponded Confined Reservoir Ponded 4 0.71 B Plane bed Semiconfined Low sinuosity Trace 5 0.89 F Plane bed Confined Low sinuosity None 6 --- --- Ponded Confined Reservoir Ponded 7 0.95 G Runs and rapids Confined Low sinuosity None 8 0.47 F Plane bed Semiconfined Floodplain pockets Discontinuous
pockets 9 0.34 F Runs and rapids Confined Low sinuosity None 10 6.0* G Rapids Confined Straight gorge None 11 0.32 C Plain bed run Unconfined Low sinuosity Yes 12 0.17 B/C Plain bed, run Semiconfined Straight Discontinuous 13 --- F Rapids, ponded Semiconfined Sinuous None 14 --- --- Ponded Confined Reservoir #3 Ponded 15 --- --- Ponded Confined Reservoir #2 Ponded 16 0.275 G Run and rapids Confined Gorge None 17 0.10 C Meander, gravel bed Unconfined Floodplain/terrace Major floodplain 18 0 G Straight, gravel bed Confined Gorge None
*Very short rapids at Zoar Gap The valley settings and channel characteristics listed under River Styles provide a large scale picture of the Deerfield River and how it varies along its length. It has irregular variation in its valley slope and width that dictate the channel and floodplain form. 4.2 Channel Slope Classic discussions on channel slope and profile types describe the bed slope as declining in the downstream direction (M&B, 1997). However, specific situations such as variable bedrock and glaciated terrain lead to many exceptions. In most segments, the main channel of the Deerfield River does have declining slope in the downstream direction as shown in Table 4-1, declining from a segment mean slope of 1 percent to just 0.1 percent. A river channel's slope provides the only source of significant energy (gravity) to convey water and sediment. Slope is not only closely related to water and sediment transport but also to channel alignment, bed form, sediment size, and channel dimensions. The slope of the Deerfield
RIVER AND STREAM POWER ASSESSMENT REPORT DEERFIELD RIVER BASIN – MASSACHUSETTS AND VERMONT DECEMBER 2014 (REVISED APRIL 4, 2017)
PAGE 27
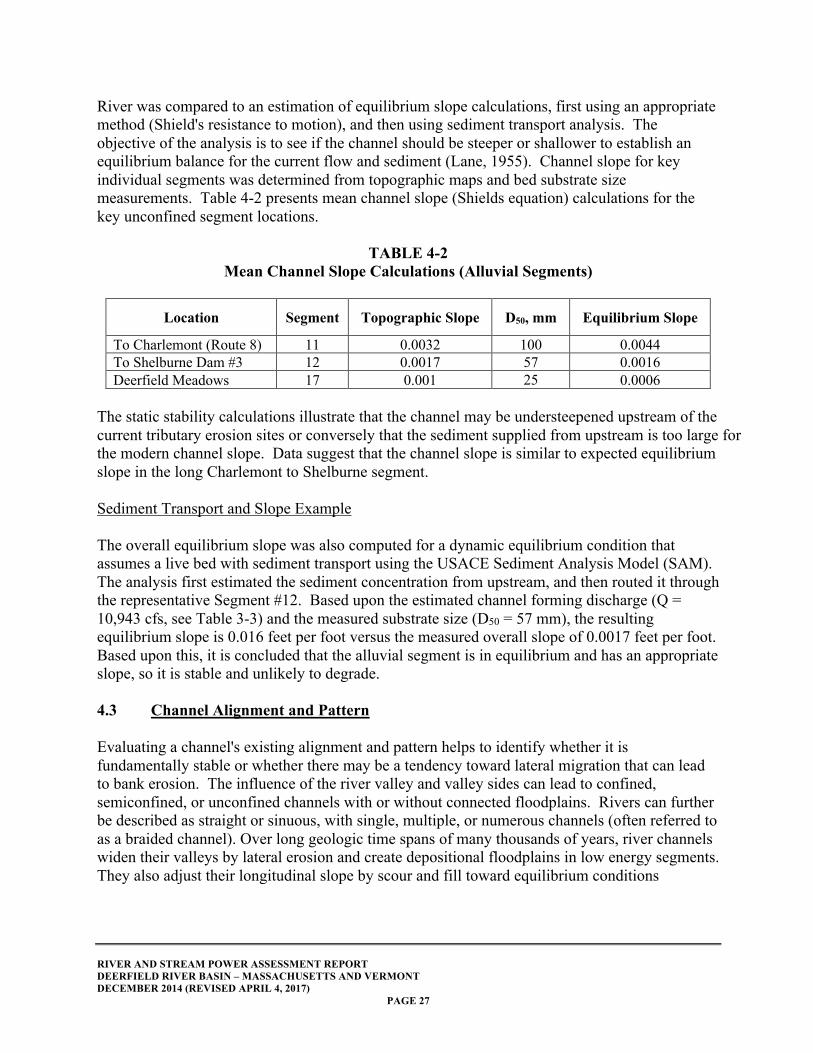
River was compared to an estimation of equilibrium slope calculations, first using an appropriate method (Shield's resistance to motion), and then using sediment transport analysis. The objective of the analysis is to see if the channel should be steeper or shallower to establish an equilibrium balance for the current flow and sediment (Lane, 1955). Channel slope for key individual segments was determined from topographic maps and bed substrate size measurements. Table 4-2 presents mean channel slope (Shields equation) calculations for the key unconfined segment locations.
TABLE 4-2 Mean Channel Slope Calculations (Alluvial Segments)
Location Segment Topographic Slope D50, mm Equilibrium Slope
To Charlemont (Route 8) 11 0.0032 100 0.0044 To Shelburne Dam #3 12 0.0017 57 0.0016 Deerfield Meadows 17 0.001 25 0.0006
The static stability calculations illustrate that the channel may be understeepened upstream of the current tributary erosion sites or conversely that the sediment supplied from upstream is too large for the modern channel slope. Data suggest that the channel slope is similar to expected equilibrium slope in the long Charlemont to Shelburne segment.
Sediment Transport and Slope Example
The overall equilibrium slope was also computed for a dynamic equilibrium condition that assumes a live bed with sediment transport using the USACE Sediment Analysis Model (SAM). The analysis first estimated the sediment concentration from upstream, and then routed it through the representative Segment #12. Based upon the estimated channel forming discharge (Q = 10,943 cfs, see Table 3-3) and the measured substrate size (D50 = 57 mm), the resulting equilibrium slope is 0.016 feet per foot versus the measured overall slope of 0.0017 feet per foot. Based upon this, it is concluded that the alluvial segment is in equilibrium and has an appropriate slope, so it is stable and unlikely to degrade. 4.3 Channel Alignment and Pattern Evaluating a channel's existing alignment and pattern helps to identify whether it is fundamentally stable or whether there may be a tendency toward lateral migration that can lead to bank erosion. The influence of the river valley and valley sides can lead to confined, semiconfined, or unconfined channels with or without connected floodplains. Rivers can further be described as straight or sinuous, with single, multiple, or numerous channels (often referred to as a braided channel). Over long geologic time spans of many thousands of years, river channels widen their valleys by lateral erosion and create depositional floodplains in low energy segments. They also adjust their longitudinal slope by scour and fill toward equilibrium conditions
RIVER AND STREAM POWER ASSESSMENT REPORT DEERFIELD RIVER BASIN – MASSACHUSETTS AND VERMONT DECEMBER 2014 (REVISED APRIL 4, 2017)
PAGE 28
influenced by flood discharge rates, valley slope, substrate size and type, roughness, and sediment loads. The Deerfield River is fully confined in many segments (1, 2, 3, 5, 6, 7, 9, 10, 14, 15, and 16 due to bedrock incision and gorges). Some segments are impounded by dams and are no longer a free-flowing channel. Segments 4, 8, 11, and 12 are semiconfined with limited narrow floodplains or on only one side. There are only two unconfined segments (17, 18), thus there are very limited areas with the potential for free meanders primarily near Old Deerfield Village. Confined and semiconfined channels are typical of geologically young landscapes with mountainous terrain where rivers and valley width have not segmented long-term equilibrium. Permanent human infrastructure in these confined river corridors is hydropower and impoundments. During floods, the Deerfield River is unable to modify its valley bottom and side walls, either laterally and longitudinally, in the confined segments due to bedrock and lack of alluvium. However, road fill at Zoar Gap can and does erode in floods due to artificial confinement. Portions of Cold River, North River, and Chickley River have high specific stream power and had extensive erosion during Hurricane Irene with local valley widening.
Deerfield Meadows (Stillwater Segment) The only fully unconfined alluvial channel segments along the main stem channel are at the Deerfield Meadows downstream of the I-91 bridge. Segments 17 and 18 have a large radius meandering channel with an active floodplain backed up by terraces (Rosgen Type C).
Predicting equilibrium and potential channel planform patterns is not a mature science; and the various methods are not always reliable, so we use a series of procedures. To address the essential question about whether this meandering segment is stable, potential channel patterns have been predicted using five methods, all assuming there is no channel confinement and that the river is free to adjust in its valley bottom. The two empirical methods employed, Church (2002) and Ferguson (1984), are based on field observations that updated and expanded earlier work by Leopold and Wolman (1957) that differentiated between meandering and braided channels as a function of the mean annual flood and slope. The third method is a deterministic sediment transport model by Chang (1988) that differentiates stream pattern as a function of slope, sediment size, and bankfull discharge. The fourth approach to predicting channel pattern was Kleinhans' (2010) analysis of channel pattern and slope as a function of stream power. The analyses were based on an estimated channel-forming discharge of 16,032 cfs (the 2-year flood as derived from West Deerfield stream gauge data, see Table 4-4) and a representative D50 sediment size of 50 millimeters (mm) for the active bedload.
The results of the two older empirical methods (Church, Ferguson) both inaccurately forecast a braided channel, which is usually straight when considered at the segment and valley scale. However, upstream dams reduce this river's sediment load, so braided channels at this location are most unlikely. Chang's sediment transport method correctly forecasts a meandering point bar
RIVER AND STREAM POWER ASSESSMENT REPORT DEERFIELD RIVER BASIN – MASSACHUSETTS AND VERMONT DECEMBER 2014 (REVISED APRIL 4, 2017)
PAGE 29
channel. The stream power-based Kleinhans' specific stream power method also predicts a moderately active meandering channel with scrolls. The newer River Styles channel pattern data focuses on the combination of confinement and stream power concepts. For Deerfield Meadows, the mean specific stream power for the 0.1 percent valley slope is a stream power of 68 watts/square meter. This is a relatively low value consistent with low-gradient sandy, stable meandering channels that are unlikely to have avulsions, consistent with research publications by Kleinhans and Chang. In summary, the stream power methods of predicting the channel pattern forecast that the natural channel form would tend toward moderately active meandering if not confined, and this matches the existing condition. However, the specific stream power is quite modest, so one would not expect rapid or dramatic channel adjustments even with increases in flow. This is confirmed by the river's mild response to Hurricane Irene, which caused little geomorphic change in the floodplain segments. Historic Channel Alignment Analysis It is common practice for geomorphic assessment to include a review of historic documents to help identify past river and land use trends, particularly for alluvial segments subject to migration. Historical meander patterns of the alluvial Deerfield Meadows segments were observed using aerial photographs and USGS topographic mapping. The USGS mapping at five time periods was reviewed including 1892, 1936, 1941, 1954, and the present series of maps. The 1892 USGS map has a contour interval of 20 feet using a mean sea level datum and a map scale of 1:62,500 (1 inch equals 1 mile). This map predates the current Route 5 and I-91, of course, but does depict early roads, buildings, and land features. The alignment of the Deerfield River across the Deerfield Meadows is very similar to the current conditions, except at the first big bend where an additional side channel (or canal) is present. Floodplain features are not shown. The 1936 USGS map is at a larger scale with 10-foot contour intervals. The channel alignment is similar to the present, with point bar chutes and islands. The floodplain features its oxbows and scroll lines. The subsequent USGS maps up to 1954 are essentially the same as the 1992 Google Earth aerial photograph. The September 2011 aerial photograph was taken shortly after Hurricane Irene and shows fresh, light-colored sediment deposits over the lower floodplain areas and reflected inundated accretion areas. Minor changes in the meander geometry are present but no avulsions or mass migration despite the huge flood flows. Similarly, the above documents show minor evolution of the big bars at the mouth of Cold River, Chickley River, below the Route 8 bridge, and the Dam #4 delta. No drastic geomorphic changes are evident at these points.
RIVER AND STREAM POWER ASSESSMENT REPORT DEERFIELD RIVER BASIN – MASSACHUSETTS AND VERMONT DECEMBER 2014 (REVISED APRIL 4, 2017)
PAGE 30
The historic photographs and maps provide valuable data but are not perfect due to challenges in comparative image overlaps and indexing. As a result, field observations that verify past channel or floodplain evidence are invaluable. 4.4 Bankfull Width Channel Dimensions The width of an alluvial channel measured at the elevation of the bankfull discharge provides guidance on the preferred size of regional self-formed channels that are in equilibrium. It is expected that undersized channels will tend to widen and that oversized channels (usually due to flood scour) will tend to narrow via deposition if excess coarse sediment is supplied. Semiconfined and confined channels that adjust their width via eroding into a terrace or valley wall can cause mass bank failures and will generate new sediment. Bankfull channel analysis was used to help assess whether the Deerfield River channel has an appropriate size for its channel-forming discharge. Bankfull width data is also used for planning the size of riparian buffer zones and conservation corridors for existing or future hydrologic conditions. The concept of having equilibrium bankfull channel dimensions such as regime relations (later called hydraulic geometry bankfull channel widths) was developed in India in the later 19th Century for unconfined canals and later applied to rivers in the United States and in Europe. Several methods are available to predict equilibrium dimensions including regime relations based on discharge rates and substrate, regional hydraulic geometry relations based on watershed area, multiparameter regression equations, and sediment transport relations. The theoretical approach to predicting the dimensions of a channel in equilibrium is to first estimate (or measure) the incoming sediment load from an upstream channel segment, then find the size of the downstream design segment channel that will convey both the sediment load and the discharge. The solution is accomplished by iteration or simultaneous equations, with the best solution being the one that conveys water and sediment most efficiently (with the least energy). For example, based upon the upstream segment geometry and bed material for Segment #12, the SAM solution has a bottom width of 87 feet and a depth of 14.1 feet. Assuming 2:1 side slopes similar to existing boulder edges, the width at bankfull is 143 feet for an unconfined segment. This is narrower than field conditions, suggesting that this example river reach has ample width. The bankfull channel widths along selected reaches of the Deerfield River and key tributaries were measured in the field with a handheld laser distance meter. Cross sections were selected at the free-flowing riffles or runs, preferably in less confined areas. Table 4-3 summarizes the measured bankfull channel widths and compares them with regional hydraulic geometry relations and regime equations (only at gauges). The regime equation is the Soar & Thorne (2001) calibrated version of the Lacey equation, using the channel forming discharge (bankfull or Q2) as its predictor.
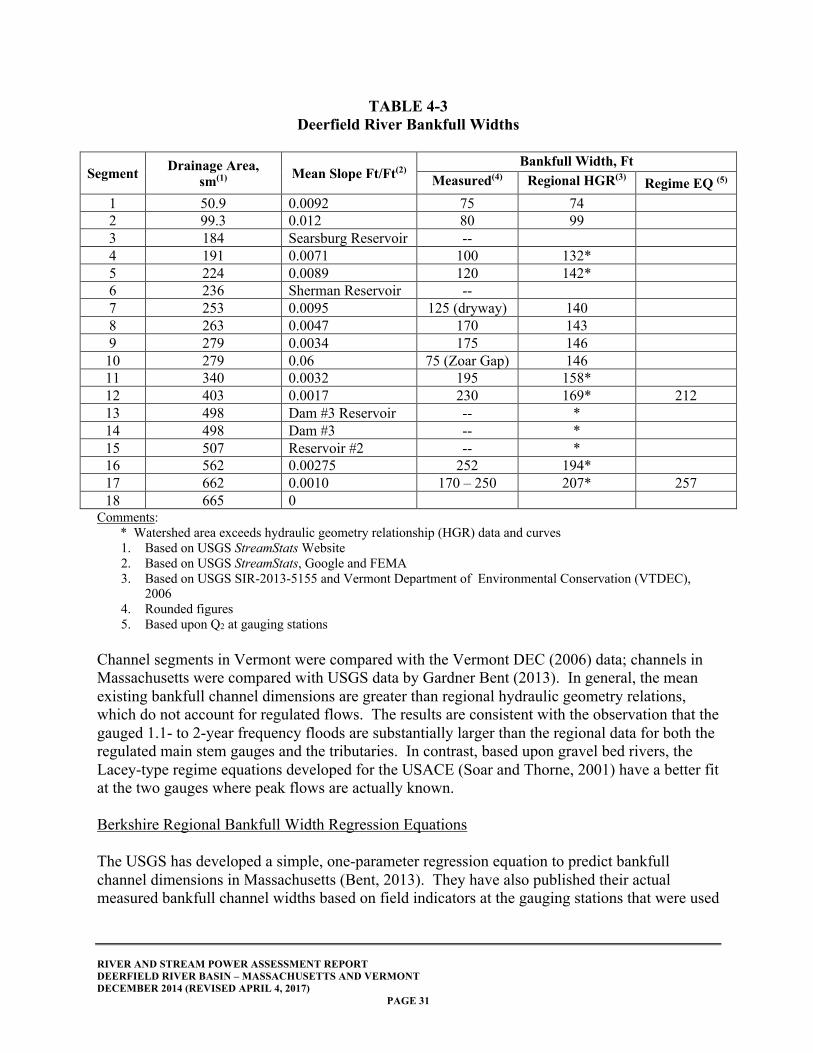
RIVER AND STREAM POWER ASSESSMENT REPORT DEERFIELD RIVER BASIN – MASSACHUSETTS AND VERMONT DECEMBER 2014 (REVISED APRIL 4, 2017)
PAGE 31
TABLE 4-3 Deerfield River Bankfull Widths
Segment Drainage Area, sm(1) Mean Slope Ft/Ft(2)
Bankfull Width, Ft Measured(4) Regional HGR(3) Regime EQ (5)
1 50.9 0.0092 75 74 2 99.3 0.012 80 99 3 184 Searsburg Reservoir -- 4 191 0.0071 100 132* 5 224 0.0089 120 142* 6 236 Sherman Reservoir -- 7 253 0.0095 125 (dryway) 140 8 263 0.0047 170 143 9 279 0.0034 175 146 10 279 0.06 75 (Zoar Gap) 146 11 340 0.0032 195 158* 12 403 0.0017 230 169* 212 13 498 Dam #3 Reservoir -- * 14 498 Dam #3 -- * 15 507 Reservoir #2 -- * 16 562 0.00275 252 194* 17 662 0.0010 170 – 250 207* 257 18 665 0
Comments: * Watershed area exceeds hydraulic geometry relationship (HGR) data and curves
1. Based on USGS StreamStats Website 2. Based on USGS StreamStats, Google and FEMA 3. Based on USGS SIR-2013-5155 and Vermont Department of Environmental Conservation (VTDEC),
2006 4. Rounded figures 5. Based upon Q2 at gauging stations
Channel segments in Vermont were compared with the Vermont DEC (2006) data; channels in Massachusetts were compared with USGS data by Gardner Bent (2013). In general, the mean existing bankfull channel dimensions are greater than regional hydraulic geometry relations, which do not account for regulated flows. The results are consistent with the observation that the gauged 1.1- to 2-year frequency floods are substantially larger than the regional data for both the regulated main stem gauges and the tributaries. In contrast, based upon gravel bed rivers, the Lacey-type regime equations developed for the USACE (Soar and Thorne, 2001) have a better fit at the two gauges where peak flows are actually known. Berkshire Regional Bankfull Width Regression Equations The USGS has developed a simple, one-parameter regression equation to predict bankfull channel dimensions in Massachusetts (Bent, 2013). They have also published their actual measured bankfull channel widths based on field indicators at the gauging stations that were used
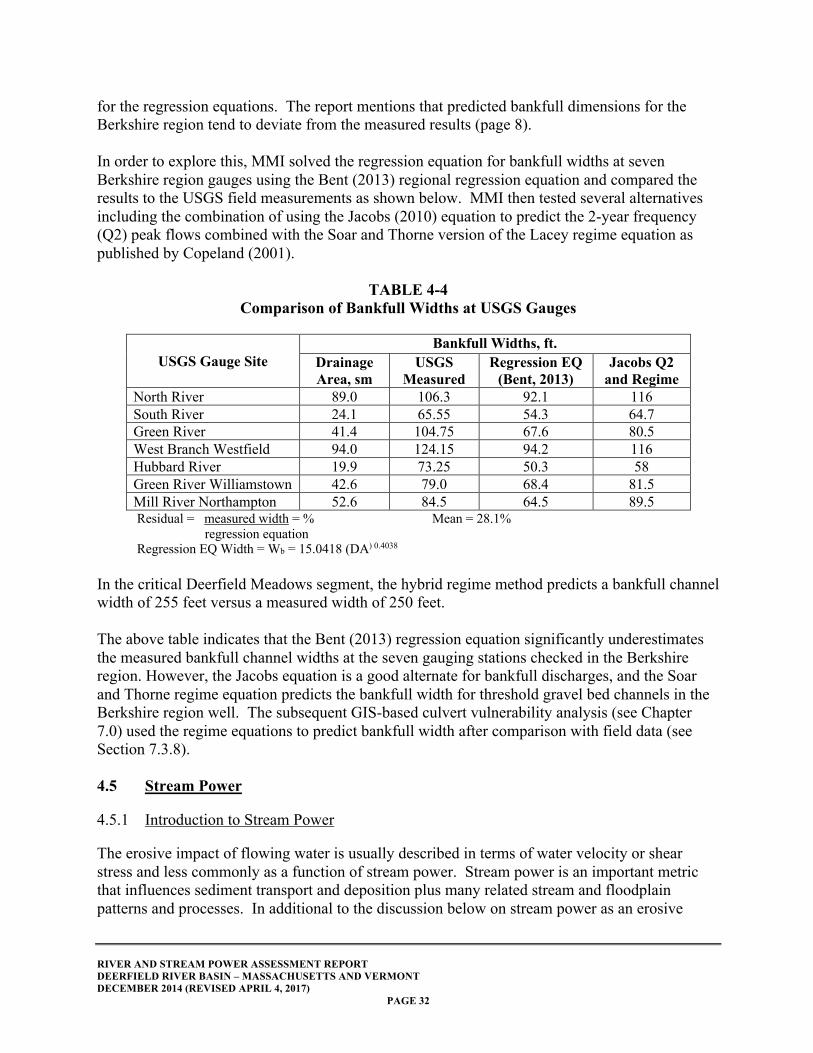
RIVER AND STREAM POWER ASSESSMENT REPORT DEERFIELD RIVER BASIN – MASSACHUSETTS AND VERMONT DECEMBER 2014 (REVISED APRIL 4, 2017)
PAGE 32
for the regression equations. The report mentions that predicted bankfull dimensions for the Berkshire region tend to deviate from the measured results (page 8). In order to explore this, MMI solved the regression equation for bankfull widths at seven Berkshire region gauges using the Bent (2013) regional regression equation and compared the results to the USGS field measurements as shown below. MMI then tested several alternatives including the combination of using the Jacobs (2010) equation to predict the 2-year frequency (Q2) peak flows combined with the Soar and Thorne version of the Lacey regime equation as published by Copeland (2001).
TABLE 4-4 Comparison of Bankfull Widths at USGS Gauges
USGS Gauge Site Bankfull Widths, ft.
Drainage Area, sm
USGS Measured
Regression EQ (Bent, 2013)
Jacobs Q2 and Regime
North River 89.0 106.3 92.1 116 South River 24.1 65.55 54.3 64.7 Green River 41.4 104.75 67.6 80.5 West Branch Westfield 94.0 124.15 94.2 116 Hubbard River 19.9 73.25 50.3 58 Green River Williamstown 42.6 79.0 68.4 81.5 Mill River Northampton 52.6 84.5 64.5 89.5
Residual = measured width = % Mean = 28.1% regression equation Regression EQ Width = Wb = 15.0418 (DA) 0.4038 In the critical Deerfield Meadows segment, the hybrid regime method predicts a bankfull channel width of 255 feet versus a measured width of 250 feet. The above table indicates that the Bent (2013) regression equation significantly underestimates the measured bankfull channel widths at the seven gauging stations checked in the Berkshire region. However, the Jacobs equation is a good alternate for bankfull discharges, and the Soar and Thorne regime equation predicts the bankfull width for threshold gravel bed channels in the Berkshire region well. The subsequent GIS-based culvert vulnerability analysis (see Chapter 7.0) used the regime equations to predict bankfull width after comparison with field data (see Section 7.3.8). 4.5 Stream Power 4.5.1 Introduction to Stream Power The erosive impact of flowing water is usually described in terms of water velocity or shear stress and less commonly as a function of stream power. Stream power is an important metric that influences sediment transport and deposition plus many related stream and floodplain patterns and processes. In additional to the discussion below on stream power as an erosive
RIVER AND STREAM POWER ASSESSMENT REPORT DEERFIELD RIVER BASIN – MASSACHUSETTS AND VERMONT DECEMBER 2014 (REVISED APRIL 4, 2017)
PAGE 33
force, it is discussed in Section 4.0 of this report with regard to predicting channel patterns and profiles types, in Section 5.0 in regard to floodplain classification, and in Section 7.0 concerning culvert vulnerability. Modern stream power channel classification systems include River Styles (2005) and Nanson and Croke (1994) for floodplains and the EU REFORM (2014) program. Our interest in stream power is stimulated by "observations that floods of similar magnitude and frequency sometimes produce surprisingly dissimilar geomorphic results" (Costa and O'Conner, 1995). MMI witnessed these same phenomena during Hurricane Irene in August 2011 where some Schoharie Creek (New York) and Deerfield River (Massachusetts) reaches conveyed huge flood flows with a frequency of 100 to 500 years with extensive inundation but limited damage while nearby confined reaches of Cold River that concentrated the flow suffered tremendous geomorphic adjustments and community damage. Despite over 50 years of periodic research, there is uncertainty in the scientific community to apply stream power for predicting future flood responses and for design of river channels and flood mitigation programs. This report attempts to advance stream power applications by compiling previous literature data plus new observations. Stream power is a function of just channel slope and discharge, so it is easy to determine, requiring less data than predicting velocity or shear stress. Bruce Rhoads (1987) commented on the confusing stream power terminology then in use and the need for consistent definitions. This report seeks to adhere to his recommended nomenclature. The general term "stream power" refers to the broad concept of work performed by flowing water moving down slope, in a qualitative sense. Total stream power is the rate of energy expenditure per unit length of channel at a cross section location. It is the amount of potential geomorphic work done by the weight of the water times the channel's vertical drop, defined using the metric power units of watts. TP= ϒQS ϒ = unit weight of water Q = discharge rate S = Channel slope The total stream power is the amount of work done per unit of time. It is the product of the fluid density, energy grade line slope, gravity acceleration, and water discharge rate. It may also be expressed as shear stress times velocity. In English units, the total stream power equation is the weight of flowing water per second: P = 62.4 QS, compared to the specific stream power per square foot, which is also the product of shear stress times velocity (T x vel), with the units of power per unit bed area. Stream power increases as the discharge rate or slope increases. Although discharges increase in the downstream direction, the total stream power may decrease because channel and valley slopes decrease downstream. The specific or mean stream power (SSP) is the total stream power at a cross section divided by the active channel (or flood) flow width, with the metric units of watts per square meter. It is usually computed for the bankfull or 1.5-year frequency flood (Petit, 2005) for the median
RIVER AND STREAM POWER ASSESSMENT REPORT DEERFIELD RIVER BASIN – MASSACHUSETTS AND VERMONT DECEMBER 2014 (REVISED APRIL 4, 2017)
PAGE 34
annual maximum flood (Barker, 2008) or the 2-year frequency flood (Bizzi, 2013), all of which are intended to approximate the channel-forming discharge. For large floods, the total stream power is divided by the flood flow width, often the floodplain width. The unit stream power is the power per unit weight of water. Bagnold (1960, 1966) introduced stream power in relation to the physics of sediment transport. His 1960 paper published by the USGS as Circular #421 provides the development of the stream power concept theory, claiming that sediment transport under steady state conditions requires continuous work, which equates to the rate of power expenditure supported by sediment transport tests and use of the famous Gilbert (1914) flume data in USGS paper 86. Bagnold also showed that transport rates matched stream power better than shear stress. After extensive flume experiments, Simons and Richardson were able to define the formation and properties of channel bedforms (ripples, dunes, antidunes, and flat beds) in alluvial sediments as a function of the particle's fall diameter and stream power, demonstrating how stream power transports sediment and alters bed resistance in sand (Vanoni, 1975). William Bull (1991) described general stream power as that available to transport sediment and that channel degradation will occur when stream power is sufficient to overcome resistance and transport bed material. At peak stream flows, the flow width will equal the valley floor width in degrading reaches. Bedload transport will diminish when stream power declines, leading to aggradation (Bull, 1991). The conceptual stream power theory is increasingly being used as a metric for initiation of motion, channel stability, and floodplain classification. It can be used as a substitute for or verification of the more common threshold velocity or shear stress analytical methods at a large scale. Among the channel processes and forms influenced by stream power are the planform pattern, profile type, sediment transport, channel equilibrium, and response to floods. The initial stream power in headwater reaches is low because of low flow rates, and downstream reaches may also have low stream power due to modest slopes. The highest total stream power levels are often found in the middle reaches, also known as the sediment transport zone. But there are many exceptions as channel gradients seldom decline at a uniform rate. Stream Power for Sediment Transport A suspended sediment transport equation was developed by Ted Yang (1972) based upon stream power, building upon the work of Bagnold. Yang first investigated and classified previous transport equations and concluded they were not universal in their application. Yang differed from Bagnold in that he addressed the unit stream power per pound of water and assumed that the suspended concentration was a function of the effective stream power, depth of water, and particle size. Yang defined his unit stream power as the product of the mean velocity and slope. Furthermore, the coefficients for depth and size had a narrow variation, and he successfully tested and verified his equation, which is still in use. Yang then developed a similar equation for the bedload transport of gravel (1984) and tested it with flume data. Yang later became chief of the Sedimentation Engineering Unit at the U.S. Bureau of Reclamation. Gomez and Church
RIVER AND STREAM POWER ASSESSMENT REPORT DEERFIELD RIVER BASIN – MASSACHUSETTS AND VERMONT DECEMBER 2014 (REVISED APRIL 4, 2017)
PAGE 35
(1989) tested sediment transport equations and found that those based upon stream power had the best results. Yang's transport equation is one of the options in SAM and Hydrologic Engineering Center's River Analysis System (HEC-RAS). Stream Power Computations A river's total stream power (TSP) can be easily computed from its gross characteristics of slope and discharge, so no hydraulic details are needed (Petit, 2005). Stream power is easily computed for open channels based upon the discharge and slope of uniform channels. The slope term is for the energy grade line, but when there is no hydraulic analysis available, the water profile or bed slope is used (Barker, 2008). Bed slopes may be determined from topography maps or digital elevation models (DEMs) and Light Detection and Ranging (LIDAR) remote sensing (Barker, 2008; Bizzi 2013). GIS applications are practical for large-scale analysis of entire watersheds, using the GIS to determine watershed areas and slope, then to compute hydrology from regional regression equations. Stream power is also computed by open channel software such as HEC-RAS and can be added to the output tables. The specific stream power (SSP) is the gross or total value divided by mean flow width. The bankfull channel width may be used, from regional hydraulic geometry relations (Bizzi, 2013). Narrow confined channels will thus have higher SSP than wider channels of the same slope and discharge. For large flood events, the SSP is the peak flow rate divided by the floodplain width. 4.5.2 Critical Specific Stream Power for Particles It is easy to compute stream power, but to be useful for river planning and design, one must be able to relate it to the critical threshold at which particle and general riverbed and perimeter movement begins. SSP can be used to define a critical power threshold of movement for sediment transport, and a general boundary threshold for channel stability. Several researches use maximum or minimum stream power as part of external hypothesis theories to solve channel geometry dimensions. Costa and O'Conner (1995) indicate that shear stress and stream power are indicators of the geomorphic work done by floods. But the effect of stream power is also influenced by the flood duration and the resistance of the landscape (Bull, 1979; Costa and O'Conner, 1995). High energy floods that have short duration such as thunderstorms have limited time to disrupt vegetated floodplains and scour underlying materials. So in order to apply the concept of stream power to actual predictions, one must understand both its driving force and resistance to the thresholds. Important information on depositional critical stream power levels comes from a series of paleo-hydrology studies of Pleistocene cataclysmic floods by glacial meltwaters. Costa (1983) provided a detailed paper on critical specific stream power while researching paleo-hydraulic floods in nine Colorado watersheds. The size of 75 alluvial sediment deposits moved by floods in confined channels, including boulders, was measured and compared to flood flow rates and
RIVER AND STREAM POWER ASSESSMENT REPORT DEERFIELD RIVER BASIN – MASSACHUSETTS AND VERMONT DECEMBER 2014 (REVISED APRIL 4, 2017)
PAGE 36
corresponding unit stream powers. This led to a simple regression equation for critical stream power in the following table, with both the best fit and envelop lines. This format has since been used by other researchers. Rathburn (1993) studied ancient floods at Big Lost River in central Idaho and used HEC-2 to predict SSP for erosion and deposition. Boulder deposits were found at under 600 W/M-2, loess hill streamlining at 600–1,000, and loess erosion at 100–600 W/M-2. The larger boulders (1.3- to 2.4-meter diameter) were deposited at 940–2,500 W/M-2. 4.5.3 Empirical Critical Specific Stream Power Equations The large-scale critical specific (unit) stream power in gravel bed rivers in central Europe was studied by Petit et al. (2005) and compared to the literature. They found that the critical value increased with the size of the river, which is attributed to increased bed form roughness in larger channels. Petit et al. (2005) conducted field experiments along gravel bed rivers, with slopes from 5 percent on headwaters to 0.2 percent and watersheds of 0.3 to 2,660 km2. Hundreds of painted rocks were placed on the bed and their movement observed after floods. Particle sizes ranged up to 230 mm. The ratio between the critical shear stress to the total shear stress was 0.3 in small headwaters and up to 0.5 for intermediate rivers. The Petit data suggests that smaller and steeper streams have higher critical thresholds due to increased form resistance that uses up stream power. For intermediate rivers with watersheds of 40 to 500 km2, the specific unit critical stream power was found to be: SPc = 0.13D 1.438 W/M2 D = mm The basic form of the critical power equation for particle movement is: SPc = AD50 B Critical unit power W per m2, D50 = mm
RIVER AND STREAM POWER ASSESSMENT REPORT DEERFIELD RIVER BASIN – MASSACHUSETTS AND VERMONT DECEMBER 2014 (REVISED APRIL 4, 2017)
PAGE 37
Data source Coefficient A Coefficient B D50 Size Range, mm Costa, 1983 0.009-0.03 1.69 50-1000 Williams, 1983 0.079 (no movement) 1.30 10-1500 2.9 (general movement) 1.30 O'Conner, 1993 0.1 (centimeters) 1.71 30-600 CM Jacob, 2003 0.025 1.647 700-2300 Gob, 2005 0.0253 1.62 900-2,000 Petit, 2005 0.13 1.438 20-150 Ferguson, 2005 0.0104 S-0.17 0.67 Mao, 2008 31.5 (small steep steams) 0.488 15-357
Costa, Williams, and Jacobs all studied very coarse substrates and had similar results. In comparing threshold results, Petit (2005), Ferguson (2005), and Mao (2008) all felt that steep, small streams with bedform resistance had higher stream power thresholds than the larger, smoother river beds, suggesting two classes of response (Petit, 2005). This condition was attributed to the particle hiding factor for mixed substrate sizes and the bed armor. The Williams (1983) field-measured stream data from Europe brackets the initial beginning of particle movement and the power at which general movement was found, recognizing that at the threshold only a few particles move. The range was attributed to variations in grain shape and weight, particle size distribution, packing density, and orientation. Similarly, Costa plotted one line that was the lower envelop threshold and then a best fit line on his figure 6. The SSP relations by Jacob (2003) and related work by Gobb (2005) are based upon lichenometric studies in France. They were able to date the age of boulder movement using the regional growth rate of certain lichens and then relate that to gauged flood flows. The assumption is that major floods remove lichens from mobile rocks, and the lichen age correlates to mobility dates. They were able to compute the SSP for large boulders up to 2 meters in diameter, with corresponding regression equations. The latter are consistent with Costa (1983) while extending the size range. 4.5.4 Critical Specific Stream Power and Channel Adjustments Stream power is a convenient metric to use for river assessments because it is easy to predict from the reaches' slope and discharge. However, the critical value at which particle and general
RIVER AND STREAM POWER ASSESSMENT REPORT DEERFIELD RIVER BASIN – MASSACHUSETTS AND VERMONT DECEMBER 2014 (REVISED APRIL 4, 2017)
PAGE 38
bed movement is initiated has not been fully defined. The absolute values of specific unit stream power that lead to geomorphic adjustments are believed to be a function of particle size, cohesion, cross-section characteristics, confinement, and alignment. In alluvial reaches, stream power thresholds depend on sediment properties of the bed and banks (Sear et al., 2010), which is similar to critical shear stress or velocity. The role of particle sizes in determining critical SSP is discussed by Carson (1984) in regard to channel pattern thresholds because it is the excess stream power that mobilizes sediment and leads to geomorphic changes in pattern, with freely meandering rivers found at SSP above 50 WM-2 and active braiding above 100 WM-2 for 25 mm size bed material. Stream power is just beginning to be used to help define channel patterns. Factors that affect critical stream power in rivers include particle size, cross-section expansions and width changes, river channel bends, and floodplain symmetry (Miller, 1990; Sear, 2010). Some of the highest SSPs are found during floods in narrow bedrock valleys and gorges due to their narrow widths, but geomorphic change may be minimal due to their bedrock and boulder resistance to erosion (Miller, 1990, 1995). Conversely, large rivers with high flood flows in their downstream reaches often have low gradients and broad floodplains, leading to low unit stream power. Channels with sandy bed material are most sensitive to stream power due to low thresholds of motion. River bends magnify local stream power as with shear stress. The stream power gradient along channels and floodplains was classified by Nanson and Croke (1992) (see Section 5.0). Their energy-based system extends from high SSPs to low power for confined, semiconfined, and unconfined valleys. They consider coarse, fine granular, and cohesive materials. Floodplains that rapidly widen and have reduced SSP are prone to deposition. For low-gradient channels, research in both Denmark and Great Britain found that unit stream powers of less than 35 watts per square meter (WM-2) for small streams were stable while channels with greater values were unstable (Brookes, 1987, 1988); however, the size and strength of the boundary material was not stated. In Illinois, the low-gradient postchannelization Kishwaukee River with an unconsolidated bed of silt, clay, and sand bed was stable with very low SSPs of 3.3 to 6.8 W/M2 while it meandered at SSPs of 10 to 20 W/M 2. Kochel (1988) indicates that bedload threshold conditions may only occur during great floods and discusses that influence during Hurricane Agnes in 1972. Significant erosion and floodplain scour was found in headwaters where coarse bedload was transported, but low-gradient floodplains rarely scoured. Rivers in humid climates recover rapidly after floods. Factors associated with dramatic response to floods include high gradients, coarse bedloads, and channel geometry. Miller (1990) studied stream power in regard to historic floods with extreme discharges in the central Appalachian mountain states including Hurricanes Agnes and Camille. Unit stream power was computed for 46 gauging stations, and the sites were rated for flood damage. Widespread erosion (scour, floodplain stripping, floodplain chutes, channel widening) occurred at stream power levels from 200 to 500 WM-2, with severe erosion above 300 WM-2. There was
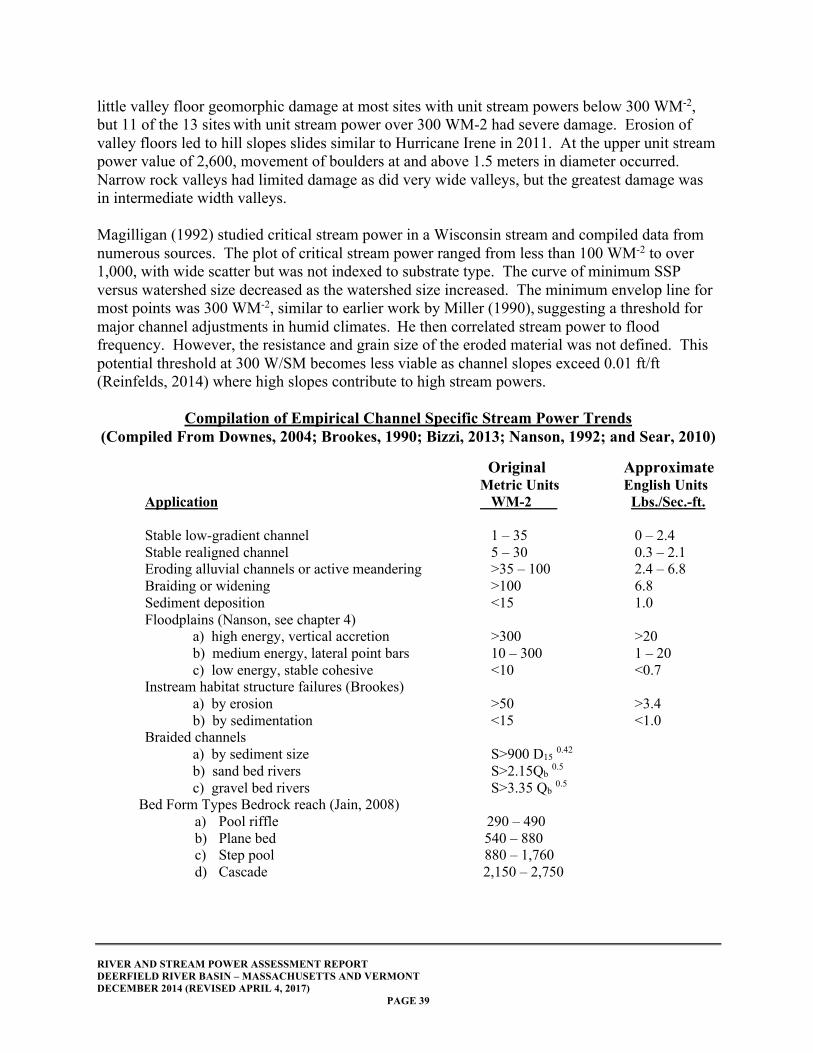
RIVER AND STREAM POWER ASSESSMENT REPORT DEERFIELD RIVER BASIN – MASSACHUSETTS AND VERMONT DECEMBER 2014 (REVISED APRIL 4, 2017)
PAGE 39
little valley floor geomorphic damage at most sites with unit stream powers below 300 WM-2, but 11 of the 13 sites with unit stream power over 300 WM-2 had severe damage. Erosion of valley floors led to hill slopes slides similar to Hurricane Irene in 2011. At the upper unit stream power value of 2,600, movement of boulders at and above 1.5 meters in diameter occurred. Narrow rock valleys had limited damage as did very wide valleys, but the greatest damage was in intermediate width valleys. Magilligan (1992) studied critical stream power in a Wisconsin stream and compiled data from numerous sources. The plot of critical stream power ranged from less than 100 WM-2 to over 1,000, with wide scatter but was not indexed to substrate type. The curve of minimum SSP versus watershed size decreased as the watershed size increased. The minimum envelop line for most points was 300 WM-2, similar to earlier work by Miller (1990), suggesting a threshold for major channel adjustments in humid climates. He then correlated stream power to flood frequency. However, the resistance and grain size of the eroded material was not defined. This potential threshold at 300 W/SM becomes less viable as channel slopes exceed 0.01 ft/ft (Reinfelds, 2014) where high slopes contribute to high stream powers.
Compilation of Empirical Channel Specific Stream Power Trends (Compiled From Downes, 2004; Brookes, 1990; Bizzi, 2013; Nanson, 1992; and Sear, 2010)
Original Approximate Metric Units English Units Application WM-2 Lbs./Sec.-ft. Stable low-gradient channel 1 – 35 0 – 2.4 Stable realigned channel 5 – 30 0.3 – 2.1 Eroding alluvial channels or active meandering >35 – 100 2.4 – 6.8 Braiding or widening >100 6.8 Sediment deposition <15 1.0 Floodplains (Nanson, see chapter 4) a) high energy, vertical accretion >300 >20 b) medium energy, lateral point bars 10 – 300 1 – 20 c) low energy, stable cohesive <10 <0.7 Instream habitat structure failures (Brookes) a) by erosion >50 >3.4 b) by sedimentation <15 <1.0 Braided channels a) by sediment size S>900 D15 0.42 b) sand bed rivers S>2.15Qb 0.5
c) gravel bed rivers S>3.35 Qb 0.5
Bed Form Types Bedrock reach (Jain, 2008) a) Pool riffle 290 – 490 b) Plane bed 540 – 880 c) Step pool 880 – 1,760 d) Cascade 2,150 – 2,750
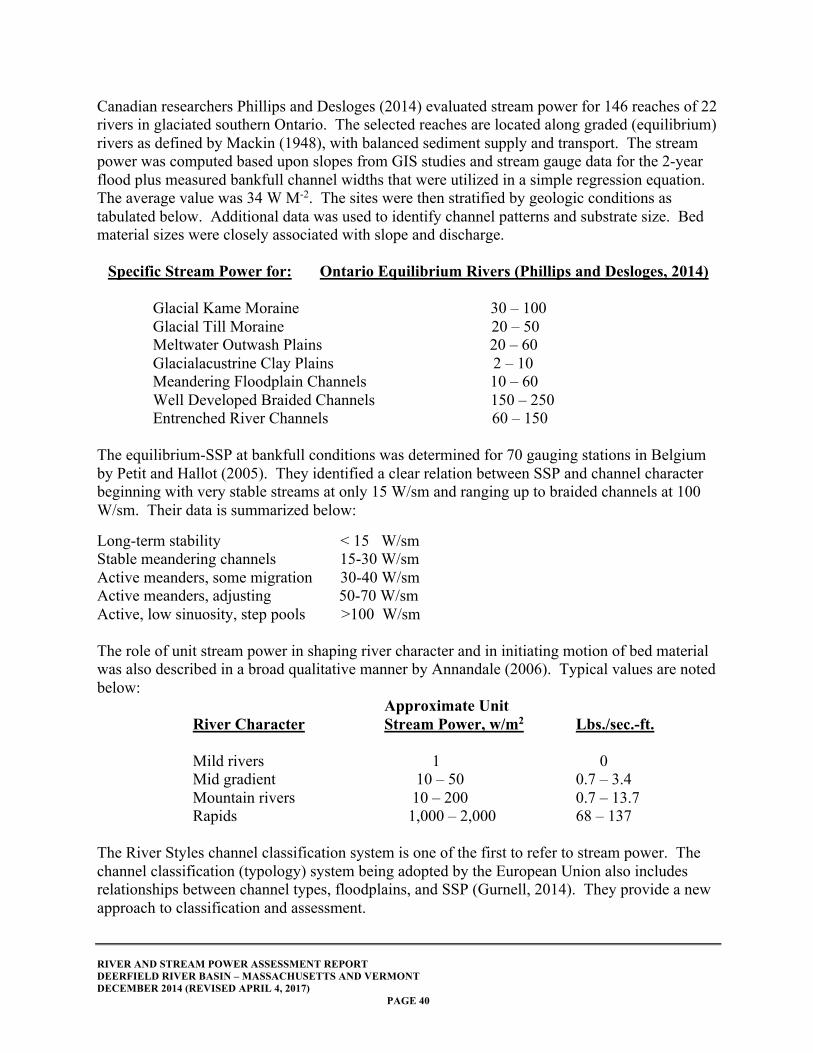
RIVER AND STREAM POWER ASSESSMENT REPORT DEERFIELD RIVER BASIN – MASSACHUSETTS AND VERMONT DECEMBER 2014 (REVISED APRIL 4, 2017)
PAGE 40
Canadian researchers Phillips and Desloges (2014) evaluated stream power for 146 reaches of 22 rivers in glaciated southern Ontario. The selected reaches are located along graded (equilibrium) rivers as defined by Mackin (1948), with balanced sediment supply and transport. The stream power was computed based upon slopes from GIS studies and stream gauge data for the 2-year flood plus measured bankfull channel widths that were utilized in a simple regression equation. The average value was 34 W M-2. The sites were then stratified by geologic conditions as tabulated below. Additional data was used to identify channel patterns and substrate size. Bed material sizes were closely associated with slope and discharge.
Specific Stream Power for: Ontario Equilibrium Rivers (Phillips and Desloges, 2014)
Glacial Kame Moraine 30 – 100 Glacial Till Moraine 20 – 50 Meltwater Outwash Plains 20 – 60 Glacialacustrine Clay Plains 2 – 10 Meandering Floodplain Channels 10 – 60 Well Developed Braided Channels 150 – 250 Entrenched River Channels 60 – 150 The equilibrium-SSP at bankfull conditions was determined for 70 gauging stations in Belgium by Petit and Hallot (2005). They identified a clear relation between SSP and channel character beginning with very stable streams at only 15 W/sm and ranging up to braided channels at 100 W/sm. Their data is summarized below: Long-term stability < 15 W/sm Stable meandering channels 15-30 W/sm Active meanders, some migration 30-40 W/sm Active meanders, adjusting 50-70 W/sm Active, low sinuosity, step pools >100 W/sm The role of unit stream power in shaping river character and in initiating motion of bed material was also described in a broad qualitative manner by Annandale (2006). Typical values are noted below: Approximate Unit River Character Stream Power, w/m2 Lbs./sec.-ft. Mild rivers 1 0 Mid gradient 10 – 50 0.7 – 3.4 Mountain rivers 10 – 200 0.7 – 13.7 Rapids 1,000 – 2,000 68 – 137 The River Styles channel classification system is one of the first to refer to stream power. The channel classification (typology) system being adopted by the European Union also includes relationships between channel types, floodplains, and SSP (Gurnell, 2014). They provide a new approach to classification and assessment.
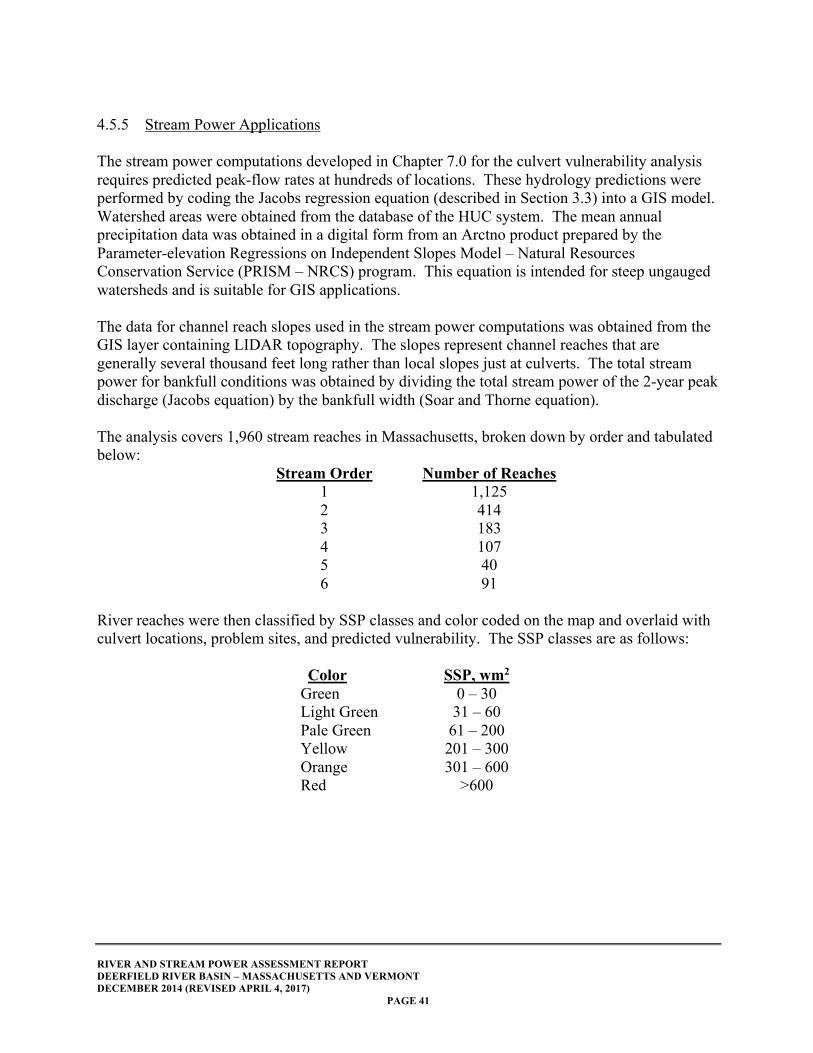
RIVER AND STREAM POWER ASSESSMENT REPORT DEERFIELD RIVER BASIN – MASSACHUSETTS AND VERMONT DECEMBER 2014 (REVISED APRIL 4, 2017)
PAGE 41
4.5.5 Stream Power Applications The stream power computations developed in Chapter 7.0 for the culvert vulnerability analysis requires predicted peak-flow rates at hundreds of locations. These hydrology predictions were performed by coding the Jacobs regression equation (described in Section 3.3) into a GIS model. Watershed areas were obtained from the database of the HUC system. The mean annual precipitation data was obtained in a digital form from an Arctno product prepared by the Parameter-elevation Regressions on Independent Slopes Model – Natural Resources Conservation Service (PRISM – NRCS) program. This equation is intended for steep ungauged watersheds and is suitable for GIS applications. The data for channel reach slopes used in the stream power computations was obtained from the GIS layer containing LIDAR topography. The slopes represent channel reaches that are generally several thousand feet long rather than local slopes just at culverts. The total stream power for bankfull conditions was obtained by dividing the total stream power of the 2-year peak discharge (Jacobs equation) by the bankfull width (Soar and Thorne equation). The analysis covers 1,960 stream reaches in Massachusetts, broken down by order and tabulated below:
Stream Order Number of Reaches 1 1,125 2 414 3 183 4 107 5 40 6 91
River reaches were then classified by SSP classes and color coded on the map and overlaid with culvert locations, problem sites, and predicted vulnerability. The SSP classes are as follows:
Color SSP, wm2 Green 0 – 30 Light Green 31 – 60 Pale Green 61 – 200 Yellow 201 – 300 Orange 301 – 600 Red >600
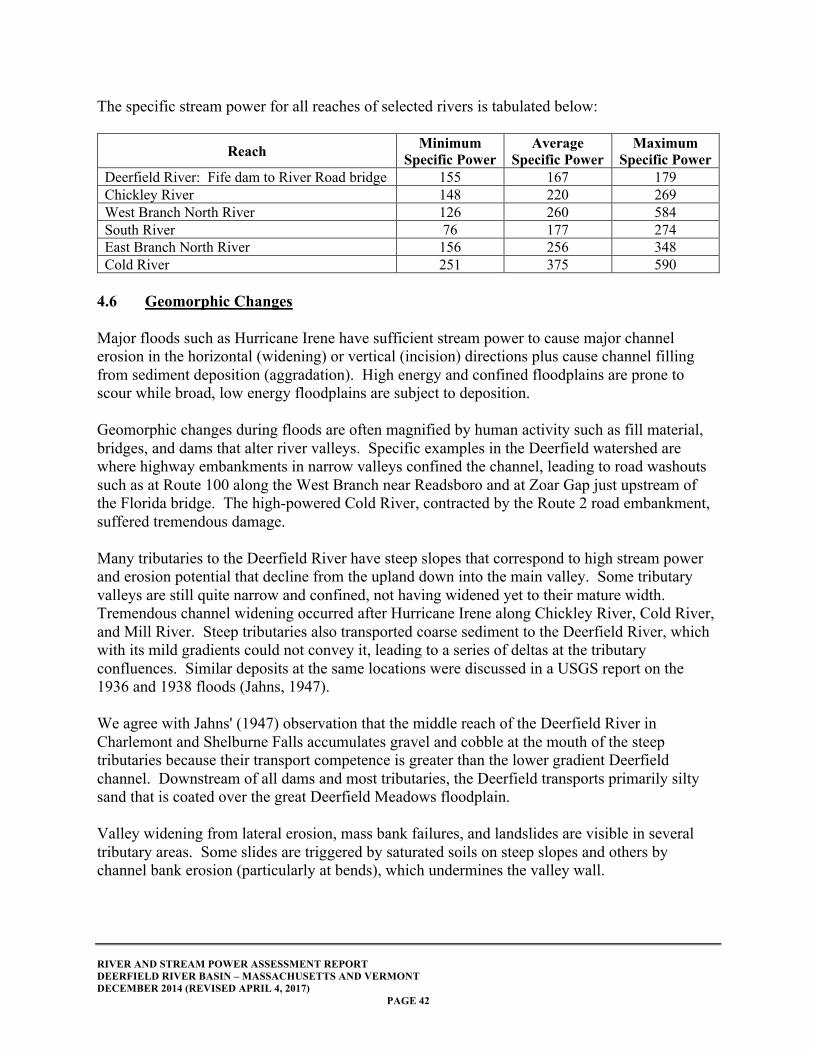
RIVER AND STREAM POWER ASSESSMENT REPORT DEERFIELD RIVER BASIN – MASSACHUSETTS AND VERMONT DECEMBER 2014 (REVISED APRIL 4, 2017)
PAGE 42
The specific stream power for all reaches of selected rivers is tabulated below:
Reach Minimum Specific Power
Average Specific Power
Maximum Specific Power
Deerfield River: Fife dam to River Road bridge 155 167 179 Chickley River 148 220 269 West Branch North River 126 260 584 South River 76 177 274 East Branch North River 156 256 348 Cold River 251 375 590
4.6 Geomorphic Changes Major floods such as Hurricane Irene have sufficient stream power to cause major channel erosion in the horizontal (widening) or vertical (incision) directions plus cause channel filling from sediment deposition (aggradation). High energy and confined floodplains are prone to scour while broad, low energy floodplains are subject to deposition. Geomorphic changes during floods are often magnified by human activity such as fill material, bridges, and dams that alter river valleys. Specific examples in the Deerfield watershed are where highway embankments in narrow valleys confined the channel, leading to road washouts such as at Route 100 along the West Branch near Readsboro and at Zoar Gap just upstream of the Florida bridge. The high-powered Cold River, contracted by the Route 2 road embankment, suffered tremendous damage. Many tributaries to the Deerfield River have steep slopes that correspond to high stream power and erosion potential that decline from the upland down into the main valley. Some tributary valleys are still quite narrow and confined, not having widened yet to their mature width. Tremendous channel widening occurred after Hurricane Irene along Chickley River, Cold River, and Mill River. Steep tributaries also transported coarse sediment to the Deerfield River, which with its mild gradients could not convey it, leading to a series of deltas at the tributary confluences. Similar deposits at the same locations were discussed in a USGS report on the 1936 and 1938 floods (Jahns, 1947). We agree with Jahns' (1947) observation that the middle reach of the Deerfield River in Charlemont and Shelburne Falls accumulates gravel and cobble at the mouth of the steep tributaries because their transport competence is greater than the lower gradient Deerfield channel. Downstream of all dams and most tributaries, the Deerfield transports primarily silty sand that is coated over the great Deerfield Meadows floodplain. Valley widening from lateral erosion, mass bank failures, and landslides are visible in several tributary areas. Some slides are triggered by saturated soils on steep slopes and others by channel bank erosion (particularly at bends), which undermines the valley wall.
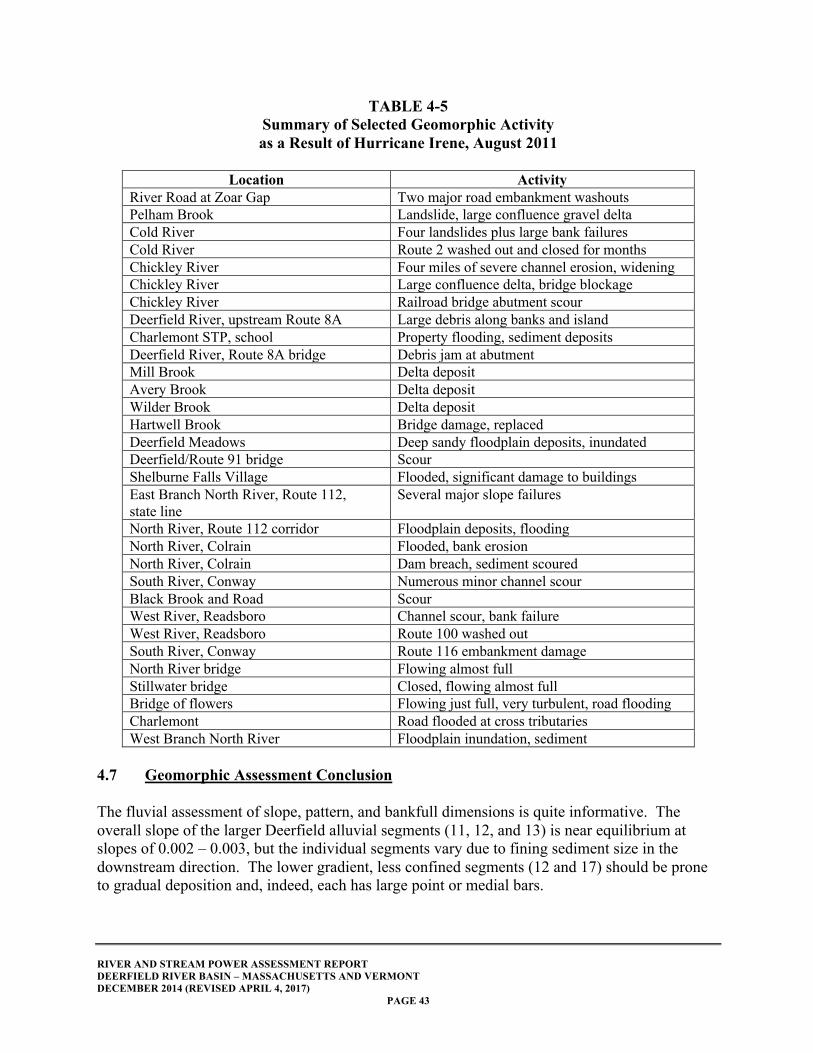
RIVER AND STREAM POWER ASSESSMENT REPORT DEERFIELD RIVER BASIN – MASSACHUSETTS AND VERMONT DECEMBER 2014 (REVISED APRIL 4, 2017)
PAGE 43
TABLE 4-5 Summary of Selected Geomorphic Activity as a Result of Hurricane Irene, August 2011
Location Activity
River Road at Zoar Gap Two major road embankment washouts Pelham Brook Landslide, large confluence gravel delta Cold River Four landslides plus large bank failures Cold River Route 2 washed out and closed for months Chickley River Four miles of severe channel erosion, widening Chickley River Large confluence delta, bridge blockage Chickley River Railroad bridge abutment scour Deerfield River, upstream Route 8A Large debris along banks and island Charlemont STP, school Property flooding, sediment deposits Deerfield River, Route 8A bridge Debris jam at abutment Mill Brook Delta deposit Avery Brook Delta deposit Wilder Brook Delta deposit Hartwell Brook Bridge damage, replaced Deerfield Meadows Deep sandy floodplain deposits, inundated Deerfield/Route 91 bridge Scour Shelburne Falls Village Flooded, significant damage to buildings East Branch North River, Route 112, state line
Several major slope failures
North River, Route 112 corridor Floodplain deposits, flooding North River, Colrain Flooded, bank erosion North River, Colrain Dam breach, sediment scoured South River, Conway Numerous minor channel scour Black Brook and Road Scour West River, Readsboro Channel scour, bank failure West River, Readsboro Route 100 washed out South River, Conway Route 116 embankment damage North River bridge Flowing almost full Stillwater bridge Closed, flowing almost full Bridge of flowers Flowing just full, very turbulent, road flooding Charlemont Road flooded at cross tributaries West Branch North River Floodplain inundation, sediment
4.7 Geomorphic Assessment Conclusion The fluvial assessment of slope, pattern, and bankfull dimensions is quite informative. The overall slope of the larger Deerfield alluvial segments (11, 12, and 13) is near equilibrium at slopes of 0.002 – 0.003, but the individual segments vary due to fining sediment size in the downstream direction. The lower gradient, less confined segments (12 and 17) should be prone to gradual deposition and, indeed, each has large point or medial bars.
RIVER AND STREAM POWER ASSESSMENT REPORT DEERFIELD RIVER BASIN – MASSACHUSETTS AND VERMONT DECEMBER 2014 (REVISED APRIL 4, 2017)
PAGE 44
The unconfined channel pattern in segment 17 was assessed using both empirical data and theoretical approaches. The estimated channel-forming discharge of 16,032 cfs and typical mean slope of 0.1 percent creates conditions commonly associated with a stable meandering channel type with little likelihood of avulsions. Stream power assessments confirm this. The regional regression equations for bankfull discharges and bankfull channel width both underestimate field measurements and local gauge data. This is likely due to the above average precipitation and runoff in the mountainous Berkshire region. However, the Jacobs regression equation is a good substitute for peak flows, and the Soar and Thorne regime equations predict bankfull width well for gravel bed threshold channels in the Berkshire region. The Deerfield River is remarkably stable compared to other mountain channels. The right column in Table 4-4 shows that the hybrid combination of the Jacobs (2010) Q2 and Soar and Thorne's (2001) regime equation provides the best estimate of bankfull channel widths.
RIVER AND STREAM POWER ASSESSMENT REPORT DEERFIELD RIVER BASIN – MASSACHUSETTS AND VERMONT DECEMBER 2014 (REVISED APRIL 4, 2017)
PAGE 45
5.0 FLOODPLAINS 5.1 Introduction Floodplains are a key element of the fluvial system and provide a blend of ecological and cultural functions. However, active floodplains are subject to periodic inundation, and both active and former floodplains (terraces) can be subject to erosion or deposition. They begin to form along rivers that have, or had, significant sediment loads and consist of excess sediment that is temporarily stored along and over the valley bottom in segments where the sediment supply exceeds the rate of sediment transport. Floodplains seldom form along headwater streams with steep valley slopes (greater than 0.02 feet per foot [ft/ft]), nor are they common in narrow gorges that concentrate flood flows and stream power. Discontinuous floodplain "pockets" may be formed along valley bottoms with variable width on one or both sides, becoming continuous in low gradient and wide valleys. Valley slopes less than 0.001 ft/ft result in sandy flat floodplains (Jain, Fryirs, and Brierley, 2008). Professionals have several approaches to defining and delineating floodplains. Geologists define floodplains as sedimentary deposits placed by rivers along the valley bottoms and subject to periodic inundations and reworking. Surficial geology maps that delineate glacial outwash, stratified drift, and alluvium are a watershed-wide clue to historic floodplain locations (see Figure 5-1). The famous American geologist, William Morris Davis, studied and wrote about landscape evolution long before current knowledge of tectonic uplift and plate movement. His geographical essays published in 1909 include a detailed chapter on the formation of postglacial New England floodplains and terraces long before modern hydraulic analysis of floodplains. He recognized that floodplain terraces are "river carved remnants of stratified clays, sands, or gravels that once occupied in larger volume than today the rock floored valleys of still earlier origin" (Davis, 1909, pp 516). The USDA-NRCS County Soil Surveys provide further details on poorly drained, very poorly drained, and alluvial soils (see Franklin County Soil Survey) that are associated with flooding. The steep, narrow valleys in Vermont have few geologic floodplains while narrow geologic floodplains in Massachusetts extend from the Cold River confluence to Shelburne Falls and in the Connecticut River Valley in Deerfield, Massachusetts. Hydrologists and hydraulic engineers define floodplains as flat and nearly flat plains subject to inundation by floods with a specific frequency of recurrence. The FEMA NFIP, FIS, refer to Flood Hazard Zones (FHZ) as a regulatory base flood that has a one percent chance of occurring each year, with a long-term statistical occurrence of once in 100 years. The FEMA FHZ is an area where hydraulic computations indicate a risk of flooding and are not limited to specific geologic formations. For example, the lower part of hillsides in a gorge may be floodprone and subject to periodic inundation but still lack a geologic floodplain or stratified drift or poorly drained soils due to scour.
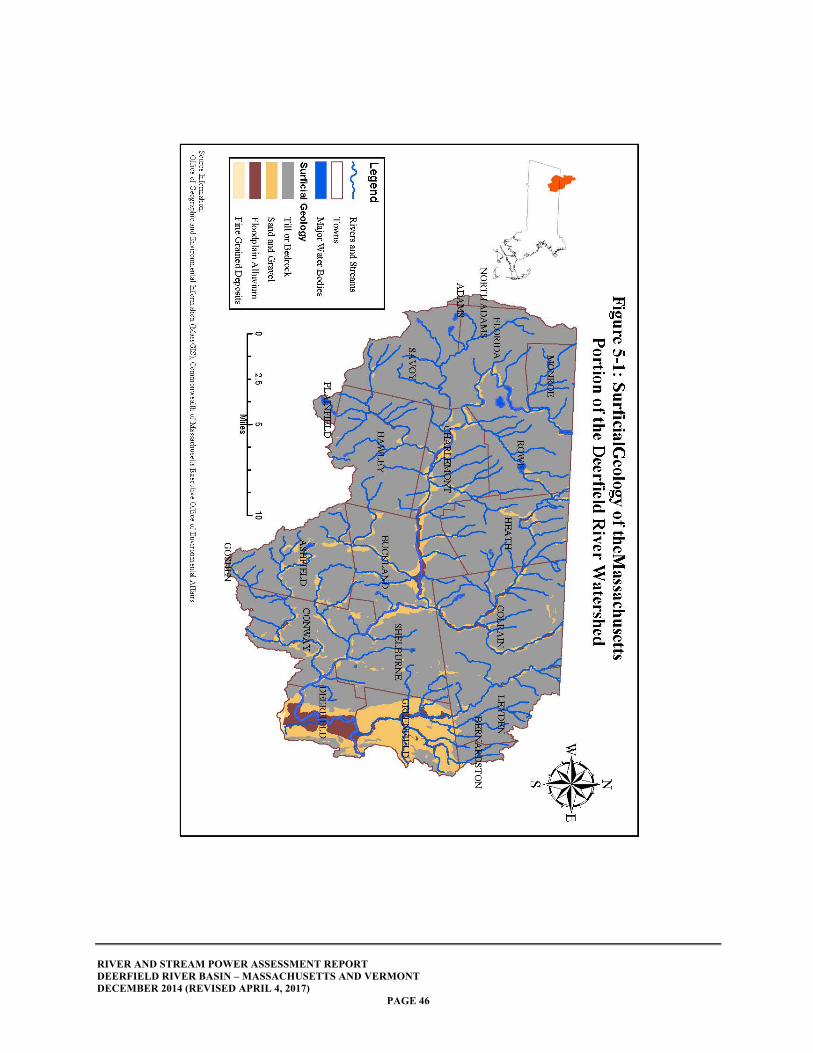
RIVER AND STREAM POWER ASSESSMENT REPORT DEERFIELD RIVER BASIN – MASSACHUSETTS AND VERMONT DECEMBER 2014 (REVISED APRIL 4, 2017)
PAGE 46
RIVER AND STREAM POWER ASSESSMENT REPORT DEERFIELD RIVER BASIN – MASSACHUSETTS AND VERMONT DECEMBER 2014 (REVISED APRIL 4, 2017)
PAGE 47
The hydraulic-based floodplain delineations assume channels have rigid boundaries and that they are not subject to avulsions or migration. In contrast, geologic maps of floodplains track historic evidence of past scour, fill, and migration. The geologic and FEMA methods of floodplain delineation do not account for future climate change and potential future floodplain expansion or channel realignment. Even early geologists such as Davis recognized that floodplains and terraces were dynamic features that responded to hydrologic and climate conditions. By the 1930s, it was also evident that human activities were influencing floodplains as well. The U.S. Soil Conservation Service was founded in 1935 as part of the Department of Agriculture, during the dust bowl. Its mission included control of soil erosion and selected watershed flood control. One of its first products was a detailed research project on stream and valley sedimentation including floodplains (Happ, 1940). The floodplain descriptions penned by Happ et al. are still in use today to classify floodplain deposits. The six original genetic types of deposits are listed below:
Floodplain Deposits
Colluvium deposits Vertical accretion deposits Lateral accretion deposits Floodplain splay deposits Channel fill deposits Channel lag deposits
Ecological Value Natural floodplains that are periodically inundated and subject to channel migration and avulsions are renewed by fresh sediment and grade adjustments. These dynamic processes contribute to the river corridor's habitat diversity, plants, and animals. The Deerfield River floodplains have a modified flood pulse and sediment load due to upstream dams, and the floodplains have largely been cleared. Consequently, their ecological role is also modified. The lower floodplains are frequently inundated and are often riparian wetlands. They may also have shallow groundwater, which further contributes to water-tolerant vegetation. 5.2 Flood Inundation Mapping In 2015 following Hurricane Irene and after the first draft of this report, the USGS issued flood inundation maps for two key reaches of the Deerfield River. These excellent quality digital maps are discussed in USGS Scientific Investigation Report 2015-5104 (Lombard and Bent, 2015) and are available on the web. The report describes the flood, and the maps depict the areas subject to inundation. The maps are prepared using conventional hydrologic methods. New stream cross sections were surveyed. Water profiles were computed with HEC-RAS and calibrated to high water marks.
RIVER AND STREAM POWER ASSESSMENT REPORT DEERFIELD RIVER BASIN – MASSACHUSETTS AND VERMONT DECEMBER 2014 (REVISED APRIL 4, 2017)
PAGE 48
The flood limits were then plotted on LIDAR topographic maps and digitized. The resulting maps are very informative and nonregulatory. But, at the same time, they focus on areas that largely already have FEMA FIS, and they do not include any specific recommendations for flood hazard reductions. Floodplain Services Along the Deerfield River, from the confluence with Cold Brook in West Charlemont at mile 29 to Shelburne Falls at mile 17, there are broad floodplains and terraces used by roadways, small villages, and for agriculture. Other significant floodplains are located along the North River and its East and West Branches and where the Deerfield River crosses into the Connecticut River Valley in the town of Deerfield downstream of I-91. Floodplains provide many essential hydrologic, ecologic, and cultural services and are a key component of our landscape. Floodplains are used extensively due to low gradients and nutrient-rich soils. Native Americans and early European colonists both used floodplains for agriculture. Today, many Deerfield River floodplains are used for corn production and cattle pastures. Many roads and railroads also use floodplains and terraces for transportation facilities.
Selected Floodplain Services and Functions
Hydrologic Ecological Cultural Store sediment Diverse habitat Agriculture Reduce peak flows Rare species Communities Recharge groundwater Nesting sites Transportation routes Convey floodwaters Riparian wetlands Historic sites
The Deerfield Meadows between Lower Road bridge and Route 5 are an active alluvial floodplain with rich alluvial soils, an important agricultural resource for Native Americans, early European colonists, and modern farmers. The Deerfield Meadows were discussed by Edward Hitchcock in his 1841 book Final Report on Geology of Massachusetts, which described alluvium up to 20 feet thick. There are four contributing geomorphic factors to this unusually large floodplain. First is the river's position lying over the earlier remnants of glacial Lake Hitchcock; second is the reduced gradient and sediment deposition as the river emerges from the deep gorge between Shelburne Falls and the former Lake Hitchcock; third is the hydraulic narrows around the north side of the trap rock Pocumtuck Mountain, which traps overbank flow on the floodplain; and forth is the reverse backwater from the Connecticut River.
RIVER AND STREAM POWER ASSESSMENT REPORT DEERFIELD RIVER BASIN – MASSACHUSETTS AND VERMONT DECEMBER 2014 (REVISED APRIL 4, 2017)
PAGE 49
5.3 High Water Marks and Historic Floods The oldest method of delineating floodprone areas and community planning is undoubtedly the observation of actual floods and their high water marks. For example, Old Deerfield Village is carefully situated on a terrace above the elevation of most floods. Floodplains may be identified by historic limits of inundation during great floods as recorded by news reports, photographs, elevation markers, and living memory. The high water marks, due to scour, debris, and sediment, may be plotted on topographic maps and connected along contours to determine water elevations. Flood limits are then interpreted between the high water marks to draw a flood inundation map. For example, high water marks from Hurricane Irene are still visible in the field, and many flood limits and sediment deposits are shown on Google aerial photographs taken shortly after the flood. During our fieldwork, several residents volunteered information on flood levels in Charlemont Center, Shelburne Falls, and Deerfield Meadows. Some floodplains are identified by the presence of hydrophytic vegetation, which tolerates saturated soils such as in modern soil surveys used for wetland delineation. 5.4 National Flood Insurance Program Floodplain Maps The NFIP was established by Congress in 1968 to mitigate future flood losses. The program was advocated by geographer Dr. Gilbert White from the University of Chicago who chaired a task force on federal Flood Control Policy. It is administered by FEMA and is the nation's primary source of floodplain mapping data. A major advance in floodplain management was Executive Order 11988 in 1977, requiring federal agencies to minimize direct and indirect support of floodplain development. As part of the flood insurance program, FEMA publishes flood hazard boundary maps (FHBM) that delineate areas subject to flooding by the 100-year frequency of recurrence base flood, which has a one percent chance each year. The maps are based on engineering studies with surveyed cross sections of the rivers, hydrology studies of peak flows (usually based upon gauging stations), and hydraulic analysis to compute floodwater profiles using one of a series of approved computer models such as HEC-2 or HEC-RAS. The computed water elevations are then plotted on topographic maps to delineate the floodplains, which become the basis of the FIRMs. The technical "standard step" procedures for computing floodwater profiles was developed in the 1930s, and the full protocol for delineating computed floodplain boundaries was issued 30 years later (Wiitala et al., 1961). Some early FEMA floodplain maps, plus maps in rural areas, have floodprone areas designated as "Zone A" based on approximate mapping, without detailed engineering computations. Zone A designations are based on flood history, topography, and other indirect data. The FEMA floodplain maps have numerous limitations as summarized below:
RIVER AND STREAM POWER ASSESSMENT REPORT DEERFIELD RIVER BASIN – MASSACHUSETTS AND VERMONT DECEMBER 2014 (REVISED APRIL 4, 2017)
PAGE 50
1. They are often based upon older hydrology data prior to their publication date and, in an era of land use and climate changes, they become outdated.
2. There are no normal provisions for addressing future hydrology conditions and floodplain expansion.
3. Development is still allowed within the floodplain fringe as long as certain buildings are
elevated. This encourages filling floodplains and reducing floodwater storage.
4. The NFIP does not address the ecological value of floodplains and wetlands.
5. The NFIP assumes channels and floodplains have rigid boundaries and that river dimensions are constant over time without migration or avulsion.
6. The FEMA NFIP studies identify and map flood hazards and provide recommended building and zoning criteria; they do not provide specific recommendations on reducing floodwater elevations or hazards.
In addition to mapping floodplains and predicting base floodwater elevations, FEMA studies tabulate floodway widths and the predicted flood flow velocities. 5.5 Surficial Geology Maps Surficial geology maps that delineate broad soil groups are available for many areas of the nation and depict the generic original of earth materials. Many have been prepared by USGS and its contracts and overlie the conventional quadrangle topographic maps. The maps typically identify surface bedrock exposures, glacial till, stratified (sand and gravel) deposits, and postglacial deposits of swamps, alluvium, beaches, and artificial fill. Many earlier maps have been digitized and matched together to create large area maps (see Figure 5-1). The stratified drift deposits are a useful guide to areas that were subject to glacial meltwater and, as such, they are more extensive than modern floodplains. The mapped alluvial soils cover a smaller area and are a subset of stratified drift, representing modern deposits that have been used to approximate current floodplains. The mapped alluvial soil deposits in the Deerfield River basin correspond well with the FEMA mapped floodplains. The identification of alluvium and stratified drift deposits on surficial geology maps can also be used as part of hydro-geomorphic classification systems to map both floodplains and ecological zones and their processes. Floodplain sites are mapped based upon Landform Sediment Assemblages (LSA) and related hydrology and vegetation to understand floodplain processes (Theiling et al.).
RIVER AND STREAM POWER ASSESSMENT REPORT DEERFIELD RIVER BASIN – MASSACHUSETTS AND VERMONT DECEMBER 2014 (REVISED APRIL 4, 2017)
PAGE 51
Principal sediment deposits and landforms include the following: Modern aquatic classes Active floodplain – poorly drained Active floodplain – well drained Paleo floodplain – poorly drained Paleo floodplain – well drained Natural levees Alluvial/colluvium aprons Sandy terraces The Natural Conservancy (TNC) Active River Area (Smith, 2008) uses some elements of the LSA approach together with GIS data on saturated soils and soils to map floodplains. 5.5.1 Local Floodplain Mapping The FEMA NFIP flood hazard maps for the various towns in the Deerfield River basin have been digitized by MMI and overlain on the GIS-based surficial geology maps in order to compare potential floodprone areas. The FEMA studies are variable; there are no studies for Monroe, Rowe, Florida, Savoy, Heath, Hawley, and Ashfield. However, all of these towns have mapped sand and gravel deposits that confirm postglacial flows and floods. In Monroe and Rowe, there is an obviously narrow band of floodprone land along the Deerfield River, but the narrow confined valley limits the formation and width of floodplains, and there are no FEMA maps. Significant sand and gravel deposits are mapped and observed in the field along the west bank in Florida near and downstream of the tunnel, but once again, there are no FEMA flood hazard maps. In Hawley, the floodprone Chickley River is not mapped by FEMA but does have geologic mapping of both alluvium and sand and gravel. The Chickley River had high velocity erosive flood flows during Hurricane Irene with road damage. The detailed floodplains mapped by FEMA in Deerfield, Buckland, and Charlemont agree closely with the geologic maps of alluvium while being much smaller than the mapped limits of sand and gravel. In Shelburne, no alluvium is mapped and only narrow bands of sand and gravel, which is consistent with field observations. In Colrain, there are FEMA mapped floodplains along the North River and its West Branch, fairly similar to geologic maps of alluvium. These floodplains are used extensively for agriculture and transportation corridors and were inundated by Hurricane Irene. Much of the town of Greenfield is mapped as having sand and gravel deposits from past glacier deposition. However, the FEMA mapped floodplain is limited, and the FEMA mapped floodplains more or less match the mapped modern alluvium. The exceptions are several small urban streams mapped by FEMA without the presence of alluvium.
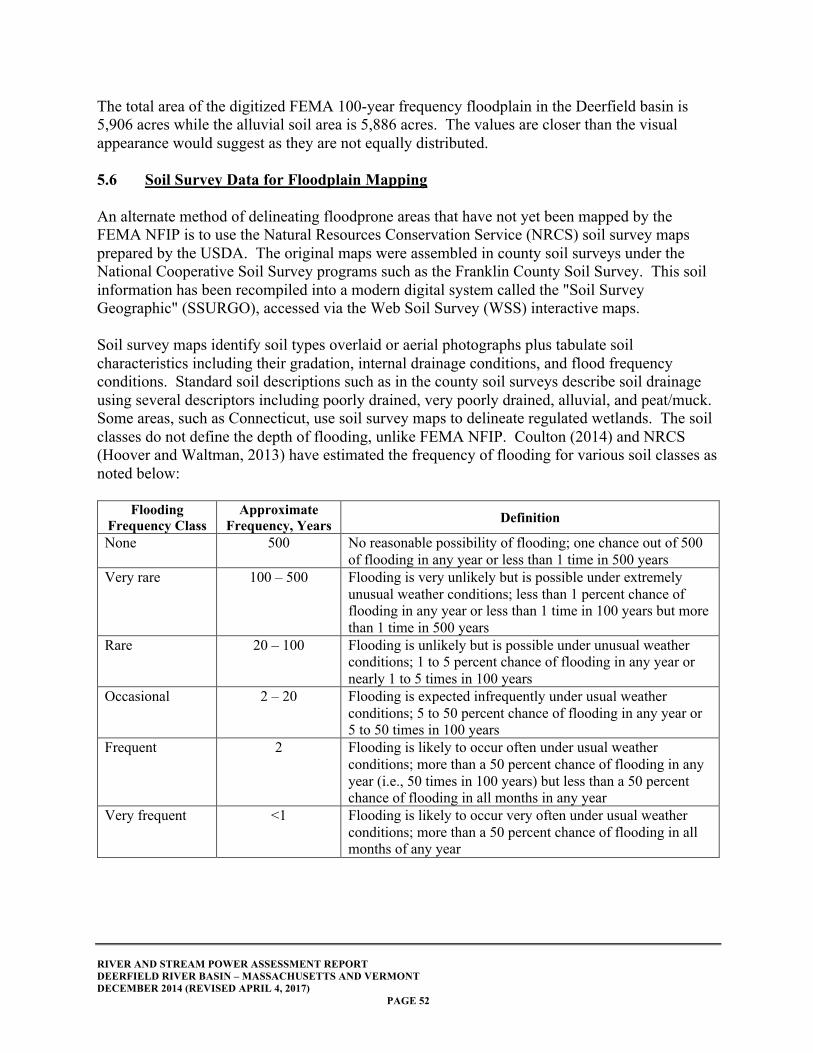
RIVER AND STREAM POWER ASSESSMENT REPORT DEERFIELD RIVER BASIN – MASSACHUSETTS AND VERMONT DECEMBER 2014 (REVISED APRIL 4, 2017)
PAGE 52
The total area of the digitized FEMA 100-year frequency floodplain in the Deerfield basin is 5,906 acres while the alluvial soil area is 5,886 acres. The values are closer than the visual appearance would suggest as they are not equally distributed. 5.6 Soil Survey Data for Floodplain Mapping An alternate method of delineating floodprone areas that have not yet been mapped by the FEMA NFIP is to use the Natural Resources Conservation Service (NRCS) soil survey maps prepared by the USDA. The original maps were assembled in county soil surveys under the National Cooperative Soil Survey programs such as the Franklin County Soil Survey. This soil information has been recompiled into a modern digital system called the "Soil Survey Geographic" (SSURGO), accessed via the Web Soil Survey (WSS) interactive maps. Soil survey maps identify soil types overlaid or aerial photographs plus tabulate soil characteristics including their gradation, internal drainage conditions, and flood frequency conditions. Standard soil descriptions such as in the county soil surveys describe soil drainage using several descriptors including poorly drained, very poorly drained, alluvial, and peat/muck. Some areas, such as Connecticut, use soil survey maps to delineate regulated wetlands. The soil classes do not define the depth of flooding, unlike FEMA NFIP. Coulton (2014) and NRCS (Hoover and Waltman, 2013) have estimated the frequency of flooding for various soil classes as noted below:
Flooding Frequency Class
Approximate Frequency, Years Definition
None 500 No reasonable possibility of flooding; one chance out of 500 of flooding in any year or less than 1 time in 500 years
Very rare 100 – 500 Flooding is very unlikely but is possible under extremely unusual weather conditions; less than 1 percent chance of flooding in any year or less than 1 time in 100 years but more than 1 time in 500 years
Rare 20 – 100 Flooding is unlikely but is possible under unusual weather conditions; 1 to 5 percent chance of flooding in any year or nearly 1 to 5 times in 100 years
Occasional 2 – 20 Flooding is expected infrequently under usual weather conditions; 5 to 50 percent chance of flooding in any year or 5 to 50 times in 100 years
Frequent 2 Flooding is likely to occur often under usual weather conditions; more than a 50 percent chance of flooding in any year (i.e., 50 times in 100 years) but less than a 50 percent chance of flooding in all months in any year
Very frequent <1 Flooding is likely to occur very often under usual weather conditions; more than a 50 percent chance of flooding in all months of any year
RIVER AND STREAM POWER ASSESSMENT REPORT DEERFIELD RIVER BASIN – MASSACHUSETTS AND VERMONT DECEMBER 2014 (REVISED APRIL 4, 2017)
PAGE 53
The evidence of flooding includes a combination of surficial evidence of inundation, subsoil conditions, and remote sensing. Hoover and Waltman (2013) from the USDA National Soil Survey Center list the following characteristics:
- Actual extent of flooded area - Flood debris and high water marks - Aerial photographs - Channels, oxbows, point bars, alluvial fans, meander scrolls, sloughs, natural levees, and
sand plains - Vegetation - Soil stratigraphy - Organic matter - Abrupt soil layers - Laboratory sieve tests and organic carbon
Comparisons between the FEMA NFIP flood rate maps of floodplains and the soils-based SSURGO maps have been made by the USGS (Noe, 2013) in the Chesapeake Bay region and in Indiana at Purdue University (Merwade, 2014). The USGS study concluded that the SSURGO flood frequency method can map floodplains that are not already covered by FEMA. The Purdue study prepared statewide floodplain maps and compared them to FEMA maps, where available, and was found to be a reasonable match. They offer an economical mapping process for use where FEMA maps are not available. There are a few limitations. For glaciated areas, some floodprone areas are well drained terrace soils that do not match the SSURGO criteria for poorly drained and alluvial soils. In addition, soils-based floodplain maps do not depict the elevation of floodwater or their velocity. Selected Floodplain Soils The Franklin County Soil Survey (USDA, 1967) includes maps and descriptions of all soils in the county and continues to be a valuable resource. Soil maps of the Deerfield River corridor delineate glacial outwash and alluvial soils that generally correspond to floodprone lands. In the central part of the watershed, soils along the Deerfield River are generally mapped as the Merrimac-Ondawa Association. Merrimac soils are well-drained sandy loams formed on glacial outwash terraces and plains while Ondawa soils are described as well-drained alluvial soils, typically flooded once every 1 to 5 years. Suncook and Agawam well-drained loamy sand soils are also found on bottom lands, particularly in Charlemont and Buckland, and in some places are flooded annually. The lower watershed includes the vast Deerfield Meadows floodplain, consisting largely of the very sandy loam Hadley soils. They are deep, well-drained deposits formed of recent alluvial sediments. Local farmers mentioned that Hurricane Irene plowed new sediments, ranging from a
RIVER AND STREAM POWER ASSESSMENT REPORT DEERFIELD RIVER BASIN – MASSACHUSETTS AND VERMONT DECEMBER 2014 (REVISED APRIL 4, 2017)
PAGE 54
few inches to a few feet thick while other deposits were excavated. Poorly drained Limerick soils are mapped along riverbanks and bars. 5.7 River Corridor Floodplain Mapping Geomorphic floodplains include land forms that have been created and shaped by fluvial processes during modern climate conditions including the active channel, floodplain, and lower terraces. The geomorphic floodplain incorporates the alluvial river meander zone across which channels have migrated and may again migrate over in the future. The location of the active river may change over time due to meander migration and avulsions, leaving floodplain features such as bars, chutes, oxbows, ridges, side channels, meander scars, backwater swamps, natural levees, and other scour or fill features. The outer limit of the land over which the river has migrated is called the meander belt. It is assumed that over long periods of time the river may reoccupy any part of the meander belt. The meander belt widths are a function of channel characteristics (bankfull width, radius of meander curvature, meander length, etc.) plus local soils, topography, and vegetation. Several states and nations have developed specific techniques for delineating migration zones as described below. The greatest limitation is that they are based upon the past hydrology, not the future. Vermont Floodprone River Corridors Mapping Several regions of the United States and Europe have adopted the delineation of floodprone river corridors to supplement traditional hydraulic-based floodplain mapping. The primary goal is to predict an active river corridor that defines potential river migration zones along unconfined channels to depict where meandering rivers may adjust their alignment. Vermont defines river corridors as an area around the present channel where fluvial erosion, channel evolution, and down valley meander migration are most likely to occur. The resulting river corridor is generally wider than conventional FEMA-designated floodplains, which are assumed to be stationary and do not allow for channel migration. The best regional example is the Vermont Fluvial Erosion Hazard Mapping program (FHM). It is based upon the State of Vermont's Phase 1 and Phase 2 geomorphic assessments that use Rosgen channel classifications. The channel's bankfull width is determined, and the river is classified by type and condition. For alluvial meandering rivers, a virtual centerline is drawn through the crossover point between meander bends. Channel sensitivity ratings are then assigned by river type and condition and are used to select corresponding potential meander belt widths. The latter typically range from one to six times the equilibrium reference channel width and are drawn on a topographic map considering floodplain features. This procedure maps the probable floodprone corridor but does not provide floodwater elevations or flood risks. As with other approximate methods, it is not based upon hydrologic data and has no provisions for
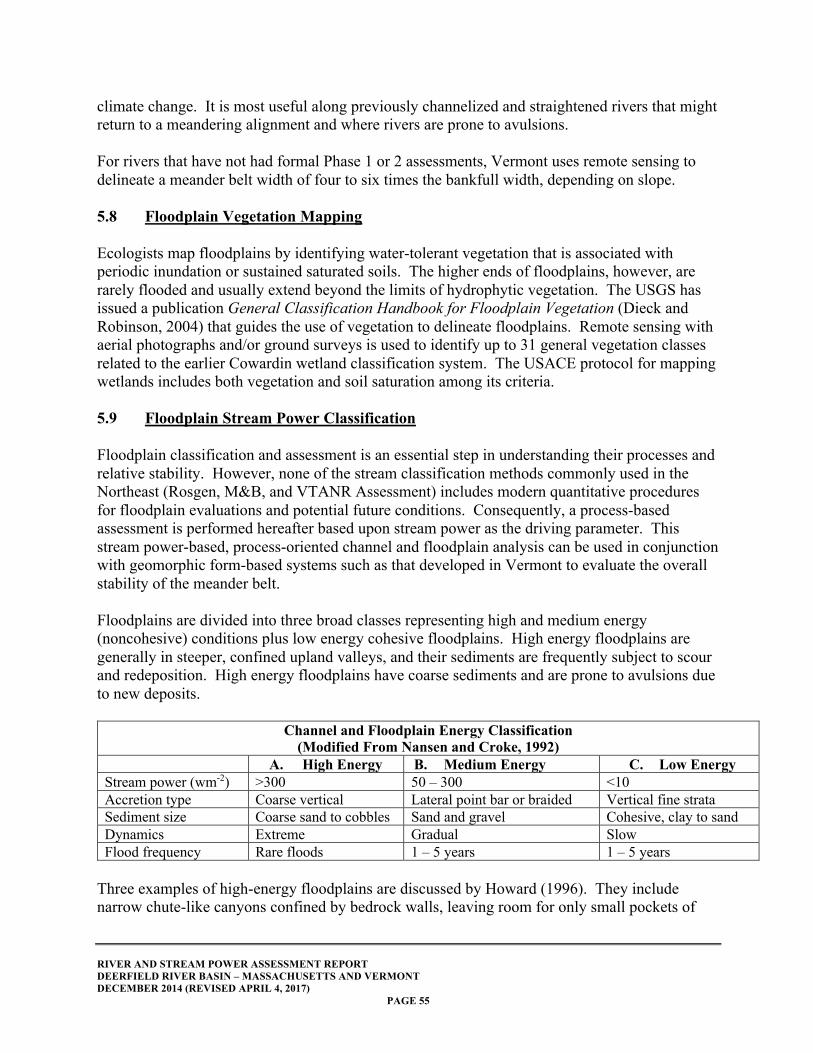
RIVER AND STREAM POWER ASSESSMENT REPORT DEERFIELD RIVER BASIN – MASSACHUSETTS AND VERMONT DECEMBER 2014 (REVISED APRIL 4, 2017)
PAGE 55
climate change. It is most useful along previously channelized and straightened rivers that might return to a meandering alignment and where rivers are prone to avulsions. For rivers that have not had formal Phase 1 or 2 assessments, Vermont uses remote sensing to delineate a meander belt width of four to six times the bankfull width, depending on slope. 5.8 Floodplain Vegetation Mapping Ecologists map floodplains by identifying water-tolerant vegetation that is associated with periodic inundation or sustained saturated soils. The higher ends of floodplains, however, are rarely flooded and usually extend beyond the limits of hydrophytic vegetation. The USGS has issued a publication General Classification Handbook for Floodplain Vegetation (Dieck and Robinson, 2004) that guides the use of vegetation to delineate floodplains. Remote sensing with aerial photographs and/or ground surveys is used to identify up to 31 general vegetation classes related to the earlier Cowardin wetland classification system. The USACE protocol for mapping wetlands includes both vegetation and soil saturation among its criteria. 5.9 Floodplain Stream Power Classification Floodplain classification and assessment is an essential step in understanding their processes and relative stability. However, none of the stream classification methods commonly used in the Northeast (Rosgen, M&B, and VTANR Assessment) includes modern quantitative procedures for floodplain evaluations and potential future conditions. Consequently, a process-based assessment is performed hereafter based upon stream power as the driving parameter. This stream power-based, process-oriented channel and floodplain analysis can be used in conjunction with geomorphic form-based systems such as that developed in Vermont to evaluate the overall stability of the meander belt. Floodplains are divided into three broad classes representing high and medium energy (noncohesive) conditions plus low energy cohesive floodplains. High energy floodplains are generally in steeper, confined upland valleys, and their sediments are frequently subject to scour and redeposition. High energy floodplains have coarse sediments and are prone to avulsions due to new deposits.
Channel and Floodplain Energy Classification (Modified From Nansen and Croke, 1992)
A. High Energy B. Medium Energy C. Low Energy Stream power (wm-2) >300 50 – 300 <10 Accretion type Coarse vertical Lateral point bar or braided Vertical fine strata Sediment size Coarse sand to cobbles Sand and gravel Cohesive, clay to sand Dynamics Extreme Gradual Slow Flood frequency Rare floods 1 – 5 years 1 – 5 years
Three examples of high-energy floodplains are discussed by Howard (1996). They include narrow chute-like canyons confined by bedrock walls, leaving room for only small pockets of
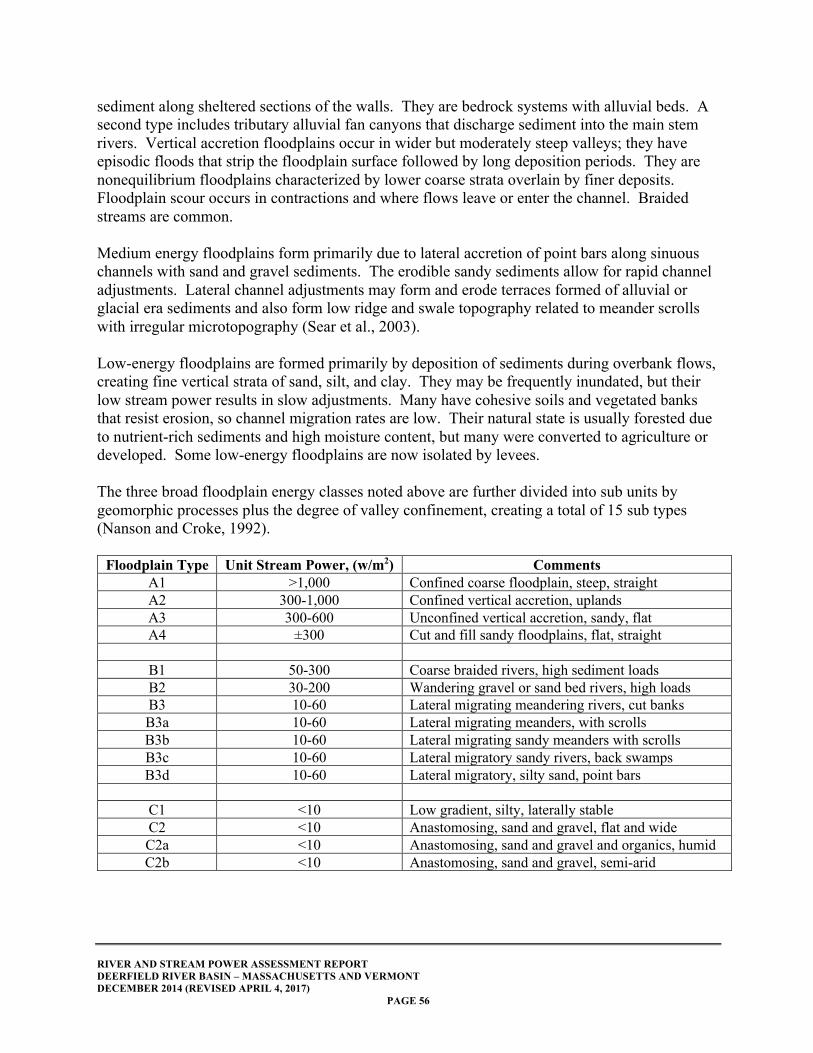
RIVER AND STREAM POWER ASSESSMENT REPORT DEERFIELD RIVER BASIN – MASSACHUSETTS AND VERMONT DECEMBER 2014 (REVISED APRIL 4, 2017)
PAGE 56
sediment along sheltered sections of the walls. They are bedrock systems with alluvial beds. A second type includes tributary alluvial fan canyons that discharge sediment into the main stem rivers. Vertical accretion floodplains occur in wider but moderately steep valleys; they have episodic floods that strip the floodplain surface followed by long deposition periods. They are nonequilibrium floodplains characterized by lower coarse strata overlain by finer deposits. Floodplain scour occurs in contractions and where flows leave or enter the channel. Braided streams are common. Medium energy floodplains form primarily due to lateral accretion of point bars along sinuous channels with sand and gravel sediments. The erodible sandy sediments allow for rapid channel adjustments. Lateral channel adjustments may form and erode terraces formed of alluvial or glacial era sediments and also form low ridge and swale topography related to meander scrolls with irregular microtopography (Sear et al., 2003). Low-energy floodplains are formed primarily by deposition of sediments during overbank flows, creating fine vertical strata of sand, silt, and clay. They may be frequently inundated, but their low stream power results in slow adjustments. Many have cohesive soils and vegetated banks that resist erosion, so channel migration rates are low. Their natural state is usually forested due to nutrient-rich sediments and high moisture content, but many were converted to agriculture or developed. Some low-energy floodplains are now isolated by levees. The three broad floodplain energy classes noted above are further divided into sub units by geomorphic processes plus the degree of valley confinement, creating a total of 15 sub types (Nanson and Croke, 1992).
Floodplain Type Unit Stream Power, (w/m2) Comments A1 >1,000 Confined coarse floodplain, steep, straight A2 300-1,000 Confined vertical accretion, uplands A3 300-600 Unconfined vertical accretion, sandy, flat A4 ±300 Cut and fill sandy floodplains, flat, straight
B1 50-300 Coarse braided rivers, high sediment loads B2 30-200 Wandering gravel or sand bed rivers, high loads B3 10-60 Lateral migrating meandering rivers, cut banks B3a 10-60 Lateral migrating meanders, with scrolls B3b 10-60 Lateral migrating sandy meanders with scrolls B3c 10-60 Lateral migratory sandy rivers, back swamps B3d 10-60 Lateral migratory, silty sand, point bars
C1 <10 Low gradient, silty, laterally stable C2 <10 Anastomosing, sand and gravel, flat and wide C2a <10 Anastomosing, sand and gravel and organics, humid C2b <10 Anastomosing, sand and gravel, semi-arid
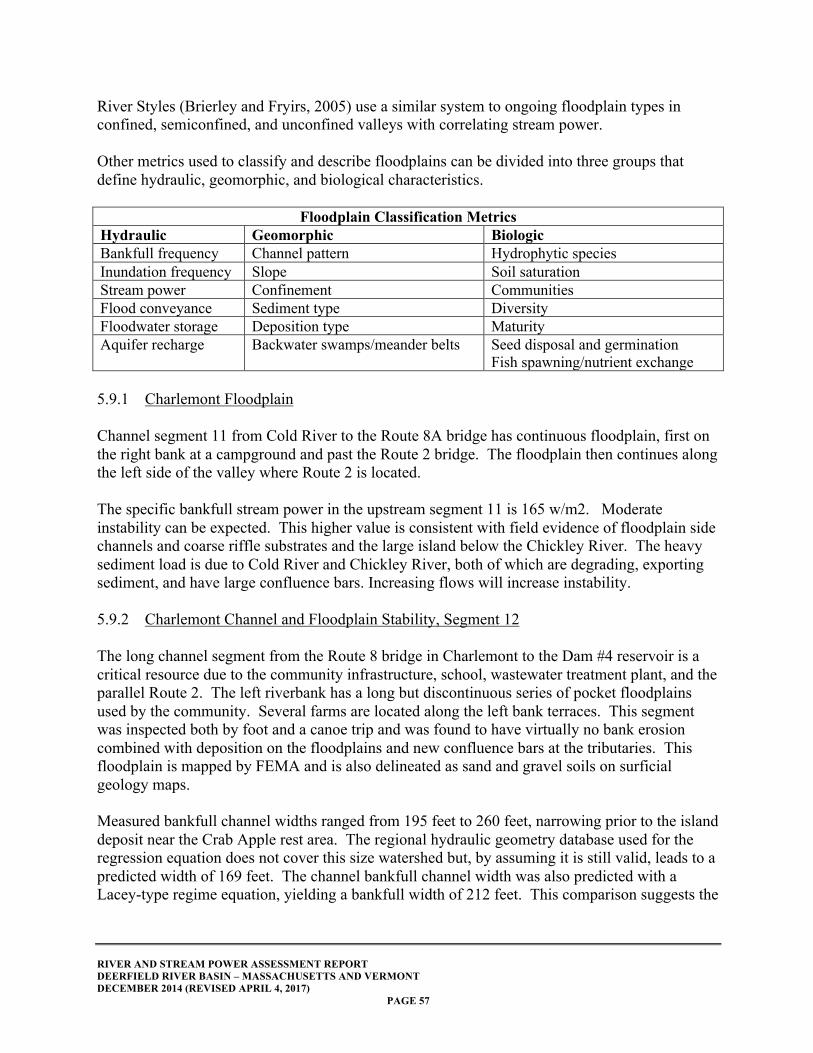
RIVER AND STREAM POWER ASSESSMENT REPORT DEERFIELD RIVER BASIN – MASSACHUSETTS AND VERMONT DECEMBER 2014 (REVISED APRIL 4, 2017)
PAGE 57
River Styles (Brierley and Fryirs, 2005) use a similar system to ongoing floodplain types in confined, semiconfined, and unconfined valleys with correlating stream power. Other metrics used to classify and describe floodplains can be divided into three groups that define hydraulic, geomorphic, and biological characteristics.
Floodplain Classification Metrics Hydraulic Geomorphic Biologic Bankfull frequency Channel pattern Hydrophytic species Inundation frequency Slope Soil saturation Stream power Confinement Communities Flood conveyance Sediment type Diversity Floodwater storage Deposition type Maturity Aquifer recharge Backwater swamps/meander belts Seed disposal and germination
Fish spawning/nutrient exchange 5.9.1 Charlemont Floodplain Channel segment 11 from Cold River to the Route 8A bridge has continuous floodplain, first on the right bank at a campground and past the Route 2 bridge. The floodplain then continues along the left side of the valley where Route 2 is located. The specific bankfull stream power in the upstream segment 11 is 165 w/m2. Moderate instability can be expected. This higher value is consistent with field evidence of floodplain side channels and coarse riffle substrates and the large island below the Chickley River. The heavy sediment load is due to Cold River and Chickley River, both of which are degrading, exporting sediment, and have large confluence bars. Increasing flows will increase instability. 5.9.2 Charlemont Channel and Floodplain Stability, Segment 12 The long channel segment from the Route 8 bridge in Charlemont to the Dam #4 reservoir is a critical resource due to the community infrastructure, school, wastewater treatment plant, and the parallel Route 2. The left riverbank has a long but discontinuous series of pocket floodplains used by the community. Several farms are located along the left bank terraces. This segment was inspected both by foot and a canoe trip and was found to have virtually no bank erosion combined with deposition on the floodplains and new confluence bars at the tributaries. This floodplain is mapped by FEMA and is also delineated as sand and gravel soils on surficial geology maps. Measured bankfull channel widths ranged from 195 feet to 260 feet, narrowing prior to the island deposit near the Crab Apple rest area. The regional hydraulic geometry database used for the regression equation does not cover this size watershed but, by assuming it is still valid, leads to a predicted width of 169 feet. The channel bankfull channel width was also predicted with a Lacey-type regime equation, yielding a bankfull width of 212 feet. This comparison suggests the
RIVER AND STREAM POWER ASSESSMENT REPORT DEERFIELD RIVER BASIN – MASSACHUSETTS AND VERMONT DECEMBER 2014 (REVISED APRIL 4, 2017)
PAGE 58
channel has excessive width, which is consistent with the minimal erosion during Hurricane Irene. The overbank floodplain is up to 500 feet wide. A sediment transport-based optimization model was also used to predict channel characteristics based on discharge rates and sediment sizes as measured with a pebble count. The "Sediment Analysis Model" predicted the channel slope well, with an optimum bankfull width of 143 feet and a possibility of aggradation. The specific stream power for the Charlemont segment (12) has been computed using the 2-year frequency flood as determined from the MMI analysis of USGS gauge data. This hydrology value of 10,943 cfs is much higher than the regional regression data for bankfull discharges. The resulting specific stream power is 79 w/m2. This is a modest level that River Styles, literature searches, and MMI projects indicate as corresponding to moderately active meandering rivers. The segment 12 floodplain is a Nanson and Croke type B2. In conclusion, this important channel segment is forecast to be stable despite rare inundation. The channel is overly large, and the floodplain is subject to mild deposition. 5.9.3 Deerfield Meadows Channel and Floodplain Stability, Segment 17 The Deerfield River has an unconfined alluvial gravel bed channel and broad depositionary floodplain from the Lower Road bridge (near I-91) to the Route 5 bridge. This 6-mile-long segment has a Rosgen type C4 gravel bed meandering channel, steep banks, and an adjacent flat floodplain that is used for extensive agriculture. The floodplain was inundated during Hurricane Irene and covered with a layer of fresh, light-colored silty sand sediment ranging from a few inches to several feet thick. Fortunately, there have been no observed avulsions or significant meander migration due to this flood. The current floodplain surface is built primarily by vertical accretion, though several old oxbows and meander scrolls attest to previous lateral channel adjustments and previous channels that must have filled in. The measured bankfull channel widths vary from 170 feet to 250 feet with a typical bankfull depth of 12.5 feet. In comparison, the bankfull width computed with the USGS regional regression equations is 207 feet, and the predicted regime width is 257 feet using the Lacey-type equation. This consistency suggests the channel is in a well-balanced equilibrium. The computed SSP in Deerfield River segment 17 is 65 watts per square meter for the 2-year frequency flood and bankfull width. This is within the range for stable meandering sand and gravel bed rivers with modest erosive forces. For the 100-year frequency flood, the cross-sectional average SSP is just 47 due to its great width, which is consistent with the silty sand deposition. The risk of avulsion is minimal. Based upon the Nanson and Croke classification, this is a stable type B3 floodplain.
RIVER AND STREAM POWER ASSESSMENT REPORT DEERFIELD RIVER BASIN – MASSACHUSETTS AND VERMONT DECEMBER 2014 (REVISED APRIL 4, 2017)
PAGE 59
Historic Note The 1841 Agricultural Report of Franklin County (Coleman, 1841) describes the Deerfield Meadows as consisting of 3,000 acres, with "soils composed of fine sand and much vegetable (organic) matter, being the washings of nearby hills and deposits from the occasional overflowing of the banks which gives its strong consistency." "The meadows are overflowed, in some cases, more than once a year." "The outlet being small in proportion to the amount of water collected on the meadows to be discharge, a sort of lake is formed at times… and the enriching matter held in suspension by the waters are gradually made and to a large amount." Coleman (1841) then describes the Green River Valley as being "alluvial, but only small portions of it are now overflown by the stream, and there is every reason to believe that this valley and the Deerfield Valley were at one time the sites of lakes, and their richness is owing to the deposits brought from neighboring hills and mountains by various streams." The Deerfield Meadows were described as producing outstanding crops of hay and corn, which is still true. 5.9.4 Delta Unlike the nearby Westfield River, the Deerfield River does not have a distinct fluvial delta where it enters into the Connecticut River. Presumably, this is because the large Deerfield Meadows upstream of the confluence serve as a low gradient, low power sediment deposition area, and the Connecticut River must have enough power to convey whatever sediment that gets past the meadows. 5.10 Floodplain Adjustments None of the empirical floodplain mapping and management methods mentioned above address the likelihood of channel or floodplain adjustments occurring. Channel adjustments may be as basic as channel widening or degradation along the present alignment or as complex as meander migration and avulsions across floodplains. Channel adjustments are normally studied with detailed geomorphic assessments of historic conditions and trends and engineering hydraulics. For this project, we use a large-scale screening process to predict potential channel adjustments using the River Styles concept (Brierley and Fryirs, 2005) and stream power. The primary floodplain adjustment observed along the Deerfield River consists of overbank sediment deposition in segments 12, 13, and 17. The regulated flood flows reduce the chance of channel migration and avulsions.
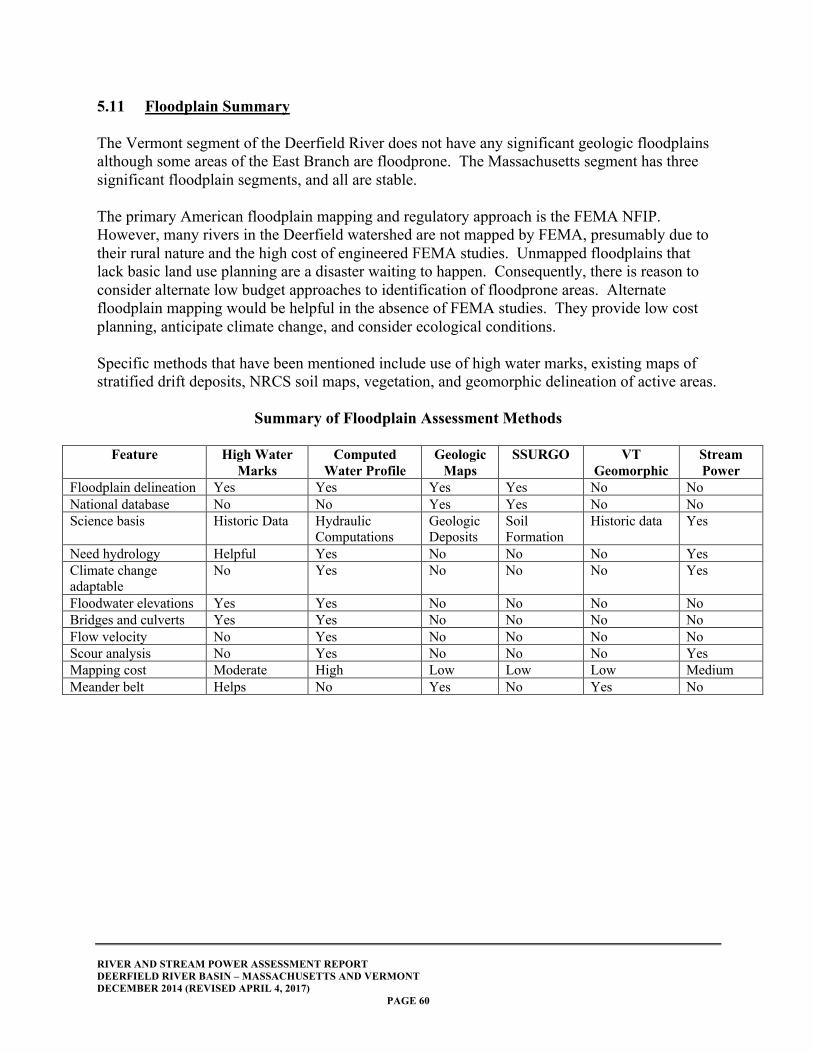
RIVER AND STREAM POWER ASSESSMENT REPORT DEERFIELD RIVER BASIN – MASSACHUSETTS AND VERMONT DECEMBER 2014 (REVISED APRIL 4, 2017)
PAGE 60
5.11 Floodplain Summary The Vermont segment of the Deerfield River does not have any significant geologic floodplains although some areas of the East Branch are floodprone. The Massachusetts segment has three significant floodplain segments, and all are stable. The primary American floodplain mapping and regulatory approach is the FEMA NFIP. However, many rivers in the Deerfield watershed are not mapped by FEMA, presumably due to their rural nature and the high cost of engineered FEMA studies. Unmapped floodplains that lack basic land use planning are a disaster waiting to happen. Consequently, there is reason to consider alternate low budget approaches to identification of floodprone areas. Alternate floodplain mapping would be helpful in the absence of FEMA studies. They provide low cost planning, anticipate climate change, and consider ecological conditions. Specific methods that have been mentioned include use of high water marks, existing maps of stratified drift deposits, NRCS soil maps, vegetation, and geomorphic delineation of active areas.
Summary of Floodplain Assessment Methods
Feature High Water Marks
Computed Water Profile
Geologic Maps
SSURGO VT Geomorphic
Stream Power
Floodplain delineation Yes Yes Yes Yes No No National database No No Yes Yes No No Science basis Historic Data Hydraulic
Computations Geologic Deposits
Soil Formation
Historic data Yes
Need hydrology Helpful Yes No No No Yes Climate change adaptable
No Yes No No No Yes
Floodwater elevations Yes Yes No No No No Bridges and culverts Yes Yes No No No No Flow velocity No Yes No No No No Scour analysis No Yes No No No Yes Mapping cost Moderate High Low Low Low Medium Meander belt Helps No Yes No Yes No
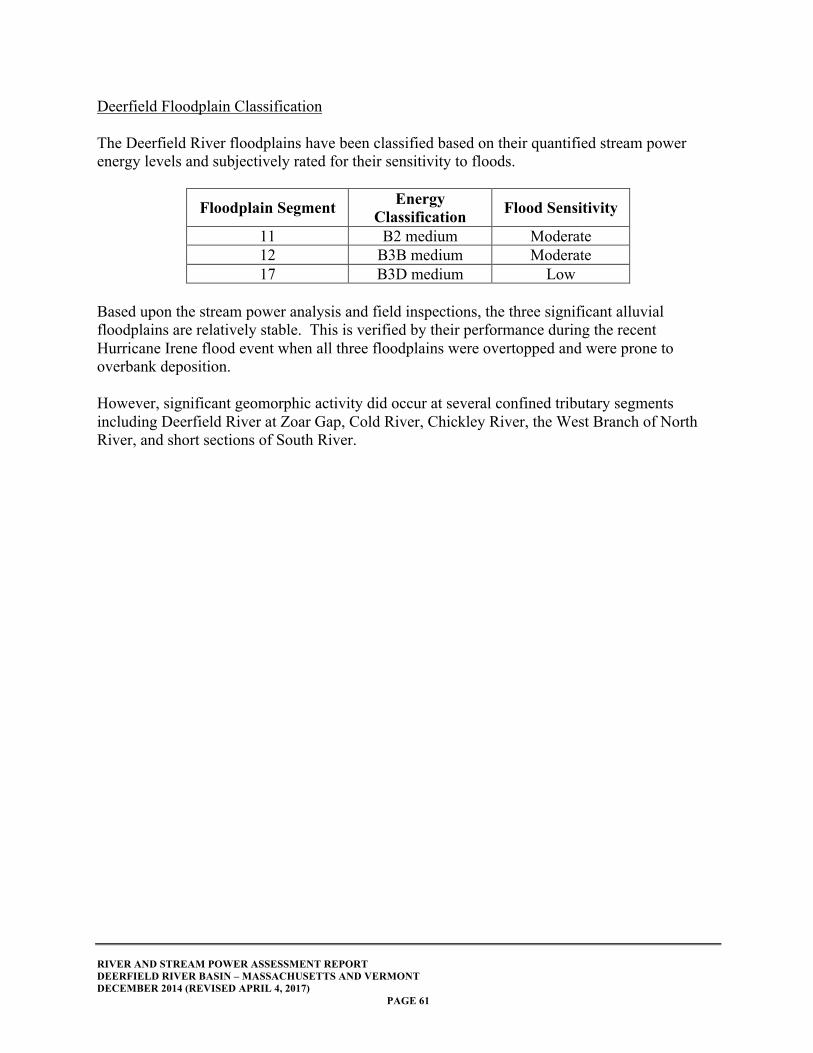
RIVER AND STREAM POWER ASSESSMENT REPORT DEERFIELD RIVER BASIN – MASSACHUSETTS AND VERMONT DECEMBER 2014 (REVISED APRIL 4, 2017)
PAGE 61
Deerfield Floodplain Classification The Deerfield River floodplains have been classified based on their quantified stream power energy levels and subjectively rated for their sensitivity to floods.
Floodplain Segment Energy Classification
Flood Sensitivity
11 B2 medium Moderate 12 B3B medium Moderate 17 B3D medium Low
Based upon the stream power analysis and field inspections, the three significant alluvial floodplains are relatively stable. This is verified by their performance during the recent Hurricane Irene flood event when all three floodplains were overtopped and were prone to overbank deposition. However, significant geomorphic activity did occur at several confined tributary segments including Deerfield River at Zoar Gap, Cold River, Chickley River, the West Branch of North River, and short sections of South River.
RIVER AND STREAM POWER ASSESSMENT REPORT DEERFIELD RIVER BASIN – MASSACHUSETTS AND VERMONT DECEMBER 2014 (REVISED APRIL 4, 2017)
PAGE 62
6.0 MANAGEMENT ISSUES
6.1 Introduction The Deerfield River has a complex watershed that raises the classic question of what is a natural river. Many people consider it to be a great natural resource and appreciate using it for recreation, including whitewater boating and fishing, plus riverside activities such as camping, hiking, and scenic drives. The river also is known for providing numerous services including hydroelectric power, formerly hydromechanical power, water supply, and flood attenuation. But some river attributes are far from natural. The store, retain, and release operational mode of the hydroelectric facilities drastically alters the river hydrology on both a seasonal and daily basis. The off-site generating stations are up to several miles downstream of the corresponding dams, leading to long "bypass" segments with little flow, and none of the dams have fish passage facilities. Summary of Hydrologic Findings 1. The Deerfield River is generally confined by bedrock valleys in Vermont and portions of its
Massachusetts segments and is semiconfined with small or discontinuous floodplains from the Cold River confluence to Shelburne Falls.
2. The only significant unconfined alluvial floodplains along the main Deerfield River are the North and South Meadows in the town of Deerfield from Lower Road bridge to the Route 5 bridge.
3. The FEMA FIS cover only portions of the main Deerfield River channel including the town
of Deerfield and from Cold River to Shelburne Falls and portions of some tributaries. The hydrology data used for the FEMA regulatory base flood is outdated and lower than our analysis of USGS gauges data and should not be used for design of infrastructure. The FEMA FIS should be updated.
4. The channel-forming discharges (1.1- to 2.0-year floods) as determined at the USGS gauges
are much higher than the statewide regression equation bankfull discharges. In the steep Deerfield watershed, the Jacobs (2010) regression equation for peak flows performs better than the Bent (2013) equation.
5. The generic "geologic floodplains" along the Deerfield River are limited, generally agreeing
with the location of FEMA FHAs.
6. The measured bankfull channel widths are greater than the Massachusetts regional regression equation bankfull widths. Regime equations provide improved predictions.
RIVER AND STREAM POWER ASSESSMENT REPORT DEERFIELD RIVER BASIN – MASSACHUSETTS AND VERMONT DECEMBER 2014 (REVISED APRIL 4, 2017)
PAGE 63
7. An analytical stream power review of the Deerfield River floodplains in the Shelburne and Deerfield Meadows segments indicates they are stable and not very prone to avulsion. During Hurricane Irene, there were deposition zones. However, several confined channel sections at Zoar Gap and along tributaries have high stream power and had severe erosion during Hurricane Irene in August 2011.
8. Floodplains should be mapped in all developed areas along the river. Where FEMA FIS
cannot be prepared in the near future, approximate methods could be used in the interim. 6.2 Regulated Flows The Deerfield River flow rates are regulated by a series of hydroelectric dams and generating facilities. There is a flow release agreement. The low-flow release of 125 cfs is insufficient for whitewater boating. Its ecological impact is unknown. 6.3 Bypass Segments Several dams along the Deerfield River have generating powerhouses that are located well downstream of the dam in order to maximize the applied head at the turbine. The total head available to spin the turbine and generate power is the sum of the dam's height plus the river gradient from the dam to the powerhouse. This is an effective system for use on steep channels. Dams are connected to the off-site powerhouses by either diverting water from the river to a penstock pipe (as at Searsburg Dam) or an open channel (as at Monroe #5 Dam). The flow diversion reduces or virtually eliminates flow in the river channel, called the bypass segment, between the dam and powerhouse. The flow rates in bypass segments are highly variable depending upon flow agreements, the time of day, and whether the reservoir is full and spilling water. Bypass segments usually have poor habitat and recreational value due to dry channels or shallow flow with periodic pulses of water when release is made. It has become common practice for the FERC to negotiate and stipulate bypass segment flows as part of the overall flow management at hydroelectric dams. It is our understanding that the present release conditions were negotiated with New England Power, the former owner of most dams, and includes recreational considerations. 6.4 Fish Passage Under natural conditions, the Deerfield River and its tributaries have coarse gravel beds, ample flow, and moderate to steep gradients that are ideal for cold-water fisheries. The Deerfield River is also tributary to the Connecticut River, which supports several species of anadromous fish that spend their adult years in the ocean but migrate to fresh water to spawn. The natural bedrock falls at Shelburne Falls would prevent migration beyond that point at river mile 17.0.
RIVER AND STREAM POWER ASSESSMENT REPORT DEERFIELD RIVER BASIN – MASSACHUSETTS AND VERMONT DECEMBER 2014 (REVISED APRIL 4, 2017)
PAGE 64
Dams and some culverts are obstacles to both fresh water and anadromous fish passage in the upstream direction and increase fish mortality in the downstream direction. While modern dams are often equipped with fish ladders or fish bypass channels, neither were common practice at the era when the lower Deerfield dams were built in the early 20th Century, and none are able to provide upstream passage to Shelburne Falls. It is noted that there is only 3.8 miles of the Deerfield River and no major tributaries between the block at Dam #2 and the natural block at Shelburne Falls. The federal government has withdrawn its support of the salmon restoration program, but limited state efforts continue. Wild salmon spawning attempts were recently observed in the Farmington River. Facilities to aid downstream passage includes fishways, sluice gates, modified trash racks and booms, bar racks, and monitoring. Monitoring efforts have included radio tags and computational fluid dynamics (CFD) modeling. The dams between Shelburne Falls and the Connecticut River are reportedly equipped to aid the downstream passage of stocked salmon smolts. Salmon presence below the most downstream dam is monitored to determine if they are attempting to use the Deerfield River. There is no known monitoring of other migratory species including American shad, herring, or eels. 6.5 Recreation The middle section of the Deerfield River is a popular whitewater boating area that is also scenic and has great fishing. Water recreation is enhanced by a 1994 agreement with the hydropower industry to have scheduled water releases that enable optimum conditions. Water release schedules are on the web and available from local outfitters. The primary kayak runs are summarized below:
From To Length, Miles
Average Slope, FPM Class
1. Monroe Bridge Dam #5
Dunbar Picnic Area/Fife Reservoir
2.65 78 III-IV
2. Fife Brook Dam Zoar Gap/River Road 5 25 II-III 3. Zoar Gap Shunpike Rest Area, Route 2 2.5 I-II 4. Shunpike Rest Area Buckland Boat Ramp 7 I-II
Several websites provide further information on recreational opportunities (Deerfield River Whitewater Association, American Whitewater, local outfitters). Some of the hydropower impoundments have lakeside picnic areas, hiking trails, and boat launches. They provide popular public access points, which were well maintained during site visits. Numerous out-of-state license plates were observed, confirming tourist use. The Green Mountain State Forest in Vermont and the Mohawk Trail, Savoy Mountain, and Monroe State Forests in Massachusetts provide hiking trails. Campgrounds and picnic areas along the Cold River were noted as receiving extensive usage.
RIVER AND STREAM POWER ASSESSMENT REPORT DEERFIELD RIVER BASIN – MASSACHUSETTS AND VERMONT DECEMBER 2014 (REVISED APRIL 4, 2017)
PAGE 65
6.6 Floodplain Mapping The FEMA FIS and FIRMs in the Deerfield River and tributaries date from the early 1980s and only cover developed areas. They do not provide current land use and flood risk guidance. The peak flood flow rates used in the FIS are generally lower than predicted by current USGS gauging station data and will underestimate floodplain boundaries. Geologic maps of alluvial soil deposits appear to correlate well with the FEMA maps and could be used to predict flood hazards in areas not yet studied by FEMA. 6.7 Conclusion The Deerfield River is in good condition despite extensive hydromodifications and recent floods and supports a variety of users. It is our understanding that the dams are being operated in accordance with their FERC licenses and state permits. It also appears, from informal conversations along the river, that many river users have adjusted to the operational conditions and take advantage of the scheduled flow releases, relieving potential tension between the parties. Many people have been observed using the provided (but still limited) recreational facilities for boating, fishing, and picnicking. In conclusion, an uneasy balance appears to have been made between naturalness and ecosystem services. The hydroelectric dams help to dampen peak-flow rates, and the damages during Hurricane Irene were an unusual exception. Narrow, steep-sided valleys extend from the Vermont headwaters to the confluence of Cold River in Florida, limiting floodplain development and consequential damages. There are flood hazards associated with transportation facilities (highways and bridges) and selected villages such as Colrain Center on North River, Charlemont, and Shelburne Falls. The lower, broad floodplains in Charlemont and Deerfield have extensive agricultural uses, which are appropriate for floodplains. Floodplain land use regulations and FEMA standards must be enforced.
RIVER AND STREAM POWER ASSESSMENT REPORT DEERFIELD RIVER BASIN – MASSACHUSETTS AND VERMONT DECEMBER 2014 (REVISED APRIL 4, 2017)
PAGE 66
7.0 CULVERT AND BRIDGE VULNERABILITY ANALYSIS 7.1 Introduction This protocol to screen bridges and culverts for vulnerability of failure moves beyond the conventional visual inspection and channel classification to include a geomorphic engineering analysis to predict channel and structure stability. The screen considers geophysical valley setting by inclusion of specific stream power and bed resistance. This work builds on past geomorphic compatibility screens (e.g., Schiff et al., 2008). This project was a collaboration between the University of Massachusetts (UMass), Massachusetts Department of Transportation (MassDOT), Trout Unlimited (TU), and Milone & MacBroom, Inc. (MMI) (Table 7-1).
TABLE 7-1 Vulnerability Analysis Project Team
Project Team Member Project Role
University of Massachusetts (UMass)
Project lead, task review, data collection, data analysis review, relate geomorphic vulnerability to other aspects of culvert screening
Massachusetts Department of Transportation (MassDOT)
Manage bridges and culverts on state highway system, data collection, original screen to build upon
Trout Unlimited (TU) Data collection Milone & MacBroom, Inc. MMI) Method development, data collection, data analysis,
reporting 7.2 Methods 7.2.1 Data Collection Form Development MMI developed a field data collection form to access relevant data previously collected by TU that would be useful to have in the field and to provide a location for recording field observations. Existing data spreadsheets provided by the project team were retained in their original format, and a new spreadsheet was made that accessed existing data using CAPS ID as the unique identifier. Existing data placed on the field data form included identification information such as CAPS ID, XYcode, Culvert ID, stream name, road name, descriptive location, and latitude and longitude. Information about the structure such as number of culvert cells, culvert shape, width, height, and length; culvert slope relative to channel slope; culvert width as percent of bankfull channel width; culvert alignment with channel; selection criteria for field assessment; and past observations and damage were also included. Stream data such as drainage area, channel bankfull width, upstream channel slope, estimated bankfull flow, SSP, D50, and upstream and downstream channel substrate were also placed on the form. The reverse side of the form included blank fields for data to be collected during each assessment.
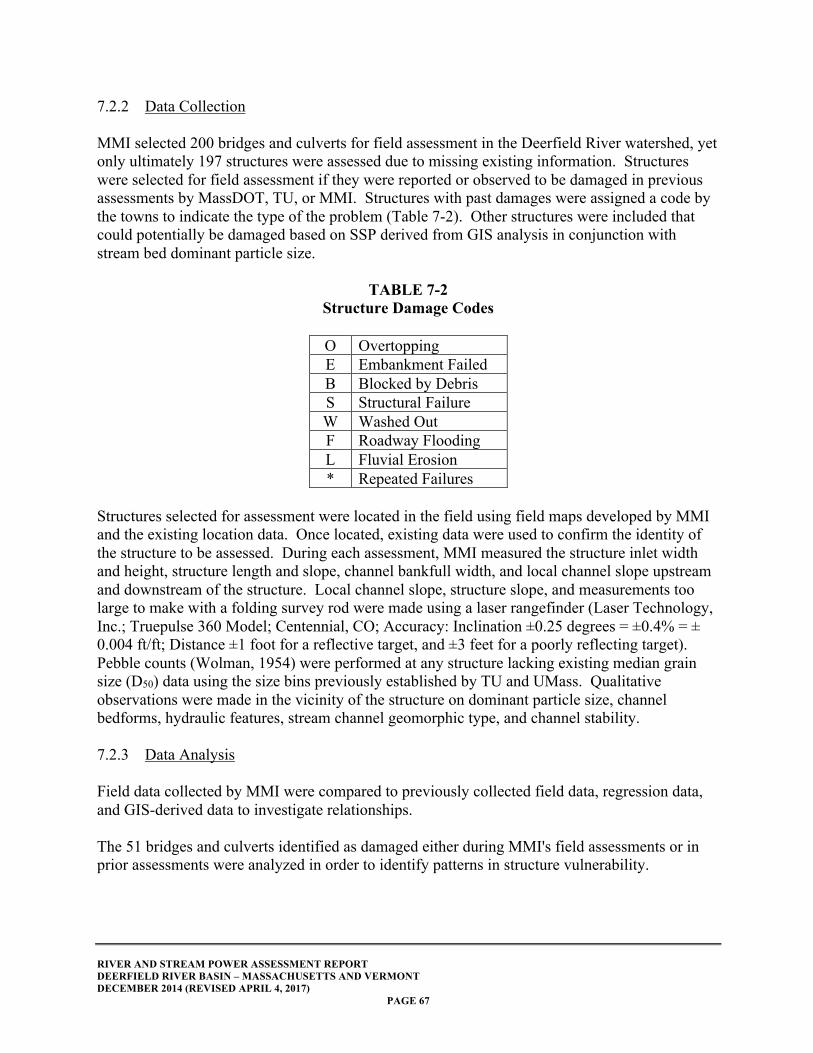
RIVER AND STREAM POWER ASSESSMENT REPORT DEERFIELD RIVER BASIN – MASSACHUSETTS AND VERMONT DECEMBER 2014 (REVISED APRIL 4, 2017)
PAGE 67
7.2.2 Data Collection MMI selected 200 bridges and culverts for field assessment in the Deerfield River watershed, yet only ultimately 197 structures were assessed due to missing existing information. Structures were selected for field assessment if they were reported or observed to be damaged in previous assessments by MassDOT, TU, or MMI. Structures with past damages were assigned a code by the towns to indicate the type of the problem (Table 7-2). Other structures were included that could potentially be damaged based on SSP derived from GIS analysis in conjunction with stream bed dominant particle size.
TABLE 7-2
Structure Damage Codes
O Overtopping E Embankment Failed B Blocked by Debris S Structural Failure W Washed Out F Roadway Flooding L Fluvial Erosion * Repeated Failures
Structures selected for assessment were located in the field using field maps developed by MMI and the existing location data. Once located, existing data were used to confirm the identity of the structure to be assessed. During each assessment, MMI measured the structure inlet width and height, structure length and slope, channel bankfull width, and local channel slope upstream and downstream of the structure. Local channel slope, structure slope, and measurements too large to make with a folding survey rod were made using a laser rangefinder (Laser Technology, Inc.; Truepulse 360 Model; Centennial, CO; Accuracy: Inclination ±0.25 degrees = ±0.4% = ± 0.004 ft/ft; Distance ±1 foot for a reflective target, and ±3 feet for a poorly reflecting target). Pebble counts (Wolman, 1954) were performed at any structure lacking existing median grain size (D50) data using the size bins previously established by TU and UMass. Qualitative observations were made in the vicinity of the structure on dominant particle size, channel bedforms, hydraulic features, stream channel geomorphic type, and channel stability. 7.2.3 Data Analysis Field data collected by MMI were compared to previously collected field data, regression data, and GIS-derived data to investigate relationships. The 51 bridges and culverts identified as damaged either during MMI's field assessments or in prior assessments were analyzed in order to identify patterns in structure vulnerability.
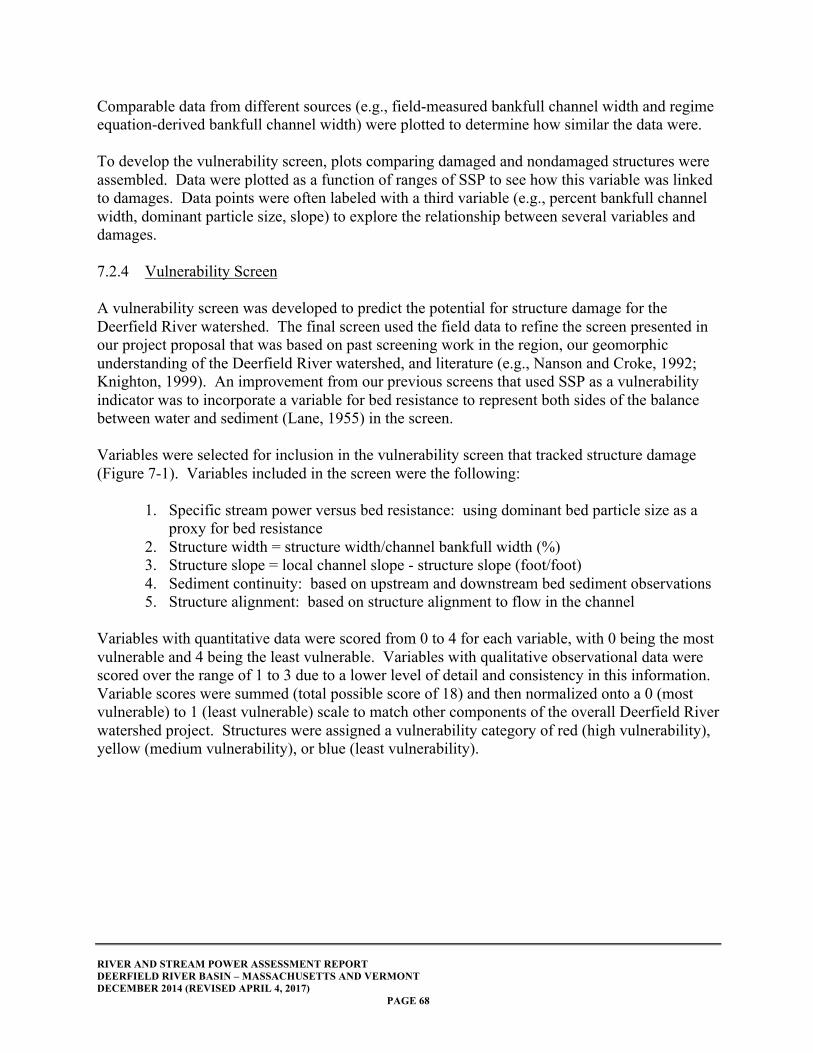
RIVER AND STREAM POWER ASSESSMENT REPORT DEERFIELD RIVER BASIN – MASSACHUSETTS AND VERMONT DECEMBER 2014 (REVISED APRIL 4, 2017)
PAGE 68
Comparable data from different sources (e.g., field-measured bankfull channel width and regime equation-derived bankfull channel width) were plotted to determine how similar the data were. To develop the vulnerability screen, plots comparing damaged and nondamaged structures were assembled. Data were plotted as a function of ranges of SSP to see how this variable was linked to damages. Data points were often labeled with a third variable (e.g., percent bankfull channel width, dominant particle size, slope) to explore the relationship between several variables and damages. 7.2.4 Vulnerability Screen A vulnerability screen was developed to predict the potential for structure damage for the Deerfield River watershed. The final screen used the field data to refine the screen presented in our project proposal that was based on past screening work in the region, our geomorphic understanding of the Deerfield River watershed, and literature (e.g., Nanson and Croke, 1992; Knighton, 1999). An improvement from our previous screens that used SSP as a vulnerability indicator was to incorporate a variable for bed resistance to represent both sides of the balance between water and sediment (Lane, 1955) in the screen.
Variables were selected for inclusion in the vulnerability screen that tracked structure damage (Figure 7-1). Variables included in the screen were the following:
1. Specific stream power versus bed resistance: using dominant bed particle size as a proxy for bed resistance
2. Structure width = structure width/channel bankfull width (%) 3. Structure slope = local channel slope - structure slope (foot/foot) 4. Sediment continuity: based on upstream and downstream bed sediment observations 5. Structure alignment: based on structure alignment to flow in the channel
Variables with quantitative data were scored from 0 to 4 for each variable, with 0 being the most vulnerable and 4 being the least vulnerable. Variables with qualitative observational data were scored over the range of 1 to 3 due to a lower level of detail and consistency in this information. Variable scores were summed (total possible score of 18) and then normalized onto a 0 (most vulnerable) to 1 (least vulnerable) scale to match other components of the overall Deerfield River watershed project. Structures were assigned a vulnerability category of red (high vulnerability), yellow (medium vulnerability), or blue (least vulnerability).
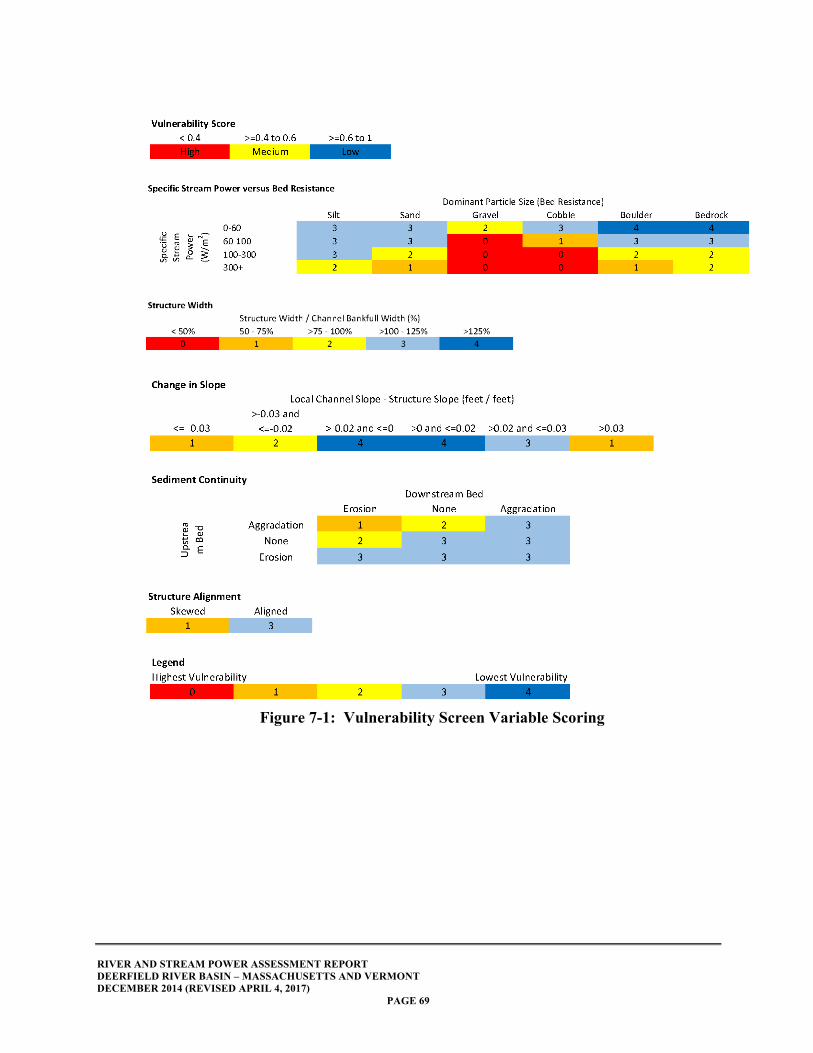
RIVER AND STREAM POWER ASSESSMENT REPORT DEERFIELD RIVER BASIN – MASSACHUSETTS AND VERMONT DECEMBER 2014 (REVISED APRIL 4, 2017)
PAGE 69
Figure 7-1: Vulnerability Screen Variable Scoring
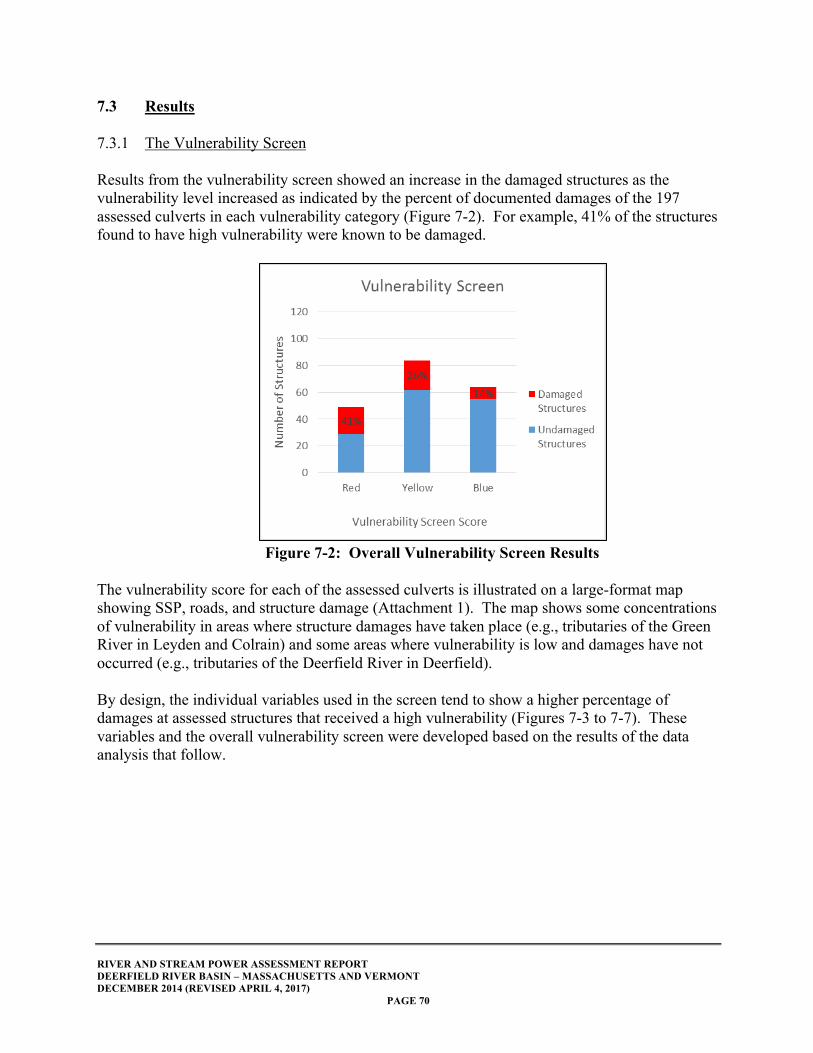
RIVER AND STREAM POWER ASSESSMENT REPORT DEERFIELD RIVER BASIN – MASSACHUSETTS AND VERMONT DECEMBER 2014 (REVISED APRIL 4, 2017)
PAGE 70
7.3 Results
7.3.1 The Vulnerability Screen
Results from the vulnerability screen showed an increase in the damaged structures as the vulnerability level increased as indicated by the percent of documented damages of the 197 assessed culverts in each vulnerability category (Figure 7-2). For example, 41% of the structures found to have high vulnerability were known to be damaged.
Figure 7-2: Overall Vulnerability Screen Results
The vulnerability score for each of the assessed culverts is illustrated on a large-format map showing SSP, roads, and structure damage (Attachment 1). The map shows some concentrations of vulnerability in areas where structure damages have taken place (e.g., tributaries of the Green River in Leyden and Colrain) and some areas where vulnerability is low and damages have not occurred (e.g., tributaries of the Deerfield River in Deerfield). By design, the individual variables used in the screen tend to show a higher percentage of damages at assessed structures that received a high vulnerability (Figures 7-3 to 7-7). These variables and the overall vulnerability screen were developed based on the results of the data analysis that follow.
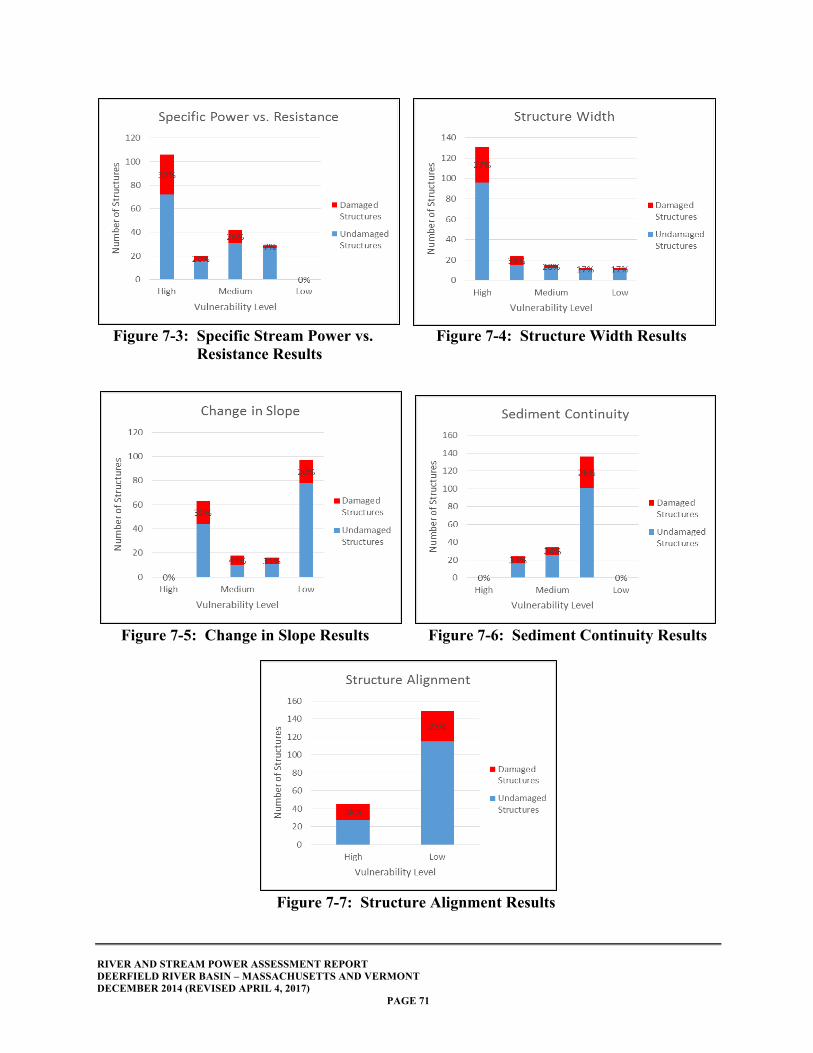
RIVER AND STREAM POWER ASSESSMENT REPORT DEERFIELD RIVER BASIN – MASSACHUSETTS AND VERMONT DECEMBER 2014 (REVISED APRIL 4, 2017)
PAGE 71
Figure 7-3: Specific Stream Power vs. Figure 7-4: Structure Width Results Resistance Results
Figure 7-5: Change in Slope Results Figure 7-6: Sediment Continuity Results
Figure 7-7: Structure Alignment Results
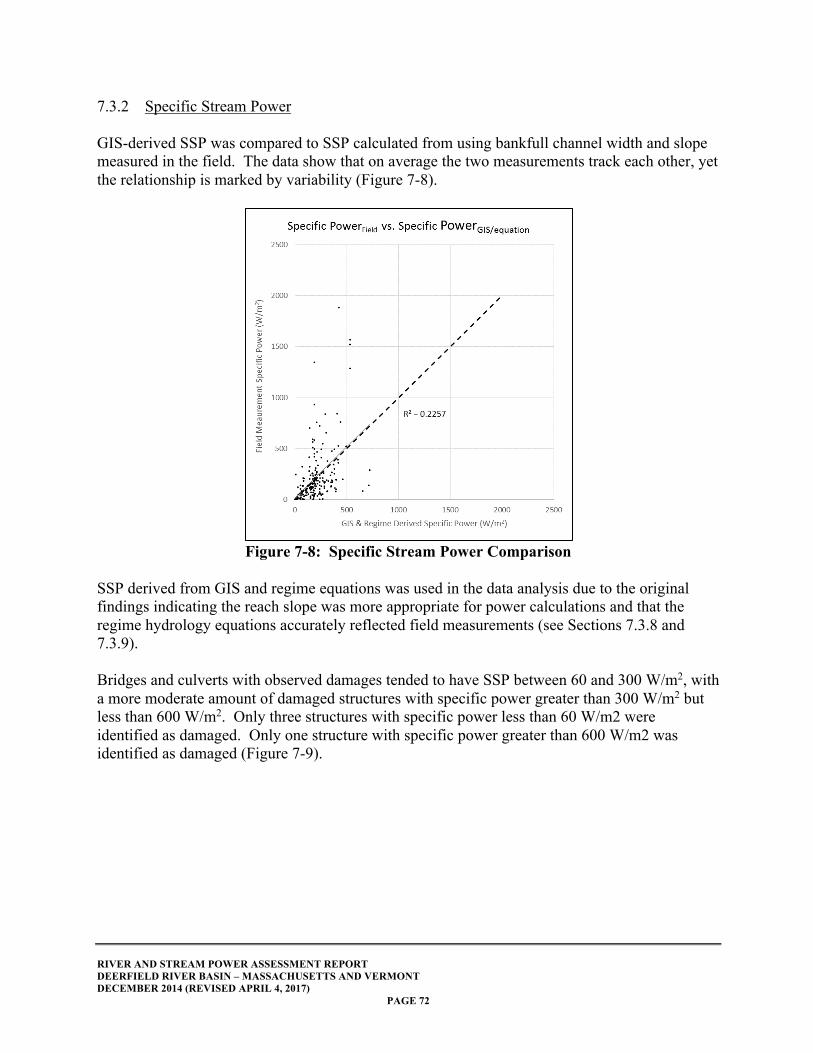
RIVER AND STREAM POWER ASSESSMENT REPORT DEERFIELD RIVER BASIN – MASSACHUSETTS AND VERMONT DECEMBER 2014 (REVISED APRIL 4, 2017)
PAGE 72
7.3.2 Specific Stream Power GIS-derived SSP was compared to SSP calculated from using bankfull channel width and slope measured in the field. The data show that on average the two measurements track each other, yet the relationship is marked by variability (Figure 7-8).
Figure 7-8: Specific Stream Power Comparison
SSP derived from GIS and regime equations was used in the data analysis due to the original findings indicating the reach slope was more appropriate for power calculations and that the regime hydrology equations accurately reflected field measurements (see Sections 7.3.8 and 7.3.9).
Bridges and culverts with observed damages tended to have SSP between 60 and 300 W/m2, with a more moderate amount of damaged structures with specific power greater than 300 W/m2 but less than 600 W/m2. Only three structures with specific power less than 60 W/m2 were identified as damaged. Only one structure with specific power greater than 600 W/m2 was identified as damaged (Figure 7-9).
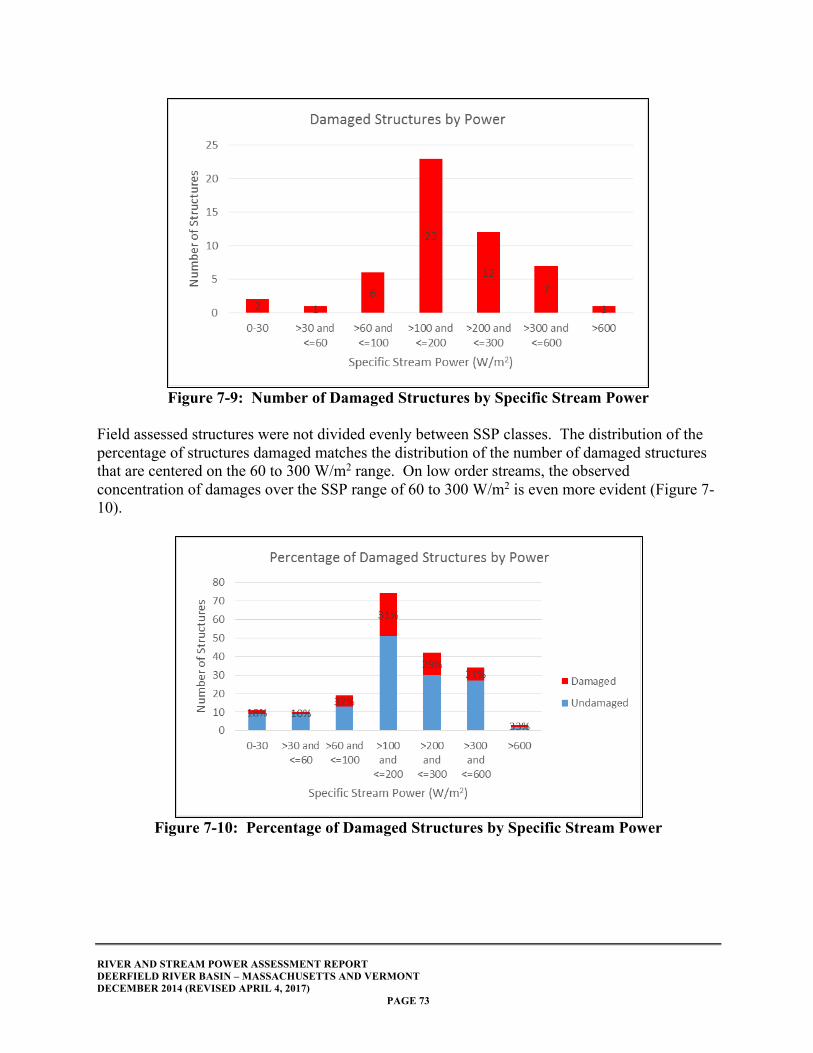
RIVER AND STREAM POWER ASSESSMENT REPORT DEERFIELD RIVER BASIN – MASSACHUSETTS AND VERMONT DECEMBER 2014 (REVISED APRIL 4, 2017)
PAGE 73
Figure 7-9: Number of Damaged Structures by Specific Stream Power
Field assessed structures were not divided evenly between SSP classes. The distribution of the percentage of structures damaged matches the distribution of the number of damaged structures that are centered on the 60 to 300 W/m2 range. On low order streams, the observed concentration of damages over the SSP range of 60 to 300 W/m2 is even more evident (Figure 7-10).
Figure 7-10: Percentage of Damaged Structures by Specific Stream Power
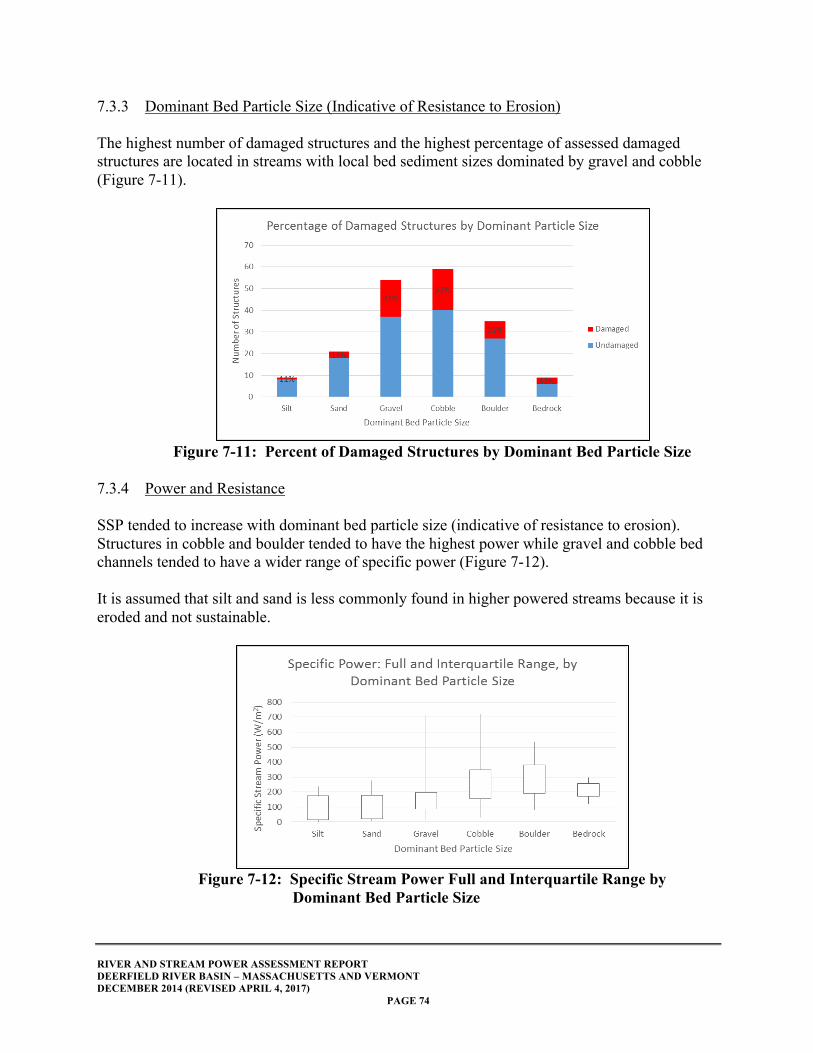
RIVER AND STREAM POWER ASSESSMENT REPORT DEERFIELD RIVER BASIN – MASSACHUSETTS AND VERMONT DECEMBER 2014 (REVISED APRIL 4, 2017)
PAGE 74
7.3.3 Dominant Bed Particle Size (Indicative of Resistance to Erosion)
The highest number of damaged structures and the highest percentage of assessed damaged structures are located in streams with local bed sediment sizes dominated by gravel and cobble (Figure 7-11).
Figure 7-11: Percent of Damaged Structures by Dominant Bed Particle Size
7.3.4 Power and Resistance
SSP tended to increase with dominant bed particle size (indicative of resistance to erosion). Structures in cobble and boulder tended to have the highest power while gravel and cobble bed channels tended to have a wider range of specific power (Figure 7-12).
It is assumed that silt and sand is less commonly found in higher powered streams because it is eroded and not sustainable.
Figure 7-12: Specific Stream Power Full and Interquartile Range by
Dominant Bed Particle Size
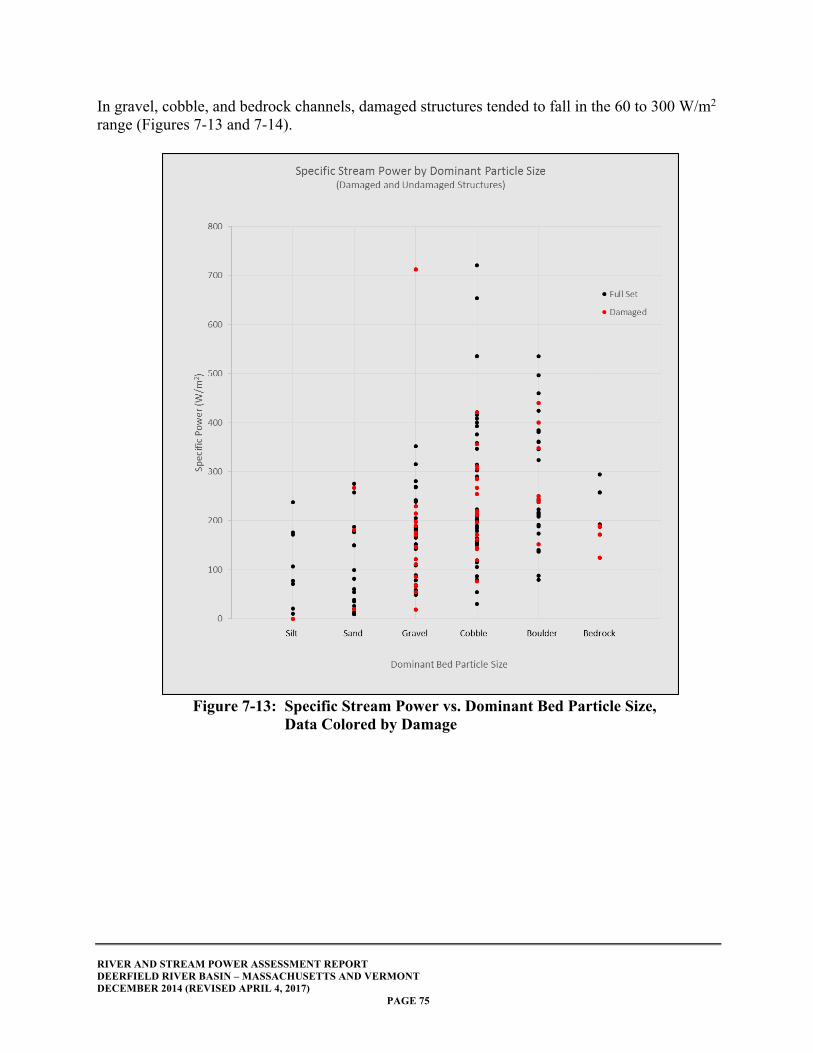
RIVER AND STREAM POWER ASSESSMENT REPORT DEERFIELD RIVER BASIN – MASSACHUSETTS AND VERMONT DECEMBER 2014 (REVISED APRIL 4, 2017)
PAGE 75
In gravel, cobble, and bedrock channels, damaged structures tended to fall in the 60 to 300 W/m2 range (Figures 7-13 and 7-14).
Figure 7-13: Specific Stream Power vs. Dominant Bed Particle Size, Data Colored by Damage
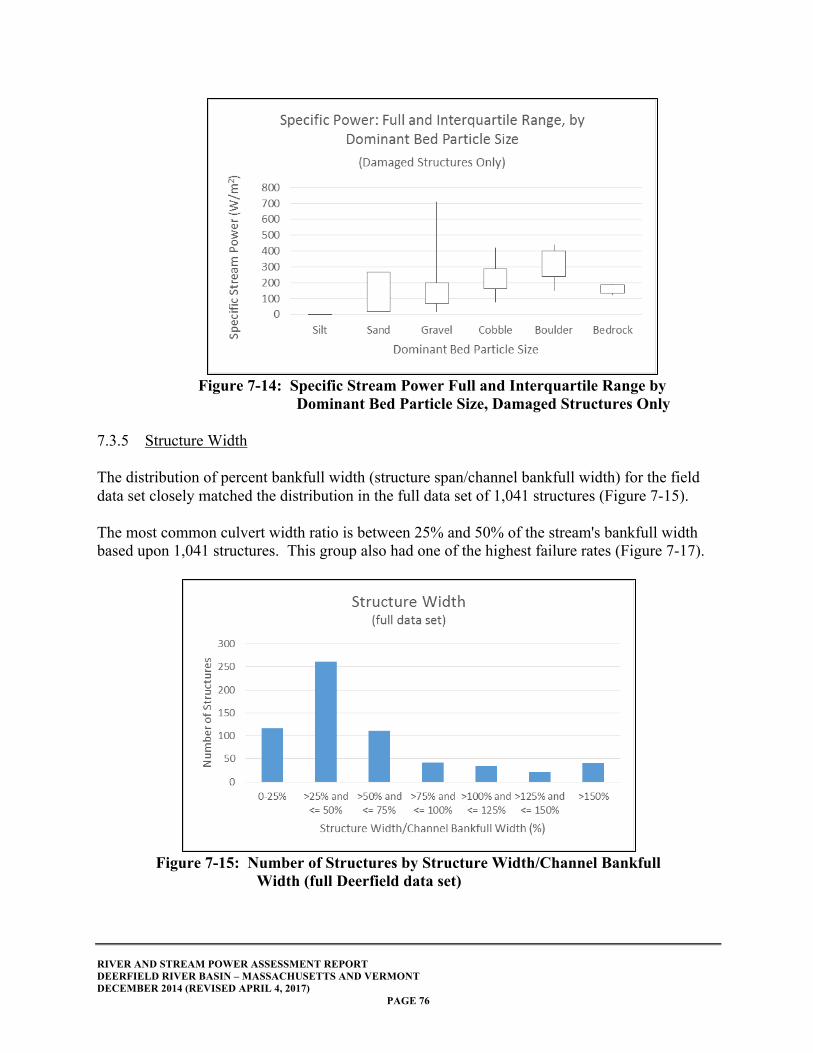
RIVER AND STREAM POWER ASSESSMENT REPORT DEERFIELD RIVER BASIN – MASSACHUSETTS AND VERMONT DECEMBER 2014 (REVISED APRIL 4, 2017)
PAGE 76
Figure 7-14: Specific Stream Power Full and Interquartile Range by
Dominant Bed Particle Size, Damaged Structures Only 7.3.5 Structure Width
The distribution of percent bankfull width (structure span/channel bankfull width) for the field data set closely matched the distribution in the full data set of 1,041 structures (Figure 7-15).
The most common culvert width ratio is between 25% and 50% of the stream's bankfull width based upon 1,041 structures. This group also had one of the highest failure rates (Figure 7-17).
Figure 7-15: Number of Structures by Structure Width/Channel Bankfull
Width (full Deerfield data set)
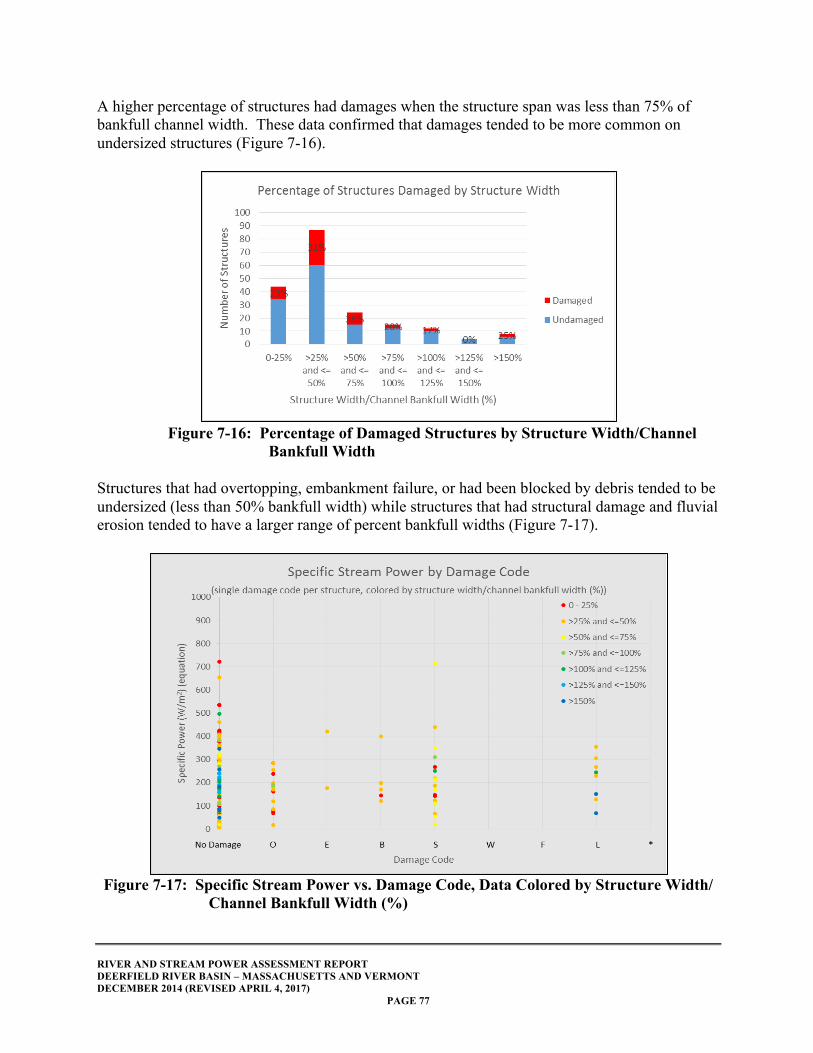
RIVER AND STREAM POWER ASSESSMENT REPORT DEERFIELD RIVER BASIN – MASSACHUSETTS AND VERMONT DECEMBER 2014 (REVISED APRIL 4, 2017)
PAGE 77
A higher percentage of structures had damages when the structure span was less than 75% of bankfull channel width. These data confirmed that damages tended to be more common on undersized structures (Figure 7-16).
Figure 7-16: Percentage of Damaged Structures by Structure Width/Channel
Bankfull Width Structures that had overtopping, embankment failure, or had been blocked by debris tended to be undersized (less than 50% bankfull width) while structures that had structural damage and fluvial erosion tended to have a larger range of percent bankfull widths (Figure 7-17).
Figure 7-17: Specific Stream Power vs. Damage Code, Data Colored by Structure Width/
Channel Bankfull Width (%)
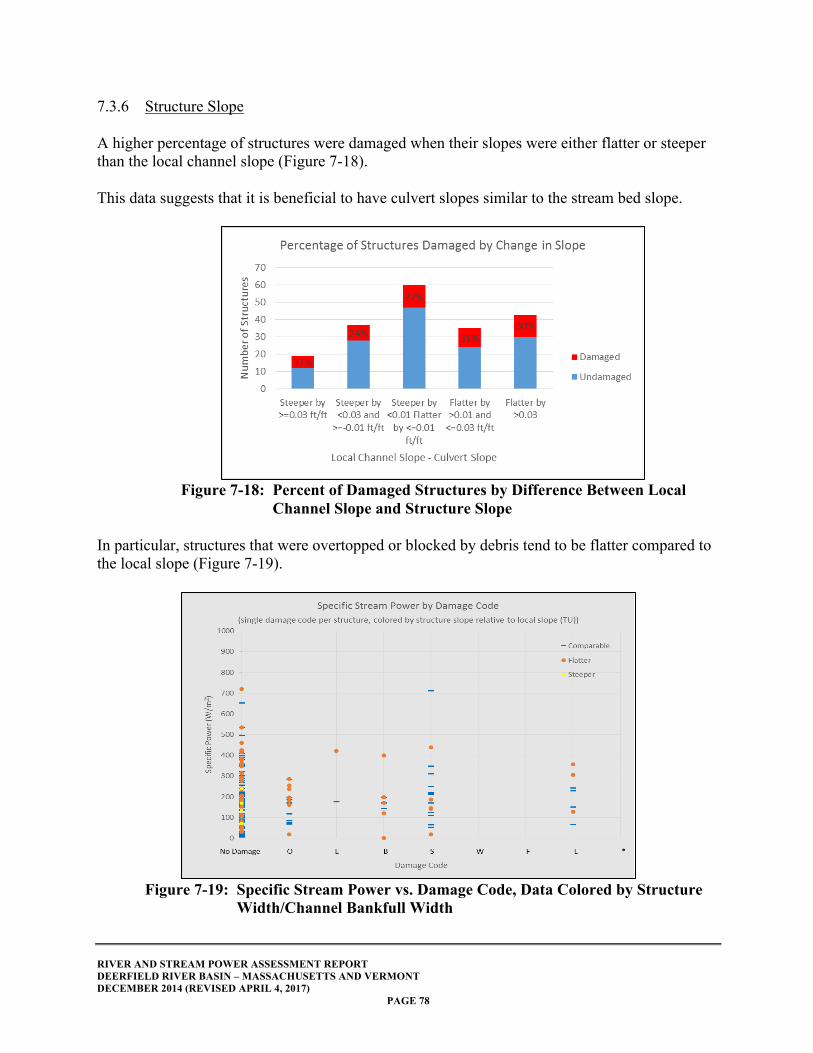
RIVER AND STREAM POWER ASSESSMENT REPORT DEERFIELD RIVER BASIN – MASSACHUSETTS AND VERMONT DECEMBER 2014 (REVISED APRIL 4, 2017)
PAGE 78
7.3.6 Structure Slope A higher percentage of structures were damaged when their slopes were either flatter or steeper than the local channel slope (Figure 7-18).
This data suggests that it is beneficial to have culvert slopes similar to the stream bed slope.
Figure 7-18: Percent of Damaged Structures by Difference Between Local Channel Slope and Structure Slope
In particular, structures that were overtopped or blocked by debris tend to be flatter compared to the local slope (Figure 7-19).
Figure 7-19: Specific Stream Power vs. Damage Code, Data Colored by Structure Width/Channel Bankfull Width

RIVER AND STREAM POWER ASSESSMENT REPORT DEERFIELD RIVER BASIN – MASSACHUSETTS AND VERMONT DECEMBER 2014 (REVISED APRIL 4, 2017)
PAGE 79
7.3.7 Structure Alignment
A much higher percentage of structures are damaged when the structure is not aligned with the channel (Figure 7-20).
Figure 7-20: Percent of Damage Structures by Structure Alignment
Relative to Channel In particular, structures that are overtopped tend to be skewed (Figure 7-21).
Figure 7-21: Specific Stream Power vs. Damage Code, Data Colored by
Structure Alignment Relative to Channel
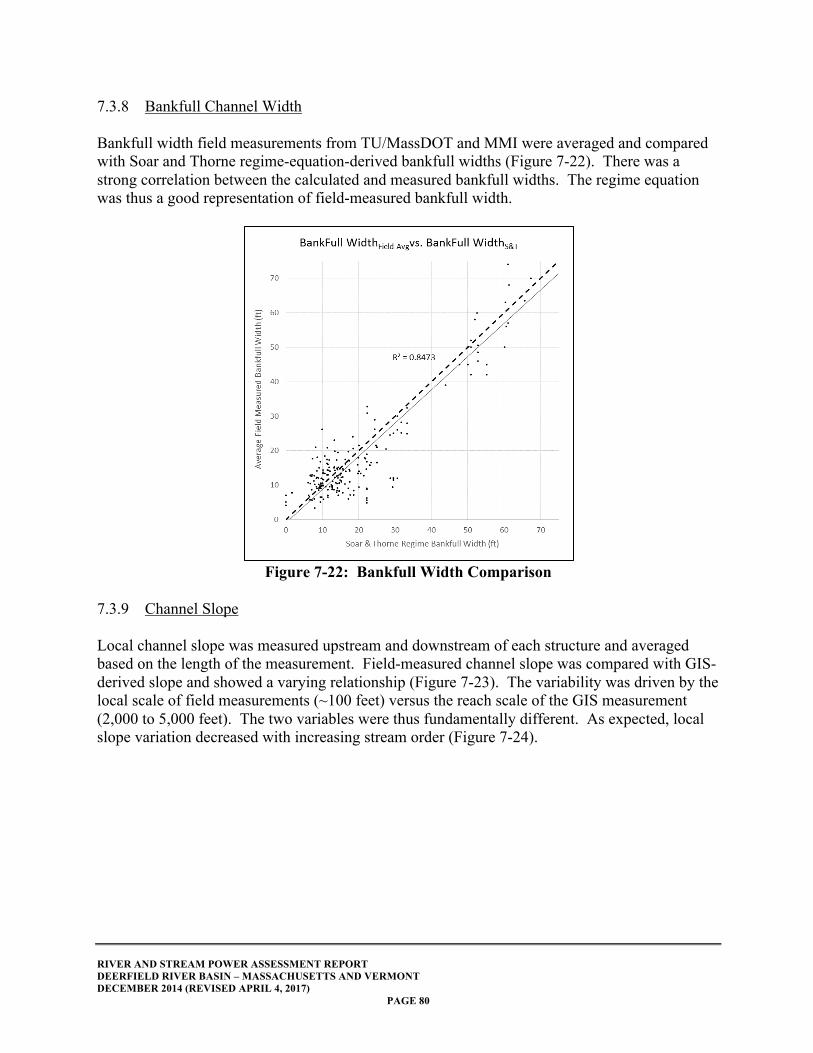
RIVER AND STREAM POWER ASSESSMENT REPORT DEERFIELD RIVER BASIN – MASSACHUSETTS AND VERMONT DECEMBER 2014 (REVISED APRIL 4, 2017)
PAGE 80
7.3.8 Bankfull Channel Width
Bankfull width field measurements from TU/MassDOT and MMI were averaged and compared with Soar and Thorne regime-equation-derived bankfull widths (Figure 7-22). There was a strong correlation between the calculated and measured bankfull widths. The regime equation was thus a good representation of field-measured bankfull width.
Figure 7-22: Bankfull Width Comparison
7.3.9 Channel Slope Local channel slope was measured upstream and downstream of each structure and averaged based on the length of the measurement. Field-measured channel slope was compared with GIS-derived slope and showed a varying relationship (Figure 7-23). The variability was driven by the local scale of field measurements (~100 feet) versus the reach scale of the GIS measurement (2,000 to 5,000 feet). The two variables were thus fundamentally different. As expected, local slope variation decreased with increasing stream order (Figure 7-24).
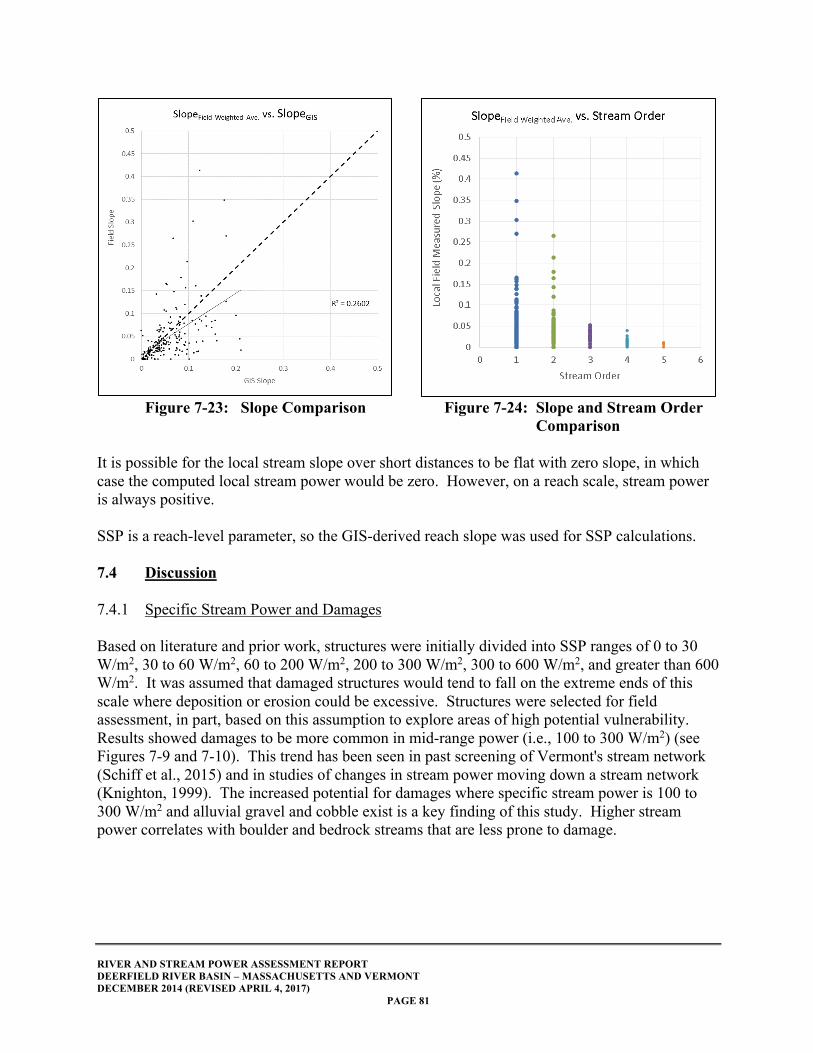
RIVER AND STREAM POWER ASSESSMENT REPORT DEERFIELD RIVER BASIN – MASSACHUSETTS AND VERMONT DECEMBER 2014 (REVISED APRIL 4, 2017)
PAGE 81
Figure 7-23: Slope Comparison Figure 7-24: Slope and Stream Order Comparison
It is possible for the local stream slope over short distances to be flat with zero slope, in which case the computed local stream power would be zero. However, on a reach scale, stream power is always positive.
SSP is a reach-level parameter, so the GIS-derived reach slope was used for SSP calculations.
7.4 Discussion 7.4.1 Specific Stream Power and Damages Based on literature and prior work, structures were initially divided into SSP ranges of 0 to 30 W/m2, 30 to 60 W/m2, 60 to 200 W/m2, 200 to 300 W/m2, 300 to 600 W/m2, and greater than 600 W/m2. It was assumed that damaged structures would tend to fall on the extreme ends of this scale where deposition or erosion could be excessive. Structures were selected for field assessment, in part, based on this assumption to explore areas of high potential vulnerability. Results showed damages to be more common in mid-range power (i.e., 100 to 300 W/m2) (see Figures 7-9 and 7-10). This trend has been seen in past screening of Vermont's stream network (Schiff et al., 2015) and in studies of changes in stream power moving down a stream network (Knighton, 1999). The increased potential for damages where specific stream power is 100 to 300 W/m2 and alluvial gravel and cobble exist is a key finding of this study. Higher stream power correlates with boulder and bedrock streams that are less prone to damage.
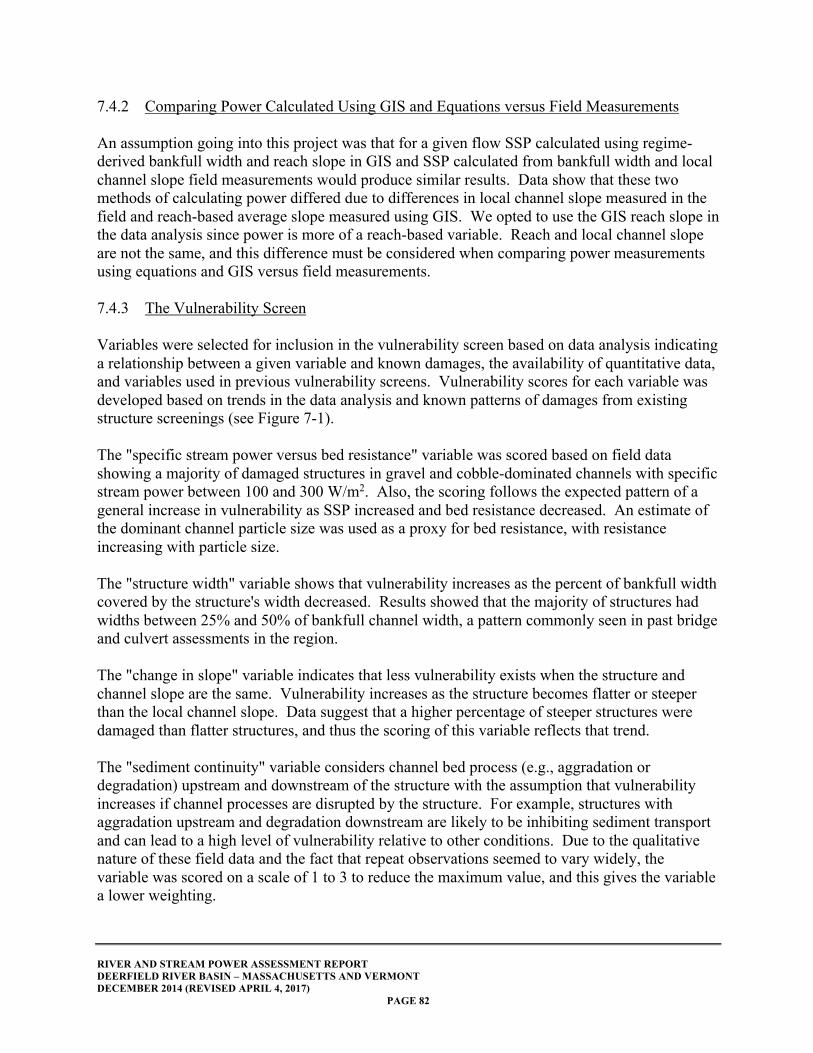
RIVER AND STREAM POWER ASSESSMENT REPORT DEERFIELD RIVER BASIN – MASSACHUSETTS AND VERMONT DECEMBER 2014 (REVISED APRIL 4, 2017)
PAGE 82
7.4.2 Comparing Power Calculated Using GIS and Equations versus Field Measurements
An assumption going into this project was that for a given flow SSP calculated using regime-derived bankfull width and reach slope in GIS and SSP calculated from bankfull width and local channel slope field measurements would produce similar results. Data show that these two methods of calculating power differed due to differences in local channel slope measured in the field and reach-based average slope measured using GIS. We opted to use the GIS reach slope in the data analysis since power is more of a reach-based variable. Reach and local channel slope are not the same, and this difference must be considered when comparing power measurements using equations and GIS versus field measurements. 7.4.3 The Vulnerability Screen Variables were selected for inclusion in the vulnerability screen based on data analysis indicating a relationship between a given variable and known damages, the availability of quantitative data, and variables used in previous vulnerability screens. Vulnerability scores for each variable was developed based on trends in the data analysis and known patterns of damages from existing structure screenings (see Figure 7-1).
The "specific stream power versus bed resistance" variable was scored based on field data showing a majority of damaged structures in gravel and cobble-dominated channels with specific stream power between 100 and 300 W/m2. Also, the scoring follows the expected pattern of a general increase in vulnerability as SSP increased and bed resistance decreased. An estimate of the dominant channel particle size was used as a proxy for bed resistance, with resistance increasing with particle size.
The "structure width" variable shows that vulnerability increases as the percent of bankfull width covered by the structure's width decreased. Results showed that the majority of structures had widths between 25% and 50% of bankfull channel width, a pattern commonly seen in past bridge and culvert assessments in the region.
The "change in slope" variable indicates that less vulnerability exists when the structure and channel slope are the same. Vulnerability increases as the structure becomes flatter or steeper than the local channel slope. Data suggest that a higher percentage of steeper structures were damaged than flatter structures, and thus the scoring of this variable reflects that trend.
The "sediment continuity" variable considers channel bed process (e.g., aggradation or degradation) upstream and downstream of the structure with the assumption that vulnerability increases if channel processes are disrupted by the structure. For example, structures with aggradation upstream and degradation downstream are likely to be inhibiting sediment transport and can lead to a high level of vulnerability relative to other conditions. Due to the qualitative nature of these field data and the fact that repeat observations seemed to vary widely, the variable was scored on a scale of 1 to 3 to reduce the maximum value, and this gives the variable a lower weighting.
RIVER AND STREAM POWER ASSESSMENT REPORT DEERFIELD RIVER BASIN – MASSACHUSETTS AND VERMONT DECEMBER 2014 (REVISED APRIL 4, 2017)
PAGE 83
Structures identified as "skewed" were considered more vulnerable than those identified as "aligned" for the "structure alignment" variable. The further the structure alignment deviates from being parallel to the direction of flow the more vulnerable the structure is. Due to the qualitative nature of the field observations, the variable was scored on a scale of 1 to 3 to reduce the maximum value, and this gives the variable a lower weighting.
The results of this study show the highest percentage of structures with known damages exists when the vulnerability screen result is "high," and damages tend to decrease for medium and low screen scores. However, it is important to note that some damaged structures do get a vulnerability score of "low," which illustrates the inexact nature of a screening tool. The vulnerability screen is not an exact predictor of damages yet is most appropriately used to flag sites where the potential vulnerability for damages is high or medium. All findings using the vulnerability must be field verified as part of project development. 7.4.4 Data Comparison – Quality Control Check Twenty structures were inspected by MMI using the TU Culvert and Bridge Assessment ("TU+Elev" spreadsheet), MassDOT Culvert Condition Assessment ("Condition" spreadsheet), and UMass Road-Stream Crossing Inventory ("Stream Continuity" spreadsheet) field data forms. The MMI assessment data for each structure were then compared to the prior assessments performed by TU, MassDOT, and UMass for quality assurance purposes. In general, good agreement existed for quantitative variables (e.g., bankfull width and structure dimensions). Most data discrepancies between the assessments occurred for qualitative data (e.g., UMass "Crossing Condition" and TU "Substrate Particle Size"). Some of the differences may be explained by changing field conditions since data were collected a year apart. The MMI assessment reported "None" more frequently for the "Streambed: Erosion/Aggradation/None" and "Deposit Type" fields.
Some large differences in collected data did exist. For example, width measurement for larger bridges varied between the TU and MMI data. TU appeared to be measuring the road span of the bridge while MMI measured the width of the hydraulic opening between the abutments. Larger differences also existed for the "Floodplain filled by roadway" variable. TU consistently indicated more floodplain fill than MMI. MMI observed the amount of floodplain actually covered by the road embankment. Perhaps TU noted the amount of floodplain disconnected from the channel by a road embankment. 7.4.5 Particle Size Data Pebble counts were conducted to identify the substrate characteristics (e.g., median grain size D50) that could represent bed resistance to erosion. Out of the 197 structures assessed by MMI, UMass provided pebble counts for 34, with particle sizes placed into 11 size bins (<2 mm, 2-8 mm, 9-16 mm, 17-64 mm, 65-90 mm, 91-128 mm, 129-256 mm, 257-512 mm,513-1,024 mm, >1,024 mm, and bedrock). MMI used this bin system for pebble counts performed on the
RIVER AND STREAM POWER ASSESSMENT REPORT DEERFIELD RIVER BASIN – MASSACHUSETTS AND VERMONT DECEMBER 2014 (REVISED APRIL 4, 2017)
PAGE 84
remaining 166 structures. When D50 was calculated from the pebble count data it became evident that these bins were too wide, so most of the D50 calculations landed in the same size grouping. The concentration of the data may be obscuring the relationships between D50 and channel characteristics like slope, bankfull width, SSP, and damages.
A qualitative observation of dominant bed particle size was substituted for D50 when developing the "specific stream power and bed resistance" vulnerability screen variable because it seemed to do a better job indicating bed particle size and resolving damages. It is recommended that standard gravelometer-sized bins be used in future work in order to obtain quantitative data on bed resistance.
7.4.6 Structure Damages
Structures with reported damage were assigned a damage code to differentiate between various types of damages and failures (see Figure 7-18). Many damaged structures had more than one associated code, and damage codes appeared to have overlapping definitions (e.g., What differentiates an "overtopped" structure from a structure with "roadway flooding"?). Standardizing and simplifying the damage codes would help with such future analyses.
7.4.7 Data Substitution in Vulnerability Screen The vulnerability screen uses data obtained during MMI field assessments whenever possible. Qualitative data from prior fieldwork conducted by project team members is available for the dominant particle size and structure slope relative to local channel slope. These qualitative data may be substituted for missing field data if necessary but will likely result in a loss of detail in the vulnerability screen. An initial trial was conducted to replace the variable indicating the difference in the slope of the local channel and structure with a qualitative observation of a "steeper" or "flatter" culvert. The loss of detail limited the use of the slope variable to help identify when structure damages are more likely. It may be best to eliminate a variable with missing data rather than substitute qualitative information. More work is needed to determine the best data substitution method.
7.4.8 Future Implementation Work The vulnerability screen can be applied to the full 1,041 structure database for the Deerfield River watershed. It is recommended that local channel slope and structure slope be measured for each structure, but already available qualitative data may be substituted. Based on the results of the vulnerability screen, field investigations of high vulnerability structures can be conducted to verify predictions and develop projects where needed. These data can also be provided to local municipalities to help guide resource allocation for repairs and preventative maintenance for high vulnerability structures.
RIVER AND STREAM POWER ASSESSMENT REPORT DEERFIELD RIVER BASIN – MASSACHUSETTS AND VERMONT DECEMBER 2014 (REVISED APRIL 4, 2017)
PAGE 85
APPENDIX A
GEOMORPHIC SEGMENTATION AND DESCRIPTIONS
In order to describe and assess the Deerfield River in an orderly process, MMI has identified a series of river segments numbered from 1 to 18, with segment 1 at the upstream headwaters and segment 18 at the confluence of the Connecticut River, plus a series of key tributary segments. Remote sensing data was then reviewed for each segment, which were then inspected in the field during 2014. Initial segment boundaries were then adjusted. Each segment is described from upstream to downstream including its geomorphic characteristics and its physical condition. The former includes the length and slope, its planform pattern and profile features, sinuosity, watershed area, channel size, bed material, and a corridor description including infrastructure and floodplains. The break points between individual segments are based on multiple factors including the level of detail needed (effects segment lengths), confluences of major tributaries, valley confinement, changes in stream patterns, hydraulic control points, confinement, dams, and highway crossings. The objective is for each stream segment to have consistent similar hydrology and stream processes. The segment summary is a compilation of various sources including remote sensing (aerial photographs, topography), existing literature, field inspections, channel classification, and interpretations.
RIVER AND STREAM POWER ASSESSMENT REPORT DEERFIELD RIVER BASIN – MASSACHUSETTS AND VERMONT DECEMBER 2014 (REVISED APRIL 4, 2017)
PAGE 86
RIVER SEGMENT NO. 1 FROM: Main Branch headwaters DRAINAGE AREA, SM: 50.9 TO: RM 61 TYPICAL BANKFULL WIDTH: Up to 75 feet RIVER MILES RIVER CHARACTER: Wild LENGTH: 12.1 miles SLOPE: 48.6 feet per mile CORRIDOR CHARACTER: National forest CHANNEL TYPE: B
GENERAL DESCRIPTION The main branch of the Deerfield River originates in rough road less terrain in the Green Mountain National Forest west of National Forest Route (NFR) 71 and south of the rural Stratton-Arlington Road. It flows in a southerly direction parallel to NFR71 to the confluence with the East Branch at RM 61, at the head of Searsburg Reservoir about 2 miles north of the well-known Route 9. The watershed area just before the confluence is a substantial 50.9 square miles. The channel has a steep mean gradient of 48.6 feet (drop) per mile, equal to 0.9 percent. At this gradient, channels generally have many pools and riffles and a coarse substrate. According to the USGS StreamStats hydrology software, the predicted 2-year frequency flood is 1,710 cfs. A new aluminum truss footbridge crosses the main branch near RM 61, leading to the East Branch trail. The straight channel is 75 feet wide at this point with shallow, rapid flow on a cobble bed. The channel is slightly incised and lacks any floodplain. The Rosgen classification is type B3, without any unusual sediment erosion or deposition.
RIVER AND STREAM POWER ASSESSMENT REPORT DEERFIELD RIVER BASIN – MASSACHUSETTS AND VERMONT DECEMBER 2014 (REVISED APRIL 4, 2017)
PAGE 87
RIVER SEGMENT NO. VT East Branch
FROM: East Branch headwaters DRAINAGE AREA, SM: 30.9 TO: Searsburg Reservoir, RM 61 TYPICAL BANKFULL WIDTH: RIVER MILES to 61 RIVER CHARACTER: LENGTH: 15.7 miles SLOPE: 52 feet per mile CORRIDOR CHARACTER: Rural national forest CHANNEL TYPE:
GENERAL DESCRIPTION The headwaters of the Deerfield River originate in the Green Mountains of southern Vermont, immediately west of Stratton Mountain and Mt. Snow resorts. Most of this area is remote, in the Green Mountain National Forest, with few roads. The headwaters area is crossed by the famous Long Trail hiking path. The headwaters include the North Branch, which is east of the East Branch, the main stem, which is west of the East Branch, and the shorter West Branch. The longest of the four headwaters is the East Branch, which begins near the back west side of Stratton Mountain and then was dammed in 1912 to form the giant 1,514-acre Somerset Reservoir that is used for seasonal-scale storage at RM 66. This large reservoir is surrounded by protected wild lands and is popular for nonpower boating. The East Branch then continues on a southerly course to its confluence with the main stem at RM 61 just above Searsburg Dam. It is located in the long, wild valley on the west side of the mountain ridge that includes Mt. Snow and Haystack ski resorts.
RIVER AND STREAM POWER ASSESSMENT REPORT DEERFIELD RIVER BASIN – MASSACHUSETTS AND VERMONT DECEMBER 2014 (REVISED APRIL 4, 2017)
PAGE 88
RIVER SEGMENT NO. 2 FROM: Searsburg Reservoir DRAINAGE AREA, SM: 99.3 TO: Harriman Delta TYPICAL BANKFULL WIDTH: 80 feet RIVER MILES 61 to 56 RIVER CHARACTER: Rapids, cobble bed LENGTH: 5 miles SLOPE: 65.6 feet per mile CORRIDOR CHARACTER: Rural forest CHANNEL TYPE:
GENERAL DESCRIPTION This short river segment extends from the confluence of the East and Main Branches of the Deerfield River at the head of Searsburg Reservoir to the delta at the head of the giant Harriman Reservoir. Flows in this segment are regulated by the Somerset Reservoir upstream along the East Branch plus by flow diversions at Searsburg Reservoir to its off-site pump station. The watershed area along the main branch at the Harriman Reservoir delta is 99.3 square miles with a predicted 2-year flood of 2,260 cfs. From the small 30-acre Searsburg Reservoir, the river flows downstream a short distance to Route 9, then parallels the highway southeasterly to the delta at Harriman Reservoir. There are three significant bridges over the river in just one-half mile as the river and highway share a narrow valley bottom. Route 9 is a major east-west connector across the Green Mountains from I-91 to Route 7. The channel segment from Searsburg Reservoir to Route 9 is in a sinuous, incised bedrock canyon with a measured bankfull width of 80 feet. The channel bed is armored with a static bed of boulders and cobbles with a rapids-type profile. Large boulders are present in some areas. It is a bypass segment with a wood stove pipe, 8-foot-diameter penstock, which runs parallel to the river from the dam to its powerhouse along Route 9. The channel is generally laterally and vertically stable except for local bank erosion such as at the bend by Route 9 at RM 59. The second channel segment that extends parallel to Route 9 to Harriman Reservoir has a wider bankfull width of 110 feet and a flat cross section bed with many cobbles and boulders. The channel is confined by a steep hillslope on one side and highway embankment on the other. It is a Rosgen type B channel.
RIVER AND STREAM POWER ASSESSMENT REPORT DEERFIELD RIVER BASIN – MASSACHUSETTS AND VERMONT DECEMBER 2014 (REVISED APRIL 4, 2017)
PAGE 89
RIVER SEGMENT NO. 3 FROM: Harriman Reservoir RM 56 DRAINAGE AREA, SM: 184 TO: RM 48.5 TYPICAL BANKFULL WIDTH: N/A RIVER MILES RIVER CHARACTER: Reservoir LENGTH: 7.5 SLOPE: N/A CORRIDOR CHARACTER: Mountain valley CHANNEL TYPE: Reservoir
GENERAL DESCRIPTION The 7.5-mile-long Harriman Reservoir is a large storage impoundment used to regulate seasonal flows for the downstream hydropower dams. It is the largest body of water totally within the state of Vermont and was built in 1923 by the New England Power Company, now owned by TransCanada, with a watershed area of 184 square miles. It represents over 10 percent of the Deerfield River's overall length and therefore warrants its own segment designation. The reservoir is formed by a 215-foot-high earth dam with a "morning glory" spillway and has a surface area of 2,039 acres. Most of its perimeter consists of steep forest covered slopes with limited road access. The maximum water depth is reportedly 180 feet with a useable drawdown of 86 feet (TransCanada Northeast, LIHC application). The associated powerhouse, built in 1925, is 2.5 miles downstream and connected by a tunnel. The main Deerfield River enters the northwest end of the reservoir and has formed a 1,500-foot-long sand and gravel delta, up to 500 feet wide. The East Branch Deerfield River discharges into the northeast end of the reservoir. The large impoundment volume and long duration drawdown enable the reservoir to trap and settle most inflow sediments, removing them from channel conveyance. The reservoir is known for fishing, boating, and ice fishing. There are several small boat launches at the north end along Route 9 and along the east side. There are no roads to the west shore.
RIVER AND STREAM POWER ASSESSMENT REPORT DEERFIELD RIVER BASIN – MASSACHUSETTS AND VERMONT DECEMBER 2014 (REVISED APRIL 4, 2017)
PAGE 90
RIVER SEGMENT NO. 4 FROM: RM 48.5, Harriman Dam DRAINAGE AREA, SM: 191 TO: RM 44.6, West Branch TYPICAL BANKFULL WIDTH: 100 RIVER MILES RIVER CHARACTER: Confined rapids, bypass LENGTH: 3.9 segment SLOPE: 37.5 CORRIDOR CHARACTER: Steep hillside
forests CHANNEL TYPE:
GENERAL DESCRIPTION This short river segment extends from the giant Harriman Dam to the confluence with the West Branch Deerfield River at Readsboro, Vermont. This 3.9-mile segment is highly confined on both sides of the river, and its flow is regulated by the dam. It is also a "bypass" segment because the dam diverts water via a long penstock to the off-site Harriman red brick powerhouse downstream of Readsboro, leaving minimal flow in this segment. The channel follows a narrow, sinuous valley with little floodplain due to confinement. It has a gravel and cobble bed and a typical width of 100 feet and shallow depth. The banks are heavily vegetated with road access limited to a section of Route 100 near the village. A 10-foot-high bedrock rapids capped with a low, decayed timber dam is located in the village of Readsboro just before the confluence with the West Branch. Site inspections reveal most of its small pool is filled with debris. Route 100 crosses the river on a high bridge just below the rapids. The total watershed area on the Deerfield River just upstream of the confluence with the West Branch is 191 square miles. The mean segment slope is a moderate 37 feet per mile.
RIVER AND STREAM POWER ASSESSMENT REPORT DEERFIELD RIVER BASIN – MASSACHUSETTS AND VERMONT DECEMBER 2014 (REVISED APRIL 4, 2017)
PAGE 91
RIVER SEGMENT NO. West Branch to Readsboro FROM: Headwater DRAINAGE AREA, SM: 31.8 TO: Readsboro TYPICAL BANKFULL WIDTH: 50 feet RIVER MILES RIVER CHARACTER: Steep LENGTH: 11 SLOPE: 100 CORRIDOR CHARACTER: Rural and confined CHANNEL TYPE:
GENERAL DESCRIPTION The West Branch of the Deerfield River originates in the town of Woodford and flows southeast to join the main channel in Readsboro. The West Branch has a total watershed area of 31.8 square miles and is very steep with a mean channel slope of 100 feet per mile. For 5 miles from Heartwellville to Readsboro, it flows in a fully confined narrow valley parallel to Route 100. Several sections of the highway were destroyed by erosion during Hurricane Irene and had to be rebuilt and the riverbanks reinforced with stone riprap. Each of the highway repairs corresponds to sections where the channel is extra narrow and confined by bedrock or bank boulders. StreamStats predicts the 2-year flood frequency peak flow to be 1,100 cfs and the 100-year to be 4,250 cfs. High failures along the left bank also occurred right in the village behind School Street, 400 feet upstream of Tunnel Road. The Vermont Basin 12 water quality assessment rates the macroinvertebrate community as excellent, and the river supports wild brook and brown trout with great habitat. The West Branch is also a challenging kayak run during high water in the spring. The narrow valley and highway encroachments mean there is no floodplain, and the segment is subject to concentrated stream power and future erosion. Bedrock is visible in some areas. The Branch Hill Road and Tunnel Road bridges cross the West Branch River just before its confluence with the Deerfield River.
RIVER AND STREAM POWER ASSESSMENT REPORT DEERFIELD RIVER BASIN – MASSACHUSETTS AND VERMONT DECEMBER 2014 (REVISED APRIL 4, 2017)
PAGE 92
RIVER SEGMENT NO. 5 FROM: RM 44.6 West Branch Confluence DRAINAGE AREA, SM: 224 TO: RM 42.1, Sherman Dam TYPICAL BANKFULL WIDTH: 120 RIVER MILES RIVER CHARACTER: Rapids and run LENGTH: 2.5 miles SLOPE: 47 feet per mile CORRIDOR CHARACTER: Steep narrow valley CHANNEL TYPE: Incised plain bed
GENERAL DESCRIPTION The Readsboro to Sherman Dam segment has a length of 2.5 miles with a mixture of a confined and semiconfined channel to the Sherman Dam impoundment. Beginning at the small village of Readsboro, there is a large confluence bar at the mouth of the sediment-laden West Branch, and the channel is incised with a high terrace on the left and a lower terrace on the right. Both terraces are developed with roads parallel to the river. The channel top width averages 150 feet as it sweeps into a double bend. A prominent point bar is located along the left bank along a gentle bend followed by a rocky rapids 1 mile downstream of the confluence. At this point, the right terrace has faded out, and Tunnel Road is located close to and overlooking the right bank. The left bank continues to have a ±20-foot-high terrace and narrow vegetated buffer zone, then a ball field, a wastewater treatment lagoon, and then the Harriman Power Plant, at which point the bypass segment ends and the river is back to full discharge. Several mid-channel gravel bars, the beginning of a delta, are present just before the power plant's short tailrace as the river is influenced by the backwater from the Sherman pool. The channel profile for this segment has a mean gradient of 47 feet per mile and is slightly concave, declining near the reservoir. The bed is covered with cobbles and boulders. The bypassed segment has an incised channel measured at up to 187 feet wide at its top of bank and 120 feet at the estimated bankfull elevation. However, the actual wetted width during inspection was only 70 feet with shallow flow. The channel bed edges were grass covered, reflecting the reduced flow rates.
RIVER AND STREAM POWER ASSESSMENT REPORT DEERFIELD RIVER BASIN – MASSACHUSETTS AND VERMONT DECEMBER 2014 (REVISED APRIL 4, 2017)
PAGE 93
RIVER SEGMENT NO. 6 FROM: Sherman Delta DRAINAGE AREA, SM: 236 TO: Sherman Dam TYPICAL BANKFULL WIDTH: RIVER MILES RM 42.0 RIVER CHARACTER: Reservoir LENGTH: 2.0 SLOPE: N/A CORRIDOR CHARACTER: Very steep valley, CHANNEL TYPE: forested
GENERAL DESCRIPTION The Sherman Dam Reservoir is located across the Vermont-Massachusetts border, just upstream of the Village of Monroe Bridge. It is the last large impoundment on the Deerfield River in the downstream direction. The 2-mile-long pool has a surface area of 218 acres and was built for hydropower, weekly pool and release storage. The pool has steep forested hillsides and no floodplains. The 100-foot-high dam is an earth fill structure built in 1927. The former Yankee Rowe Nuclear Power Plant was once located on the banks of the pool, which was used for cooling water, but has been decommissioned and demolished after its 1992 shutdown. The South Branch of the Deerfield River, which originates on the east side of the Hoosic Mountain Range, flows east directly into the Sherman Reservoir. This is a small, steep, rural tributary stream. The dam has a large side channel spillway into a bedrock channel. The backwater from the Monroe Bridge Dam (No. 5) extends a flat water pool 3,500 feet upstream almost to the base of the Sherman Dam. There is a small parking area and boat launch along Tunnel Road providing public access to Sherman Reservoir.
RIVER AND STREAM POWER ASSESSMENT REPORT DEERFIELD RIVER BASIN – MASSACHUSETTS AND VERMONT DECEMBER 2014 (REVISED APRIL 4, 2017)
PAGE 94
RIVER SEGMENT NO. 7 FROM: Sherman Dam DRAINAGE AREA, SM: 253 TO: Fife Brook Dam TYPICAL BANKFULL WIDTH: 100-150 RIVER MILES RM 42 to RM 37 RIVER CHARACTER: Confined, dry bypass LENGTH: 5 miles SLOPE: 50 feet per mile (dryway) CORRIDOR CHARACTER: Confined valley CHANNEL TYPE: Regulated and modified
GENERAL DESCRIPTION The Deerfield River flows through a spectacular steep-sided narrow gorge for 5 miles from the base of the Sherman Dam to the Fife Brook Dam. Within the gorge, the crowded valley bottom has three distinct segments, one after the other, plus River Road along the right bank and a railroad track on the left bank. The Deerfield No. 5 hydropower development in this segment is a complex system built in 1974 and owned by TransCanada. It has a modest height (35 feet) concrete dam at RM 41.2 that backs up a small linear pool to the Sherman Dam and diverts most flow into a 2.7-mile-long headrace canal along and above the right bank to a powerhouse at RM 38.5, which is also at the upstream end of the Fife Brook Dam Reservoir. The 2.7-mile-long bypassed segment of the river is known locally as the "dryway;" it has a narrow, steep channel but little flow except releases timed for special whitewater sports events. Boater access to the dryway in Monroe Bridge is very poor with limited parking near an abandoned factory and few signs. The reported minimum flow is 73 cfs while short-duration sports event releases are up to 1,000 cfs. The dryway is further discussed in various whitewater sports-related web pages. The dryway channel segment has a series of rocky rapids rated whitewater classes II through a challenging IV. Release rates and diversions have been reportedly discussed and negotiated for many years with the owner, TransCanada, and FERC. The FERC license #2323 runs until 2037. The water quality is good; it meets Massachusetts class B standards. The dryway terminates in the Fife Brook reservoir where a parking lot and boat ramp are located. Water levels and flow rates may rapidly change in this segment.
RIVER AND STREAM POWER ASSESSMENT REPORT DEERFIELD RIVER BASIN – MASSACHUSETTS AND VERMONT DECEMBER 2014 (REVISED APRIL 4, 2017)
PAGE 95
RIVER SEGMENT NO. 8 FROM: Fife Dam, RM 37 DRAINAGE AREA, SM: 263 sm TO: River Road bridge TYPICAL BANKFULL WIDTH: 170 ft. RIVER MILES RM 31.5 RIVER CHARACTER: Semiconfined rapids LENGTH: 5.5 SLOPE: 25 feet per mile CORRIDOR CHARACTER: Entrenched sinuous CHANNEL TYPE: valley
GENERAL DESCRIPTION The river segment from the Fife Brook dam downstream to River Road bridge near Zoar Gap is a popular whitewater class II-III run for intermediate skill levels. The flow is totally regulated by the upstream dams. The channel itself is confined to semiconfined by steep valley walls leaving limited space for the disconnected terraces. The wide, shallow channel has a cobble and boulder bed, creating fast runs and some rapids. Alternate and point bars are visible upstream of the railroad bridge during low flow. The bankfull width was measured at 176 feet with a bankfull depth of only 4 feet. Outwash terraces are located on the left bank opposite and downstream of the Hoosic railroad tunnel and used to support a railroad station and village. A larger terrace is located on the right bank beginning near Whitcomb Road and extending downstream for 1 mile. It reportedly was the site of tunnel worker housing in the 1800s. Tunnel Road follows the right bank to the bridge at Zoar Gap, then changes name to Zoar Road. The railroad follows the left bank with the channel conferred between the railroad (left) and highway (right). Hurricane Irene caused 300 linear feet of embankment failures a short distance upstream of the Zoar Gap bridge, in a narrow contraction. An 800-foot-long, high, steep road embankment failure occurred where the narrow 60-foot-wide channel and in-channel boulders contributed to very high velocities at the sharp bend 1 mile upstream of Pelham Brook. The steep, high banks are repaired at both sites with rock riprap but remain vulnerable due to channel geometry. A second embankment failure 400 feet long occurred at RM 34 along a sharp, narrow river bend to the left; it also was repaired with riprap. The railroad follows the left bank, crosses the river near RM 35.5, and goes through the famous Hoosic Tunnel to North Adams.
RIVER AND STREAM POWER ASSESSMENT REPORT DEERFIELD RIVER BASIN – MASSACHUSETTS AND VERMONT DECEMBER 2014 (REVISED APRIL 4, 2017)
PAGE 96
RIVER SEGMENT NO. 9 FROM: Florida Bridge, 31.5 DRAINAGE AREA, SM: 279 TO: Cold River, 29 TYPICAL BANKFULL WIDTH: 175 feet RIVER MILES RIVER CHARACTER: Runs and rapids LENGTH: 2.5 SLOPE: CORRIDOR CHARACTER: Confined rural CHANNEL TYPE: Confined
GENERAL DESCRIPTION Zoar Road and the railroad share the river's left bank from the Florida bridge crossing, past Pelham Brook, to the major confluence with Cold River. This segment of the Deerfield River has a series of fast runs, riffles, and pools with a coarse cobble bed and many boulders. It is a popular recreation area for fishing, tubing, and kayaking. The channel has a single stem with an average width of 175 feet with high firm banks. The forested right bank is fully confined by the steep, forested flanks of Todd Mountain with its pointed crest and narrow ridgeline. The left bank downstream of the bridge has a large public picnic area and canoe launch along the riverbank on a terrace provided by the TransCanada Power Company. The terrace then narrows in the downstream direction crowding the railroad and highway, requiring a riverbank retaining wall to the mouth of Pelham Brook. Pelham Brook enters on the left at RM 30.5. It is a steep, clear-water tributary with step pools and rapids. A locally significant hillside failure occurred recently a few hundred yards upstream of the confluence. Pelham Brook sediments create bed changes in the Deerfield River, including lateral bars and a large riffle. Most noticeably, a large bar present prior to 2010 is largely gone after Hurricane Irene in 2011.
RIVER AND STREAM POWER ASSESSMENT REPORT DEERFIELD RIVER BASIN – MASSACHUSETTS AND VERMONT DECEMBER 2014 (REVISED APRIL 4, 2017)
PAGE 97
RIVER SEGMENT NO. 10 – Zoar Gap Rapids FROM: RM 32 DRAINAGE AREA, SM: 279 TO: TYPICAL BANKFULL WIDTH: 75 RIVER MILES RIVER CHARACTER: Confined, contraction LENGTH: 200 feet SLOPE: 6 percent CORRIDOR CHARACTER: Rock gorge CHANNEL TYPE: A1
GENERAL DESCRIPTION After passing Beaver Island at a sharp right bend, the river channel spreads out to a bankfull width of almost 300 feet. The railroad is on the left bank along the base of Negus Mountain, and River Road is on the right side high above the shallow river. The channel then steadily narrows as it approaches the River Road bridge in Florida. The well-known Zoar Gap Rapids, a popular kayak class IV run, precedes the bridge and has an access point on the right bank prior to the two sets of rapids. The channel width at the primary rapids decreases from over 250 feet to just 75 feet. The rapids begin at a pair of medium boulders in the left central part of the channel, which create whitewater, followed by a series of three giant boulders projecting into the left side of the channel, opposite a line of medium boulders parallel to the right bank, creating a mid-channel chute only 30 feet wide. The head of the chute has at least two submerged boulders that create standing waves and reverse eddies. The chute ends in a deep pool. Easier boat passage and upstream fish passage is along the right bank. A secondary rapids is located a few hundred feet downstream with three main clusters of boulders in the 75-foot-wide trapezoidal channel. They obstruct about 25 percent of the channel's base width. The first cluster has three large protruding boulders in the center and left side of the channel, followed by about four submerged boulders, then a second cluster with two pairs of boulders on each side of the channel with an open slot down the middle. The third cluster of boulders forms an open triangle in the mid channel with enough of a gap to go in the middle slot or on either side, depending on water levels. The rapids have a measured 6-foot drop in a length of 200 feet. The takeout point is on the left bank after the Florida River Road bridge.
RIVER AND STREAM POWER ASSESSMENT REPORT DEERFIELD RIVER BASIN – MASSACHUSETTS AND VERMONT DECEMBER 2014 (REVISED APRIL 4, 2017)
PAGE 98
RIVER SEGMENT NO. Chickley River
FROM: West Hawley DRAINAGE AREA, SM: 27.4 TO: Deerfield River TYPICAL BANKFULL WIDTH: Modified RIVER MILES RIVER CHARACTER: Channelized LENGTH: 10 SLOPE: CORRIDOR CHARACTER: Rural, forest CHANNEL TYPE: Modified
GENERAL DESCRIPTION The Chickley River headwaters are on the high plateau in the towns of Savoy and Plainfield, and much of the land is watershed land state forest. The channel length is 10 miles with a drop of 1,500 feet, leading to a very steep gradient of 150 feet per mile. Its ungauged watershed size is similar to that at the South River gauge, so its runoff rates should be similar to that gauge. The Chickley River drains a rural watershed of 27.4 square miles and flows into the Deerfield River at RM 27.0. The lower main branch is 5 miles long and runs northerly parallel to Route 8A. It was known as a moderate-sized cold-water trout stream that was stocked as part of the salmon restoration program even though downstream dams on the Deerfield River prevent anadromous upstream migration. It had a gravel and cobble bed with excellent forest cover and was listed as a class III whitewater stream. Hurricane Irene caused extensive Chickley River channel erosion, washed out sections of Route 8A, and damaged the Hawley Public Works Department garage. In response, the town engaged a contractor who dredged and channelized approximately 5 miles of river, removing all pools, riffles, and fish habitat, and shaping the banks and new levees with former bed material; all channel boulders and woody material were removed. MassDEP concluded that the contractor significantly deepened and straightened the river in violation of state regulations, isolating it from the floodplain. Emergency road repairs were necessary to reopen Route 8A to traffic. A minimalist river restoration project has been installed based upon a downstream reference segment. The project raised the bed, removed stone linings from the upper banks, and placed some boulders and logs along the bed. However, the channel has not recovered its earlier pool structure and is overly wide and devegetated, and the outlet bridges are partially blocked by coarse sediment. Bank plantings are in progress during 2015. Natural recovery will eventually help revegetate and repair the flood damage to the river corridor. The Town of Hawley does not have a FEMA FIS and, therefore, does not have regulated floodplains or floodways. The middle segment of the Chickley River that was severely damaged by Hurricane Irene has a mean slope of 3.8 percent, a typical flood width of 100 feet, and an estimated bankfull (2 year)

RIVER AND STREAM POWER ASSESSMENT REPORT DEERFIELD RIVER BASIN – MASSACHUSETTS AND VERMONT DECEMBER 2014 (REVISED APRIL 4, 2017)
PAGE 99
discharge of 1,906 cfs based on the South River gauge. The resulting bankfull SSP is a high 307 watts per square meter and a crushing 1,383 watts per square meter for Hurricane Irene. It is not surprising that there was severe erosion to the channel and Route 8A.
RIVER AND STREAM POWER ASSESSMENT REPORT DEERFIELD RIVER BASIN – MASSACHUSETTS AND VERMONT DECEMBER 2014 (REVISED APRIL 4, 2017)
PAGE 100
RIVER SEGMENT NO. 11 – Deerfield River FROM: Cold River Confluence DRAINAGE AREA, SM: 340 TO: Charlemont Center, Route 8 bridge
TYPICAL BANKFULL WIDTH: 175-220
RIVER MILES RIVER CHARACTER: Unconfined alluvial LENGTH: SLOPE: 0.0032 CORRIDOR CHARACTER: Village and pastoral CHANNEL TYPE: C
GENERAL DESCRIPTION The Deerfield River character and condition change immediately after the confluence with Cold River. The latter adds 31.7 square miles of watershed plus a significant sediment load, followed 2 miles downstream by the input from the Chickley River with another 27.4 square miles. The total watershed area at the Route 8A bridge in the center of Charlemont is 340 square miles. After the Cold River delta of fresh coarse sediment, the river flows easterly past a floodprone campground on the right floodplain and under the large Route 2 bridge, then past a picnic area and canoe launch (locally known as "Shunpike") located on the low left terrace, past continuing low terrace geologic formations on both overbanks, to the Route 8A bridge over the river and the center of Charlemont. The channel has several large cobble bars on alternate banks from the Cold River confluence to the Route 2 bridge, representing the input of sediment from the Cold River mass bank failures. The terraces on both banks along Route 2 on the left and along Route 8A on the right are both mapped by FEMA as floodplains. The left floodplain near Legate Road at Route 2 was covered by fresh sediment after Hurricane Irene and has log jams along the banks. Similarly, the riverfront portion of the left bank linear field near Zoar Outdoor was also covered with sand. Aerial photographs show that the right floodplain along West Hawleyville Road flooded. Farther downstream, the school grounds and firehouse flooded, and the wastewater treatment plant's sand filters were out of service for over a year; all of these public infrastructure facilities are in the mapped floodplain. The measured bankfull channel width at the picnic area/boat launch near the Route 2 bridge is 220 feet with high, with well-defined banks and a deep pool with a cobble bed. Limited bedrock was visible at the left bank. Farther downstream at the Zoar Outdoor parking lot and canoe launch, the channel is only 175 feet wide with lower banks, which helps explain why the river overtopped this section. There are several long, shallow riffles in this segment composed of surprisingly large cobble with an estimated D50 of 6 inches. In terms of bed features, there is a large gravel confluence bar at the mouth of the Chickley River that contributes to a riffle at the next bend. The large floodplain on the left bank opposite the Chickley River has a side channel, possibly a remnant channel, on its north side, and there is a half-mile-long mid-channel island on the right half of the channel ending at Zoar Outdoor. The vegetated island has several cross chutes that convey water only during high flow. These fluvial

RIVER AND STREAM POWER ASSESSMENT REPORT DEERFIELD RIVER BASIN – MASSACHUSETTS AND VERMONT DECEMBER 2014 (REVISED APRIL 4, 2017)
PAGE 101
sediment features reflect deposition zones for the additional sediment influx from the Chickley River, so this is an active alluvial zone, encouraged by the channel narrowing past the wastewater treatment plant where higher banks create a semiconfined valley. The twin span railroad bridge and road bridges across the mouth of the Chickley River are both about 50 percent obstructed by gravel and cobble deposits, reflecting the river's high load of coarse bedload sediment. This material should be removed. The asymmetric flow contributes to a scour hole under the railroad bridge. The Route 8A bridge over the Deerfield River at Charlemont is a large, high structure with four spans of steel beams and three concrete piers. The left abutment and left pier are on bedrock. The center pier has a 6-foot scour hole, and the top of the footing is exposed, but the depth of footing or piers is unknown. This 1944 bridge replaced a historic long timber bridge damaged in the great 1938 hurricane.
RIVER AND STREAM POWER ASSESSMENT REPORT DEERFIELD RIVER BASIN – MASSACHUSETTS AND VERMONT DECEMBER 2014 (REVISED APRIL 4, 2017)
PAGE 102
RIVER SEGMENT NO. 12 – Deerfield River FROM: Charlemont, RM 26 DRAINAGE AREA, SM: 361 TO: Dam #4, RM TYPICAL BANKFULL WIDTH: 220' RIVER MILES RIVER CHARACTER: Semiconfined LENGTH: 5.6 SLOPE: 0.0017 CORRIDOR CHARACTER: Rural, farms CHANNEL TYPE:
GENERAL DESCRIPTION As the Deerfield River flows east out of Charlemont center, the left floodplain narrows beyond the wastewater treatment plant and the confluence bar at Mine Brook. The right floodplain also narrows, forcing the railroad and road close together as they pass the side of Thunder Mountain. Most of this segment is partially confined on the right bank, with limited alluvial unconfined floodplains on portions of the left bank. The right bank is generally steep, forested, stable, and nonalluvial. The river is remarkably uniform with a straight alignment and cobble bed. The channel has a series of long pools and riffles, the latter with shallow summer flow with many cobbles and boulders. The pools are typically 3 to 4 feet deep with gravel substrate. The left bank has a discontinuous terrace supporting Route 2, with occasional lower narrow floodplain patches. The terraces support the Academy at Charlemont, the Mile Long Farm, and Hall Tavern Farm. A local schist bedrock control extends along 500 feet of the left bank, east of the Academy, creating a mild rapids with a low flow width of only 90 feet. Elsewhere, the bankfull width is typically up to 260 feet with a cobble and gravel bed. The bankfull depth is only 4 to 6 feet in riffle cross sections. Remnants of a potential former oxbow are present on the low left floodplain near East Oxbow Road. There are significant cobble confluence bars several feet high at most of the tributary confluences. They represent bedload sediments that have moved through the tributaries and are a major source of the Deerfield River substrate material. A large mid-channel island and gravel bars are located at the head of the pool of Dam #4, representing a delta where the Deerfield River bedload sediments settle as they enter the backwater from the dam. The river character begins to change at Wildler Brook (left bank) and Purinton Road (right bank). The valley bottom is unconfined; the bed material composition has more sand and gravel; and the banks have fine-grain cohesive soil. The USGS operates a long-term stream gauge in East Charlemont with a watershed area of 361 square miles. FEMA has published an FIS for Charlemont that includes a map of this segment showing a narrow floodway and floodplain that generally corresponds to geologic map deposits of alluvial outwash material.
RIVER AND STREAM POWER ASSESSMENT REPORT DEERFIELD RIVER BASIN – MASSACHUSETTS AND VERMONT DECEMBER 2014 (REVISED APRIL 4, 2017)
PAGE 103
The FEMA FIS indicates that this long, straight run from its station 27.2 to 21.6 (5.6 miles) has a mean gradient of 0.00172 feet per foot, or 0.17 percent. Based on gauging station flows in this segment, the SSP is a modest 79 watts per square meter, which is barely enough to carry sand, so the channel has little erosion potential. Even during a 100-year flood such as Irene, the SSP in typical 500-foot-wide floodplains is 173 watts, which enables some deposition and no avulsions. This explains why the Hurricane Irene confluence bars are still in place and largely intact, and there is little bank or floodplain surface erosion. In fact, the floodplains were generally deposition areas.
RIVER AND STREAM POWER ASSESSMENT REPORT DEERFIELD RIVER BASIN – MASSACHUSETTS AND VERMONT DECEMBER 2014 (REVISED APRIL 4, 2017)
PAGE 104
RIVER SEGMENT NO. Mill Brook FROM: Charlemont DRAINAGE AREA, SM: 11.9 TO: TYPICAL BANKFULL WIDTH: 30 feet RIVER MILES RIVER CHARACTER: Mountain stream LENGTH: 6 miles SLOPE: 3.1 percent CORRIDOR CHARACTER: Rural, forested CHANNEL TYPE:
GENERAL DESCRIPTION Mill Brook is a steep, rocky mountain stream that discharges in the Deerfield River next to the Charlemont Wastewater Treatment Plant where its confluence bar of sediment could attenuate. It is named after the 18th and 19th Century mills that once lined its banks. The headwaters originate in the mixed forest uplands just south of the Vermont border. The Rosgen type B cobble bed channel flows south parallel to Route 8A through segments with numerous mass bank failures and recent channelization to the Mountain Road bridge. Overbank flooding and extensive deposition occurred during Hurricane Irene down to the former Mill Brook Reservoir and the remnants of its dam and the beautiful restored Bissell wood covered bridge at Route 8A. The downstream channel is in a narrow, rocky gorge to Route 2, then is channelized to the Deerfield River. This clear cold-water mountain stream has excellent trout habitat, dropping 1,000 feet in just 6 miles for a mean gradient of 3.1 percent.
RIVER AND STREAM POWER ASSESSMENT REPORT DEERFIELD RIVER BASIN – MASSACHUSETTS AND VERMONT DECEMBER 2014 (REVISED APRIL 4, 2017)
PAGE 105
RIVER SEGMENT NO. North River FROM: Wilmington, VT DRAINAGE AREA, SM: 92.9 TO: Deerfield River TYPICAL BANKFULL WIDTH: 80-100 feet RIVER MILES RIVER CHARACTER: Broad, flat gravel and LENGTH: 20 miles cobble bottom SLOPE: CORRIDOR CHARACTER: Rural, small farms CHANNEL TYPE: Semiconfined, types B, C, F
on floodplains
GENERAL DESCRIPTION The North River is the largest single tributary to the Deerfield River with a total watershed area of 92.9 square miles. Its East Branch originates on the south side of Wilmington, Vermont, and flows south, parallel to Route 112, to the town of Colrain where it joins the smaller West Branch of the North River. The combined waters then flow south 3.3 miles to the Deerfield River at Shelburne. The North River and its East Branch both have flat erosion-prone bottom lands composed of stratified drift outwash deposits, visible along the channel banks and terrace scarps. The bottom lands are used for corn and grazing. The North River is listed as having class B cold-water fisheries and is a stocked stream. The USGS stream gauge on the North River at Shattuckville has discharge records since 1939 including Hurricane Irene. The latter event is the flood of record, almost three times larger than the second ranked flood, with an average return frequency of just over 500 years. Evidence of the flood is still visible in the valley in the form of road and bridge repairs, bank erosion, and sediment-covered fields. Beginning in Jacksonville, Vermont, the headwaters were measured at only 12 feet wide with a cobble bed and riffles, a Rosgen type B4 classified channel. Farther downstream approaching the Halifax to Colrain town line, there are massive bank failures along the right side at the confined Halifax Gorge, up to 25 feet high by 300 feet long. This section of Route 112 is prone to erosion damage to the embankment due to the narrow confined valley. Channel dredging appears to have occurred near the intersection of Route 112 and Fowler Road. Downstream of the Route 112 bridge near Thompson Road, there has been almost continuous floodplain aggradation over agricultural fields parallel to the river. The typical channel bankfull width is 80 to 90 feet while the deposition zone visible on aerial photography is an average of 400 feet wide (Google Earth). The channel is gradually enlarging, and the floodplain aggrading. In the center of Colrain, there has been flood damage to roads and buildings including the Highway Department garage. The high left bank is eroding at the bend about a half mile downstream of Colrain center.

RIVER AND STREAM POWER ASSESSMENT REPORT DEERFIELD RIVER BASIN – MASSACHUSETTS AND VERMONT DECEMBER 2014 (REVISED APRIL 4, 2017)
PAGE 106
An 8-foot-high dam segment was observed at Griswoldville at the confluence of the East and West Branches. The timber crib spillway failed at its left end, drying out a mill headrace at the BBA Nonwovens Mill. The low right bank near the dam allowed the Irene event to inundate the unconfined floodplain to a width of over 500 feet. This facility has a NPDES permit and wastewater treatment plant that also receives municipal waste. The North River becomes fully confined (type F4 channel) with less floodplain as it approaches the Deerfield River with a coarser cobble bed. It has a bankfull width of 105 feet and bankfull depth of 4 feet, then passes under a 120-foot-wide green steel truss bridge with concrete abutments and into the Deerfield River at a popular swimming and fishing hole known as Sunburn Beach. A USDA Soil Conservation Service report (1990) also discusses the same channel erosion trends, specifically after the 1987 flood. The West Branch of the North River is a significant tributary and was subject to erosion, floodplain overbank flows, and deposition. The confluence area appears to have been dredged to remove excess sediment. The presence of stratified drift and more recent alluvium along the valley bottom enabled common bank erosion and avulsions during Hurricane Irene between Adamsville and Route 112.
RIVER AND STREAM POWER ASSESSMENT REPORT DEERFIELD RIVER BASIN – MASSACHUSETTS AND VERMONT DECEMBER 2014 (REVISED APRIL 4, 2017)
PAGE 107
RIVER SEGMENT NO. 13, Dam #4 to Dam #3, Shelburne Falls
FROM: 19 DRAINAGE AREA, SM: 498 TO: 17 TYPICAL BANKFULL WIDTH: RIVER MILES RIVER CHARACTER: Confined LENGTH: 2.6 SLOPE: CORRIDOR CHARACTER: Confined CHANNEL TYPE: A1, B3
GENERAL DESCRIPTION This segment extends from Dam #4 in Shelburne near the high Route 2 bridge to Shelburne Falls at Dam #3. This short segment has three distinct segments beginning at the 35-foot-high dam. The river flows clockwise around a half loop through an inaccessible narrow, steep, rocky ravine parallel to North River Road to the confluence with the North River at Main Street (Route 112). The combined waters then flow south through riffles to the dam's off-site powerhouse, which receives water from a penstock that cleverly cuts across the "loop." After one more riffle 500 feet downstream of the powerhouse, waters pass under Route 2 and enter the one-mile backwater pool to Shelburne Falls. There are several lateral bars and a riffle, probably reflecting bedload from the sediment-rich North River. The bars have grown during and since the 2011 hurricane. A large, flat terrace is present along the left bank downstream of the North River, with a farm and businesses, and then the terrace is on the right bank below the powerhouse with a lumber mill and DOT maintenance garage. The river remains entrenched to Shelburne Falls without an active floodplain. Water levels rise and fall about 8 feet due to powerhouse needs.
RIVER AND STREAM POWER ASSESSMENT REPORT DEERFIELD RIVER BASIN – MASSACHUSETTS AND VERMONT DECEMBER 2014 (REVISED APRIL 4, 2017)
PAGE 108
RIVER SEGMENT NO. 14, Dam #3 FROM: Shelburne Falls DRAINAGE AREA, SM: 498.4 TO: RM 17.0 TYPICAL BANKFULL WIDTH: 310 (dam pool) RIVER MILES: N/A RIVER CHARACTER: Modified, dam LENGTH: N/A SLOPE: N/A CORRIDOR CHARACTER: Urban village CHANNEL TYPE: Bedrock Falls
GENERAL DESCRIPTION Salmon Falls in the village of Shelburne Falls is a natural waterfall composed of metamorphic gneiss bedrock and is the "headcut" at the upstream end of the 9-mile-long ravine that extends to Upper Road in Deerfield. It has an irregular jagged cascade with a total drop of about 34 feet over a length of 400 feet; the base bedrock has dozens of scoured "potholes." The crest of the falls has a concrete ogee crest spillway dam up to 13 feet high, which is topped by 6-foot-high wood flashboards that provide a total grade change of about 50 feet. Hydroelectric plant #3 is located downstream of the right abutment with a 1,800-foot-long bypass segment. The falls are the first known natural migratory fish barrier upstream from the Connecticut River, but downstream dams are the effective barrier. The village of Shelburne Falls extends along both banks of the river in the towns of Shelburne and Buckland. State Highway 112 crosses the river upstream of the combined falls and dam using a three-span steel truss bridge, and an adjacent five-span concrete arch trolley bridge was converted to pedestrian use and is decorated with flowers. The village supports a moderate tourist trade with several bookstores, art galleries, and restaurants. Several mills have used water power at the falls. During Hurricane Irene, the Bridge of Flowers was flowing full, and water spilled over the right bank along State Street in Buckland, damaging commercial property. State Street is on a narrow, low terrace about 5 feet lower than the left upper bank terrace that supports Water Street and Main Street in Shelburne. State Street is mapped in a FEMA 500-year frequency flood hazard area. The Shelburne and Buckland FEMA studies define the 100-year frequency regulatory base flood at 62,650 cfs. In comparison, the measured flow at the upstream USGS gauge in Charlemont was 54,000 cfs, and the downstream gauge in West Deerfield measured 103,000 cfs. It is likely that Hurricane Irene's peak flows in Shelburne Falls exceeded the 100-year frequency event. Dam #3 obviously raises floodwater levels higher than natural conditions, even when the flashboards break away. The FEMA FIS for Buckland predicts that the 100-year frequency flood would pass under the Bridge of Flowers while the 500-year event would be well over the bridge. This is a reasonable representation of what actually happened during Hurricane Irene.
RIVER AND STREAM POWER ASSESSMENT REPORT DEERFIELD RIVER BASIN – MASSACHUSETTS AND VERMONT DECEMBER 2014 (REVISED APRIL 4, 2017)
PAGE 109
RIVER SEGMENT NO. 15 – Deerfield River FROM: RM 17, Shelburne Falls DRAINAGE AREA, SM: 507 TO: RM 13.2 Dam #2 TYPICAL BANKFULL WIDTH: N/A RIVER MILES RIVER CHARACTER: Impounded LENGTH: 3.8 SLOPE: Impounded CORRIDOR CHARACTER: Rural, forested CHANNEL TYPE: Impounded
GENERAL DESCRIPTION The Deerfield River downstream of Shelburne Falls consists of several flow-regulated bypass segments and impoundments for the next 3.8 miles. The river and its impoundments are fully confined on both sides by steep, high valley walls without floodplains. Immediately below the falls is a 2,000-foot-long shallow, wide bypass segment leading to the Shelburne Falls Dam #3 powerhouse. The powerhouse is located on the right bank at the end of Cricket Field Road, below a large head pool. At this point, all flow is returned to the natural channel and goes immediately into the backwater pool of the Gardner Falls Dam, an older 30-foot-high hydroelectric dam built in 1904 at RM 15.8. The Gardner Falls Dam has a 1,200-foot-long headrace and bypass segment to its powerhouse, also on the right bank. The powerhouse discharges into a short, rocky transition channel leading to the 1.5-mile-long (and narrow) backwater pool for the TransCanada Dam #2, a 70-foot-high structure built in 1913. The railroad is located along the right bank for this entire industrial river segment with its three hydroelectric facilities and essentially no public access. A portion of the modern Mahican-Mohawk Trail extends above the steep left bank, with access near the State Police headquarters on Route 2, but the trail is closed. There are no upstream fish passage facilities, so all fish are blocked by Dam #2.
RIVER AND STREAM POWER ASSESSMENT REPORT DEERFIELD RIVER BASIN – MASSACHUSETTS AND VERMONT DECEMBER 2014 (REVISED APRIL 4, 2017)
PAGE 110
RIVER SEGMENT NO. 16 – Deerfield River FROM: RM 13.2, Dam #2 DRAINAGE AREA, SM: 562 SM TO: RM 7.5, Lower Road TYPICAL BANKFULL WIDTH: 250 RIVER MILES RIVER CHARACTER: Confined runs LENGTH: 5.7 SLOPE: 0.0027 feet per foot CORRIDOR CHARACTER: Rural gorge CHANNEL TYPE: B, F
GENERAL DESCRIPTION This long channel segment is located in a slightly sinuous entrenched valley that is confined by steep forested hill slopes that rise hundreds of feet. The average channel bed slope is a moderate 15 feet per mile (0.0027 feet per foot) with a cobble and bedrock stream bed. The bankfull channel width was measured at two cross sections and tabulated below: Watershed Bankfull
Site Area, SM Width, Ft Bardwells Ferry bridge 528 175 (bedrock influence) Lower Road bridge 562 252 (alluvial) The South River State Forest extends along the right bank for much of the length between Dam #2 and Upper Road. The river has intermittent rapids from Dam #2 to Bardwells Ferry bridge and is fully confined without floodplains. The railroad is on the right bank well above the river, then crosses to the left bank prior to the Bardwells Ferry bridge. The Mahican-Mohawk Trail is on the left bank to the bridge. There are no local roads to the river. Two tributaries, Bear River and Hawkes Brook, are deeply incised to meet the grade of Deerfield River. The Bardwells Ferry bridge over the Deerfield River from Conway to Shelburne is a historic steel truss structure built in 1882 and is on the National Register of Historic Places. It has a one-lane timber deck with a span of 200 feet, supported by stone masonry abutments. The deck is 40 feet above the bedrock channel. The river remains in a deep, steep-sided valley for the next 3 miles to the Stillwater bridge at Upper Road in Deerfield. The wide, shallow single-stem channel has a mild gradient with gravel and cobbles, plus a few boulders. The parallel banks are 200 to 250 feet apart, except at the bridge, with occasional bedrock exposures. The railroad is halfway up the left bank; the foot trail is halfway up the right bank. There are no floodplains in this entrenched, confined valley until the Upper Road bridge. This river reach is popular with recreational tubers.
RIVER AND STREAM POWER ASSESSMENT REPORT DEERFIELD RIVER BASIN – MASSACHUSETTS AND VERMONT DECEMBER 2014 (REVISED APRIL 4, 2017)
PAGE 111
RIVER SEGMENT NO. South River FROM: Ashfield DRAINAGE AREA, SM: 26.3 TO: Deerfield River TYPICAL BANKFULL WIDTH: 50 feet RIVER MILES RIVER CHARACTER: Incised alluvial LENGTH: SLOPE: Mean 1.3 percent CORRIDOR CHARACTER: Agricultural CHANNEL TYPE: B, F
GENERAL DESCRIPTION The South River is a significant tributary to the Deerfield River, with a watershed area of 26.3 square miles. The river originates in the Berkshire uplands of Ashfield west of Ashfield Lake, then flowing east parallel to Route 116 into Conway where it has narrow floodplains at and beyond the village center. South River then flows north in a narrow valley, entering a steeper confined gorge as it downcuts to meet the incised Deerfield River. The confluence is downstream of all Deerfield River dams. The long-term South River gauge in Conway has annual flood data since 1966 with a 2-year frequency flood flow of 1,906 cfs and a 100-year recurrent peak flow of 12,531 cfs. In contrast, Hurricane Irene was originally reported at 13,000 cfs, then revised to 9,300 cfs, resulting in moderate channel erosion and some infrastructure damage. It is noted that the three highest flows over the almost 50 years of record have been in the past 10 years, so channel erosion is to be expected due to increasing frequency of peak flows. Some riverbanks along Route 116 and in the town center have been reinforced. Conway does have a FEMA FIS dated December 1979. Portions of South River received a detailed study, other areas an approximate study. It was noted that there was little floodplain development. At that time, there was only 10 years of gauge data, and the three modern floods had not yet occurred. The FEMA FIS is out of date and underestimates peak flows and the floodplain size. It is our understanding that a Vermont-style Fluvial Erosion Hazard Assessment with delineation was scheduled for 2014-2015. However, this type of empirical assessment does not define flood risk elevations. Bank erosion has occurred and has been repaired in several areas along Route 116 and at the Main Street bridge. High stream power is predicted in the reach approaching Main Street. Stratified drift deposits and legacy deposits at old mill dams and former dams are prone to local erosion. From the center of town at Route 116 and Pumpkin Hollow Brook northwards to Newell Crossing, South River is semiconfined to unconfined with a moderate slope, sinuous alignment, and floodplain used for agriculture. The segment has a 70-foot drop over a length of 2 miles with a mild mean slope of just 0.006 feet per foot. The river then enters a deepening gorge, extending past Graves Road and the Conway Electric Reservoir and dam, to Deerfield River.

RIVER AND STREAM POWER ASSESSMENT REPORT DEERFIELD RIVER BASIN – MASSACHUSETTS AND VERMONT DECEMBER 2014 (REVISED APRIL 4, 2017)
PAGE 112
This steep, nearly inaccessible segment has a valley length of 2.2 miles and mean slope of 0.025 feet per foot. The entrenched channel has rapids and cascades with slides and bedrock control. The end of the segment has a confluence sediment bar at Deerfield River. The Conway Electric Reservoir was reportedly built in 1899 and currently is filled to the dam crest with sandy sediment, storing no water.
RIVER AND STREAM POWER ASSESSMENT REPORT DEERFIELD RIVER BASIN – MASSACHUSETTS AND VERMONT DECEMBER 2014 (REVISED APRIL 4, 2017)
PAGE 113
RIVER SEGMENT NO. 17, Deerfield Meadows FROM: RM 8.0 DRAINAGE AREA, SM: 662 TO: RM 1.5 TYPICAL BANKFULL WIDTH: 170-250 feet RIVER MILES RIVER CHARACTER: Alluvial, unconfined, LENGTH: 6.0 meandering SLOPE: 0.001 CORRIDOR CHARACTER: Farmland on CHANNEL TYPE: C floodplains
GENERAL DESCRIPTION The Deerfield River emerges from its gorge at the Upper Road bridge next to Stillwater Road. The four-span bridge is high above the water, and the 1980 FEMA FIS shows little head loss. The floodplain begins to flare out on both the left and right banks. A small parking lot used by fishermen is located on the right terrace near the south end of the bridge. The gravel bed alluvial channel has a mild bend at the bridge, leading to a sandy point bar under the right span of the bridge. The alluvial Type C channel has a variable width, typically up to 250 feet. Continuing downstream, the river passes under the multispan, high I-91 bridges with concrete beams and steel beams currently being repaired. A town water supply well is on the right floodplain adjacent to the bridge. A large, lightly vegetated bar with a side channel extends under the bridge along the left bank, probably due to the reduced gradient after the gorge. From I-91 to the Route 5 bridge 6.5 miles downstream, the Deerfield River flows across a unique active floodplain that has been farmed since the mid 1600s. The meandering channel is generally on the left side of the valley with point bars and several cutoff chutes at the bends. The type of meander bends, with point bars and chutes, are a Brice Type D. The sand and gravel channel after I-91 has a typical bankfull width of 170 to 250 feet and depth of 12 feet, as tabulated below. A major floodplain is on the right bank.
Station Bankfull Width (ft.) Bankfull Depth (ft.) RM 7.6 225 9 RM 7.5 250 ? RM 5.5 198 13 RM 5.0 170 12+ RM 3.5 245 16 Mean 218 12.5
Mill Village Road and a low stone riprap levee run parallel to the right bank near RM 7 at the farm. The river then bends away from the road and meanders past cornfields. The Deerfield Wastewater Treatment Plant is on the right bank near RM 5, and a large bedrock outcrop is visible along the left bank at RM 4. There are numerous connected and unconnected oxbow lakes and dry meander scrolls on the right floodplain. The 10- to 15-foot-high banks are steep and lightly vegetated, with some bend
RIVER AND STREAM POWER ASSESSMENT REPORT DEERFIELD RIVER BASIN – MASSACHUSETTS AND VERMONT DECEMBER 2014 (REVISED APRIL 4, 2017)
PAGE 114
erosion. But the large hardwood trees in the buffer zone along most of the segment length indicate there is little meander migration. Historic Old Deerfield Village is located on a low terrace at the right (east) side of the valley bottom. Several buildings had wet basements and land damage from Hurricane Irene, but it was the lower fields that had deep (8 foot) inundations and were covered with sediment. The river bends to the right at RM 3 where high bank erosion occurs on the left side opposite a point bar. The Green River then enters on the left near the golf course as one comes to the Route 5 bridge. The natural constriction at and downstream of the Route 5 bridge serves as a throttle, contributing to upstream floodplain inundation and deposition. The surface of the Deerfield Meadows has a slight gradient from south to north, ranging from elevation 145 along Mill Village Road at Stillwater Road to elevation 125 along Pogues Hole Road in the North Meadows. In contrast, Old Main Street in Old Deerfield Village is on a terrace at elevation 154. The FEMA predicted flood elevations are at 134, 140, 143, and 149 for the 10-, 50-, 100-, and 500-year frequency events, largely due to the Connecticut River backwater.
RIVER AND STREAM POWER ASSESSMENT REPORT DEERFIELD RIVER BASIN – MASSACHUSETTS AND VERMONT DECEMBER 2014 (REVISED APRIL 4, 2017)
PAGE 115
RIVER SEGMENT NO. Green River FROM: Headwaters DRAINAGE AREA, SM: 88 TO: Deerfield River TYPICAL BANKFULL WIDTH: 50 RIVER MILES RIVER CHARACTER: Alluvial, gravel bed LENGTH: 30 SLOPE: CORRIDOR CHARACTER: Rural to urban CHANNEL TYPE: Confined to meandering
GENERAL DESCRIPTION The Green River headwaters are in Marlboro, Vermont, from where it extends over 30 miles to the Deerfield River in Greenfield, Massachusetts. Their confluence is just 2.5 miles upstream of the Connecticut River, so the Green River has little influence upon the Deerfield River. The Green River has a significant watershed area of 89 square miles. The Vermont section of the river had significant damage during Hurricane Irene, washing out gravel roads and a small dam in the narrow, steep valley. The river has an important USGS long-term stream flow gauging station near its midpoint. The Massachusetts segment has a FEMA FIS. The middle segment of the river in Massachusetts begins at a small water supply intake and then enters a wider, flat valley with extensive stratified drift deposits of sand and gravel. A small dam and covered bridge washed out at Eunice Williams Drive, and severe bend erosion occurred downstream, leaving large bars and woody debris. A few barbs have since been installed. There is evidence of a cutoff-type avulsion near Auclair Vincent Drive and abandoned meander loops. A town swimming hole near Nash's Mill Road is partially filled with sediment upstream of the I-91 bridge. The downstream reach is impounded by dams at River Road and Meridian Street that block fish passage, followed by rapids in a confined urban area. The wastewater treatment plant is near the river's confluence with Deerfield River.
RIVER AND STREAM POWER ASSESSMENT REPORT DEERFIELD RIVER BASIN – MASSACHUSETTS AND VERMONT DECEMBER 2014 (REVISED APRIL 4, 2017)
PAGE 116
RIVER SEGMENT NO. 18 Outlet FROM: RM 1.5 DRAINAGE AREA, SM: 665 TO: RM -, CT River TYPICAL BANKFULL WIDTH: 300 feet RIVER MILES RIVER CHARACTER: Backwater LENGTH: 1.5 SLOPE: 0 CORRIDOR CHARACTER: Confined CHANNEL TYPE: F
GENERAL DESCRIPTION The last downstream segment of the Deerfield River extends from the Route 5 bridge in Greenfield to the Connecticut River. This is a confined segment, constricted by high ground on both sides, without floodplain. The right side is the north end of the basalt Pocumtuck Range and a rock quarry. The river is subject to backwater from the Connecticut River and effectively has no gradient. The channel bankfull width is typically 300 feet.
RIVER AND STREAM POWER ASSESSMENT REPORT DEERFIELD RIVER BASIN – MASSACHUSETTS AND VERMONT DECEMBER 2014 (REVISED APRIL 4, 2017)
PAGE 117
REFERENCES
Bailey, Robert G., 1995. "Descriptions of the Ecoregions of United States," U.S. Department of
Agriculture Forestry Service, Publication 1391, Washington, DC. Bent, G.C. and Andrew M. Waite, 2013. "Equations for Estimating Bankfull Channel Geometry
and Discharge for Streams in Massachusetts," U.S. Geological Survey Scientific Investigations Report 2013–SISS, Reston, Virginia.
Bent, Gardner C., 2006. "Equations for Estimating Bankfull Channel Geometry and Discharge
for Streams in the Northeastern United States," abstract, Proceedings Eight Interagency Sedimentations Conference, Reno, Nevada.
Caleb, Slater, January 28, 2010. Letter to Fred Ayer from Massachusetts Division of Fisheries
and Wildlife. Coleman, Henry, 1841. Report on the Agriculture of Massachusetts, Counties of Franklin and
Middlesex, Boston. Collins, Matt, 2011. "Flood Frequency Estimate for New England River Restoration Projects,"
NOAA Fishery Services FS-2011-01. Coulton, Kevin, 2014. "Using Soil Data to Map National Floodplains," Water Resources Impact
Vol. 16, No. 2. Davis, William Morris, 1909. "Geographical Essays," Ginn and Co., Boston. Dieck, Jennifer and Larry R. Robinson, 2004. "General Classification Handbook for Floodplain
Vegetation in Large River Systems," Chapter 1 of Collection of Environmental Data, U.S. Geological Survey.
EOEA, 2004. "Deerfield River 5-Year Action Plan," Commonwealth of Massachusetts, Boston,
Mass. EOEA, 2004. "Deerfield River Assessment Report," Commonwealth of Massachusetts, Boston,
Mass. Friesz, P.J., 1996. "Geohydrology of Stratified Drift and Streamflow in the Deerfield River
Basin, Northwestern Massachusetts," WRIR96-4115, U.S. Geological Survey. Happ, Stafford and G.C. Dobson, 1940. "Some Principles of Accelerated Stream and Valley
Sedimentation," Tech Bulletin 695, U.S. Dept. of Agriculture.
RIVER AND STREAM POWER ASSESSMENT REPORT DEERFIELD RIVER BASIN – MASSACHUSETTS AND VERMONT DECEMBER 2014 (REVISED APRIL 4, 2017)
PAGE 118
Hoover, David and Sharon Waltman, 2013. "Soil Survey Information for Floodplain Mapping," USDA-NRCS, National Soil Survey Center.
Howard, A.D., 1996. "Modeling Channel Evolution and Floodplain Morphology," in Floodplain
Processes, Edited by Malcolm G. Anderson et al., John Wiley & Sons. Jacobs, Jennifer, 2010. "Estimating the Magnitude of Peak Flows for Steep Gradient Streams in
New England," prepared for The New England Transportation Consortium NETCR81, Project No. NETC-04-3.
Jain, Vikrant, Kirstin Fryirs, and Gary Brierly, 2008. "Where Do Floodplains Begin? The Role
of Total Streampower and Longitudinal Profile Form on Floodplain Initiation Processes," GSA Bulletin V. 120. N. ½, P. 127-141.
Knighton, A. D., 1999. Downstream Variation in Stream Power. Geomorphology 29(3-4):293-
306. Lane, E. W., 1955. The Importance of Fluvial Morphology in Hydraulic Engineering. In
Proceedings of: American Society of Civil Engineering, Journal of the Hydraulics Division. 81(paper 745):1-17.
Lombard, Pamela J. and Gardner C. Bent, 2015. "Flood Inundation Maps for the Deerfield
River," Scientific Investigation Report 2015-5104, U.S. Geological Survey. MacBroom, James, G., 2014. “Applied Fluvial Geomorphology, 2 end edition, Class Notes for
FES 729”, Yale University, New Haven. Merwade, Venkatesk, 2014. "Flood Inundation Mapping Using SSURGO Soil Data," American
Water Resources Association, 2014 Spring Specialty Conference, Salt Lake City. Montgomery, David and John Buffington, 1993. "Channel Classification, Prediction of Channel
Response, and Assessment of Channel Condition," Washington Timber, Fish, and Wildlife, TFW-SH 10-93-002, Seattle.
Nanson, G.C. and J.C. Croke, 1992. "A Genetic Classification of Floodplains,"
Geomorphology, 4, 459-486, Elsevoir Science Publishers. NCHRP, 2004. "Handbook for Predicting Stream Meander Migration," Transportation Research
Board of the National Academies, Report 533, Washington, DC. Noe, Greg, 2013. "Mapping Floodplains in the Chesapeake Bay Watershed," USGS National
Research Program, Reston, Virginia.
RIVER AND STREAM POWER ASSESSMENT REPORT DEERFIELD RIVER BASIN – MASSACHUSETTS AND VERMONT DECEMBER 2014 (REVISED APRIL 4, 2017)
PAGE 119
Olsen, Scott, 2003. "Flow Frequency Characteristics of Vermont Streams," USGS WRIR 02-4238, U.S. Department of Interior.
River Management Program, 2006. "Vermont Regional Hydraulic Geometry Curves," Vermont
Department of Environmental Conservation. Schiff, R., J. S. Clark, and S. Jaquith, 2008. The Vermont Culvert Geomorphic Compatibility
Screening Tool. Prepared by Milone & MacBroom, Inc. with the VT DEC River Management Program, Waterbury, VT.
Schiff, R., J. C. Louisos, E. Fitzgerald, J. Bartlett, and L. Thompson, 2015. The Vermont River
Sensitivity Coarse Screen. Prepared by Milone & MacBroom for the Vermont Land Trust and its conservation partners, Waterbury, VT.
Smith, Mark, Roy Schiff, Arlene Olivero, and James MacBroom, 2008. "The Active River
Area," The Nature Conservancy, Boston, Mass. Soar, Phillip and Colin Thorne, 2001. “Channel Restoration Design for Meandering Channels”’
ERDC CR-01-1, US Army Corps of Engineers, Vicksburg, Mississippi. Theiling, Charles et al., 2012. "Hydro-Geomorphic Classification and Potential Vegetation
Mapping for Upper Mississippi River Bottomland Restoration," ISBN978-953-51-0361-5, U.S. Army Corps of Engineers.
USDA, 1967. "Soil Survey, Franklin County, Massachusetts," Soil Conservation Service. USDA, 1990. "North River Flood Plain Management Study," Soil Conservation Service,
Amherst, Massachusetts. Walter, Meghan and Richard Vogel, 2010. "Increasing Trends in Peak Flows in the Northeastern
United States and Their Impact on Design," 2nd Joint Federal Interagency Conference, Las Vegas, NV.
Wandle, S. William, 1984. "Gazetteer of Hydrologic Characteristics of Streams in
Massachusetts – Connecticut River Basin," WRIR-84-4282, U.S. Geological Survey. Wiitala, Sulo, Karl Jetter, and Allan Sommerville, 1961. "Hydraulic and Hydrologic Aspects of
Floodplain Planning," Water Supply Paper 1526, U.S. Geological Survey. Wolman, M. G., 1954. A Method of Sampling Coarse River-Bed Material. Transactions of
American Geophysical Union 35:951-956.

RIVER AND STREAM POWER ASSESSMENT REPORT DEERFIELD RIVER BASIN – MASSACHUSETTS AND VERMONT DECEMBER 2014 (REVISED APRIL 4, 2017)
PAGE 120
Yellen, B., J. D. Woodruff, L.N. Kratz, S.B. Mabee, and A.M. Martini, 2014 (in press). "Source, Conveyance, and Fate of Suspended Sediments Following Hurricane Irene, New England USA." Geomorphology.
4297-03-mr2917-rpt.docx
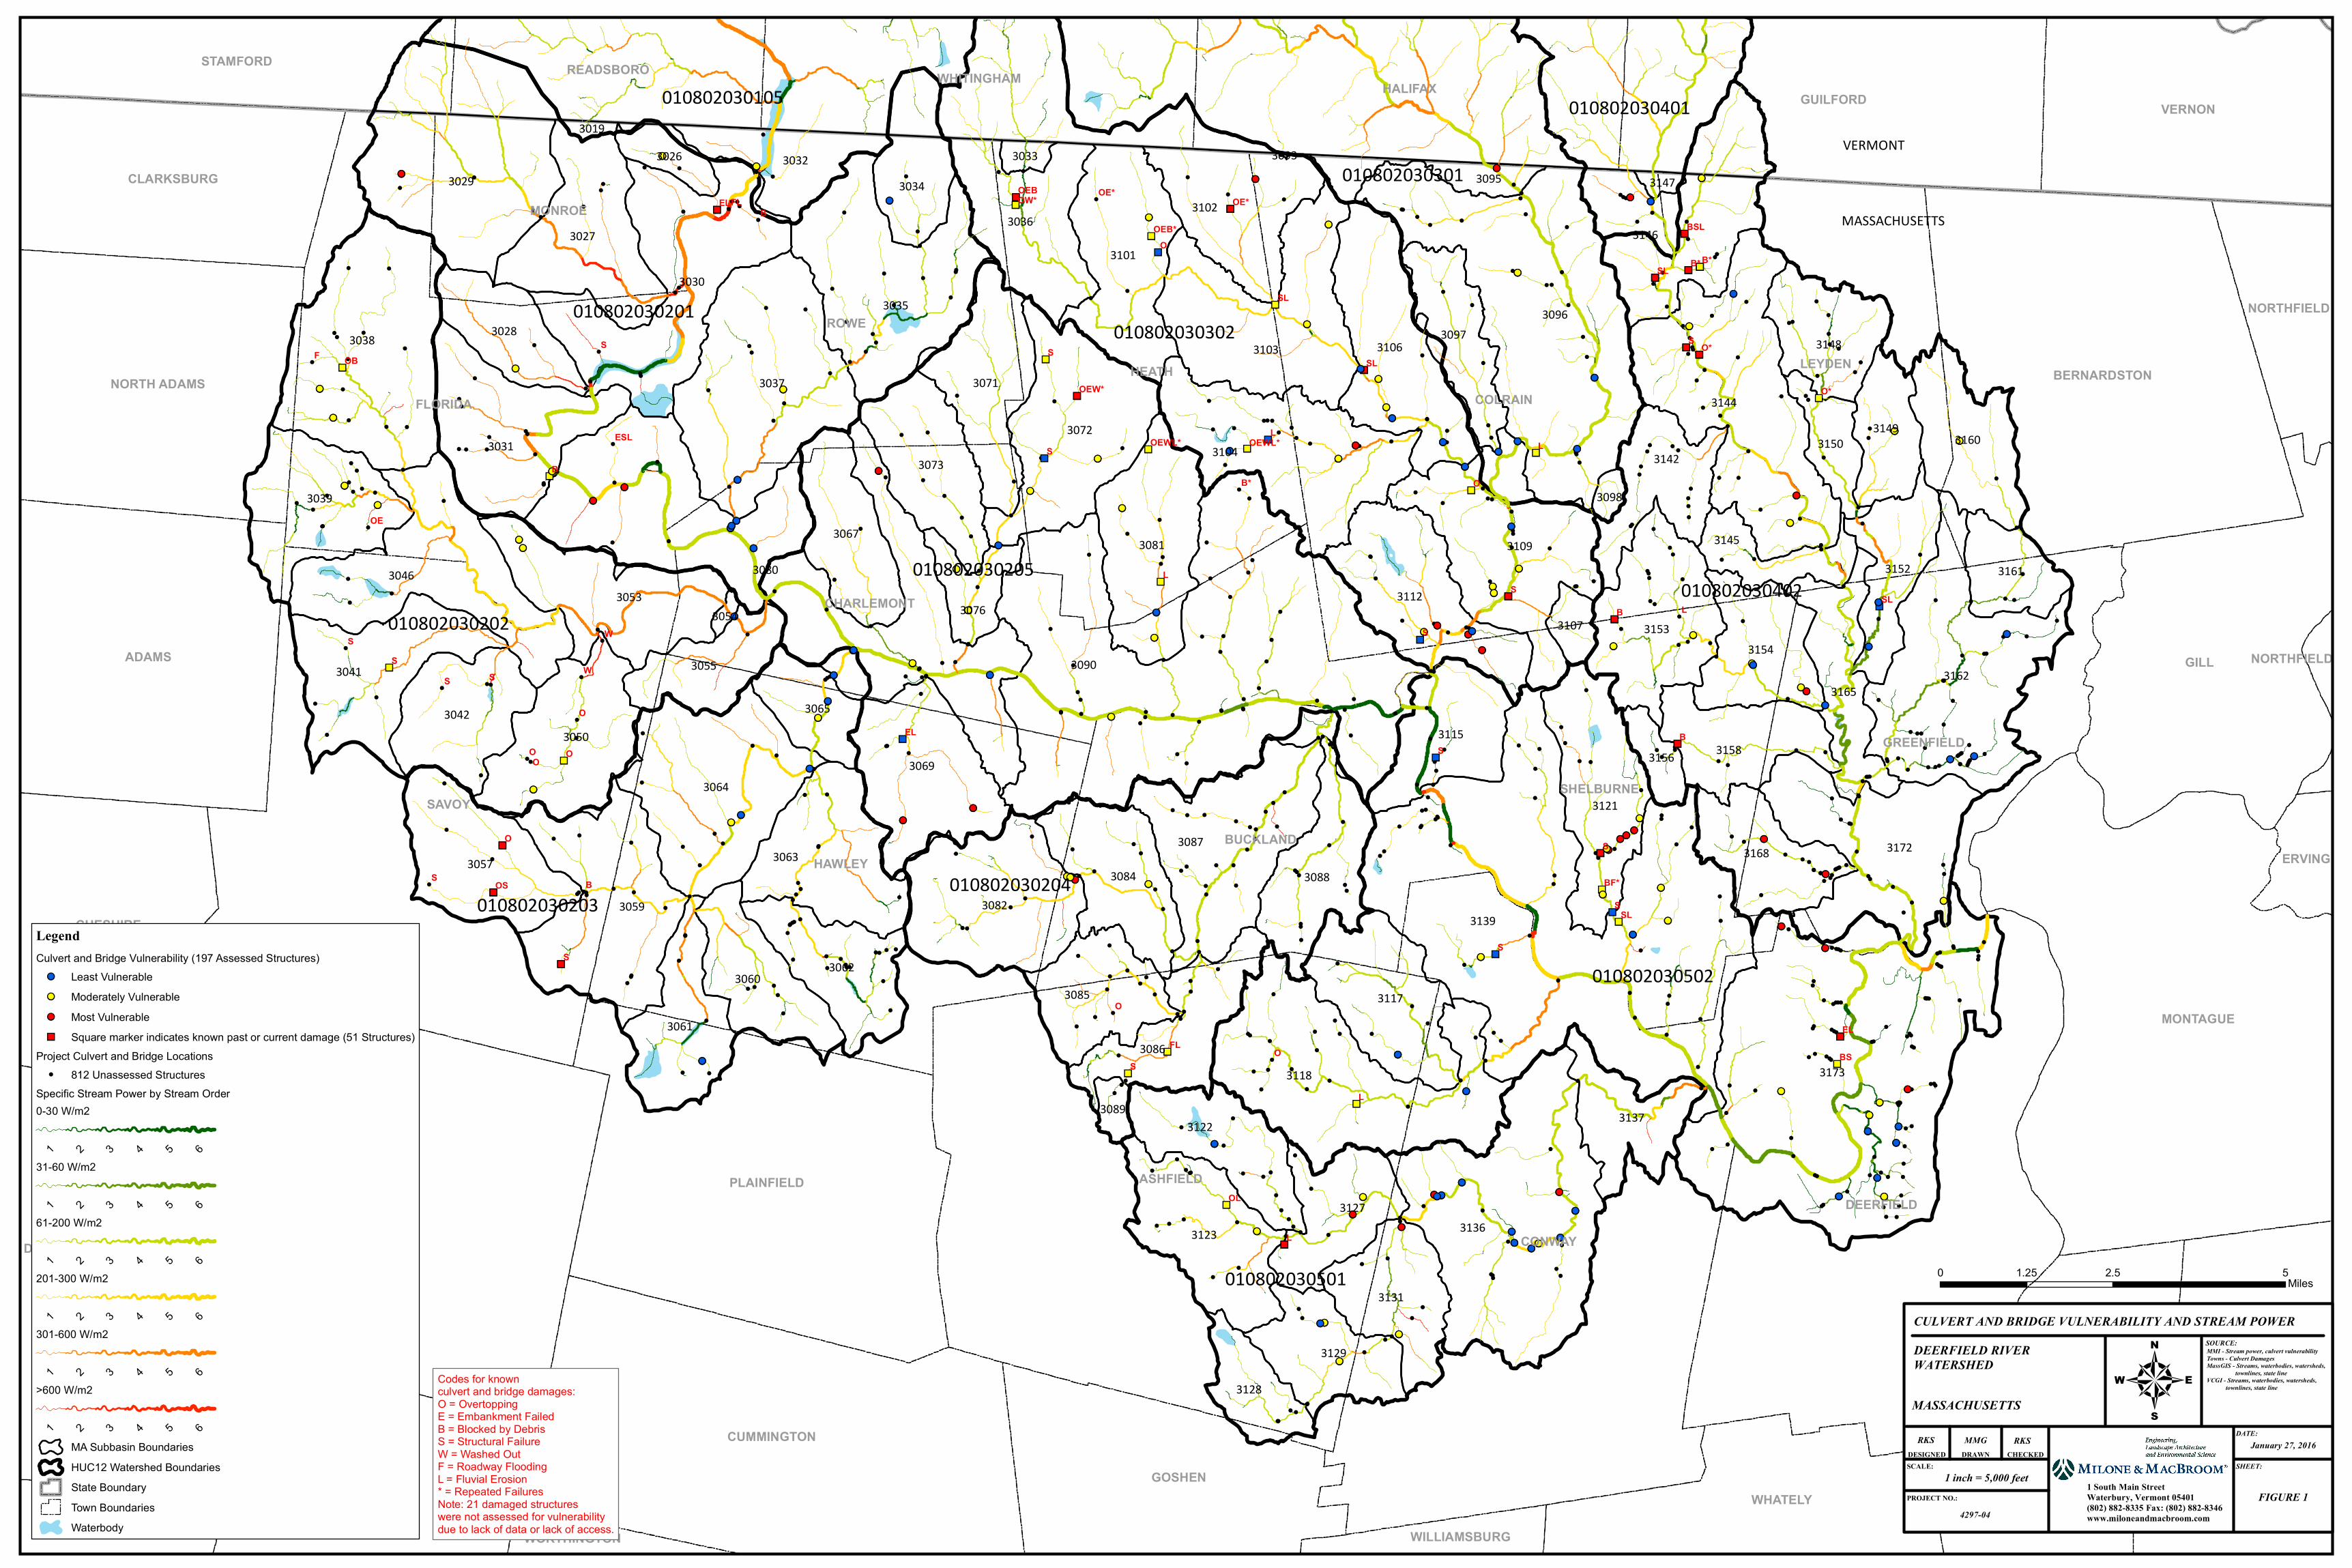
!!!
!!!!
!
!
!! !
!!!! !
! !
! !! !!
! !!
!
!!! !!!!! !
!!! !
! !!
!!
! !! !!!
!
!!
! !! ! !! !!
!! !!! !
!
!!!
!!
!!
!! !! !!
!! ! !! !!
!!
!
! !
!!
!!
! !!
!
!!
!
!
! !
!!
!! !
!
!!!! !!
! ! !
!
!!
!
!
!
!
!!!
!!
! !!
!
!!
! !
!
! !
!!
!!
!!
!!
!
! !!
!
!!!
! !!
!!
! !! !
!!
! ! !!!!!
!
!
!
!
!!!
! !
!!! !
!!
!
!
!
!!
!
!
!!!
!
!!
!
!
!
!!
!!!!!
!!
!!!
!!
!!
!!
!! !!
!
!!
!
!
! !!
! !
!!
!
!!!
! !
!
!!!
!!
!
!
!
!
!
!!!
!
!!!
!
! !
!
!!
!!!
!
!
!
!!
!
!
!!
!!
!
! ! !
! !
!
!
! !!!
!
!!!
! !!
!!
!!
!
! !
!
!
!!
! !
! !!!
!!
!
!
!
! !
!
!
!!
!
!
!
!!
!
!
!
!
!!!
! !
!! !!! !!!!
!
!
!
!
!
!!
!
!!
!
!
!!
!
!
! ! !! !
!
!!
!!!
!
!
!
!
! !!
!! !
!
! !
!! !
!
!!
! !
!
!!
!!
! !
!!!! !!
! ! !
!!
!!
!
!!
!
!
! !
!
!!
!
!!!
! !
!!
!
!
!!
!!!
!
!!
!
!
!
!
! ! !!!
!
!
!
!!
!!
!
!!
!!
!! ! !
!
!!
!
!
! !!!
!
! ! !!
!
!
!
!
!! !
!!
!! !!
!
!
!!
!!
!!!!
!
!
! !!! !!
!
! !
!
!!
! !!! !
!
!
!
!
!!!
!
!
!
!
!
! !!
!
!!
!
!
!
!! !! !
!
! !!
!
!!!!
!!
!
!
!!! !
!
!!!
!!
!
!
!
!
!!!
! !!
!
!
!
!!
! !
!!
!
!!
!!
!!!!
!! !
!
!
! !!
!!!
!
! !
!
!
!
!! ! !
! !
! !
!!
!
!!
!
!!
!
!!
! !! !!
!!
!
!!
!!
!
!!!!
!!
!
!
!
!!!!
!!!
!
!
! !!
! !
!!!
!!
!
!
!
!
!
!!
!!
!
!
!
!
!!
! !
!
!
!
!
!
!! !
! !!
!!
!!
!!!
!
!
!
!! !
!
!!
!!
!!
!!
!
!
!!
!
!
!
!
!
!
!
!
!
! !!
!
!
!
!
!
! !!
!
!
! !
!! !
!! !
!
! !!
!
!!!
!
!!
!!! !
!
!!
!! !!
!
!
! !
!
!!
!!!
!
!
!!
!
!
!
!
!
!
!
!
!!!!
!!
! !!
!!
!
!!!
!!
!
!
!
!
!
!
!
!
! !!
!
!
!
!
!! !
!!! !
!
!
!
!
!!
!
!
!
!!!
!
!! !
!
!
! !
!
!
!
! !
!
!
!!
!
!! ! !
!
!
! !
!
!
! !!
!!
!!
!
! !
!
!
!
!
! !
!
! !
! !
! ! !
!
! !
!!
!
!
!!
!! !! !
!!!
!
!
!!
!!
!
!!
!
!!!
! ! !!
!
!
! !
! !!
!
!
!!
!!
!!!
!
!
!
!
! ! !
!!
!
!! !
!
!!
!! !
!
!
!!
!!! !
!
!
!
!
!
""
""
""
""
""
""
""
""
""
""
""
""
""
""""
""
""
""
""
""
!!
""
!!
""
""
!!
!!
""
!!
!!
""
!!
""
!!
!!
!!
""
!!
!!
!!
!!
""
""
""
!!
!!
""
""
!!
!!
""
!!
!!
""""
!!
""
!!
!!
""
!!
!!
""
!!
!!
!!
!!
!!
""
""
!!
!!
""
""
!!
!!
!!
!!
""
""
!!
""
!!
!!
!! !!
!!
""
!!
""
!!
!!
!!
""
!!
!!
!!
""
!!
""
!!
""
""
!!
!!
!!
!!
!!
""
!!
!!
""
!!
!!
!!
!!
""
!!
!!
!!
!!
!!
""
!!
!!
!!
!!
!!
!!
""
""
!!
!!
!!
!!
""
!!
!!
!!
!!
""
!!
!!
!!
""
!!
!!
!!
""
!!
!!
!!
!!
!!
""
!!
!!
"" !!
!!
!!
!!
!!
""
!!
!!
!!
!!
""
!!
!!
!!
!!
!!
!!
!!""
!!
!!
!!
!!
!!!!
!!
!!
!!
!!!!
!!
""
!!
!!
!!
!!
!!
!!
""
!!
!!
!!
!!
!!
!!
!!
!!
!!
""
!!
!!
!!
""
!!
!!
!!!!
!!
!!
!!
!!
!!
!!
!!
!!
!!
!!
!!
!!
!!
!!
!!
!!
!!
!!
!!
!!
!!
!!
!!
!!
!!!!
!!
!!
!!
!!
!!
!!
!!
!!
!!
!!
!!
!!
!!
!!
!!
!! !!
!!
!!
!!
!!
!!
!!
!!
!!
!!
!!
!!
!!
!!
!!
!!
!!
!!
!!
!!
!!
!!
!!
!!
!!
!!
!!
!!
!!
!!
!!
!!
!!
!!
!!
!!
!!
!!
!!
!!
!!
!!
!!
!!
!!
!!
!!
!!
!!
!!
!!
!!
!!
!!
!!
!!
!!
!!
!!
!!
!!
!!
!!
!!
!!
!!
!!
!!
!!
!!
!!
!!
!!
!!
!!!!
!!
!!
!!
!!!!
!!
!!
!!
!!
!!
!!
!!
!!
!!
!!
!!
!!
!!
!!
!!
!!
!!
!!
!!
!!
!!
!!!!
!!
!!
MASSACHUSETTS
VERMONT
B
O
SS SF
LLS
OB
LS
LBSWS
SWSS
O
BSO OO
SO
S BS
SS
O
OS
L
L
FLEL
B*B*SL
SL
O*SLOB
O*
B*
OE
SL
EL
OS
SL
ELFL
BS
OL
OEB OE*OW* OE*
BSL
ESL
BF*
OEB*
OEW*
OEWL*OEWL*
SAVOY
COLRAIN
CONWAY
ASHFIELD
ROWE
HEATH
WINDSOR
HAWLEY
GILL
DEERFIELD
FLORIDA
MONTAGUE
LEYDEN
ADAMS
PERU
SHELBURNE
CHARLEMONT
PLAINFIELD
BUCKLAND
GREENFIELD
CUMMINGTON
BERNARDSTON
MONROE
GOSHEN
LEVERETT
NORTH ADAMS
CHESHIRE
WHATELY
SUNDERLAND
HINSDALE
CLARKSBURG
DALTON
NORTHFIELD
ERVING
WILLIAMSBURGWORTHINGTON
NORTHFIELD
HALIFAX GUILFORD VERNON
WHITINGHAMSTAMFORD READSBORO
3090
3139
3173
3080
3096
3136
3144
3118
3038
3162
3037
30303035
3103
3064
31093046
3104
3059
3029
31723087
3072
3082
3106
3031
3069
3101
3112
3081
3053
3050
31463027
3153
3041
3123
3063
3121
3057
3039
3117
30363102
3071
3084
3073
3042
3088
3160
3122
30863061
3062
3131
3115
3067
3154
3085
3168
3060
3158
3129
3127
3165
3142
3148
3137
3097
3152
3028
3055
3032
3149
3161
3065
3128
3034
3145
3076
3150
30953026
3156
3107
3089
30333147
3098
3019
3054
3093
010802030402
010802030502
010802030205
010802030201010802030302
010802030202
010802030203
010802030301
010802030501
010802030204
010802030105 010802030401
CULVERT AND BRIDGE VULNERABILITY AND STREAM POWER
DEERFIELD RIVER WATERSHED
MASSACHUSETTS
MMG
4297-04
January 27, 2016
FIGURE 11 South Main StreetWaterbury, Vermont 05401(802) 882-8335 Fax: (802) 882-8346www.miloneandmacbroom.com
DESIGNED DRAWN CHECKEDSCALE:
PROJECT NO.:
DATE:
SHEET:
41 inch = 5,000 feet
SOURCE:
LegendCulvert and Bridge Vulnerability (197 Assessed Structures)!! Least Vulnerable!! Moderately Vulnerable!! Most Vulnerable"" Square marker indicates known past or current damage (51 Structures)
Project Culvert and Bridge Locations ! 812 Unassessed Structures
Specific Stream Power by Stream Order0-30 W/m2
1 2 3 4 5 631-60 W/m2
1 2 3 4 5 661-200 W/m2
1 2 3 4 5 6201-300 W/m2
1 2 3 4 5 6301-600 W/m2
1 2 3 4 5 6>600 W/m2
1 2 3 4 5 6MA Subbasin BoundariesHUC12 Watershed BoundariesState BoundaryTown BoundariesWaterbody
MMI - Stream power, culvert vulnerabilityTowns - Culvert DamagesMassGIS - Streams, waterbodies, watersheds, townlines, state lineVCGI - Streams, waterbodies, watersheds, townlines, state line
0 2.5 51.25Miles
RKS RKS
Codes for known culvert and bridge damages:O = OvertoppingE = Embankment FailedB = Blocked by DebrisS = Structural FailureW = Washed OutF = Roadway FloodingL = Fluvial Erosion* = Repeated FailuresNote: 21 damaged structures were not assessed for vulnerabilitydue to lack of data or lack of access.