Embed Size (px)
Citation preview

Rita Popat, PhDClinical Assistant Professor
Division of EpidemiologyStanford University School of Medicine
August 7, 2007
Rapid appraisal of the literature:
Identifying study biases

What is critical appraisal?
Balanced assessment of benefits and strengths of research against its flaws and weaknesses
Assessment of research process and results
To be undertaken by all health professionals as part of their work

Why should we critically appraise?
Published research is not always valid – we cannot take conclusions for granted, even if the article is published in a peer-reviewed journal.
Published research is not always relevant – the abstract may indicate relevance but you will need to read the complete article to judge its applicability to your own practice/circumstances.
To improve clinical effectiveness, we need a systematic framework to interpret research, rather than relying on a haphazard or casual approach.
3

Key Steps To Effective Critical Appraisal
1. Are the results valid?
2. What are the results?
3. How will these results help me work with my patients?
4
Focus of today’s lecture
Outline
Quick review of study designs
What is validity?
Identifying study biases that can threaten
internal validity
5

Observational vs. Experimental Studies
Experimental studies – the investigator tries to control the environment in which the hypothesis is tested (the randomized, double-blind clinical trial is the gold standard)
Observational studies – the population is observed without any interference by the investigator
6

Why Observational Studies?
Cheaper Faster Can examine long-term effects Hypothesis-generating Sometimes, experimental studies are not
ethical (e.g., randomizing subjects to smoke) Sometimes, experimental studies are not
possible – examples… randomizing subjects to gestational
diabetes studying natural progression of a disease studying long term effects of drugs
7

THE LANCET • Vol 359 • January 5, 2002

Cohort Studies
Target population
Exposed (E+)
Not Exposed (E-)
Disease-free cohort
Disease (IE+)
Disease-free
Disease (IE-)
Disease-free
TIME
9

a b
c d
E
E
I
I
dc
cba
a
RR
Outcome-
Exposure +
Exposure -
Outcome+
a + b
c + d
Incidence (probability) of outcome among exposed
Incidence (probability)of outcome among unexposed
10
Measure of association in cohort studies:
Relative Risk (RR)

376 12560
985 23957
73.00395.0
029.0
24942985
12936376
RR
T2DM-
Active †
Inactive
T2DM+
12936
24942
11
Interpretation: Active women are 27% less likely to develop T2DM compared to inactive women
†Energy expenditure was at least 1000 kcal/wk.

Cohort Studies: Advantages & Disadvantages
Advantages Allows you to measure true rates and risks of disease
for the exposed and the unexposed groups.
Temporality is correct
Can be used to study multiple outcomes.
Prevents bias in the ascertainment of exposure that may occur after a person develops a disease.
Disadvantages
Can be lengthy and costly!
Loss to follow-up is a problem (especially if non-random).
12

Target population
Exposed in past
Not exposed
Exposed in the past
Not Exposed
Case-Control Studies
Cases
(outcome +)
Controls
(outcome -)
13

Disease (D+)Cases
No disease(D-)Controls
Exposure (E+) a b
No exposure(E-) c d
14
Measure of Association in case-control studies: Odds Ratio (OR)
OR = Odds of exposure among controls
Odds of exposure among cases )|(
)|(
DEP
DEP
=
)|(
)|(
DEP
DEP=
caccaa
dbddbb
=
bc
ad
a+c b+d

15
Cases Controls
NSAIDS+ 561 971
NSAIDS- 71 74
15
60.0)971)(71(
)74)(561(OR
Interpretation: NSAIDs use is associated with a 40% reduction in the risk of colon cancer

Case-Control Studies: Advantages & Disadvantages Advantages:
• Cheap and fast• Great for rare diseases
Disadvantages:• Exposure estimates are subject to
• recall bias (those with the disease are searching for reasons why they got sick and may be more likely to report an exposure)
• interviewer bias (interviewer may prompt a positive response in cases).
• Temporality is a problem (did exposure cause disease or disease cause exposure?)
16

Intervention Studies
Target population
Intervention group
No intervention group
Disease-free cohort
Disease
Disease-free
Disease
Disease-free
TIME
17

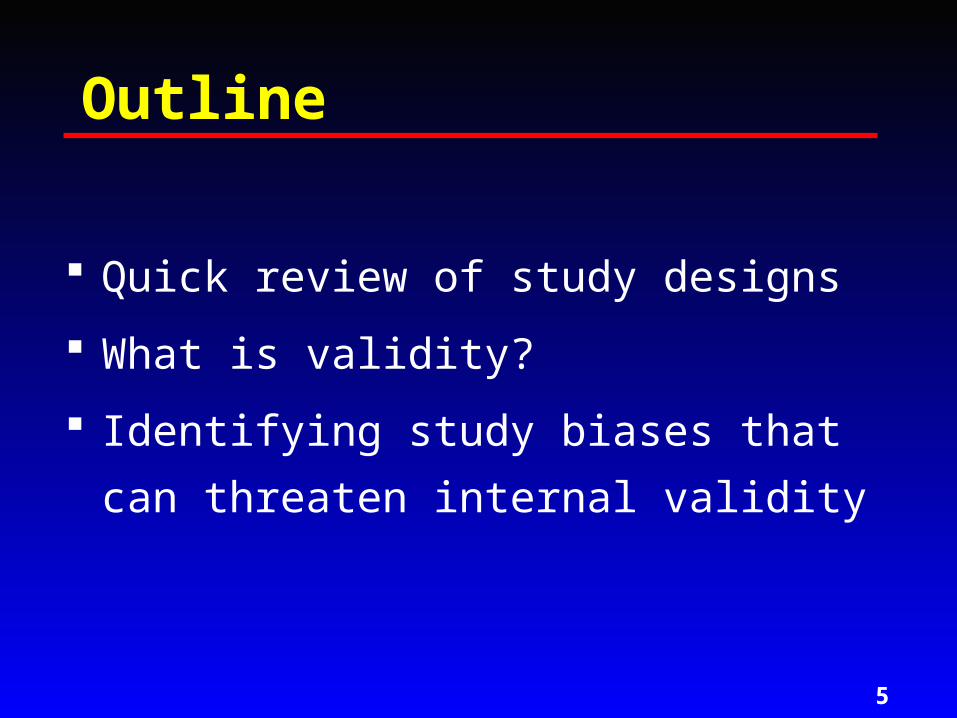
Eligible participants
RandomizedStandard lifestyle recommendations
Intensive Metformin PlaceboLifestyle(n = 1079) (n = 1073) (n = 1082) 18
DPP trial: Primary Outcome - Diabetes
19

Intervention Studies: Advantages & Disadvantages
Advantages:• Allows randomization (controls for confounding)• Allows double-blind assessment (controls bias)
Disadvantages:• Can be lengthy and costly! • Loss to follow-up is a problem (especially if non-
random).• Ethical limitations
20

Causation in human health & disease
Association does not prove causation
• If a putative risk factor and the occurrence of an outcome are strongly associated with each other it does not provide evidence that the risk factor causes the disease, only implies that it is correlated with outcome
• Non-causal explanations may cause a spurious association – study biases (measurement error, selection bias, confounding, sampling error)
21

Study validity
INTERNAL VALIDITY
EXTERNAL VALIDITY
22
Do we believe the results?
Can the results be applied to the target population i.e., beyond the subjects in the study?

Threats to Internal validity: Non-causal explanations due to study biases
Confounding
Selection bias
Misclassification bias (measurement error)
23

Confounding
Confounding is the defined as a distortion of an exposure-outcome association brought about by the association of another factor with both the outcome and exposure
exposure outcome
Confounding factor
24

Research question - Is physical activity associated with risk of T2DM?
Physical activity T2DM
BMI++
25Potential confounder
JAMA. 2004;292:1188-1194

Why worry about confounding?
Spurious association
Exaggerate an association (over-estimate)
Attenuate an association (under-estimate)
Obscure an association
26

Methods for controlling confounding
Design phase• Randomization• Matching• Restriction
Analysis phase: statistical adjustment for confounders
27

Controlling confounding by randomization

Identifying potential confounders
Subset of Table 1 from JAMA. 2004;292:1188-1194

Statistical adjustment for confounding
Is BMI a confounder of the relationship b/w physical activity and T2DM?
Compare the crude hazard ratio (HR) to the adjusted HR.
Weinstein et al. JAMA 292:1188-94
Crude HR =2.9/3.9 = 0.74

Statistical adjustment for confounding Weinstein et al. JAMA 292:1188-94
10% rule for identifying confounders:(Crude HR - Adjusted HR) X 100 10%
Crude HR

True or false
A randomized clinical trial design cannot be affected by bias due to confounding?
Answer: False (if randomization is not done appropriately, then can introduce bias due to confounding)
32
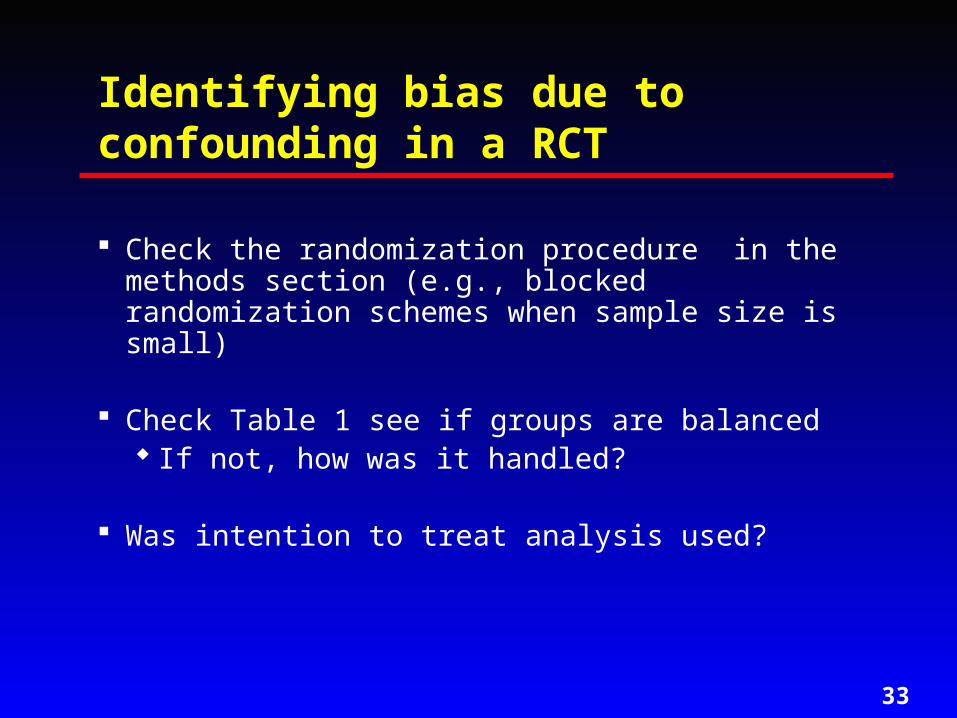
Identifying bias due to confounding in a RCT
Check the randomization procedure in the methods section (e.g., blocked randomization schemes when sample size is small)
Check Table 1 see if groups are balanced If not, how was it handled?
Was intention to treat analysis used?
33

JAMA. 2006;296:2441-2450

JAMA. 2006;296:2441-2450

Selection bias
A form of sampling bias due to systematic differences between those who are selected for study (or agree to participate) and those who are not selected (or refuse to participate).
36

Selection bias Improper selection of cases or controls in a case-
control study Subjects lost to follow-up varies according to both
the exposure of interest and the outcome (e.g., in prospective cohort studies and clinical trials)
Can affect any study design, although case-control studies more prone to selection bias
Selection bias can cause either overestimates or underestimates of the true associations between the exposure and disease in the underlying population
37

Identifying Selection bias What are the response rates?
Was follow-up complete? Ideally should have follow-up for at least 80% of
the initial sample/cohort
Does drop out differ in the groups being compared (e.g., treatment and placebo groups)?
38

Selection bias example:
In this case-control study, response rate was ~80% in cases and ~60% in controls.
Could there be selection bias…especially among controls?
39

Selection bias example:
So observed proportion of NSAID users among controls (92.9%) is greater than true proportion of exposure
Hence observed odds ratio of 0.54 is an overestimate (i.e., true odds ratio is greater than 0.54)
[Note that Odds ratio = p1* (1- p2) / p2 *(1- p1)]
Scenario: NSAID users in the base population were more likely to participate in this study than were non-NSAID users
p1 p2
40

Some strategies for minimizing selection bias
Careful enumeration and thorough attempts at recruiting all cases within the source population
High standards for methods of control selection (population-based ideal)
Minimizing non-response and refusals
Minimizing loss to follow-up (in cohort and RCTs)
41

Information bias (aka measurement error)
Misclassification of outcome Misclassification of exposure status
42
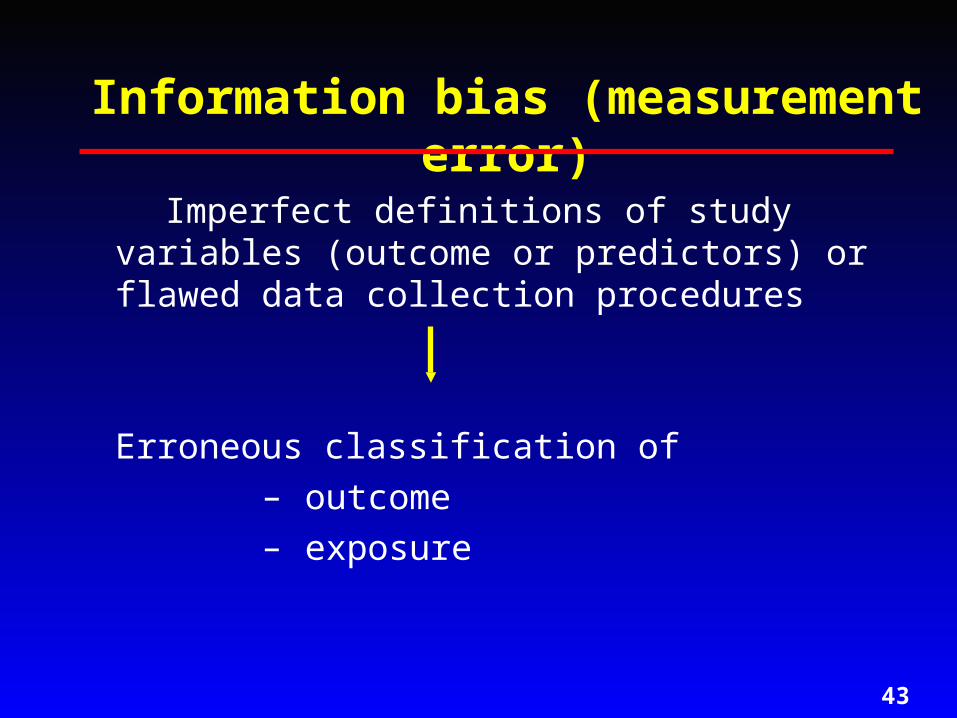
Information bias (measurement error)
Imperfect definitions of study variables (outcome or predictors) or flawed data collection procedures
Erroneous classification of – outcome– exposure
43

Information bias misclassification
Study
Gold-standard
b+da+c
c+dd
TN
c
FNOutcome -
a+bb
FP
a
TPOutcome +
Outcome
-
Outcome
+
Sensitivity = a / (a+c)
Specificity = d / (b+d)
44

45
Outcome + Outcome -
Exposure + (treatment)
a b
Exposure –(placebo)
c d
45
Misclassification of the outcome
Non-differential misclassification occurs when the degree of misclassification of outcome is independent of exposure status Tends to bias the association toward the null Occurs when the sensitivity and specificity of the
classification of outcome are same for exposed and non-exposed groups but less than 100%

46
Outcome + Outcome -
Exposure + (treatment)
a b
Exposure –(placebo)
c d
46
Misclassification of the outcome
Differential misclassification occurs when the degree of misclassification differs between the groups being compared. May bias the association either toward or away from
the null hypothesis Occurs when the sensitivity and specificity of the
classification of outcome differ for exposed and non-exposed groups

47
Cases Controls
NSAIDS+ 561 971
NSAIDS- 71 74
47
Most likely scenario in this study
Misclassification of the outcome: NSAIDs and colon cancer example
Is misclassification of outcome likely to be non-differential or differential with respect to exposure?

Study Measures
The primary measures were the Medical Outcomes Study 36-Item Short- Form Health Survey (SF-36) bodily pain and physical function scales and the American Academy of Orthopaedic Surgeons MODEMS version of the Oswestry Disability Index (ODI).
Secondary measures included patient self-reported improvement, work status, and satisfaction with current symptoms and with care. Symptom severity was measured by the Sciatica Bothersomeness Index (range, 0-24; higher scores represent worse symptoms).
JAMA. 2006;296:2441-2450
Is misclassification of outcome likely to be non-differential or differential with respect to exposure?


50
Cases(outcome +)
Controls(outcome -)
Exposure + a b
Exposure - c d
50
Misclassification of the exposure
Non-differential misclassification occurs when the degree of misclassification of exposure is independent of outcome/disease status Tends to bias the association toward the null Occurs when the sensitivity and specificity of the
classification of exposure are same for those with and without the outcome but less than 100%

51
Cases(outcome +)
Controls(outcome -)
Exposure + a b
Exposure - c d
51
Misclassification of the outcome
Differential misclassification occurs when the degree of misclassification differs between the groups being compared. May bias the association either toward or away from the
null hypothesis Occurs when the sensitivity and specificity of the
classification of exposure differ for those with and without the outcome
52
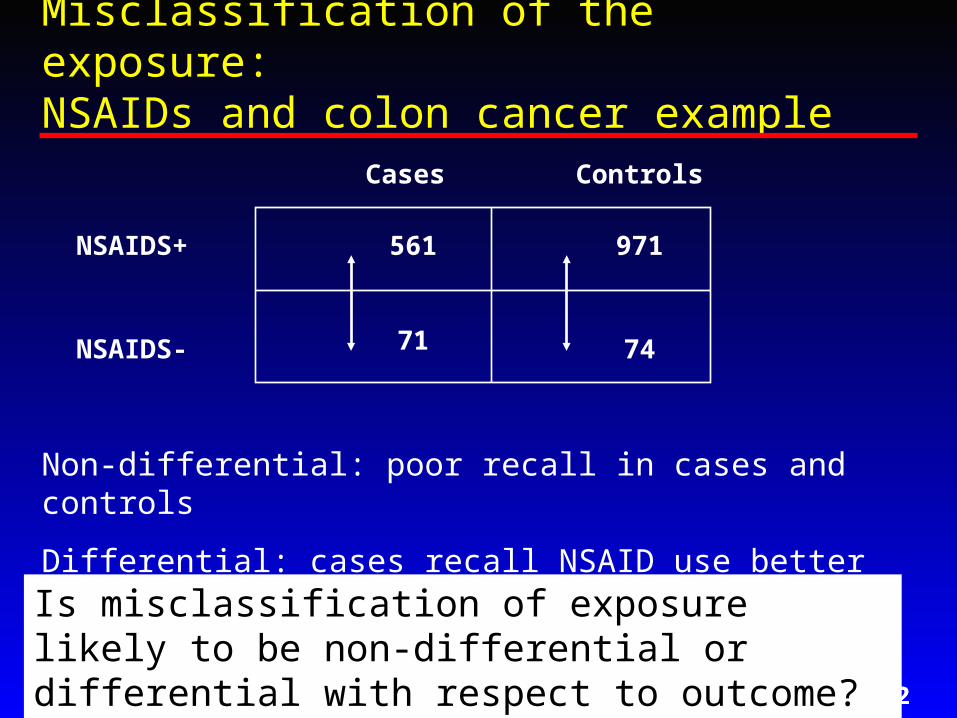
Cases Controls
NSAIDS+ 561 971
NSAIDS- 71 74
52
Non-differential: poor recall in cases and controls
Differential: cases recall NSAID use better than controls?
Misclassification of the exposure: NSAIDs and colon cancer example
Is misclassification of exposure likely to be non-differential or differential with respect to outcome?

Some strategies for minimizing misclassification bias Test reliability and validity of instruments used to
determine outcome and exposure
Similar methods for determining outcome and exposure in all study subjects
Train interviewers, blind interviewers to outcome status and study hypothesis ( interviewer bias)
Blind subjects to study hypothesis ( recall bias)
Use incident cases in case-control studies, not prevalent ( recall bias)
Try to use objective measures (e.g., pharmacy records vs. self-report use of medications)
53

Summary : Study designs and biases
54
Threats to internal validity
Case-control Cohort RCT
Confounding Generally present Generally present Not likely (due to randomization)
Selection bias Likely (e.g., when low response
rates)
May occur due to differential loss to
follow up
May occur due to differential loss to
follow-up
Misclassification of exposure
More likely to be differential
Generally non-differential
Not likely; if exists then non-differential (e.g., drop-in/drop out)
Misclassification of outcome
Most likely non-differential
Most likely non-differential
Most likely non-differential

Once you are satisfied the study findings are valid…
You can now ask whether the association causal?
Evaluate positive features of causation Temporality Strength of the association Dose-response relationship Consistency of findings Biologic plausibility
55

Experiment/RCT
Prospective cohort
Retrospective cohort
Case-control
Correlation/x-section
Case series
Case report
Proofof cause
Cost andease
Best
Best
56
Critical appraisal tools
Assist with systematic critique of published research papers
Several tools available
One of my favorite… http://www.muhc-ebn.mcgill.ca/EBN_tools.htm#evidence and look for link to “CASP Appraisal Tools”
57
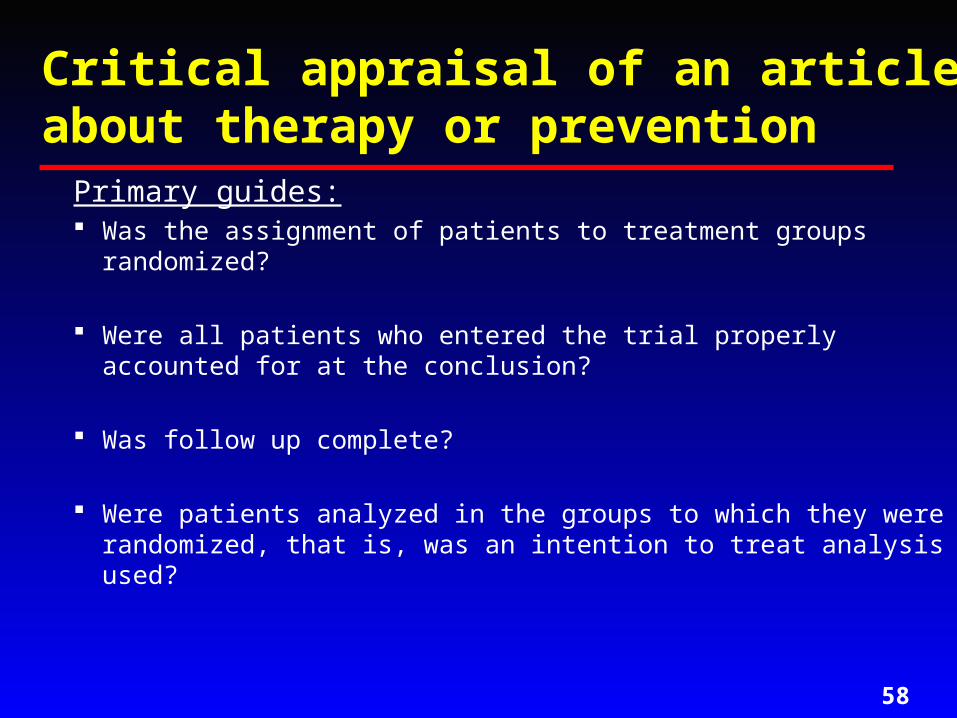
Critical appraisal of an article about therapy or prevention
Primary guides: Was the assignment of patients to treatment groups randomized?
Were all patients who entered the trial properly accounted for at the conclusion?
Was follow up complete?
Were patients analyzed in the groups to which they were randomized, that is, was an intention to treat analysis used?
58

Secondary guides: Were patients, health workers and study personnel blinded to
treatment?
Does the study provide evidence that blinding was effective?
Were the groups similar at the start of the trial?
Was there an adequate Table 1?
If not, were adjustments made for differences?
Aside from the experimental intervention, were the groups
treated equally?
59
Critical appraisal of an article about therapy or prevention

What were the results? How large was the treatment effect? How precise was the estimate of the treatment effect? Were confidence intervals given? Will the results help me with my patients?
60
Will discuss these aspects on August 9th, 2007!
Critical appraisal of an article about therapy or prevention

![Research Scientist, Google Inc. Ashok Popat · Ashok Popat, Sep 03, 2015 Inspiration: Markov-model-based approaches Document image decoding [Kopec and Chou, 1994] Explicit model of](https://img.pdfslide.us/doc/110x75/5f3cc202029ecb673b27aee3/research-scientist-google-inc-ashok-popat-ashok-popat-sep-03-2015-inspiration.jpg)