Embed Size (px)
Citation preview

INDIA INTERNATIONAL BANK (MALAYSIA) BERHAD (911666-D)
RISK WEIGHTED CAPITAL ADEQUACY (BASEL II)
Pillar 3 Disclosure for Half Year ended 30 June 2013

TABLE OF CONTENTS
1.0 Overview 1
2.0 Capital Management 2 - 3
2.1 Capital Adequacy Ratio (CAR)
2.2 Capital Structure
3.0 Regulatory Capital Requirement 4 - 5
4.0 Risk Management 5
5.0 Credit Risk 5 - 18
5.1 Credit Risk Mitigations
5.2 Off-Balance Sheet Exposures
6.0 Market Risk 19
6.1 Interest Rate Risk
7.0 Operational Risk 20
India International Bank (Malaysia) Berhad - Basel II Pillar 3 Disclosure 30 JUNE 2013
1
1.0 OVERVIEW
The Pillar 3 Disclosure for the half year ended 30 June 2013 for India International Bank (Malaysia) Berhad (“IIBM”) complies with the Bank Negara Malaysia’s (BNM) “Risk Weighted Capital Adequacy
Framework (Basel II) – Disclosure Requirements (Pillar 3)” - BNM/RH/GL 001-32
IIBM has adopted the Standardised Approach (SA) for the computation of credit and market risk
weighted asset, while the Basic Indicator Approach (BIA) has been adopted for the computation of operational risk weighted asset.
2.0 CAPITAL MANAGEMENT
The objective of the IIBM’s capital management policy is to maintain an adequate level of capital to
support business growth strategies under an acceptable risk framework, and to meet its regulatory
requirements and market expectations.
IIBM’s capital management process involves a careful analysis of the capital requirements to support business growth. The Bank regularly assesses its capital adequacy under various scenarios on a
forward looking perspective for the purpose of capital planning and management to ensure that the
capital is at the level suitable for the prevailing business conditions.
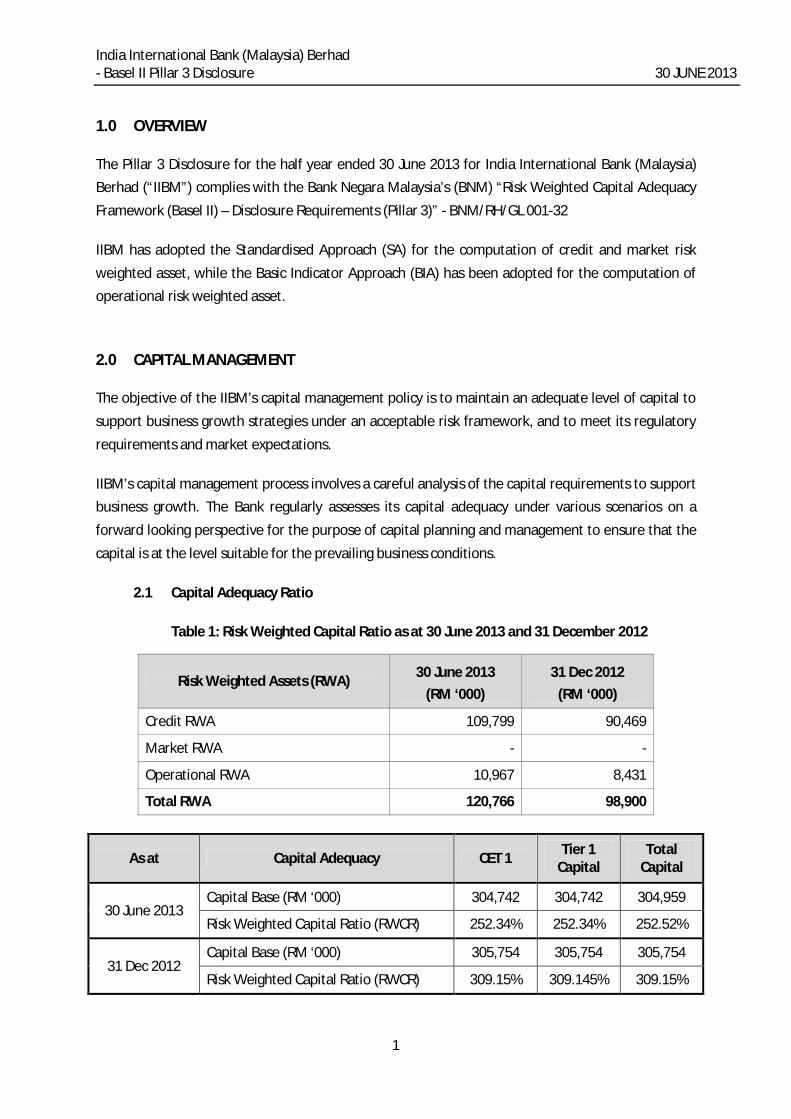
2.1 Capital Adequacy Ratio
Table 1: Risk Weighted Capital Ratio as at 30 June 2013 and 31 December 2012
Risk Weighted Assets (RWA) 30 June 2013 (RM ‘000)
31 Dec 2012 (RM ‘000)
Credit RWA 109,799 90,469
Market RWA - -
Operational RWA 10,967 8,431
Total RWA 120,766 98,900
As at Capital Adequacy CET 1 Tier 1 Capital
Total Capital
30 June 2013 Capital Base (RM ‘000) 304,742 304,742 304,959
Risk Weighted Capital Ratio (RWCR) 252.34% 252.34% 252.52%
31 Dec 2012 Capital Base (RM ‘000) 305,754 305,754 305,754
Risk Weighted Capital Ratio (RWCR) 309.15% 309.145% 309.15%

India International Bank (Malaysia) Berhad - Basel II Pillar 3 Disclosure 30 JUNE 2013
2
2.2 Capital Structure
India International Bank (Malaysia) Berhad capital structure, according to the BNM’s
“Risk Weighted Capital Adequacy Framework”, consists of Tier 1 and Tier 2 capital. Tier 1 capital comprises ordinary paid-up share capital, statutory reserves and retained
profits, while tier 2 capital comprises collective impairment provision allocated.
30 June 2013 31 December 2012 RM’000 RM’000 Tier-1 Capital Share capital 310,000 310,000 Accumulated Loss (5,258) (4,246) ──────── ──────── Total Tier-1 capital 304,742 305,754 ──────── ──────── Tier-2 Capital Collective Impairment Provision 217 - ──────── ────────
Total Tier-2 capital 217 -
Total Capital 304,959 305,754

India International Bank (Malaysia) Berhad - Basel II Pillar 3 Disclosure 30 JUNE 2013
3
3.0 REGULATORY CAPITAL REQUIREMENT
Tables 2 - 10 present the minimum regulatory capital requirement for credit risk under the Standardised Approach. These tables tabulate the total RWA under the various exposure classes under the Standardised Approach and apply the minimum capital requirement at 8% as set by BNM.
Table 2a: Disclosure on Capital Adequacy under Standardised Approach as at 30th June 2013 (RM’000)
Exposure Class
Gross Exposures /
EAD before CRM
Net Exposures /
EAD after CRM
Risk Weighted
Assets
Minimum Capital
Requirement at 8%
Credit Risk
Exposures under the Standardised Approach On-Balance Sheet Exposures Corporate 14,223 14,223 8,885 711 Sovereigns/Central Banks 13,873 13,873 0 0 Banks, Development Financial Institutions & MDBs 356,633 356,633 77,805 6,225 Other Assets 15,430 15,430 14,825 1,186 Defaulted Exposures 0 0 0 0
Total for On- Balance Sheet Exposures 400,159 400,159 101,515 8,122
Off-Balance Sheet Exposures Credit Derivatives 2,455 2,455 953 76 Off balance sheet exposures other than OTC derivatives or credit derivatives 7,331 7,331 7,331 587
Defaulted Exposures 0 0 0 0 Total Off- Balance Sheet Exposures 9,786 9,786 8,284 663
Total On and Off- Balance Sheet Exposures 409,945 409,945 109,799 8,786
Operational Risk (Basic Indicator Approach) 10,967 877
Total RWA and Capital Requirements 120,766 9,663
India International Bank (Malaysia) Berhad - Basel II Pillar 3 Disclosure 30 JUNE 2013
4
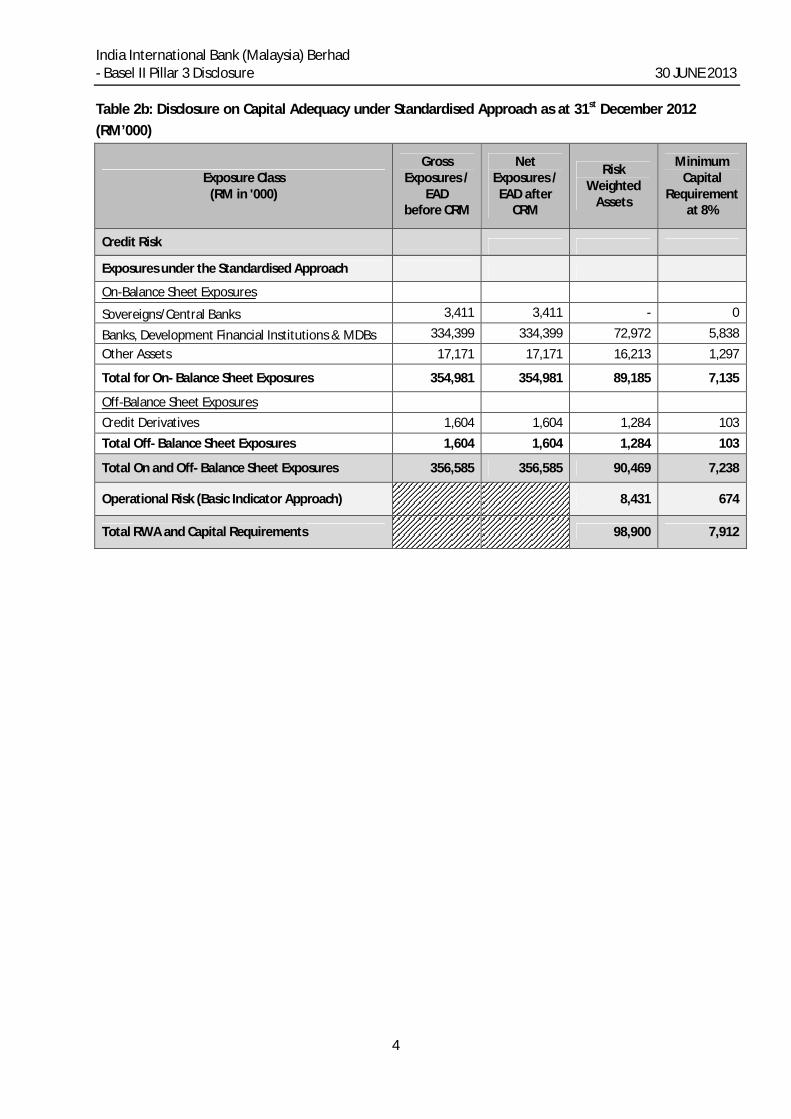
Table 2b: Disclosure on Capital Adequacy under Standardised Approach as at 31st December 2012 (RM’000)
Exposure Class (RM in '000)
Gross Exposures /
EAD before CRM
Net Exposures /
EAD after CRM
Risk Weighted
Assets
Minimum Capital
Requirement at 8%
Credit Risk
Exposures under the Standardised Approach On-Balance Sheet Exposures Sovereigns/Central Banks 3,411 3,411 - 0
Banks, Development Financial Institutions & MDBs 334,399 334,399 72,972 5,838 Other Assets 17,171 17,171 16,213 1,297
Total for On- Balance Sheet Exposures 354,981 354,981 89,185 7,135
Off-Balance Sheet Exposures Credit Derivatives 1,604 1,604 1,284 103 Total Off- Balance Sheet Exposures 1,604 1,604 1,284 103
Total On and Off- Balance Sheet Exposures 356,585 356,585 90,469 7,238
Operational Risk (Basic Indicator Approach) 8,431 674
Total RWA and Capital Requirements 98,900 7,912

India International Bank (Malaysia) Berhad - Basel II Pillar 3 Disclosure 30 JUNE 2013
5
4.0 RISK MANAGEMENT
The Bank recognizes that risk management is a vital part of the Bank’s operations and is critical to achieve continuous growth, profitability and sustainability. The Bank has in place a Risk Management Framework that oversees the management of different risk areas, and the key business risks are credit risk, operational risk, liquidity risk and market risk.
The Board has established Board Risk Management Committee with the primary objective of overseeing risk management activities of the Bank and recommending appropriate risk management policies and risk measurement parameters.
5.0 CREDIT RISK
Credit risk is the risk of loss resulting from the failure of a borrower or counterparty to honour its financial or contractual obligations. The Bank’s credit risk arises both in direct lending operations and in its funding, investment and trading activities, where counterparties have repayment or other obligations of the Bank.
IIBM appraises the amount and timing of the cash flows as well as the financial position of the borrower and intended purpose of the funds during loan structuring. The Bank operates within well-defined criteria for new credits as well as the expansion of existing credits and an assessment of the risk profile of the customer or transaction is being conducted prior to any approvals.
Table 3a: Disclosure on Credit Risk Exposure – Geographical Analysis as at 30 June 2013 (RM ‘000)
Geographical Exposure as at 30 June 2013 Malaysia
Exposure Class
Nor
ther
n Re
gion
East
Coa
st
Regi
on
Cent
ral R
egio
n
Sout
hern
Re
gion
East
Mal
aysia
Tota
l
Exposures under the Standardised Approach Corporate 7,066 4,969 11,974 - - 24,009
Regulatory Retail - - - - - -
Sovereigns/Central Banks - - 13,873 - - 13,873
Banks, Development Financial Institutions & MDBs - - 356,633 - - 356,633
Other Assets - - 15,430 - - 15,430 Defaulted Exposures - - - - - -
Total Credit Exposure 7,066 4,969 397,909 - - 409,945

India International Bank (Malaysia) Berhad - Basel II Pillar 3 Disclosure 30 JUNE 2013
6
Table 3b: Disclosure on Credit Risk Exposure – Geographical Analysis as at 31 December 2012 (RM ‘000)
Geographical Exposure as at 31 December 2012 Malaysia
Exposure Class
Nor
ther
n Re
gion
East
Coa
st
Regi
on
Cent
ral R
egio
n
Sout
hern
Re
gion
East
Mal
aysia
Tota
l
Exposures under the Standardised Approach Corporate - - 1,604 - - 1,604
Regulatory Retail - - - - - -
Sovereigns/Central Banks - - 3,411 - - 3,411
Banks, Development Financial Institutions & MDBs - - 334,399 - - 334,399
Other Assets - - 17,171 - - 17,171 Defaulted Exposures - - - - - -
Total Credit Exposure - - 356,585 - - 356,585

India International Bank (Malaysia) Berhad - Basel II Pillar 3 Disclosure 30 JUNE 2013
7
Table 4a: Disclosure on Credit Risk Exposure – Sectoral Analysis as at 30 June 2013 (RM ‘000)
Exposure Class
Prim
ary
Agric
ultu
re
Min
ing
and
Qua
rryi
ng
Man
ufac
turin
g
Elec
trici
ty, G
as a
nd W
ater
Su
pply
Cons
truc
tion
Who
lesa
le a
nd R
etai
l Tra
de,
and
Rest
aura
nt a
nd H
otel
s
Tran
spor
t, St
orag
e an
d Co
mm
unica
tion
Fina
nce,
Insu
ranc
e an
d Re
al
Esta
te a
nd B
usin
ess A
ctiv
ities
Educ
atio
n, H
ealth
and
Oth
ers
Hous
ehol
d
Sect
or N
.E.C
Tota
l
Exposures under the Standardised Approach Corporate - - 12,625 - - 10,606 - 765 - - 13 24,008 Regulatory Retail - - - - - - - - - - - - Sovereigns/Central Banks - - - - - - - - - - 13,873 13,873 Banks, Development Financial Institutions & MDBs - - - - - - - - - - 356,633 356,633 Other Assets - - - - - - - - - - 15,430 15,430 Defaulted Exposures - - - - - - - - - - - -
Total Credit Exposure -
- 12,625 - - 10,606 - 765 - - 385,949 409,945

India International Bank (Malaysia) Berhad - Basel II Pillar 3 Disclosure 30 JUNE 2013
8
Table 4b: Disclosure on Credit Risk Exposure – Sectoral Analysis as at 31 December 2012 (RM ‘000)
Exposure Class
Prim
ary
Agric
ultu
re
Min
ing
and
Qua
rryi
ng
Man
ufac
turin
g
Elec
trici
ty, G
as a
nd W
ater
Su
pply
Cons
truc
tion
Who
lesa
le a
nd R
etai
l Tra
de,
and
Rest
aura
nt a
nd H
otel
s
Tran
spor
t, St
orag
e an
d Co
mm
unica
tion
Fina
nce,
Insu
ranc
e an
d Re
al
Esta
te a
nd B
usin
ess A
ctiv
ities
Educ
atio
n, H
ealth
and
Oth
ers
Hous
ehol
d
Sect
or N
.E.C
Tota
l
Exposures under the Standardised Approach
Corporate -
- - - - 1,204 - 400 - - - 1,604
Regulatory Retail - - - - - - - - - - - - Sovereigns/Central Banks - - - - - - - - - - 3,411 3,411 Banks, Development Financial Institutions & MDBs - - - - - - - - - - 334,399 334,399 Other Assets - - - - - - - - - - 17,171 17,171 Defaulted Exposures - - - - - - - - - - - -
Total Credit Exposure -
- - - - 1,204 - 400 - - 354,981 356,585

India International Bank (Malaysia) Berhad - Basel II Pillar 3 Disclosure 30 JUNE 2013
9
Table 5a: Disclosure on Credit Risk Exposure – Maturity Analysis as at 30 June 2013 (RM ‘000)
Exposure Class One Year or Less
One to Five Years
Over Five Years Total
Exposures under the Standardised Approach Corporate 24,009 - - 24,009 Regulatory Retail - - - -
Sovereigns/Central Banks 3,694 10,179 - 13,873
Banks, Development Financial Institutions & MDBs 356,633 - - 356,633 Other Assets 15,430 - - 15,430 Defaulted Exposures - - - -
Total Credit Exposure 399,766 10,179 - 409,945
Table 5b: Disclosure on Credit Risk Exposure – Maturity Analysis as at 31 December 2012 (RM ‘000)
Exposure Class One Year or Less
One to Five Years
Over Five Years Total
Exposures under the Standardised Approach Corporate 1,604 - - 1,604 Regulatory Retail - - - -
Sovereigns/Central Banks 3,411 - - 3,411
Banks, Development Financial Institutions & MDBs 334,399 - - 334,399 Other Assets 17,171 - - 17,171 Defaulted Exposures - - - -
Total Credit Exposure 378,619 - - 356,585
Table 6: Impaired Loans, Collective Impairment Allowance, Individual Impairment Allowance and Write-offs as at 30 June 2013 (RM ‘000)
Purpose of Financing Collective Impairment
Individual Impairment
Impaired Assets
Write-Offs Total
Exposures under the Standardised Approach Purchase of Non-Residential Property - - - - - Purchase of Fixed Asset other than Land/ Buildings - - - - -
Working Capital 217 - - - -
Others - - - - -
Total Credit Exposure 217 - - - -
No collective and individual impairment allowance, impaired loans and write-offs as at 31 December 2012.

India International Bank (Malaysia) Berhad - Basel II Pillar 3 Disclosure 30 JUNE 2013
10
5.1 Credit Rating
IIBM has adopted Standardized Approach in the computation of Credit Risk Weighted Assets. External credit assessments by External Credit Assessment Institutions (ECAI) on borrowers or specific securities issued by the borrower are the basis for the determination of risk weights under the standardised approach for exposures to sovereigns, central banks, public sector entities, banks, corporates as well as certain other specific portfolios.
Table 7a: Disclosure on Risk Weights under Standardised Approach as at 30 June 2013 (RM’000)
Risk Weights
Exposures after Netting and Credit Risk Mitigation Total
Exposures after
Netting & Credit Risk Mitigation
Total Risk Weighted
Assets Sovereigns & Central
Banks PSEs
Banks, MDBs and
FDIs
Insurance Cos,
Securities Firms &
Fund Managers
Corporates Regulatory Retail
Residential Mortgages
Higher Risk
Assets
Other Assets
Specialised Financing
/Investment Securitisation Equity
0% 13,873 5,821 605 20,299 0
20% 335,039 335,039 67,008
50% 21,594 2,038 23,632 11,816
100% 16,150 14,825 30,975 30,975
Total Exposure 13,873 - 356,633 - 24,009 - - - 15,430 - - - 409,945 109,799
Total RWA 0 0 77,805 0 17,169 0 0 0 14,825 0 0 0
Average Risk Weight
0.00% 0.00% 21.82% 0.00% 71.51% 0.00% 0.00% 0.00% 96.08% 0.00% 0.00% 0.00%
Deduction from Capital Base - - - - - - - - - - - -

India International Bank (Malaysia) Berhad - Basel II Pillar 3 Disclosure 30 JUNE 2013
11
Table 7b: Disclosure on Risk Weights under Standardised Approach as at 31 December 2012 (RM’000)
Risk Weights
Exposures after Netting and Credit Risk Mitigation Total
Exposures after
Netting & Credit Risk Mitigation
Total Risk Weighted
Assets Sovereigns & Central
Banks PSEs
Banks, MDBs
and FDIs
Insurance Cos,
Securities Firms &
Fund Managers
Corporates Regulatory Retail
Residential Mortgages
Higher Risk
Assets
Other Assets
Specialised Financing
/Investment Securitisation Equity
0% 3,411 120 957 4,488 0
20% 314,092 314,092 62,818
50%
20,307
400
20,707 10,354
100%
1,084
16,213
17,297 17,297
Total Exposure 3,411 - 334,399 - 1,604 - - - 17,170 - - - 356,584 90,469
Total RWA - 72,972 1,284 16,213 Average
Risk Weight 0.00% 0.00% 21.82% 0.00% 80.03% 0.00% 0.00% 0.00% 94.42% 0.00% 0.00% 0.00%
Deduction
from Capital Base - - - - - - - - - - - -

India International Bank (Malaysia) Berhad - Basel II Pillar 3 Disclosure 30 JUNE 2013
12
Table 8a: Disclosure on Rated and Unrated Exposures according to Ratings by ECAIs as at 30 June 2013 (RM’000)
Exposure Class
Short term Ratings of Banking Institutions and Corporate by Approved ECAIs Moodys P-1 P-2 P-3 Others Unrated
S&P A-1 A-2 A-3 Others Unrated Fitch F1+,F1 F2 F3 B to D Unrated RAM P-1 P-2 P-3 NP Unrated
MARC MARC-1 MARC-2 MARC-3 MARC-4 Unrated Rating &
Investment Inc a-1+,a-1 a-2 a-3 b,c Unrated
On and Off Balance-Sheet Exposures
Banks, MDBs and FDIs 355,098 1,535 Credit Exposures (using Corporate Risk Weights)
Public Sector Entities (applicable for entities risk weighted based on their external ratings as corporates)
Insurance Cos, Securities Firms & Fund Managers
Corporates 24,009
Total 355,098 0 1,535 0 24,009
Exposure Class
Ratings of Corporate by Approved ECAIs Moodys Aaa to Aaa3 A1 to A3 Baa1 to Ba3 B1 to C Unrated
S&P AAA to AA- A+ to A- BBB+ to BB- B+ to D Unrated Fitch AAA to AA- A+ to A- BBB+ to BB- B+ to D Unrated RAM AAA to AA3 A to A3 BBB1 to BB3 B to D Unrated
MARC AAA to AA- A+ to A- BBB+ to BB- B+ to D Unrated Rating &
Investment Inc AAA to AA- A+ to A- BBB+ to BB- B+ to D Unrated On and Off Balance-Sheet Exposures
Credit Exposures (using Corporate Risk Weights)
Public Sector Entities (applicable for entities risk weighted based on their external ratings as corporates)
Insurance Cos, Securities Firms & Fund Managers
Corporates 24,009
Total 0 0 0 0 24,009
India International Bank (Malaysia) Berhad - Basel II Pillar 3 Disclosure 30 JUNE 2013
13
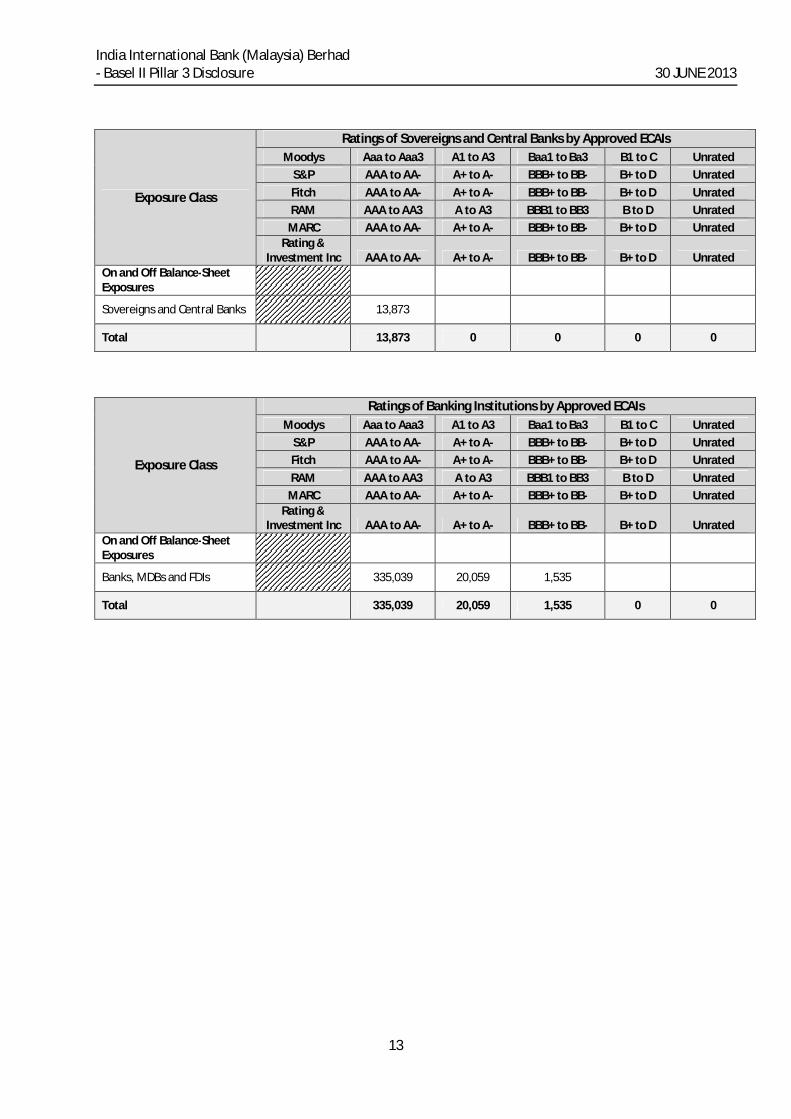
Exposure Class
Ratings of Sovereigns and Central Banks by Approved ECAIs Moodys Aaa to Aaa3 A1 to A3 Baa1 to Ba3 B1 to C Unrated
S&P AAA to AA- A+ to A- BBB+ to BB- B+ to D Unrated Fitch AAA to AA- A+ to A- BBB+ to BB- B+ to D Unrated RAM AAA to AA3 A to A3 BBB1 to BB3 B to D Unrated
MARC AAA to AA- A+ to A- BBB+ to BB- B+ to D Unrated Rating &
Investment Inc AAA to AA- A+ to A- BBB+ to BB- B+ to D Unrated On and Off Balance-Sheet Exposures
Sovereigns and Central Banks 13,873
Total 13,873 0 0 0 0
Exposure Class
Ratings of Banking Institutions by Approved ECAIs Moodys Aaa to Aaa3 A1 to A3 Baa1 to Ba3 B1 to C Unrated
S&P AAA to AA- A+ to A- BBB+ to BB- B+ to D Unrated Fitch AAA to AA- A+ to A- BBB+ to BB- B+ to D Unrated RAM AAA to AA3 A to A3 BBB1 to BB3 B to D Unrated
MARC AAA to AA- A+ to A- BBB+ to BB- B+ to D Unrated Rating &
Investment Inc AAA to AA- A+ to A- BBB+ to BB- B+ to D Unrated On and Off Balance-Sheet Exposures
Banks, MDBs and FDIs 335,039 20,059 1,535
Total 335,039 20,059 1,535 0 0

India International Bank (Malaysia) Berhad - Basel II Pillar 3 Disclosure 30 JUNE 2013
14
Table 8b: Disclosure on Rated and Unrated Exposures according to Ratings by ECAIs as at 31 December 2012 (RM’000)
Exposure Class
Ratings of Corporate by Approved ECAIs Moodys Aaa to Aaa3 A1 to A3 Baa1 to Ba3 B1 to C Unrated
S&P AAA to AA- A+ to A- BBB+ to BB- B+ to D Unrated Fitch AAA to AA- A+ to A- BBB+ to BB- B+ to D Unrated RAM AAA to AA3 A to A3 BBB1 to BB3 B to D Unrated
MARC AAA to AA- A+ to A- BBB+ to BB- B+ to D Unrated Rating &
Investment Inc AAA to AA- A+ to A- BBB+ to BB- B+ to D Unrated On and Off Balance-Sheet Exposures
Credit Exposures (using Corporate Risk Weights)
Public Sector Entities (applicable for entities risk weighted based on their external ratings as corporates)
Insurance Cos, Securities Firms & Fund Managers
Corporates 1,604
Total 0 0 0 0 1,604
Exposure Class
Short term Ratings of Banking Institutions and Corporate by Approved ECAIs Moodys P-1 P-2 P-3 Others Unrated
S&P A-1 A-2 A-3 Others Unrated Fitch F1+,F1 F2 F3 B to D Unrated RAM P-1 P-2 P-3 NP Unrated
MARC MARC-1 MARC-2 MARC-3 MARC-4 Unrated Rating &
Investment Inc a-1+,a-1 a-2 a-3 b,c Unrated
On and Off Balance-Sheet Exposures
Banks, MDBs and FDIs 334,276 123 Credit Exposures (using Corporate Risk Weights)
Public Sector Entities (applicable for entities risk weighted based on their external ratings as corporates)
Insurance Cos, Securities Firms & Fund Managers
Corporates 1,604
Total 334,276 0 123 0 1,604
India International Bank (Malaysia) Berhad - Basel II Pillar 3 Disclosure 30 JUNE 2013
15
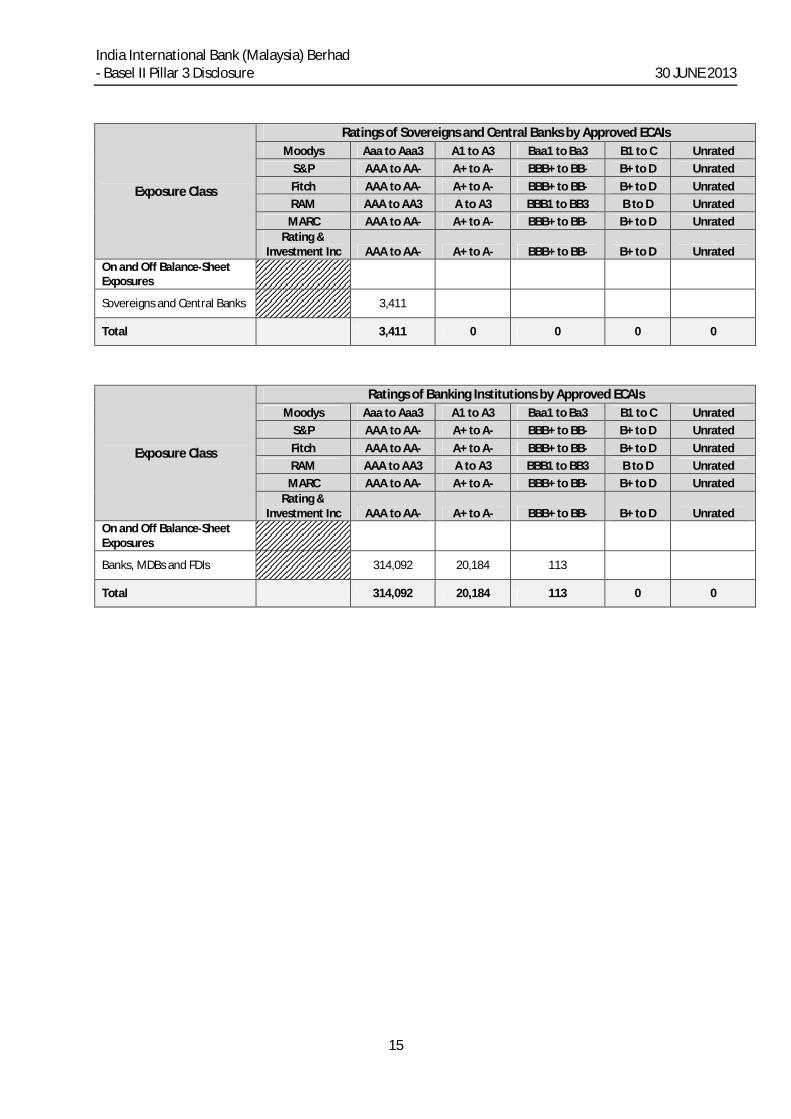
Exposure Class
Ratings of Sovereigns and Central Banks by Approved ECAIs Moodys Aaa to Aaa3 A1 to A3 Baa1 to Ba3 B1 to C Unrated
S&P AAA to AA- A+ to A- BBB+ to BB- B+ to D Unrated Fitch AAA to AA- A+ to A- BBB+ to BB- B+ to D Unrated RAM AAA to AA3 A to A3 BBB1 to BB3 B to D Unrated
MARC AAA to AA- A+ to A- BBB+ to BB- B+ to D Unrated Rating &
Investment Inc AAA to AA- A+ to A- BBB+ to BB- B+ to D Unrated On and Off Balance-Sheet Exposures
Sovereigns and Central Banks 3,411
Total 3,411 0 0 0 0
Exposure Class
Ratings of Banking Institutions by Approved ECAIs Moodys Aaa to Aaa3 A1 to A3 Baa1 to Ba3 B1 to C Unrated
S&P AAA to AA- A+ to A- BBB+ to BB- B+ to D Unrated Fitch AAA to AA- A+ to A- BBB+ to BB- B+ to D Unrated RAM AAA to AA3 A to A3 BBB1 to BB3 B to D Unrated
MARC AAA to AA- A+ to A- BBB+ to BB- B+ to D Unrated Rating &
Investment Inc AAA to AA- A+ to A- BBB+ to BB- B+ to D Unrated On and Off Balance-Sheet Exposures
Banks, MDBs and FDIs 314,092 20,184 113
Total 314,092 20,184 113 0 0

India International Bank (Malaysia) Berhad - Basel II Pillar 3 Disclosure 30 JUNE 2013
16
5.2 Credit Risk Mitigation
IIBM has currently adopted The Simple Approach as per BNM’s “Risk-Weighted Capital Adequacy Framework (Basel II - Risk-Weighted Assets Computation)” in the computation of collateralised transactions.
Table 9a: Disclosure on Credit Risk Mitigation Analysis as at 30 June 2013 (RM ‘000)
Exposure Class (RM '000)
Exposures before CRM
Exposures Covered by Guarantees
/Credit Derivatives
Exposures Covered by
Eligible Financial Collateral
Exposures Covered by
Other Eligible
Collateral Credit Risk Exposures under the Standardised Approach On-Balance Sheet Exposures Sovereigns/Central Banks 13,873 - - - Banks, Development Financial Institutions & MDBs 356,633 - - -
Corporate 14,223 1,638 4,519 - Other Assets 15,430 - 605 - Defaulted Exposures - - - - Total for On- Balance Sheet Exposures 400,159 1,638 5,124 - Off-Balance Sheet Exposures Credit Derivatives 2,455 400 1,302 - Off balance sheet exposures other than OTC derivatives or credit derivatives 7,331 - - -
Defaulted Exposures - - - - Total Off- Balance Sheet Exposures 9,786 400 1,302 -
Total On and Off- Balance Sheet Exposures 409,945 2,038 6,426 -

India International Bank (Malaysia) Berhad - Basel II Pillar 3 Disclosure 30 JUNE 2013
17
Table 9b: Disclosure on Credit Risk Mitigation Analysis as at 31 December 2012 (RM ‘000)
Exposure Class (RM '000)
Exposures before CRM
Exposures Covered by Guarantees
/Credit Derivatives
Exposures Covered by
Eligible Financial Collateral
Exposures Covered by
Other Eligible
Collateral Credit Risk Exposures under the Standardised Approach On-Balance Sheet Exposures Sovereigns/Central Banks 3,411 - - - Banks, Development Financial Institutions & MDBs 334,399 - - -
Corporate - - - - Other Assets 17,171 - - - Defaulted Exposures - - - - Total for On- Balance Sheet Exposures 354,981 - - - Off-Balance Sheet Exposures Credit Derivatives 1,604 400 120 - Off balance sheet exposures other than OTC derivatives or credit derivatives - - - -
Defaulted Exposures - - - - Total Off- Balance Sheet Exposures 1,604 400 120 -
Total On and Off- Balance Sheet Exposures 356,585 400 120 0

India International Bank (Malaysia) Berhad - Basel II Pillar 3 Disclosure 30 JUNE 2013
18
5.3 Off-Balance Sheet Exposure
Table 10a: Disclosures of Off-Balance Sheet Items as at 30 June 2013 (RM’000)
Description Principal Amount
Positive Fair Value
of Derivative Contracts
Credit Equivalent
Amount
Risk Weighted
Assets
Credit Substitutes 2,455 2,455 953 Short Term Self Liquidating trade related 631 126 126 Foreign exchange related contracts One year or less 857 - 13 13 Over one year to five years Over five years Interest/Profit rate related contracts One year or less Over one year to five years Over five years Other commitments, such as formal standby facilities and credit lines, with an original maturity of over one year
Other commitments, such as formal standby facilities and credit lines, with an original maturity of up to one year 35,957 7,192 7,192
Any commitments that are unconditionally cancelled at any time by the bank without prior notice or that effectively provide for automatic cancellation due to deterioration in a borrower's creditworthiness
- - -
Total 39,900 0 9,786 8,284
Table 10b: Disclosures of Off-Balance Sheet Items as at 31 December 2012 (RM’000)
Description Principal Amount
Positive Fair Value
of Derivative Contracts
Credit Equivalent
Amount
Risk Weighted
Assets
Credit Substitutes 1,604 1,604 1,284 Foreign exchange related contracts One year or less Over one year to five years Over five years Interest/Profit rate related contracts One year or less Over one year to five years Over five years Other commitments, such as formal standby facilities and credit lines, with an original maturity of over one year
Other commitments, such as formal standby facilities and credit lines, with an original maturity of up to one year
Any commitments that are unconditionally cancelled at any time by the bank without prior notice or that effectively provide for automatic cancellation due to deterioration in a borrower's creditworthiness
Total 1,604 0 1,604 1,284
India International Bank (Malaysia) Berhad - Basel II Pillar 3 Disclosure 30 JUNE 2013
19
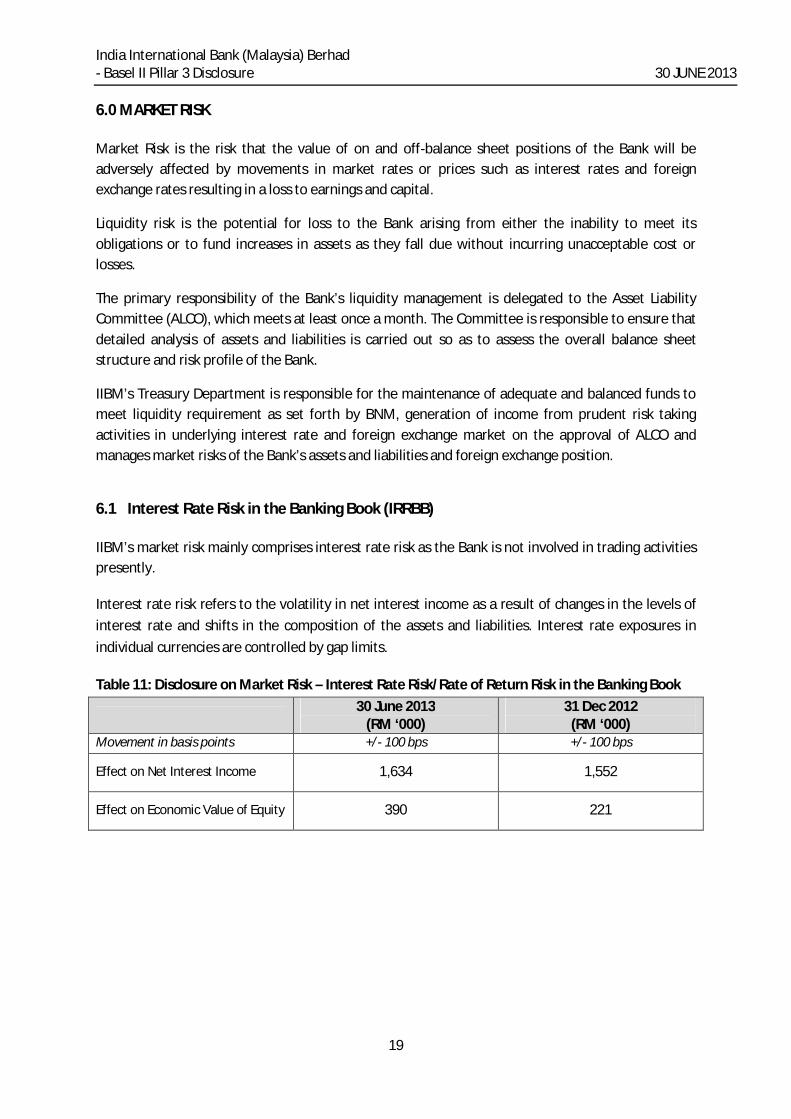
6.0 MARKET RISK
Market Risk is the risk that the value of on and off-balance sheet positions of the Bank will be adversely affected by movements in market rates or prices such as interest rates and foreign exchange rates resulting in a loss to earnings and capital.
Liquidity risk is the potential for loss to the Bank arising from either the inability to meet its obligations or to fund increases in assets as they fall due without incurring unacceptable cost or losses.
The primary responsibility of the Bank’s liquidity management is delegated to the Asset Liability Committee (ALCO), which meets at least once a month. The Committee is responsible to ensure that detailed analysis of assets and liabilities is carried out so as to assess the overall balance sheet structure and risk profile of the Bank.
IIBM’s Treasury Department is responsible for the maintenance of adequate and balanced funds to meet liquidity requirement as set forth by BNM, generation of income from prudent risk taking activities in underlying interest rate and foreign exchange market on the approval of ALCO and manages market risks of the Bank’s assets and liabilities and foreign exchange position.
6.1 Interest Rate Risk in the Banking Book (IRRBB)
IIBM’s market risk mainly comprises interest rate risk as the Bank is not involved in trading activities presently.
Interest rate risk refers to the volatility in net interest income as a result of changes in the levels of interest rate and shifts in the composition of the assets and liabilities. Interest rate exposures in individual currencies are controlled by gap limits.
Table 11: Disclosure on Market Risk – Interest Rate Risk/Rate of Return Risk in the Banking Book
30 June 2013 (RM ‘000)
31 Dec 2012 (RM ‘000)
Movement in basis points +/- 100 bps +/- 100 bps
Effect on Net Interest Income 1,634 1,552
Effect on Economic Value of Equity 390 221

India International Bank (Malaysia) Berhad - Basel II Pillar 3 Disclosure 30 JUNE 2013
20
7.0 OPERATIONAL RISK
Operational risk is the risk of loss resulting from inadequate or failed internal processes, people and system or from external events. Operational risk is associated with human error, system failures and inadequate procedures and controls. It is the risk of loss arising from the potential that inadequate information system; technology failures, breaches in internal controls, fraud, unforeseen catastrophes, or other operational problems may result in unexpected losses or reputation problems.
The objective of operational risk management is to find out the extent of the Bank’s operational risk exposure; to understand what drives it; to allocate capital against it and identify trends internally and externally that would help predicting it.
The Bank utilizes Operational Risk Event Database, Risk Control Self-Assessment and Key Risk Indicators to identify, assess and monitor operational risks in the Bank’s operating environment. All risks identified will be reported to the Operational Risk Management Committee and Board Risk Management Committee, which will be at least once on a quarterly basis.
Operational Risk Capital Charge Computation Methodology
Operational Risk capital charge is calculated using the Basic Indicator Approach (BIA) as per BNM’s “Risk-Weighted Capital Adequacy Framework (Basel II - Risk-Weighted Assets Computation)” guideline. Operational risk capital charge calculation applies a fixed percentage of 15% to the average of positive gross income that was achieved over the preceding three years.
Table 12: Disclosure on Operational Risk Weighted Assets
30 June 2013
(RM ‘000) 31 December 2012
(RM ‘000) Total RWA for Operational Risk 10,967 8,431