Embed Size (px)
Citation preview
Risk sharing and the economics of M-PESA
William Jack Georgetown University
Tavneet Suri MIT Sloan
With support from the Consortium on Financial Systems and Poverty
Impact and Policy Conference August 30 – September 1, 2012
Bangkok

The solution:
Jack - M-PESA
The problem:
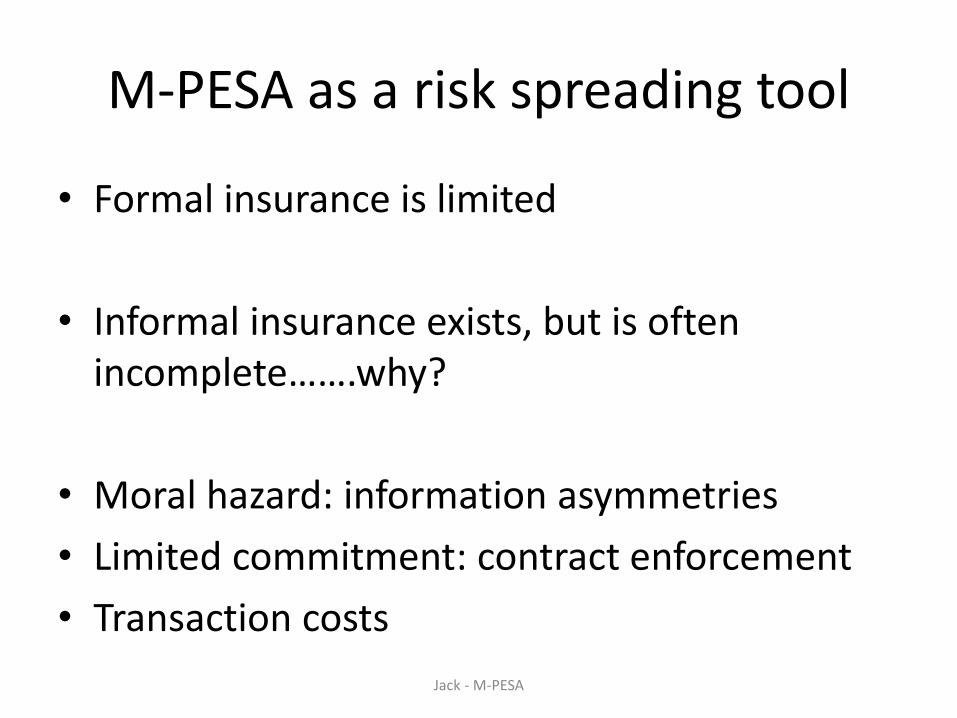
M-PESA as a risk spreading tool
• Formal insurance is limited
• Informal insurance exists, but is often incomplete…….why?
• Moral hazard: information asymmetries
• Limited commitment: contract enforcement
• Transaction costs
Jack - M-PESA
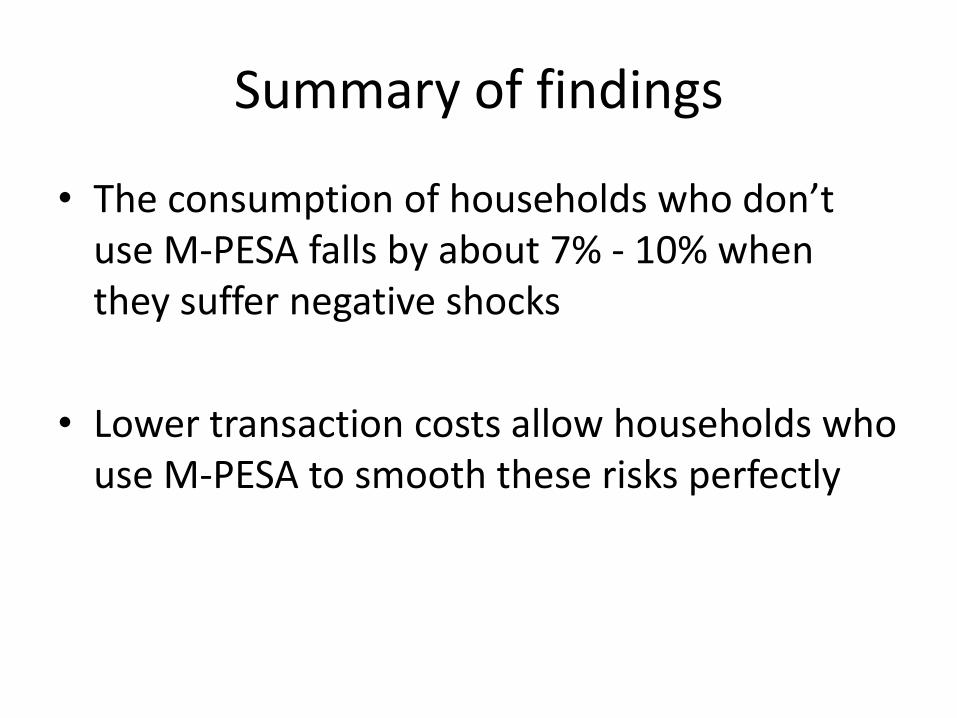
Summary of findings
• The consumption of households who don’t use M-PESA falls by about 7% - 10% when they suffer negative shocks
• Lower transaction costs allow households who use M-PESA to smooth these risks perfectly
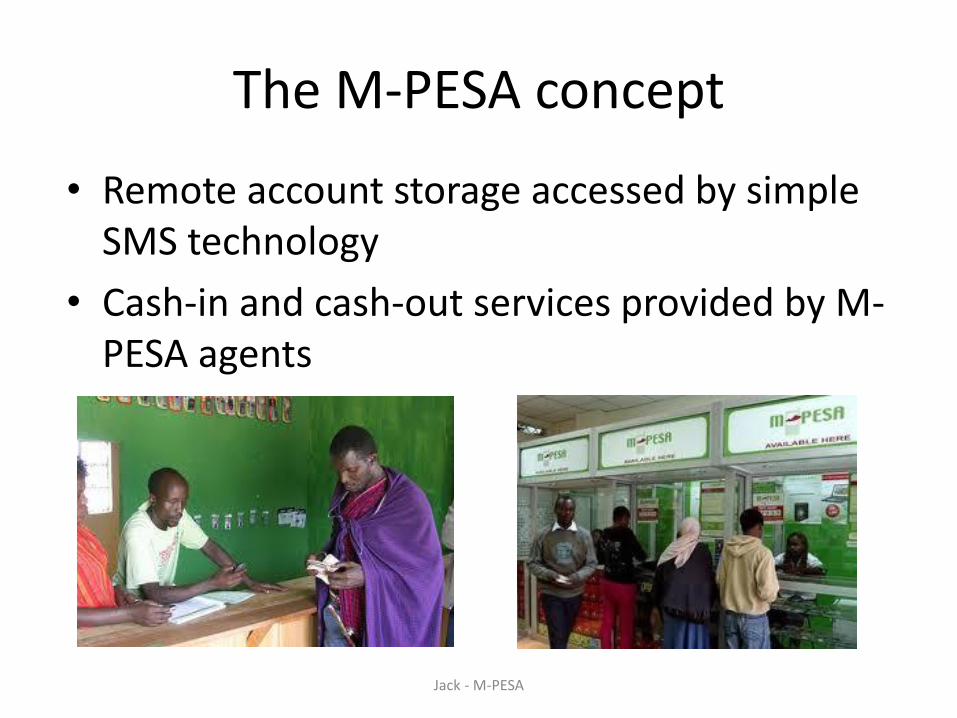
The M-PESA concept
• Remote account storage accessed by simple SMS technology
• Cash-in and cash-out services provided by M-PESA agents
Jack - M-PESA
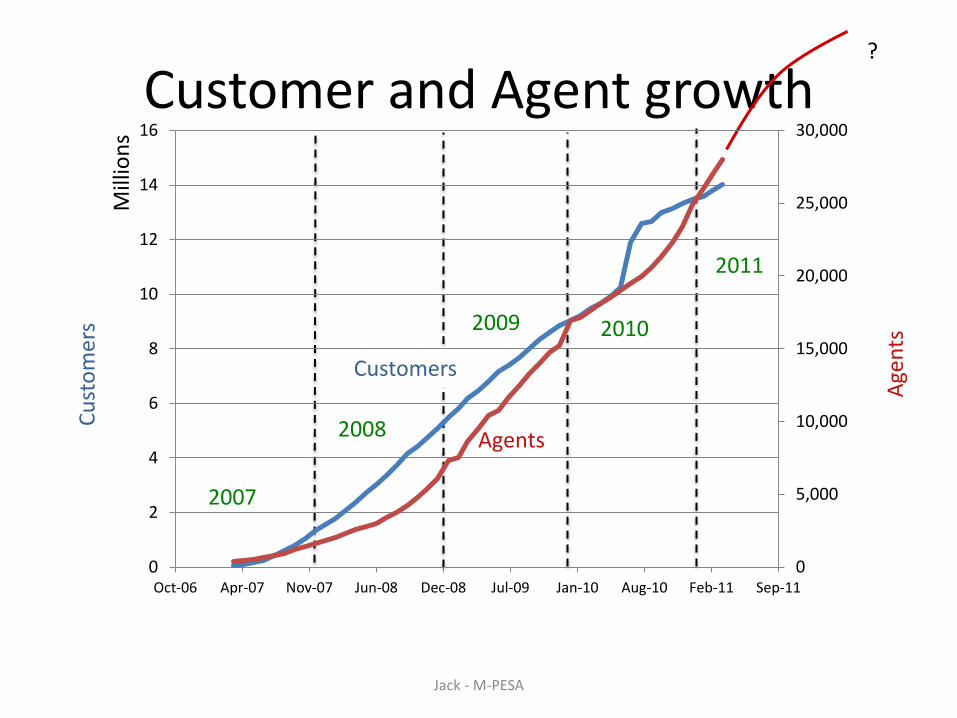
Customers
Customer and Agent growth
Agents
Cu
sto
mer
s
Age
nts
2007
2008
2009 2010
Jack - M-PESA
?
2011
0
5,000
10,000
15,000
20,000
25,000
30,000
0
2
4
6
8
10
12
14
16
Oct-06 Apr-07 Nov-07 Jun-08 Dec-08 Jul-09 Jan-10 Aug-10 Feb-11 Sep-11
Mill
ion
s
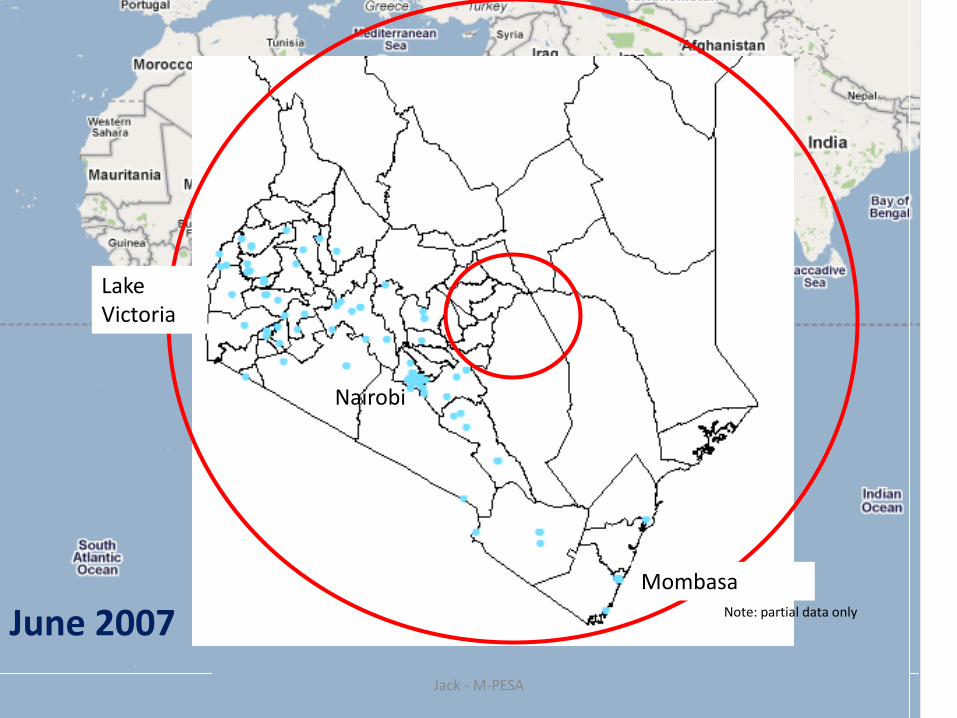
Nairobi
Lake Victoria
Mombasa
June 2007 Note: partial data only
Jack - M-PESA
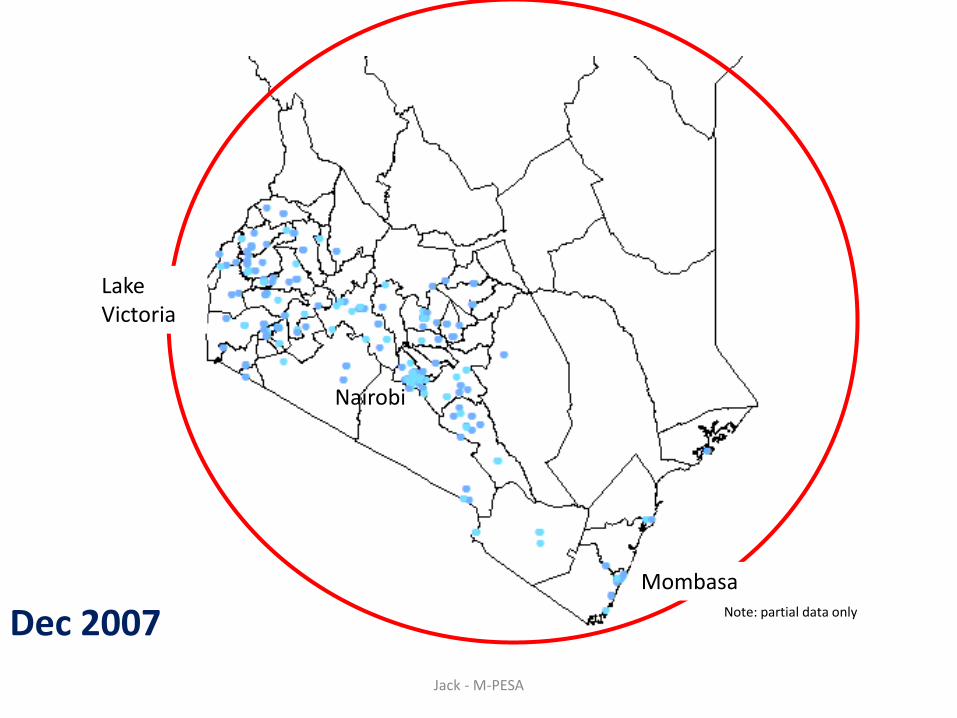
Dec 2007 Note: partial data only
Jack - M-PESA
Nairobi
Lake Victoria
Mombasa
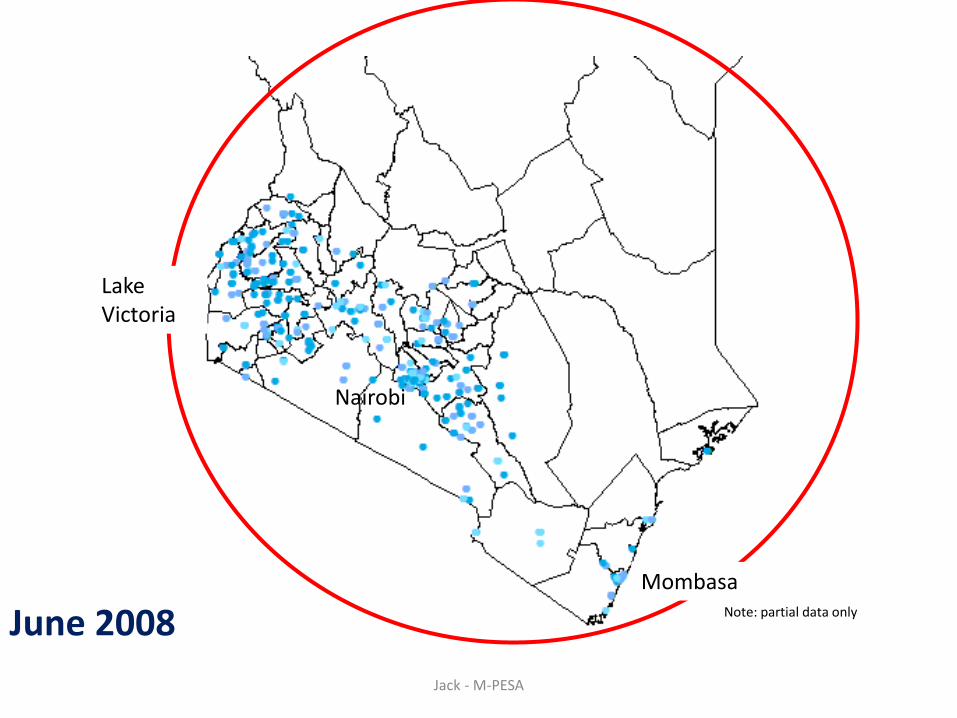
June 2008 Note: partial data only
Jack - M-PESA
Nairobi
Lake Victoria
Mombasa
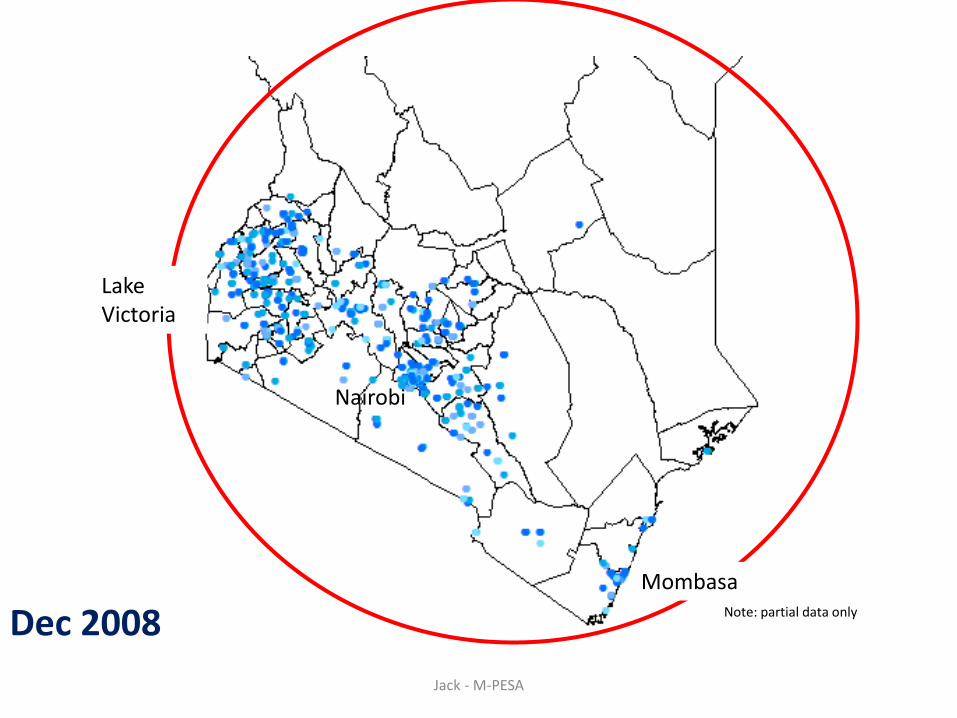
Dec 2008 Note: partial data only
Jack - M-PESA
Nairobi
Lake Victoria
Mombasa
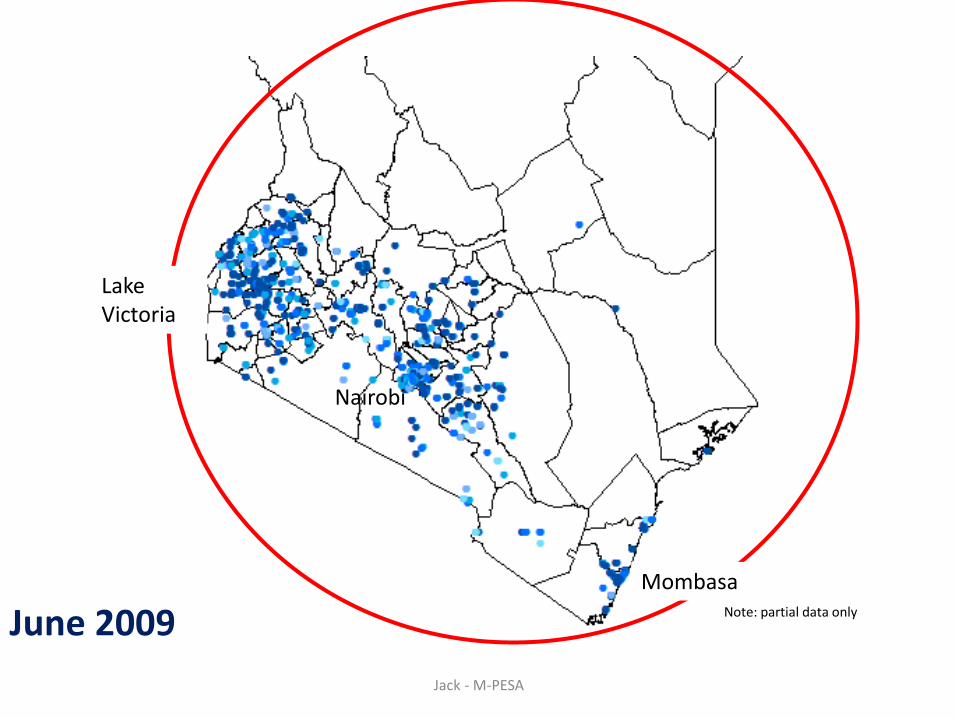
June 2009 Note: partial data only
Jack - M-PESA
Nairobi
Lake Victoria
Mombasa

Dec 2009 Note: partial data only
Jack - M-PESA
Nairobi
Lake Victoria
Mombasa

June 2010 Note: partial data only
Jack - M-PESA
Nairobi
Lake Victoria
Mombasa
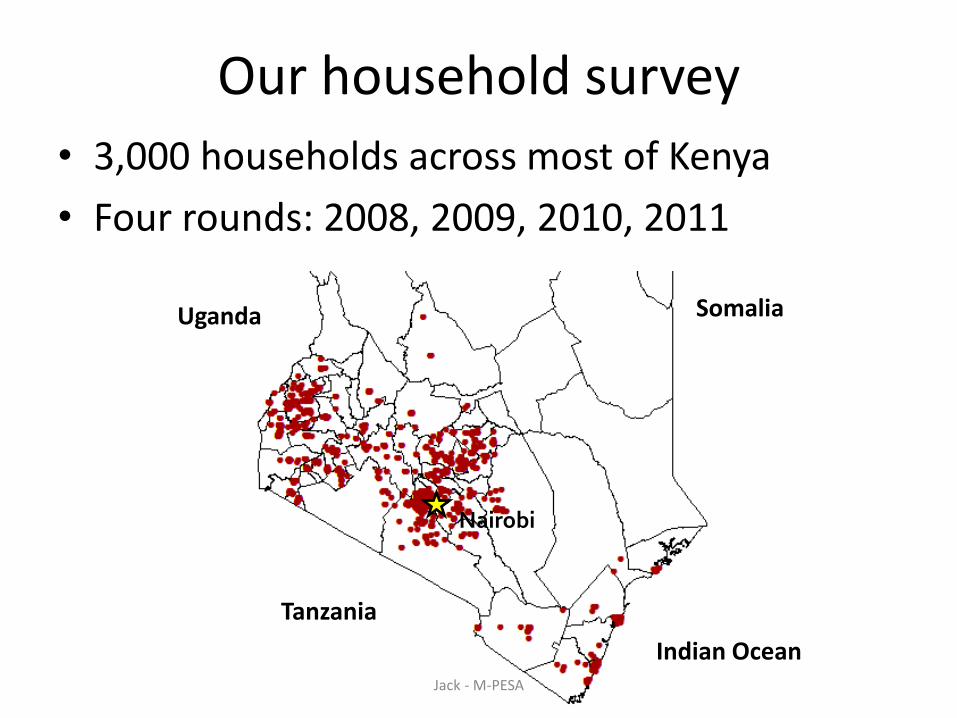
Our household survey
Tanzania
Indian Ocean
Uganda Somalia
Nairobi
• 3,000 households across most of Kenya
• Four rounds: 2008, 2009, 2010, 2011
Jack - M-PESA
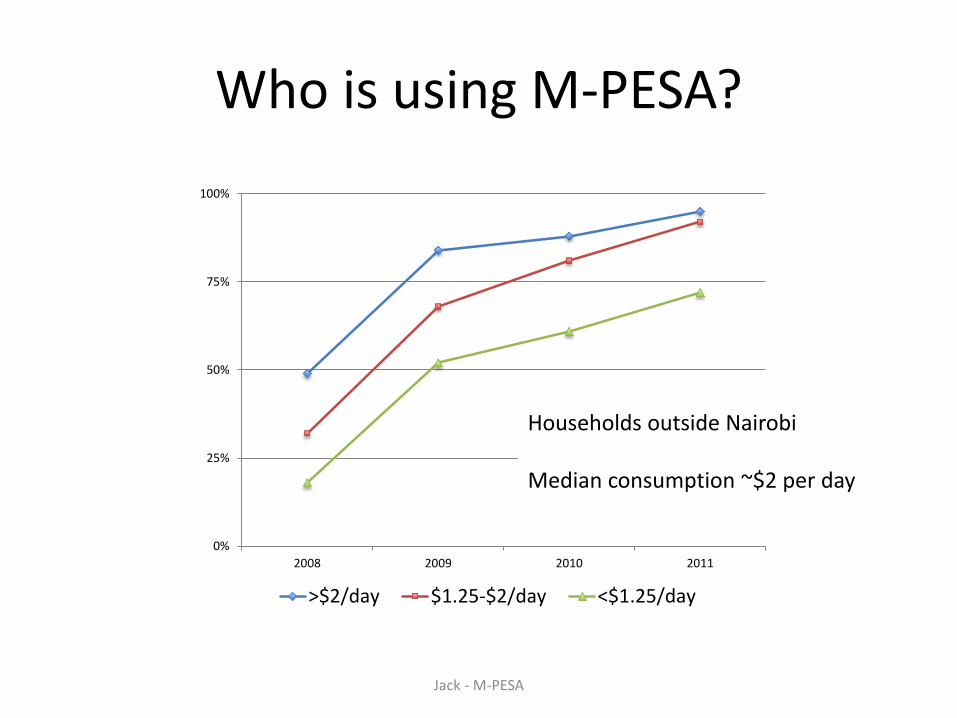
Who is using M-PESA?
0%
25%
50%
75%
100%
2008 2009 2010 2011
>$2/day $1.25-$2/day <$1.25/day
Households outside Nairobi Median consumption ~$2 per day
Jack - M-PESA
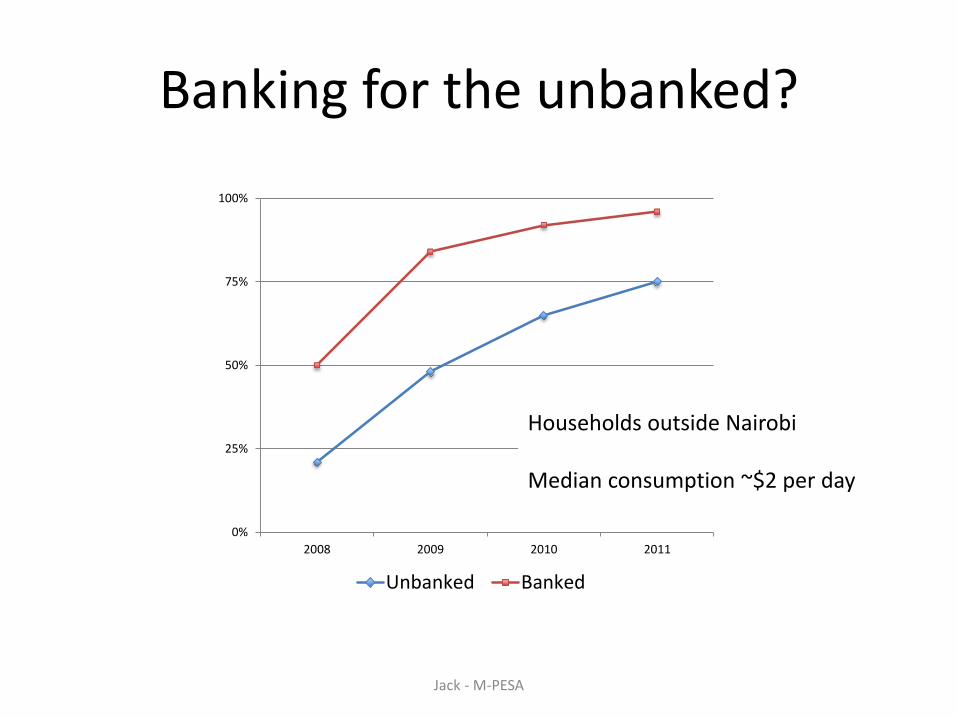
Banking for the unbanked?
0%
25%
50%
75%
100%
2008 2009 2010 2011
Unbanked Banked
Households outside Nairobi Median consumption ~$2 per day
Jack - M-PESA
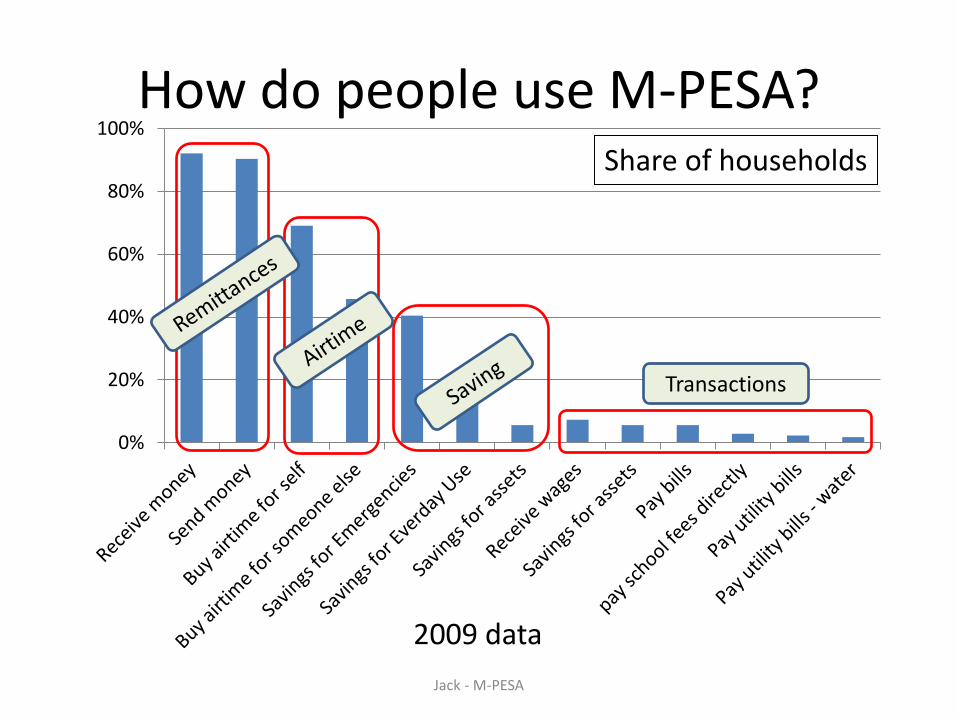
How do people use M-PESA?
0%
20%
40%
60%
80%
100%
2009 data
Share of households
Transactions
Jack - M-PESA
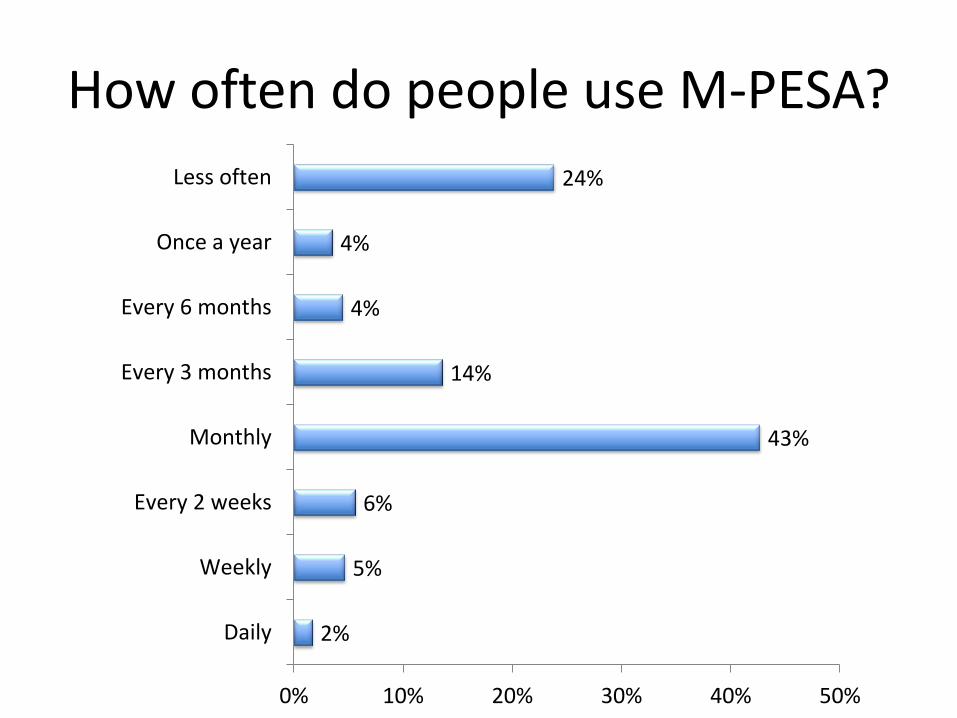
How often do people use M-PESA?
2%
5%
6%
43%
14%
4%
4%
24%
0% 10% 20% 30% 40% 50%
Daily
Weekly
Every 2 weeks
Monthly
Every 3 months
Every 6 months
Once a year
Less often
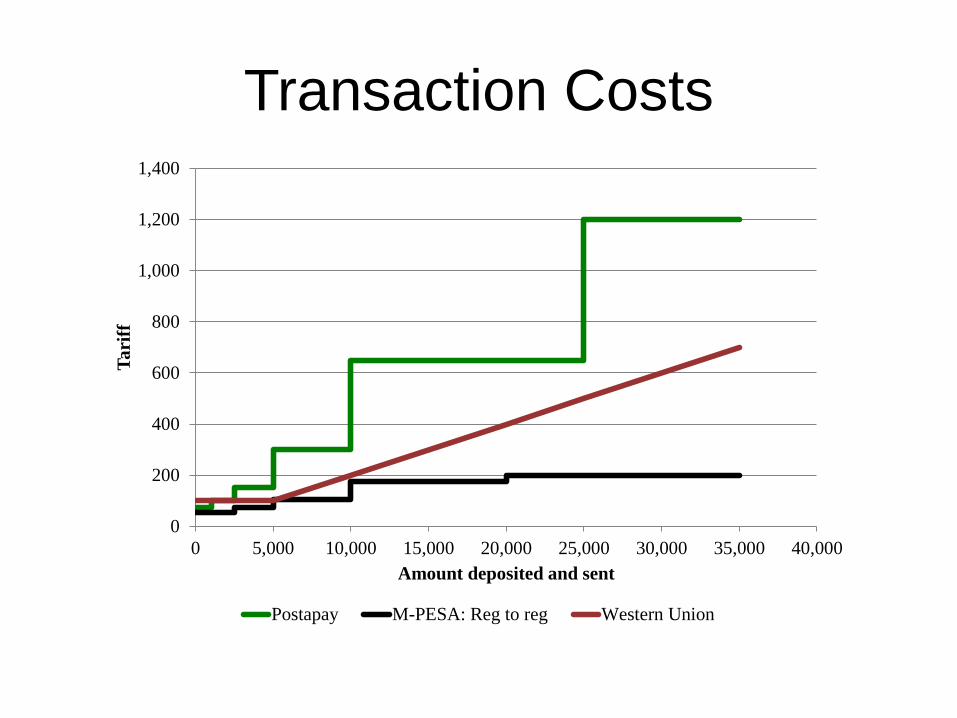
Transaction Costs
0
200
400
600
800
1,000
1,200
1,400
0 5,000 10,000 15,000 20,000 25,000 30,000 35,000 40,000
Ta
riff
Amount deposited and sent
Postapay M-PESA: Reg to reg Western Union
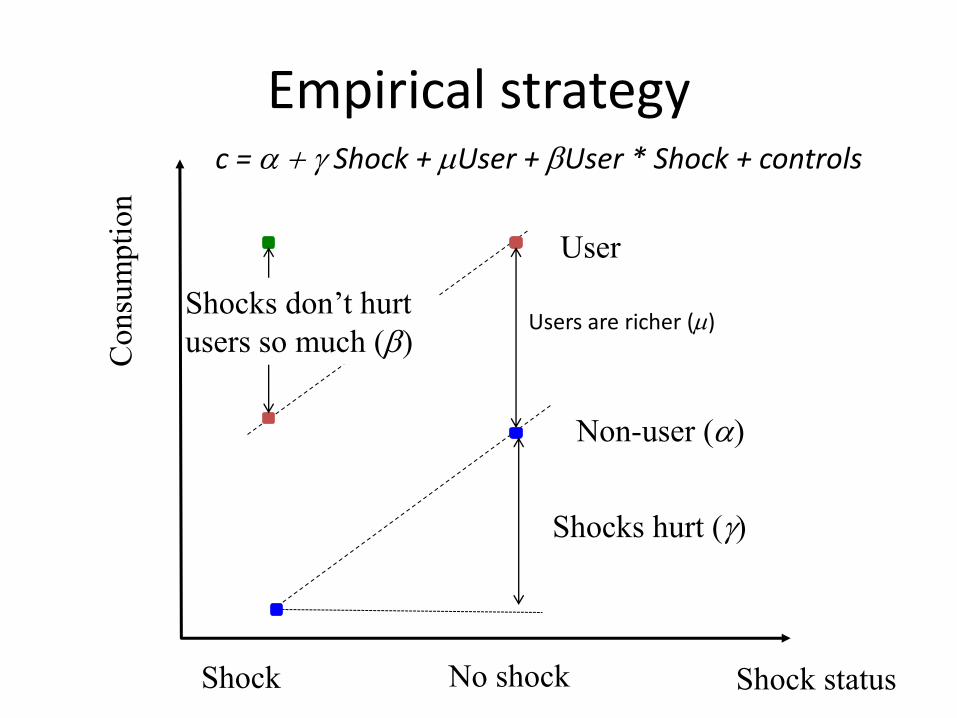
Empirical strategy
Shock No shock
Consu
mpti
on
User
Non-user (a)
Shock status
Users are richer ()
Shocks hurt ()
Shocks don’t hurt
users so much (b)
c = a + Shock + User + bUser * Shock + controls
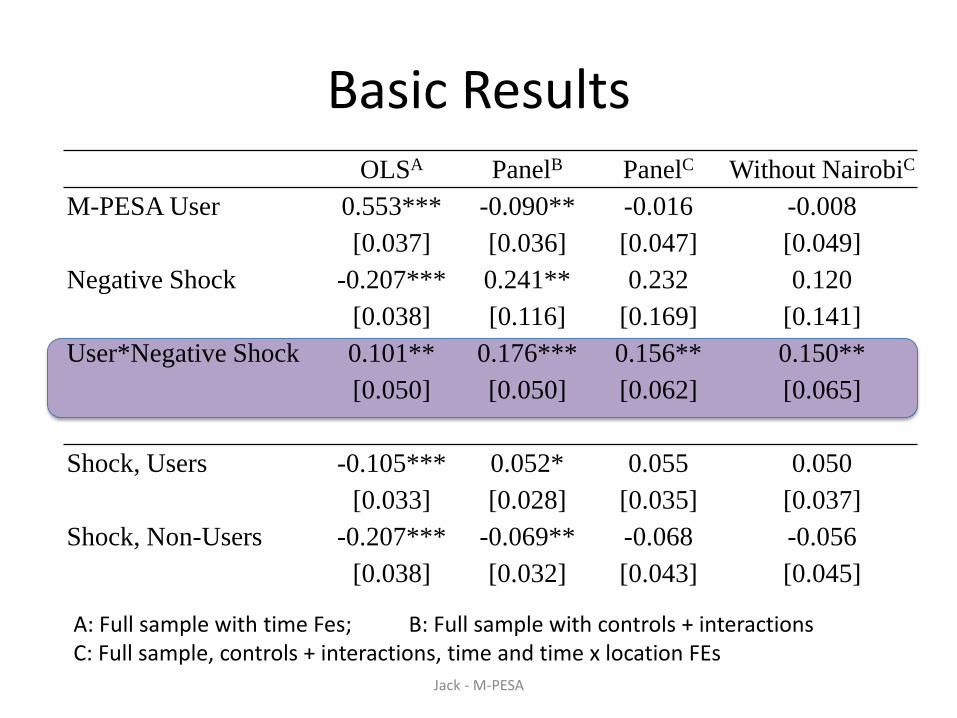
Basic Results OLSA PanelB PanelC Without NairobiC
M-PESA User 0.553*** -0.090** -0.016 -0.008
[0.037] [0.036] [0.047] [0.049]
Negative Shock -0.207*** 0.241** 0.232 0.120
[0.038] [0.116] [0.169] [0.141]
User*Negative Shock 0.101** 0.176*** 0.156** 0.150**
[0.050] [0.050] [0.062] [0.065]
Shock, Users -0.105*** 0.052* 0.055 0.050
[0.033] [0.028] [0.035] [0.037]
Shock, Non-Users -0.207*** -0.069** -0.068 -0.056
[0.038] [0.032] [0.043] [0.045]
Jack - M-PESA
A: Full sample with time Fes; B: Full sample with controls + interactions C: Full sample, controls + interactions, time and time x location FEs
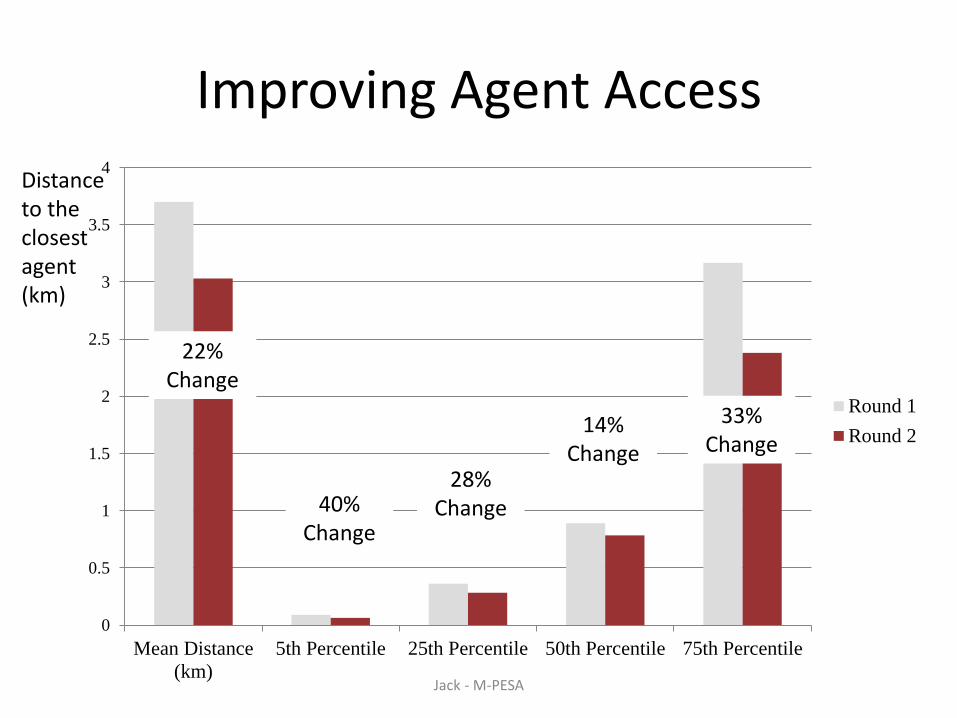
0
0.5
1
1.5
2
2.5
3
3.5
4
Mean Distance
(km)
5th Percentile 25th Percentile 50th Percentile 75th Percentile
Round 1
Round 2
Improving Agent Access
22% Change
40% Change
33% Change
28% Change
14% Change
Distance to the closest agent (km)
Jack - M-PESA
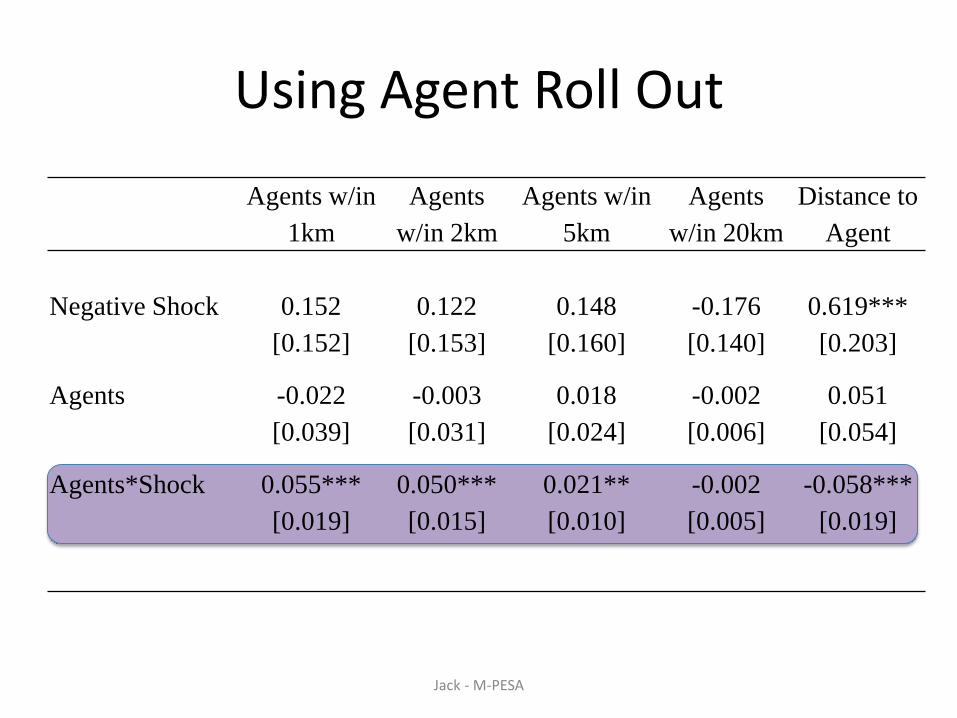
Using Agent Roll Out
Agents w/in
1km
Agents
w/in 2km
Agents w/in
5km
Agents
w/in 20km
Distance to
Agent
Negative Shock 0.152 0.122 0.148 -0.176 0.619***
[0.152] [0.153] [0.160] [0.140] [0.203]
Agents -0.022 -0.003 0.018 -0.002 0.051
[0.039] [0.031] [0.024] [0.006] [0.054]
Agents*Shock 0.055*** 0.050*** 0.021** -0.002 -0.058***
[0.019] [0.015] [0.010] [0.005] [0.019]
Jack - M-PESA
Mechanisms
• Consumption smoothing could be effected through
– Remittances
– Savings
– Information/communication
• We find remittances are the dominant factor
– More likely, More often, More
– Larger network Jack - M-PESA