Embed Size (px)
Citation preview

University of Mississippi University of Mississippi
eGrove eGrove
Electronic Theses and Dissertations Graduate School
2017
Risk, Reward, And The Role Of Habitat Selection On Community Risk, Reward, And The Role Of Habitat Selection On Community
Dynamics In Temporary Ponds Dynamics In Temporary Ponds
Matthew Robert Pintar University of Mississippi
Follow this and additional works at: https://egrove.olemiss.edu/etd
Part of the Ecology and Evolutionary Biology Commons
Recommended Citation Recommended Citation Pintar, Matthew Robert, "Risk, Reward, And The Role Of Habitat Selection On Community Dynamics In Temporary Ponds" (2017). Electronic Theses and Dissertations. 385. https://egrove.olemiss.edu/etd/385
This Dissertation is brought to you for free and open access by the Graduate School at eGrove. It has been accepted for inclusion in Electronic Theses and Dissertations by an authorized administrator of eGrove. For more information, please contact [email protected].

RISK, REWARD, AND THE ROLE OF HABITAT SELECTION ON COMMUNITY
DYNAMICS IN TEMPORARY PONDS:
A Dissertation
presented in partial fulfillment of requirements
for the degree of Doctor of Philosophy
in the Department of Biology
The University of Mississippi
by
MATTHEW R. PINTAR
December 2017

Copyright © 2017 by Matthew R. Pintar
All rights reserved.

ii
ABSTRACT
The processes that generate patterns of species diversity within and among habitat
patches are a fundamental topic of interest in ecology. Traditionally, there was a focus on post-
colonization effects such as predation, however, pre-colonization processes, such as habitat
selection, are equally important determinants of community structure. In freshwater systems, the
lethal effects of dominant predators (particularly fish) are well established, while the transition
from permanent to temporary ponds is a defining characteristic. This transition produces distinct
communities characterized by organisms with complex life cycles and plastic developmental
strategies. This means that many organisms occupying habitat patches arrive there by the
processes of dispersal and colonization. To better understand the processes regulating
community assembly in temporary ponds, I conducted a series of mesocosm experiments that
were colonized by natural populations of aquatic beetles and treefrogs. Hyla chrysoscelis
selected habitats in which they minimized the risk of both desiccation and predation. Aquatic
beetles selected habitats with more available resources, and their habitat preferences partitioned
species among habitats based on the abundance of their preferred resource type. Furthermore,
spatial context-dependent processes created patterns of beetle abundances distinct from what
would be expected without any context-dependent processes. These results indicate that the
variation in abiotic and biotic conditions in ponds creates landscapes that are heterogeneous
mosaics of patches that vary in quality and have distinct communities that are assembled through
several processes, beginning with colonization and habitat selection.

iii
LIST OF ABBREVIATIONS AND SYMBOLS
°C Degrees Celsius
^ Indicates dytiscid species in chapters 4–6
α Significance level
𝜼𝟐 Measure of effect size in ANOVA
𝜼𝑷𝟐
Measure of effect size in ANOVA, excluding unexplained variation
μS Microsiemens
ANOVA Analysis of variance
cm Centimeter
df Degrees of freedom
DO Dissolved oxygen
F Test statistic in ANOVA
L Liter
LSD Least significant difference
m Meter
mg Milligram
N Population/sample size
NMDS Non-metric multidimensional scaling
PERMANOVA Permutational analysis of variance

iv
P Probability of obtaining a test statistic as extreme or more extreme as the
one observed, given the null hypothesis is true
SE Standard error
SIMPER Similarity percentages
SS Sums of squares
UMFS University of Mississippi Field Station

v
ACKNOWLEDGEMENTS
Jason Bohenek, Tyler Breech, and Lauren Eveland assisted with field and lab
components of this dissertation, while they, Timothy Chavez, Rachel Kroeger, Brandon
McDaniel, Zachary Mitchell, Randi Robison, and Nishant Rout provided help with the field and
lab work of the numerous other studies I conducted at UMFS. Jason Bohenek, Tyler Breech,
Chris Binckley, Dave Chalcraft, Jon Davenport, and Emlyn Resetarits provided helpful
comments on manuscripts that formed this dissertation. William Resetarits provided abundant
feedback on experimental designs, analyses, manuscripts, among other things, while Clifford
Ochs, Christopher Leary, Kevin Smith, and Gregg Davidson provided support throughout the
process of completing this dissertation. Financial support was provided by the University of
Mississippi Graduate Student Council, University of Mississippi Field Station, and the Henry L.
and Grace Doherty Foundation. This research was approved by the University of Mississippi’s
Institutional Animal Care and Use Committee (protocol 14-027) and the Mississippi Department
of Wildlife, Fisheries, and Parks.

vi
TABLE OF CONTENTS
Abstract ........................................................................................................................................... ii
List of abbreviations and symbols ................................................................................................. iii
Acknowledgements ..........................................................................................................................v
List of tables ................................................................................................................................. viii
List of figures ................................................................................................................................. ix
Chapter 1: Introduction ..................................................................................................................1
Background ................................................................................................................................2
Study site ....................................................................................................................................8
Mesocosms ...............................................................................................................................10
Study species ............................................................................................................................11
List of references......................................................................................................................13
Chapter 2: Out with the old, in with the new: oviposition preferences matches larval success in
Cope’s gray treefrog, Hyla chrysoscelis ....................................................................................20
Abstract ....................................................................................................................................21
Introduction ..............................................................................................................................22
Materials and methods .............................................................................................................25
Results ......................................................................................................................................27
Discussion ................................................................................................................................29
List of references......................................................................................................................33
Chapter 3: Relative predation risk and risk of desiccation co-determine oviposition preferences
in Cope’s gray treefrog, Hyla chrysoscelis ...............................................................................37
Abstract ....................................................................................................................................38
Introduction ..............................................................................................................................39
Materials and methods .............................................................................................................42
Results ......................................................................................................................................45
Discussion ................................................................................................................................49
List of references......................................................................................................................54
Chapter 4: Tree leaf litter composition drives temporal variation in aquatic beetle colonization
and assemblage structure in lentic systems ...............................................................................59
Abstract ....................................................................................................................................60
Introduction ..............................................................................................................................61
Materials and methods .............................................................................................................65
Results ......................................................................................................................................68
Discussion ................................................................................................................................70

vii
List of references......................................................................................................................76
Appendix A ..............................................................................................................................80 Chapter 5: Prey-driven control of predator assemblages: zooplankton abundance drives aquatic
beetle colonization .....................................................................................................................89
Abstract ....................................................................................................................................90
Introduction ..............................................................................................................................91
Materials and methods .............................................................................................................96
Mesocosms .........................................................................................................................96
Water change experiment ..................................................................................................96
Inoculation experiment ......................................................................................................98
Data analysis ......................................................................................................................98
Results ....................................................................................................................................101
Water change experiment ................................................................................................101
Inoculation experiment ....................................................................................................102
Discussion ..............................................................................................................................105
List of references....................................................................................................................112
Appendix B ............................................................................................................................118
Chapter 6: Context-dependent colonization dynamics: regional reward contagion drives local
compression in aquatic beetles ................................................................................................140
Abstract ..................................................................................................................................141
Introduction ............................................................................................................................143
Materials and methods ...........................................................................................................150
Data analysis ....................................................................................................................152
Results ....................................................................................................................................154
Discussion ..............................................................................................................................160
List of references....................................................................................................................166
Appendix C ............................................................................................................................171
Vita ...............................................................................................................................................174
viii
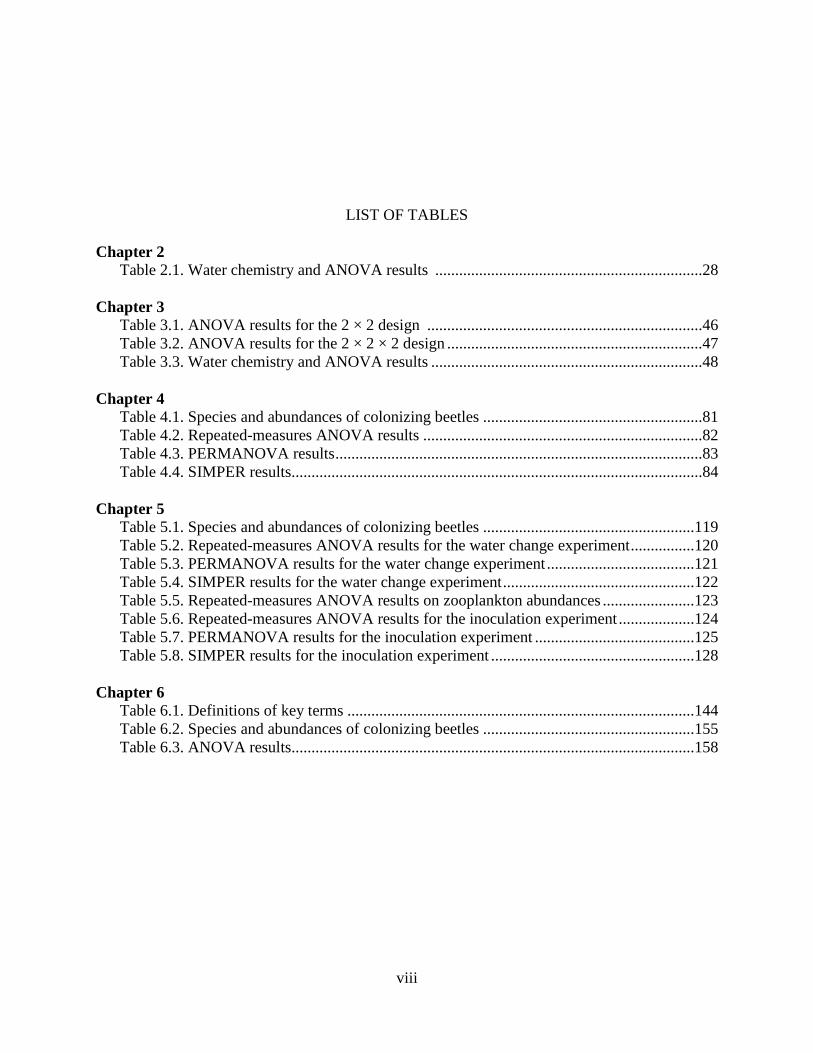
LIST OF TABLES
Chapter 2
Table 2.1. Water chemistry and ANOVA results ...................................................................28
Chapter 3
Table 3.1. ANOVA results for the 2 × 2 design .....................................................................46
Table 3.2. ANOVA results for the 2 × 2 × 2 design ................................................................47
Table 3.3. Water chemistry and ANOVA results ....................................................................48
Chapter 4
Table 4.1. Species and abundances of colonizing beetles .......................................................81
Table 4.2. Repeated-measures ANOVA results ......................................................................82
Table 4.3. PERMANOVA results ............................................................................................83
Table 4.4. SIMPER results.......................................................................................................84
Chapter 5
Table 5.1. Species and abundances of colonizing beetles .....................................................119
Table 5.2. Repeated-measures ANOVA results for the water change experiment ................120
Table 5.3. PERMANOVA results for the water change experiment .....................................121
Table 5.4. SIMPER results for the water change experiment ................................................122
Table 5.5. Repeated-measures ANOVA results on zooplankton abundances .......................123
Table 5.6. Repeated-measures ANOVA results for the inoculation experiment ...................124
Table 5.7. PERMANOVA results for the inoculation experiment ........................................125
Table 5.8. SIMPER results for the inoculation experiment ...................................................128
Chapter 6
Table 6.1. Definitions of key terms .......................................................................................144
Table 6.2. Species and abundances of colonizing beetles .....................................................155
Table 6.3. ANOVA results.....................................................................................................158

ix
LIST OF FIGURES
Chapter 2
Fig. 2.1. Eggs per pool and by day .........................................................................................28
Chapter 3
Fig. 3.1. Mean number of eggs per mesocosm for the 2 × 2 design .......................................46
Fig. 3.2. Mean number of eggs per mesocosm for the 2 × 2 × 2 design ..................................47
Chapter 4
Fig. 4.1. Abundances of all beetles, species richness, dytiscids, and hydrophilids .................85
Fig. 4.2. Abundances of the six most common hydrophilid species........................................86
Fig. 4.3. Abundances of the four most common dytiscid species ............................................87
Fig. 4.4. NMDS plots ...............................................................................................................88
Chapter 5
Fig. 5.1. Abundances of all beetles, species richness, dytiscids, and hydrophilids in the water
change experiment ...........................................................................................................127
Fig. 5.2. Abundances of the 10 most numerous species in the water change experiment .....128
Fig. 5.3. NMDS plots for the water change experiment ........................................................129
Fig. 5.4. Zooplankton abundances .........................................................................................130
Fig. 5.5. Regression of 25 June beetle samples in the water change experiment ..................131
Fig. 5.6. Regression of 25 June beetle samples in the water change experiment ..................132
Fig. 5.7. Regression of 30 April beetle samples in the water change experiment .................133
Fig. 5.8. Regression of 4 October beetle samples in the water change experiment...............134
Fig. 5.9. Abundances of beetles in the inoculation experiment .............................................135
Fig. 5.10. PERMANOVA plots for the inoculation experiment............................................136
Fig. 5.11. Regression of beetles in the inoculation experiment .............................................137
Fig. 5.12. Regression of 5 November beetles in the inoculation experiment ........................138
Fig. 5.13. Regression of 19 November beetle samples in the inoculation experiment ..........139
Chapter 6
Fig. 6.1. Five potential colonization scenarios ......................................................................146
Fig. 6.2. Schematic of region .................................................................................................151
Fig. 6.3. Abundances of all beetles and species richness .......................................................156
Fig. 6.4. Abundances of the four most common beetle species .............................................157
Fig. 6.5. Abundances of beetles .............................................................................................172
Fig. 6.6. Average differences in beetle abundance and species richness between the three
locality types ....................................................................................................................173

1
CHAPTER 1:
INTRODUCTION

2
BACKGROUND
The processes that produce and maintain patterns of species diversity are a fundamental
area of interest in ecology (Hutchinson 1959; Paine 1966; MacArthur and Wilson 1967; Tilman
1999). Physical variation in environmental conditions and species interactions generate patterns
of diversity across multiple spatial scales (Connell 1978; Connell and Sousa 1983; Morin 2011).
Two primary mechanisms directly produce observed diversity within a habitat patch. First, lethal
effects during post-colonization sorting have traditionally been viewed as the dominant
mechanism structuring communities. Species are excluded from patches when they lack
adaptations to escape predation, migrate to another patch when conditions deteriorate, or are
poor competitors and cannot acquire adequate resources (Werner and Glennemeier 1999;
Fairchild et al. 2000; Snodgrass et al. 2000; Knapp et al. 2001; Skelly et al. 2002). Second,
habitat selection is a non-lethal behavioral process that emphasizes nonrandom colonization of
habitat patches based on the perceived fitness consequences of that patch (Resetarits and Wilbur
1989; Resetarits 1996, 2001). Non-lethal effects generated by habitat selection can be as
important, if not more so, as lethal processes in determining species abundances, richness, and
diversity within a patch (Resetarits and Wilbur 1989; Resetarits and Binckley 2009; Binckley
and Resetarits 2009; Vonesh et al. 2009; Kraus and Vonesh 2010).
In lentic freshwater systems, pond permanence, predator presence, and productivity are
primary, often interconnected, drivers of community composition. Ponds exist on a hydroperiod
gradient, and as hydroperiod increases, ponds are typically inhabited by more dominant predators

3
(Wellborn et al. 1996; Wilbur 1997). Most aquatic taxa sort among habitats across a gradient of
predators and productivity (McPeek 1990; Batzer and Wissinger 1996; Wellborn et al. 1996).
Pond productivity is strongly determined by both light availability and the abundance and quality
of resource inputs (Polis et al. 1997; Marcarelli et al. 2011; Stoler and Relyea 2013). Plant litter-
derived allochthonous inputs of organic matter drive ecosystem productivity and processes in
many freshwater systems (Minshall 1967; Holt and Polis 1997; Stoler et al. 2016). These
resource inputs are vital for invertebrates and other aquatic taxa and provide nutrients and energy
both directly to scavengers and decomposers as well as indirectly to herbivores and predators by
stimulating primary and secondary productivity (Fisher and Likens 1973; Anderson and Sedell
1979; Wilbur 1997; Williams 2005).
Physical and chemical characteristics of resource inputs can have a range of interactive
effects on decomposition rates, microbial growth, and assimilation of energy and nutrients
derived from these resource inputs (Webster and Benfield 1986; Magill et al. 1997; Rubbo and
Kiesecker 2004; Maerz et al. 2005; Swan and Palmer 2006; Williams et al. 2008). This in turn
can result in differential effects on the development and morphology of aquatic animals that feed
on litter-derived resources, although such effects have predominately been studied in larval
amphibians. The growth, development, body size, and survival of aquatic animals can be
influenced by both the amount of resources available and the length of time those resources are
accessible to consumers (Golladay et al. 1983; Webster and Benfield 1986; Stoler and Relyea
2011; Earl et al. 2014). Body size and condition are critical because individuals with larger body
sizes have better chances of overwinter survival, shorter times to first reproduction, greater
mating success, and better ability to escape predation (Wilbur and Collins 1973; Howard 1978;
Berven 1981; Berven and Gill 1983; Semlitsch et al. 1988; Rogers and Chalcraft 2008).

4
In permanent ponds fish are often top predators, and the transition from fish to fishless
habitats is a defining characteristic of aquatic communities. In fishless habitats, top predators
are often invertebrates such as beetles, odonates, and hemipterans, or other organisms with
complex life cycles, such as larval salamanders (Schneider and Frost 1996; Wilbur 1997).
Predators play critical roles in structuring populations, communities, and ecosystems, and have
effects that are felt throughout food webs (Power 1990; Holt and Polis 1997; Sih et al. 1998).
Prey abundances are reduced through direct consumption, while other consumers can increase
in abundance in their absence (Paine 1966). Trophic cascades caused by changes in the identity
and/or abundances of top predators that shift predation pressures throughout a food web can
affect primary producers (Carpenter et al. 1985; Power 1990; Polis et al. 2000). Freshwater
systems are perhaps the system in which the effects of predators on lower trophic levels have
been best studied (Brett and Goldman 1996; Hulot et al. 2014).
Many organisms have the ability to produce multiple phenotypes in heterogeneous
environments (Bradshaw 1965; Sibly 1995; Relyea 2001). This phenotypic plasticity can be a
response to environmental conditions to maximize fitness, reflecting the response of
biochemical processes to physics and chemistry. Such is the case with the well-established
example of faster development rates in the presence of higher temperatures. However, this
plasticity has been shaped by natural selection as a result of variable selection pressures on traits
in variable environments (Bradshaw 1965). Adaptive plasticity has in part allowed species to
colonize diverse habitats with an array of environmental conditions (Wilbur 1980). As ponds
dry, many aquatic animals face mortality, particularly those in the larval stage that lack the
ability to disperse to or across terrestrial habitats, and mass mortalities in rapidly drying ponds
are not uncommon (Newman 1992). Thus, plasticity enables organisms to respond to changes in

5
their environment to maximize their chances of survival and future fitness, with resulting
consequences for the structure of ecological communities (Turner and Mittelbach 1990; Werner
1991).
Breeding habitat choices of adult amphibians determine the pond in which larval
amphibians will grow, while aquatic beetles select habitats for not only their offspring but also
themselves (Resetarits 1996). When choosing a breeding habitat many adult amphibians and
insects avoid ponds with predators, particularly fish, which are predators of eggs, larvae, and
adults (Resetarits and Wilbur 1989; Binckley and Resetarits 2005). Fish typically persist only in
permanent ponds, and those in temporary ponds will not survive the subsequent drying cycle.
Fish are also found in nearly all permanent ponds now because of human introductions.
Therefore, while some amphibians do breed in permanent ponds with fish, optimal breeding
habitat for many amphibians is often temporary ponds (Baldwin et al. 2006).
While lacking the risk of predation by fish, temporary ponds can be more stressful
environments because as ponds dry there are fewer resources, greater competition for resources
because there are more individuals in a smaller volume, and higher and often more variable
temperatures, among other changes in abiotic conditions (Schneider and Frost 1996;
McDonough et al. 2011). Risk of predation by animals from the terrestrial environment may
also be greater because there are more individuals in a smaller area with fewer places to escape
predation. Hydroperiod, or the amount of time that a pond retains water, may be one of the most
important factors for amphibians that use temporary ponds (Wellborn et al. 1996). Larvae that
do not complete metamorphosis prior to drying will suffer desiccation and likely death (Rowe
and Dunson 1993). Ponds with different hydroperiods create different selective pressures on
larval amphibian development.

6
In drying ponds, animals with complex life cycles such as amphibians and insects have
the adaptive plasticity to have accelerated larval development, which often occurs after shorter
time periods and at smaller sizes (Gotthard and Nylin 1995; Laurila and Kujasalo 1999; Brady
and Griffiths 2012). Metamorphosis in amphibians and insects in drying ponds occurs earlier as
a result of shorter pond hydroperiod (Wilbur 1987; Newman 1988; Semlitsch and Wilbur 1988;
Juliano and Stoffregen 1994; Tejedo and Reques 1994). These differences can be critical
because with larger body sizes resulting from longer larval periods, individuals have a greater
probability of surviving the winter and a shorter time to first reproduction. Also, females with
larger body sizes at metamorphosis have higher fecundity while males have greater mating
success (Howard 1978; Berven 1981; Berven and Gill 1983; Semlitsch et al. 1988). When
ponds have shorter hydroperiods or a greater risk of predation, larval amphibians may reduce
risk in these environments by metamorphosing sooner, but they also often have a smaller size
that puts them at a disadvantage as individuals that are larger at metamorphosis are more likely
to survive their first winter and have higher fitness (Rogers and Chalcraft 2008).
If size and time to metamorphosis are plastic traits in temporary ponds, then there must
be a cue that indicates potential future mortality and limited growth opportunities and tells
individuals to optimize their larval period (Perrin 1992). Biotic factors that could act as cues
include changes in larval densities (Newman 1987; Tejedo and Reques 1994), food availability
(Burggren and Just 1992), and predator density (Benard 2004). Abiotic factors that could act as
cues include volume (Denver 1997), temperature variation (Wilbur 1987), oxygen availability,
and conductivity (Burggren and Just 1992). However, the frequency of these varying
environmental conditions must be relatively common in order for the evolution of plasticity to
occur (Sibly 1995).

7
All ponds have a history of colonization and succession where prior colonization can
prevent or enhance the success of a new colonizer. The trajectory of a community in temporary
ponds can be determined by the order of arrival of colonizing amphibians (priority effects), so
each time a pond fills with water a new community begins (Alford and Wilbur 1985). Semi-
aquatic animals often reproduce in ponds immediately after they fill, which reduces the risk of
predation (Blaustein and Margalit 1996), the strength of competition, and tadpole mortality due
to desiccation (Lawler and Morin 1993; Wilbur 1997). However, temporal differences in ponds
extend beyond the biological to physical and chemical characteristics such as dissolved oxygen,
conductivity, pH, and volume, all of which may also correlate with spatial patterns in pond use
(Vos and Stumpel 1996; van der Voet and Stumpel 1998; Arav and Blaustein 2006). Given that
amphibians select breeding sites based on site characteristics and context, chemical properties of
both the focal patch and neighboring patches should also affect patterns of site selection
(Resetarits and Wilbur 1989; Resetarits and Binckley 2009). The dynamic habitats that are
lentic freshwater systems are formed by this extensive network of interconnected abiotic and
biotic factors that affect colonization and resulting patterns of species abundance and richness.

8
STUDY SITE
All research herein was conducted at the University of Mississippi Field Station (UMFS)
in Lafayette County, Mississippi, United States. UMFS consists of 318 ha of the Eocene Hills of
the Interior Gulf Coastal Plain with elevations ranging from 118 m along Bay Springs Branch at
the eastern boundary to over 170 m in upland areas along the northern and western boundaries.
UMFS is in the headwaters of the Little Tallahatchie River, a tributary of the Yazoo River in the
lower Mississippi River basin. Bay Springs Branch and its tributaries drain the majority of
UMFS, forming shallow valleys, and the numerous springs provide a perennial water supply for
many of the streams and some of the over 200 ponds that largely fill the valleys. Ponds, which
range in area from 0.01 to 1.9 ha, vary in depth, hydroperiod, and fish assemblages, among other
characteristics. Many of the ponds originated as a part of a fish hatchery operation that opened in
1947 and raised primarily Notemigonus crysoleucas and Carassius auratus. The fish hatchery
operated until the early 1980s before the land was acquired by the University of Mississippi in
1985 and UMFS was established in 1986. One pond and 91 ha of UMFS were originally part of a
cattle farm. During construction of the original ponds, some streams were rerouted from their
natural course to both sides of the valleys with ponds between. In 1990–1991 seven of the
original ponds were converted to 45 400-m2 experimental ponds (Knight 1996).
Located within the Northern Hilly Gulf Coastal Plain ecoregion, UMFS is part of the
North American Coastal Plain, a previously overlooked and recently recognized biodiversity
hotspot (Noss et al. 2015). UMFS supports 345 known species of vascular plants, 55 butterflies,

9
39 mammals, 25 snakes, 22 fish, 16 frogs, 12 salamanders, 10 turtles, and 9 lizards (Keiser 1999,
2001, 2008, 2010, 2014, personal communication; King et al. 2002; Menon and Holland 2012),
but other taxa have not been assessed. Aside from the Hydrophilidae (Testa and Lago 1994) and
Hydrochidae (Worthington et al. 2016), comprehensive assessments of the aquatic beetle fauna
of this region have been lacking relative to other parts of North America. Forests at UMFS are
dominated by Acer rubrum and Liquidambar styraciflua in lowland areas and Pinus spp. and
Quercus spp. in upland areas; fields occur primarily in upland areas, but areas around ponds are
also primarily grasses. Soils are predominately sandy and sandy-loam, but were originally
covered in loess prior to settlement in the mid-19th
century, when the loess was lost due to
deforestation and poor agricultural practices.

10
MESOCOSMS
Temporary ponds are an excellent system for studying community and food web
dynamics because they have discrete boundaries and are realistically mimicked using artificial
mesocosms (Wellborn et al. 1996; Wilbur 1997). Mesocosms control for many factors present in
natural systems, allowing research to focus on factors of interest and replicate treatments to
minimize variance and increase statistical power (Morin 1981; Resetarits and Wilbur 1989;
Resetarits 1998).
Two sizes of mesocosms were used in these experiments. Plastic cattle tanks (1.83 m
diameter, 0.50 m depth, ~1200 L volume) were used in chapter 3, while plastic wading pools (1
m diameter; 0.2 m depth, 110 L) were used in chapters 2 and 4–6. Both cattle tanks and wading
pools are useful for addressing ecological questions in aquatic systems (Morin 1981; Fauth and
Resetarits 1991). Mesocosms were created by filling with either well or pond water. Window
screening (1.3 mm2, 1.13 mm opening) was used to create lids that were depressed below the
water surface to allow for colonization and enable the easy collection of beetles and treefrog
eggs. Leaf litter collected from nearby forest was added at the time of initial filling to provide a
nutrient base and structural complexity (Morin 1981; Resetarits and Wilbur 1989).

11
STUDY SPECIES
This research focused on the colonization of a diverse assemblage of aquatic beetles and
the oviposition behaviors of one common anuran, Hyla chrysoscelis (Cope’s gray treefrog; Cope
1880). Hyla chrysoscelis is common throughout much of the southeastern United States, is
abundant at UMFS, and exhibits selective oviposition behaviors (Resetarits and Wilbur 1989;
Binckley and Resetarits 2008). Between May 2014 and October 2017 I collected and identified
at least 115 species of aquatic beetles at UMFS (94 of which were collected from mesocosms),
representing 46 genera and 8 families (unpublished data). Aquatic beetles are important
components of freshwater aquatic communities, particularly in small, ephemeral, fishless
habitats (Maguire 1963; Schneider and Frost 1996; Fairchild et al. 2000, 2003). Compared to
many other taxa, including other insects, aquatic beetles form highly diverse assemblages in
small habitat patches (Batzer and Wissinger 1996), such as wading pools used as mesocosms.
Most species are vagile and strong dispersers, which enables colonization of isolated and
ephemeral water bodies (Jeffries 1994; Wellborn et al. 1996). Colonization by aquatic beetles
can quickly influence communities as the aquatic adults select habitats both for themselves and
their offspring.
Dispersal is energetically costly, and emphasis is placed on initial colonization as
secondary dispersal may only occur if conditions dramatically change (Zalom et al. 1979;
Jeffries 1994; Zera and Denno 1997; Bilton 2014). Experimental mesocosms of various sizes are
readily colonized by this diverse array of aquatic beetles as they select habitats based on patch
12
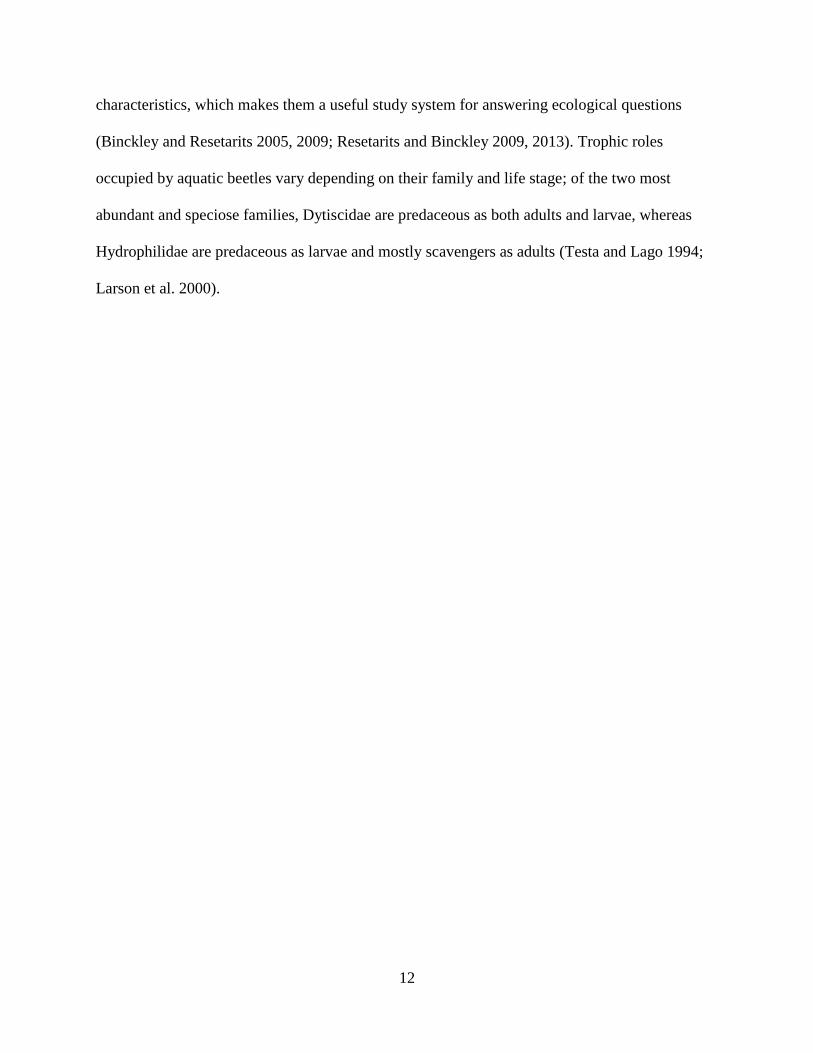
characteristics, which makes them a useful study system for answering ecological questions
(Binckley and Resetarits 2005, 2009; Resetarits and Binckley 2009, 2013). Trophic roles
occupied by aquatic beetles vary depending on their family and life stage; of the two most
abundant and speciose families, Dytiscidae are predaceous as both adults and larvae, whereas
Hydrophilidae are predaceous as larvae and mostly scavengers as adults (Testa and Lago 1994;
Larson et al. 2000).

13
LIST OF REFERENCES

14
Alford, R.A., and H.M. Wilbur. 1985. Priority effects in experimental pond communities:
competition between Bufo and Rana. Ecology 66:1097–1105.
Anderson, N.H., and J.R. Sedell. 1979. Detritus processing by macroinvertebrates in stream
ecosystems. Annual Review of Entomology 24:351–377.
Arav, D., and L. Blaustein. 2006. Effects of pool depth and risk of predation on oviposition
habitat selection by temporary pool Dipterans. Journal of Medical Entomology 43:493–
497.
Baldwin, R.F., A.J.K. Calhoun, and P.G. DeMaynadier. 2006. The significance of hydroperiod
and stand maturity for pool-breeding amphibians in forested landscapes. Canadian
Journal of Zoology 84:1604–1615.
Batzer, D.P., and S.A. Wissinger. 1996. Ecology of insect communities in nontidal wetlands.
Annual Review of Entomology 41:75–100.
Benard, M.F. 2004. Predator-induced phenotypic plasticity in organisms with complex life
histories. Annual Review of Ecology, Evolution, and Systematics 35:651–673.
Berven, K.A. 1981. Mate choice in the wood frog, Rana sylvatica. Evolution 35:707–722.
Berven, K.A., and D.E. Gill. 1983. Interpreting geographic variation in life-history traits.
American Zoologist 23:85–97.
Bilton, D.T. 2014. Dispersal in Dytiscidae. Ecology, Systematics, and the Natural History of
Predaceous Diving Beetles (Coleoptera: Dytiscidae) (ed D.A. Yee), pp. 387–407.
Springer, New York.
Binckley, C.A., and W.J. Resetarits, Jr. 2005. Habitat selection determines abundance, richness
and species composition of beetles in aquatic communities. Biology Letters 1:370–374.
Binckley, C.A., and W.J. Resetarits, Jr. 2008. Oviposition behavior partitions aquatic landscapes
along predation and nutrient gradients. Behavioral Ecology 19:552–557.
Binckley, C.A., and W.J. Resetarits, Jr. 2009. Spatial and temporal dynamics of habitat selection
across canopy gradients generates patterns of species richness and composition in aquatic
beetles. Ecological Entomology 34:457–465.
Blaustein, L., and J. Margalit. 1996. Priority effects in temporary pools: nature and outcome of
mosquito larva-toad tadpole interactions depend on order of entrance. The Journal of
Animal Ecology 65:77–84.
Bradshaw, A.D. 1965. Evolutionary significance of phenotypic plasticity in plants. Advances in
Genetics 13:115–155.
Brady, L.D., and R.A. Griffiths. 2012. Developmental responses to pond desiccation in tadpoles
of the British anuran amphibians (Bufo bufo, B. calamita and Rana temporaria). Journal
of Zoology 252:61–69.
Brett, M.T., and C.R. Goldman. 1996. A meta-analysis of the freshwater trophic cascade.
Proceedings of the National Academy of Sciences 93:7723–7726.
Burggren, W.W., and J.J. Just. 1992. Developmental changes in physiological systems.
Environmental Physiology of Amphibians (ed M.E. Feder and W.W. Burggren), pp. 467–
530. University of Chicago Press, Chicago.
Carpenter, S.R., J.F. Kitchell, and J.R. Hodgson. 1985. Cascading trophic interactions and lake
productivity. BioScience 35:634–639.
Connell, J.H. 1978. Diversity in tropical rain forests and coral reefs. Science 199:1302–1310.
Connell, J.H., and W.P. Sousa. 1983. One the evidence needed to judge ecological stability or
persistence. The American Naturalist 121:789–824.
Cope, E.D. 1880. On the zoological position of Texas. Bulletin of the U.S. National Museum

15
17:1–51.
Denver, R.J. 1997. Proximate mechanisms of phenotypic plasticity in amphibian metamorphosis.
American Zoologist 37:172–184.
Earl, J.E., P.O. Castello, K.E. Cohagen, and R.D. Semlitsch. 2014. Effects of subsidy quality on
reciprocal subsidies: How leaf litter species changes frog biomass export. Oecologia
175:209–218.
Fairchild, G.W., J. Cruz, A.M. Faulds, A.E.Z. Short, and J.F. Matta. 2003. Microhabitat and
landscape influences on aquatic beetle assemblages in a cluster of temporary and
permanent ponds. Journal of the North American Benthological Society 22:224–240.
Fairchild, G.W., A.M. Faulds, and J.F. Matta. 2000. Beetle assemblages in ponds: Effects of
habitat and site age. Freshwater Biology 44:523–534.
Fauth, J.E., and W.J. Resetarits, Jr. 1991. Interactions between the salamander Siren intermedia
and the keystone predator Notophthalmus viridescens. Ecology 72:827–838.
Fisher, S.G., and G.E. Likens. 1973. Energy flow in Bear Brook, New Hampshire: an integrative
approach to stream ecosystem metabolism. Ecological Monographs 43:421–439.
Golladay, S.W., J.R. Webster, and E.F. Benfield. 1983. Factors affecting food utilization by a
leaf shredding aquatic insect: leaf species and conditioning time. Holarctic Ecology
6:157–162.
Gotthard, K., and S. Nylin. 1995. Adaptive plasticity and plasticity as an adaptation: a selective
review of plasticity in animal morphology and life history. Oikos 74:3–17.
Holt, R.D., and G.A. Polis. 1997. A theoretical framework for intraguild predation. The
American Naturalist 149:745–764.
Howard, R.D. 1978. The evolution of mating strategies in bullfrogs, Rana catesbeiana.
Evolution 32:850–871.
Hulot, F.D., G. Lacroix, and M. Loreau. 2014. Differential responses of size-based functional
groups to bottom-up and top-down perturbations in pelagic food webs: A meta-analysis.
Oikos 123:1291–1300.
Hutchinson, G.E. 1959. Homage to Santa Rosalia or why are there so many kinds of animals?
The American Naturalist XCIII:145–159.
Jeffries, M. 1994. Invertebrate communities and turnover in wetland ponds affected by drought.
Freshwater Biology 32:603–612.
Juliano, S.A., and T.L. Stoffregen. 1994. Effects of habitat drying on size at and time to
metamorphosis in the tree hole mosquito Aedes triseriatus. Oecologia 97:369–376.
Keiser, E.D. 1999. Salamanders of the University of Mississippi Field Station. University of
Mississippi, Oxford, MS.
Keiser, E.D. 2001. Turtles of the University of Mississippi Field Station. University of
Mississippi, Oxford, MS.
Keiser, E.D. 2008. Frogs of the University of Mississippi Field Station. University of
Mississippi, Oxford, MS.
Keiser, E.D. 2010. Snakes of the University of Mississippi Field Station. University of
Mississippi, Oxford, MS.
Keiser, E.D. 2014. Lizards of the University of Mississippi Field Station. University of
Mississippi, Oxford, MS.
King, J., A. McBride, and P.K. Lago. 2002. A Field Guide to the Butterflies Common to the
University of Mississippi Field Station. University of Mississippi, Oxford, MS.
Knapp, R.A., K.R. Matthews, and O. Sarnelle. 2001. Resistance and resilience of alpine lake
16
fauna to fish introductions. Ecological Monographs 71:401–421.
Knight, L.A. 1996. A History and General Description of the University of Mississippi
Biological Field Station. University of Mississippi, Oxford, MS.
Kraus, J.M., and J.R. Vonesh. 2010. Feedbacks between community assembly and habitat
selection shape variation in local colonization. Journal of Animal Ecology 79:795–802.
Larson, D.J., Y. Alarie, and R.E. Roughley. 2000. Predaceous Diving Beetles (Coleoptera:
Dytiscidae) of the Nearctic Region, with emphasis on the fauna of Canada and Alaska.
National Research Council of Canada, Ottawa, Canada.
Laurila, A., and J. Kujasalo. 1999. Habitat duration, predation risk and phenotypic plasticity in
common frog (Rana temporaria) tadpoles. Journal of Animal Ecology 68:1123–1132.
Lawler, S.P., and P.J. Morin. 1993. Temporal overlap, competition, and priority effects in larval
anurans.
MacArthur, R.H., and E.O. Wilson. 1967. The theory of island biogeography. Monographs in
Population Biology 1:1–215.
Maerz, J.C., C.J. Brown, C.T. Chapin, and B. Blossey. 2005. Can secondary compounds of an
invasive plant affect larval amphibians? Functional Ecology 19:970–975.
Magill, A.H., J.D. Aber, J.J. Hendricks, R.D. Bowden, J.M. Melillo, and P.A. Steudler. 1997.
Biogeochemical response of forest ecosystems to simulated chronic nitrogen deposition.
Ecological Applications 7:402–415.
Maguire, B. 1963. The passive dispersal of small aquatic organisms and their colonization of
isolated bodies of water. Ecological Monographs 33:161–185.
Marcarelli, A.M., C.V Baxter, M.M. Mineau, and R.O. Hall. 2011. Quantity and quality:
Unifying food web and ecosystem perspectives on the role of resource subsidies in
freshwaters. Ecology 92:1215–1225.
McDonough, O.T., J.D. Hosen, and M.A. Palmer. 2011. Temporary streams: the hydrology,
geography, and ecology of non-perennially flowing waters. Pages 259–289River
Ecosystems: Dynamics, Management and Conservation.
McPeek, M.A. 1990. Determination of species composition in the Enallagma damselfly
assemblages of permanent lakes. Ecology 71:83–98.
Menon, R., and M.M. Holland. 2012. Study of understory vegetation at the University of
Mississippi Field Station in North Mississippi. Castanea 77:28–36.
Minshall, G.W. 1967. Role of allochthonous detritus in the trophic structure of a woodland
springbrook community. Ecology 48:139–149.
Morin, P.J. 1981. Predatory salamanders reverse the outcome of competition among three
species of anuran tadpoles. Science 212:1284–1286.
Morin, P.J. 2011. Community Ecology. 2nd edition. Wiley-Blackwell, Hoboken.
Newman, R.A. 1987. Effects of density and predation on Scaphiopus couchi tadpoles in desert
ponds. Oecologia 71:301–307.
Newman, R.A. 1988. Adaptive plasticity in development of Scaphiopus couchii tadpoles in
desert ponds. Evolution 42:774–783.
Newman, R.A. 1992. Adaptive plasticity in amphibian metamorphosis. BioScience 42:671–678.
Noss, R.F., W.J. Platt, B.A. Sorrie, A.S. Weakley, D.B. Means, J. Costanza, and R.K. Peet. 2015.
How global biodiversity hotspots may go unrecognized: Lessons from the North
American Coastal Plain. Diversity and Distributions 21:236–244.
Paine, R.T. 1966. Food web complexity and species diversity. The American Naturalist 100:65–
75.

17
Perrin, N. 1992. Optimal resource allocation and the marginal value of organs. The American
Naturalist 139:1344.
Polis, G.A., W.B. Anderson, and R.D. Holt. 1997. Toward an integration of landscape and food
web ecology: the dynamics of spatially subsidized food webs. Annual Review of Ecology
and Systematics 28:289–316.
Polis, G.A., A.L.W. Sears, G.R. Huxel, D.R. Strong, and J. Maron. 2000. When is a trophic
cascade a trophic cascade? Trends in Ecology & Evolution 15:473–475.
Power, M.E. 1990. Effects of fish in river food webs. Science 250:811–814.
Relyea, R.A. 2001. Morphological and behavioral plasticity of larval anurans in response to
different predators. Ecology 82:523–540.
Resetarits, W.J. Jr. 1996. Oviposition site choice and life history evolution. American Zoologist
36:205–215.
Resetarits, W.J. Jr. 1998. Differential vulnerability of Hyla chrysoscelis eggs and hatchlings to
larval insect predators. Journal of Herpetology 32:440–443.
Resetarits, W.J. Jr. 2001. Colonization under threat of predation: avoidance of fish by an aquatic
beetle, Tropisternus lateralis (Coleoptera: Hydrophilidae). Oecologia 129:155–160.
Resetarits, W.J. Jr., and C.A. Binckley. 2009. Spatial contagion of predation risk affects
colonization dynamics in experimental aquatic landscapes. Ecology 90:869–876.
Resetarits, W.J. Jr., and C.A. Binckley. 2013. Patch quality and context, but not patch number,
drive multi-scale colonization dynamics in experimental aquatic landscapes. Oecologia
173:933–946.
Resetarits, W.J. Jr., and H.M. Wilbur. 1989. Choice of oviposition site by Hyla chrysoscelis: role
of predators and competitors. Ecology 70:220–228.
Rogers, T.N., and D.R. Chalcraft. 2008. Pond hydroperiod alters the effect of density-dependent
processes on larval anurans. Canadian Journal of Fisheries and Aquatic Sciences
65:2761–2768.
Rowe, C.L., and W.A. Dunson. 1993. Relationships among abiotic parameters and breeding
effort by three amphibians in temporary wetlands of central Pennsylvania. Wetlands
13:237–246.
Rubbo, M.J., and J.M. Kiesecker. 2004. Leaf litter composition and community structure:
translating regional species changes into local dynamics. Ecology 85:2519–2525.
Schneider, D.W., and T.M. Frost. 1996. Habitat duration and community structure in temporary
ponds. Journal of the North American Benthological Society 15:64–86.
Semlitsch, R.D., D.E. Scott, and J.H.K. Pechmann. 1988. Time and size at metamorphosis
related to adult fitness in Ambystoma talpoideum. Ecology 69:184–192.
Semlitsch, R.D., and H.M. Wilbur. 1988. Effects of pond drying time on metamorphosis and
survival in the salamander Ambystoma talpoideum. Copeia 1988:978–983.
Sibly, R.M. 1995. Life-history evolution in spatially heterogeneous environments, with and
without phenotypic plasticity. Evolutionary Ecology 9:242–257.
Sih, A., G. Englund, and D. Wooster. 1998. Emergent impacts of multiple predators on prey.
Trends in Ecology and Evolution 13:350–355.
Skelly, D.K., L.K. Freidenburg, and J.M. Kiesecker. 2002. Forest canopy and the performance of
larval amphibians. Ecology 83:983–992.
Snodgrass, J.W., A.L. Bryan, and J. Burger. 2000. Development of expectations of larval
amphibian assemblage structure in southeastern depression wetlands. Ecological
Applications 10:1219–1229.

18
Stoler, A.B., D.J. Burke, and R.A. Relyea. 2016. Litter chemistry and chemical diversity drive
ecosystem processes in forest ponds. Ecology 97:1783–1795.
Stoler, A.B., and R.A. Relyea. 2011. Living in the litter: The influence of tree leaf litter on
wetland communities. Oikos 120:862–872.
Stoler, A.B., and R.A. Relyea. 2013. Bottom-up meets top-down: leaf litter inputs influence
predator-prey interactions in wetlands. Oecologia 173:249–257.
Swan, C.M., and M.A. Palmer. 2006. Composition of speciose leaf litter alters stream detritivore
growth, feeding activity and leaf breakdown. Oecologia 147:469–478.
Tejedo, M., and R. Reques. 1994. Plasticity in metamorphic traits of natterjack tadpoles: the
interactive effects of density and pond duration. Oikos 71:295–304.
Testa, S., and P.K. Lago. 1994. The aquatic Hydrophilidae (Coleoptera) of Mississippi.
Mississippi Agricultural and Forestry Experimental Station Technical Bulletin 193:1–71.
Tilman, D. 1999. The ecological consequences of changes in biodiversity: a search for general
principles. Ecology 80:1455–1474.
Turner, A.M., and G.G. Mittelbach. 1990. Predator avoidance and community structure:
interactions among piscivores, planktivores, and plankton. Ecology 71:2241–2254.
van der Voet, H., and A.H.P. Stumpel. 1998. Characterizing the suitability of new ponds for
amphibians.
Vonesh, J.R., J.M. Kraus, J.S. Rosenberg, and J.M. Chase. 2009. Predator effects on aquatic
community assembly: disentangling the roles of habitat selection and post-colonization
processes. Oikos 118:1219–1229.
Vos, C.C., and A.H.P. Stumpel. 1996. Comparison of habitat-isolation parameters in relation to
fragmented distribution patterns in the tree frog (Hyla arborea). Landscape Ecology
11:203–214.
Webster, J.R., and E.F. Benfield. 1986. Vascular plant breakdown in freshwater ecosystems.
Annual Review of Ecology and Systematics 17:567–594.
Wellborn, G.A., D.K. Skelly, and E.E. Werner. 1996. Mechanisms creating community structure
across a freshwater habitat gradient. Annual Review of Ecology and Systematics 27:337–
363.
Werner, E.E. 1991. Nonlethal effects of a predator on competitive interactions between two
anuran larvae. Ecology 72:1709–1720.
Werner, E.E., and K.S. Glennemeier. 1999. Influence of forest canopy cover on the breeding
pond distributions of several amphibian species. Copeia 1999:1–12.
Wilbur, H.M. 1980. Complex life cycles. Annual Review of Ecology and Systematics 11:67–93.
Wilbur, H.M. 1987. Regulation of structure in complex systems: experimental temporary pond
communities. Ecology 68:1437–1452.
Wilbur, H.M. 1997. Experimental ecology of food webs: complex systems in temporary ponds.
Ecology 78:2279–2302.
Wilbur, H.M., and J.P. Collins. 1973. Ecological aspects of amphibian metamorphosis. Science
182:1305–1314.
Williams, B.K., T.A.G. Rittenhouse, and R.D. Semlitsch. 2008. Leaf litter input mediates tadpole
performance across forest canopy treatments. Oecologia 155:377–384.
Williams, D.D. 2005. Temporary forest pools: Can we see the water for the trees? Wetlands
Ecology and Management 13:213–233.
Worthington, R.J., J.L. Hellman, and P.K. Lago. 2016. Hydrochilidae (Coleoptera) of
Mississippi. Transactions of the American Entomological Society 142:167–213.

19
Zalom, F.G., A.A. Grigarick, and M.O. Way. 1979. Seasonal and diel flight periodicities of rice
field Hydrophilidae. Environmental Entomology 8:938–943.
Zera, A.J., and R.F. Denno. 1997. Physiology and ecology of dispersal polymorphism in insects.
Annual Review of Entomology 42:207–230.

20
CHAPTER 2:
OUT WITH THE OLD, IN WITH THE NEW: OVIPOSITION PREFERENCE MATCHES
LARVAL SUCCESS IN COPE’S GRAY TREEFROG, HYLA CHRYSOSCELIS

21
ABSTRACT1
Oviposition site selection by breeding amphibians determines larval habitat for their
offspring. Many amphibians breed in temporary ponds, which vary in hydroperiod and levels of
competition, predation, and resource abundance. Newly filled ponds have fewer competitors and
predators and more periphyton and phytoplankton, which are more palatable food sources for
anuran larvae. We tested for oviposition site preference between old and new water pools in Hyla
chrysoscelis, a species known to have better larval performance in newly filled pools. Consistent
with larval performance and the observation that anurans often breed in ponds immediately after
they fill, H. chrysoscelis selectively oviposited in new pools. Conductivity was significantly
lower and dissolved oxygen significantly higher in new versus old pools, and these may be cues
of pond age and productivity, respectively. We demonstrate that adult oviposition site selection
preferences in our study match larval performance differences seen in previous work and that
this preference is not simply for newly filled ponds but for ponds with a recent influx of water.
These results further suggest novel ways for land managers to increase amphibian populations.
Draining ponds will increase their attractiveness to breeding females who simultaneously avoid
fish and choose new water.
1 A modified version of this chapter was published as this article:
Pintar, M.R., and W.J. Resetarits, Jr. 2017. Out with the old, in with the new: oviposition preference matches larval
success in Cope’s gray treefrog, Hyla chrysoscelis. Journal of Herpetology 51:186–189.

22
INTRODUCTION
During oviposition, a female selects habitat for her offspring, determining the quality of
the offspring’s environment and dictating larval performance and adult fitness (Resetarits and
Wilbur 1989). Because habitat selection is a response to variation in habitat quality, adults would
be expected to choose oviposition sites that maximize larval performance (Fretwell and Lucas
1970; Morris 2003). The relationship between oviposition site preference and larval performance
has been well studied in insects (Jaenike 1978; Mayhew1997), where offspring have better
survival on preferred plant species, and females lay more eggs on these preferred plants
(Gripenberg et al. 2010). Work on insects and amphibians shows that optimal habitat matching
results in better larval performance and survival (Rieger et al. 2004). Oviposition in poor larval
habitats can greatly reduce or completely eliminate the lifetime reproductive output of some taxa
(Spencer et al. 2002).
Earlier breeding by anuran amphibians at temporary ponds provides offspring with an
advantage over later breeders. Filling releases nutrients from dead plant and animal matter
already in the pond, which produces early successional periphyton and phytoplankton blooms
more palatable for anuran larvae than later successional filamentous algae and macrophytes
(Seale 1980). Anurans have higher larval survival, shorter larval periods, and larger metamorphic
size in recently filled ponds, and early arriving individuals can shape community structure via
priority effects (Wilbur and Alford 1985). As hydroperiod increases and ponds age, the
abundance of predators and competitors increases (Wellborn et al. 1996), and resources decline

23
for larval anurans as they are stored in the biomass of plants and animals, which can then be
exported from a pond (Wilbur 1997; Kraus and Vonesh 2012). Thus, the "priority advantage"
derives from reduced risk of death via desiccation and predation, increased resource availability
(Wilbur 1987), and decreased competition (Alford and Wilbur 1985).
Amphibians select breeding sites based on a variety of site characteristics, including
biotic factors, such as the presence of predators and competitors (Resetarits and Wilbur 1989),
and abiotic factors such as water depth, sediment depth (Rudolf and Rödel 2005), and canopy
coverage (Binckley and Resetarits 2007). Other chemical differences between ponds that may
relate to pond age, such as conductivity, dissolved oxygen (DO), and pH, can correlate with
patterns of pond use (Vos and Stumpel 1996; van der Voet and Stumpel 1998). Therefore,
breeding anurans likely respond to the chemical cue(s) (or lack thereof) of new water in recently
filled ponds and select these sites as their preferred breeding habitat. Timing of oviposition and
selection of breeding sites may interact as breeding subsides later in the summer and many
temporary ponds begin to dry. Temporary ponds provide critical breeding habitat for amphibians,
and their use of temporary ponds is an important evolutionary adaptation for maintaining
complex life cycles (Wassersug 1975).
Although many anurans often breed in ponds immediately after they fill (Woodward
1983), their "preference" for newly filled ponds should not be axiomatic in amphibian ecology
(Duellman and Trueb 1986), as the preference for newly filled ponds has not been
experimentally demonstrated. In the southeastern United States Hyla chrysoscelis (Cope’s gray
treefrog; Cope 1880) breeds April through August in an array of pond types, including
experimental mesocosms, and has greater survival, grows larger, and reaches metamorphosis
faster in recently filled ponds (Wilbur and Alford 1985; Pintar and Resetarits 2017a). They can
24
metamorphose in as little as one month, and juvenile growth can be partitioned between their
aquatic and terrestrial stages, enabling them to take advantage of temporary ponds while also
metamorphosing before they dry (Wilbur and Collins 1973). To determine whether oviposition
site preference matches previously observed larval performance differences in H. chrysoscelis,
we investigated the effects of pond water age and resulting chemical characteristics on
oviposition site preference of a natural population of H. chrysoscelis in a landscape of
experimental mesocosms.

25
MATERIALS AND METHODS
Experimental ponds (plastic wading pools: 1 m diameter; 110 L), arranged in a 4 × 6
rectangular array (1 m between pool edges), were established on 31 July 2014 at UMFS in a field
38 m north and 45 m west of the nearest ponds, which contained fish. Two treatments, old water
(Old) and new water (New) (12 replicates each), were arranged in a block design with rows (N =
6, south to north towards forest edge) as blocks. We randomized the treatment of the first pool in
the first block and systematically alternated treatment between pools by row and column so no
pools of the same treatment were adjacent. Pools were filled with water from a nearby well and
had 0.5 kg of leaf litter (primarily Quercus spp.) added at the time of filling. Pools were not
inoculated with pond water in order to mimic newly filled ponds with no pre-existing aquatic
biota; uninoculated ponds nonetheless rapidly develop algal, phytoplankton, and zooplankton
assemblages (Louette and De Meester 2005). Window screening (1.3 mm2, 1.13 mm opening)
was used to cover the pools and depressed below the water surface to segregate frog eggs from
the leaf litter and enable collection. Once every seven days for four weeks, beginning on 7
August, nearly all water (> 95%) in the New pools was bailed using a bucket. Water was bailed
from above the screen so that no leaf litter (placed below the screen) was lost during the bailing
process. New pools were refilled and Old pools were topped off, both with well water, to
maintain equal volumes. Pools were checked daily for frog eggs, which were collected, counted,
and placed in nearby fishless ponds. The experiment was terminated on 4 September 2014. We
measured pool temperature, conductivity, and pH with a YSI 63/25 FT meter, dissolved oxygen

26
(DO) with a YSI 550 DO meter, and analyzed all variables with separate ANOVAs on log-
transformed data (except pH). We also measured the above variables for well water and
rainwater (from the previous night) on 28 and 31 August, respectively (Table 2.1). We examined
the effects of treatment and block on mean total eggs using square-root transformed data and
ANOVA. Our primary response variable, total number of eggs laid per pool during the course of
the experiment, is the most ecologically meaningful way of analyzing our data and does not
inflate statistical power relative to using number of egg masses laid. Although neither eggs nor
egg masses are independent pieces of information on treatment effects, egg counts within
experimental units are independent estimates of treatment effects in unconstrained natural
populations. All analyses were conducted using type III SS (α = 0.05), R v. 3.2.2 (R Core Team
2015), and the car package (Fox and Weisberg 2011). Data are available in Figshare (Pintar and
Resetarits 2017a).

27
RESULTS
Hyla chrysoscelis laid a total of 6554 eggs in New pools (655.4 ± 203.2, mean ± SE) and
44 in Old pools (4.4 ± 4.4) (F1,18 = 15.22, P = 0.0010, Figure 2.1). We estimate this represents
the output from 8 to 11 females based on the spatial and temporal distributions of eggs and
average clutch size. Because the experiment was conducted late in the season breeding activity
was limited, but the difference in response was nonetheless definitive. All eggs in Old pools
were laid in one pool on 8 August, the first rainy night during the experiment, whereas
oviposition in New pools occurred on five of the six nights (Figure 2.1; also 3 September) when
more than a trace of precipitation was recorded at the University and Abbeville, MS weather
stations (National Oceanic and Atmospheric Administration, 2014). Seven of the ten New pools
included in the analysis received eggs, and two of these pools received eggs on multiple nights.
No oviposition by H. chrysoscelis was observed anywhere at UMFS after 31 August. The
northernmost row (2 replicates of each treatment) received zero eggs and was eliminated from
the egg analysis, whereas the effect of block on number of eggs, conductivity, and DO was not
significant (P > 0.25) and was included in the error term. Water changes significantly decreased
pool conductivity and increased DO but did not significantly affect pH and temperature (Table
2.1).

28
Table 2.1. Water chemistry and ANOVA results for differences between New and Old pools.
Mean pH was calculated by converting each pool’s pH to hydrogen ion concentrations,
calculating the arithmetic average of all pools in each treatment, and converting back to pH.
New Old Well Rain
df F P Mean SE Mean SE
Conductivity (µS/cm)
Residuals
1
22
721.37
<0.0001
25.01 0.47 59.43 1.56 18.8 7.1
DO (mg/L)
Residuals
1
22
5.37 0.0301 5.24 0.20 4.64 0.17 6.68 7.74
pH
Block
Residuals
1
5
17
0.91
1.92
0.3535
0.1433
6.67 0.10 6.72 0.16 5.49 5.82
Temperature ( °C)
Block
Residuals
1
5
17
0.00
3.47
0.9957
0.0242
34.17 0.32 34.17 0.30 18.6 20.1
Figure 2.1. Total number of eggs per treatment (gray = New, black = Old) for each night
oviposition occurred, and mean number of eggs (mean ± SE) per New (dark gray) and Old
(black) pools over the duration of the experiment.

29
DISCUSSION
Preference-performance theory predicts that when there are larval performance
differences between patches of varying quality there should also be matching oviposition site
preference differences among these patches. Many amphibians have been observed breeding in
ponds soon after they fill, and one of these species, Hyla chrysoscelis, is known to have better
larval performance in newer ponds (Wilbur and Alford 1985; Pintar and Resetarits 2017a). Given
these larval performance differences in H. chrysoscelis, we would expect to observe matching
adult oviposition site preferences so that individuals are able to maximize their expected fitness.
In our experiment, H. chrysoscelis selected oviposition sites with new water over those
with old water only eight days after pools were established. Differences of six days in the timing
of arrival of species can have important effects on species interactions and community structure
that persist through the summer (Wilbur and Alford 1985). Our study was conducted in late
summer, when most females ovipositing in our array had likely already laid a clutch earlier in the
summer or were younger females that recently reached maturity. At this time many of the
fishless ponds at our study site had begun to dry and larvae of many amphibians that bred earlier
in the year were completing metamorphosis. The choice of oviposition site by females at this
point in the year is likely influenced by factors such as predation risk, resource availability,
expected hydroperiod, and water temperature. Because larvae do not overwinter, the emphasis
remains on larval survival, but growth rate takes on increased importance as they need to
complete metamorphosis and prepare for winter.

30
Both conductivity and DO differed significantly between old and new pools. Female H.
chrysoscelis may be responding to total dissolved solids, particularly dissolved organics that
have leached from dead organic matter or have been metabolized by other organisms in older
ponds, or responding to increased DO, which would indicate higher algal productivity.
Conductivity increases as temporary ponds age and dry, concentrating more dissolved solids in a
smaller volume, and it is also higher in ponds with high nutrient levels regardless of pond age or
hydroperiod. Therefore, high conductivity can be an ambiguous indicator of habitat quality,
indicating both higher resource availability and desiccation risk (Spencer and Blaustein 2001).
Dissolved oxygen should be a more reliable indicator of algal production relative to animal
metabolism, but because it is undersaturated in both new and old pools, it may be difficult to
relate to productivity. Although we show that H. chrysoscelis selects new pools with low
conductivity/higher DO, as well as pools with larger volumes but equal surface area (Pintar and
Resetarits 2017c), they do not respond to increased nutrient levels directly (Binckley and
Resetarits 2008). Females may respond negatively to dissolved solids (conductivity) as an
indicator of increased desiccation risk and lower habitat quality, and use DO as a positive
indicator of productivity and enhanced larval growth. Of course, other cues, perhaps emanating
directly from biota, may be used for assessment.
Although many amphibians are often found in new ponds and have better larval
performance in these habitats, oviposition preference for newly filled ponds has not previously
been demonstrated (Wilbur 1980; Alford and Wilbur 1985; Wilbur and Alford 1985; Morin
1990; Murphy 2003; Church 2008). In a similar study, ovipositing Túngara Frogs, Physalaemus
pustulosus, in Panama did not prefer newly filled ponds two, four, and eight weeks younger than
paired old water ponds (Fegraus and Marsh 2000). However, larval growth and survival did not

31
differ between old and new ponds, suggesting no selective advantage to breed in new ponds. In
both newly created habitats (typically via disturbances) or newly available habitats (e.g. seasonal
colonization of temperate breeding habitats by migratory birds) benefits gained from early arrival
at new habitats stems from being able to secure optimal breeding sites, avoid predation, and
reduce competition (Alve 1999; Kokko 1999). These priority effects occur in many systems and
allow early colonizers to gain advantages over later colonizers (Alford and Wilbur 1985; Facelli
and Facelli 1993; Shorrocks and Bingley 1994; Almany 2003).
Although many anurans are observed to breed in recently filled ponds, we demonstrate
that H. chrysoscelis is selecting ponds with new water, not simply ponds that have recently filled,
since our pools never really dry. Choosing recently replenished ponds does not necessarily place
them in fishless habitats, as would typically be the case with newly filled ponds, thus explaining
the strong direct avoidance of ponds containing fish (Binckley and Resetarits 2003). Hyla
chrysoscelis appear to directly assess larval habitat in two stages, one assessment of potential
productivity/desiccation risk, and one of predation risk. Our results provide evidence for habitat
selection behaviors and oviposition site preferences of adult anurans that match the performance
of larvae in those predator-free habitats. Adult H. chrysoscelis in our experiment oviposited in
new ponds, and larvae in previous studies performed better in new ponds than in old ponds
(Wilbur and Alford 1985). Ovipositing female frogs select habitats most beneficial to their
offspring to maximize fitness (Resetarits 1996), but these decisions can also affect population
growth rates, abundance and persistence of individual species, and the assembly of pond
communities. The strategic drying of ponds can be a useful tool for improving amphibian
breeding habitat quality and managing populations by both removing fish (Knapp et al. 2007)
and resetting the overall community structure, including in fishless ponds. Pond drying provides

32
optimal breeding habitat for amphibians that select not only fishless ponds but also those with
new water.

33
LIST OF REFERENCES

34
Alford, R.A., and H.M. Wilbur. 1985. Priority effects in experimental pond communities:
competition between Bufo and Rana. Ecology 66:1097–1105.
Almany, G.R. 2003. Priority effects in coral reef fish communities. Ecology 84:1920–1935.
Alve, E. 1999. Colonization of new habitats by benthic foraminifera: a review. Earth-Science
Reviews 46:167–185.
Binckley, C.A., and W.J. Resetarits, Jr. 2003. Functional equivalence of non-lethal effects:
generalized fish avoidance determines distribution of gray treefrog, Hyla chrysoscelis,
larvae. Oikos 102:623–629.
Binckley, C.A., and W.J. Resetarits, Jr. 2007. Effects of forest canopy on habitat selection in
treefrogs and aquatic insects: implications for communities and metacommunities.
Oecologia 153:951–958.
Binckley, C.A., and W.J. Resetarits, Jr. 2008. Oviposition behavior partitions aquatic landscapes
along predation and nutrient gradients. Behavioral Ecology 19:552–557.
Church, D.R. 2008. Role of current versus historical hydrology in amphibian species turnover
within local pond communities. Copeia 2008:115–125.
Cope, E.D. 1880. On the zoological position of Texas. Bulletin of the U.S. National Museum
17:1–51.
Duellman, W.D., and L. Trueb. 1986. Biology of Amphibians. McGraw Hill, New York.
Facelli, J.M., and E. Facelli. 1993. Interactions after death: plant litter controls priority effects in
a successional plant community. Oecologia 95:277–282.
Fegraus, E.H., and D.M. Marsh. 2000. Are newer ponds better? Pond chemistry, oviposition site
selection, and tadpole performance in the tungara frog, Physalaemus pustulosus. Journal
of Herpetology 34:455–459.
Fox, J., and S. Weisberg. 2011. An {R} Companion to Applied Regression, 2nd ed. Sage,
Thousand Oaks.
Fretwell, S.D., and H.L. Lucas. 1970. On territorial behavior and other factors influencing
habitat distribution in birds. Acta Biotheoretica 19:16–36.
Gripenberg, S., P.J. Mayhew, M. Parnell, and T. Roslin. 2010. A meta-analysis of preference-
performance relationships in phytophagous insects. Ecology Letters 13:383–393.
Jaenike, J. 1978. On optimal oviposition behavior in phytophagous insects. Theoretical
Population Biology 14:350–356.
Knapp, R.A., D.M. Boiano, and V.T. Vredenburg. 2007. Removal of nonnative fish results in
population expansion of a declining amphibian (mountain yellow-legged frog, Rana
muscosa). Biological Conservation 135:11–20.
Kokko, H. 1999. Competition for early arrival in migratory birds. Journal of Animal Ecology
68:940–950.
Kraus, J.M., and J.R. Vonesh. 2012. Fluxes of terrestrial and aquatic carbon by emergent
mosquitoes: a test of controls and implications for cross-ecosystem linkages. Oecologia
170:1111–1122.
Louette, G. and L. De Meester. 2005. High dispersal capacity of cladoceran zooplankton in
newly founded communities. Ecology 86:353–359.
Mayhew, P.J. 1997. Adaptive patterns of host-plant selection by phytophagous insects. Oikos
79:417–428.
Morin, P.J. 1990. Ecology and breeding phenology of larval Hyla andersonii: the disadvantages
of breeding late. Ecology 71:1590–1598.
Morris, D.W. 2003. Toward an ecological syntheis: a case for habitat selection. Oecologia

35
136:1–13.
Murphy, P.J. 2003. Does reproductive site choice in a neotropical frog mirror variable risks
facing offspring? Ecological Monographs 73:45–67.
National Oceanic and Atmospheric Administration. 2014. Daily Summaries Location Details:
Oxford, MS 38655. Available at http://www.ncdc.noaa.gov/cdo-
web/datasets/GHCND/locations/ZIP:38655/detail.
Pintar, M.R., and W.J. Resetarits, Jr. 2017a. Larval development varies across pond age and
larval density in Cope’s gray tree frog, Hyla chrysoscelis. Herpetologica 73: in press.
Pintar, M.R., and W.J. Resetarits, Jr. 2017b. Data for “Out with the old, in with the new:
oviposition preference matches larval success in Cope’s gray treefrog, Hyla
chrysoscelis.” Figshare. doi: 10.6084/m9.figshare.5306311
Pintar, M.R., and W.J. Resetarits, Jr. 2017c. Relative predation risk and risk of desiccation co-
determine oviposition preferences in Cope’s gray treefrog, Hyla chrysoscelis. Oecologia
184: 423–430.
R Core Team. 2015. R: A Language and Environment for Statistical Computing. R Foundation
for Statistical Computing, Vienna.
Resetarits, W.J. Jr., 1996. Oviposition site choice and life history evolution. American Zoologist
36:205–215.
Resetarits, W.J. Jr., and H.M. Wilbur. 1989. Choice of oviposition site by Hyla chrysoscelis: role
of predators and competitors. Ecology 70:220–228.
Rieger, J.F., C.A. Binckley, and W.J. Resetarits, Jr. 2004. Larval performance and oviposition
site preference along a predation gradient. Ecology 85:2094–2099.
Rudolf, V.H.W., and M.O. Rödel. 2005. Oviposition site selection in a complex and variable
environment: the role of habitat quality and conspecific cues. Oecologia 142:316–325.
Seale, D.B. 1980. Influence of amphibian larvae on primary production, nutrient flux, and
competition in a pond ecosystem. Ecology 61:1531–1550.
Shorrocks, B., and M. Bingley. 1994. Priority effects and species coexistence: experiments with
fungal-breeding Drosophila. Journal of Animal Ecology 63:799–806.
Spencer, M., and L. Blaustein. 2001. Hatching responses of temporary pool invertebrates to
signals of environmental quality. Israel Journal of Zoology 47:397–418.
Spencer, M., L. Blaustein, and J.E. Cohen. 2002. Oviposition habitat selection by mosquitoes
(Culiseta longiareolata) and consequences for population size. Ecology 83:669–679.
van der Voet, H., and A.H.P. Stumpel. 1998. Characterizing the suitability of new ponds for
amphibians. Amphibia-Reptilia 19:125–142.
Vos, C.C., and A.H.P. Stumpel. 1996. Comparison of habitat-isolation parameters in relation to
fragmented distribution patterns in the tree frog (Hyla arborea). Landscape Ecology
11:203–214.
Wassersug, R.J. 1975. The adaptive significance of the tadpole stage with comments on the
maintenance of complex life cycles in anurans. American Zoologist 15:405–417.
Wellborn, G.A., D.K. Skelly, and E.E. Werner. 1996. Mechanisms creating community structure
across a freshwater habitat gradient. Annual Review of Ecology and Systematics 27:337–
363.
Wilbur, H.M. 1980. Complex life cycles. Annual Review of Ecology and Systematics 11:67–93.
Wilbur, H.M. 1987. Regulation of structure in complex systems: experimental temporary pond
communities. Ecology 68:1437–1452.
Wilbur, H.M. 1997. Experimental ecology of food webs: complex systems in temporary ponds.

36
Ecology 78:2279–2302.
Wilbur, H.M., and R.A. Alford. 1985. Priority effects in experimental pond communities:
responses of Hyla to Bufo and Rana. Ecology 66:1106–1114.
Wilbur, H.M., and J.P. Collins. 1973. Ecological aspects of amphibian metamorphosis. Science
182:1305–1314.
Woodward, B.D. 1983. Predator-prey interactions and breeding-pond use of temporary-pond
species in a desert anuran community. Ecology 64:1549–1555.

37
CHAPTER 3:
RELATIVE PREDATION RISK AND RISK OF DESICCATION CO-DETERMINE
OVIPOSITION PREFERENCES IN COPE’S GRAY TREEFROG, HYLA CHRYSOSCELIS

38
ABSTRACT2
Habitat permanence and threat of predation are primary drivers of community assembly
and composition in lentic freshwater systems. Pond-breeding amphibians select oviposition sites
to maximize fitness and minimize risks of predation and desiccation of their offspring, typically
facing a tradeoff between the two as predation risk often increases as desiccation risk decreases.
In order to experimentally determine if Hyla chrysoscelis partition oviposition along gradients of
relative desiccation risk and predation risk, we tested oviposition site preference in a natural
population of treefrogs colonizing experimental ponds that varied in water depth and contained
predatory larvae of two Ambystoma salamander species. Hyla chrysoscelis selected habitats with
both lower predation risk, avoiding A. talpoideum over A. maculatum, and lower desiccation risk,
selecting ponds with three times greater depth. We demonstrate that adult oviposition site
choices simultaneously minimize relative predation risk and desiccation risk and that closely
related salamander species produce functionally different responses among colonizing animals.
2 A modified version of this chapter was published as this article:
Pintar, M.R., and W.J. Resetarits, Jr. 2017. Relative predation risk and risk of desiccation co-determine oviposition
preferences in Cope’s gray treefrog, Hyla chrysoscelis. Oecologia 184:423–430.

39
INTRODUCTION
Studies of multiple risk factors in ecology have tended to focus on multiple predators, in
contrast to risks derived from the interaction of biotic and abiotic factors (Sih et al. 1998;
Schmitz and Sokol-Hessner 2002; Grabowski et al. 2008; Touchon and Warkentin 2009).
Predators play critical roles in structuring communities, but the conditions that allow for the
persistence of predators can be driven by the abiotic environment (Paine 1966; Carpenter et al.
1985; Schneider and Frost 1996; Skelly 1996). Lethal and sublethal effects of the abiotic
environment, such as those of desiccation, fire, or pollutants, can equally affect both predators
and organisms at lower trophic levels (Menge and Sutherland 1987; Scott and Sloman 2004).
Although different species of predators may be equally affected by the abiotic environment, they
often produce functionally diverse effects on communities (DeWitt et al. 2000; Resetarits and
Chalcraft 2007; Schmitz 2009; Resetarits and Pintar 2016). This generates landscapes of habitat
patches that vary in risk due to the interaction between abiotic and biotic factors (Menge and
Sutherland 1987; Wellborn et al. 1996; Jackson et al. 2001), and colonizing organisms must
assess this risk when selecting habitat patches. How various sources of risk are perceived is a
window on the strength of selection exerted by multiple factors.
Pond permanence and predator presence are primary drivers of freshwater aquatic
community composition. Ponds exist on a hydroperiod gradient, and as hydroperiod increases
ponds are typically inhabited by more dominant predators (Wellborn et al. 1996). Differences in
aquatic communities were traditionally ascribed to varying strengths of lethal processes

40
(predation and desiccation), but habitat selection can play an equal or greater role in determining
community composition (Resetarits and Wilbur 1989; Skelly 1996; Resetarits and Binckley
2009; Kraus and Vonesh 2010). Predatory fish occupy most permanent ponds and play extremely
important roles at both colonization and post-colonization stages, both repelling colonizers and
shaping community structure through direct predation (Petranka et al. 1987; Resetarits and
Wilbur 1989). Thus, many other aquatic taxa have evolved to live in, and are more often found
in, temporary ponds. Even among temporary ponds, those with longer hydroperiods typically
have more and larger predators (Woodward 1983; Wellborn et al. 1996).
During oviposition, females select habitats for their offspring based on a variety of
abiotic and biotic site characteristics, such as predator or competitor presence, canopy cover,
patch size, or sediment depth (Resetarits and Wilbur 1989; Thompson and Pellmyr 1991; Rudolf
and Rödel 2005; McGuffin et al. 2006; Silberbush and Blaustein 2011; Bohenek et al. 2017).
Oviposition site selection is a strong determinant of reproductive success, as larvae cannot leave
their habitat patch before metamorphosis. Thus, it is imperative that adults make decisions that
minimize risk and maximize reward. However, selecting breeding sites based on their perceived
permanence (volume/depth), or other characteristics that often covary with permanence such as
conductivity, temperature, and dissolved oxygen, necessitates the ability to simultaneously assess
the relative predation risk (Saward-Arav et al. 2016). Because predation risk is typically
inversely correlated with desiccation risk, site selection based on one of these two factors may
place colonizing individuals at high risk due to variation in the second factor. Predation risk
varies greatly across aquatic taxa, from often very strong effects of fish, to more moderate effects
of larval salamanders, to the often low relative risk of some insects (Morin et al. 1988; Wilbur
1997).

41
Hyla chrysoscelis (Cope’s gray treefrog) selectively oviposits in ponds without predators
as well as newly filled ponds; the latter reduces desiccation risk, and offspring of early arrivers
gain advantages over later breeders (Wilbur and Alford 1985; Resetarits and Wilbur 1989; Pintar
and Resetarits 2017a,b). With metamorphosis often occurring in less than one month, H.
chrysoscelis is capable of surviving in short-lived temporary ponds. However, this can come at a
cost of smaller sizes at metamorphosis and shifting of growth between the aquatic and terrestrial
stages (Wilbur and Collins 1973). In the southeastern United States, H. chrysoscelis typically
breeds in fishless lentic habitats where the top predators are often larval salamanders, particularly
Ambystoma talpoideum (mole salamander) and/or A. maculatum (spotted salamander) (Petranka
1998). Ambystoma talpoideum pose a greater predation risk to larval treefrogs than do A.
maculatum as they grow to larger sizes and persist as larvae or paedomorphs in ponds for a year
or more, whereas A. maculatum metamorphose by mid-summer (Pintar and Resetarits 2017c). To
assess oviposition responses to perceived risk in different oviposition sites, we experimentally
examined effects of pond water depth and presence of larvae of these two predatory Ambystoma
salamanders on oviposition site preferences of a natural population of H. chrysoscelis.

42
MATERIALS AND METHODS
On 17 January 2015 we set up an array of experimental mesocosms (plastic cattle tanks:
diameter = 1.83 m, maximum depth = 0.61 m; N = 63) in a field UMFS, 25 m north and west of
nearby fish-containing ponds. This experiment was designed to assess the effects of flooding and
competitor addition on larval Ambystoma development. Thus, our primary goal in experimental
design was to achieve an optimal setup for development, hence our mesocosms were separated
by 0.5 m edge-to-edge and arranged in a quasi-rectangular array due to highly uneven ground. A
5 × 8 set of mesocosms formed the core of the array, with the remaining mesocosms set up on
the periphery, while maintaining equal spacing. This resulted in six spatial blocks (distance south
to north from a treeline), which we included in our initial analyses, but ultimately had no effect
on oviposition. The spatial design of our experiment was within the range of areas occupied by
similar experiments, which allows females to assess chemical cues from multiple mesocosms
prior to and during oviposition (Resetarits and Wilbur 1991; Binckley and Resetarits 2008).
Using pond water pumped through 1.3 mm mesh, we filled the mesocosms to a depth of
16 cm (~400 L); mesocosms were fitted with PVC standpipes to adjust water levels. On 19
January we randomly assigned and added 3 kg of dry hardwood leaf litter (primarily Platanus
occidentalis) to each mesocosm. Originally using a 2 × 2 × 2 factorial design, we randomly
assigned treatments of salamander species (A. maculatum, A. talpoideum) crossed with water
depth (16 cm = Low, 50 cm = Full) and the addition of competitors midway through the larval
stage (5 A. maculatum, no salamanders). On 28 January we added 15 larvae of either A.

43
maculatum or A. talpoideum to each mesocosm and allowed larvae to develop until 21 April
when mesocosms in the Full treatment were filled to a depth of 50 cm (~1200 L) with pond
water. The five additional A. maculatum competitors were added on 22 April, however these
competitors had no effect, so we eliminated this factor from additional analyses, resulting in a 2
× 2 factorial design. The A. talpoideum/Low treatment (TL) had 12 replicates, and all other
treatments had 17 replicates: A. maculatum/Full (MF), A. maculatum/Low (ML), A.
talpoideum/Full (TF). We checked all mesocosms daily, and once oviposition by H. chrysoscelis
began in mid-May, we collected eggs daily (early morning), counted them with photographs, and
placed all eggs into nearby fishless ponds.
Although predators were not caged, Ambystoma were unable to consume eggs prior to
counting, and consumption of H. chrysoscelis eggs by Ambystoma larvae has not been observed
by the authors. Ambystoma maculatum may be incapable of feeding on Ranidae eggs, whereas A.
talpoideum has minimal success (Anderson et al. 2013; Tumlison and Serviss 2013). The small
body size and low abundance of our larvae would make them incapable of consuming a small
number of the eggs in each tank, as the gelatinous H. chrysoscelis egg masses occupy volumes
that would greatly exceed the size of our larvae (Petranka 1998). Thus, while predation by
Ambystoma on Hyla eggs was possible, the likelihood of any meaningful consumption of H.
chrysoscelis eggs by Ambystoma was minimal.
The total number of eggs laid per mesocosm during the course of our experiment was our
response variable, and in our initial 2 × 2 × 2 analysis, we conducted ANOVA on square root
transformed mean total eggs using type III SS on factors of salamander species, addition of
competitors, water level, and block. In our reduced 2 × 2 analysis (without added competitors)
we examined the effects of salamander species, water level, and block in a similar ANOVA to

44
the initial analysis, along with effect size and post-hoc Tukey. To account for potential effects of
spillover from density-dependent oviposition if preferred breeding sites could not accommodate
all breeders on a given night, we used simple linear regression to compare the proportion of eggs
found in the preferred patch type to the total number of eggs laid on a night. On 12 May, the
closest date to the oviposition period for which we have data, we measured the conductivity,
oxygen, pH, and temperature of each mesocosm with a YSI 63/25 FT meter and dissolved
oxygen with a YSI 550 DO meter. We analyzed all water chemistry variables using ANOVAs
with water level and block as factors on log-transformed data (except pH). Temperature was
included as a covariate in the dissolved oxygen analysis. All analyses used α = 0.05, R v.3.3.1 (R
Core Team 2016), and the car package (Fox and Weisberg 2011), and block was rolled into the
error term when P > 0.20. Data are available in Figshare (Pintar and Resetarits 2017d).

45
RESULTS
Hyla chrysoscelis laid 59,213 eggs in our mesocosms on 18 nights from 16 May until 21
June with the number of eggs laid per night ranging from 1474–6377. The MF treatment
received 44,782 eggs (2634.2 ± 338.9, mean ± SE), ML 7965 (468.5 ± 161.2), TF 6348 (373.4 ±
116.2), and TL 118 (9.8 ± 9.8) (Figure 3.1). We estimate this represents the reproductive output
of around 45–65 females based on previous estimates of H. chrysoscelis clutch sizes and site-
specific observational data (Resetarits and Wilbur 1989; Resetarits 2005). The effects of predator
species and water depth were both significant, as was the interaction between them (Table 3.1).
The initial 2 × 2 × 2 design produced similar results, but the additional competitors had no effect
(Table 3.2, Figure 3.2). Block (distance south to north from a tree row) was not significant in
both analyses (P > 0.5), so it was rolled into the error term. In our reduced 2 × 2 design, species
and water depth had large, similar effect sizes. All but one of the pairwise comparisons (ML–TF)
were significantly different from each other (Table 3.1). Ambystoma maculatum metamorphosed
from 12 May until 12 July, with 95% of surviving individuals metamorphosing before 21 June,
the last day we collected eggs in this experiment. Ambystoma talpoideum began metamorphosing
on 2 June, but only eight metamorphs (3% of surviving individuals) emerged before 21 June.
However, oviposition patterns did not change over time as the number of remaining A.
maculatum larvae decreased in the mesocosms (r2 = 0.0042, P = 0.132). There was no
relationship between the proportion of eggs occurring in MF mesocosms and the total number of
eggs laid on a night (r2 = 0.0234, P = 0.253). In Low mesocosms, we observed significantly

46
higher conductivity and higher temperature, but no differences in pH, whereas DO significantly
covaried with temperature but was not independently affected by water level (Table 3.3).
Figure 3.1. Mean number of eggs per mesocosm (± SE) for each treatment in the 2 × 2 design
over the duration of the experiment (N = 63 mesocosms; 59,213 total eggs)
Table 3.1. ANOVA and Tukey results for the reduced 2 × 2 experimental design
ANOVA Tukey
df SS F P η2
η𝑃2 Comparison P
Species 1 9644.8 60.308 <0.0001 0.325 0.505 MF-ML <0.0001
Water depth 1 8832.4 55.228 <0.0001 0.298 0.483 MF-TF <0.0001
Species ×
Water depth
1 1726.9 10.798 0.0017 0.058 0.155 MF-TL <0.0001
Residuals 59 9435.6 0.318 ML-TF 0.9946
ML-TL 0.0186
TF-TL 0.0337

47
Table 3.2. ANOVA results for the original 2 × 2 × 2 experimental design
df SS F P
Species 1 281.9 39.774 <0.0001
Competitors 1 45.0 0.635 0.4288
Water depth 1 2387.5 33.685 <0.0001
Species × Water depth 1 1211.0 17.086 0.0001
Initial species × Competitors 1 9.9 0.140 0.7102
Water depth × Competitors 1 137.7 1.942 0.1690
Species × Competitors × Water depth 1 79.9 1.127 0.2930
Residuals 55 3898.3
Figure 3.2. Mean number of eggs per mesocosm (± SE) in each treatment in the original 2 × 2 ×
2 design over the duration of the experiment (N = 63 mesocosms; 59,213 total eggs)

48
Table 3.3. Water chemistry ANOVA results with means and standard errors of mesocosms in
Low and Full treatments as measured on 12 May. Mean pH was calculated by converting each
mesocosm’s pH to hydrogen ion concentrations, calculating the arithmetic average of all
mesocosms in each treatment, and converting back to pH
Low Full
df F P Mean SE Mean SE
Conductivity (μS/cm) 23.21 0.05 22.39 0.09
Block 5 1.569 0.1838
Water level 1 48.860 <0.0001
Residuals 56
DO (mg/L) 3.42 0.18 3.93 0.12
Temperature 1 6.000 0.0173
Water level 1 1.250 0.2681
Residuals 60
pH 6.36 0.05 6.41 0.04
Water level 1 0.4588 0.5007
Residuals 61
Temperature 34.49 0.97 29.24 0.52
Block 5 2.317 0.0554
Water level 1 32.788 <0.0001
Residuals 56

49
DISCUSSION
In natural systems, there is often a tradeoff between avoiding predators to reduce
predation risk and selecting habitats with greater permanence to reduce mortality due to drastic
environmental changes or energy expenditures in search of better habitats (Menge and
Sutherland 1987; Jackson et al. 2001). Our data show that H. chrysoscelis simultaneously assess
and select habitats to minimize risks of both desiccation and predation. The lowest risk habitat
(MF) was the preferred oviposition site and highest risk habitat (TL) almost completely avoided
(except for 118 eggs in one mesocosm on a single night). The equivalence of MF and TL
suggests that the difference in desiccation risk between Low and High mesocosms is similar to
the difference in predation risk between A. talpoideum and A. maculatum, which is supported by
the similar effect sizes. Nevertheless, A. maculatum is a predator of larval Hyla (Walters 1975),
and evidence shows that H. chrysoscelis has reduced oviposition in habitats containing A.
maculatum when predator-free controls are present (Resetarits and Wilbur 1989).
Studies of oviposition responses to predators typically include predator-free controls,
which are almost universally preferred, but the natural landscape may seldom provide that option
(Resetarits and Wilbur 1989; Blaustein et al. 2004; Vonesh et al. 2009; Resetarits and Binckley
2013). When given moderate to poor choices in oviposition sites, ovipositing mosquitoes not
constrained to mesocosms often choose to seek higher quality natural pools (Kiflawi et al. 2003;
Silberbush and Blaustein 2011), whereas ovipositing female Salamandra adjust their egg
production based on a breeding site’s volume (Segev et al. 2011). Given that there are often

50
diverse arrays of predators in natural systems and their occurrence can be related to variation in
habitat quality, it is important to understand how species respond independently to variation in
the specific identity of predators and variation in habitat quality. By creating a landscape without
predator-free controls we were able to force female H. chrysoscelis to reveal any preferences
with respect to the two species of Ambystoma. Unlike the aforementioned mosquito studies, there
were few, if any, better (e.g. fishless) options within ~500 m of our experimental array,
providing additional pressure on H. chrysoscelis to select among our mesocosms.
When presented with a landscape of oviposition sites that varied in both desiccation and
predation risk, H. chrysoscelis selected sites with lower risks of both desiccation and predation.
Our Full mesocosms (3x deeper than Low) represented a much lower desiccation risk than Low
mesocosms. Ponds as shallow as our Low mesocosms could dry in one to two months or less
during summer in our system, within the typical larval period of H. chrysoscelis (Altig and
McDiarmid 2015). It is important to note that none of our mesocosms ever actually dried, and
after final filling on 21 April, established water levels were maintained by rain throughout the
remainder of the oviposition period. The lack of relationship between the proportion of eggs laid
in MF patches and the total of number of eggs laid per night could be due to relatively low
activity levels with a maximum of 6377 eggs collected on a single night. This represents the
reproductive output of about six females, and there were 17 available MF patches on each night,
providing adequate space for breeding in the preferred patch type without interference from other
frogs. It is unlikely that reduced oviposition in Low mesocosms was due to a higher cue density
(number of individuals or biomass per volume) as detection/avoidance thresholds for H.
chrysoscelis are low and were well exceeded in all of our mesocosms (Rieger et al. 2004).
Furthermore, effects are not additive above this threshold, and we observed no difference

51
between our four treatment groups when considering those that received five additional
competitors.
Ambystoma talpoideum are facultatively paedomorphic and can persist in ponds for a
year or more, whereas A. maculatum are obligately metamorphic, and 95% of A. maculatum
metamorphosed in our system by the end of the experiment. Furthermore, A. talpoideum
typically grows faster and reaches larger larval sizes than does A. maculatum, and A. talpoideum
is competitively dominant over A. maculatum (Walls 1996; Petranka 1998). Thus, A. talpoideum
poses a greater predation threat to larval H. chrysoscelis both immediately, because of their
larger size, and in the long-term due to their longer larval period (Anderson et al. 2013).
Responses of ovipositing H. chrysoscelis to a diverse array of fish with a range of predatory
capabilities have produced functionally equivalent responses (Resetarits and Wilbur 1989;
Binckley and Resetarits 2003; Resetarits and Binckley 2013), whereas oviposition/colonization
by other taxa, including beetles and mosquitoes, have produced more diverse responses to
predators (Růžička 2001; Vonesh and Blaustein 2010; Resetarits and Pintar 2016). Interestingly,
our two Ambystoma species produced functionally unique responses among ovipositing H.
chrysoscelis, with much stronger avoidance of A. talpoideum. This may be explained by the
greater co-occurrence of H. chrysoscelis with Ambystoma in temporary ponds than with fish in
permanent ponds. Both Ambystoma and H. chrysoscelis are typically found in fishless ponds,
with H. chrysoscelis and some Ambystoma species exhibiting strong oviposition preferences for
sites without fish (Resetarits and Wilbur 1989; Kats and Sih 1992). Therefore, we would predict
stronger selection for species-specific responses by H. chrysoscelis to salamanders and other
predators common in temporary ponds, in contrast to nearly uniform responses to most fish
species.

52
Although hydroperiod is a strong correlate of fish presence in ponds, pond permanence
per se has a large, direct, non-lethal effect on community assembly that rivals predator identity.
Frogs selected habitats with greater perceived permanence, the same habitats in natural systems
that are more likely to support more dominant predators (Wellborn et al. 1996; Wilbur 1997).
Our data support the idea that colonizing organisms are directly and simultaneously assessing
patch quality based not only on predator cues, but on other patch characteristics (Binckley and
Resetarits 2003). Although we have limited water chemistry data, the relation of lower water
depth to higher conductivity and higher temperature would both be expected, as is the covariance
of DO with temperature. Other studies have observed preferential oviposition by H. chrysoscelis
in mesocosms with lower conductivity and higher dissolved oxygen (Pintar and Resetarits
2017b), so these characteristics could be used as indicators of patch quality, as they are for other
ovipositing organisms such as mosquitoes (Spencer and Blaustein 2001). Direct assessment of
multiple indicators of patch quality stands in contrast to using specific patch characteristics
(depth/volume) as indicators of potential long-term predation risk, allowing more refined
responses if more complex communities with stronger predators develop in more permanent
habitats (Saward-Arav et al. 2016). The functionally diverse responses of H. chrysoscelis to
Ambystoma and water depth provides further support for the idea that direct, non-lethal effects of
patch characteristics (predation/desiccation risk), mediated through habitat selection behaviors of
colonizing animals, are major determinants of community structure in freshwater systems.
Females from an array of taxa, including frogs (Resetarits and Wilbur 1989; Touchon and
Warkentin 2008), mosquitoes (Vonesh and Blaustein 2010; Silberbush and Blaustein 2011),
beetles (Messina et al. 1992; Resetarits 2001), damselflies (McGuffin et al. 2006), and butterflies
(Thompson and Pellmyr 1991) make oviposition decisions in complex environments. These

53
oviposition decisions have both differential fitness consequences through varying offspring
mortality and performance (Jaenike 1978; Rieger et al. 2004; Gripenberg et al. 2010) and form
an important component of the myriad of factors driving patterns of species distributions, species
abundances, and community composition (Blaustein et al. 1995; Wellborn et al. 1996). The
ability to assess habitat quality across multiple gradients not only helps to maximize fitness, but
may also affect the persistence of species as environmental change alters habitats across similar
gradients through shifts in species distributions or changes in habitat duration from shifting
precipitation (Martin 2001; Both et al. 2006).

54
LIST OF REFERENCES

55
Altig, R., and R.W. McDiarmid. 2015. Handbook of Larval Amphibians of the United States and
Canada. Cornell University Press, Ithaca
Anderson, T.L., C.L. Mott, T.D. Levine, and H.H. Whiteman. 2013. Life cycle complexity
influences intraguild predation and cannibalism in pond communities. Copeia 2013:284–
291.
Binckley, C.A., and W.J. Resetarits, Jr. 2008. Oviposition behavior partitions aquatic landscapes
along predation and nutrient gradients. Behavioral Ecology 19:552–557.
Binckley, C.A., and W.J. Resetarits, Jr. 2003. Functional equivalence of non-lethal effects:
generalized fish avoidance determines distribution of gray treefrog, Hyla chrysoscelis,
larvae. Oikos 102:623–629.
Blaustein, L., M. Kiflawi, A. Eitam, M. Mangel, and J.E. Cohen. 2004. Oviposition habitat
selection in response to risk of predation in temporary pools: Mode of detection and
consistency across experimental venue. Oecologia 138:300–305.
Blaustein, L., B.P. Kotler, and D. Ward. 1995. Direct and indirect effects of a predatory
backswimmer (Notonecta maculata) on community structure of desert temporary pools.
Ecological Entomology 20:311–318.
Bohenek, J.R., M.R. Pintar, T.M. Breech, and W.J. Resetarits, Jr. 2017. Patch size influences
perceived patch quality for colonising Culex mosquitoes. Freshwater Biology 62: 1614–
1622.
Both, C., S. Bouwhuis, C.M. Lessells, and M.E. Visser. 2006. Climate change and population
declines in a long-distance migratory bird. Nature 441:81–83.
Carpenter, S.R., J.F. Kitchell, and J.R. Hodgson. 1985. Cascading trophic interactions and lake
productivity. Bioscience 35:634–639.
DeWitt, T.J., B.W. Robinson, and D.S. Wilson. 2000. Functional diversity among predators of a
freshwater snail imposes an adaptive trade-off for shell morphology. Evolutionary
Ecology Research 2:129–148.
Fox, J., and S. Weisberg. 2011. An {R} Companion to Applied Regression, 2nd ed. Sage,
Thousand Oaks.
Grabowski, J.H., A.R. Hughes, and D.L. Kimbro. 2008 Habitat complexity influences cascading
effects of multiple predators. Ecology 89:3413–3422.
Gripenberg, S., P.J. Mayhew, M. Parnell, and T. Roslin. 2010. A meta-analysis of preference-
performance relationships in phytophagous insects. Ecology Letters 13:383–393.
Jackson, D.A., P.R. Peres-Neto, and J.D. Olden. 2001. What controls who is where in freshwater
fish communities –– the roles of biotic, abiotic, and spatial factors. Canadian Journal of
Fisheries and Aquatic Sciences 58:157–170.
Jaenike, J. 1978. On optimal oviposition behavior in phytophagous insects. Theoretical
Population Biology 14:350–356.
Kats, L.B., and A. Sih. 1992. Oviposition site selection and avoidance of fish by streamside
salamanders (Ambystoma barbouri). Copeia 1992:468–473.
Kiflawi, M., L. Blaustein, and M. Mangel. 2003. Oviposition habitat selection by the mosquito
Culiseta longiareolata in response to risk of predation and conspecific larval density.
Ecological Entomology 28:168–173.
Kraus, J.M., and J.R. Vonesh. 2010. Feedbacks between community assembly and habitat
selection shape variation in local colonization. Journal of Animal Ecology 79:795–802.
Martin, T.E. 2001. Abiotic vs. biotic influences on habitat selection of coexisting species:
climate change impacts? Ecology 82:175–188.

56
McGuffin, M.A., R.L. Baker, and M.R. Forbes. 2006. Detection and avoidance of fish predators
by adult Enallagma damselflies. Journal of Insect Behavior 19:77–91.
Menge, B.A., and J.P. Sutherland. 1987. Community regulation: variation in disturbance,
competition, and predation in relation to environmental stress and recruitment. The
American Naturalist 130:730–757.
Messina, F.J., Kemp, J.L., and J.A. Dickinson. 1992. Plasticity in the egg-spacing behavior of a
seed beetle: effects of host deprivation and seed patchiness (Coleoptera: Bruchidae).
Journal of Insect Behavior 5:609–621.
Morin, P.J., S.P. Lawler, and E.A. Johnson. 1988. Competition between aquatic insects and
vertebrates: interaction strength and higher order interactions. Ecology 69:1401–1409.
Paine, R.T. 1966. Food web complexity and species diversity. The American Naturalist 100:65–
75.
Petranka, J.W. 1998. Salamanders of the United States and Canada. Smithsonian Institution
Press, Washington, DC
Petranka, J.W., L.B. Kats, and A. Sih. 1987. Predator-prey interactions among fish and larval
amphibians: use of chemical cues to detect predatory fish. Animal Behaviour 35:420–
425.
Pintar, M.R., and W.J. Resetarits, Jr. 2017a. Larval development varies across pond age and
larval density in Cope’s gray tree frog, Hyla chrysoscelis. Herpetologica 73: in press.
Pintar, M.R., and W.J. Resetarits, Jr. 2017b. Out with the old, in with the new: oviposition
preference matches larval success in Cope’s gray treefrog, Hyla chrysoscelis. Journal of
Herpetology 51:186–189.
Pintar, M.R., and W.J. Resetarits, Jr. 2017c. Persistence of an egg mass polymorphism in
Ambystoma maculatum: differential performance under high and low nutrients. Ecology
98: 1349–1360.
Pintar, M.R., and W.J. Resetarits, Jr. 2017d. Data for “Relative predation risk and risk of
desiccation co-determine oviposition preferences in Cope’s gray treefrog, Hyla
chrysoscelis”. Figshare. doi: 10.6083/m9.figshare.4887020
R Core Team. 2016. R: A Language and Environment for Statistical Computing. R Foundation
For Statistical Computing, Vienna.
Resetarits, W.J. Jr. 2001. Colonization under threat of predation: avoidance of fish by an aquatic
beetle, Tropisternus lateralis (Coleoptera: Hydrophilidae). Oecologia 129:155–160.
Resetarits, W.J. Jr. 2005. Habitat selection behaviour links local and regional scales in aquatic
systems. Ecology Letters 8:480–486.
Resetarits, W.J. Jr., and C.A. Binckley. 2009. Spatial contagion of predation risk affects
colonization dynamics in experimental aquatic landscapes. Ecology 90:869–876.
Resetarits, W.J. Jr., and C.A. Binckley. 2013. Is the pirate really a ghost? Evidence for
generalized chemical camouflage in an aquatic predator, pirate perch Aphredoderus
sayanus. The American Naturalist 181:690–699.
Resetarits, W.J. Jr., and D.R. Chalcraft. 2007. Functional diversity within a morphologically
conservative genus of predators: implications for functional equivalence and redundancy
in ecological communities. Functional Ecology 21:793–804.
Resetarits, W.J. Jr., and M.R. Pintar. 2016. Functional diversity of non-lethal effects, chemical
camouflage, and variation in fish avoidance in colonizing beetles. Ecology 97:3517–
3529.
Resetarits, W.J. Jr., and H.M. Wilbur. 1989. Choice of oviposition site by Hyla chrysoscelis: role

57
of predators and competitors. Ecology 70:220–228.
Resetarits, W.J. Jr., and H.M. Wilbur. 1991. Calling site choice by Hyla chrysoscelis: effect of
predators, competitors, and oviposition sites. Ecology 72:778–786.
Rieger, J.F., C.A. Binckley, and W.J. Resetarits, Jr. 2004. Larval performance and oviposition
site preference along a predation gradient. Ecology 85:2094–2099.
Rudolf, V.H.W., and M.-O. Rödel. 2005. Oviposition site selection in a complex and variable
environment: the role of habitat quality and conspecific cues. Oecologia 142:316–325.
Růžička, Z. 2001. Oviposition responses of aphidophagous coccinellids to tracks of ladybird
(Coleoptera: Coccinellidae) and lacewing (Neuroptera: Chrysopidae) larvae. European
Journal of Entomology 98:183–188.
Saward-Arav, D., A. Sadeh, M. Mangel, A.R. Templeton, and L. Blaustein. 2016. Oviposition
responses of two mosquito species to pool size and predator presence: varying trade-offs
between desiccation and predation risks. Israel Journal of Ecology and Evolution 62:143–
148.
Schmitz, O.J. 2009. Effects of predator functional diversity on grassland ecosystem function.
Ecology 90:2339–2345.
Schmitz, O.J., and L. Sokol-Hessner. 2002. Linearity in the aggregate effects of multiple
predators in a food web. Ecology Letters 5:168–172.
Schneider, D.W., and T.M Frost. 1996. Habitat duration and community structure in temporary
ponds. Journal of the North American Benthological Society 15:64–86.
Scott, G.R., and K.A. Sloman. 2004. The effects of environmental pollutants on complex fish
behaviour: Integrating behavioural and physiological indicators of toxicity. Aquatic
Toxicology 68:369–392.
Segev, O., M. Mangel, N. Wolf, A. Sadeh, A. Kershenbaum, and L. Blaustein. 2011.
Spatiotemporal reproductive strategies in the fire salamander: A model and empirical test.
Behavioral Ecology 22:670–678.
Sih, A., G. Englund, and D. Wooster. 1998. Emergent impacts of multiple predators on prey.
Trends in Ecology and Evolution 13:350–355.
Silberbush, A., and L. Blaustein. 2011. Mosquito females quantify risk of predation to their
progeny when selecting an oviposition site. Functional Ecology 25:1091–1095.
Skelly, D.K. 1996. Pond drying, predators, and the distribution of Pseudacris tadpoles. Copeia
3:599–605.
Spencer, M., and L. Blaustein. 2001. Hatching responses of temporary pool invertebrates to
signals of environmental quality. Israel Journal of Zoology 47:397–418.
Thompson, J.N., and O. Pellmyr. 1991. Evolution of oviposition behavoir and host preference in
Lepidoptera. Annual Review of Entomology 36:65–89.
Touchon, J.C., and K.M. Warkentin. 2008. Reproductive mode plasticity: aquatic and terrestrial
oviposition in a treefrog. PNAS 105:7495–7499.
Touchon, J.C., and K.M. Warkentin. 2009. Negative synergism of rainfall patterns and predators
affects frog egg survival. Journal of Animal Ecology 78:715–723.
Tumlison, R., and B. Serviss. 2013. Novel food habits of branchiate mole salamanders
(Ambystoma talpoideum) from southwestern Arkansas. Southeastern Naturalist 12:579–
588.
Vonesh, J.R., and L. Blaustein. 2010. Predator-induced shifts in mosquito oviposition site
selection: a meta-analysis and implications for vector control. Israel Journal of Ecology
and Evolution 56:263–279.

58
Vonesh, J.R., J.M. Kraus, J.S. Rosenberg, and J.M. Chase. 2009. Predator effects on aquatic
community assembly: disentangling the roles of habitat selection and post-colonization
processes. Oikos 118:1219–1229.
Walls, S.C. 1996. Differences in foraging behaviour explain interspecific growth inhibition in
competing salamanders. Animal Behaviour 52:1157–1162.
Walters, B. 1975. Studies of interspecific predation within an amphibian community. Journal of
Herpetology 9:267–279.
Wellborn, G.A., D.K. Skelly, and E.E. Werner. 1996. Mechanisms creating community structure
across a freshwater habitat gradient. Annual Review of Ecology and Systematics 27:337–
363.
Wilbur, H.M. 1997. Experimental ecology of food webs: complex systems in temporary ponds.
Ecology 78:2279–2302.
Wilbur, H.M., and R.A. Alford. 1985. Priority effects in experimental pond communities:
responses of Hyla to Bufo and Rana. Ecology 66:1106–1114.
Wilbur, H.M., and J.P Collins. 1973. Ecological aspects of amphibian metamorphosis. Science
182:1305–1314.
Woodward, B.D. 1983. Predator-prey interactions and breeding-pond use of temporary-pond
species in a desert anuran community. Ecology 64:1549–1555.
59
CHAPTER 4:
TREE LEAF LITTER COMPOSITION DRIVES TEMPORAL VARIATION IN AQUATIC
BEETLE COLONIZATION AND ASSEMBLAGE STRUCTURE IN LENTIC SYSTEMS

60
ABSTRACT3
Tree leaf litter inputs to freshwater systems are a major resource and primary drivers of
ecosystem processes and structure. Spatial variation in tree species distributions and forest
composition control litter inputs across landscapes, but inputs to individual lentic habitat patches
are determined by adjacent plant communities. In small, ephemeral, fishless ponds, resource
quality and abundance can be the most important factor affecting habitat selection preferences of
colonizing animals. We used a landscape of experimental mesocosms to assess how natural
populations of aquatic beetles respond over time to variation in tree leaf litter input composition
(pine or hardwood). Patches with faster-decomposing hardwood leaf litter were initially
colonized at higher rates than slower-decomposing pine pools by most species of Hydrophilidae,
but this pattern reversed later in the experiment with higher colonization of pine pools by
hydrophilids. Colonization did not differ between pine and hardwood for dytiscids and the small
hydrophilid Paracymus, but there were distinct beetle assemblages between pine and hardwood
patches both early and late in the experiment. Our data support the importance of patch quality
and habitat selection as determinants of species abundances, richness, and community structure
in freshwater aquatic systems, not only when new habitat patches are formed and initial
conditions set, but as patches change due to interactions of processes such as decomposition with
time.
3 A modified version of this chapter was published as this article:
Pintar, M.R., and W.J. Resetarits, Jr. 2017. Tree leaf litter composition drives temporal variation in aquatic beetle
colonization and assemblage structure in lentic systems. Oecologia 183:797–807.

61
INTRODUCTION
Ecosystem structure and function are strongly influenced by resource inputs, the
assimilation, processing, and transfer of resources, and the interactions among organisms in food
webs (Polis et al. 1997; Marcarelli et al. 2011; Stoler and Relyea 2013). Allochthonous inputs of
organic matter derived primarily from plant litter drive ecosystem processes and productivity in
nutrient-limited freshwater systems (Minshall 1967; Polis et al. 1997; Stoler et al. 2016). These
inputs are important resources for invertebrates and other aquatic taxa (Anderson and Sedell
1979) and provide energy and nutrients not only directly to scavengers and decomposers, but
also indirectly to herbivores and predators by stimulating primary and secondary productivity
(Wilbur 1997; Williams 2005). Total dissolved organic carbon in streams can originate nearly
exclusively (99%) from tree litter (Fisher and Likens 1973), supporting higher levels of
productivity than autochthonous resources can provide alone (Polis et al. 1997). Although leaf
litter inputs are also important carbon sources in lentic systems (Rubbo et al. 2006; Rubbo et al.
2008; Stoler and Relyea 2011), work has focused primarily on lotic systems (Fisher and Likens
1973; Wallace et al. 1997; Meyer et al. 1998). Spatial subsidies, in both lotic and lentic systems,
provide links between habitats, maintain ecosystem function, act as ecosystem services, and
support the open nature of many systems (Polis et al. 1997; Loreau and Holt 2004; Earl and
Semlitsch 2013).
Interspecific differences among plants in the composition of their primary (involved in
growth and development) and secondary compounds (not direct contributors to metabolism), and

62
the chemical composition of living and senesced foliage, results in variation in rates of
decomposition, herbivory, and flow of energy from plant matter through food webs (Webster and
Benfield 1986; Facelli and Pickett 1991; Scott and Binkley 1997). Variation in litter quality can
manifest itself via a variety of characteristics, including nutrient and lignin content, breakdown
rate, structural complexity, and leeched secondary compounds, among others (Melillo et al.
1982; Ostrofsky 1997; Swan and Palmer 2006). Among woody plant inputs to aquatic systems,
Pinaceae often have slower breakdown rates and Tiliaceae, Magnoliaceae, and Cornaceae faster,
whereas other families have intermediate rates, although breakdown rates are often context-
dependent (Webster and Benfield 1986). Chemical characteristics of leaf litter can drive
microbial activity, both promoting and inhibiting microbial growth, influence physical
breakdown of leaf litter and assimilation of litter-derived resources, and inhibit the detection of
prey chemical cues (Rubbo and Kiesecker 2004; Maerz et al. 2005; Williams et al. 2008).
Effects of litter composition can be context-dependent, for example, driving differences
in species richness in open canopy locations, but not under forest canopy (Deans and Chalcraft
2017). Although associations between litter quality/quantity and species richness of colonizing
animals have been observed in lentic (Kok and Vanderveld 1994; Yanoviak 1999; Reiskind et al.
2009; Stoler and Relyea 2011) and lotic systems (Short et al. 1980; Richardson et al. 2004;
Egglishaw 2011), other studies in both systems have shown little or no association (Batzer and
Wissinger 1996; LeRoy and Marks 2006; Earl and Semlitsch 2013). Furthermore, studies of the
effects of litter composition on colonization and structure of aquatic communities have typically
focused on snapshots in time in natural communities or endpoints in experiments, with little
consideration of temporal variation and the interaction of litter composition with time. Therefore,
understanding the full effects of litter composition on aquatic community structure requires

63
assessment of both a greater range of conditions and over time, with more consideration for
short-term changes in community responses to the temporal dynamics of litter breakdown.
Given differences in community composition and individual performance in habitats with
varying composition of litter inputs, colonizing animals would be expected to exhibit habitat
selection preferences that match their performance (expected fitness) (Resetarits 1996; Vonesh et
al. 2009; Pintar and Resetarits 2017a). In habitat selection theory, patch-specific colonization
rates are driven largely by patch quality (Fretwell and Lucas 1970). Variation in composition of
litter inputs creates discrete spatial variation in habitat quality in lotic systems because of the
closed nature of these systems. Litter composition therefore generates, along with myriad other
factors (predator presence, pond area and depth, community composition, etc.), landscapes that
are mosaics of habitat patches varying in quality. Habitat selection, a behavioral process, co-
determines patterns of local species abundance and diversity along with post-colonization
processes (predation, competition), and effects of pre-colonization habitat selection can exceed
those of post-colonization sorting (Binckley and Resetarits 2005; Resetarits and Binckley 2009;
Vonesh et al. 2009). Understanding the roles of habitat selection and habitat quality in dispersal,
and in population and metacommunity dynamics, has increased in importance in ecology and
conservation biology in the context of both local and global environmental changes, particularly
habitat alteration and climate change (Mortelliti et al. 2010; Doerr et al. 2011).
A useful study system for understanding population and metacommunity dynamics are
aquatic beetles, which can form diverse assemblages that dominate in freshwater habitats that are
typically small, ephemeral, fishless, and depend on colonization by organisms from other
habitats (Jeffries 1994; Schneider and Frost 1996; Fairchild et al. 2000, 2003). These taxa,
predominantly those in the families Dytiscidae (predaceous adults, predaceous larvae) and

64
Hydrophilidae (omnivorous adults, predaceous larvae), play important ecological roles in
freshwater aquatic communities, and adults select habitats both for themselves and their
offspring (Layton and Voshell 1991). In order to determine how habitat selection of dispersing
beetles is influenced by leaf litter composition as ponds age, we examined the effects of leaf
litter composition on the dynamics of colonization and the assemblage structure of natural
populations of aquatic beetles. We conducted a field experiment using mesocosms with two
types of leaf litter (hardwood and pine) and collected colonizing beetles. We hypothesized that
colonization by beetles would initially be higher in pools with hardwood leaf litter compared to
pools with pine leaf litter due to faster breakdown of hardwood litter than pine litter, but that
these differences would disappear over time.

65
MATERIALS AND METHODS
On 6 June 2014 we set up a 4 × 8 rectangular array of experimental mesocosms (plastic
wading pools: 1 m diameter, 0.2 m deep, 110 L, N = 32) in a dry pond basin with open canopy at
UMFS. The study site was situated at the intersection of bottomland hardwood forest, mixed
upland forest, and adjacent wetlands. Pools were filled with water from a nearby spring-fed
stream and covered with window screening (1.3 mm2, 1.13 mm opening) that was depressed
below the water surface to separate all but the smallest colonizing beetles (Paracymus and
Uvarus) from leaf litter. Two treatments (16 replicates each, N = 32), 0.5 kg dry hardwood leaf
litter (primarily Fagus grandifolia and Quercus spp. with Acer rubrum) or 0.5 kg dry pine leaf
litter (Pinus taeda), were alternated between pools so no pools of the same treatment were
adjacent (0.5 m apart at edge). Treatments represent commonly occurring leaf litter assemblages
at UMFS. Pinus taeda often occurs in monotypic stands whereas F. grandifolia and Quercus
spp. co-dominate hardwood stands in the uplands down to pond edges in the valleys. Acer
rubrum occurs with F. grandifolia and Quercus spp. in the transition between bottomland and
upland forest.
There are 115 known species of aquatic beetles at UMFS representing eight families, and
94 of these species have been observed colonizing experimental mesocosms. Beginning on 9
June, we collected all adult beetles without replacement weekly with fine mesh nets by removing
all colonizing beetles from above the screens (collection dates: 9, 16, 24 June and 1, 8, 15, 22, 29
July), and the experiment was terminated on 29 July. All beetles were preserved in ethanol and

66
identified to species. Due to small size (~2 mm total length) and abundance, not all Paracymus
were identified to species. Most Paracymus identified from UMFS have been P. subcupreus,
with some P. confusus and P. nanus.
We analyzed the effect of treatment over time and block (row = distance from north to
south) on total beetle abundance, beetle species richness, and abundances of Dytiscidae,
Hydrophilidae, and species with total abundances greater than 100 individuals in the experiment,
using separate repeated-measures ANOVAs. For PERMANOVA, SIMPER, and NMDS analyses
we used groups of sampling dates because we exhaustively sampled all of our pools on a weekly
basis without replacement, and there was a lot of temporal variability in dispersal of natural
beetle populations. We combined the data from weeks 1 and 2 (samples from 9 and 16 June) into
one aggregate “Early” sample and weeks 7 and 8 (22 and 29 July) into one aggregate “Late”
sample. To test for differences in assemblage structure, we used PERMANOVA set to 999
permutations to analyze the differences in total beetle, Dytiscidae, and Hydrophilidae
assemblages between treatments within each of these two aggregate samples. We also compared
the total beetle, Dytiscidae, and Hydrophilidae assemblages between these two aggregate
samples using repeated-measures PERMANOVAs with factors of treatment crossed with time,
plus pool nested within treatment. PERMANOVA results were visualized with non-metric
multidimensional scaling (NMDS). We used SIMPER to determine which species contributed
the most to the differences between treatments within Early and Late samples and highlight
differences between treatments in SIMPER results using separate univariate ANOVAs on each
species in these groups. All analyses used α = 0.05 on square root transformed data, and block
was excluded from PERMANOVA analyses when P > 0.25. PRIMER 7 and the
PERMANOVA+ add-on (Anderson et al. 2015; Clarke and Gorley 2015) were used to conduct

67
PERMANOVAs and SIMPER using the Bray-Curtis Index and to construct NMDS plots; all
other analyses were conducted in R v. 3.2.2 (R Core Team 2015). Data are available in Figshare
(Pintar and Resetarits 2017b).

68
RESULTS
We collected a total of 3362 beetles from 38 species in 5 families on 7 sampling dates
(Table 4.14). Due to an error, on 15 July we have data for only 9 of 32 pools (3 hardwood, 6 pine,
233 beetles), so we did not include this date in our analyses or Table 4.1, but kept it in Figs. 4.1–
4.3. As expected, we observed significant main effects of time in all but one of the analyses
(Hydrophilidae repeated-measures PERMANOVA), representing temporal variation in beetle
dispersal from natural populations across the landscape. In the univariate repeated-measures
ANOVAs there were significant time × treatment interactions for total beetle abundance, species
richness, and the five most abundant hydrophilid species (Table 4.2, Figs. 4.1, 4.2). Hydrophilids
preferentially colonized hardwood pools early in the experiment and pine pools late. This
interaction was not significant for Paracymus (Fig. 4.2e), Berosus peregrinus (Fig. 4.2f), or any
dytiscids (Fig. 4.3). There were no significant main effects of treatment in the repeated-measures
ANOVAs.
In the repeated-measures PERMANOVAs there were significant time × treatment
interactions for combined counts of all beetle species (N = 1734, 36 species), as well as counts of
hydrophilid species (N = 1315, 16 species), but not dytiscids (N = 409, 17 species) when we
compared Early versus Late samples (Table 4.3, Fig. 4.4). Individual PERMANOVAs on Early
and Late samples had significant effects of treatment for all beetle species (Early: N = 1029, 31
species; Late: N = 705, 25 species) and hydrophilids (Early: N = 655, 14 species; Late: N = 660,
15 species) (Table 4.3). The effect of treatment was not significant for Dytiscidae in the Late
4 All tables and figures in this chapter appear in Appendix A at the end of the chapter.
69
samples, but was significant for Early samples. The significance of the Early Dytiscidae
PERMANOVA was likely due to the very low number of dytiscids (N = 44, 9 species) during
the first two weeks compared to the last two weeks (N = 365, 14 species), and four of the nine
species in the Early samples were singletons. These singletons contributed to the occurrence of
three outliers in the NMDS plots, which we excluded in Fig. 4. SIMPER results show that the
dissimilarities between hardwood and pine pools were dominated by hydrophilids with abundant
species predictably contributing more to the assemblage dissimilarity between treatments (Table
4.4). Abundant dytiscids also contributed to the dissimilarity between treatments, even though
means of these species were similar between treatments in Late samples, though this is likely a
statistical artefact (Warton et al. 2012).

70
DISCUSSION
A primary goal of ecology is to understand the mechanisms responsible for generating
species distributions and maintaining biodiversity (Chesson 2000). Studies of habitat selection
behavior have contributed greatly to this by identifying biotic and abiotic characteristics of
habitat patches that drive patterns of colonization (Resetarits and Wilbur 1989; Kraus and
Vonesh 2010). Furthermore, linkages between terrestrial and aquatic systems are important
determinants of aquatic patch quality and ecosystem structure (Polis et al. 1997; Stoler et al.
2016). Here we observed that leaf litter composition drove differences in aquatic beetle
colonization and assemblage structure. Pools containing hardwood litter were initially colonized
at higher rates and had higher species richness over the first three weeks of the experiment than
pine pools, but these differences reversed over the last three weeks of the experiment, with
higher colonization and richness in pine pools. These differences in colonization were driven by
the scavenging hydrophilids, but not the dytiscids, emphasizing that taxa, and often species-
specific colonization, are critical determinants of community structure.
While hydrophilids as a family were largely responsible for generating differences in
overall colonization between hardwood and pine pools both early and late in the experiment,
colonization patterns were not uniform across all species in the family. The four most abundant
species in that family, two Berosus species (B. infuscatus and B. striatus) and two Tropisternus
species (T. collaris and T. lateralis), were largely responsible for the overall colonization pattern
with greater colonization of hardwood early in the experiment and pine late. Of the six most

71
abundant hydrophilids, only Paracymus did not exhibit any suggestion of significant time ×
treatment interaction. Paracymus also preferentially colonized hardwood pools across the
entirety of the experiment, although the variance on most sampling dates is relatively high (Fig.
4.2e). The subfamily Hydrobiinae , includes Paracymus, along with Cymbiodyta, Enochrus, and
Helochares, but abundances of the five species in these other genera were too low to analyze
individually or cumulatively (Table 4.1; N = 52) to determine whether lack of response in
Paracymus is genus-specific or present elsewhere in the subfamily. However, in other habitat
selection studies, Paracymus often exhibits colonization behaviors different from other
hydrophilids, often aligning more with the responses of dytiscids, and reasons for these
differences requires further study (Resetarits and Pintar 2016).
Although we observed inter-generic differences in colonization among the hydrophilids,
colonization was consistent across the four most abundant dytiscid species (in three genera). In
contrast to most hydrophilids, for which leaf litter drove colonization over time, there were no
significant differences between treatments at any point in the experiment for total dytiscid
abundance or the four most common species (Fig. 4.3). Adult dytiscids (predaceous diving
beetles) are predators, whereas adult hydrophilids (water scavenger beetles) are omnivores.
Differential decomposition between pine and hardwood leaf litter can drive resources that are
responsive over shorter timescales (periphyton, algae, fungi, biofilms), which would be used by
hydrophilids. Conversely, dytiscids feed on organisms dependent on dispersal from surrounding
habitats or resting stages (zooplankton and larval insects), which react in a delayed manner to
increases in primary productivity (Batzer and Wissinger 1996).
By driving differential colonization of hydrophilids, leaf litter composition resulted in
distinct beetle assemblages in pine and hardwood pools both Early and Late in the experiment.
72
Assemblages were most distinct temporally, but significant differences existed between litter
treatments among the total beetle and hydrophilid assemblages in both Early and Late samples,
as visualized by the spatial differences among clusters in the NMDS plots (Fig. 4.4). Although
there were significant assemblage differences between treatments, there was still considerable
overlap of treatment clusters. This stands in contrast to the more distinct assemblages generated
by fish presence and fish species identity (Resetarits and Pintar 2016), which pose a much
stronger and immediate threat to the fitness of colonizing beetles than does differential resource
quality or abundance. Nevertheless, in small, ephemeral, fishless habitats it is not surprising that
resource quality can drive assemblage structure. Early arrival at recently formed habitat patches
allows colonizing animals to maximize fitness by obtaining more resources and avoiding
predators and competitors. These priority effects can shape future community structure (Alford
and Wilbur 1985), but this may further interact with variation in litter characteristics and the
quality of the resource base over time.
Over the eight-week duration of our experiment, colonization of hardwood pools
exhibited less inter-week variation in total beetle abundance, hydrophilid abundance, and species
richness than pine pools. This suggests that the multi-species leaf litter assemblage in hardwood
pools provided a more stable resource base than the single species in pine pools over these eight
weeks. Multi-species litter assemblages would be expected to provide a more temporally-stable
resource base than a single litter species (Swan and Palmer 2006), but diversity of litter species is
unlikely to be the only determinant of this lower variability. Species with faster litter
decomposition rates are quickly available to consumers, but remain available for a limited time,
whereas those with slower decomposition rates have delayed availability but remain available
longer. The lower inter-week variability in hardwood pools could be partially attributed to

73
overall higher nutrient concentrations in hardwood leaf litter. However, due to interactions of
chemical compounds in different species of leaves, mixtures of litter species can decrease
primary productivity relative to a single species, such as decreased productivity in a maple-oak
mixture relative to oak alone (Rubbo and Kiesecker 2004; Stoler and Relyea 2011). A mixture of
pine and hardwood litter might be expected to generate more temporally consistent colonization
at rates intermediate between pools of a single litter type, but potential interactions between
different litter types may generate patterns different from those expected. Longer term data
would be necessary to determine if, and at what point, both treatments would be perceived as
equivalent quality to colonizing animals. Habitat selection behaviors are nonetheless critical to
determining colonization patterns over the short timescales used in our experiment.
The ability to assess habitat quality during colonization enables organisms to select
habitats with the highest expected fitness. For aquatic beetles in particular, this behavioral
response to patch quality is a critical decision given the energetic costs of dispersal and potential
fitness consequences of selecting poor quality patches, since adults select habitats both for
themselves and their offspring (Zera and Denno 1997; Binckley and Resetarits 2008). The
variation in habitat selection preferences among the Hydrophilidae across the relatively short
duration of our experiment suggest they are selecting habitats based on the immediate perceived
quality of the patches rather than potential long-term differences between patches, if such long-
term differences exist. Changes in the relative quality of habitat patches over time may offset
fitness reductions associated with colonizing a habitat that is initially of low quality or reduce the
benefit of colonizing a habitat that is initially of high quality. However, maximizing growth
earlier in development, thus achieving larger sizes sooner and gaining a competitive advantage
over later colonizers, should be more important than maximizing later growth (Werner and

74
Gilliam 1984). In addition, the initial preferential colonization of hardwood pools by
hydrophilids could reduce available resources in these patches, resulting in a loss in preference
for this habitat type, as we observed. Nevertheless, colonization patterns generated by variation
in litter composition are important for individual fitness, population dynamics, and community
structure, placing further emphasis on the importance of aquatic-terrestrial linkages.
Our study highlights the importance of tree species composition in driving community
structure in freshwater systems. Changes in tree species composition can alter nutrient cycling,
overall species composition, and food web structure, resulting in functionally different systems.
These effects on colonization can be driven both by the local composition of pond litter resulting
from patchy variation in tree species composition, and the larger habitat matrix in which the local
site is embedded (Deans and Chalcraft 2017). Since the early twentieth century, forests in North
America have undergone drastic human-driven changes in their composition, such as the loss of
Castanea dentata, once one of the most important trees in eastern North America (Smock and
MacGregor 1988). Ulmus americana, Fraxinus spp., Tsuga canadensis, and Quercus spp. are all
important, widespread taxa that have been, or are currently being, decimated by disease, insect
infestation, or overbrowsing (Abrams 2003). Further changes to forest structure from logging
and fire suppression provide opportunities for invasive or opportunistic species and alter
successional dynamics of habitat patches. Understanding the effects of tree species composition
on habitat use by aquatic animals is critical for projecting distributions and abundances of
species as forests continue to change due to anthropogenically-driven processes, including
climate change. Knowing how tree species composition drives community structure and
ecosystem processes in embedded freshwater systems provides a basic framework for localized

75
efforts to restore and protect the habitat quality of freshwater systems and the ecosystem services
they provide.

76
LIST OF REFERENCES

77
Abrams, M.D. 2003. Where has all the white oak gone? Bioscience 53:927–939.
Alford, R.A., and H.M. Wilbur. 1985. Priority effects in experimental pond communities:
competition between Bufo and Rana. Ecology 66:1097–1105.
Anderson, M.J., R.N. Gorley, and K.R. Clarke. 2015. PERMANOVA+ for PRIMER: Guide to
Software and Statistical Methods. PRIMER-E, Plymouth.
Anderson, N.H., and J.R. Sedell. 1979. Detritus processing by macroinvertebrates in stream
ecosystems. Annual Review of Entomology 24:351–377.
Batzer, D.P., and S.A. Wissinger. 1996. Ecology of insect communities in nontidal wetlands.
Annual Review of Entomology 41:75–100.
Binckley, C.A., and W.J. Resetarits, Jr. 2005. Habitat selection determines abundance, richness
and species composition of beetles in aquatic communities. Biology Letters 1:370–374.
Binckley, C.A., and W.J. Resetarits, Jr. 2008. Oviposition behavior partitions aquatic landscapes
along predation and nutrient gradients. Behavioral Ecology 19:552–557.
Chesson, P. 2000. Mechanisms of maintenance of species diversity. Annual Review of Ecology
and Systematics 31:343–366.
Clarke, K.R., and R.N. Gorley. 2015. PRIMER v7: User Manual/Tutorial. PRIMER-E,
Plymouth.
Deans, R.A., and D.R. Chalcraft. 2017. Matrix context and patch quality jointly determine
diversity in a landscape-scale experiment. Oikos 126:874–887.
Doerr, V.A.J., T. Barrett, and E.D. Doerr. 2011. Connectivity, dispersal behaviour and
conservation under climate change: A response to Hodgson et al. Journal of Applied
Ecology 48:143–147.
Earl, J.E., and R.D. Semlitsch. 2013. Spatial subsidies, trophic state, and community structure:
examining the effects of leaf litter input on ponds. Ecosystems 16:639–651.
Egglishaw, H.J. 2011. The distributional relationship between the bottom fauna and plant
detritus. Journal of Animal Ecology 33:463–476.
Facelli, J.M., and S.T.A. Pickett. 1991. Plant litter: Its dynamics and effects on plant community
structure. The Botanical Review 57:1–32.
Fairchild, G.W., J. Cruz, A.M. Faulds, A.E.Z. Short, and J.F. Matta. 2003. Microhabitat and
landscape influences on aquatic beetle assemblages in a cluster of temporary and
permanent ponds. Journal of the North American Benthological Society 22:224–240.
Fairchild, G.W., A.M. Faulds, and J.F. Matta. 2000. Beetle assemblages in ponds: Effects of
habitat and site age. Freshwater Biology 44:523–534.
Fisher, S.G., and G.E. Likens. 1973. Energy flow in Bear Brook, New Hampshire: an integrative
approach to stream ecosystem metabolism. Ecological Monographs 43:421–439.
Fretwell, S.D., and H.L. Lucas. 1970. On territorial behavior and other factors influencing
habitat distribution in birds. Acta Biotheoretica 19:16–36.
Jeffries, M. 1994. Invertebrate communities and turnover in wetland ponds affected by drought.
Freshwater Biology 32:603–612.
Kok, C.J., and G. Vanderveld. 1994. Decomposition and macroinvertebrate colonization of
aquatic and terrestrial leaf material in alkaline and acid still water. Freshwater Biology
31:65–75.
Kraus, J.M., and J.R. Vonesh. 2010. Feedbacks between community assembly and habitat
selection shape variation in local colonization. Journal of Animal Ecology 79:795–802.
Layton, R.J., and J.R. Voshell. 1991 Colonization of new experimental ponds by benthic
macroinvertebrates. Environmental Entomology 20:110–117.
78
LeRoy, C.J., and J.C. Marks. 2006. Litter quality, stream characteristics and litter diversity
influence decomposition rates and macroinvertebrates. Freshwater Biology 51:605–617.
Loreau, M., and R.D. Holt. 2004. Spatial flows and the regulation of ecosystems. The American
Naturalist 163:606–615.
Maerz, J.C., C.J. Brown, C.T. Chapin, and B. Blossey. 2005. Can secondary compounds of an
invasive plant affect larval amphibians? Functional Ecology 19:970–975.
Marcarelli, A.M., C.V. Baxter, M.M. Mineau, and R.O. Hall. 2011. Quantity and quality:
unifying food web and ecosystem perspectives on the role of resource subsidies in
freshwaters. Ecology 92:1215–1225.
Melillo, J.M., J.D. Aber, and J.F. Muratore. 1982. Nitrogen and lignin control of hardwood leaf
litter decomposition dynamics. Ecology 63:621–626.
Meyer, J.L., W.J. Bruce, and S.L. Eggert. 1998. Leaf litter as a source of dissolved organic
carbon in streams. Ecosystems 1:240–249.
Minshall, G.W. 1967. Role of allochthonous detritus in the trophic structure of a woodland
springbrook community. Ecology 48:139–149.
Mortelliti, A., G. Amori, and L. Boitani. 2010. The role of habitat quality in fragmented
landscapes: A conceptual overview and prospectus for future research. Oecologia
163:535–547.
Ostrofsky, M.L. 1997. Relationship between chemical characteristics of autumn-shed leaves and
aquatic processing rates. Journal of the North American Benthological Society 16:750–
759.
Pintar, M.R., and W.J. Resetarits, Jr. 2017a. Out with the old, in with the new: oviposition
preference matches larval success in Cope’s Gray Treefrog, Hyla chrysoscelis. Journal of
Herpetology 51:186–189.
Pintar, M.R., and W.J. Resetarits, Jr. 2017b. Data from: Tree leaf litter composition drives
temporal variation in aquatic beetle colonization and assemblage structure in lentic
systems. Figshare. doi: 10.6084/m9.figshare.5566879
Polis, G.A., W.B. Anderson, and R.D. Holt. 1997. Toward an integration of landscape and food
web ecology: the dynamics of spatially subsidized food webs. Annual Review of Ecology
and Systematics 28:289–316.
R Core Team. 2015. R: A Language and Environment for Statistical Computing. R Foundation
for Statistical Computing, Vienna.
Reiskind, M.H., K.L. Greene, and L.P. Lounibos. 2009. Leaf species identity and combination
affect performance and oviposition choice of two container mosquito species. Ecological
Entomology 34:447–456.
Resetarits, W.J. Jr. 1996. Oviposition site choice and life history evolution. American Zoologist
36:205–215.
Resetarits, W.J. Jr., and C.A. Binckley. 2009. Spatial contagion of predation risk affects
colonization dynamics in experimental aquatic landscapes. Ecology 90:869–876.
Resetarits, W.J. Jr., and M.R. Pintar. 2016. Functional diversity of non-lethal effects, chemical
camouflage, and variation in fish avoidance in colonizing beetles. Ecology 97:3517–
3529.
Resetarits, W.J., and H.M. Wilbur. 1989. Choice of oviposition site by Hyla chrysoscelis: role of
predators and competitors. Ecology 70:220–228.
Richardson, J.S., C.R. Shaughnessy, and P.G. Harrison. 2004. Litter breakdown and invertebrate
association with three types of leaves in a temperate rainforest stream. Archiv für

79
Hydrobiologie 159:309–325.
Rubbo, M.J., L.K. Belden, and J.M. Kiesecker. 2008. Differential responses of aquatic
consumers to variations in leaf-litter inputs. Hydrobiologia 605:37–44.
Rubbo, M.J., J.J. Cole, and J.M. Kiesecker. 2006. Terrestrial subsidies of organic carbon support
net ecosystem production in temporary forest ponds: Evidence from an ecosystem
experiment. Ecosystems 9:1170–1176.
Rubbo, M.J., and J.M Kiesecker. 2004. Leaf litter composition and community structure:
translating regional species changes into local dynamics. Ecology 85:2519–2525.
Schneider, D.W., and T.M Frost. 1996. Habitat duration and community structure in temporary
ponds. Journal of the North American Benthological Society 15:64–86.
Scott, N.A., and D. Binkley. 1997. Foliage litter quality and annual net N mineralization:
Comparison across North American forest sites. Oecologia 111:151–159.
Short, R.A., S.P. Canton, and J.V. Ward. 1980. Detrital processing and associated
macroinvertebrates in a Colorado mountain stream. Ecology 61:727–732.
Smock, L.A., and C.M. MacGregor. 1988. Impact of the American chestnut blight on aquatic
shredding macroinvertebrates. Journal of the North American Benthological Society
7:212–221.
Stoler, A.B., D.J. Burke, and R.A. Relyea. 2016. Litter chemistry and chemical diversity drive
ecosystem processes in forest ponds. Ecology 97:1783–1795.
Stoler, A.B.,and R.A. Relyea. 2013. Bottom-up meets top-down: leaf litter inputs influence
predator-prey interactions in wetlands. Oecologia 173:249–257.
Stoler, A.B., and R.A. Relyea. 2011. Living in the litter: The influence of tree leaf litter on
wetland communities. Oikos 120:862–872.
Swan, C.M., and M.A. Palmer. 2006. Composition of speciose leaf litter alters stream detritivore
growth, feeding activity and leaf breakdown. Oecologia 147:469–478.
Vonesh, J.R., J.M. Kraus, J.S. Rosenberg, and J.M. Chase. 2009. Predator effects on aquatic
community assembly: disentangling the roles of habitat selection and post-colonization
processes. Oikos 118:1219–1229.
Wallace, J.B., S.L. Eggert, J.L. Meyer, and J.R. Webster. 1997. Multiple trophic levels of a
forest stream linked to terrestrial litter inputs. Science 277:102–104.
Warton, D.I., S.T. Wright, and Y. Wang. 2012. Distance-based multivariate analyses confound
location and dispersion effects. Methods in Ecology and Evolution 3:89–101.
Webster, J.R., and E.F. Benfield. 1986. Vascular plant breakdown in freshwater ecosystems.
Annual Review of Ecology and Systematics 17:567–594.
Werner, E.E., and J.F. Gilliam. 1984. The ontogenetic niche and species interactions in size-
structured populations. Annual Review of Ecology and Systematics 15:393–425.
Wilbur, H.M. 1997. Experimental ecology of food webs: complex systems in temporary ponds.
Ecology 78:2279–2302.
Williams, B.K., T.A.G. Rittenhouse, and R.D. Semlitsch. 2008. Leaf litter input mediates tadpole
performance across forest canopy treatments. Oecologia 155:377–384.
Williams, D.D. 2005. Temporary forest pools: Can we see the water for the trees? Wetlands
Ecology and Management 13:213–233.
Yanoviak, S.P. 1999. Effects of leaf litter species on macroinvertebrate community properties
and mosquito yield in Neotropical tree hole microcosms. Oecologia 120:147–155.
Zera, A.J., and R.F. Denno. 1997. Physiology and ecology of dispersal polymorphism in insects.
Annual Review of Entomology 42:207–230.

80
APPENDIX A

81
Table 4.1. Species and abundances of colonizing beetles (N = 3362)
Taxa Abundance Taxa Abundance
Dytiscidae 1590 Helophoridae 8
Anodocheilus exiguus 2 Helophorus linearis 8
Bidessonotus inconspicuus 5
Celina angustata 2 Hydrophilidae 1751
Copelatus chevrolati 11 Berosus aculeatus 34
Copelatus glyphicus 346 Berosus exiguus 80
Coptotomus longulus 1 Berosus infuscatus 685
Desmopachria convexa 9 Berosus pantherinus 2
Hydaticus bimarginatus 1 Berosus peregrinus 137
Hydroporus rufilabris 11 Berosus pugnax 6
Hydrovatus pustulatus 4 Berosus striatus 181
Laccophilus fasciatus 405 Cymbiodyta chamberlaini 1
Laccophilus maculosus 13 Enochrus consors 1
Laccophilus proximus 618 Enochrus ochraceus 39
Mediorhantus calidus 2 Enochrus pygmaeus 6
Neobidessus pullus 104 Helochares maculicollis 5
Neoporus undulatus 2 Paracymus 172
Thermonectus basillaris 3 Tropisternus blatchleyi 17
Uvarus granarius 17 Tropisternus collaris 196
Uvarus lacustris 34 Tropisternus lateralis 189
Haliplidae 3 Noteridae 10
Haliplus fasciatus 3 Hydrocanthus oblongus 10

82
Table 4.2. F statistics and P values from repeated-measures ANOVAs on total beetle abundance,
beetle species richness, Dytiscidae, Hydrophilidae, and species with N > 100 in rank order of
abundance (see Table 4.1). Bold indicates statistical significance (P < 0.05)
Between pools Within pool
Treatment
df (1,23)
Block
(7,23)
Time
(6,180)
Treatment
× Time
(6,180)
Total abundance 0.039
0.8450
5.118
0.0013
19.359
<0.0001
4.037
0.0008
Species richness 0.529
0.474
1.948
0.108
26.621
<0.0001
4.184
0.0006
Dytiscidae 0.117
0.7354
3.994
0.0054
38.647
<0.0001
0.947
0.463
Laccophilus
proximus
0.529
0.4743
2.387
0.0544
24.058
<0.0001
0.678
0.668
Laccophilus
fasciatus
0.187
0.6693
6.221
0.0004
28.605
<0.0001
1.413
0.212
Copelatus glyphicus 0.089
0.768
1.086
0.404
36.594
<0.0001
1.312
0.254
Neobidessus pullus 0.354
0.558
0.353
0.920
15.762
<0.0001
1.141
0.34
Hydrophilidae 0.289
0.5960
2.304
0.0618
38.468
<0.0001
8.541
<0.0001
Berosus infuscatus 0.086
0.7720
6.004
0.0005
59.85
<0.0001
11.43
<0.0001
Tropisternus collaris 0.642
0.4314
2.081
0.0874
8.475
<0.0001
2.440
0.0272
Tropisternus
lateralis
0.132
0.7194
2.489
0.0466
7.212
<0.0001
8.242
<0.0001
Berosus striatus 0.133
0.719
0.634
0.723
24.661
<0.0001
5.202
<0.0001
Paracymus 3.418
0.0774
1.056
0.4216
10.759
<0.0001
0.401
0.878
Berosus peregrinus 0.632
0.435
1.106
0.393
13.380
<0.0001
1.388
0.222

83
Table 4.3. PERMANOVA results. The reduced number of residual degrees of freedom in the
Dytiscidae analyses is due to pools with 0 beetles, which cannot be included in these analyses.
Bold indicates statistical significance (P < 0.05)
Source df SS Pseudo-F P Permutations
Early versus Late (repeated measures)
All beetle species
Treatment
Pool (Treat)
Time
Time×Treat
Residuals
1
30
1
1
30
1609.1
32073
26363
5781.1
91893
1.5051
1.2304
30.34
6.6534
0.150
0.091
0.001
0.001
999
999
999
999
Dytiscidae
Treatment
Pool (Treat)
Time
Time×Treat
Residuals
1
22
1
1
22
3540.9
46846
23185
3320
39736
1.6629
1.1789
12.836
1.8381
0.168
0.184
0.001
0.111
998
999
998
999
Hydrophilidae
Treatment
Pool (Treat)
Time
Time×Treat
Residuals
1
30
1
1
30
2098.6
27654
16078
6028.8
21690
2.2766
1.2749
22.238
8.3384
0.038
0.065
0.001
0.001
998
999
999
999
Early
All beetle species
Treatment
Residuals
1
30
4478.1
31668
4.2422 0.001 998
Dytiscidae
Treatment
Block
Residuals
1
7
15
6848.3
10666
7964
12.899
2.87
0.001
0.001
999
998
Hydrophilidae
Treatment
Residuals
1
30
3939
25587
4.6183
0.001
999
Late
All beetle species
Treatment
Residuals
1
30
2912.1
26472
3.3003 0.001 999
Dytiscidae
Treatment
Residuals
1
30
209.27
34819
0.18031
0.949
998
Hydrophilidae
Treatment
Residuals
1
30
4188.3
23757
5.2891
0.001
999

84
Table 4.4. The ten species contributing the most to the dissimilarity between beetle assemblages
in pine and hardwood pools in Early and Late samples determined with SIMPER. Average
abundances are means of raw beetle abundances in Early and Late groups, and contributing
percent was calculated from square root transformed data. ^ indicates Dytiscidae; all others are
Hydrophilidae. Bold indicates statistical significance (P < 0.05).
Average abundance Contributing
Species Hardwood Pine percent
Early
Berosus infuscatus 13.69 7.00 11.54
Tropisternus collaris 4.81 3.06 10.64
Paracymus 2.00 1.31 9.53
Tropisternus lateralis 1.56 0.38 9.18
Berosus striatus 1.50 0.31 9.15
Berosus exiguus 1.19 1.38 7.54
Laccophilus proximus^ 0.31 0.69 5.85
Tropisternus blatchleyi 0.31 0.06 4.37
Enochrus ochraceus 0.44 0.00 3.76
Berosus peregrinus 0.31 0.25 3.75
Late
Berosus infuscatus 5.19 11.44 10.88
Tropisternus lateralis 1.25 4.25 9.99
Berosus striatus 3.19 5.38 8.89
Laccophilus fasciatus^ 2.81 2.88 7.62
Paracymus 2.38 1.75 6.40
Neobidessus pullus^ 1.44 1.44 6.20
Copelatus glyphicus 0.88 1.06 5.74
Berosus peregrinus 1.00 1.69 5.31
Laccophilus proximus^ 4.56 4.56 5.23
Tropisternus collaris 0.38 1.06 5.18

85
Figure 4.1. (a) Average total beetle abundance, (b) beetle species richness, (c) dytiscid
abundance, and (d) hydrophilid abundance by date in hardwood (solid circle, dashed line) and
pine pools (open circle, solid line) (means ± SE)

86
Figure 4.2. Average abundances of the six most common (N > 100; see table 4.1) species of
Hydrophilidae by sampling date in hardwood (solid circle, dashed line) and pine pools (open
circle, solid line) (means ± SE)

87
Figure 4.3. Average abundances of the four most common (N > 100; see table 4.1) species of
Dytiscidae by sampling date in hardwood (solid circle, dashed line) and pine pools (open circle,
solid line) (means ± SE)

88
Figure 4.4. NMDS plots with minimum convex polygons for Early versus Late samples on (a)
all beetle species, (b) Dytiscidae, and (c) Hydrophilidae. (b) excludes three outliers.

89
CHAPTER 5:
PREY-DRIVEN CONTROL OF PREDATOR ASSEMBLAGES: ZOOPLANKTON
ABUNDANCE DRIVES AQUATIC BEETLE COLONIZATION

90
ABSTRACT5
Trophic interactions are critical determinants of community structure and ecosystem
function. In freshwater habitats, top predators are traditionally viewed as drivers of ecosystem
structure, shaping populations of consumers and primary producers. The temporary nature of
small water bodies makes them dependent on colonization by many organisms, particularly
insects that form highly diverse predator assemblages. We conducted mesocosm experiments
with naturally-colonizing populations of aquatic beetles to assess how prey (zooplankton)
abundances influenced colonization and assemblages of natural populations of aquatic beetles.
We experimentally demonstrate that zooplankton populations can be proximate regulators of
predator populations and assemblages via prey density-dependent predator recruitment. Our
results provide support for the importance of prey populations in structuring predator populations
and the role of habitat selection in structuring communities. We indicate that traditional views of
predators as drivers of ecosystem structure in many systems may not provide a comprehensive
picture, particularly in the context of highly disturbed or ephemeral habitats.
5 A modified version of the chapter was published as this article:
Pintar, M.R., and W.J. Resetarits, Jr. 2017. Prey-driven control of predator assemblages: zooplankton abundance
drives aquatic beetle colonization. Ecology 98:2201–2215.

91
INTRODUCTION
Communities are structured by three primary factors: predation (top-down), resources
(bottom-up), or competition (parallel) (Pimm et al. 1985; McQueen et al. 1986). How these
factors interact and influence communities has been extensively studied in a variety of systems
(Hairston et al. 1960; Power 1992; Ernest et al. 2000; Horswill et al. 2016). Predator-driven
effects have been viewed as the dominant force in many systems, including intertidal (Paine
1966), freshwater (Carpenter et al. 1985), and terrestrial (Hairston et al. 1960). Resource-driven
effects are dominant in marine systems (Aebischer et al. 1990; Ware and Thomson 2005;
Frederiksen et al. 2006). Evidence for competition-driven control of populations is mixed (Sih et
al. 1985; Meserve et al. 2003). However, no one factor is likely to control community structure
in any given system, and there is considerable variability in the relative strengths of trophic
processes. This variability has been attributed to shifting control (Meserve et al. 2003), complex
non-linear relationships (Ernest et al. 2000), or missing links, such as non-lethal effects of
predators (Peckarsky et al. 2008; Orrock et al. 2010).
Predators’ effects reverberate throughout foods webs and play critical roles in structuring
populations, communities, and ecosystems (Power 1990; Holt and Polis 1997; Sih et al. 1998).
Direct consumption reduces abundance of some prey, while others may increase due to
competitive release (Paine 1966). Changes in identity and/or abundances of top predators can
lead to trophic cascades that shift predation pressures across a food web and alter biomass of

92
primary producers (Carpenter et al. 1985; Power 1990; Polis et al. 2000). Predators, via both
direct and indirect effects, can have positive, negative, or neutral effects on diversity (Menge and
Sutherland 1976; Huston 1979; Shurin and Allen 2001).
We are becoming increasingly aware that these various effects on diversity can result
from both lethal and non-lethal processes (Schmitz et al. 1997). Non-lethal processes play
important roles in shifting prey habitat use and performance, but both lethal and non-lethal
effects are important drivers of community structure. In particular, habitat selection can have
dramatic effects on species distributions and resulting communities (Anderson and Shugart 1974;
Resetarits and Wilbur 1989; Vonesh et al. 2009; Kraus and Vonesh 2010; Resetarits and Pintar
2016). Predators have non-lethal effects on habitat selection by prey and resulting prey
distribution and abundance, whereas habitat selection by predators leads to lethal effects on prey.
Effects of predators on lower trophic levels have perhaps been best studied in freshwater
systems (Brett and Goldman 1996; Hulot et al. 2014). Lentic systems, with their discrete
boundaries and relatively closed nature, are well-suited to studies of population dynamics and
community structure. Zooplankton are important consumers of primary production and
significant food resources for predators in lentic systems (Elser and Goldman 1991). Predators
strongly control zooplankton populations and weakly control phytoplankton, whereas resources
strongly control phytoplankton and weakly control zooplankton (McQueen et al. 1989; Hulot et
al. 2014). In these systems fish are often top predators, and the transition from fish to fishless
habitats is a defining characteristic. Many fishless habitats are temporary and undergo a
seasonal/drying filling cycle, which makes them obligately dependent on recurrent colonization
of both predators and prey (Wilbur 1980; Wellborn et al. 1996).

93
In fishless habitats the primary predators are insects, such as beetles, odonates, and
hemipterans, or other organisms with complex life cycles (e.g. larval salamanders) (Schneider
and Frost 1996; Wilbur 1997). Colonization by aquatic beetles and hemipterans can quickly
influence communities as the aquatic adults select habitats both for themselves and their
offspring. Odonates and many salamanders select habitats only for their offspring, and thus there
is a time lag between oviposition and full development of larval predatory capabilities. Most
aquatic beetles are strong dispersers and can form diverse assemblages in fishless habitats, but
dispersal is energetically costly, and emphasis is placed on initial colonization as secondary
dispersal may occur only if conditions dramatically change (Zalom et al. 1979; Jeffries 1994;
Zera and Denno 1997; Bilton 2014). Colonizing beetles select habitats based on perceived risk,
by avoiding predators such as fish, and their perceived reward, by choosing habitats with more
available resources (Binckley and Resetarits 2005, 2009).
Beetles from the primary families in aquatic systems (Dytiscidae, Gyrinidae, Haliplidae,
Helophoridae, Hydraenidae, Hydrochidae, Hydrophilidae) occupy trophic levels that vary with
both family and life stage (Merritt et al. 2008). Haliplid larvae and adults are herbivorous,
noterid larvae are omnivorous and adults predaceous, hydraenid larvae and adults are scavengers,
and gyrinid larvae are predaceous but adults are both predators and opportunistic scavengers.
Hydrochids and helophorids are less well understood, but may be scavengers (Epler 2010).
Dytiscids and hydrophilids are the dominant beetles in many lentic habitats. Larval
dytiscids and hydrophilids are predaceous, and adult hydrophilids are omnivores/scavengers,
whereas adult dytiscids are primarily predaceous (Testa and Lago 1994; Larson et al. 2000).
Dytiscids capture prey ranging from zooplankton to other aquatic insects and conspecifics, to

94
larval amphibians and small fish (Yee 2010; Culler et al. 2014). Dytiscid effects on zooplankton
can be similar to fish effects, altering population sizes, community structure, behavior, and
individual body size, while also causing trophic cascades by releasing phytoplankton and
periphyton from grazing pressure (Arts et al. 1981; Herwig and Schindler 1996; Cobbaert et al.
2010). Effects of hydrophilid adults on aquatic communities are less well understood.
Studies of trophic interactions have traditionally focused on how changes to the resource
base (bottom-up) or predator assemblages (top-down) affect food web dynamics (Hunter and
Price 1992; Power 1992). The direct effects of intermediate trophic levels, especially on higher
trophic levels, are poorly understood. Work in predator-prey systems often assumes that both
predators and prey move between habitat patches in response to movements of the other (Sih
1984; Abrams 2007). This is seldom the case in lentic systems, where many organisms cannot
disperse across the terrestrial matrix. Very little is known regarding how variation in prey
abundances affects critical habitat selection processes and colonization dynamics of predators, or
the resulting community structure, particularly in the context of speciose predator assemblages.
The role of habitat selection, and how variation in characteristics of organisms at intermediate
trophic levels and habitat selection interact, are important for understanding the dynamics of
predation and community assembly.
We conducted two mesocosm experiments that allowed us to determine how colonization
and assemblage structure of aquatic beetles was influenced by zooplankton abundance over time.
Our first experiment examined whether beetles preferred new versus old ponds by simulating
water conditions of newly filled ponds. These ponds had no preexisting zooplankton populations,
thus relative zooplankton abundances were determined by actual pond age and our manipulation

95
of water age. The follow-up experiment focused specifically on effects of zooplankton
inoculation on beetle colonization under otherwise equivalent conditions. We predicted that adult
dytiscids (predaceous) would colonize pools with higher zooplankton abundances, but were
unsure if the omnivorous hydrophilids would preferentially colonize a treatment in either of the
experiments.

96
MATERIALS AND METHODS
Mesocosms
Our experiments were conducted UMFS from February until December 2015. We
established mesocosms using plastic wading pools (1 m diameter, 0.2 m deep, 110 L, N = 24).
We added 0.5 kg of dry hardwood leaf litter (primarily Quercus spp. and Fagus grandifolia) and
filled pools with unchlorinated well water. To separate colonizing beetles from the leaf litter and
allow for efficient collection, pools were covered with window screening (1.3 mm2, 1.13 mm
opening) that was depressed below the water surface. In both experiments, the treatment of the
first pool of the first block was randomly assigned, and then treatment was alternated between
pools and by block so no pools of the same treatment were adjacent. Pools were separated from
each other by 1 m edge-to-edge. Beetles were exhaustively collected once weekly, preserved in
ethanol, and identified to species, with the exception of Paracymus, Hydrochus, and
Desmopachria. Paracymus were not identified to species because of high abundance and small
size, but those at UMFS are primarily P. subcupreus. Only males of the small Hydrochus species
we collected are identifiable to species, and we only collected females. Beetles in the subgenus
Desmopachria of the genus Desmopachria are very small and difficult to identify (only males
are identifiable), but one individual from the subgenus Pachriodesma was identified to species.
Water change experiment
On 5 February 2015 we set up a 6 × 4 (N = 24) rectangular array in a field at UMFS. Two

97
treatments were arranged with rows (N = 4, south-north from nearby ponds to forest edge) as
blocks. The two treatments were: (1) controls that retained the original water on a weekly basis
(Old), and (2) pools that had most of their water and constituent zooplankton removed weekly
and replaced with zooplankton-free well water (New) to simulate influx of water to existing
ponds. Water used to initially fill and refill pools originated from the same source well. In
addition to refilling New pools, all Old pools were topped off with water weekly to maintain
equal volumes, which disturbed the water in each pool to a similar degree as occurred in the New
pools. None of the pools were inoculated with pond water. Assemblages of zooplankton,
phytoplankton, and algae nonetheless develop in uninoculated pools (Cáceres and Soluk 2002;
Louette and De Meester 2005). Beetle collections began on 12 February, but cold temperatures
and ice precluded sampling on 19 and 26 February, and 5 March.
Following the collection on 26 March, we changed water in the New pools weekly by
bailing from above the screen to prevent the loss of leaf litter. Replacement of water in New
pools served two purposes: (1) to maintain water quality similar to that of recently filled pools,
and (2) to continually maintain low zooplankton abundances. Both zooplankton and water
quality change over time in mesocosms, and some organisms (Hyla treefrogs) prefer water with
conditions similar to those of newly filled pools (Pintar and Resetarits 2017a). We conducted the
last water change on 7 May, and continued to collect beetles weekly and top off all pools as
necessary until termination of the experiment on 21 October. Because our initial focus was on
simulating newly filled ponds, and we were not primarily interested in zooplankton, we
conducted limited zooplankton sampling. On 30 April (near the end of water changes), 22 June
(after water changes had stopped and ponds presumably equilibrated), and 16 October (at the end

98
of data collection) we collected two 400 mL water samples from separate locations in each pool,
filtered them through 80 µm mesh into 50 mL centrifuge tubes, and preserved them with Lugol’s
solution. All zooplankton in each sample were counted and identified to order.
Inoculation experiment
On 22 October we set up six linear blocks of four pools each in six sites separated by >
315 meters distributed across UMFS (N = 24). Two pools in each block were inoculated with
two 470 mL aliquots containing zooplankton collected from fishless ponds at UMFS, and the
other two pools served as uninoculated controls. Pools underwent natural dynamics without
water changes or other disturbances, except for weekly beetle collections. During collections
separate fine mesh nets were used for Control and Inoculated pools to prevent transfer of
zooplankton between pools of different treatments. Final beetle collection was 10 December.
Zooplankton samples were collected on 7 and 21 November in the same manner as in the water
change experiment.
Data analysis
We analyzed the effect of treatment over time and block using univariate repeated-
measures ANOVAs on species richness and abundances of all beetles, Dytiscidae,
Hydrophilidae, and individual species with total abundances greater than 75. We aggregated data
from multiple weeks for assemblage analyses due to our exhaustive weekly sampling and
temporal variation in dispersal of natural beetle populations. These temporal groups were based
on our experimental procedures and patterns of beetle colonization. In the water change
experiment there were three groups: Period 1 (9 April–14 May), during which we actively
changed the water; Period 2 (28 May–23 July), when the effects of the water changes persisted;

99
and Period 3 (5 August–21 October), the latter part of the experiment during which the effects of
the water changes subsided. There were two groups in the inoculation experiment: Early (29
October–5 November), when we observed clear differences in the total beetle abundances
between treatments, and Late (19 November–10 December), when we did not observe
differences in total beetle abundances. We analyzed the effect of treatment on total beetle,
dytiscid, and hydrophilid assemblages using PERMANOVAs set to 999 permutations and type
III SS. Repeated-measures PERMANOVA can only analyze one fixed and one random factor, so
we did not run this analysis as there were large block effects in several of our analyses from both
experiments. We used SIMPER to determine which species contributed most to the dissimilarity
between treatments within the aggregated temporal groups and highlighted differences between
treatments in SIMPER results using univariate ANOVAs on each species in each group.
We used repeated-measures ANOVAs to analyze abundances of all zooplankton and
orders Cladocera, Copepoda, Ostracoda, and Rotifera from both experiments. To directly
compare beetle colonization to zooplankton abundance, we used multiple regression to relate
beetle abundance to zooplankton abundance with block as a factor for beetle species and families
with N > 25 in each corresponding sampling date. These regression analyses were only
conducted with beetle data from sampling dates closest to the zooplankton sampling dates. In the
water change experiment beetles collected on 30 April, 25 June, 14 October were paired with
zooplankton collections from 30 April, 22 June, and 16 October, respectively. In the inoculation
experiment, beetle collections from 5 and 19 November were paired with zooplankton
collections from 7 and 21 November, respectively. There were no zooplankton order-specific
responses by beetles, so we used total zooplankton abundances in all regression analyses.

100
All analyses were conducted on square root transformed (√𝑋 + 0.5) count data using α =
0.05. PRIMER 7 and the PERMANOVA+ add-on were used to conduct PERMANOVAs and
SIMPER using the Bray-Curtis Index and to construct NMDS plots (Anderson et al. 2015;
Clarke and Gorley 2015); all other analyses were conducted in R v. 3.3.1 (R Core Team 2016).
Data are available in Figshare (Pintar and Resetarits 2017b).

101
RESULTS
Water change experiment
A total of 6763 beetles representing 55 species in five families colonized the water
change experiment (Table 5.16). Pools were also colonized by several Hemiptera, but
abundances were too low for meaningful analysis: Belastoma lutarium (N = 1), Hesperocorixa
(18), Limnoporus canaliculatus (5), Notonecta irrorata (13), and Sigara (38). One Old pool
failed (drained) on 20 May and was excluded from repeated-measures analyses.
Temporal variation in dispersal of natural beetle populations resulted in significant
effects of time in all repeated-measures analyses. In all these ANOVAs, we saw significant time
× treatment interactions for all beetles, Dytiscidae, the four most abundant dytiscid species,
Helophorus linearis, and one hydrophilid (Enochrus ochraceus) (Table 5.2). There was
significantly higher colonization of Old pools by these groups and species while the water
changes were being conducted and for up to two months after (Figs. 5.1, 5.2).
PERMANOVA revealed that treatment had a significant effect on total beetle and
dytiscid assemblages in Periods 1 and 2 and on hydrophilids in Period 2 (Table 5.3, Fig. 5.3).
There were no significant assemblage differences in Period 3. Differences in Periods 1 and 2
were driven by dytiscid species, with abundant Hydrophilidae also contributing (Table 5.4).
However, only one hydrophilid had significantly higher colonization in Old pools within these
groups: Berosus exiguus in Period 2, which were present in only low abundances. The large
6 All tables and figures in this chapter appear in Appendix B at the end of this chapter.

102
contribution of species with similar means in each treatment could be due to a statistical artefact
(Warton et al. 2012).
There were significant time × treatment interactions and main effects of time in the total
zooplankton, cladoceran, copepod, and rotifer analyses (Table 5.5). Overall zooplankton
abundances were initially 47 times higher in Old pools while water changes were being
conducted than in New pools, and abundances remained higher in Old pools for over a month
after water changes ended before becoming equivalent between treatments late in the experiment
(Fig. 5.4a). Thus, observed differences between Old and New water treatments corresponded to
periods where zooplankton abundance was significantly higher in the Old treatments, and
disappeared when zooplankton populations equilibrated between Old and New pools.
In the June beetle/zooplankton regression, we observed a strong positive relationship
between zooplankton abundance and abundances of dytiscids, with more dytiscids in pools that
contained more zooplankton, regardless of treatment, but there was no relationship with
hydrophilids (Figs. 5.5, 5.6). We observed similar patterns for the April and October samples,
but abundances were much lower for these dates (Figs. 5.7, 5.8).
Inoculation experiment
A total of 2306 beetles representing 36 species in five families colonized the zooplankton
inoculation experiment (Table 5.1). Pools were colonized by several Hemiptera, but abundances
were again too low for analysis: Hesperocorixa (N = 36), Notonecta irrorata (53), and Sigara
(39). We observed significant effects of time and block in all repeated-measures ANOVAs,
however we observed significant time × treatment interactions in only the dytiscid and
Laccophilus fasciatus (the most abundant dytiscid) analyses (Fig. 5.9; Table 5.6). Other less

103
abundant dytiscids (e.g. Hydroporus rufilabris) had similar but non-significant patterns (Fig.
5.9f). Abundances of these groups were initially higher in Inoculated pools before equilibrating
between treatments (Fig. 5.9). However, there were significant main effects of treatment in the
analyses of all beetles, Dytiscidae, and the three most abundant dytiscids, reflecting higher
colonization of Inoculated pools during the first two weeks when abundances of all dispersing
beetles were much greater. Hydrophilids were the dominant colonizers in this experiment, but
there were no significant effects of treatment or an interaction for this family (Fig. 5.9; Table
5.6).
In our Early group, there were significant effects of treatment on the total beetle and
dytiscid assemblages, but not the hydrophilids (Table 5.7). There were no significant effects of
treatment among any beetle assemblages in the Late group. Differences in the Early group were
driven by a mix of the abundant hydrophilid species as well as three dytiscids (Table 5.8).
However, ANOVAs on the species within the Early group reveal significant differences in
colonization between pool types for only the three dytiscids and one hydrophilid, E. ochraceus.
In the Late group a mix of species from both families contributed to differences between
treatments, but there were no significant differences between treatments for any species. In all
PERMANOVA analyses we saw a large, significant effect of block, which makes visualization
of differences using NMDS plots difficult (Table 5.7, Fig. 5.10).
There were significant time × treatment interactions in the total zooplankton and copepod
analyses: overall zooplankton abundances were initially five times higher in inoculated pools
Early and equal between treatments Late (Table 5.5). Significant main effects of treatment in
zooplankton, cladoceran, copepod, and rotifer analyses reflected higher abundances in inoculated

104
pools (Fig. 5.4b). Abundance patterns of the three common orders followed the same patterns as
that of all zooplankton. Ostracods were too rare (N = 10) for meaningful analysis, but were
included in the total zooplankton ANOVA.
In regression analyses of beetles collected on 5 November and zooplankton collected on
7 November, we observed a significant relationship between dytiscid abundances and
zooplankton abundances, but hydrophilids had no relationship with zooplankton abundance
(Figs. 5.11a–f, 5.12). Although there were fewer beetles during the 19 November collections, we
still observed a significant relationship between dytiscid and zooplankton abundances, but still
no relationship between hydrophilids and zooplankton (Figs. 5.11g,h, 5.13). It is important to
note that the 19/21 November collections occurred when there were no longer statistically
significant differences between treatments in either dytiscid colonization or zooplankton
abundance. On both sampling dates, dytiscids were more abundant in pools that contained more
zooplankton, regardless of treatment.

105
DISCUSSION
Predator-prey interactions and their consequences are a central focus in ecology. It is
well-documented that predators are attracted to areas with more prey, and evolve/develop
appropriate prey acquisition strategies, whereas prey, of necessity, avoid predators and
evolve/develop appropriate defenses (Sih 1984; Lima 1998). Studies have traditionally focused
on interactions between small numbers of predator and prey species, or effects of one (or a small
number) of predator species on larger assemblages of prey (Sih et al. 1998; Abrams 2007). Much
of this work has been in systems where at least one, and often all, species involved are vagile and
capable of moving between habitat patches at will, as in the context of optimal foraging theory
and the ideal free distribution (Fretwell and Lucas 1970; Werner and Hall 1974; Charnov 1976).
This kind of movement dynamics is not realistic for many natural systems, and we can learn a
great deal about community assembly by studying the effects of prey abundances on predator
habitat selection, colonization, and resulting community structure in more constrained systems.
Our study system involved numerous prey species across four orders of zooplankton, 32 species
of predaceous diving beetles (Dytiscidae), and 27 species of aquatic beetles from four other
families (Table 5.1). Aside from low abundances of hemipterans, beetles were the only predators
present in our pools.
Our data show that abundances of prey occupying middle trophic levels (zooplankton)
can be the proximate regulator of the colonization dynamics and resulting abundances and

106
species composition of predators (adult beetles) in lentic systems. We observed significant time
× treatment interactions in both zooplankton abundances and colonization by dytiscid beetles:
when zooplankton abundances were higher, there was increased colonization by aquatic beetles,
predominately predatory dytiscids, but not hydrophilids. Over time, as zooplankton abundances
equilibrated between treatments, colonization likewise equilibrated. This is supported by both
zooplankton removal in the water change experiment, and addition in the inoculation experiment.
Perhaps most interestingly, even given our limited number of zooplankton sampling dates, we
found strong relationships between dytiscid and zooplankton abundances, with more dytiscids
colonizing pools with more zooplankton. This relationship occurred regardless of treatment and
whether or not there were significant differences in dytiscid or zooplankton abundances between
treatments.
Zooplankton are important consumers of primary production and significant food
resources for predators in freshwater systems (Elser and Goldman 1991). In fishless lentic
systems, adult and larval dytiscids and larval hydrophilids are among the most important
predators of zooplankton (Wilbur 1997; Arnott et al. 2006). Adult beetles have terrestrial
pupation of their larvae, which makes populations entirely dependent on colonization from
surrounding patches or terrestrial pupation sites. Resource variation in lentic systems does not
immediately affect adult population size, as resources do not cause direct/immediate mortality,
but rather drive patterns of colonization, dispersal, and fitness via differences in patch quality.
Over short timescales resources can more strongly affect larval beetles, which cannot disperse to
other patches. Resources are nonetheless critical to adults given the importance of initial
colonization decisions, low likelihood of secondary dispersal, and effects on larval performance.

107
We would expect increased colonization of pools with more zooplankton to place
increased predation pressure on those populations, possibly creating a negative feedback loop
(Möllmann et al. 2008). Whether this occurred in our system is undetermined, because we
interrupted community assembly with each weekly sample, and there was significant temporal
variation in natural colonization rates. However, even based on relatively few zooplankton
samples, differences in zooplankton abundance between Old vs New, and Inoculated vs Control
pools are relatively consistent (Fig. 5.4), until they ultimately converge. This suggests no top-
down feedback or population regulation in our system. Inoculated pools reached stable levels
quickly (within two weeks), whereas Control pools approached this same level after four weeks.
This high capacity for passive dispersal by zooplankton allows for rapid colonization of small,
isolated water bodies (Maguire 1963; Cáceres and Soluk 2002).
We see evidence of bottom-up regulation of zooplankton and in turn adult beetle
populations in the water change experiment. With our weekly water changes, we removed from
New pools not only zooplankton, but also dissolved nutrients and fine particulate organic matter.
Conducting water changes for seven weeks should have reduced base resource levels, and in
turn, reduced primary productivity and consumer (zooplankton) populations (Leibold 1999). If
the effects of water changes were solely to reduce zooplankton populations, we would expect
some recovery of populations in New pools by the second sampling date (22 June), over a month
after water changes ended, given the equality of populations between treatments after four weeks
in the inoculation experiment. Although we do not have zooplankton data between 22 June and
16 October, based on patterns of dytiscid colonization, we suspect zooplankton populations did
not recover until at least late July. However, we see strong relationships between dytiscid

108
abundance and zooplankton abundance throughout the course of the experiment with higher
dytiscid abundances in pools with more zooplankton, regardless of treatment. Therefore, the
differences in colonization between treatments likely cannot be attributed to disturbance,
differences in water chemistry, or other such factors.
Interestingly, we did not observe consistent differences between treatments in
colonization by the omnivorous hydrophilids. We saw significant time × treatment interactions
for Enochrus ochraceus and Helophorus linearis (Helophoridae is closely related to
Hydrophilidae) in the water change experiment and significantly higher colonization by E.
ochraceus of Old pools (Table 5.2). These patterns are weaker than for dytiscids, occur on only a
few dates in E. ochraceus (Fig. 5.2i), and there is no relationship with zooplankton abundance as
in dytiscids (Fig. 5.12c). Across several colonization experiments, E. ochraceus responses have
been enigmatic, exhibiting geographically and temporally variable colonization (Resetarits and
Pintar 2016; unpublished data). Why we see significant differences with this particular
hydrophilid in this experiment is unknown. Knowledge of species-level resource use is limited in
aquatic beetles, but we would expect resource use and colonization responses to more closely
mimic other adult hydrophilids than dytiscids.
If water changes removed sufficient nutrients or other resources to suppress zooplankton
populations, it suggests that overall productivity was lowered, including decreased primary
productivity. Similarly, our zooplankton inocula also undoubtedly contained phytoplankton and
periphyton. Both of these processes should affect hydrophilid colonization, but we saw equal
colonization of both treatments in both experiments among most hydrophilids. As scavengers,
hydrophilids may directly respond to base resource in our pools (leaf litter) (Pintar and Resetarits

109
2017c). We previously recorded resource-driven colonization of pools that vary in the type and
quality of leaf litter only in hydrophilids, not dytiscids (Pintar and Resetarits 2017d). The trophic
distance from the resource base to scavenging hydrophilids is shorter than to predaceous
dytiscids, and colonization preferences of hydrophilids switched between litter types over a short
time scale (two months). While many natural systems contain many other aquatic insects that
could be food sources for beetles, we observed very few in our experiment and many that were
present were removed during beetle sampling.
Variation in resources used by different taxa and the differing primacy of factors
controlling patch quality places an emphasis on habitat selection decisions by colonizing adult
beetles. Colonization in response to varying prey levels among dytiscid adults and not
hydrophilids suggests that hydrophilids are primarily selecting habitats for themselves and not
their predaceous offspring, which should perform better with greater zooplankton abundance.
Preference of adult dytiscids for pools with more zooplankton matches the optimal habitat for
both their predaceous offspring and themselves, maximizing expected fitness, whereas lower
zooplankton abundances (while they persist) would reduce fitness for hydrophilids as a result of
larval competition and cannibalism. Similar differences exist between these families in
colonization preferences in the context of predation risk, reinforcing the idea that adult
hydrophilids select habitats primarily for themselves (Resetarits and Pintar 2016, Pintar and
Resetarits 2017d).
Variation in zooplankton populations drives differential family- and species-specific
colonization of aquatic beetles, resulting in distinct assemblages between treatments in both
experiments. Assemblages were more distinct temporally (Fig. 5.3), but significant differences

110
existed between treatments early (groups: 1, 2, Early) in both experiments for all beetles and
dytiscids, but not later (groups: 3, Late), or in hydrophilids. However, there was also
considerable spatial overlap in the NMDS plots (Fig. 5.3). The degree of overlap is similar to
that observed with other resource-driven colonization patterns, yet less distinct than those in the
context of predation risk-driven colonization (Resetarits and Pintar 2016, Pintar and Resetarits
2017d). Nevertheless, based on our results, we would expect both primary resource and prey
abundances to be important drivers of assemblage structure in small, ephemeral, fishless habitats.
Species composition and those species contributing the most to differences between treatments
varied over time in both experiments (Tables 5.4, 5.8), yet we still observed effects that tracked
zooplankton abundances for dytiscids and not hydrophilids.
Distinct assemblages and higher species richness in pools with more zooplankton should
produce functionally distinct communities in lentic systems across a gradient of prey availability.
In contrast to most taxa of aquatic animals (including other insects), beetles can sustain highly
diverse assemblages in small habitat patches (Larson 1985; Batzer and Wissinger 1996; Fairchild
et al. 2000, 2003). Aquatic beetles (dytiscids in particular) are more morphologically and
functionally diverse as adults than they are as larvae (Larson et al. 2000). Zooplankton are
consumed by many adult dytiscids (and all larval dytiscids), and some adults have specialized
morphologies for capturing zooplankton (Friis et al. 2003). Further work on zooplankton
community structure in this context could prove interesting if increased beetle colonization alters
zooplankton abundance and species composition via a feedback loop (Arnott et al. 2006).
Zooplankton are indicators of water quality and critical to the functioning of freshwater
and marine food webs (Gannon and Stemberger 1978; Richardson 2008). Populations of these

111
abundant consumers support countless other species in aquatic systems. Although their
populations have traditionally been viewed as controlled by predator populations, we see that
during the initial colonization phase of freshwater systems zooplankton determine the
abundances of predators present and their assemblage structure within a patch. The effects
observed in our system are analogous to remote effects of predators (Orrock et al. 2010) but in
reverse, with prey-driven patterns of dispersal and colonization in predator populations. While
predators may be more dominant drivers of community structure later in community assembly,
the abundances and identities of the initial colonists are important, as they can shape future
colonization patterns and successional dynamics (Alford and Wilbur 1985). It is important to
understand the roles of prey population dynamics and habitat selection in structuring populations
and metacommunities via prey-density dependent predator colonization, especially in the context
of local and global environmental changes (Mortelliti et al. 2010; Doerr et al. 2011). Top-down
and bottom-up control of community structure are only two of the possibilities for how variation
in species composition and population density impact the function of natural ecosystems.

112
LIST OF REFERENCES

113
Abrams, P.A. 2007. Habitat choice in predator-prey systems: spatial instability due to interacting
adaptive movements. The American Naturalist 169:581–594.
Aebischer, N. J., J.C. Coulson, and J.M. Colebrook. 1990. Parallel long-term trends across four
marine trophic levels and weather. Nature 347:753–755.
Alford, R.A., and H.M. Wilbur. 1985. Priority effects in experimental pond communities:
competition between Bufo and Rana. Ecology 66:1097–1105.
Anderson, M.J., R.N. Gorley, and K.R. Clarke. 2015. PERMANOVA+ for PRIMER: Guide to
Software and Statistical Methods. PRIMER-E, Plymouth.
Anderson, S.H., and H.H. Shugart. 1974. Habitat selection of breeding birds in an East
Tennessee deciduous forest. Ecology 55:828–837.
Arnott, S.E., A.B. Jackson, and Y. Alarie. 2006. Distribution and potential effects of water
beetles in lakes recovering from acidification. Journal of the North American
Benthological Society 25:811–824.
Arts, M.T., E.J. Maly, and M. Pasitschniak. 1981. The influence of Acilius (Dytiscidae)
predation on Daphnia in a small pond. Limnology and Oceanography 26:1172–1175.
Batzer, D.P., and S.A. Wissinger. 1996. Ecology of insect communities in nontidal wetlands.
Annual Review of Entomology 41:75–100.
Bilton, D.T. 2014. Dispersal in Dytiscidae. Ecology, Systematics, and the Natural History of
Predaceous Diving Beetles (Coleoptera: Dytiscidae) (ed D.A. Yee), pp. 387–407.
Springer, New York.
Binckley, C.A., and W.J. Resetarits, Jr. 2005. Habitat selection determines abundance, richness
and species composition of beetles in aquatic communities. Biology Letters 1:370–374.
Binckley, C.A., and W.J. Resetarits, Jr. 2009. Spatial and temporal dynamics of habitat selection
across canopy gradients generates patterns of species richness and composition in aquatic
beetles. Ecological Entomology 34:457–465.
Brett, M.T., and C.R. Goldman. 1996. A meta-analysis of the freshwater trophic cascade.
Proceedings of the National Academy of Sciences 93:7723–7726.
Cáceres, C.E., and D.A. Soluk. 2002. Blowing in the wind: A field test of overland dispersal and
colonization by aquatic invertebrates. Oecologia 131:402–408.
Carpenter, S.R., J.F. Kitchell, and J.R. Hodgson. 1985. Cascading trophic interactions and lake
productivity. BioScience 35:634–639.
Charnov, E.L. 1976. Optimal foraging, the marginal value theorem. Theoretical Population
Biology 9:129–136.
Clarke, K.R., and R.N. Gorley. 2015. PRIMER v7: User Manual/Tutorial. PRIMER-E,
Plymouth.
Cobbaert, D., S.E. Bayley, and J.L. Greter. 2010. Effects of a top invertebrate predator (Dytiscus
alaskanus; Coleoptera: Dytiscidae) on fishless pond ecosystems. Hydrobiologia 644:103–
114.
Culler, L.E., S. Ohba, and P. Crumrine. 2014. Predator-prey interactions of dytiscids. Ecology,
Systematics, and the Natural History of Predaceous Diving Beetles (Coleoptera:
Dytiscidae) (ed D.A. Yee), pp. 363–386. Springer, New York.
Doerr, V. A.J., T. Barrett, and E.D. Doerr. 2011. Connectivity, dispersal behaviour and
conservation under climate change: A response to Hodgson et al. Journal of Applied
Ecology 48:143–147.

114
Elser, J.J., and C.R. Goldman. 1991. Zooplankton effects on phytoplankton in lakes of
contrasting trophic status. Limnology and Oceanography 36:64–90.
Epler, J.H. 2010. The water beetles of Florida. Florida Department of Environmental Protection,
Tallahassee.
Ernest, S.K.M., J.H. Brown, and R.R. Parmenter. 2000. Rodents, plants, and precipitation: spatial
and temporal dynamics of consumers and resources. Oikos 88:470–482.
Fairchild, G.W., J. Cruz, A.M. Faulds, A.E.Z. Short, and J.F. Matta. 2003. Microhabitat and
landscape influences on aquatic beetle assemblages in a cluster of temporary and
permanent ponds. Journal of the North American Benthological Society 22:224–240.
Fairchild, G.W., A.M. Faulds, and J.F. Matta. 2000. Beetle assemblages in ponds: Effects of
habitat and site age. Freshwater Biology 44:523–534.
Frederiksen, M., M. Edwards, A.J. Richardson, N.C. Halliday, and S. Wanless. 2006. From
plankton to top predators: Bottom-up control of a marine food web across four trophic
levels. Journal of Animal Ecology 75:1259–1268.
Fretwell, S.D., and H.L. Lucas. 1970. On territorial behavior and other factors influencing
habitat distribution in birds. Acta Biotheoretica 19:16–36.
Friis, H., T. Bauer, and O. Betz. 2003. An insect larva with a “pig-snout”: structure and function
of the nasale of Hyphydrus ovatus L. (1763) (Coleoptera: Dytiscidae). Journal of Zoology
261:59–68.
Gannon, J.E., and R.S. Stemberger. 1978. Zooplankton (especially crustaceans and rotifers) as
indicators of water quality. Transactions of the American Microscopical Society 97:16–
35.
Hairston, N.G., F.E. Smith, and L.B. Slobodkin. 1960. Community structure, population control,
and competition. The American Naturalist 94:421–425.
Herwig, B.R., and D.E. Schindler. 1996. Effects of aquatic insect predators on zooplankton in
fishless ponds. Hydrobiologia 324:141–147.
Holt, R.D., and G.A. Polis. 1997. A theoretical framework for intraguild predation. The
American Naturalist 149:745–764.
Horswill, C., N. Ratcliffe, J.A. Green, R.A. Phillips, P.N. Trathan, and J. Matthiopoulos. 2016.
Unravelling the relative roles of top-down and bottom-up forces driving population
change in an oceanic predator. Ecology 97:1919–1928.
Hulot, F.D., G. Lacroix, and M. Loreau. 2014. Differential responses of size-based functional
groups to bottom-up and top-down perturbations in pelagic food webs: A meta-analysis.
Oikos 123:1291–1300.
Hunter, M.D., and P.W. Price. 1992. Playing chutes and ladders: heterogeneity and the relative
roles of bottom-up and top- down forces in natural communities. Ecology 73:724–732.
Huston, M.A. 1979. A general hypothesis of species diversity. The American Naturalist 113:81–
101.
Jeffries, M. 1994. Invertebrate communities and turnover in wetland ponds affected by drought.
Freshwater Biology 32:603–612.
Kraus, J.M., and J.R. Vonesh. 2010. Feedbacks between community assembly and habitat
selection shape variation in local colonization. Journal of Animal Ecology 79:795–802.
Larson, D.J. 1985. Structure in temperate predaceous diving beetle communities (Coleoptera:
Dytiscidae). Holarctic Ecology 8:18–32.

115
Larson, D.J., Y. Alarie, and R.E. Roughley. 2000. Predaceous Diving Beetles (Coleoptera:
Dytiscidae) of the Nearctic Region, with emphasis on the fauna of Canada and Alaska.
National Research Council of Canada, Ottawa.
Leibold, M.A. 1999. Biodiversity and nutrient enrichment in pond plankton communities.
Evolutionary Ecology Research 1:73–95.
Lima, S.L. 1998. Nonlethal effects in the ecology of predator-prey interactions. BioScience
48:25–34.
Louette, G., and L. De Meester. 2005. High dispersal capacity of cladoceran zooplankton in
newly founded communities. Ecology 86:353–359.
Maguire, B. 1963. The passive dispersal of small aquatic organisms and their colonization of
isolated bodies of water. Ecological Monographs 33:161–185.
McQueen, D.J., M.R.S. Johannes, J.R. Post, T.J. Stewart, and R.S. Lean. 1989. Bottom-up and
top-down impacts on freshwater pelagic community structure. Ecological Monographs
59:289–309.
McQueen, D.J., J.R. Post, and E.L. Mills. 1986. Trophic relationships in freshwater pelagic
ecosystems. Canadian Journal of Fisheries and Aquatic Sciences 43:1571–1581.
Menge, B.A., and J.P. Sutherland. 1976. Species diversity gradients: synthesis of the roles of
predation, competition, and temporal heterogeneity. The American Naturalist 110:351–
369.
Merritt, R.W., K.W. Cummins, and M.B. Berg. 2008. An Introduction to the Aquatic Insects of
North America. 4th edition. Kendall/Hunt Publishing Company, Dubuque.
Meserve, P.L., D.A. Kelt, M.W. Bryan, and J.R. Gutierrez. 2003. Thirteen years of shifting top-
down and bottom-up control. BioScience 53:633–646.
Möllmann, C., B. Müller-Karulis, G. Kornilovs, and M.A. St John. 2008. Effects of climate and
overfishing on zooplankton dynamics and ecosystem structure: Regime shifts, trophic
cascade, and feedback loops in a simple ecosystem. ICES Journal of Marine Science
65:302–310.
Mortelliti, A., G. Amori, and L. Boitani. 2010. The role of habitat quality in fragmented
landscapes: A conceptual overview and prospectus for future research. Oecologia
163:535–547.
Orrock, J.L., L.M. Dill, A. Sih, J.H. Grabowski, S.D. Peacor, B.L. Peckarsky, E.L. Preisser, J.R.
Vonesh, and E.E. Werner. 2010. Predator effects in predator-free space: the remote
effects of predators on prey. Ecology 3:22–30.
Paine, R.T. 1966. Food web complexity and species diversity. The American Naturalist 100:65–
75.
Peckarsky, B.L., P.A. Abrams, D.I. Bolnick, L.M. Dill, J.H. Grabowski, B. Luttbeg, J.L. Orrock,
S.D. Peacor, E.L. Preisser, O.J. Schmitz, and G.C. Trussell. 2008. Revisiting the classics:
considering nonconsumptive effects in textbook examples of predator–prey interactions.
Ecology 89:2416–2425.
Pimm, S.L., M.L. Rosenzweig, and W. Mitchell. 1985. Competition and food selection: field
tests of a theory. Ecology 66:798–807.
Pintar, M.R., and W.J. Resetarits, Jr. 2017a. Out with the old, in with the new: oviposition
preference matches larval success in Cope’s gray treefrog, Hyla chrysoscelis. Journal of
Herpetology 51:186–189.

116
Pintar, M.R., and W.J. Resetarits, Jr. 2017b. Data from: Prey-driven control of predator
assemblages: zooplankton abundance drives aquatic beetle colonization. Figshare. doi:
10.6084/m9.figshare.5566888
Pintar, M.R., and W.J. Resetarits, Jr. 2017c. Context-dependent colonization dynamics: regional
reward contagion drives local compression in aquatic beetles. Journal of Animal Ecology.
Pintar, M.R., and W.J. Resetarits, Jr. 2017d. Tree leaf litter composition drives temporal
variation in aquatic beetle colonization and assemblage structure in lentic systems.
Oecologia 183:797–807.
Polis, G.A., A.L.W. Sears, G.R. Huxel, D.R. Strong, and J. Maron. 2000. When is a trophic
cascade a trophic cascade? Trends in Ecology & Evolution 15:473–475.
Power, M.E. 1990. Effects of fish in river food webs. Science 250:811–814.
Power, M.E. 1992. Top-down and bottom-up forces in food webs: do plants have primacy?
Ecology 73:733–746.
R Core Team. 2016. R: A Language and Environment for Statistical Computing. R Foundation
for Statistical Computing, Vienna.
Resetarits, W.J. Jr., and M.R. Pintar. 2016. Functional diversity of non-lethal effects, chemical
camouflage, and variation in fish avoidance in colonizing beetles. Ecology 97:3517–
3529.
Resetarits, W.J. Jr., and H.M. Wilbur. 1989. Choice of oviposition site by Hyla chrysoscelis: role
of predators and competitors. Ecology 70:220–228.
Richardson, A.J. 2008. In hot water: Zooplankton and climate change. ICES Journal of Marine
Science 65:279–295.
Schmitz, O.J., A.P. Beckerman, and K.M. O’Brien. 1997. Behaviorally mediated trophic
cascades: Effects of predation risk on food web interactions. Ecology 78:1388–1399.
Schneider, D.W., and T.M. Frost. 1996. Habitat duration and community structure in temporary
ponds. Journal of the North American Benthological Society 15:64–86.
Shurin, J.B., and E.G. Allen. 2001. Effects of competition, predation, and dispersal on species
richness at local and regional scales. The American Naturalist 158:624–637.
Sih, A. 1984. The behavioral response race between predator and prey. The American Naturalist
123:143–150.
Sih, A., P.H. Crowley, M. McPeek, J.W. Petranka, and K. Strohmeier. 1985. Predation,
competition, and prey communities: a review of field experiments. Annual Review of
Ecology and Systematics 16:269–311.
Sih, A., G. Englund, and D. Wooster. 1998. Emergent impacts of multiple predators on prey.
Trends in Ecology and Evolution 13:350–355.
Testa, S., and P.K. Lago. 1994. The aquatic Hydrophilidae (Coleoptera) of Mississippi.
Mississippi Agricultural and Forestry Experimental Station Technical Bulletin 193:1–71.
Vonesh, J.R., J.M. Kraus, J.S. Rosenberg, and J.M. Chase. 2009. Predator effects on aquatic
community assembly: disentangling the roles of habitat selection and post-colonization
processes. Oikos 118:1219–1229.
Ware, D.M., and R.E. Thomson. 2005. Bottom-up ecosystem trophic dynamics determine fish
production in the Northeast Pacific. Science 308:1280–1284.
Warton, D.I., S.T. Wright, and Y. Wang. 2012. Distance-based multivariate analyses confound
location and dispersion effects. Methods in Ecology and Evolution 3:89–101.

117
Wellborn, G.A., D.K. Skelly, and E.E. Werner. 1996. Mechanisms creating community structure
across a freshwater habitat gradient. Annual Review of Ecology and Systematics 27:337–
363.
Werner, E.E., and D.J. Hall. 1974. Optimal foraging theory and the size selection of prey by the
bluegill sunfish (Lepomis macrochirus). Ecology 55:1042–1052.
Wilbur, H.M. 1980. Complex life cycles. Annual Review of Ecology and Systematics 11:67–93.
Wilbur, H.M. 1997. Experimental ecology of food webs: complex systems in temporary ponds.
Ecology 78:2279–2302.
Yee, D.A. 2010. Behavior and aquatic plants as factors affecting predation by three species of
larval predaceous diving beetles (Coleoptera: Dytiscidae). Hydrobiologia 637:33–43.
Zalom, F.G., A.A. Grigarick, and M.O. Way. 1979. Seasonal and diel flight periodicities of rice
field Hydrophilidae. Environmental Entomology 8:938–943.
Zera, A.J., and R.F. Denno. 1997. Physiology and ecology of dispersal polymorphism in insects.
Annual Review of Entomology 42:207–230.

118
APPENDIX B

119
Table 5.1. Species and abundances of colonizing beetles for both the water change (WC) and
inoculation (IN) experiments. S indicates number of species from that family.
Experiment Experiment
WC IN WC IN
Dytiscidae (S = 32) 3211 643 Haliplidae (S = 3) 5 10
Acilius fraternus 0 1 Haliplus triopsis 2 0
Acilius mediatus 0 5 Peltodytes dunavani 3 0
Agabus disintegratus 7 3 Peltodytes sexmaculatus 0 10
Agabus punctatus 0 9
Bidessonotus inconspicuus 1 0 Helophoridae (S = 2) 180 51
Celina angustata 1 0 Helophorus linearis 177 51
Celina hubbelli 1 0 Helophorus marginicollis 3 0
Copelatus caelatipennis 1 0
Copelatus chevrolati 19 6 Hydrochidae (S = 1) 1 2
Copelatus glyphicus 1006 94 Hydrochus 1 2
Desmopachria spp. 19 0
Desmopachria seminola 1 0 Hydrophilidae (S = 21) 3366 1600
Hydaticus bimarginatus 2 0 Berosus exiguus 28 0
Hydrocolus deflatus 6 36 Berosus infuscatus 242 84
Hydrocolus oblitus 26 69 Berosus peregrinus 4 1
Hydroporus pseudoniger 11 12 Berosus striatus 12 0
Hydroporus rufilabris 476 153 Cymbiodyta chamberlaini 22 76
Hydrovatus pustulatus 2 0 Cymbiodyta vindicata 1 2
Ilybius biguttulus 3 0 Enochrus cinctus 3 0
Ilybius gagates 4 2 Enochrus consors 5 1
Laccophilus fasciatus 199 170 Enochrus ochraceus 252 490
Laccophilus maculosus 6 0 Enochrus perplexus 23 1
Laccophilus proximus 995 62 Enochrus pygmaeus 8 75
Mediorhantus calidus 11 2 Enochrus sayi 3 0
Neobidessus pullus 54 1 Helochares maculicollis 9 143
Neoporus blanchardi 2 10 Hydrochara brevipalpus 1 0
Neoporus undulatus 1 1 Hydrophilus triangularis 1 0
Platambus flavovittatus 7 0 Laccobius teneralis 1 0
Thermonectus basillaris 7 4 Paracymus 1868 253
Thermonectus nigrofasciatus 2 1 Tropisternus blatchleyi 4 5
Uvarus granarius 328 2 Tropisternus collaris 22 58
Uvarus lacustris 14 0 Tropisternus lateralis 855 411
Tropisternus natator 2 0

120
Table 5.2. F statistics and P values from repeated-measures ANOVAs for the water change
experiment: total beetle abundance, species richness, Dytiscidae, Hydrophilidae, and species
with N > 100, in rank order of abundance by family (see Table 5.1). Bold indicates statistical
significance (P < 0.05)
Between pools Within pool
Age
df (1,18)
Block
(3,18)
Time
(33,693)
Age
× Time
(33,693)
Total abundance 11.907 1.117 58.035 2.584
0.0029 0.3684 <0.0001 <0.0001
Species richness 11.018 1.195 45.704 1.814
0.0038 0.3398 <0.0001 0.0039
Dytiscidae 20.57 0.91 50.812 5.592
0.0003 0.456 <0.0001 <0.0001
Copelatus glyphicus 10.461 2.361 33.020 4.113
0.0046 0.1054 <0.0001 <0.0001
Laccophilus proximus 9.730 1.851 24.985 4.163
0.0059 0.1742 <0.0001 <0.0001
Hydroporus rufilabris 14.755 0.331 37.910 5.252
0.0012 0.8027 <0.0001 <0.0001
Uvarus granarius 8.119 0.355 12.247 3.199
0.0106 0.7863 <0.0001 <0.0001
Laccophilus fasciatus 5.369 4.677 4.830 1.160
0.0325 0.0138 <0.0001 0.249
Helophorus linearis 1.234 2.694 23.965 1.774
0.2813 0.0768 <0.0001 0.0053
Hydrophilidae 3.048 2.175 29.442 0.606
0.0979 0.1263 <0.0001 0.961
Paracymus 4.289 1.265 30.855 0.616
0.0530 0.316 <0.0001 0.956
Tropisternus lateralis 0.155 0.653 17.631 0.829
0.6980 0.592 <0.0001 0.741
Enochrus ochraceus 7.406 0.287 11.487 1.874
0.0140 0.834 <0.0001 0.0024
Berosus infuscatus 0.488 5.638 7.725 0.791
0.4937 0.0066 <0.0001 0.794

121
Table 5.3. PERMANOVA results from the water change experiment. Block was rolled into the
error term when P > 0.25. Bold indicates statistical significance (P < 0.05)
Source
df
SS
Pseudo-F
P
Unique
permutations
Period 1
All beetles
Age
Residuals
1
22
2139.9
12354
3.8109 0.001 999
Dytiscidae
Age
Block
Residuals
1
3
19
2854.4
2491.5
12071
4.4927
1.3072
0.001
0.193
999
997
Hydrophilidae
Age
Residuals
1
22
2033.1
11812
3.7865
0.014
995
Period 2
All beetles
Age
Block
Residuals
1
3
18
1358.3
1742.2
6961.6
3.5121
1.5015 0.005
0.108
998
998
Dytiscidae
Age
Residuals
1
21
2270.2
8818.8
5.4061
0.003
999
Hydrophilidae
Age
Block
Residuals
1
3
18
580.0
2393.5
5683.8
1.8368
2.5266
0.119
0.005
999
998
Period 3
All beetles
Age 1 970.6 1.3074 0.247 998
Residuals 21 15589
Dytiscidae
Age 1 1694.1 1.6841 0.142 997
Residuals 21 21124
Hydrophilidae
Age 1 555.5 0.8883 0.539 999
Residuals 21 13133

122
Table 5.4. The 10 species contributing most to dissimilarity among beetle assemblages in the
water change experiment as determined by SIMPER. Contributions are broken down between
New and Old treatments and by sampling period (see methods). The 10 species contributing
most to dissimilarity between beetle assemblages in New and Old pools in the three sample
groups of the water change experiment, using SIMPER. Species listed in descending order of
contributing percent. Average abundances are means of raw beetle numbers abundances in each
group, and contributing percent was calculated from square root transformed data. ^ indicates
Dytiscidae; bold indicates significantly higher colonization in ANOVA.
Average abundance Contributing
Species New Old percent
Period 1
Hydroporus rufilabris^ 9.83 25.08 10.19
Copelatus glyphicus^ 3.58 11.00 8.98
Paracymus 5.75 9.58 7.48
Tropisternus lateralis 12.67 9.58 7.37
Uvarus granarius^ 1.67 4.92 7.37
Laccophilus proximus^ 5.08 10.33 7.32
Helophorus linearis 4.17 6.00 5.39
Laccophilus fasciatus^ 1.83 3.58 5.30
Enochrus ochraceus 1.42 1.83 4.77
Hydrocolus oblitus^ 0.42 1.25 4.30
Period 2
Copelatus glyphicus^ 17.67 43.00 12.95
Laccophilus proximus^ 13.17 32.00 10.39
Paracymus 43.83 57.64 10.17
Uvarus granarius^ 5.75 11.36 8.65
Berosus infuscatus 5.25 6.55 5.58
Tropisternus lateralis 7.75 9.55 5.38
Enochrus ochraceus 1.83 3.73 4.90
Neobidessus pullus^ 2.33 1.73 4.67
Berosus exiguus 0.58 1.55 4.48
Helophorus linearis 1.00 1.09 4.00
Period 3
Paracymus 6.33 9.64 13.58
Tropisternus lateralis 13.25 11.09 11.59
Berosus infuscatus 2.50 2.18 8.14
Enochrus ochraceus 3.25 6.36 7.15
Laccophilus fasciatus^ 1.00 1.64 6.87
Laccophilus proximus^ 7.58 6.82 6.39
Copelatus glyphicus^ 1.33 0.45 6.35
Tropisternus collaris 0.33 0.64 4.54
Uvarus granarius^ 0.67 0.27 4.36
Copelatus chevrolati^ 0.33 0.27 3.57

123
Table 5.5. Results of zooplankton repeated-measures analyses from both experiments. Block
was not significant (P > 0.25) in the water change experiment for all analyses and was rolled into
the error term. Ostracod abundances were too low in the inoculation experiment (N = 10) for
meaningful analysis but were included in the total zooplankton analysis. Bold indicates statistical
significance (P < 0.05)
Between
pools
Within pool
Treatment
Block
Time
Treatment
× Time
Water change
experiment
df (1,21) No test (2,42) (2,42)
All zooplankton 44.53 36.52 17.44
(N = 7866) <0.0001 <0.0001 <0.0001
Cladocera 13.45 22.021 6.153
(N = 2442) 0.0014 <0.0001 0.0045
Copepoda 33.0 13.046 4.484
(N = 2294) <0.0001 <0.0001 0.0172
Ostracoda 4.593 0.021 0.733
(N = 132) 0.044 0.980 0.486
Rotifera 9.618 7.922 3.208
(N = 3005) 0.0054 0.0012 0.0505
Inoculation experiment df(1,17) (5,17) (1,22) (1,22)
All zooplankton 30.989 2.785 4.500 9.547
(N = 3579) <0.0001 0.0515 0.0454 0.0054
Cladocera 12.022 1.403 3.787 0.615
(N = 670) 0.0030 0.2729 0.0645 0.4414
Copepoda 8.151 3.167 1.512 7.580
(N = 2319) 0.0110 0.0335 0.2318 0.0116
Rotifera 6.396 0.056 1.339 1.459
(N = 580) 0.0216 0.9976 0.260 0.240

124
Table 5.6. F statistics and P values from repeated-measures ANOVAs for the inoculation
experiment: total beetle abundance, species richness, Dytiscidae, Hydrophilidae, and species
with N ≥ 75 in rank order of abundance by family (see Table 5.1). Bold indicates statistical
significance (P < 0.05)
Between pools Within pool
Treatment
df (1,17)
Block
(5,17)
Time
(6,132)
Treatment
× Time
(6,132)
Total abundance 9.796 23.334 47.569 1.866
0.0061 <0.0001 <0.0001 0.0913
Species richness 4.14 10.40 55.941 1.082
0.0578 0.0001 <0.0001 0.376
Dytiscidae 17.357 8.258 24.847 4.605
0.0006 0.0004 <0.0001 0.0002
Laccophilus fasciatus 9.773 6.601 23.502 5.419
0.0062 0.0014 <0.0001 <0.0001
Hydroporus rufilabris 34.02 20.81 4.948 1.482
<0.0001 <0.0001 0.0001 0.1892
Copelatus glyphicus 5.839 9.533 33.504 1.746
0.0272 0.0002 <0.0001 0.115
Hydrophilidae 1.279 21.990 42.995 1.038
0.274 <0.0001 <0.0001 0.404
Enochrus ochraceus 2.256 13.384 17.039 1.273
0.151 <0.0001 <0.0001 0.274
Tropisternus lateralis 0.845 23.785 12.566 0.578
0.371 <0.0001 <0.0001 0.747
Paracymus 0.127 19.425 7.932 0.979
0.726 <0.0001 <0.0001 0.442
Helochares maculicollis 0.214 13.341 14.576 0.146
0.649 <0.0001 <0.0001 0.99
Berosus infuscatus 0.203 11.114 22.022 0.097
0.658 <0.0001 <0.0001 0.997
Cymbiodyta chamberlaini 0.153 3.372 4.368 0.251
0.7003 0.0268 0.0005 0.9580
Enochrus pygmaeus 0.968 16.352 2.875 0.436
0.339 <0.0001 0.0115 0.8535

125
Table 5.7. PERMANOVA results for the inoculation experiment. The reduced number of
residual degrees of freedom in the dytiscid analyses is due to pools with 0 beetles, which cannot
be included in these analyses. Bold indicates statistical significance (P < 0.05)
Source
df
SS
Pseudo-F
P
Unique
permutations
Early
All beetles
Treatment
Block
Residuals
1
5
17
2026.3
21892
10371
3.3215
7.1769 0.012
0.001
999
998
Dytiscidae
Treatment
Block
Residuals
1
5
16
3714.9
21342
20003
2.9715
3.4142
0.024
0.001
999
998
Hydrophilidae
Treatment
Block
Residuals
1
5
17
812.0
19207
7795.9
1.7707
8.3868
0.141
0.001
999
999
Late
All beetles
Treatment
Block
Residuals
1
5
17
574.6
26174
15.689
0.6627
5.6724
0.729
0.001
998
997
Dytiscidae
Treatment
Block
Residuals
1
5
16
1848.6
24627
23679
1.2491
3.3282
0.293
0.002
999
999
Hydrophilidae
Treatment
Block
Residuals
1
5
17
296.1
25643
10177
0.4947
8.5673
0.751
0.001
998
999

126
Table 5.8. The 10 species contributing most to dissimilarity among beetle assemblages in the
inoculation experiment as determined by SIMPER. Contributions are broken down between
Inoculated and Control treatments and Early and Late sample groups (see methods). Species
listed in descending order of contributing percent. Average abundances are means of raw beetle
abundances in Early and Late groups, and contributing percent was calculated from square root
transformed data. ^ indicates Dytiscidae; bold indicates significantly higher colonization in
ANOVA.
Average abundance Contributing
Species Control Inoculated percent
Early
Tropisternus lateralis 11.00 12.00 11.05
Enochrus ochraceus 7.08 16.67 9.36
Helochares maculicollis 4.83 4.92 8.48
Laccophilus fasciatus^ 2.17 8.58 8.37
Paracymus 4.58 7.92 8.33
Hydroporus rufilabris^ 1.33 4.75 7.20
Laccophilus proximus^ 1.17 2.75 5.61
Berosus infuscatus 2.83 2.83 6.39
Enochrus pygmaeus 1.00 2.25 4.66
Tropisternus collaris 2.00 2.00 4.64
Late
Enochrus ochraceus 5.50 7.00 11.95
Tropisternus lateralis 4.75 2.33 11.62
Hydroporus rufilabris^ 1.58 3.00 8.90
Cymbiodyta chamberlaini 0.00 0.17 8.67
Paracymus 0.17 0.08 7.95
Helophorus linearis^ 1.33 1.42 7.82
Hydrocolus oblitus^ 0.83 0.92 6.49
Hydrocolus deflatus^ 0.50 0.92 5.12
Laccophilus fasciatus^ 0.83 0.33 5.04
Copelatus glyphicus^ 0.67 0.42 4.84

127
Figure 5.1. (a) Total beetle abundance, (b) species richness, (c) dytiscid abundance, and (d)
hydrophilid abundance, over time in Old and New pools in the water change experiment (means
± SE). First vertical line = start of water changes; second vertical line = end of water changes. N
indicates number of individuals represented in the corresponding graph, with P values for the
effect of Age (treatment) and the Age × Time interaction in the repeated measures ANOVA (full
results in Table 5.2).

128
Figure 5.2. Abundances of the 10 most numerous colonizing species over time in Old and New
pools in the water change experiment (means ± SE). First vertical line = start of water changes;
second vertical line = end of water changes. ^ indicates Dytiscidae. N indicates number of
individuals represented in the corresponding graph with P values below for the effect of Age
(treatment) and the Age × Time interaction in the repeated measures ANOVA (full results in
Table 5.2).

129
Figure 5.3. NMDS plots of (a) all beetles, (b) Dytiscidae, and (c) Hydrophilidae, in the water
change experiment. Points sorted by group and treatment, and outlined in minimum convex
polygons. Full PERMANOVA results are in Table 5.3.

130
Figure 5.4. Total zooplankton abundances over time in Old and New pools in the (a) water
change experiment, and in Inoculated and Control pools in the (b) inoculation experiment (means
± SE). Full ANOVA results are in Table 5.5.

131
Figure 5.5. Multiple regression of (a) dytiscids, (b) hydrophilids, (c) Copelatus glyphicus, and
(d) Paracymus from the water change experiment against total zooplankton abundances in New
and Old pools. Beetles were collected on 25 June and zooplankton on 22 June. Statistics are
summaries of multiple regression results with P values for effects of zooplankton abundance. ^
indicates Dytiscidae. N = total number of beetles for that sample date.

132
Figure 5.6. Multiple regression of (a) all beetles, (b) beetle species richness, (c) Laccophilus
proximus, and (d) Uvarus granarius from the water change experiment against total zooplankton
abundances in New and Old pools. Beetles were collected on 25 June and zooplankton on 22
June. Statistics are summaries of multiple regression results, with P values for effects of
zooplankton abundance. N = total number of beetles for that sample date.

133
Figure 5.7. Multiple regression of (a) all beetles, (b) beetle species richness, and (c) dytiscids
from the water change experiment against total zooplankton abundances in New and Old pools.
Beetles and zooplankton were both collected on 30 April. Statistics are summaries of multiple
regression results, with P values for effects of zooplankton abundance. N = total number of
beetles for that sample date.

134
Figure 5.8. Multiple regression of (a) all beetles, (b) beetle species richness, (c) hydrophilids,
and (d) Tropisternus lateralis from the water change experiment against total zooplankton
abundances in New and Old pools. Beetles were collected on 14 October and zooplankton on 16
October. Statistics are summaries of multiple regression results with P values for effects of
zooplankton abundance. No dytiscids (N = 13) were abundant enough for analysis on 14
October.

135
Figure 5.9. Abundances of (a) all colonizing beetles, (b) species richness, and (c) abundances of
dytiscids, (d) hydrophilids, (e,f) the two most abundant dytiscid species, and (g–j) the four most
abundant hydrophilid species over time in Inoculated and Control pools in the inoculation
experiment (means ± SE). ^ indicates Dytiscidae. N indicates number of individuals represented
in the corresponding graph, with P values below for the effect of Treatment and the Treatment ×
Time interaction in the repeated measures ANOVA (full results in Table 5.6).

136
Figure 5.10. NMDS plots for (a) all beetles, (b) Dytiscidae, and (c) Hydrophilidae in the
inoculation experiment. The box in (b) shows an inset of the data for clarity due to the outlier at
the left side of the figure. Points are sorted by group and treatment and outlined in minimum
convex polygons (outlier not included in (b)). Large block effects make it difficult to visualize
significant effects of treatment in these graphs (see Table 5.7).

137
Figure 5.11. Multiple regression of (a) dytiscids, (b) hydrophilids, (c) Laccophilus fasciatus, (d)
Tropisternus lateralis, (e) Hydroporus rufilabris, and (f) Paracymus against total zooplankton
abundances for beetles collected on 5 November and zooplankton collected on 7 November. (g)
is a regression of dytiscids and (h) of hydrophilids against total zooplankton abundances for
beetles collected on 19 November and zooplankton collected on 21 November. Statistics are
summaries of multiple regression results, with P values for effects of zooplankton abundance.
High R2 values are largely due to large, significant effects of block in the inoculation experiment.
^ indicates Dytiscidae. N indicates number of beetles for that sampling date.

138
Figure 5.12. Multiple regression of (a) all beetles, (b) beetle species richness, (c) Enochrus
ochraceus, (d) Helochares maculicollis, and (e) Tropisternus collaris from the inoculation
experiment against total zooplankton abundances in New and Old pools. Beetles were collected
on 5 November and zooplankton on 7 November. Statistics are summaries of multiple regression
results with P values for effects of zooplankton abundance. There were large, significant block
effects in all analyses in the inoculation experiment.

139
Figure 5.13. Multiple regression of (a) total beetle abundance, (b) beetle species richness, and
(c) Hydroporus rufilabris from the inoculation experiment against total zooplankton abundances
in New and Old pools. Beetles were collected on 19 November and zooplankton on 21
November. Statistics are summaries of multiple regression results with P values for effects of
zooplankton abundance. There were large, significant block effects in all analyses in the
inoculation experiment.

140
CHAPTER 6:
CONTEXT-DEPENDENT COLONIZATION DYNAMICS: REGIONAL REWARD
CONTAGION DRIVES LOCAL COMPRESSION IN AQUATIC BEETLES

141
ABSTRACT7
Habitat selection by colonizing organisms is an important factor in determining species
abundance and community dynamics at multiple spatial scales. Many organisms select habitat
patches based on intrinsic patch quality, but patches exist in complex landscapes linked by
dispersal and colonization, forming metapopulations and metacommunities. Perceived patch
quality can be influenced by neighboring patches through spatial contagion, wherein perceived
quality of one patch can extend beyond its borders and either increase or decrease the
colonization of neighboring patches and localities. These spatially-explicit colonization
dynamics can result in habitat compression, wherein more colonists occupy a patch or locality
than in the absence of spatial context dependence. Previous work on contagion/compression
focused primarily on the role of predators in driving colonization patterns. Our goal was to
determine whether resource abundance can drive multiscale colonization dynamics of aquatic
beetles through the processes of contagion and compression in naturally-colonized experimental
pools. We established two levels (high/low quality) of within-patch resource abundances (leaf
litter) using an experimental landscape of mesocosms, and assayed colonization by 35 species of
aquatic beetles. Patches were arranged in localities (sets of two patches), which consisted of a
combination of two patch-level resource levels in a 2 × 2 factorial design, allowing us to assay
colonization at both locality and patch levels. We demonstrate that patterns of species abundance
7 A modified version of this chapter was published as this article:
Pintar, M.R., and W.J. Resetarits, Jr. 2017. Context-dependent colonization dynamics: regional reward contagion
drives local compression in aquatic beetles. Journal of Animal Ecology 86:1124–1135.

142
and richness of colonizing aquatic beetles are determined by patch quality and context-dependent
processes at multiple spatial scales. Localities that consisted of at least one high quality patch
were colonized at equivalent rates that were higher than localities containing only low quality
patches, displaying regional reward contagion. In localities that consisted of one high and one
low quality patch, reward contagion produced by higher leaf litter levels resulted in greater
abundance of beetles in such localities, which then compressed into the highest quality patches.
Our results provide further support for the critical roles of habitat selection and spatial context,
particularly the quality of neighboring habitat patches, in generating patterns of species
abundances and community structure across landscapes.

143
INTRODUCTION
Identifying the mechanisms that generate patterns of biodiversity is a central goal in
ecology (Chesson 2000), and differential rates of colonization and extinction are key components
of these patterns (MacArthur and Wilson 1967; Wellborn et al. 1996; Shurin and Allen 2001).
Habitat selection, where colonizing organisms select habitat patches (see definitions in Table
6.1) based on perceived quality (Fig. 6.1), is a critical driver of patterns of species abundance and
community structure within habitat patches and across landscapes (Binckley and Resetarits 2005;
Resetarits and Binckley 2009; Vonesh et al. 2009; Kraus and Vonesh 2010). Patch quality is
simply patch-specific fitness, thus patch colonization rates would be predicted to match variation
in patch quality, maximizing expected fitness (Fretwell and Lucas 1970; Pulliam and Danielson
1991; Resetarits 1996; Morris 2003). Patch quality is well-established as a determinant of patch
colonization, occupancy, and community structure in many systems (Fretwell and Lucas 1970;
Pulliam and Danielson 1991; Thompson and Pellmyr 1991; Kiflawi et al. 2003; Resetarits and
Binckley 2013).
Many ecological processes and mechanisms generating patterns of species distributions
are dependent on spatial scales beyond the level of a single habitat patch, making it necessary to
link processes at multiple spatial scales across a landscape (Kareiva and Wennergren 1995;
Abteilung 1997; Gustafson 1998; Wiegand et al. 1999). These processes are affected by habitat
arrangement, diversity, and availability, which contribute to variation in landscape structure

144
Table 6.1. Definitions of key terms
Term Definition
Patch A single habitat or patch in habitat selection literature (Fretwell and Lucas
1970; Rosenzweig 1981; Leibold et al. 2004). Processes that occur within a
patch occur at the patch scale. In our experiment patch is equivalent to a single
pool, which contains one habitat type.
Locality A geographical area containing multiple patches; a nested subset of all the
patches in a larger region (Leibold et al. 2004). Nearest neighbor distances are
smaller among patches within a locality than among patches at the scale of the
region. Processes that occur within localities occur at the local scale. In our
experiment a locality consists of two patches.
Region Equivalent of an experimental array (Leibold et al. 2004). Contains multiple
localities with greater spatial separation than among individual patches within a
locality. Processes that occur within regions (among localities) occur at the
regional scale. One region consists of six localities in our experiment;
equivalent to block.
Landscape An area that is spatially heterogeneous in at least one factor of interest (Forman
1995; Turner et al. 2001). In our experiment we consider the landscape to be
our entire study site, encompassing all regions, the terrestrial matrix, and
surrounding habitats. Processes and patterns that occur among regions occur at
the landscape scale (i.e. block effects).
Contagion The effect of characteristics of nearby patches on the perceived quality of a
given focal patch or the entire locality – this can be either negative (risk
contagion) or positive (reward contagion) (Resetarits et al. 2005).
Compression An increase in the colonization rate of preferred patches/localities resulting
from a reduction in the availability of preferred patches/localities through either
changes in actual quality or perceived quality (Resetarits et al. 2005; Resetarits
and Silberbush 2016)
(Andrén 1994; Gustafson 1998; Steffan-Dewenter et al. 2002). Traditional views of animal
decision making and habitat choice in the context of concepts such as optimal foraging and
rationality theory were that each option in a landscape had a value independent of other options
(Stephens and Krebs 1986; Shafir et al. 1993). However, animals are unlikely to independently
assign fixed values to each option, as the perceived value is often dependent on other available
options or prior information, resulting in context-dependent valuation (Houston 1997; Shafir et
al. 2002; Freidin and Kacelnik 2011). Context-dependent choices across multiple scales in

145
landscapes have the potential to affect individual fitness, population dynamics, and community
interactions (Kareiva and Wennergren 1995; Houston 1997).
Thus, although perceived patch quality has traditionally been viewed as an intrinsic
quality (Fretwell and Lucas 1970; Morris 2003), an organism’s ability to accurately assess patch
quality, or the actual quality itself, can be affected by spatial context; clustering of habitat
patches of different quality alter colonization rates of individual patches or localities (Resetarits
et al. 2005; Resetarits 2005; Resetarits and Binckley 2009; Hughey et al. 2012; Wesner et al.
2012; Resetarits and Silberbush 2016). This process is termed spatial contagion, which occurs
when the perceived quality of a habitat patch or locality is influenced by the quality of
neighboring or constituent patches, respectively (Fig. 6.1c,d) (Resetarits et al. 2005; Resetarits
2005). In this context, colonization of predator-free patches that are in close proximity to
predator patches is greatly reduced compared to colonization of predator-free patches distant
from any predator patches (Resetarits and Binckley 2009). Decreased colonization of predator-
free patches associated with predator patches is an example of risk contagion (Fig. 6.1c)
(Resetarits 2005), wherein proximity to predator-occupied patches presents an inherent risk if
predators are able to move between patches (Pyke 1984; Lima and Dill 1990; Brown 1999).
While much of the work on contagion has focused on the effects of predation risk, contagion also
occurs when the presence of high quality patches increases the colonization of neighboring
patches, generating reward contagion (Fig. 6.1d) (Hughey et al. 2012).

146
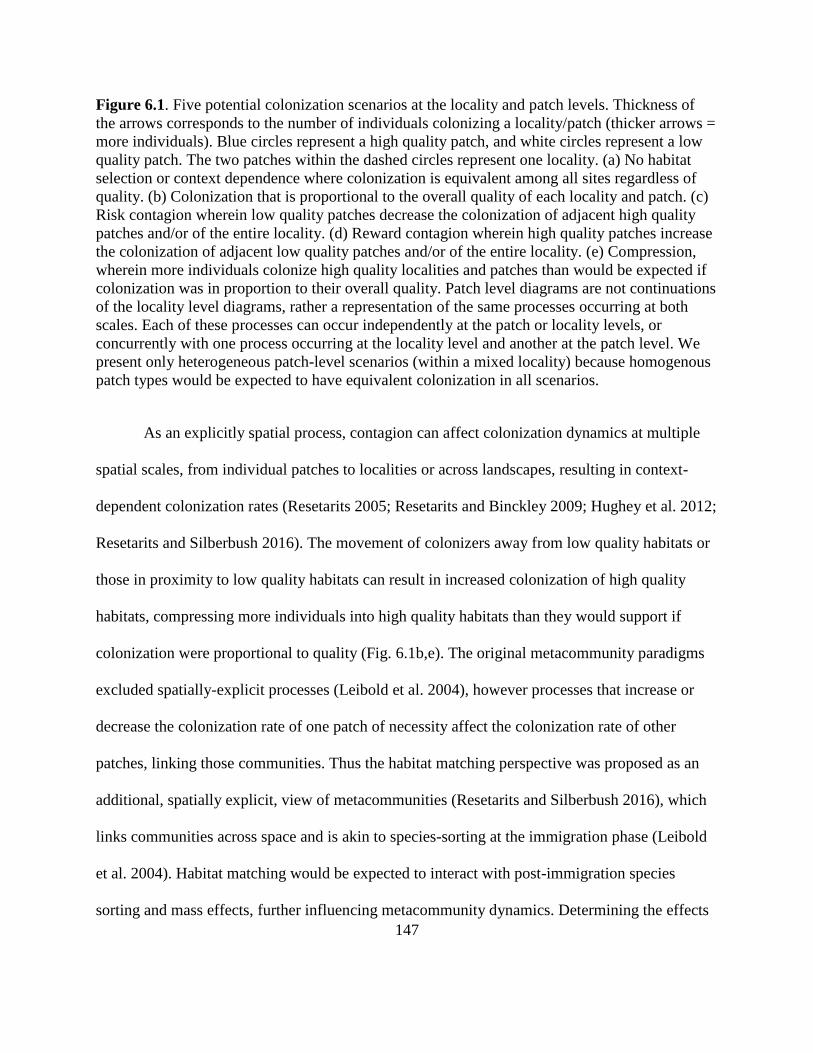
147
Figure 6.1. Five potential colonization scenarios at the locality and patch levels. Thickness of
the arrows corresponds to the number of individuals colonizing a locality/patch (thicker arrows =
more individuals). Blue circles represent a high quality patch, and white circles represent a low
quality patch. The two patches within the dashed circles represent one locality. (a) No habitat
selection or context dependence where colonization is equivalent among all sites regardless of
quality. (b) Colonization that is proportional to the overall quality of each locality and patch. (c)
Risk contagion wherein low quality patches decrease the colonization of adjacent high quality
patches and/or of the entire locality. (d) Reward contagion wherein high quality patches increase
the colonization of adjacent low quality patches and/or of the entire locality. (e) Compression,
wherein more individuals colonize high quality localities and patches than would be expected if
colonization was in proportion to their overall quality. Patch level diagrams are not continuations
of the locality level diagrams, rather a representation of the same processes occurring at both
scales. Each of these processes can occur independently at the patch or locality levels, or
concurrently with one process occurring at the locality level and another at the patch level. We
present only heterogeneous patch-level scenarios (within a mixed locality) because homogenous
patch types would be expected to have equivalent colonization in all scenarios.
As an explicitly spatial process, contagion can affect colonization dynamics at multiple
spatial scales, from individual patches to localities or across landscapes, resulting in context-
dependent colonization rates (Resetarits 2005; Resetarits and Binckley 2009; Hughey et al. 2012;
Resetarits and Silberbush 2016). The movement of colonizers away from low quality habitats or
those in proximity to low quality habitats can result in increased colonization of high quality
habitats, compressing more individuals into high quality habitats than they would support if
colonization were proportional to quality (Fig. 6.1b,e). The original metacommunity paradigms
excluded spatially-explicit processes (Leibold et al. 2004), however processes that increase or
decrease the colonization rate of one patch of necessity affect the colonization rate of other
patches, linking those communities. Thus the habitat matching perspective was proposed as an
additional, spatially explicit, view of metacommunities (Resetarits and Silberbush 2016), which
links communities across space and is akin to species-sorting at the immigration phase (Leibold
et al. 2004). Habitat matching would be expected to interact with post-immigration species
sorting and mass effects, further influencing metacommunity dynamics. Determining the effects

148
of these complex context-dependent spatial processes is critical for understanding how
metacommunities function (Wilson 1992; Resetarits et al. 2005; Logue et al. 2011).
A fundamental component of patch quality that contributes to metacommunity dynamics
is resource availability, as it affects species abundances, diversity, and species interactions within
habitat patches and across metacommunities (Huston and DeAngelis 1994; Polis et al. 1997;
Fukami and Morin 2003; Cadotte et al. 2006; Marcarelli et al. 2011). In many aquatic systems,
inputs of terrestrial leaf litter provide nutrients that drive ecosystem productivity, supporting
higher abundances of primary producers and consumers than autochthonous resources can
produce alone (Minshall 1967; Anderson and Sedell 1979; Stoler and Relyea 2013). Determining
the spatial dynamics of how resource availability affects colonization decisions in individual
patches, and how resource levels within one patch interact with those of neighboring patches, are
important to understanding community assembly and patterns of species abundance and richness.
Aquatic beetles are an excellent system in which to study habitat selection and
community dynamics, as they readily colonize experimental mesocosms, exhibit selective habitat
preferences in the context of both risk and reward, and form highly diverse assemblages of
species that vary widely in their size, morphology, life history, and trophic position (Fairchild et
al. 2000; Resetarits 2001; Binckley and Resetarits 2005; Batzer and Palik 2007; Merritt et al.
2008; Resetarits and Pintar 2016). Dispersing/colonizing aquatic beetles have multiple sensory
capabilities they use when locating and assessing habitat patches, although these capabilities are
poorly understood (Bilton 2014). Experimental work shows that these abilities enable beetles to
assess habitat availability and quality across a range of scales from landscapes of > 100 m to
habitat patches separated by less than a meter (Bilton et al. 2001; Resetarits and Binckley 2009;

149
Bilton 2014; Pintar and Resetarits 2017a,b).
Greater inputs of leaf litter support higher primary and secondary productivity, including
periphyton and zooplankton, which are primary food sources for both omnivorous and
predaceous aquatic beetles, respectively (Leibold 1999; Williams 2005; Merritt et al. 2008).
While many aquatic beetle taxa do not directly consume leaf litter, they do exhibit preferences
when selecting habitats based leaf litter quality or other patch characteristics that vary with leaf
litter (Pintar and Resetarits 2017a). We manipulated resource levels (leaf litter) at the patch scale
and formed localities from combinations of patches (Fig. 6.2) that varied in quality to examine
the effects of resource availability on colonization dynamics of aquatic beetles in a landscape
context.
We tested three competing hypotheses at both the locality and patch levels, along with
the null hypothesis of no habitat selection (Fig. 6.1a). Our first hypothesis was that no spatial
processes influenced colonization, with colonization proportional to overall patch/locality quality
(Fig. 6.1b). We also hypothesized that in spatially context-dependent scenarios, reward
contagion (Fig. 6.1d) could result if high quality patches increased the colonization of adjacent
lower quality patches or of mixed localities. Lastly, compression (Fig. 6.1e) of high quality
patches/localities could occur if beetles disproportionally colonized the highest quality
patches/localities. Each of these four hypotheses can occur independently at either the patch or
locality scales, but processes at one scale can certainly influence colonization processes at the
other scale. Risk contagion (Fig. 6.1c) was excluded as an alternative as our low quality patches
presented no strong risk to colonizers, such as that of predation.

150
MATERIALS AND METHODS
We conducted a mesocosm field experiment in a naturally colonized experimental
landscape at UMFS. Each pool (plastic wading pools: 1 m diameter, 0.2 m deep, 110 L, N = 48)
constituted a single habitat patch, and were arranged in pairs, forming localities (Table 6.1, Fig.
6.2). Mesocosms were established in fields at UMFS on 20 May 2014 and filled with water from
nearby ponds, filtered through 1.13-mm screen. We added dry hardwood leaf litter (primarily
Quercus spp.) to form a resource base and set the patch-level treatment differences. Patch-level
resource abundances were either 1 kg leaf litter (High) or 0.25 kg leaf litter (Low), representing a
range of leaf litter abundances commonly seen in small, ephemeral pools. Although we only
manipulated leaf litter abundance, it served as a nutrient base in our pools that spurred primary
and secondary productivity, including likely supporting larger amounts of periphyton,
zooplankton, and larval stages of other insects that are all food sources for adult beetles (Leibold
1999; Merritt et al. 2008; Culler et al. 2014).
Pools were established in four regions (spatial blocks) separated by > 40 m, with two
blocks in each of two fields. Each region consisted of 12 pools arranged in a linear arrangement
of 6 localities, with 2 pools at each locality (Fig. 6.2). Localities were separated by 9 m, and
patches within each locality were separated by 0.5 m (edge-to-edge). The locality-level
separation of 9 m is the maximum we could achieve given space limitations, but within the scale
that habitat selection has been observed by colonization aquatic beetles (Resetarits and Binckley

151
Figure 6.2. Schematic of one region (block). White circles indicate Low quality pools with 0.25
kg leaf litter; blue circles indicate High quality pools with 1 kg leaf litter. Each individual pool
was considered one patch. Two pools separated by 0.5 m constituted a locality. Localities were
separated by 9 m. Each block consisted of 12 pools (patches) in six localities (two replicates of
each locality-level treatment) arranged in a line. The exact linear order of localities varied by
block, but each locality was always adjacent to only one locality of each of the other two locality
types. Figure is drawn approximately to scale.
2013). Localities consisted of either two Low patches (Low locality), two High patches (High
locality), or one Low patch and one High patch (Mixed locality). Spatial arrangement of patches
and localities were systematically arranged to vary the position of locality-level treatments
within each region such that each locality did not border another locality of the same treatment
and each locality type occurred at the end of a region at least twice. Each locality-level treatment
(Low, Mixed, High) had eight replicates (N = 8). The four patch-level treatments consisted of a
combination of resource levels in each patch (Low, High) and locality-level treatment (Low,
Mixed, High). These four patch level treatments were: Low patch in Low locality (Low/Low, N
= 16), Low patch in Mixed locality (Low/Mixed, N = 8), High patch in Mixed locality
(High/Mixed, N = 8), High patch in High locality (High/High, N = 16).
Pools were covered with window screening (1.3 mm2, 1.13 mm opening) that was
initially kept above the water surface to prevent colonization while allowing for the development
of zooplankton and periphyton communities within the pools. We opened pools to colonizing
insects on 10 June by depressing the screens below the water surface, which allowed colonizing

152
insects to enter the pools while maintaining separation from the leaf litter. We collected all
colonizing adult insects without replacement weekly until 8 July, after which the experiment was
terminated. A diverse assemblage of aquatic beetles has been recorded at UMFS (115 species),
94 of which have been collected from our mesocosms (unpublished data). We preserved all
beetles in ethanol and identified them to species, with the exception of the genus Paracymus,
which were identified to genus.
Data analysis
Abundances of colonizing beetles were summed across the duration of the experiment for
each patch, and the two patches within each locality were summed for locality-level analyses.
We conducted three analyses on our data: (1) a primary 2 × 2 factorial ANOVA on patch level
responses, (2) locality level ANOVAs, and (3) ANOVAs on colonization differences between
patches in the same locality. In analyses 1 and 2, we conducted separate ANOVAs on each of
our response variables: beetle abundance (of all beetles), beetle species richness (rarefied), and
abundances of Dytiscidae, Hydrophilidae, and species with total abundances greater than 75
individuals. Because one species (Copelatus glyphicus, Dytiscidae) accounted for 70.6% of all
beetles and 82.4% of dytiscids collected, we also analyzed the abundances of all beetles and
Dytiscidae with this species excluded.
Our primary analysis (1) consisted of a 2 × 2 ANOVA on block, the effects of Focal
patch (Low, High), Adjacent patch (Low, High), and their interaction. For analyses with
interactions with P < 0.10, we followed with a Fisher's Protected LSD (α = 0.05) on the full
design. For Locality-level effects (2), we analyzed how colonization varied using ANOVA with
locality-level treatment (Low, Mixed, High) and block as factors. In our final analysis (3), we

153
compared colonization differences between pools in the same locality by taking the absolute
value of the difference in total beetle colonization and species richness between these two pools.
We then analyzed the differences in beetle abundance and species richness (not rarefied) with
two separate ANOVAs that included locality-level treatment and block as factors. All of our
analyses consisted of separate ANOVAs with type III SS with α = 0.05, and block was rolled
into the error term when P > 0.25. Treatment means in analyses 2 and 3 were compared using
Fisher’s Protected LSD only when the main effect of Treatment had P < 0.10, using α = 0.05 for
individual LSD comparisons. All analyses, except rarefied species richness, used square root
transformed count data (√𝑋 + 0.5) and were conducted in R v. 3.3.2 (R Core Team 2016) and
SAS v. 9.3 (SAS Institute 2011). Data are available in the Dryad Digital Repository (Pintar and
Resetarits 2017c).

154
RESULTS
Our experiment was colonized by 3181 beetles from 35 species in 3 families, including 4
species with abundances > 75 (Table 6.2). Pools were also colonized by limited numbers of
hemipterans (N = 73, 6 genera), but all were below our analysis threshold. In (1) our 2 × 2 patch
level analysis we observed significant or marginal interactions between Focal and Adjacent
patches and significant main effect in all analyses except species richness, which only had a
significant effect of Focal patch. Analyses of the four abundant species had a significant
interaction and main effect of Focal patch, with a marginal effect of Adjacent patch (Table 6.3).
We (2, 3) observed significant effects of treatment in all analyses at both the locality and patch
levels (Table 6.3; Figs. 6.3, 6.4). There were significant block effects in all analyses except for
those of species richness and Enochrus ochraceus. Rarefied species richness was significantly
affected by the quality of the Focal patch but not the Adjacent patch (Table 6.3) and was equally
high in High and Mixed localities (Fig. 6.3c, d).

155
Table 6.2. Species and abundances of colonizing beetles
Taxa Abundance Taxa Abundance
Dytiscidae 2726 Hydrophilidae 419
Acilius fraternus 1 Berosus aculeatus 1
Celina angustata 3 Berosus infuscatus 54
Celina hubbelli 4 Berosus striatus 3
Copelatus chevrolati 21 Cymbiodyta chamberlaini 8
Copelatus glyphicus 2246 Cymbiodyta vindicata 28
Desmopachria convexa 3 Enochrus consors 1
Hydaticus bimarginatus 11 Enochrus hamiltoni 4
Hydroporus rufilabris 1 Enochrus ochraceus 102
Ilybius biguttulus 1 Enochrus perplexus 13
Ilybius gagates 1 Enochrus sayi 1
Laccophilus fasciatus 347 Helochares maculicollis 9
Laccophilus proximus 54 Hydrochara soror 5
Mediorhantus calidus 13 Hydrochara spangleri 1
Neobidessus pullus 2 Paracymus 59
Thermonectus basillaris 9 Tropisternus blatchleyi 6
Uvarus granarius 5 Tropisternus collaris 43
Uvarus lacustris 4 Tropisternus lateralis 81
Haliplidae 36
Peltodytes muticus 36
At the locality level, abundances of all beetles, species richness, families, and individual
species were all largely consistent: colonization was not significantly different between High and
Mixed localities, but these two locality types each had significantly greater colonization than
Low localities (Figs. 6.3, 6.4, 6.58). Except for species richness, in all analyses at the patch level
colonization of High patches in Mixed localities (High/Mixed) was significantly greater than all
other patch types, including High patches in High localities (High/High) (Figs. 6.3, 6.4).
Colonization of Low/Mixed patches did not differ significantly from Low/Low patches, but was
significantly lower than High/High patches in most analyses (not in C. glyphicus or T. lateralis;
Fig. 6.4b, i). Analyses of all Dytiscidae, Hydrophilidae, and beetle abundance and dytiscid
8 Figures 6.5 and 6.6 appear in Appendix C at the end of the chapter.

156
abundance that excluded C. glyphicus had the same results and patterns as the analyses that
included C. glyphicus (Table 6.1, Fig. 6.6), so we present only figures for abundances of all
beetles (Fig. 6.3). In comparisons of colonization differences between adjacent pools, differences
in colonization were significantly greater in Mixed localities than in Low or High localities,
which did not differ from each other, for both total beetle abundance (F2,21 = 14.12, P = 0.0001)
and species richness (F2, 21 = 4.11, P = 0.0311) (Fig. 6.6).
Figure 6.3. Abundances per locality (left) and per patch (right) for all beetles (a, b) and species
richness (c, d) (means ± SE). Patches consisted of either Low (0.25 kg) or High (1 kg)
abundances of leaf litter. Locality level treatments consisted of two Low patches (Low locality),
two High patches (High locality), or one Low and one High patch (Mixed locality). Treatments
on patch figures consisted of patch level treatment/locality level treatment.

157
Figure 6.4. Abundances per locality (left) and per patch (right) for species with abundances >
75: Copelatus glyphicus (e, f), Laccophilus fasciatus (g, h), Enochrus ochraceus (i, j), and
Tropisternus lateralis (k, l) (means ± SE). Patches consisted of either Low (0.25 kg) or High (1
kg) abundances of leaf litter. Locality level treatments consisted of two Low patches (Low
locality), two High patches (High locality), or one Low and one High patch (Mixed locality).
Treatments on patch figures consisted of patch level treatment/locality level treatment.

158
Table 6.3. ANOVA results for locality and patch level analyses (Figs. 6.3, 6.4).
Locality Patch
SS df F P SS df F P
All beetles
Block 68.77 3 6.27 0.0042 Block 72.05 3 10.40 <0.0001
Treatment 73.14 2 10.00 0.0012 Focal 129.16 1 55.94 <0.0001
Residuals 65.82 18 Adjacent 14.11 1 6.11 0.0177
Focal:Adj 20.81 1 9.01 0.0045
Residuals 94.67 41
All beetles without C. glyphicus
Block 20.46 3 5.90 0.0055 Block 21.60 3 9.15 <0.0001
Treatment 43.66 2 18.89 <0.0001 Focal 74.41 1 94.61 <0.0001
Residuals 20.80 18 Adjacent 6.68 1 8.49 0.0058
Focal:Adj 8.13 1 10.33 0.0025
Residuals 32.25 41
Dytiscidae
Block 68.26 3 6.00 0.0051 Block 69.01 3 9.40 <0.0001
Treatment 53.95 2 6.98 0.0057 Focal 91.75 1 37.49 <0.0001
Residuals 68.27 18 Adjacent 9.50 1 3.88 0.0555
Focal:Adj 17.01 1 6.98 0.0116
Residuals 100.33 41
Dytiscidae without C. glyphicus
Block 25.29 3 6.94 0.0027 Block 22.29 3 10.11 <0.0001
Treatment 19.90 2 8.19 0.0030 Focal 31.13 1 42.38 <0.0001
Residuals 21.86 18 Adjacent 1.27 1 1.73 0.1963
Focal:Adj 4.63 1 6.31 0.0161
Residuals 30.12 41
Hydrophilidae
Block 6.46 3 7.30 0.0021 Block 7.80 3 9.37 <0.0001
Treatment 22.74 2 38.50 <0.0001 Focal 40.73 1 146.74 <0.0001
Residuals 5.31 18 Adjacent 5.07 1 18.25 0.0001

159
Focal:Adj 4.27 1 15.38 0.0003
Residuals 11.38 41
Species richness (rarefied)
Treatment 0.88 2 4.43 0.0248 Focal 0.26 1 11.65 0.0014
Residuals 2.07 21 Adjacent 0.01 1 0.57 0.4561
Focal:Adj 0.00 1 0.03 0.8577
Residuals 0.98 44
Copelatus glyphicus
Block 50.17 3 5.05 0.0103 Block 50.32 3 6.85 0.0008
Treatment 35.85 2 5.41 0.0144 Focal 62.59 1 25.55 <0.0001
Residuals 59.59 18 Adjacent 7.61 1 3.11 0.0854
Focal:Adj 12.71 1 5.19 0.0280
Residuals 100.44 41
Laccophilus fasciatus
Block 25.56 3 13.33 <0.0001 Block 22.25 3 14.46 <0.0001
Treatment 13.52 2 10.57 0.0009 Focal 24.32 1 47.40 <0.0001
Residuals 11.51 18 Adjacent 1.79 1 3.49 0.0690
Focal:Adj 2.23 1 4.35 0.0434
Residuals 21.03 41
Enochrus ochraceus
Treatment 6.88 2 15.01 <0.0001 Focal 7.91 1 38.23 <0.0001
Residuals 4.81 21 Adjacent 0.80 1 3.89 0.0550
Focal:Adj 2.11 1 10.18 0.0026
Residuals 9.10 44
Tropisternus lateralis
Block 4.47 3 4.90 0.0116 Block 4.07 3 7.75 0.0003
Treatment 3.94 2 6.48 0.0076 Focal 4.55 1 25.97 <0.0001
Residuals 5.47 18 Adjacent 0.50 1 2.87 0.0979
Focal:Adj 1.16 1 6.60 0.0140
Residuals 7.19 41
160
DISCUSSION
By connecting species interactions across multiple spatial scales, metacommunity
ecology has greatly contributed to understanding the mechanisms that generate species
distributions and maintain biodiversity (Chesson 2000; Leibold et al. 2004; Grainger and Gilbert
2016). In this context, the direct, non-lethal effects of habitat selection can play as strong or
stronger role in creating species distributions than direct, lethal effects (Vonesh et al. 2009;
Resetarits and Silberbush 2016). Here we expand the role of habitat selection and our
understanding of spatial processes creating linkages across multiple spatial scales, documenting
the effects of local habitat compression generated by regional reward contagion (Table 6.1, Fig.
6.1).
At the regional scale, colonizing beetles selected localities containing High patches at
equivalent rates, regardless of whether those localities contained one or two High patches (Fig.
6.3). Localities that contained two Low patches were colonized at significantly lower rates than
those Mixed and High localities. If beetles selected localities based on the overall, combined
quality of the two patches at each locality, we would expect colonization rates of Mixed
localities to be intermediate between Low and High localities (Fig. 6.1b). Equal colonization of
Mixed and High localities indicates that presence of a single High patch overrides the presence
of a Low patch, producing regional reward contagion (Fig. 6.1d). We did not observe risk
contagion at any scale, as our Low patches, while lower in quality, did not negatively impact the
161
perceived quality of High patches (Fig. 6.1c). Beetles were conceivably able to move between
patches during the seven days between collections, however, such secondary dispersal would
form part of the colonization process, prior to beetles finally settling in a patch.
Higher than expected colonization at the regional scale in Mixed localities did not result
in reward contagion at the local scale in Low/Mixed patches. Under local reward contagion the
proximity of Low/Mixed patches to High/Mixed patches should result in greater colonization of
Low/Mixed patches than Low/Low patches (Fig. 6.1d). Low/Mixed patches were colonized at
rates equivalent to Low/Low patches, and significantly lower than High/High patches in all but
two analyses (Figs. 6.3, 6.4). At the local scale within Mixed localities, beetles preferentially
colonized High patches over Low patches. The combined effects of regional reward contagion
and preferential colonization of High patches resulted in High/Mixed patches received
significantly more colonizing beetles than any other patch type. Beetles were compressed into
High/Mixed patches resulting in significantly greater colonization than would be expected if the
quality of both patches were equivalent, hence local compression (Fig. 6.1e).
At the regional scale, beetles perceived High and Mixed localities as equivalent. This
misperception at the regional scale of the true overall quality of Mixed localities resulted in the
compression of beetles into High/Mixed patches at the local scale. This compression could result
in density-dependent intra- or interspecific competition or density-dependent movements of
individuals among patches or localities. However, lack of local reward contagion in Low/Mixed
patches indicates little or no density-dependent secondary dispersal (sensu the ideal free
distribution; Fretwell and Lucas 1970). If density-dependence was a factor, we would have
expected spillover from the patches with the most colonizers (High/Mixed) into the adjacent

162
patches (Low/Mixed) (Shmida and Wilson 1985). The equivalence of Low patches (and lack of
local reward contagion) may be due to a limit on the number of individuals Low patches could
support. Compression in High/Mixed patches suggests that colonization of High patches was not
limited by patch quality, but rather by the number of beetles dispersing across the landscape,
though our study occurred during peak annual dispersal of aquatic beetles at UMFS.
The responses of four abundant species, as well as the overall abundances of species in
the families Dytiscidae and Hydrophilidae, were nearly identical with respect to variation in
resource abundance at both the local and regional scales (Figs. 6.3, 6.4, 6.5). The observed
patterns of regional reward contagion and local compression stress the importance of habitat
selection and spatial context-dependence in determining local and regional abundances of these
species. Overall, we observed regional contagion with equally high numbers of species in High
and Mixed localities, significantly more than were in Low localities (Fig. 6.3c). However, we did
not observe local compression for species richness, as the numbers of species in High/Mixed and
High/High patches were statistically equivalent (Fig. 6.3d). Nevertheless, the spatially-explicit
process of contagion produced locally and regionally different patterns of species richness,
which itself can affect metacommunity dynamics through variation in species interactions
(Wilson 1992; Leibold et al. 2004; Resetarits et al. 2005).
Aquatic beetles occupy diverse trophic positions, have diverse morphologies and life
histories, and often have unique colonization responses to a variety of factors (Merritt et al.
2008; Culler et al. 2014; Resetarits and Pintar 2016; Pintar and Resetarits 2017a,b). Thus, it is
noteworthy that we observed consistent responses across our four abundant species, which
included both dytiscids, which have predaceous adults and larvae, and hydrophilids, which have

163
omnivorous adults and predaceous larvae. Leaf litter acts as a nutrient base that spurs primary
and secondary productivity, including organisms that beetles feed on, such as zooplankton,
periphyton, and other insect larvae (Leibold 1999; Merritt et al. 2008; Culler et al. 2014). We do
not have abundance data for any other taxa, so we can only speculate as to the proximal cues
used to assess patch quality in this study, and we did not notice any accumulation of larvae over
the course of the experiment.
Colonization decisions of aquatic beetles are particularly critical as they select habitats
for both themselves and their offspring (Layton and Voshell 1991; Bilton 2014). Poor
colonization decisions have fitness consequences for the adults as once initial colonization is
complete secondary dispersal rarely occurs (Zera and Denno 1997). This is due to the oogenesis-
flight syndrome in which individuals disperse early in their adult life, soon after pupation, before
autolyzing flight muscles to provide energy for reproduction (Hocking 1952; Jackson 1952;
Johnson 1969; Bilton 1994, 2014). The greater colonization High/Mixed patches means that both
adults and their offspring in these systems could experience greater competition for resources
than in High/High patches. This is further compounded among larvae by their propensity for
cannibalism, although evidence for competition for food among adults is limited (Juliano and
Lawton 1990; Culler et al. 2014). Thus, for some species, the habitat matching perspective of
metacommunity dynamics may be much more important than other perspectives, such as mass
effects and species sorting, as movement from patches after colonization is unlikely and sorting
at the immigration stage may preempt post-colonization sorting (Leibold et al. 2004; Resetarits
and Silberbush 2016). The diverse assemblages formed by aquatic beetles present a great
opportunity for further investigation into factors generating patterns of species diversity across

164
landscapes.
Local contagion can result from both risk and reward in a diverse set of organisms,
including treefrogs, beetles, dragonflies, frogflies, and mosquitoes (Resetarits and Binckley
2009, 2014; Hughey et al. 2012; Wesner et al. 2012; Resetarits and Silberbush 2016), and
regional compression resulting from local risk contagion has recently been documented in
mosquitoes (Resetarits and Silberbush 2016). We expect contagion and compression occurs at
multiple spatial scales and in the context of both risk and reward, across many taxa. While our
experimental landscape may have produced results more extreme than those in natural systems,
experimental analyses such as this are necessary to identify processes that are difficult to detect
in more variable natural systems. However, our experiment was not unrealistic, as natural pools
in our system can be quite small, are commonly separated by very small distances, and have
large variation in the range of litter or other nutrients.
Our experiment has shown that regional reward contagion can lead to local compression,
thereby expanding the realm of known scales on which these two processes operate. We would
expect contagion and compression to be common across landscapes, but additional work on a
variety of species at different spatial scales is necessary to determine the frequency and intensity
of such effects, as well as how they may interact with other processes structuring communities.
Concepts such as the ideal free distribution and optimal foraging theory, and the
extensive body of work conducted around them, have provided a considerable foundation upon
which the link between habitat selection and metacommunity ecology has been constructed
(Fretwell and Lucas 1970; Werner and Hall 1974; Charnov 1976; Lima and Dill 1990; Pulliam
and Danielson 1991; Morris 2003; Leibold et al. 2004; Resetarits et al. 2005). Effects on local

165
and regional patterns of species distribution and abundance are generated by a variety of factors
and processes that interact to produce patch-specific colonization rates (Abrams et al. 2007).
While not ignored, spatial context has been an underserved component of many of the theories
that unpin these broader concepts. Spatially-explicit, context dependent processes such as
contagion and compression inherently affect metacommunity dynamics by shifting patterns of
colonization among patches and localities. Thus, habitat selection, which is based on the ability
of organisms to accurately assess patch quality at the colonization stage, and other spatially-
explicit processes, are critical drivers of patterns of individual species abundances and
community composition. Context-dependent colonization may break down the relationship
between perceived and actual patch quality, adding further complexity to the mechanisms
driving variation in patch-specific colonization rates and landscape scale patterns. Our
understanding of the role of spatial dynamics and context-dependence, as well the actual
importance of such processes, will likely only increase, particularly as habitats and landscapes
altered by anthropogenic activities reveal preference/performance mismatches. Full integration
of the myriad theories that form the science of ecology is incomplete and a lofty goal, but even a
piece by piece melding of individual components provides a more comprehensive view of how
the world works.

166
LIST OF REFERENCES
167
Abrams, P.A., R. Cressman, and V. Krivan. 2007. The role of behavioral dynamics in
determining the patch distributions of interacting species. The American Naturalist 169:
505–518.
Abteilung, K.B.-G. 1997. Determinants of avian species richness at different spatial scales.
Journal of Biogeography 24:49–60.
Anderson, N.H., and J.R. Sedell. 1979. Detritus processing by macroinvertebrates in stream
ecosystems. Annual Review of Entomology 24:351–377.
Andrén, H. 1994. Effects of habitat fragmentation on birds and mammals in landscapes with
different proportions of suitable habitat: a review. Oikos 71:355–366.
Batzer, D.P., and B.J. Palik. 2007. Variable response by aquatic invertebrates to experimental
manipulations of leaf litter input into seasonal woodland ponds. Fundamental and
Applied Limnology 168:155–162.
Bilton, D.T. 1994. Phylogeography and recent historical biogeography of Hydroporus
glabriusculus Aubé (Coleoptera: Dytiscidae) in the British Isles and Scandinavia.
Biological Journal of the Linnean Society 51:293–307.
Bilton, D.T. 2014. Dispersal in Dytiscidae. Ecology, Systematics, and the Natural History of
Predaceous Diving Beetles (Coleoptera: Dytiscidae) (ed D.A. Yee), pp. 387–407.
Springer, New York.
Bilton, D.T., J.R. Freeland. and B. Okamura. 2001. Dispersal in freshwater invertebrates. Annual
Review of Ecology and Systematics 32:159–181.
Binckley, C.A., and W.J. Resetarits, Jr. 2005. Habitat selection determines abundance, richness
and species composition of beetles in aquatic communities. Biology Letters 1:370–374.
Brown, J.S. 1999. Vigilance, patch use and habitat selection: foraging under predation risk.
Evolutionary Ecology Research 1:49–71.
Cadotte, M.W., A.M. Fortner, and T. Fukami. 2006. The effects of resource enrichment,
dispersal, and predation on local and metacommunity structure. Oecologia 149:150–157.
Charnov, E.L. 1976. Optimal foraging, the marginal value theorem. Theoretical Population
Biology 9:129–136.
Chesson, P. 2000. Mechanisms of maintenance of species diversity. Annual Review of Ecology
and Systematics 31:343–366.
Culler, L.E., S. Ohba, and P. Crumrine. 2014. Predator-prey interactions of dytiscids. Ecology,
Systematics, and the Natural History of Predaceous Diving Beetles (Coleoptera:
Dytiscidae) (ed D.A. Yee), pp. 363–386. Springer, New York.
Fairchild, G.W., A.M. Faulds, and J.F. Matta. 2000. Beetle assemblages in ponds: Effects of
habitat and site age. Freshwater Biology 44:523–534.
Forman, R.T.T., 1995. Land Mosaics. Cambridge University Press, Cambridge.
Freidin, E., and A. Kacelnik. 2011. Rational choice, context dependence, and the value of
information in European starlings (Sturnus vulgaris). Science 334:1000–1002.
Fretwell, S.D., and H.L. Lucas. 1970. On territorial behavior and other factors influencing
habitat distribution in birds. Acta Biotheoretica 19:16–36.
Fukami, T., and P.J. Morin. 2003. Productivity-biodiversity relationships depend on the history
of community assembly. Nature 424:423–426.
Grainger, T.N., and B. Gilbert. 2016. Dispersal and diversity in experimental metacommunities:
linking theory and practice theory and practice. Oikos 125:1213–1223.

168
Gustafson, E.J. 1998. Quantifying landscape spatial pattern: What is the state of the art?
Ecosystems 1:143–156.
Hocking, B. 1952. Autolysis of flight muscles in a mosquito. Nature 169:1101.
Houston, A.I. 1997. Natural selection and context-dependent values. Proceedings of the Royal
Society B: Biological Sciences 264:1539–1541.
Hughey, M.C., M.W. McCoy, J.R. Vonesh, and K.M. Warkentin. 2012. Spatial contagion drives
colonization and recruitment of frogflies on clutches of red-eyed treefrogs. Biology
Letters 8:887–889.
Huston, M.A., and D.L. DeAngelis. 1994. Competition and coexistence: the effects of resource
transport and supply rates. The American Naturalist 144:954–977.
Jackson, D.J. 1952. Observations on flying and flightless water beetles. Journal of the Linnean
Society of London, Zoology 43:18–42.
Johnson, C. 1969. Migration and Dispersal of Insects by Flight. Methuen, London.
Juliano, S.A., and J.H. Lawton. 1990. The relationship between competition and morphology. II.
Experiments on co-occurring dytiscid beetles. Journal of Animal Ecology 59:831–848.
Kareiva, P., and U. Wennergren. 1995. Connecting landscape patterns to ecosystem and
population processes. Nature 373:299–302.
Kiflawi, M., L. Blaustein, and M. Mangel. 2003. Oviposition habitat selection by the mosquito
Culiseta longiareolata in response to risk of predation and conspecific larval density.
Ecological Entomology 28:168–173.
Kraus, J.M., and J.R. Vonesh. 2010. Feedbacks between community assembly and habitat
selection shape variation in local colonization. Journal of Animal Ecology 79:795–802.
Layton, R.J., and J.R. Voshell. 1991. Colonization of new experimental ponds by benthic
macroinvertebrates. Environmental Entomology 20:110–117.
Leibold, M.A. 1999. Biodiversity and nutrient enrichment in pond plankton communities.
Evolutionary Ecology Research 1:73–95.
Leibold, M.A., M. Holyoak, N. Mouquet, P. Amarasekare, J.M. Chase, M.F. Hoopes, R.D. Holt,
J.B. Shurin, R. Law, D. Tilman, M. Loreau, and A. Gonzalez. 2004. The metacommunity
concept: A framework for multi-scale community ecology. Ecology Letters 7:601–613.
Lima, S.L., and L.M. Dill. 1990. Behavioural decisions made under the risk of predation: a
review and prospectus. Canadian Journal of Zoology 68:619–640.
Logue, J.B., N. Mouquet, H. Peter, and H. Hillebrand. 2011. Empirical approaches to
metacommunities: A review and comparison with theory. Trends in Ecology and
Evolution 26:482–491.
MacArthur, R.H., and E.O. Wilson. 1967. The theory of island biogeography. Monographs in
Population Biology 1:1–215.
Marcarelli, A.M., C.V. Baxter, M.M. Mineau, and R.O. Hall. 2011. Quantity and quality:
Unifying food web and ecosystem perspectives on the role of resource subsidies in
freshwaters. Ecology 92:1215–1225.
Merritt, R.W., K.W. Cummins, and M.B. Berg. 2008. An Introduction to the Aquatic Insects of
North America, 4th ed. Kendall/Hunt Publishing Company, Dubuque.
Minshall, G.W. 1967. Role of allochthonous detritus in the trophic structure of a woodland
springbrook community. Ecology 48:139–149.
Morris, D.W. 2003. Toward an ecological synthesis: A case for habitat selection. Oecologia

169
136:1–13.
Pintar, M.R., and W.J. Resetarits, Jr. 2017a. Tree leaf litter composition drives temporal
variation in aquatic beetle colonization and assemblage structure in lentic systems.
Oecologia 183:797–807.
Pintar, M.R., and W.J. Resetarits, Jr. 2017b. Prey-driven control of predator assemblages:
zooplankton abundance drives aquatic beetle colonization. Ecology 98: 2201–2215.
Pintar, M.R., and W.J. Resetarits, Jr. 2017c. Data from: Context dependent colonization
dynamics: regional reward contagion drives local compression in aquatic beetles. Dryad
Digital Repository. doi: 10.5061/dryad.55dh5
Polis, G.A., W.B. Anderson, and R.D. Holt. 1997. Toward an integration of landscape and food
web ecology: the dynamics of spatially subsidized food webs. Annual Review of Ecology
and Systematics 28:289–316.
Pulliam, H.R., and B.J. Danielson. 1991. Sources, sinks, and habitat selection: a landscape
perspective on population dynamics. The American Naturalist 137:S50–S66.
Pyke, G.H. 1984. Optimal foraging theory: a critical review. Annual Review of Ecology and
Systematics 15:523–575.
R Core Team. 2016. R: A Language and Environment for Statistical Computing. R Foundation
for Statistical Computing, Vienna.
Resetarits, W.J. Jr. 1996. Oviposition site choice and life history evolution. American Zoologist
36:205–215.
Resetarits, W.J. Jr. 2001. Colonization under threat of predation: avoidance of fish by an aquatic
beetle, Tropisternus lateralis (Coleoptera: Hydrophilidae). Oecologia 129:155–160.
Resetarits, W.J. Jr. 2005. Habitat selection behaviour links local and regional scales in aquatic
systems. Ecology Letters 8:480–486.
Resetarits, W.J. Jr., and C.A. Binckley. 2009. Spatial contagion of predation risk affects
colonization dynamics in experimental aquatic landscapes. Ecology 90:869–876.
Resetarits, W.J. Jr., and C.A. Binckley. 2013. Patch quality and context, but not patch number,
drive multi-scale colonization dynamics in experimental aquatic landscapes. Oecologia
173:933–946.
Resetarits, W.J. Jr. and C.A. Binckley. 2014. Species responses of colonising beetles to variation
in patch quality, number, and context in experimental aquatic landscapes. Ecological
Entomology 39:226–235.
Resetarits, W.J. Jr., C.A. Binckley, and D.R. Chalcraft. 2005. Habitat selection, species
interactions, and processes of community assembly in complex landscapes.
Metacommunities: Spatial Dynamics and Ecological Communities (eds M. Holyoak,
M.A. Leibold, and R.D. Holt), pp. 374–398. University of Chicago Press, Chicago.
Resetarits, W.J. Jr., and M.R. Pintar. 2016. Functional diversity of non-lethal effects, chemical
camouflage, and variation in fish avoidance in colonizing beetles. Ecology 97:3517–
3529.
Resetarits, W.J. Jr., and A. Silberbush. 2016. Local contagion and regional compression: habitat
selection drives spatially explicit, multiscale dynamics of colonisation in experimental
metacommunities. Ecology Letters 19:191–200.
Rosenzweig, M.L. 1981. A theory of habitat selection. Ecology 62:327–335.
Shafir, E., I. Simonson, and A. Tversky. 1993. Reason-based choice. Cognition 49:11–36.

170
Shafir, S., T.A. Waite, and B.H. Smith. 2002. Context-dependent violations of rational choice in
honeybees (Apis mellifera) and gray jays (Perisoreus canadensis). Behavioral Ecology
and Sociobiology 51:180–187.
Shmida, A., and M.V. Wilson. 1985. Biological determinants of species diversity. Journal of
Biogeography 12:1–20.
Shurin, J.B., and E.G. Allen. 2001. Effects of competition, predation, and dispersal on species
richness at local and regional scales. The American Naturalist 158:624–637.
Steffan-Dewenter, I., U.M. Nzenberg, C.B. Rger, C. Thies, and T. Tscharntke. 2002. Scale-
dependent effects of landscape context on three pollinator guilds. Ecology 83:1421–1432.
Stephens, D.W., and J.R. Krebs. 1986. Foraging Theory. Princeton University Press, Princeton.
Stoler, A.B., and R.A. Relyea. 2013. Bottom-up meets top-down: leaf litter inputs influence
predator-prey interactions in wetlands. Oecologia 173:249–257.
Thompson, J.N., and O. Pellmyr. 1991. Evolution of oviposition behavior and host preference in
Lepidoptera. Annual Review of Entomology 36:65–89.
Turner, M.G., R.H. Gardner, and R.V. O’Neill. 2001. Landscape Ecology in Theory and
Practice. Springer, New York.
Vonesh, J.R., J.M. Kraus, J.S. Rosenberg, and J.M. Chase. 2009. Predator effects on aquatic
community assembly: disentangling the roles of habitat selection and post-colonization
processes. Oikos 118:1219–1229.
Wellborn, G.A., D.K. Skelly, and E.E. Werner. 1996. Mechanisms creating community structure
across a freshwater habitat gradient. Annual Review of Ecology and Systematics 27:337–
363.
Werner, E.E., and D.J. Hall. 1974. Optimal foraging theory and the size selection of prey by the
bluegill sunfish (Lepomis macrochirus). Ecology 55:1042–1052.
Wesner, J.S., E.J. Billman, and M.C. Belk. 2012. Multiple predators indirectly alter community
assembly across ecological boundaries. Ecology 93:1674–1682.
Wiegand, T., K.A. Moloney, J. Naves, F. Knauer. 1999. Finding the missing link between
landscape structure and population dynamics: a spatially explicit perspective. The
American Naturalist 154:605–627.
Williams, D.D. 2005. Temporary forest pools: Can we see the water for the trees? Wetlands
Ecology and Management 13:213–233.
Wilson, D.S. 1992. Complex interactions in metacommunities, with implications for biodiversity
and higher levels of selection. Ecology 73:1984–2000.
Zera, A.J., and R.F. Denno. 1997. Physiology and ecology of dispersal polymorphism in insects.
Annual Review of Entomology 42:207–230.

171
APPENDIX C
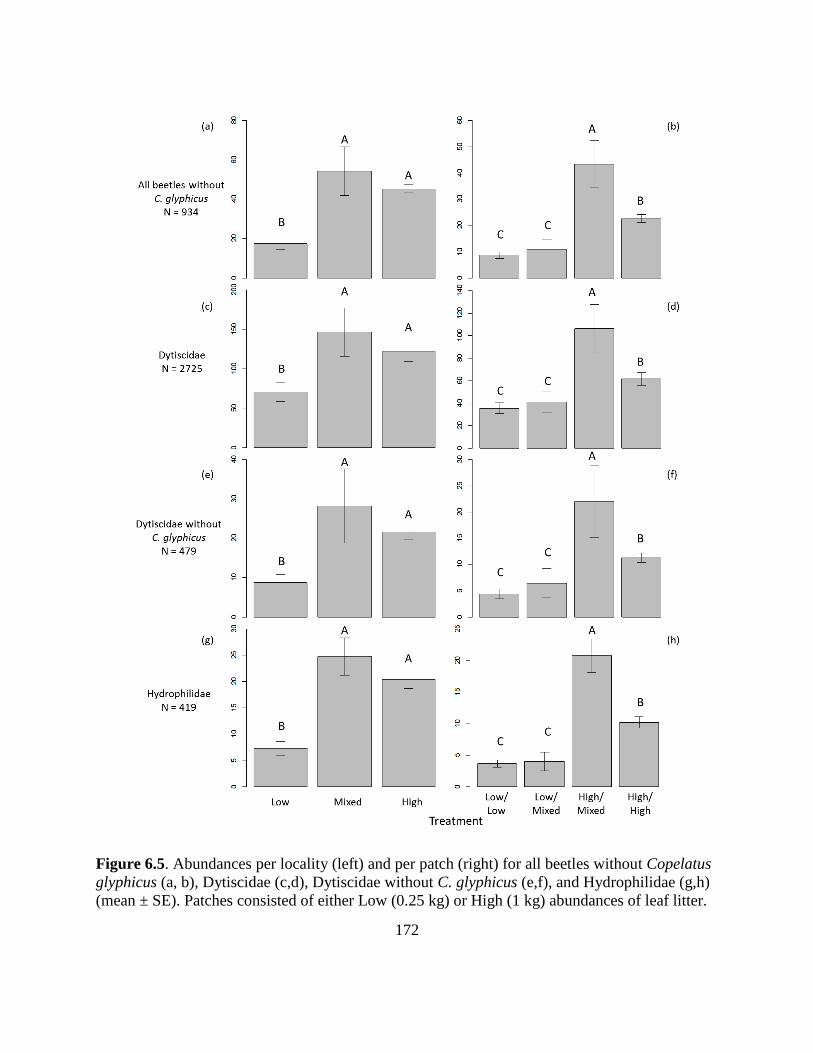
172
Figure 6.5. Abundances per locality (left) and per patch (right) for all beetles without Copelatus
glyphicus (a, b), Dytiscidae (c,d), Dytiscidae without C. glyphicus (e,f), and Hydrophilidae (g,h)
(mean ± SE). Patches consisted of either Low (0.25 kg) or High (1 kg) abundances of leaf litter.

173
Locality level treatments consisted of two Low patches (Low locality), two High patches (High
locality), or one Low and one High patch (Mixed locality). Treatments on patch figures consisted
of patch level treatment/locality level treatment.
Figure 6.6. Average differences (± SE) in (a) number of beetles and (b) number of species
between adjacent pools within the same locality, by the treatment of that locality (Low, Mixed,
High). Low differences are between two Low patches, High differences between two High
patches, and Mixed differences between a High and Low patch.

174
VITA
MATTHEW R. PINTAR
EDUCATION
B.S., Ecology and Environmental Sciences, University of Maine, December 2010
PROFESSIONAL EXPERIENCE
2014–present Research Assistant, University of Mississippi, Oxford, MS
2011–2014 Research Assistant, Texas Tech University, Lubbock, TX
2011 Biological Science Technician (fisheries), Sawtooth National Forest, Fairfield, ID
2011 Sustainability Intern, Zion National Park, Springdale, UT
2009 Resource Management Intern, Prince William Forest Park, Triangle, VA
2008 Fisheries Management Intern, Sawtooth National Recreation Area, Stanley, ID
2007 Bridge Inspection Assistant, Wilbur Smith Associates, Pittsburgh, PA
PUBLICATIONS
10. Pintar, MR and WJ Resetarits, Jr. Variation in pond hydroperiod affects larval growth in
southern leopard frogs, Lithobates sphenocephalus. Copeia in press.
9. Pintar, MR and WJ Resetarits, Jr. 2017. Larval development varies across pond age and
larval density in Cope’s gray tree frog, Hyla chrysoscelis. Herpetologica 73 (4): in press.
8. Bohenek, JR, MR Pintar, T Breech, and WJ Resetarits, Jr. 2017. Patch size influences
perceived patch quality for colonizing Culex mosquitoes. Freshwater Biology 62:1614–1622.
7. Pintar, MR and WJ Resetarits, Jr. 2017. Prey-driven control of predator assemblages:
zooplankton abundance drives aquatic beetle colonization. Ecology 98:2201–2215.
6. Pintar, MR and WJ Resetarits, Jr. 2017. Context-dependent colonization dynamics: regional
reward contagion drives local compression in aquatic beetles. Journal of Animal Ecology
86:1124–1135.
5. Pintar, MR and WJ Resetarits, Jr. 2017. Relative predation risk and risk of desiccation co-
determine oviposition preferences in Cope’s gray treefrog, Hyla chrysoscelis. Oecologia 184
(2): 423–430.
4. Pintar, MR and WJ Resetarits, Jr. 2017. Persistence of an egg mass polymorphism in
Ambystoma maculatum: differential performance under high and low nutrients. Ecology 98
(5): 1349–1360.
3. Pintar, MR and WJ Resetarits, Jr. 2017. Tree leaf litter composition drives temporal
variation in aquatic beetle colonization and assemblage structure in lentic systems. Oecologia

175
183 (3): 797–807.
2. Pintar, MR and WJ Resetarits, Jr. 2017. Out with the old, in with the new: oviposition
preference matches larval success in Cope’s gray treefrog, Hyla chrysoscelis. Journal of
Herpetology 51 (2): 186–189.
1. Resetarits, Jr, WJ and MR Pintar. 2016. Functional diversity of non-lethal effects, chemical
camouflage, and variation in fish avoidance in colonizing aquatic beetles. Ecology 97 (12):
3517–3529.
ORAL PRESENTATIONS
2017 Pintar, MR and WJ Resetarits, Jr. Prey-driven control of aquatic beetle predator
assemblages. ESA 2017, Portland, OR.
2016 Pintar, MR and WJ Resetarits, Jr. Spatial resource subsidies and predation risk as drivers
of aquatic beetle assemblages. INTECOL International Wetlands Conference, Changshu,
China.
2016 Pintar, MR and WJ Resetarits, Jr. Oviposition preference matches larval performance in
Cope’s gray treefrog. Joint Meeting of Ichthyologists and Herpetologists, New Orleans,
LA.
2016 Pintar, MR and WJ Resetarits, Jr. Oviposition preference matches larval performance in
Cope’s gray treefrog. Evolution, Austin, TX.
2015 Pintar, MR and WJ Resetarits, Jr. Effects of pond age and flooding on aquatic animals.
University of Mississippi 3-Minute Thesis Competition, Oxford, MS.
2015 Pintar, MR and WJ Resetarits, Jr. Colonization of aquatic beetles varies among patch
quality and context. Southeastern Ecology and Evolution Conference, Athens, GA.
2013 Pintar, MR and WJ Resetarits, Jr. Examination of flooding as a mechanism for altering
gray treefrog development in temporary ponds. Texas Tech University Annual Biological
Sciences Symposium, Lubbock, TX.
2010 Pintar, MR and BJ Olsen. Effects of acidification on ovenbird territory size. Bear Brook
Watershed in Maine Working Group Session, Orono, ME.
POSTER PRESENTATIONS
2017 Pintar, MR and WJ Resetarits, Jr. Context-dependent colonization: regional reward
contagion drives local compression in aquatic beetles. University of Mississippi GSC
Research Day Symposium, Oxford, MS.
2016 Pintar, MR and WJ Resetarits, Jr. Functionality of the spotted salamander egg mass
polymorphism. Joint Meeting of Ichthyologists and Herpetologists, New Orleans, LA.
2016 Pintar, MR and WJ Resetarits, Jr. Functionality of the spotted salamander egg mass
polymorphism. Evolution, Austin, TX.
2016 Pintar, MR and WJ Resetarits, Jr. Functionality of the spotted salamander egg mass
polymorphism. University of Mississippi GSC Research Day Symposium, Oxford, MS.
2014 Pintar, MR and WJ Resetarits, Jr. Interactive effects of flooding and predators on Hyla
tadpole development. World Forum of Young Scientists, Baku, Azerbaijan.
2010 Pintar, MR and BJ Olsen. The effect of experimental acidification on ovenbird territory
size. National Collegiate Honors Council Conference, Kansas City, MO.