Embed Size (px)
Citation preview
GOLDEN EAGLE NEST SITE SELECTION AND HABITAT SUITABILITY
MODELING ACROSS TWO ECOREGIONS IN SOUTHERN NEVADA
by
Sarah A. Weber, B.S.
A thesis submitted to the Graduate Council of
Texas State University in partial fulfillment
of the requirements for the degree of
Master of Science
with a Major in Wildlife Ecology
August 2015
Committee Members:
John T. Baccus
Thomas R. Simpson
Michael C. Green

COPYRIGHT
by
Sarah A. Weber
2015

FAIR USE AND AUTHOR’S PERMISSION STATEMENT
Fair Use
This work is protected by the Copyright Laws of the United States (Public Law 94-553,
section 107). Consistent with fair use as defined in the Copyright Laws, brief quotations
from this material are allowed with paper acknowledgement. Use of this material for
financial gain with the author’s express written permission is not allowed.
Duplicate Permission
As the copyright holder of this work I, Sarah A. Weber, refuse permission to copy in
excess of the “Fair Use” exemption without my written permission.

iv
ACKNOWLEDGEMENTS
I would like to thank my major advisors, Dr. John Baccus, Dr. Randy Simpson
and, as well as committee member, Dr. Clay Green, for their helpful suggestions and
guidance that made this thesis possible. I would also like to thank Ann Bedlion, Robert
Turner, Dr. Lynn Kitchen, Deborah Sitarek and the Nellis Natural Resource Program at
Nellis Air Force Base for their cooperation and continual support of myself, and this
project.
I have a long list of people who have mentored and encouraged me throughout my
years. Some of those folks include Dr. Keith Arnold, Dr. Douglas Slack, Dr. Lawrence
Griffing, Allison and Malcolm Gaylord, Craig Matkin, among many others. Thank you
for giving me opportunities, guidance and above all, inspiration.
Additionally, I would like to thank my parents Ernest and Judy Weber as well as
Gerald and Patricia Stanley for their support throughout the duration of my studies. Most
importantly, thank you to my immediate family, Jerry and Olive Stanley for their
patience, love and encouragement. Without them, none of this work would be possible.

v
TABLE OF CONTENTS
Page
ACKNOWLEDGEMENTS ............................................................................................... iv
LIST OF TABLES ............................................................................................................ vi
LIST OF FIGURES .......................................................................................................... vii
LIST OF ILLUSTRATIONS ........................................................................................... viii
ABSTRACT ...................................................................................................................... iix
CHAPTER
1. INTRODUCTION .............................................................................................1
2. STUDY SITE .....................................................................................................5
3. RESULTS ........................................................................................................24
4. DISCUSSION ..................................................................................................24
REFERENCES ................................................................................................................. 58

vi
LIST OF TABLES
Table Page
1. Environmental attributes and their potential influence on nest site selection. .............. 21
2. Nest occupancy and productivity based on numbers of active nests (Active), numbers
of chicks initially observed (Observed), numbers of chicks successfully fledged
(Success), numbers of chicks failed to fledge (Fail), numbers of chicks unknown to
fledge (Unknown) by year and ecoregion. ........................................................................ 28
3. Number of nests (active and inactive) and their four-year productivity by ecoregions
and mountain ranges in 2011-2014. .................................................................................. 29
4. Total number of nest sites and their four year productivity (2011-2014) by ecoregion
and mountain range. .......................................................................................................... 30
5. Relative differences in productivity and nest abundance based on total number of
occupied nests (Occupied), total number of nests (Total), ratio of occupied nests to total
nests (Ratio), area of cliff canyon habitat (km2) (Area), occupied nest density (occupied
nests/km2) (Density 1) and overall nest density (total nests/km
2) (Density 2) by
ecoregion. .......................................................................................................................... 31
6. Results from logistic regression analysis ...................................................................... 37
7. Analysis of Variable Contributions shows the environmental variables used in the
model and their percent predictive contribution.. ............................................................. 45
vii
LIST OF FIGURES
Figure Page
1. Study site boundaries in relation to ecoregions, Southern Nevada ..................................8
2. Key habitats surrounding study site boundaries, Great Basin, Southern Nevada ............9
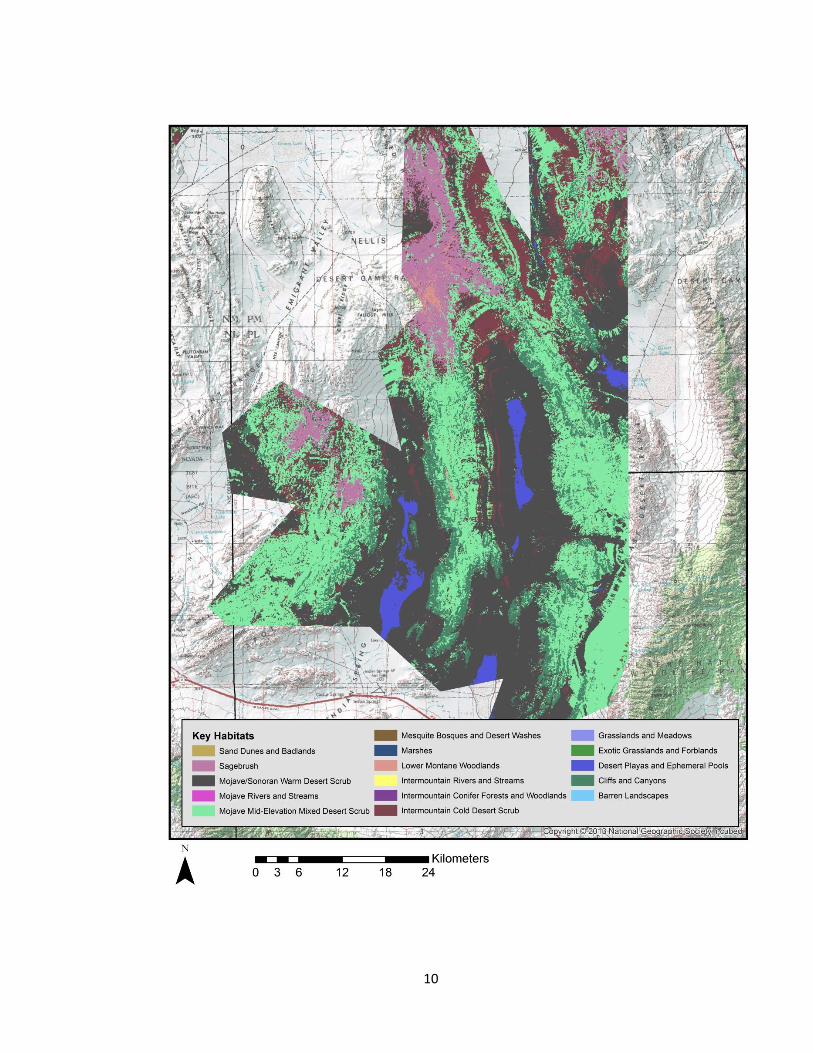
3. Key habitats surrounding study site boundaries, Mojave Desert, Southern Nevada .....11
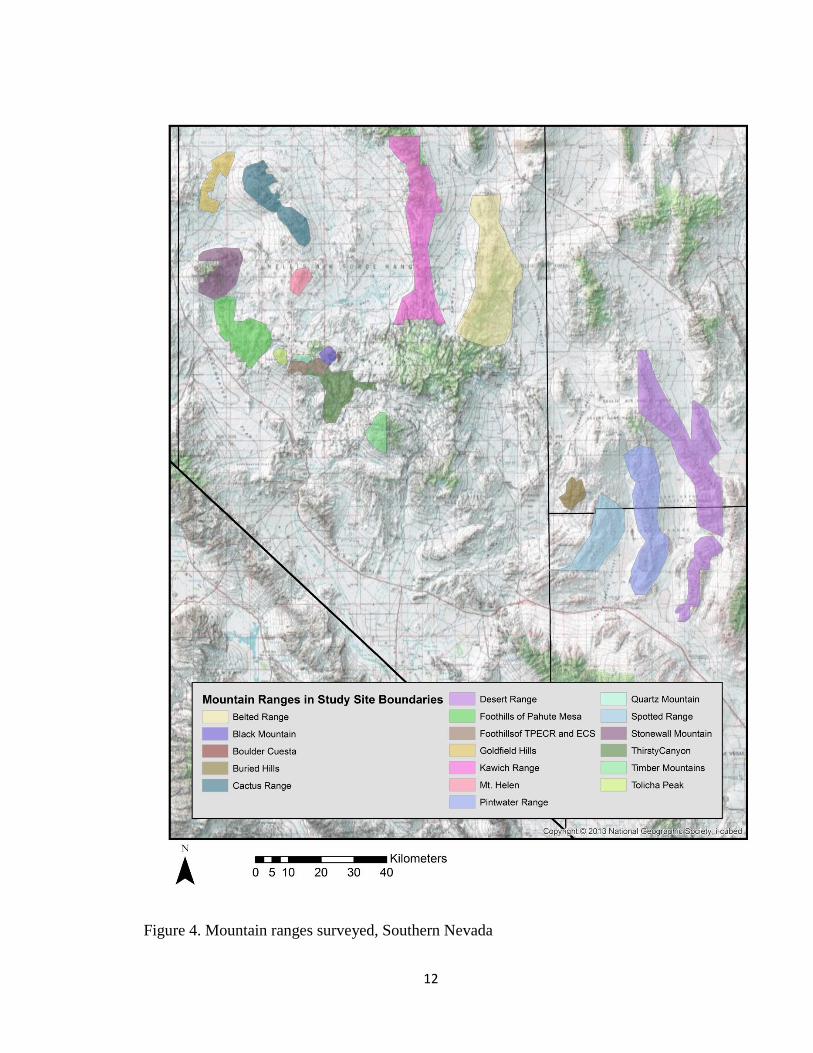
4. Mountain ranges surveyed, Southern Nevada ...............................................................12
5. ArcScene 3D aerial view of a nest site location with viewshed attribute ......................18
6. Geoprocessing model builder used for viewshed analysis of each nest site ..................19
7. Golden eagle nest sites observed 2011-2014 in the Mojave Desert ..............................25
8. Golden eagle nest sites observed from 2011-2014 in the Great Basin. .........................26
9. Mean annual chronology cycle observed in the Mojave and Great Basin ....................30
10. Key habitats associated with all nest sites in the Mojave Desert and Great Basin. .....33
11. Soil associations found all nest sites observed. ...........................................................34
12. Geological formations found at all nest sites observed. ..............................................35
13. Nearest neighbor results of the Great Basin population of active nest sites ................39
14. Nearest neighbor results of the Mojave Desert ecoregion of active nest sites. ............40
15. Potential territories of golden eagles observed within the Great Basin .......................42
16. Potential territories of golden eagles observed in the Mojave Desert .........................43
17. Area Under the Receiver Operating Characteristic (ROC) Curve or AUC Value......45
18. Habitat suitability model for nesting golden eagles in the Great Basin .......................46
19. Habitat suitability model for nesting golden eagles in the Mojave Desert ..................47

viii
LIST OF ILLUSTRATIONS
Illustration Page
1. Adult golden eagle incubating eggs. ................................................................................2
2. Typical intermountain nesting habitat of the golden eagle in southern Nevada ..............7
3. Nesting golden eagles observed approximately three weeks old. ..................................32
4. Nesting golden eagles observed approximately eight weeks old..................................32
ix
ABSTRACT
Because of perceived declines in populations of the golden eagle (Aquila
chrysaetos) in the western United States, the United States Fish and Wildlife Service
(USFWS) closely monitors population trends throughout their range. An inventory of
golden eagles in two ecosystems in Nevada (the northern Mojave Desert and southern
Great Basin) was conducted from 2011-2014 with the objectives to: 1) locate and
determine the abundance of golden eagle nest sites (active and inactive) in two eco-
regions (Mojave Desert and Great Basin); 2) quantify golden eagle nest density and
abundance within the designated study sites; 3) determine the size of territories of
nesting golden eagles; 4) determine the influence of nest site variables on acquired data;
5) develop a habitat suitability model using nest site variables to delineate areas with high
probability for nest site selection.
Cliff and canyon habitats of the southern Great Basin and northern Mojave Desert
ecoregions were surveyed for active and inactive nests of golden eagles and to measure
nest site parameters by helicopter in 2011-2014. Nest site parameters used for analysis
were: general location, mountain range, cliff height, viewshed, soils, geology, elevation,
aspect, slope, habitat, use, productivity and distances to the nearest road and water. A
suitability index was created using these parameters and the program MaxEnt to map
potential nesting habitats within the boundaries of my study sites. A total of 96 nest sites
(old/abandoned and newly decorated) were located and analyzed. During the four years,
27 active nests produced 36 fledglings. Two nests were occupied for three years and three

x
nests had double occupancy in a year. Nesting habitat variables that were chosen for the
final predictive model include: elevation, slope, distance to nearest road and distance to
water. The results of my project will aid in establishing a monitoring program to provide
guidance in avoiding and minimizing disturbances and other kinds of future “take” by
federal agencies requiring consultation with USFWS.
1
CHAPTER 1
INTRODUCTION
The golden eagle (Aquila chrysaetos) is one of the largest and most renowned
birds of prey in North America. They range throughout the northern hemisphere in North
America, Eurasia and parts of Africa. Golden eagles in North American represent 47%
(79,000 birds) of the global population (Hawk Mountain 2007). Golden eagles breed in
an array of available habitats in the eastern and western United States and are most
abundant west of 100° W longitude from the Arctic slope to central Mexico (Kochert et
al. 2002). However, data from the Audubon Society’s Christmas Bird Counts and Raptor
Migration Counts indicate that populations have declined since the early 1980s with the
most severe waning since 1998 in the western North America (Hawk Mountain 2007).
Hoffman and Smith (2003) reported declines in immature eagles from 1987-2001 at
Wellsville Mountains in northern Utah and from Lipan Point (South Rim of the Grand
Canyon, Arizona) from 1992-2001.
Other statistically significant long-term declines of golden eagles by raptor
migration counts were recorded from 1983 to 2005 at the Goshute Mountains, Nevada
and from 1985 to 2005 and at the Manzano Mountains, New Mexico (Hawk Mountain
2007). The rates of decline at these sites greatly increased in magnitude from 1995-2005.
Other studies suggest declines in golden eagle populations representing potential
downward trends throughout the west (Leslie 1992, Steenhof et al. 1997, Bittner and
Oakley 1999, Kochert et al. 2002). More recently, a study conducted by WEST, Inc.
(Nielson et al. 2014) estimated declines in the total number of juvenile golden eagles
2
from 2006-2012; however, overall abundance in the western United States appeared
relatively stable. Wildlife biologists at the United States Fish and Wildlife Service
(USFWS) estimate that approximatly 30,000 golden eagles inhabit the U.S., although
populations may undergo 10-year cycles and more years of surveys are needed to
accurately predict population trends (Gulf South Resource Corporation 2012).
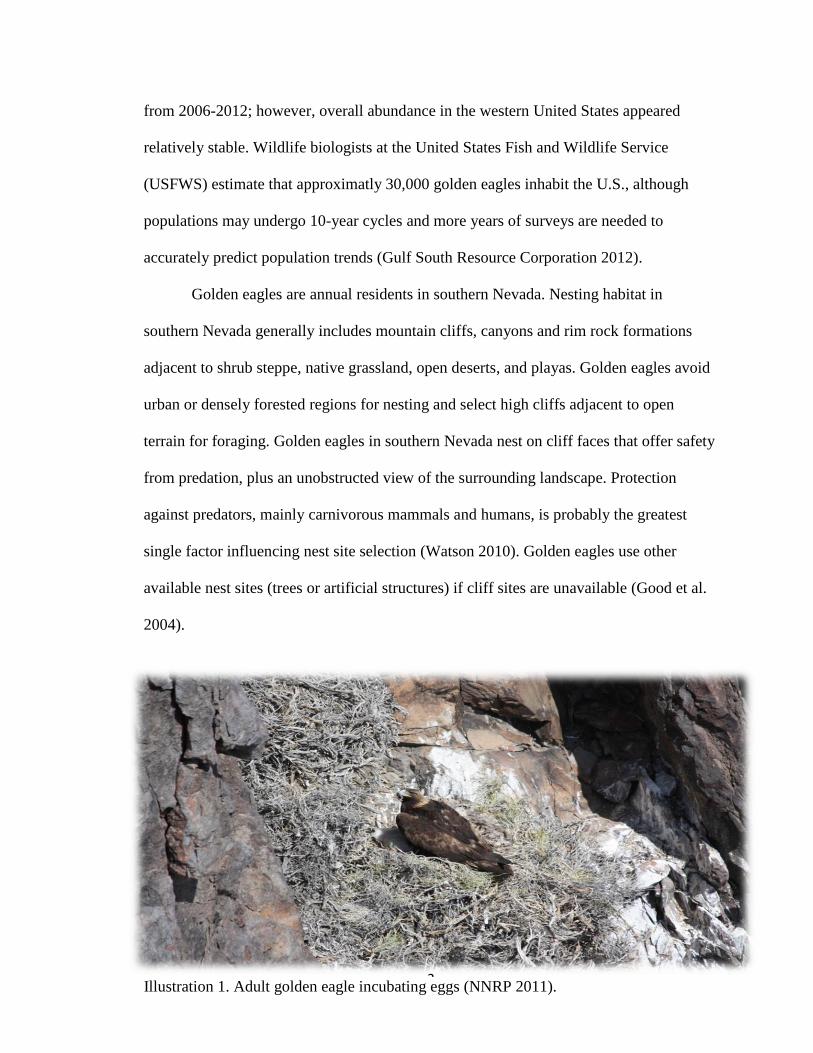
Golden eagles are annual residents in southern Nevada. Nesting habitat in
southern Nevada generally includes mountain cliffs, canyons and rim rock formations
adjacent to shrub steppe, native grassland, open deserts, and playas. Golden eagles avoid
urban or densely forested regions for nesting and select high cliffs adjacent to open
terrain for foraging. Golden eagles in southern Nevada nest on cliff faces that offer safety
from predation, plus an unobstructed view of the surrounding landscape. Protection
against predators, mainly carnivorous mammals and humans, is probably the greatest
single factor influencing nest site selection (Watson 2010). Golden eagles use other
available nest sites (trees or artificial structures) if cliff sites are unavailable (Good et al.
2004).
Illustration 1. Adult golden eagle incubating eggs (NNRP 2011).
3
Golden eagle nests are identified by their large size and the big sticks used to
form the nest (Driscoll 2010). Nests are built of branches and twigs and lined with grass
and green foliage (Cramp & Simmons 1980). Typically, a pair of golden eagles possess
several alternative eyries or supernumerary nests (McGahan 1968), usually two or three
but sometimes a dozen or more (Watson 2010). Nesting material is added to one or more
of these sites yearly (Watson 2010).
Reports of nesting success and characteristics of breeding golden eagles can be
found not only within the scientific literature (i.e., Thompson et al. 1982, Lee and
Spofford 1990, Watson et al. 1992, D. Young et al. 1995), but also within industry due to
regulations and management of commercial development and windfarms (Page & Siebert
1972, Ecosphere Environmental Services 2008, Isaacs 2011).
Bergo (1948), Donazar et al. (1989), and Mosher and White (1976) characterized
nest site selection by golden eagles; and development of habitat suitability indices have
become common for bird species, such as Newells shearwater (Troy et al. 2014) and the
white-headed woodpecker (Holldenbeck et al. 2011). Despite the extensive literature on
golden eagles in the western U. S., few quantitative data have been published describing
the features of nest sites, extrapolating them over a desired management area using a
Geographic Information Systems (GIS) model based approach.
Because of potential downward trends, the USFWS has increased conservation
protocols for the western populations of the golden eagle. Although uncertainty exists
over the current population size and status of golden eagles in the U.S., factors that may
cause population declines, such as habitat loss, are increasing (Good et al. 2004). Golden
eagles are protected by the Migratory Bird Treaty Act (16 U.S.C. 703–712) and the Bald
4
and Golden Eagle Protection Act (16 U.S.C. 668-668c); therefore, management of this
species is especially important for regulatory agencies, especially the USFWS.
Conservation and proper management of this species requires baseline information on
population size, distribution and productivity. The effects of environmental influences
impressed upon any population can only be determined accurately by a thorough study
(McGahan 1968). Additionally, assessments of breeding and nesting habitats are vitally
important to the preservation of potential nesting habitats in areas where disturbances
may be imminent. Without reliable estimates of the population size and trends, it is
difficult for the USFWS to determine the appropriate number of permits to issue for
various take requests to ensure a sustainable golden eagle population (Good et al. 2004).
The objectives of mystudy are to 1) locate and determine the abundance of golden
eagle nest sites (active and inactive) in two eco-regions (Mojave Desert and Great Basin);
2) quantify golden eagle nest density and abundance within the designated study sites; 3)
determine the territory size of nesting golden eagles; 4) determine the influence of nest
site variables on acquired data and 5) develop a habitat suitability model using nest site
variables to delineate areas with high probability for nest site selection.
5
CHAPTER 2
STUDY SITE
My study site was located within a closed access military range operated by the
Department of Defense and managed by the 98th
Range Wing of Nellis Air Force Base
(NAFB) in southern Nevada. The southern boundaries of the designated study site are
located in Clark, Lincoln and Nye counties approximately 64 km north of Las Vegas
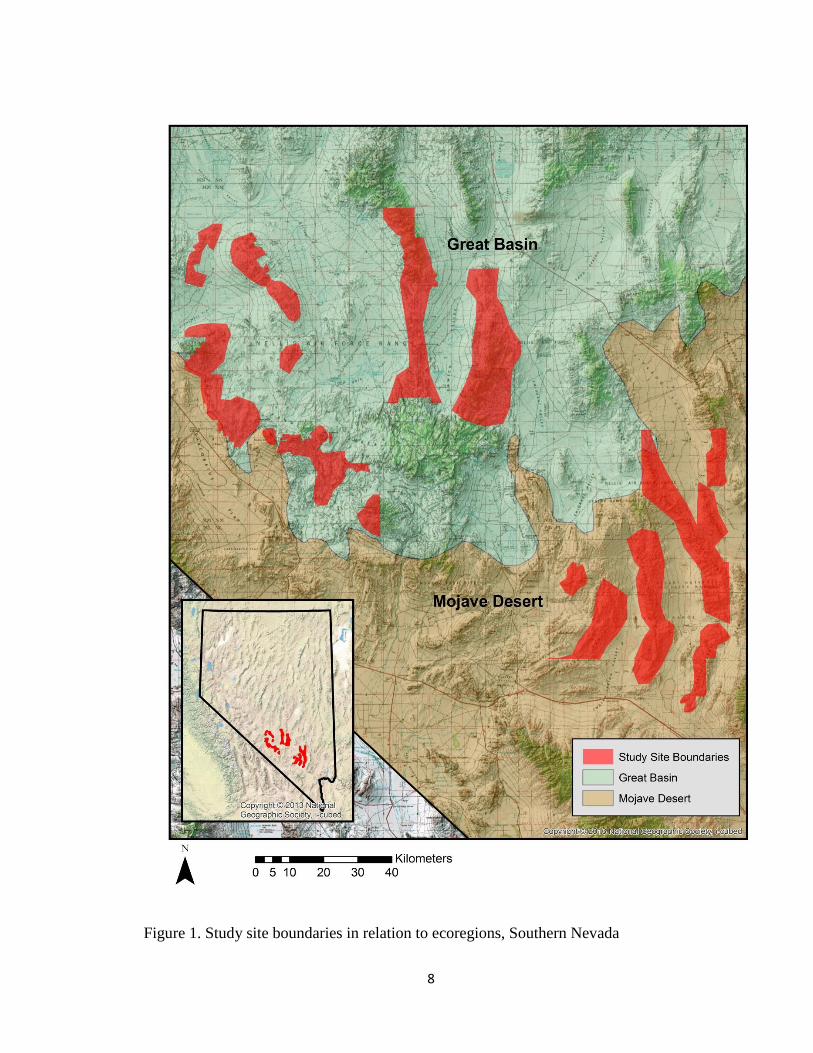
within the Mojave Desert and the Great Basin Desert ecoregions (Fig. 1). These
ecoregions are typified by broad desert valleys bounded by relatively high mountain
ranges. The Mojave Desert ecoregion is among the driest of North America’s arid lands
where precipitation averages < 12.7 cm per year in basins (United States Geological
Survey 2010). The Great Basin ecoregion is known for series of mountain ranges and
intervening valleys with greater rainfall and snowfall occuring at higher elevations and
less precipitation in basins. The general plant associations at the study sites are four-wing
saltbush (Atriplex canescens), shadscale saltbush (Atriplex confertifolia), creosote bush
(Larrea tridentata) and white bursage (Ambrosia dumosa) in the lower elevations (610-
914 m mean sea level (MSL)); Joshua tree (Yucca brevifolia) and creosotebush in the
mid-elevations (914-1371 m MSL) and sagebrush (Artemisia tridentata, A. nova), pinyon
pine (Pinus monophylla) and Utah juniper (Juniperus osteosperma) from 1372 m MSL
and above. The Nevada Department of Wildlife (NDOW) has developed a Wildlife
Action Plan to assist with the management and conservation of wildlife and habitats
across Nevada. As an integral part of this comprehensive plan, NDOW (2004) prepared a
GIS map with layers of key wildlife habitat throughout the state. The designated study
6
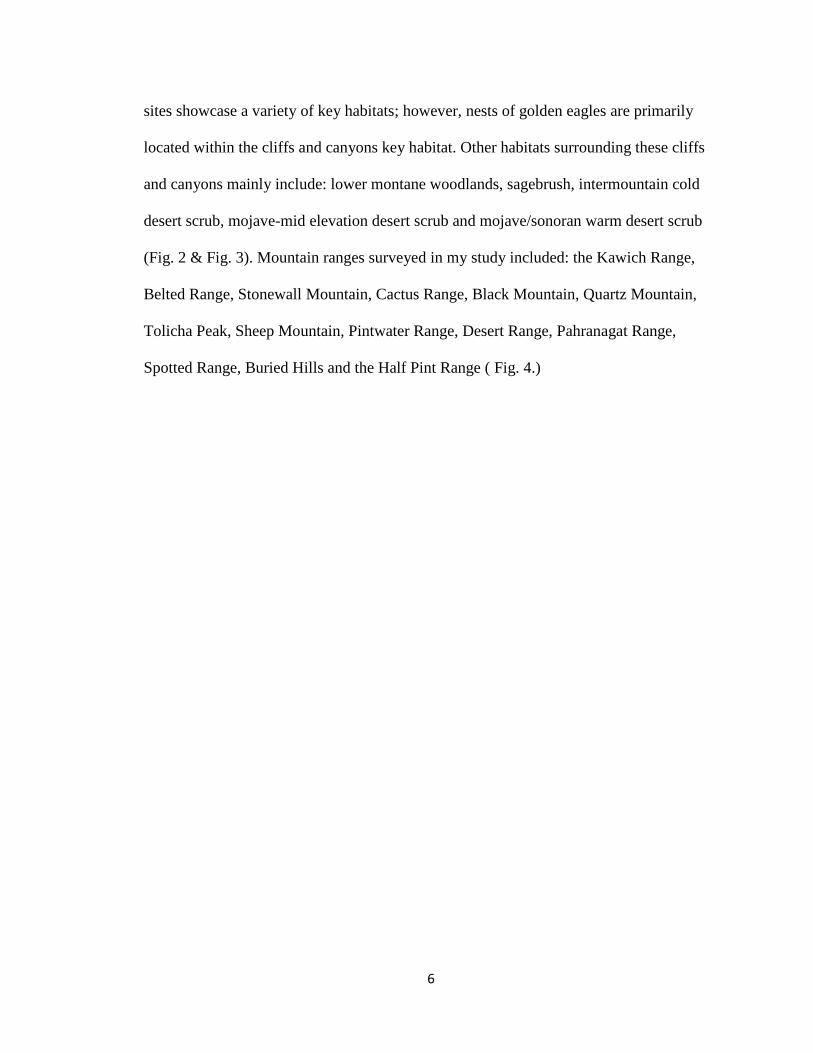
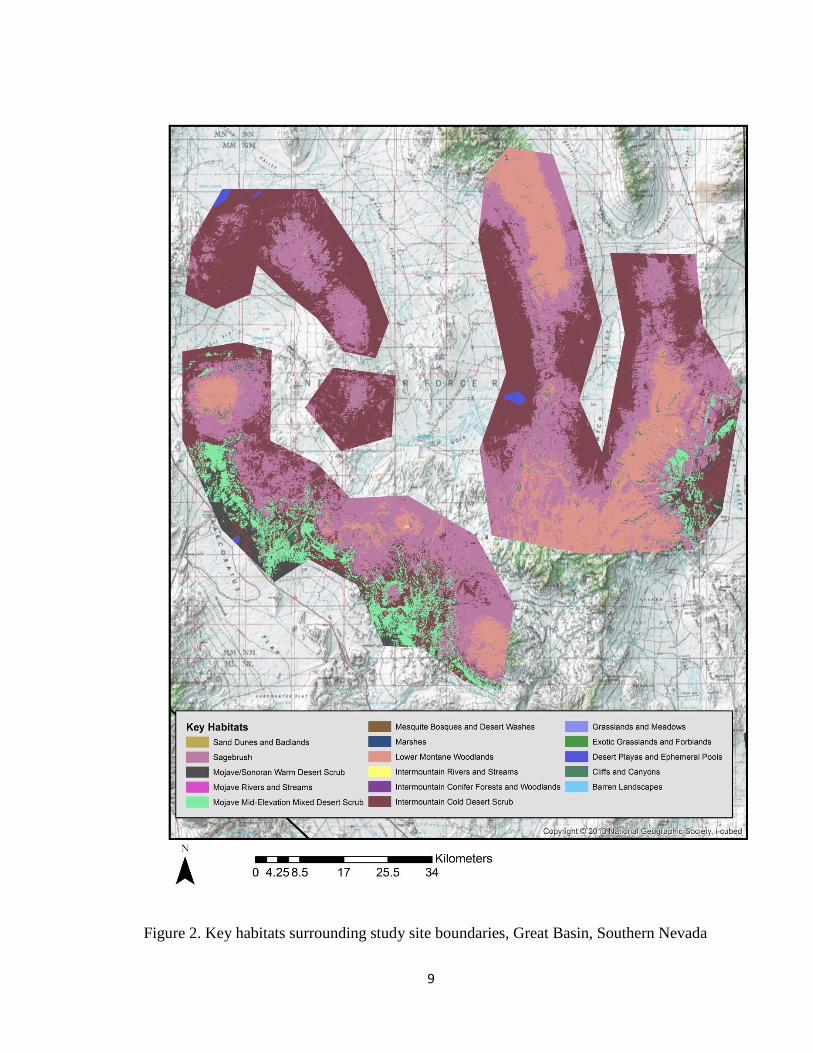
sites showcase a variety of key habitats; however, nests of golden eagles are primarily
located within the cliffs and canyons key habitat. Other habitats surrounding these cliffs
and canyons mainly include: lower montane woodlands, sagebrush, intermountain cold
desert scrub, mojave-mid elevation desert scrub and mojave/sonoran warm desert scrub
(Fig. 2 & Fig. 3). Mountain ranges surveyed in my study included: the Kawich Range,
Belted Range, Stonewall Mountain, Cactus Range, Black Mountain, Quartz Mountain,
Tolicha Peak, Sheep Mountain, Pintwater Range, Desert Range, Pahranagat Range,
Spotted Range, Buried Hills and the Half Pint Range ( Fig. 4.)
7
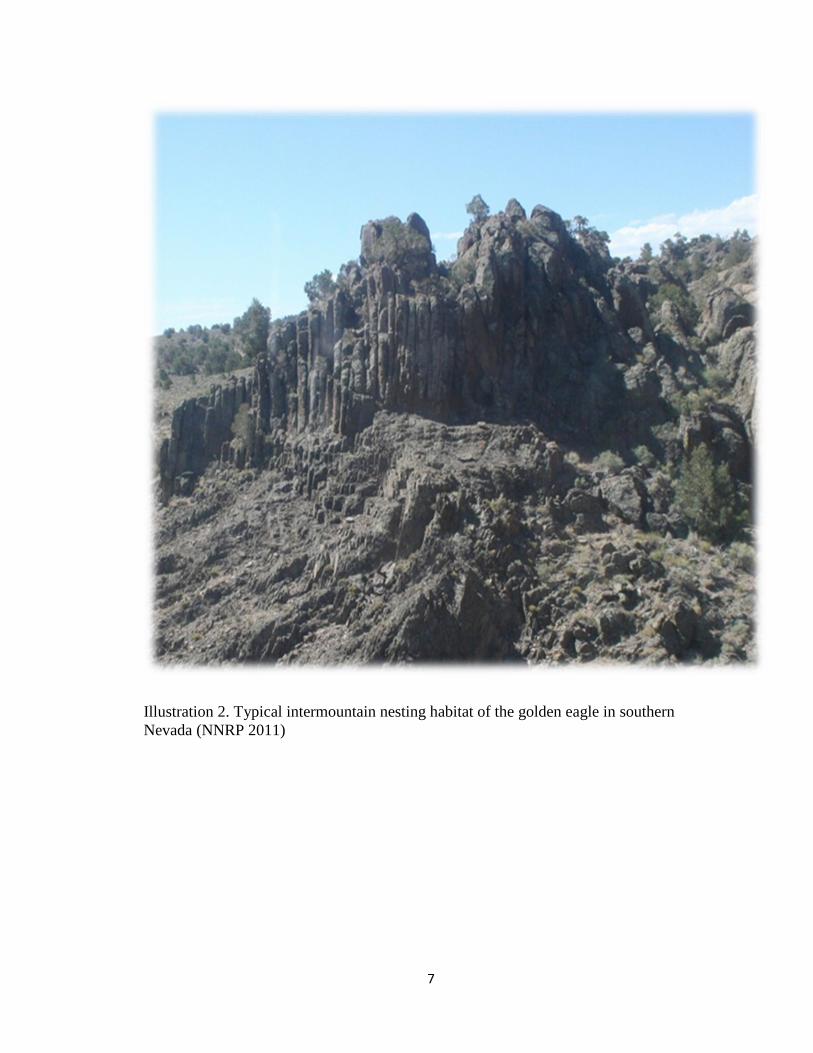
Illustration 2. Typical intermountain nesting habitat of the golden eagle in southern
Nevada (NNRP 2011)
8
Figure 1. Study site boundaries in relation to ecoregions, Southern Nevada
9
Figure 2. Key habitats surrounding study site boundaries, Great Basin, Southern Nevada
10

11
Figure 3. . Key habitats surrounding study site boundaries, Mojave Desert, Southern
Nevada
12
Figure 4. Mountain ranges surveyed, Southern Nevada
13
Methods
Aerial Surveys
Together with a team of biologists, I conducted comprehensive helicopter surveys
of all cliff habitats with an EC-130 helicopter in accordance with USFWS protocol
beginning in 2011. Aerial surveys were initiated early in the morning and usually
completed by noon. These surveys were conducted by contractors of the Nellis Natural
Resource Program (NNRP) within the designated study site boundaries. The objectives of
the surveys were to locate and identify nests of golden eagles. Observations and data for
each nest site were collected within 200 m of the nest or closer, if possible. The
helicopter approached no closer than 10-20 m of any occupied nest and remained in place
no longer than 30 sec. A close approach and extended hovering were allowed only at
unoccupied nests. During surveys, observers collected nest and nest site data, counted
eggs, counted eaglets, determined the fate of eaglets (dead or alive), or confirmed nest
success or failure. If a golden eagle appeared disturbed, the helicopter banked away to
terminate the nest search. Scheduling of all surveys was based on the timing of courtship,
breeding and nesting seasons observed by the NNRP prior to my study. Inventories of
golden eagles were initiated during courtship when adults were mobile and conspicuous.
Surveys were conducted approximately 30 to 60 days apart from January (initial territory
surveys) to July. Egg laying usually occurs in late February for the Mojave population
and mid-February to March in the Great Basin population. Golden eagles normally lay
two eggs, but are known to produce clutches with as many as four eggs (Pagel et al.
2010). Incubation lasts approximately 35-45 days and fledglings take flight 75-80 days
post-hatching (Dunstan 1989).
14
Survey timelines- During November-December 2010, helicopter survey routes
were determined based on data available from previous raptor surveys. Surveys began in
January the first year and consisted of territory surveys, nesting surveys and subsequent
productivity/occupancy surveys.
Territory surveys began in late January 2011. All stick nests identified as golden
eagle were documented, marked by GPS and mapped. The presence of a golden eagle or
other raptor species near the nests was recorded and territorial displays noted. Nests later
determined as other than golden eagle were removed from the dataset. Data collected for
golden eagle nests included: GPS location (UTM), GPS elevation, visual estimation of
nest size, location of nest relative to cliff height (height of nest : height of cliff), elevation
and aspect.
Each nest and subsequent territory were identified as positively occupied,
positively unoccupied, possibly occupied or unknown. Nest sites with a preponderance of
whitewash or fresh defecation from a perch site were recorded as possibly occupied.
Nesting surveys extended from late April to early May within the Mojave study
site and May to early June within the Great Basin site. All nests in previously identified
territories were surveyed and recorded as active/occupied or inactive/unoccupied. Active
nests had eggs and/or hatchlings present. The breeding status for active nests was
designated as successful or unsuccessful. I used the sightings of eggs, hatchlings,
incubation by female or nest decorating to confirm active nests. A nesting chronology
(estimated hatch date, current age, estimated fledge date) was developed by data
collected (number of eggs, hatchlings present or age class of nestlings) during the nesting
15
surveys. The age classification of eaglets was critical in deciding the time frame for
conducting the productivity/occupancy surveys.
I initiated productivity/occupancy surveys no earlier than 51 days after the nesting
surveys to finalize occupancy and nesting success. At this time, the nesting phenology
(estimated dates of laying, hatching and fledging) was constructed by back-dating from
the survey date assuming: 1) incubation started after the first egg was laid (Collopy and
Edwards 1989) and lasted 45 days; and 2) a nesting period, from hatching to fledging,
was 70 days (Palmer 1988). Nests were then categorized as successful, unsuccessful or
unknown, and nesting success was quanitified based on the number of successful
fledglings per number of eggs laid. Fledgling success was established via the observation
of young at least 51-days-old or known to have fledged from the observed, previously
occupied nest. Nesting was deemed successful if fledglings were observed > 51 days
from hatching. Nesting failure was determined when eggs were laid or incubation
behavior was observed, but failed to have any young after 51 days. When nest failure was
determined, a spotting scope was used to search for the dead young.
During all years, date of observation, date of each survey, helicopter routes,
nesting status and age class of all golden eagles observed were documented. A nesting
chronology was calculated for each occupied nest based on: the date the clutch was
completed (estimated), description of observed incubation behavior (used to estimate date
of completed clutch), hatch date (estimated from age of nestlings), fledge date (known or
estimated), date nesting failure was first observed and confirmed, number of young at
each visit and >51 days of age, digital photographs, landscape view of area and nests.
Weather and time of day were also recorded. Nest searches were not conducted in
16
inclement weather (high winds or rainfall) due to the safety of the crew and the potential
for nest site abandonment. High temperatures were also considered inclement because of
the potential of overheating and mortality of the egg or young if the adult flushes. At the
end of each year, all data were entered into a GIS database for analysis.
Geographic Information Systems (GIS)
I used ArcMap 10.1.1 (ESRI 2011) to view and process spatial data for the
purposes of this project. All locations of nest sites, whether active or inactive, were
represented by point locations projected into a WGS 1984 UTM Zone 11 N Coordinate
System. I used ArcMap random point generator to represent pseudo-absent points
(constrained to cliffs and canyons) for comparison to true nest sites for golden eagles.
Pseudo-absent points represent randomized locations where nest sites do not occur.
I obtained categorical habitat data from the NDOW key habitat GIS layer as
described in the NDOW Wildlife Action Plan (NDOW 2010), along with soil
associations and geological formations (NNRP 2011). Continuous data obtained online
through open source geospatial data included Digital Elevation Models (DEM) and
aspect and slope (USGS 2015). I entered the NDOW key habitat layers, geological
formations and soil associations as vector data in shape files represented by polygons.
The DEM, aspect and slope layers all represent raster grid data files converted to ASCII
format for input into the program MaxEnt.
I intersected all nest site points with these layers to obtain values for DEMs
aspect, slope, geology and soils. I transformed aspect data from a circular variable (0-
360) to a continuous variable (-1 to 1) for use in the analysis by applying cosine to the
aspect multiplied by pi divided by 180° [Northness = COS ((aspect x 3.14159)/180)].
17
Seeps and springs, represented as point data, were obtained from the land
managers (NNRP 2011) for use in calculating the distance from each nest to the nearest
water source. A road layer represented as a polyline was also obtained from the land
managers. I calculated distance to water and distance to the nearest road using the spatial
join tool set to match closest points from one another (eagle nest points to seeps and
springs points and eagle nest points to road polylines). The Euclidian distance tool was
then used to convert the nest site point files and the distance to road polyline files into a
categorical raster grid representing continuous data. Data for each of these variables was
then obtained in the same manner for randomly generated points.
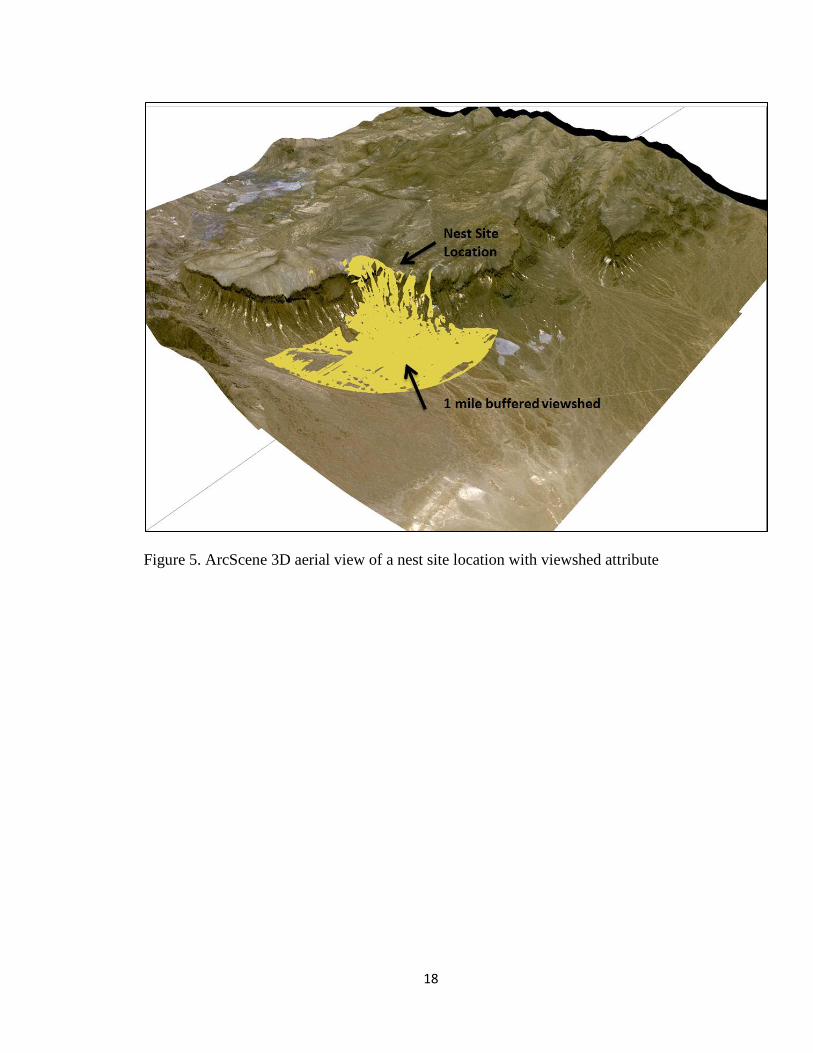
Viewshed is the geographical area that is visible from a point location. In GIS it is
a computational algorithm derived from a DEM that estimates the difference of elevation
from one grid (viewpoint cell) to the next (target cell). My goal was to quantify the area
observed by a golden eagle from its nest (within 1.61 km); assuming cliffs or canyons
hinder the potential 360° view. I considered the value obtained from a 1.61 km buffer)
with a 0-360° view as the attribute for viewshed (km2). Viewshed was visually
represented using ArcScene 10.1 (ESRI 2011). A visual example of this attribute is
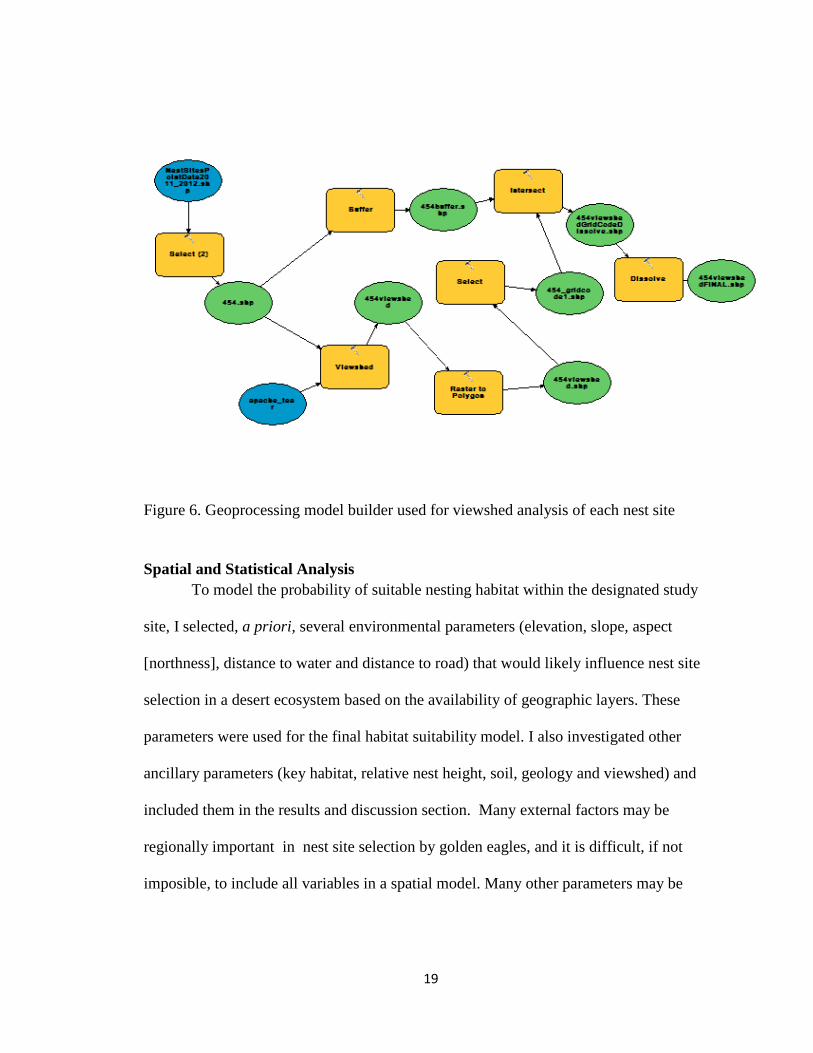
shown in Fig. 5. I used a geoprocessing model builder for this analysis (Fig. 6).
18
Figure 5. ArcScene 3D aerial view of a nest site location with viewshed attribute
19
Figure 6. Geoprocessing model builder used for viewshed analysis of each nest site
Spatial and Statistical Analysis
To model the probability of suitable nesting habitat within the designated study
site, I selected, a priori, several environmental parameters (elevation, slope, aspect
[northness], distance to water and distance to road) that would likely influence nest site
selection in a desert ecosystem based on the availability of geographic layers. These
parameters were used for the final habitat suitability model. I also investigated other
ancillary parameters (key habitat, relative nest height, soil, geology and viewshed) and
included them in the results and discussion section. Many external factors may be
regionally important in nest site selection by golden eagles, and it is difficult, if not
imposible, to include all variables in a spatial model. Many other parameters may be
20
important for nest site selection by eagles (e.g. proximity to hunting grounds and relation
to other nests); however, I was constrained by the GIS layers available for the study site.
I applied general descriptive statistics to the dataset and investigated general
trends in the data such as overall nest occupancy by year and productivity by year and
mountain range. All instances of occupied nests were lumped together and counted once
for productivity. If a nest site was occupied in multiple years, it was counted only once in
the following analyses.
I tested for significant differences in productivity between ecoregions. I examined
nesting chronology and reported general trends using dates and timing of nesting
behaviors (egg laying, hatching and fledging). I described nest abundance (total number
of nest sites observed) and density (number of nest sites/km2) for each ecoregion and
summarized the ancillary environmental parameters for each nest site. The height of each
nest in relation to its overall cliff height was also investigated.
Environmental parameters involved in nest site selection were investigated.
General trends in nest site selection were described including surrounding key habitat,
mountain range, cliff height in relation to total height, soils, geological formation and
viewshed. The characteristics of those parameters were not used in the final habitat
suitability model; however, these are important in terms of characterization of the
environment. For the model, occupied nests versus unoccupied nests and all combined
nest sites versus randomized pseudo-absence nest sites were compared. For this analysis,
elevation, slope, aspect (converted to northness), distance to water and distance to road
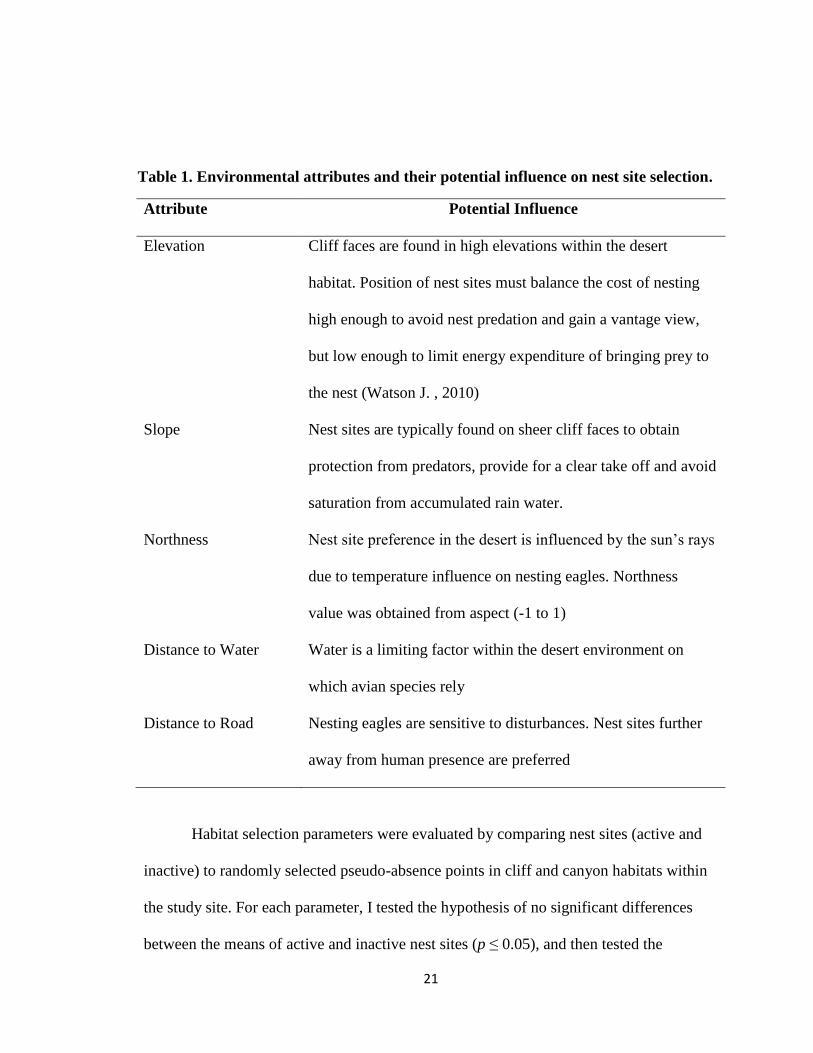
were used. Environmental attributes and their potential influence are shown in Table 1.
21
Table 1. Environmental attributes and their potential influence on nest site selection.
Attribute Potential Influence
Elevation Cliff faces are found in high elevations within the desert
habitat. Position of nest sites must balance the cost of nesting
high enough to avoid nest predation and gain a vantage view,
but low enough to limit energy expenditure of bringing prey to
the nest (Watson J. , 2010)
Slope Nest sites are typically found on sheer cliff faces to obtain
protection from predators, provide for a clear take off and avoid
saturation from accumulated rain water.
Northness Nest site preference in the desert is influenced by the sun’s rays
due to temperature influence on nesting eagles. Northness
value was obtained from aspect (-1 to 1)
Distance to Water Water is a limiting factor within the desert environment on
which avian species rely
Distance to Road Nesting eagles are sensitive to disturbances. Nest sites further
away from human presence are preferred
Habitat selection parameters were evaluated by comparing nest sites (active and
inactive) to randomly selected pseudo-absence points in cliff and canyon habitats within
the study site. For each parameter, I tested the hypothesis of no significant differences
between the means of active and inactive nest sites (p ≤ 0.05), and then tested the
22
hypothesis of no significant differences between the combined nest sites (active and
inactive) and pseudo-absent nest sites (p ≤ 0.05).
I evaluated habitat selection by using a series of logistic regressions (generalized
linear models with a binomial error distribution and a logit link function). I tested
whether golden eagle nest sites (coded as = 1) could be distinguished from pseudo-absent
nest sites (coded as = 0) based on the previously discussed environmental parameters.
Each predictor value was then weighted and ranked according to its strength in
representing the data. The final model was used to predict the potential distribution of
golden eagle nest sites using the program MaxEnt.
Breeding territories generally vary in size and configuration with topography and
prey availability (Gulf South Resource Corporation 2012). A nesting territory for the
purposes of this study was an area that contained, or historically contained, one or more
nests within the home range of a mated pair. Golden eagles live in more or less discrete
home ranges and tend to use nesting sites that are evenly spaced over the landscape
(Newton 1979). This pattern of nesting, known as over-dispersion, means that when sites
are plotted on a map they appear regularly distributed; much more regularly than if birds
were selecting nest sites at random (Watson 2010). Regular spacing of nest sites is the
norm with golden eagles because territorial pairs appear to select nest sites as far from
their neighbors as conditions will allow (Watson 2010). In order to test whether nest sites
were selected at random or whether over-dispersion was found, I applied a nearest
neighbor analysis to the active nests observed in the Great Basin and Mojave Desert
ecoregions (over four years). Territory delineations were then mapped using the mean
inter-nest distance extrapolated over all active nest sites.
23
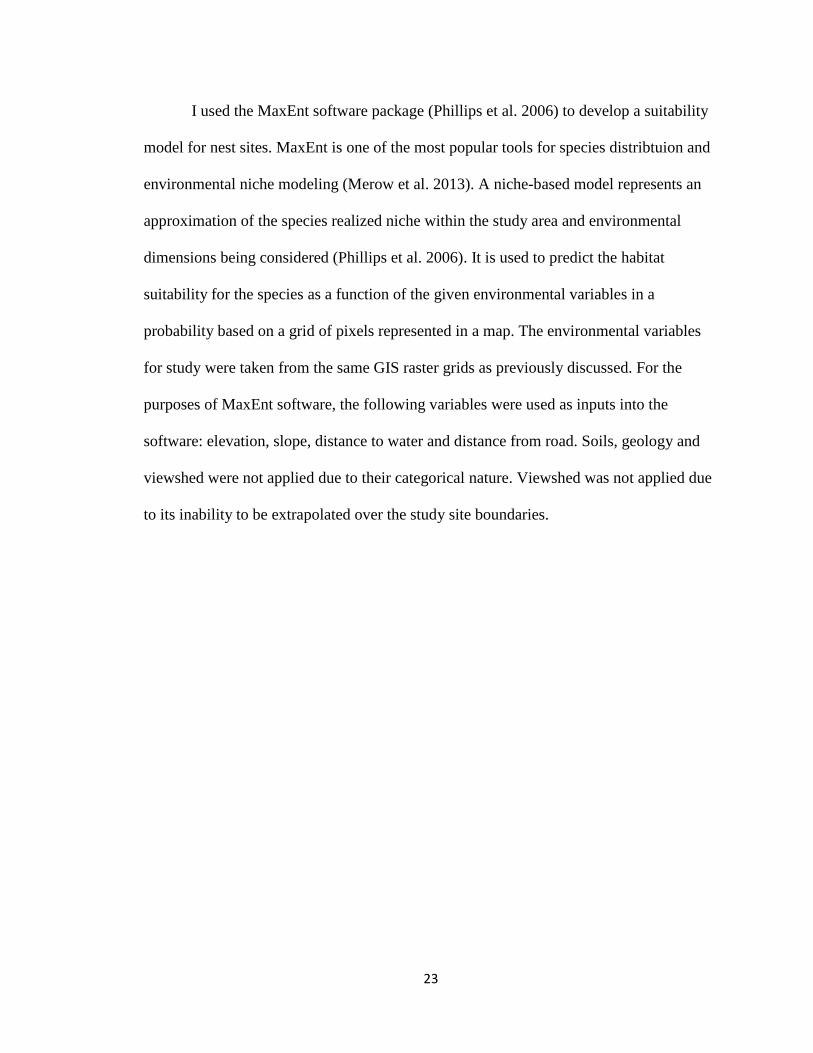
I used the MaxEnt software package (Phillips et al. 2006) to develop a suitability
model for nest sites. MaxEnt is one of the most popular tools for species distribtuion and
environmental niche modeling (Merow et al. 2013). A niche-based model represents an
approximation of the species realized niche within the study area and environmental
dimensions being considered (Phillips et al. 2006). It is used to predict the habitat
suitability for the species as a function of the given environmental variables in a
probability based on a grid of pixels represented in a map. The environmental variables
for study were taken from the same GIS raster grids as previously discussed. For the
purposes of MaxEnt software, the following variables were used as inputs into the
software: elevation, slope, distance to water and distance from road. Soils, geology and
viewshed were not applied due to their categorical nature. Viewshed was not applied due
to its inability to be extrapolated over the study site boundaries.
24
CHAPTER 3
RESULTS
Nesting Productivity
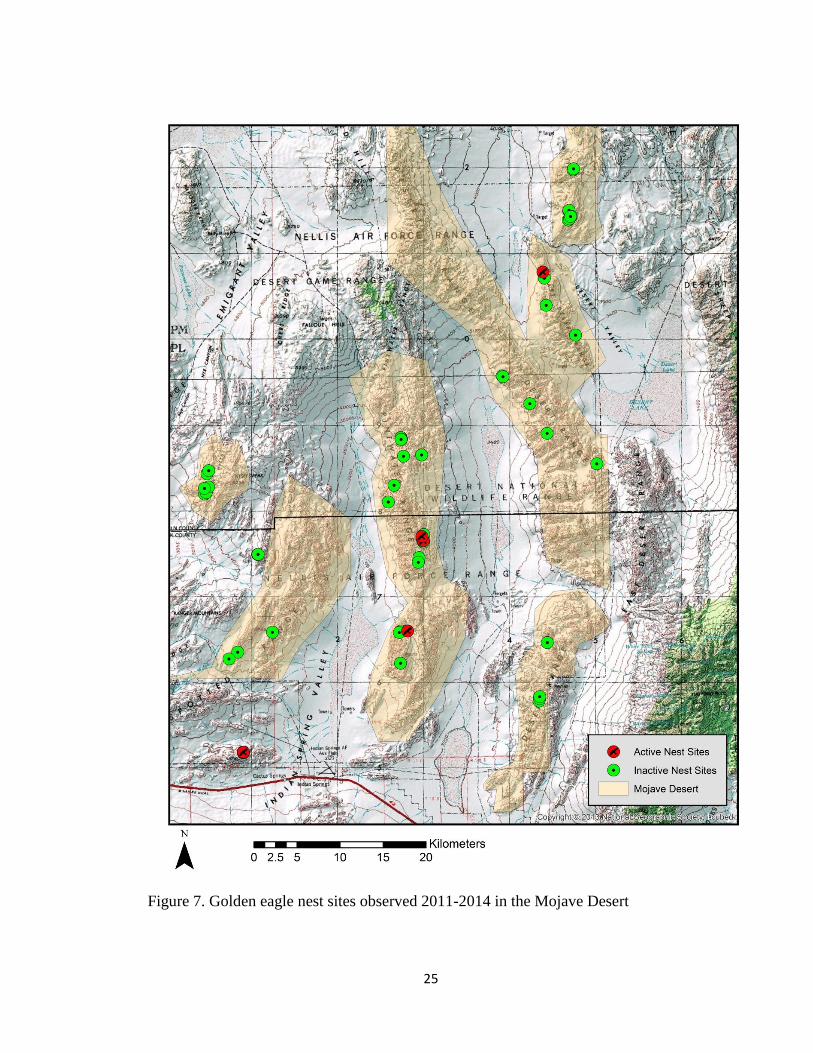
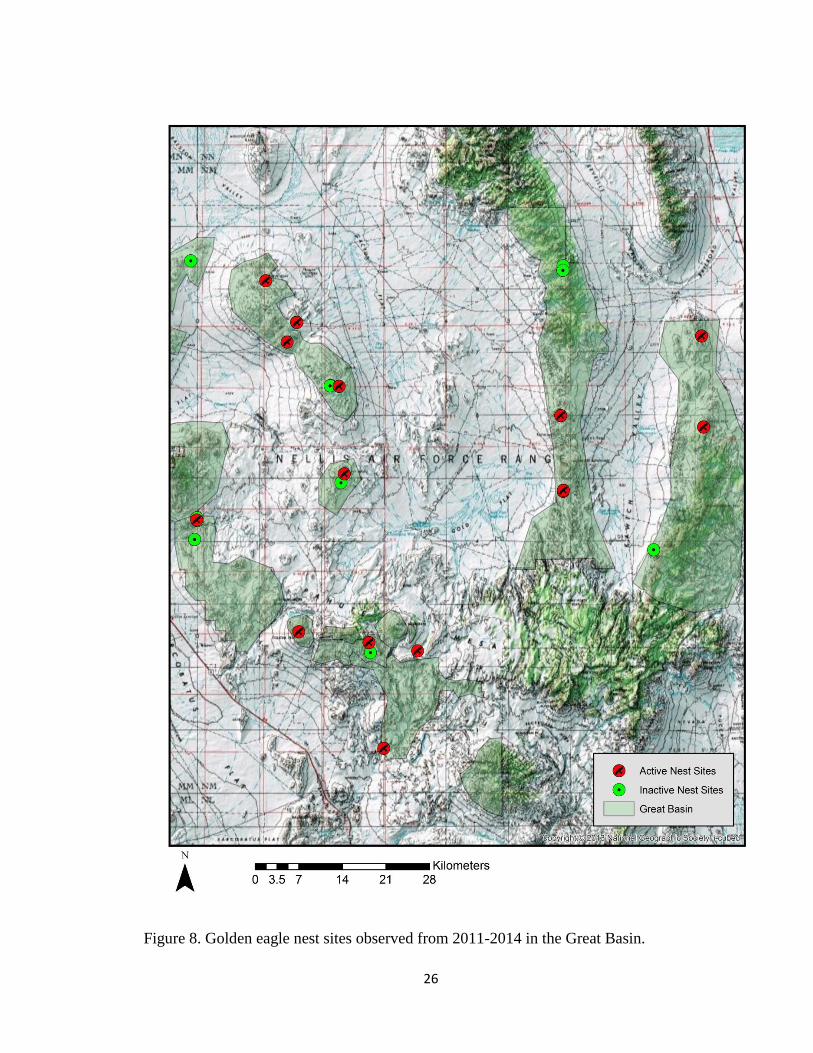
Ninety-six nest sites were identified as golden eagles within my study sites from
2011-2014. Of these nest sites, 65 occurred in the Mojave Desert ecoregion (Fig. 7) and
31 in the Great Basin ecoregion (Fig. 8). During four years of observations, 22 nests
(71%) were occupied in the Great Basin ecoregion, and only 5 (8%) were inhabited in the
Mojave Desert ecoregion. A total of 36 eaglets (96%) successfully fledged during the
four-year study, three in the Mojave Desert ecoregion and 33 in the Great Basin
ecoregion. During the study, one eaglet failed to fledge and the status of one other was
unknown.
Nest productivity significantly varied by ecoregion (Table 1). In 2011, eight nests
occupied in the Great Basin ecoregion produced 13 young (successful fledges). No nests
were observed with chicks or eggs in the Mojave Desert ecoregion. In 2012, only one
nest in the Great Basin ecoregion was active throughout the year. This nest produced a
single eaglet that successfully fledged. In 2013, nine nests in the Great Basin ecoregion
produced 14 young and one nest in the Mojave Desert ecoregion produced one young. In
2014, the Great Basin ecoregion had four occupied nests that produced five young. The
Mojave Desert ecoregion had four occupied nests, however, only two nests fledged
young. One nest failed (chick observed dead) and the status of another nest was
unknown. The unknown fledgling was not observed on the final survey after 51 days
post-hatching.
25
Figure 7. Golden eagle nest sites observed 2011-2014 in the Mojave Desert
26
Figure 8. Golden eagle nest sites observed from 2011-2014 in the Great Basin.
27
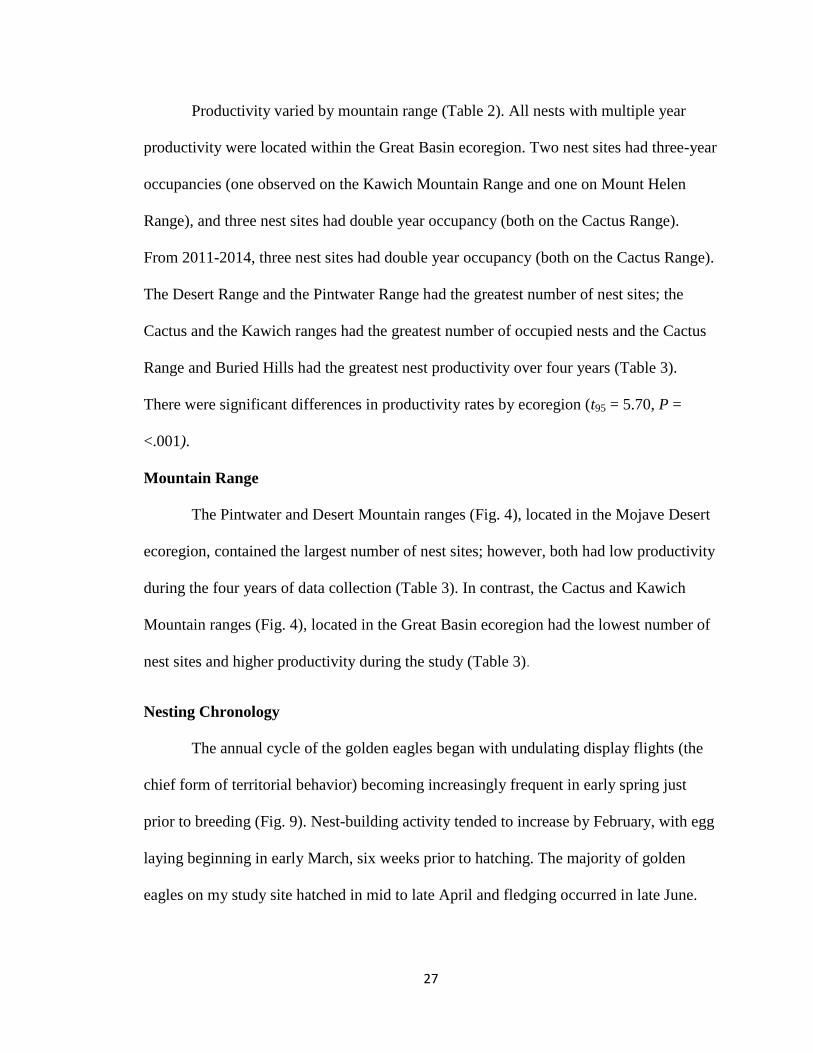
Productivity varied by mountain range (Table 2). All nests with multiple year
productivity were located within the Great Basin ecoregion. Two nest sites had three-year
occupancies (one observed on the Kawich Mountain Range and one on Mount Helen
Range), and three nest sites had double year occupancy (both on the Cactus Range).
From 2011-2014, three nest sites had double year occupancy (both on the Cactus Range).
The Desert Range and the Pintwater Range had the greatest number of nest sites; the
Cactus and the Kawich ranges had the greatest number of occupied nests and the Cactus
Range and Buried Hills had the greatest nest productivity over four years (Table 3).
There were significant differences in productivity rates by ecoregion (t95 = 5.70, P =
<.001).
Mountain Range
The Pintwater and Desert Mountain ranges (Fig. 4), located in the Mojave Desert
ecoregion, contained the largest number of nest sites; however, both had low productivity
during the four years of data collection (Table 3). In contrast, the Cactus and Kawich
Mountain ranges (Fig. 4), located in the Great Basin ecoregion had the lowest number of
nest sites and higher productivity during the study (Table 3).
Nesting Chronology
The annual cycle of the golden eagles began with undulating display flights (the
chief form of territorial behavior) becoming increasingly frequent in early spring just
prior to breeding (Fig. 9). Nest-building activity tended to increase by February, with egg
laying beginning in early March, six weeks prior to hatching. The majority of golden
eagles on my study site hatched in mid to late April and fledging occurred in late June.
28
There was little variability (1-2 weeks) in the different stages of the cycle in the Mohave
Desert and Great Basin ecosystems.
Nest Site Abundance and Density
Although a greater percentage of occupied nests occurred in the Great Basin
ecosystem, the amount of nesting habitat and number of historic or old/abandoned nest
sites in the Mojave Desert far outnumber those of the Great Basin ecosystem. The
quantity of cliff and canyon nesting habitats (263.7 km2) in the Mojave Desert ecoregion
was 10.4-fold greater than the quantity (25.3 km2) of cliff and canyon nesting habitats in
the Great Basin ecoregion. By normalizing the number of nests to the amount of available
nesting habitat (cliffs and canyons)
total nest density of 1.23 nests/km2 was obtained for the Great Basin ecosystem and 0.25
nests/km2 for the Mojave Desert ecoregion (Table 4).
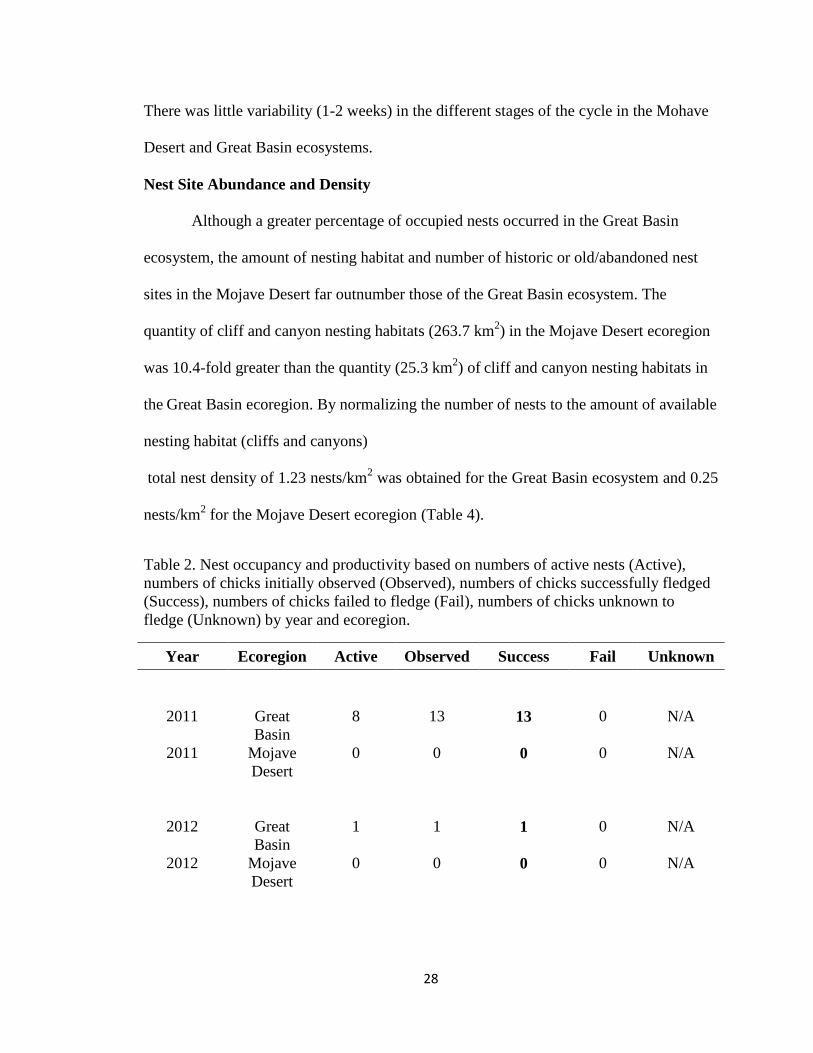
Table 2. Nest occupancy and productivity based on numbers of active nests (Active),
numbers of chicks initially observed (Observed), numbers of chicks successfully fledged
(Success), numbers of chicks failed to fledge (Fail), numbers of chicks unknown to
fledge (Unknown) by year and ecoregion.
Year Ecoregion Active Observed Success Fail Unknown
2011 Great
Basin
8 13 13 0 N/A
2011 Mojave
Desert
0 0 0 0 N/A
2012 Great
Basin
1 1 1 0 N/A
2012 Mojave
Desert
0 0 0 0 N/A
29
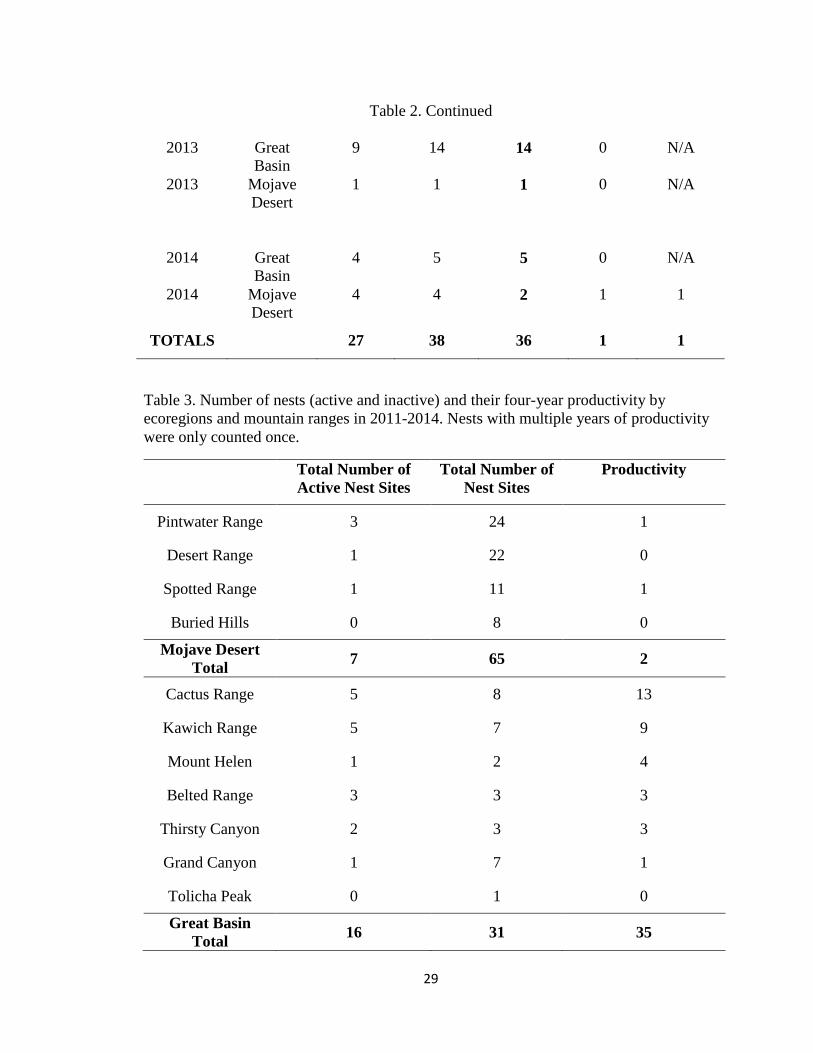
Table 2. Continued
2013 Great
Basin
9 14 14 0 N/A
2013 Mojave
Desert
1 1 1 0 N/A
2014 Great
Basin
4 5 5 0 N/A
2014 Mojave
Desert
4 4 2 1 1
TOTALS 27 38 36 1 1
Table 3. Number of nests (active and inactive) and their four-year productivity by
ecoregions and mountain ranges in 2011-2014. Nests with multiple years of productivity
were only counted once.
Total Number of
Active Nest Sites
Total Number of
Nest Sites
Productivity
Pintwater Range 3 24 1
Desert Range 1 22 0
Spotted Range 1 11 1
Buried Hills 0 8 0
Mojave Desert
Total 7 65 2
Cactus Range 5 8 13
Kawich Range 5 7 9
Mount Helen 1 2 4
Belted Range 3 3 3
Thirsty Canyon 2 3 3
Grand Canyon 1 7 1
Tolicha Peak 0 1 0
Great Basin
Total 16 31 35
30
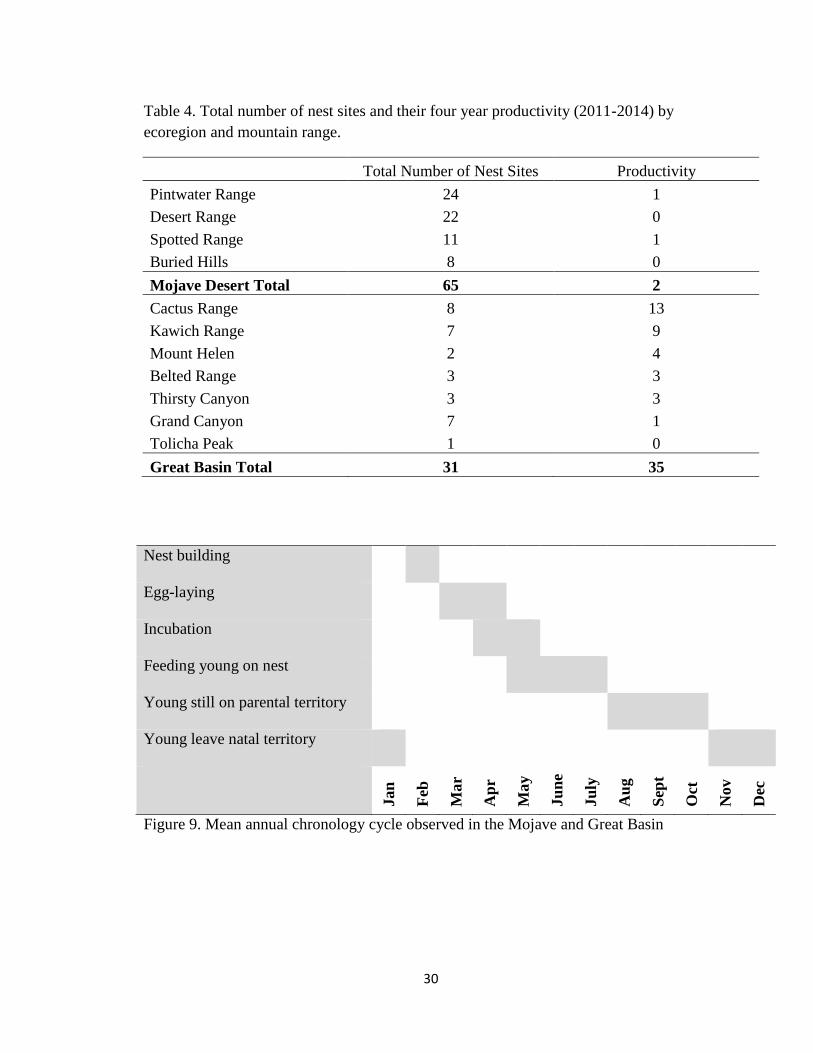
Table 4. Total number of nest sites and their four year productivity (2011-2014) by
ecoregion and mountain range.
Total Number of Nest Sites Productivity
Pintwater Range 24 1
Desert Range 22 0
Spotted Range 11 1
Buried Hills 8 0
Mojave Desert Total 65 2
Cactus Range 8 13
Kawich Range 7 9
Mount Helen 2 4
Belted Range 3 3
Thirsty Canyon 3 3
Grand Canyon 7 1
Tolicha Peak 1 0
Great Basin Total 31 35
Nest building
Egg-laying
Incubation
Feeding young on nest
Young still on parental territory
Young leave natal territory
Jan
Feb
Mar
Ap
r
May
Ju
ne
Ju
ly
Au
g
Sep
t
Oct
Nov
Dec
Figure 9. Mean annual chronology cycle observed in the Mojave and Great Basin
31
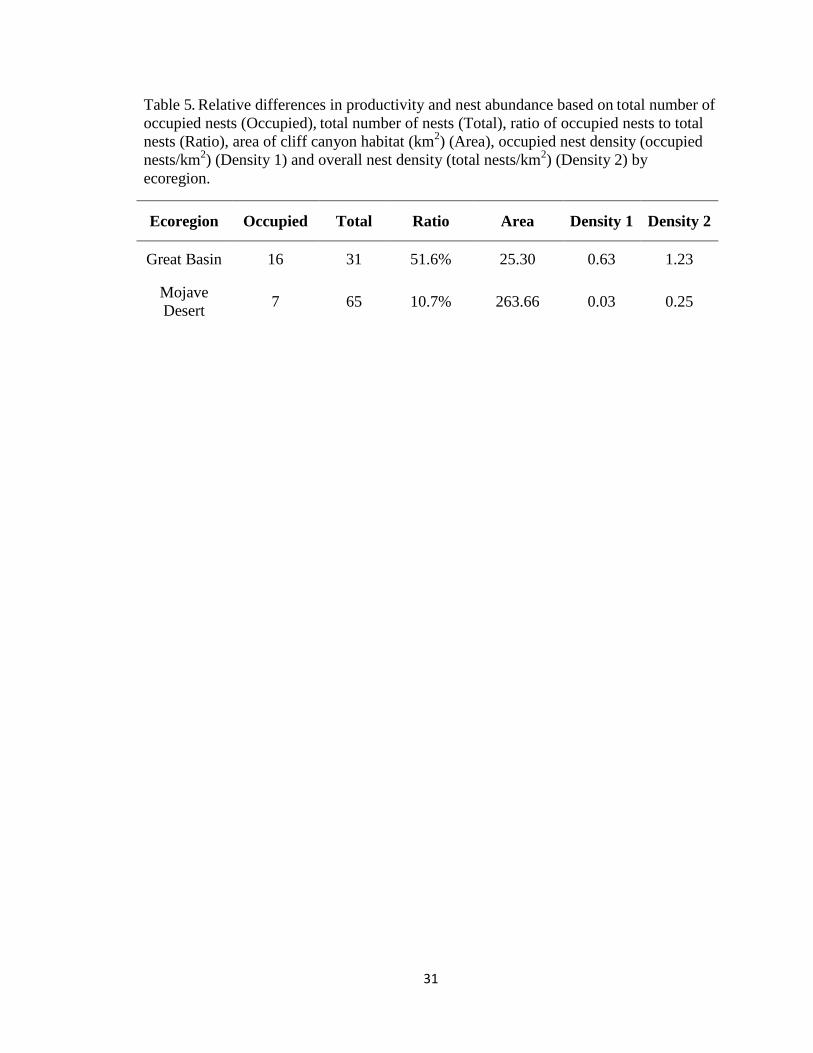
Table 5. Relative differences in productivity and nest abundance based on total number of
occupied nests (Occupied), total number of nests (Total), ratio of occupied nests to total
nests (Ratio), area of cliff canyon habitat (km2) (Area), occupied nest density (occupied
nests/km2) (Density 1) and overall nest density (total nests/km
2) (Density 2) by
ecoregion.
Ecoregion Occupied Total Ratio Area Density 1 Density 2
Great Basin 16 31 51.6% 25.30 0.63 1.23
Mojave
Desert 7 65 10.7% 263.66 0.03 0.25
32
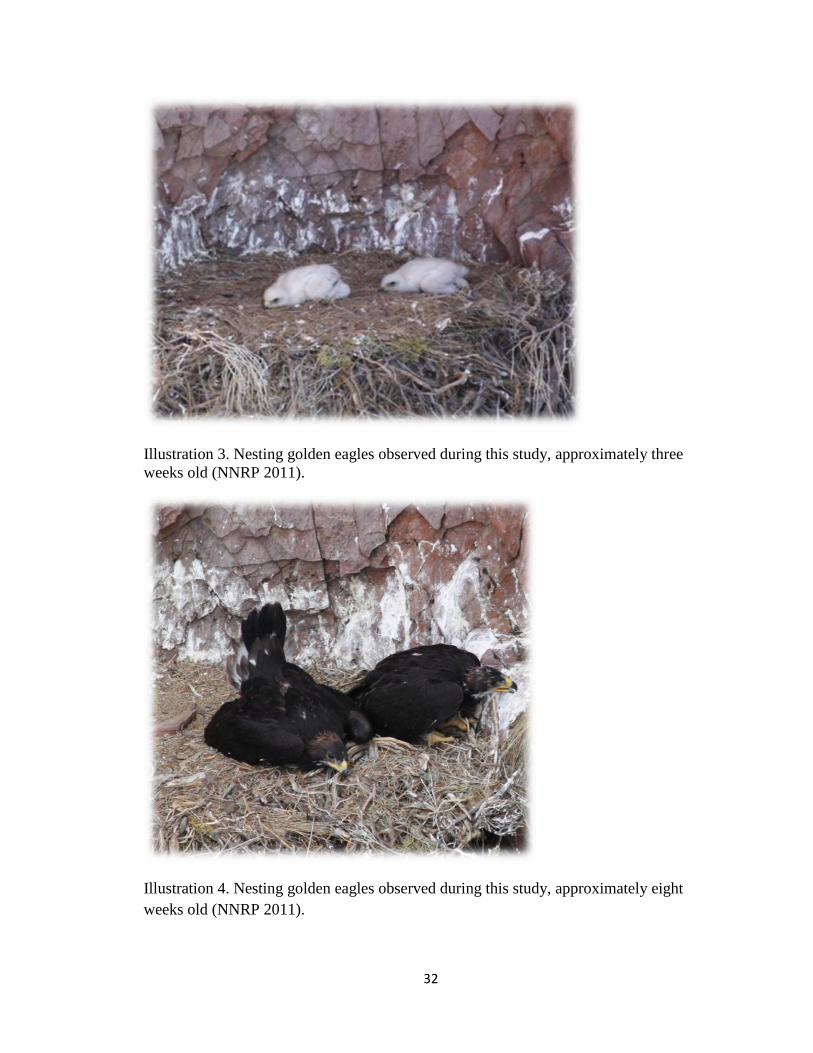
Illustration 3. Nesting golden eagles observed during this study, approximately three
weeks old (NNRP 2011).
Illustration 4. Nesting golden eagles observed during this study, approximately eight
weeks old (NNRP 2011).
33
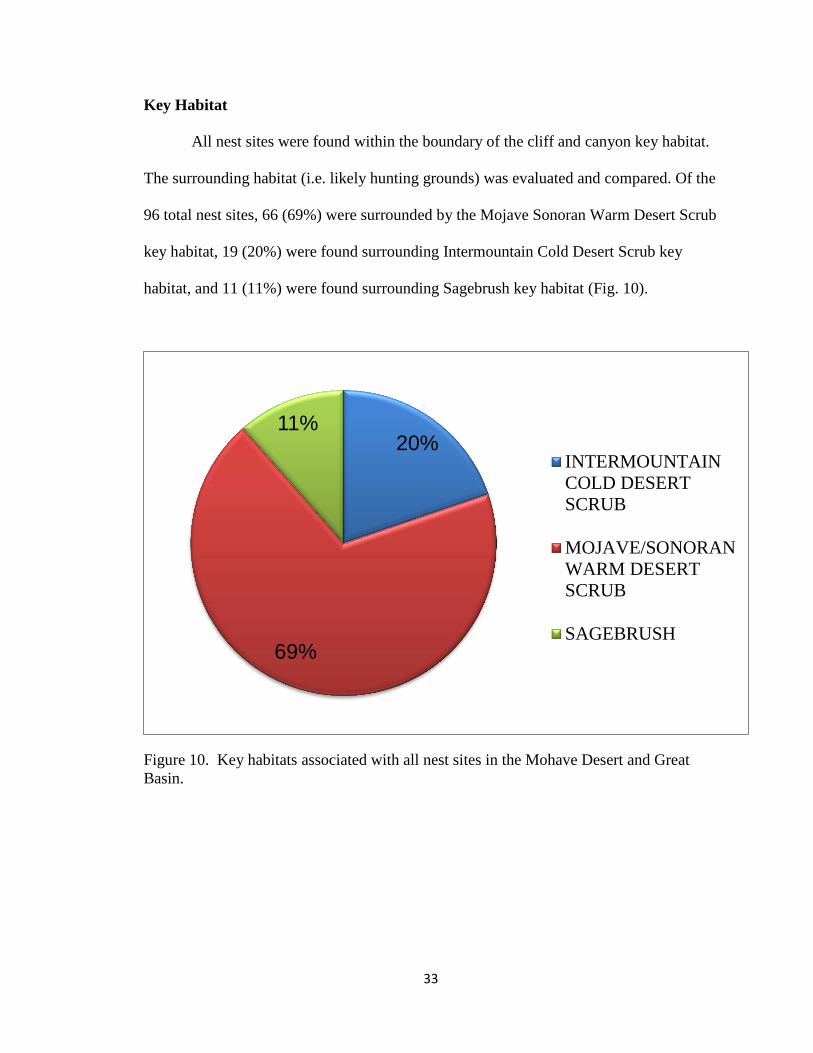
Key Habitat
All nest sites were found within the boundary of the cliff and canyon key habitat.
The surrounding habitat (i.e. likely hunting grounds) was evaluated and compared. Of the
96 total nest sites, 66 (69%) were surrounded by the Mojave Sonoran Warm Desert Scrub
key habitat, 19 (20%) were found surrounding Intermountain Cold Desert Scrub key
habitat, and 11 (11%) were found surrounding Sagebrush key habitat (Fig. 10).
Figure 10. Key habitats associated with all nest sites in the Mohave Desert and Great
Basin.
20%
69%
11%
INTERMOUNTAIN
COLD DESERT
SCRUB
MOJAVE/SONORAN
WARM DESERT
SCRUB
SAGEBRUSH
34
Relative Nesting Height
The mean ratio of nesting height to total cliff height was 0.69 ±0.21, with a range of
0.33 to 1.00. This one occasion (1.00) was a nest site observed sitting on top of the cliff,
however the nest site was unoccupied across all the years of the survey.
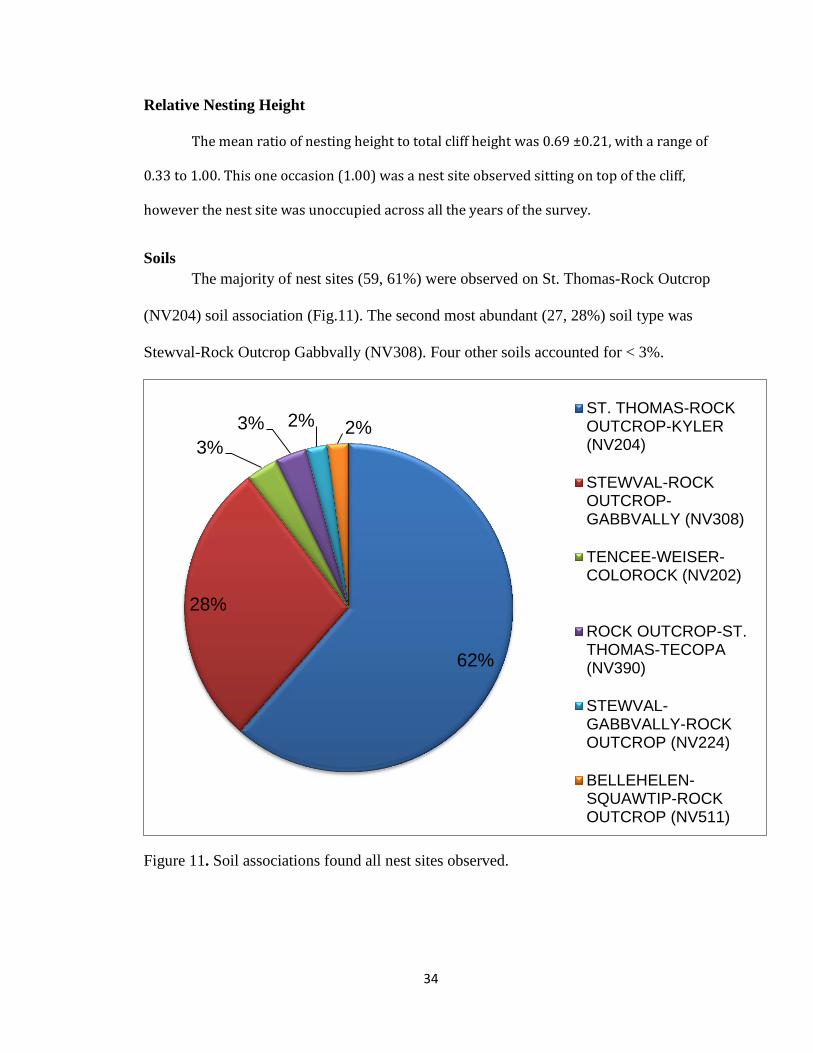
Soils
The majority of nest sites (59, 61%) were observed on St. Thomas-Rock Outcrop
(NV204) soil association (Fig.11). The second most abundant (27, 28%) soil type was
Stewval-Rock Outcrop Gabbvally (NV308). Four other soils accounted for < 3%.
Figure 11. Soil associations found all nest sites observed.
62%
28%
3%
3% 2% 2% ST. THOMAS-ROCKOUTCROP-KYLER(NV204)
STEWVAL-ROCKOUTCROP-GABBVALLY (NV308)
TENCEE-WEISER-COLOROCK (NV202)
ROCK OUTCROP-ST.THOMAS-TECOPA(NV390)
STEWVAL-GABBVALLY-ROCKOUTCROP (NV224)
BELLEHELEN-SQUAWTIP-ROCKOUTCROP (NV511)
35
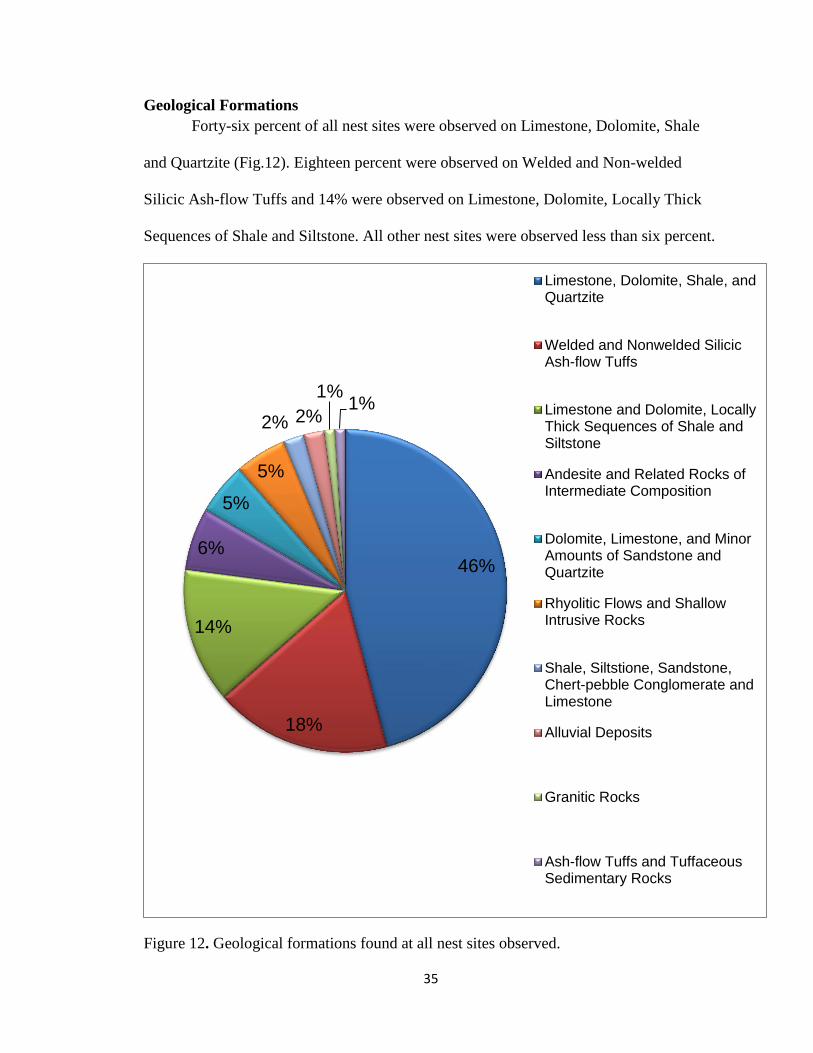
Geological Formations
Forty-six percent of all nest sites were observed on Limestone, Dolomite, Shale
and Quartzite (Fig.12). Eighteen percent were observed on Welded and Non-welded
Silicic Ash-flow Tuffs and 14% were observed on Limestone, Dolomite, Locally Thick
Sequences of Shale and Siltstone. All other nest sites were observed less than six percent.
Figure 12. Geological formations found at all nest sites observed.
46%
18%
14%
6%
5%
5%
2% 2%
1% 1%
Limestone, Dolomite, Shale, andQuartzite
Welded and Nonwelded SilicicAsh-flow Tuffs
Limestone and Dolomite, LocallyThick Sequences of Shale andSiltstone
Andesite and Related Rocks ofIntermediate Composition
Dolomite, Limestone, and MinorAmounts of Sandstone andQuartzite
Rhyolitic Flows and ShallowIntrusive Rocks
Shale, Siltstione, Sandstone,Chert-pebble Conglomerate andLimestone
Alluvial Deposits
Granitic Rocks
Ash-flow Tuffs and TuffaceousSedimentary Rocks
36
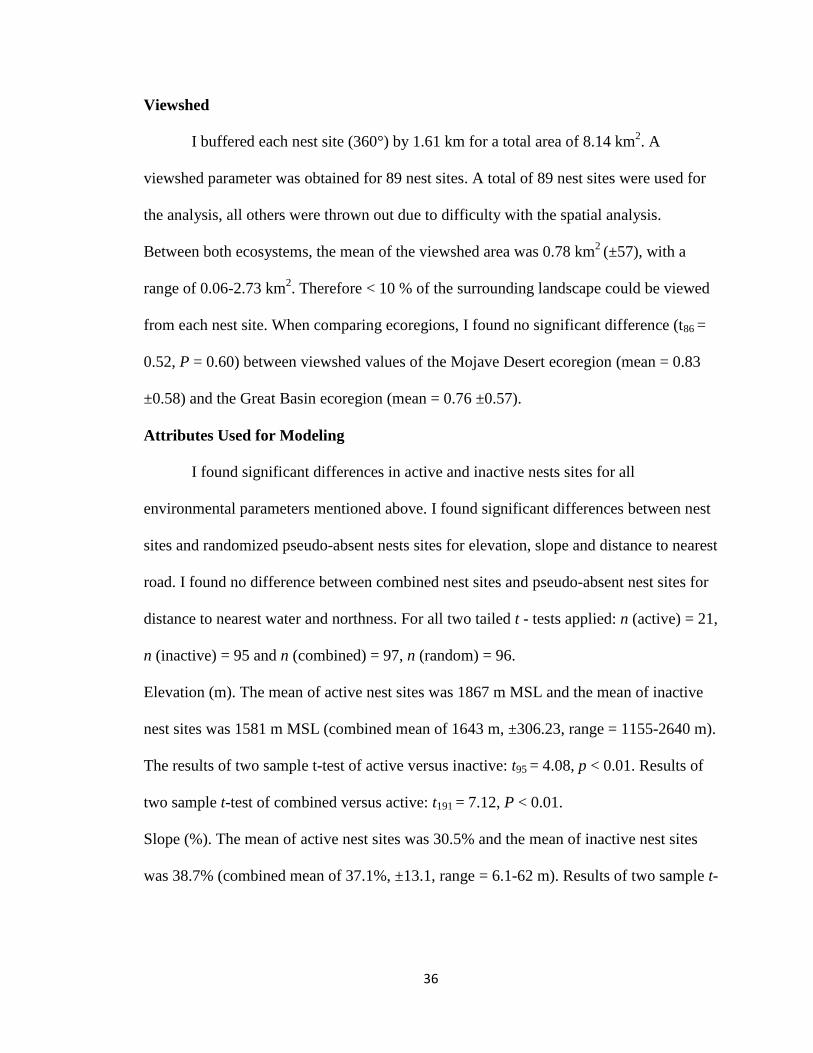
Viewshed
I buffered each nest site (360°) by 1.61 km for a total area of 8.14 km2. A
viewshed parameter was obtained for 89 nest sites. A total of 89 nest sites were used for
the analysis, all others were thrown out due to difficulty with the spatial analysis.
Between both ecosystems, the mean of the viewshed area was 0.78 km2
(±57), with a
range of 0.06-2.73 km2. Therefore < 10 % of the surrounding landscape could be viewed
from each nest site. When comparing ecoregions, I found no significant difference (t86 =
0.52, P = 0.60) between viewshed values of the Mojave Desert ecoregion (mean = 0.83
±0.58) and the Great Basin ecoregion (mean = 0.76 ±0.57).
Attributes Used for Modeling
I found significant differences in active and inactive nests sites for all
environmental parameters mentioned above. I found significant differences between nest
sites and randomized pseudo-absent nests sites for elevation, slope and distance to nearest
road. I found no difference between combined nest sites and pseudo-absent nest sites for
distance to nearest water and northness. For all two tailed t - tests applied: n (active) = 21,
n (inactive) = 95 and n (combined) = 97, n (random) = 96.
Elevation (m). The mean of active nest sites was 1867 m MSL and the mean of inactive
nest sites was 1581 m MSL (combined mean of 1643 m, ±306.23, range = 1155-2640 m).
The results of two sample t-test of active versus inactive: t95 = 4.08, p < 0.01. Results of
two sample t-test of combined versus active: t191 = 7.12, P < 0.01.
Slope (%). The mean of active nest sites was 30.5% and the mean of inactive nest sites
was 38.7% (combined mean of 37.1%, ±13.1, range = 6.1-62 m). Results of two sample t-
37
test of active versus inactive: t94 = -2.62, p = 0.005. Results of two sample t-test of
combined versus active: t190 = 6.39, p < 0.01.
Distance to Nearest Road (km). The mean of active nest sites was 3.62 km and the mean
of inactive nest sites was 5.01 km to the nearest road (combined mean of 4.73, ±1.47,
range. = 0.1-9.83 km). Results of two sample t-test of active versus inactive: t28 = -2.26, p
= 0.03. The results of two sample t-test of combined versus active: t191 = 3.07, p = 0.002.
Distance to Water (km). The mean of active nest sites was 3.57 km and the mean of
inactive nest sites was 6.55 km to water (combined mean of 5.91, SD = 3.48, min. = 0.18,
max. = 19.2 km). Results of two sample t-test of active versus inactive: t95 -2.20, p =
0.03. Results of two sample t-test of combined versus active: t191= 1.65, p = 0.10.
Northness (-1 to 1). The mean of active nest sites was 0.05 and the mean of inactive nest
sites was 0.06 (combined mean of 0.06, ±0.68, range = -099-1.00). Results of two sample
t-test of active versus inactive: t94 = 0.03, p = 0.97. Results of two sample t-test of
combined versus active: t190 = 0.71, p = 0.48.
Logistic Regression Analysis
A series of logistic regressions were used to model nest site selection from nesting
parameters, and information-theoretic model selection was used to rank candidate models
using Akaike’s Information Criterion (AICc) corrected for small-sample size and
associated Akaike weights (Table 6). The model with the lowest AICc value was
determined the best model representing the data. This model consisted of Elevation +
Slope + Distance to Water. Northness was thrown out due to its lack of influence as a
variable.
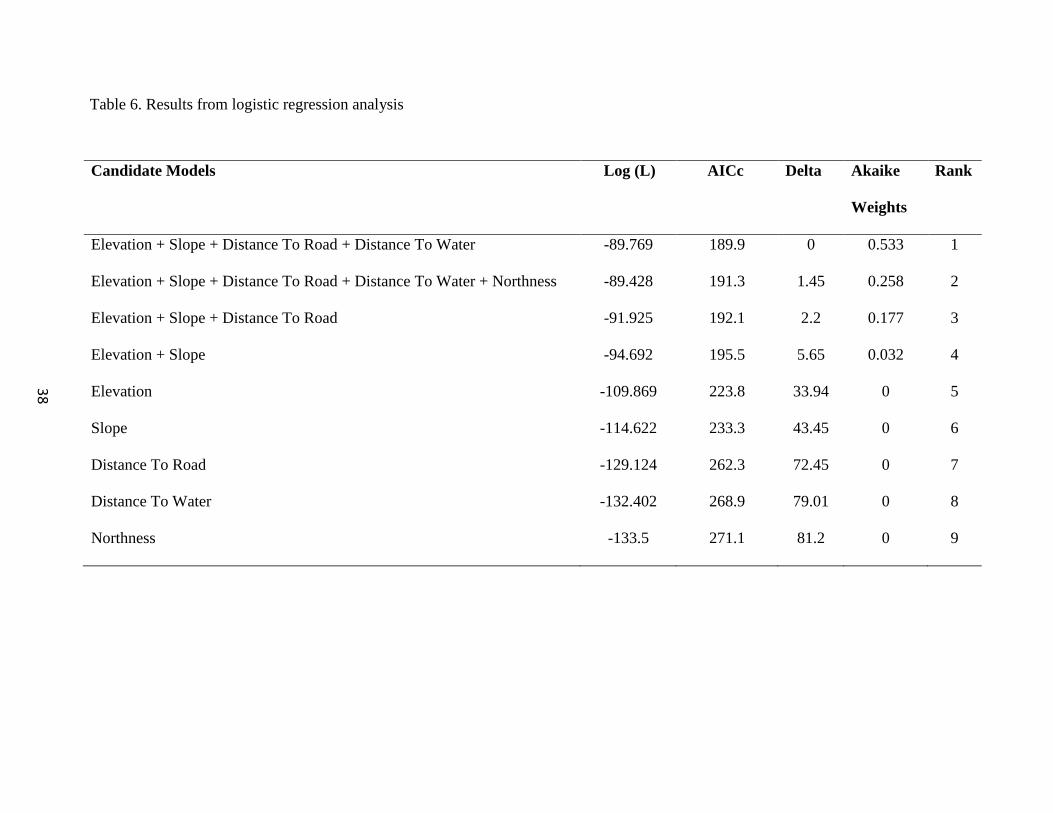
Table 6. Results from logistic regression analysis
Candidate Models Log (L) AICc Delta Akaike
Weights
Rank
Elevation + Slope + Distance To Road + Distance To Water -89.769 189.9 0 0.533 1
Elevation + Slope + Distance To Road + Distance To Water + Northness -89.428 191.3 1.45 0.258 2
Elevation + Slope + Distance To Road -91.925 192.1 2.2 0.177 3
Elevation + Slope -94.692 195.5 5.65 0.032 4
Elevation -109.869 223.8 33.94 0 5
Slope -114.622 233.3 43.45 0 6
Distance To Road -129.124 262.3 72.45 0 7
Distance To Water -132.402 268.9 79.01 0 8
Northness -133.5 271.1 81.2 0 9
38
39
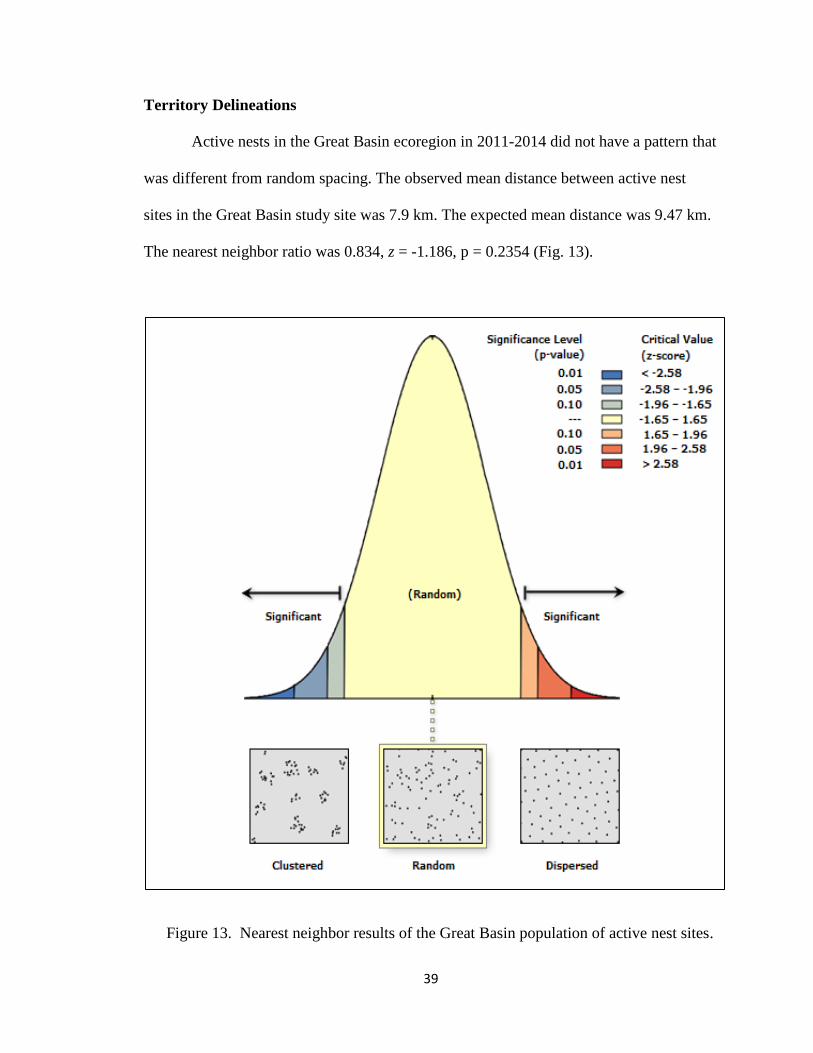
Territory Delineations
Active nests in the Great Basin ecoregion in 2011-2014 did not have a pattern that
was different from random spacing. The observed mean distance between active nest
sites in the Great Basin study site was 7.9 km. The expected mean distance was 9.47 km.
The nearest neighbor ratio was 0.834, z = -1.186, p = 0.2354 (Fig. 13).
Figure 13. Nearest neighbor results of the Great Basin population of active nest sites.
40
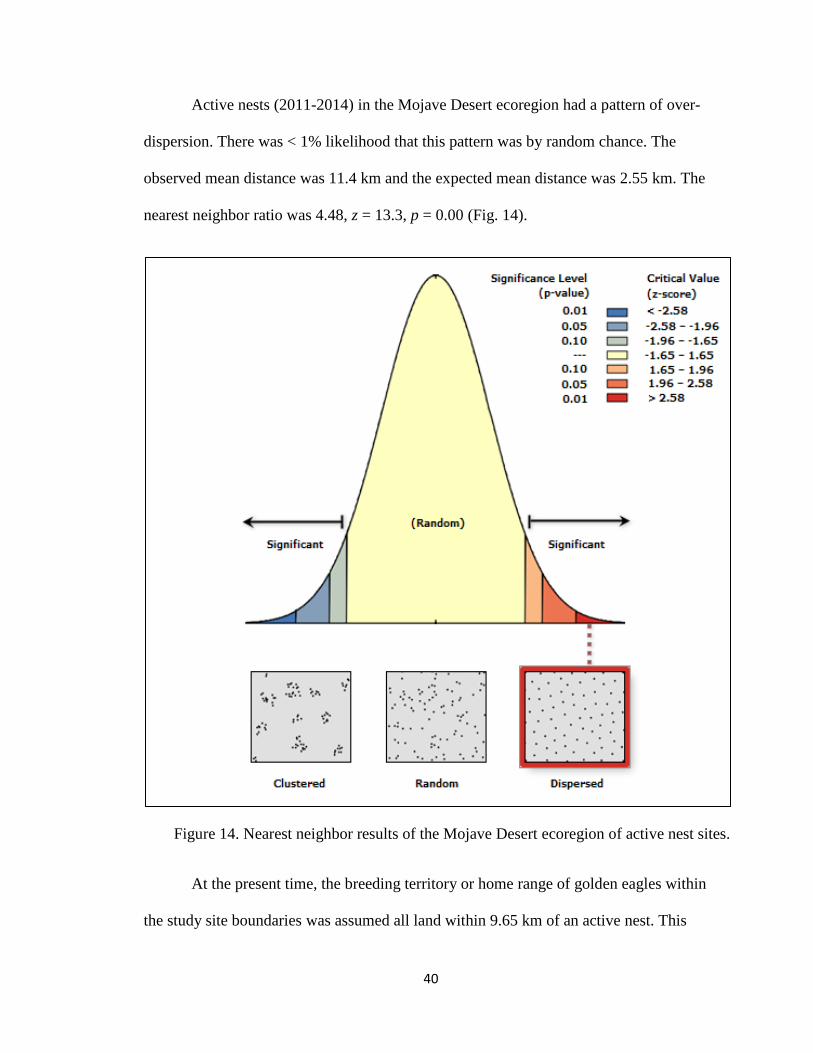
Active nests (2011-2014) in the Mojave Desert ecoregion had a pattern of over-
dispersion. There was < 1% likelihood that this pattern was by random chance. The
observed mean distance was 11.4 km and the expected mean distance was 2.55 km. The
nearest neighbor ratio was 4.48, z = 13.3, p = 0.00 (Fig. 14).
Figure 14. Nearest neighbor results of the Mojave Desert ecoregion of active nest sites.
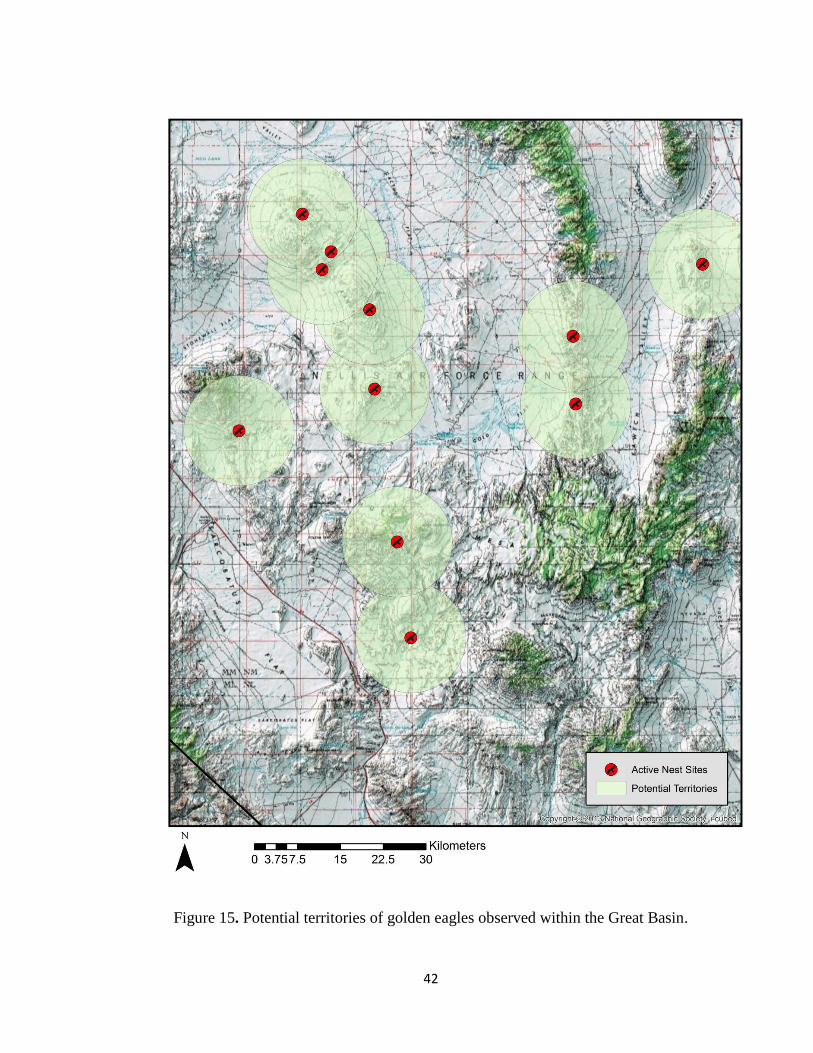
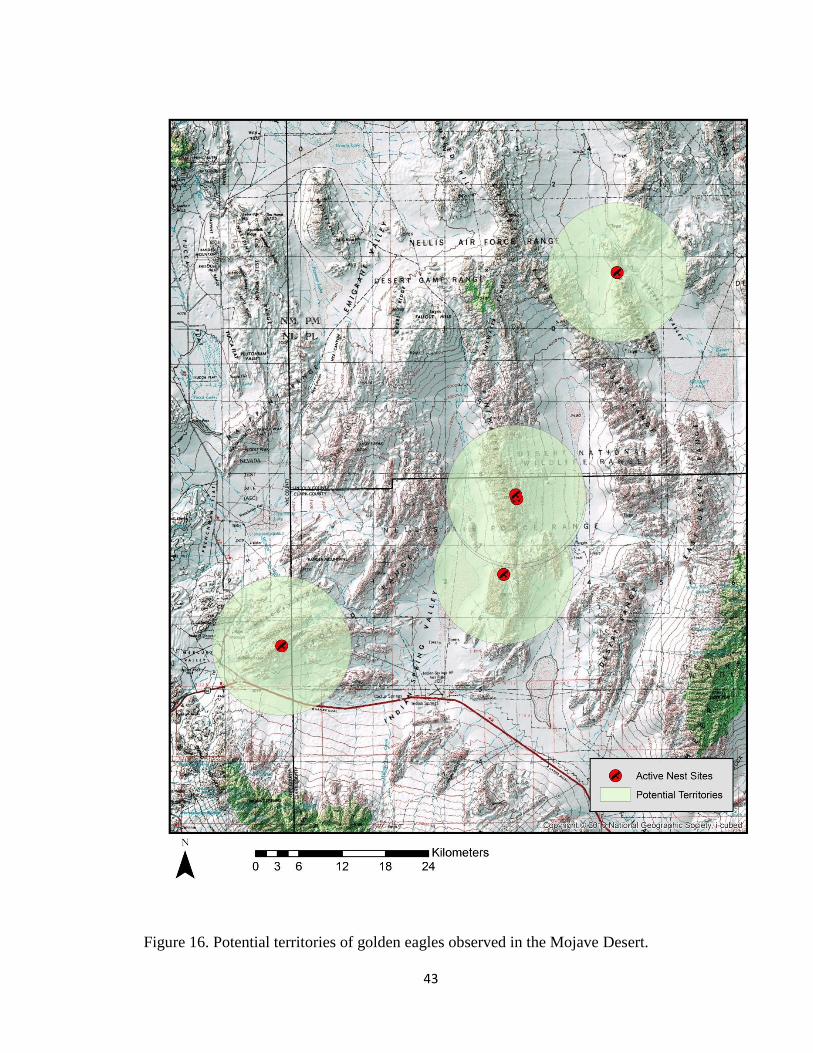
At the present time, the breeding territory or home range of golden eagles within
the study site boundaries was assumed all land within 9.65 km of an active nest. This

41
figure (Fig. 15) is the mean inter-nest distance of both the Great Basin and Mojave Desert
ecoregions combined. This coincides with the 9.98 km guideline adopted from a draft
Golden Eagle Guidance Document (Gulf South Resource Corporation 2012). Active nest
sites with delineated territories are found in Fig. 15 and Fig. 16.
42
Figure 15. Potential territories of golden eagles observed within the Great Basin.
43
Figure 16. Potential territories of golden eagles observed in the Mojave Desert.
44
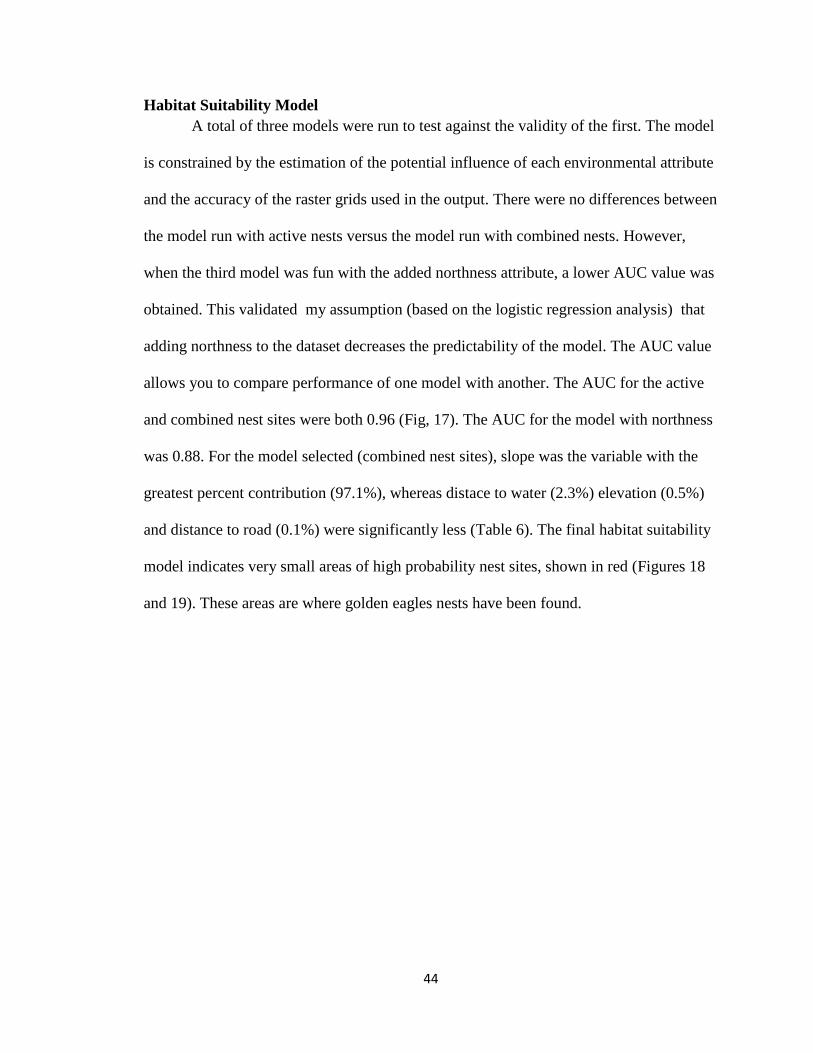
Habitat Suitability Model
A total of three models were run to test against the validity of the first. The model
is constrained by the estimation of the potential influence of each environmental attribute
and the accuracy of the raster grids used in the output. There were no differences between
the model run with active nests versus the model run with combined nests. However,
when the third model was fun with the added northness attribute, a lower AUC value was
obtained. This validated my assumption (based on the logistic regression analysis) that
adding northness to the dataset decreases the predictability of the model. The AUC value
allows you to compare performance of one model with another. The AUC for the active
and combined nest sites were both 0.96 (Fig, 17). The AUC for the model with northness
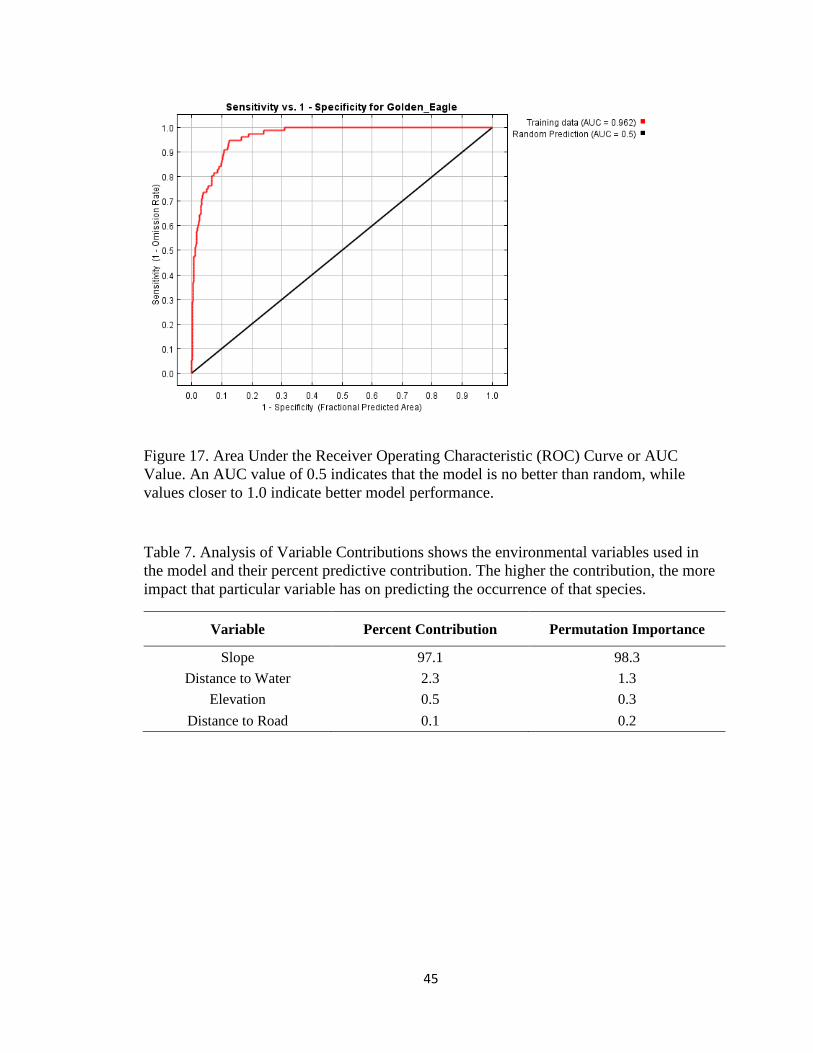
was 0.88. For the model selected (combined nest sites), slope was the variable with the
greatest percent contribution (97.1%), whereas distace to water (2.3%) elevation (0.5%)
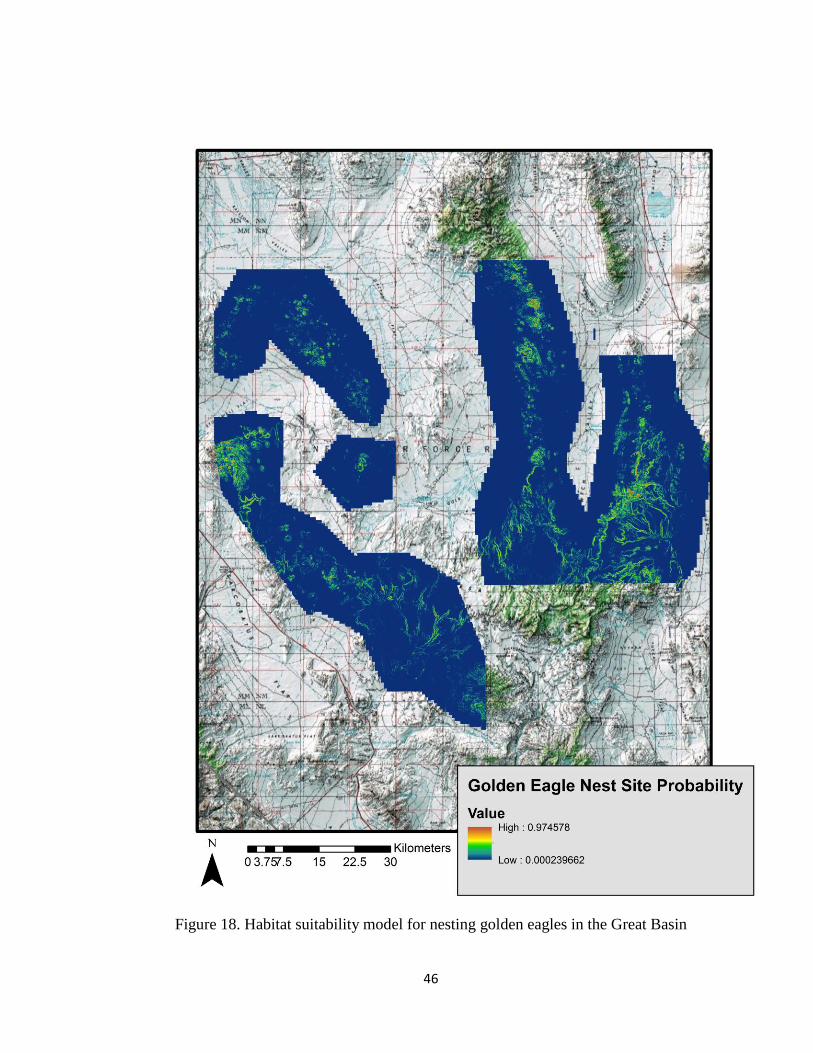
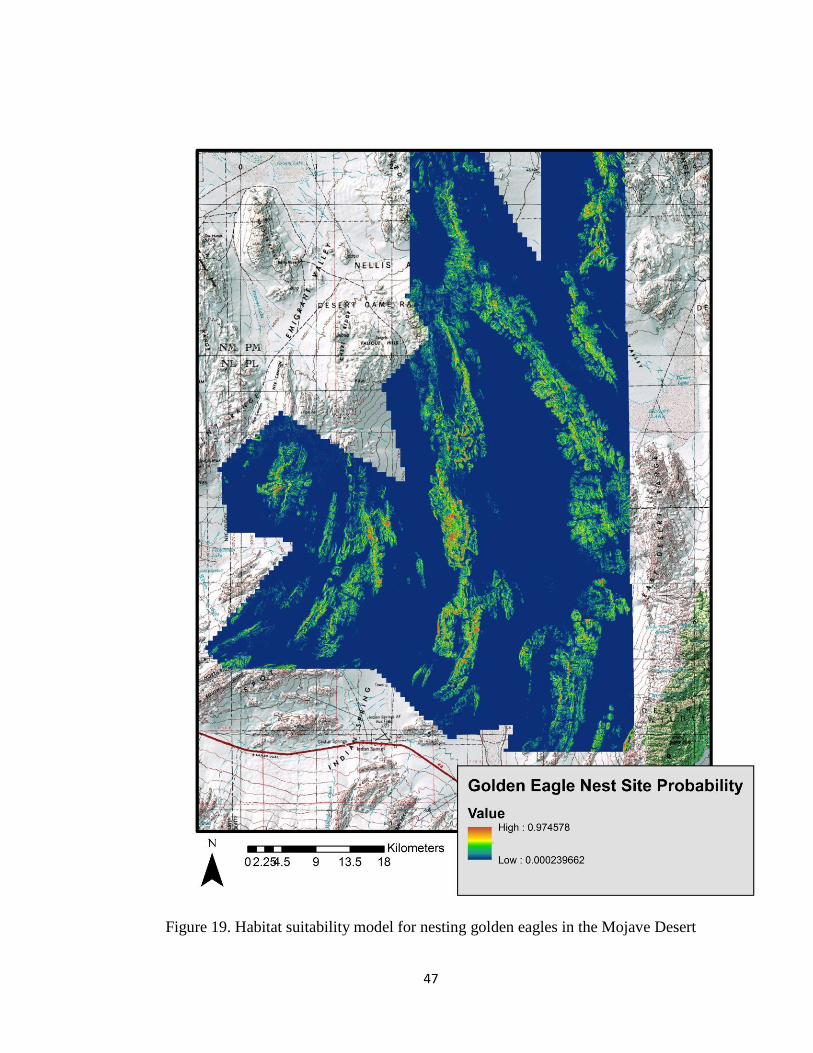
and distance to road (0.1%) were significantly less (Table 6). The final habitat suitability
model indicates very small areas of high probability nest sites, shown in red (Figures 18
and 19). These areas are where golden eagles nests have been found.
45
Figure 17. Area Under the Receiver Operating Characteristic (ROC) Curve or AUC
Value. An AUC value of 0.5 indicates that the model is no better than random, while
values closer to 1.0 indicate better model performance.
Table 7. Analysis of Variable Contributions shows the environmental variables used in
the model and their percent predictive contribution. The higher the contribution, the more
impact that particular variable has on predicting the occurrence of that species.
Variable Percent Contribution Permutation Importance
Slope 97.1 98.3
Distance to Water 2.3 1.3
Elevation 0.5 0.3
Distance to Road 0.1 0.2
46
Figure 18. Habitat suitability model for nesting golden eagles in the Great Basin
47
Figure 19. Habitat suitability model for nesting golden eagles in the Mojave Desert
48
CHAPTER 4
DISCUSSION
Measurement errors occur when investigators incorrectly interpret the status of a
particular pair of eagles or nesting territory, or incorrectly count the number of eggs or
young (Steenhof & Newton 2007). It is difficult to know how well this sample of the
population truly represents the actual demography of golden eagles within my study site.
I intended to follow the USFWS protocol for monitoring eagles, as closely as possible.
However, constraints such as field situations, observer bias, and weather were not
assessed. For future management guidelines, measuring standard observer error can be
analyzed in aerial surveys where all territorial pairs have been found (Fraser et al. 1984).
Aerial inventories of eagles have considerable advantage over ground surveys in
obtaining information such as nest site locations, habitat types and nesting attributes.
Helicopter surveys are the preferred method to survey vast swaths of habitat when
budgets allow. These aerial surveys allow for greater access to population data than could
be obtained via ground surveys. Regulatory agencies assigned responsibilities for
management of golden eagle are accountable, both monetarily and ethically, in a large
measure for the protection of this species. Decisions made to protect nesting golden
eagles will be dictated by the governing regulatory body and the nature of the threat or
combination of threats to the species. Management options for golden eagles on military
lands include: direct protection of golden eagles, nest sites and habitat, as well as a
blanket policy for protection and education. Any management option needs to be
underpinned by good-quality applied research (Watson 2010). It is the hope of the
researchers and biologists involved in this study that the documentation and data analyses
49
shall add to the available literature for western populations of golden eagles and aid in
quality management for this species.
Nesting Productivity
The estimated population of wintering golden eagles in Nevada was reported as
4685 across the state (Olendorff et al. 1981). This estimate did not likey include eagles on
military land. It is important from a management perspective to compare populations in
different areas and different years, and to use all available data to evaluate populations of
eagles statewide.
The results of this study indicate a maximum of 18 breeding golden eagles (9 nest
sites active in 2013) in the Great Basin ecoregion and 8 golden eagles (4 nest sites active
in 2014) in the Mojave Desert ecoregion. Because of variability across the years of this
study, these numbers are likely tentative. Populations of golden eagles are closely linked
with their prey base (black-tailed jackrabbits, Lepus californicus), whose populations
experience variability in 10 year cycles. Because of cyclic prey populations, more years
(≥10 years) of data collection on eagle populations may be necessary before a definite
population size can be predictable. This study indicated a remarkable 95% fledging
success rate, when compared to similar studies (Watson A. 1957, McGahan 1968,
Murphy 1975, Predatory Bird Research Group, 1995, Young et al. 1995). There is the
possibility that some pairs which appeared to have lost eggs early may have laid eggs
before they were detected. Non-laying or early failing pairs are less likely to be detected
than successful pairs (Newton, 1979).
Eighteen breeding pairs of golden eagles produced 35 fledglings over the four
years resulting in a ratio of 0.51 fledged young per territorial pair. This number is
50
comparable to a study in central Utah where 0.31-1.06 young fledged per territorial pair
over seven years (Murphy 1975).
Nesting success is defined as the proportion of nesting or laying pairs that raise
young to the age of fledging. For this study nest, I used success per territorial pair due to
the lack of data on non-layers. I considered a pair successful when a well-grown young
was observed in the nest just prior to fledging. Because productivity surveys were
completed just prior to fledging (based on back calculations from dates of previous
surveys), I assumed an overestimation of the number of fledglings was not an issue.
Calculating nest survival using the Mayfield method (Mayfield, 1961) would estimate
nest success by calculating a daily nest survival rate and might minimize bias from a
more limited survey methodology.
There was a large amount of variability in nest productivity in the four years of
my study. The lack of productivity in the Mojave Desert ecoregion was unexpected. In a
region with a large amount of potential nest sites, there was little productivity. Regional
variation was expected, and the nest sites observed in the Mojave Desert are likely
historic. Year to year fluctuations in nest site use are also common in raptors and a short-
term decline in productivity need not affect the long-term stability of a populations
(Steenhof & Newton, 2007).
Overall, the nest productivty appeared relatively stable, with annual fluctuations.
Golden eagle reproduction is closely linked with the jackrabbit prey base (Smith &
Murphy 1979) and collecting additional data on the prey base might put these population
demographic numbers for golden eagles into perspective. Only long-term collection of
51
population data can verify the vitality of the population of golden eagles in these
ecoregion management boundaries.
Nesting Chronology
Nesting chronology varies by ecoregion in the western United States. Generally,
eagles at higher latitudes nest later in the spring than those at lower latitudes. The dates
for breeding activities by golden eagles on this Nevada site are likely biased in favor of
pairs that produce nestlings. Although the actual dates were not reported in the results,
the patterns are clear (Table 3). The specific dates when eagles fledge were hard to
determine, due to the structure of my study. Repeated checks during the laying period
would help to more accurately estimate the dates. Nest success has been correlated with
dates of laying, where birds laying earliest in the season usually are the most successful
(Steenhof & Newton 2007). A more robust study would assess the variability in dates
between egg laying, incubation, feeding and fledging and the effects of laying date on
reproductive success, however these variables were outside the constraints of my study.
Nest Site Abundance and Density
The density of breeding eagles and other raptors in a landscape is primarily a
factor of habitat quality, nest site availability and prey abundance or availability (Newton
1989, Hunt et al. 1997, Driscoll 2010). The number of occupied breeding areas within a
region must initially be quantified to provide a baseline on which to compare future data
(Driscoll 2010).
The results of my study indicated that a nest density in the Great Basin ecoregion
(1.23 nests/km2) was almost five-fold greater than the Mojave Desert ecoregion (0.25
nests/km2). However, the amount of potential nesting habitat was 10-fold greater in the
52
Mojave Desert ecoregion than the Great Basin ecoregion. The ratio of occupied nests to
total nests was 52% in the Great Basin ecoregion and only 11% in the Mojave Desert
ecoregion. Some factors associated with high quality breeding habitat for golden eagles
include: 1) nesting substrate that offers protection from the weather and predators; 2)
sufficient prey abundance and biomass to sustain the eagle pairs throughout the year; 3)
updrafts and thermals for soaring and hunting; and 4) isolation from human disturbance
and development (Driscoll 2010). It is likely that the much lower nest density in the
Mojave Desert ecosystem suggests that one or more of these key habitat components are
likely absent or the cues that trigger selection.
Environmental Parameters/Attributes
Raptors are among the few groups of birds whose numbers and nest success are in
regions clearly limited by the availability of quality nest sites (Newton 1979). Many
factors influence nest placement by raptors. Protection from predators is probably the
most important single factor influencing nest site selection (Watson 2010). Another
assumed potential variable that might influence nest sites is high elevation, especially for
cliff nesters. The conclusions of two studies in Spain (Donazar et al. 1989, Fernandez
1993) suggested that golden eagles select nest sites on high cliffs that were relatively
inaccessible and farther away from human presence, specifically at greater distances from
tracks, roads and villages.
The Mojave/Sonoran warm desert scrub is the most abundant key habitat
associated with nest sites due to its open nature and prey base. Jackrabbits in the desert
southwest inhabit dry desert scrubland. Nesting adjacent to these open arid lands provide
53
golden eagles easy access to prey: whereas, other environs with denser vegetation make
hunting more difficult.
Relative nesting height is important in nest site selection due to the opposing
pressures of nesting high enough to avoid predation, and low enough to transport prey
uphill without expending too much energy (Watson, 2010). Birds in the central Highlands
of Scotland nest at 48% of the maximum surrounding elevation while those farther east
are at 60% of the maximum (Watson & Dennis 1992). The mean height of nests of
golden eagles in Nevada were located at 69% of the maximum cliff height, which is
slightly higher than reported in other studies. Because golden eagles at my study sites
primarily prey on black-tailed jackrabbits that weigh 4-6 kg, the burden of transport is
likely not as high. Additionally, ground disturbances from humans may have a tendency
to push the eagles higher.
Viewshed was not significantly different in the Great Basin ecoregion compared
to the Mojave Desert ecoregion. The mean landscape that could be viewed from each nest
site was < 10% of the surrounding environment. I interpreted these results as the
viewshed was not important because golden eagles likely do not hunt strictly from their
nest (due to sight constraints). Assessing differences between inactive and active nests,
and between combined and random nest sites should be part of future investigations. It
would be interesting to note whether there was a significant difference with this variable,
and thus assess its importance in nest site selection.
Nest site attributes were compared both by those that were active (over four
years) to those that were inactive. All nest site attributes were combined and then
compared to randomly generated nest sites (within cliff and canyon key habitat layers).
54
There were significant differences between active and inactive nests. The locations of
active nests were higher in elevation than inactive nests, as expected, and elevation was
an important habitat factor when compared to randomly generated nest sites. I concluded
that elevation was the most important nest site attribute I analyzed.
Slope appeared to be lower in active nests when compared to inactive nests.
Although there was a difference, the difference was much smaller than the differences in
elevation. The mean slope of combined nest sites (37% percent slope) was almost a 20°
grade. This is a seemingly low value given that raptors nest on sheer cliff faces. I have
determined that the microhabitat is not reflected in this value, rather is the slope of the
generalized area. Slope is a significant habitat component based on the differences
between combined nest sites and randomized points (based on the very small p-value).
Distance to nearest road also showed a significant difference when active and
inactive nests were compared; however, the mean values were close (3.62-5.01 km).
There were significant differences in distance to roads when combined nest sites were
compared to randomized points. I speculated that due to the number of nearby roads and
the topography of cliff and canyon habitats, most roads were rather close to all potential
nest sites. An evaluation of roads based on use would be interesting, as some roads get
little to no traffic (e.g. unimproved roads) and others get heavy traffic (e.g. paved roads).
Distance to water showed significant differences in active versus inactive nests.
Because water is a limiting resource in the desert, and the water table for seeps and
springs may change annually, golden eagles only used nest sites in close proximity to
water. Nests within approximately 3.2 km of a water source were continuously used over
the four years. There were no differences when combined nest sites were compared to
55
randomly generated points; the mean of inactive nest sites was much higher than active
and randomly generated points.
Northness, the index for aspect, showed no significant difference in either the
active versus inactive analysis, as well as the combined versus randomized analysis. I
conclude that along with slope, northness was a microhabitat value that was not reflected
in the GIS layer used for analysis. A nest site can be situated within a small crevice and
appear to be located in full sunlight (such as a near south facing), when in reality the nest
site had substantial shading from the rock outcrop in which it was situated. If an analysis
took into account microhabitat aspect I strongly believe this variable would be important
to a raptor nesting in a desert.
Logistic Regression
A series of logistic regressions tested whether the locations of golden eagle nests
could be distinguished from pseudo-absent nest sites based on five separate
environmental variables. Predictor variables were based on those available for the study
sites, and thus constrained the final model to these variables alone. Multicoliniarity was
not assessed, but it was assumed to be the highest between slope and elevation. For
model selection all combinations of variables were assessed, but settled on nine separate
candidate logistic regression models that remained significant. Akaike’s Information
Criterion (Sugiura 1978) and Akaike weights (Burnham and Anderson 2002) were used
as a basis for a model selection process (Troy et al. 2014). No single model had a Akaike
weight > 0.9 (Burnham and Anderson 2002), so the final model with the highest rank was
used and those attributes were inserted into the program MaxEnt.
56
Territory Delineations
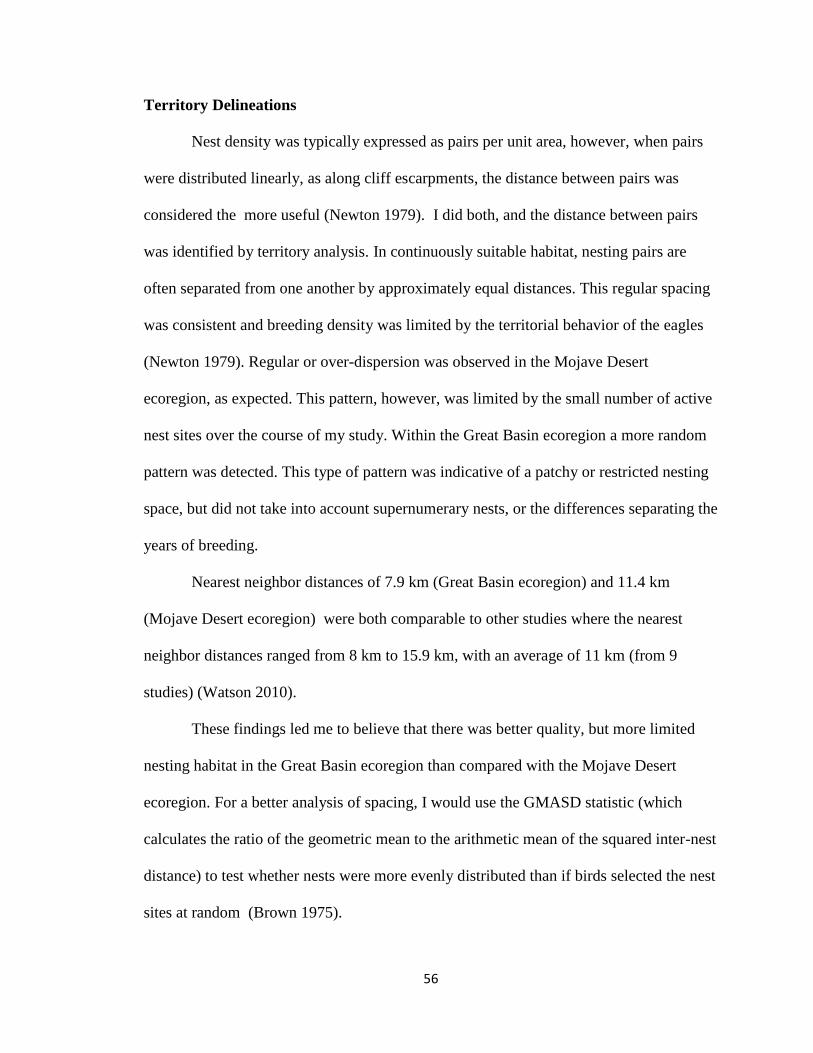
Nest density was typically expressed as pairs per unit area, however, when pairs
were distributed linearly, as along cliff escarpments, the distance between pairs was
considered the more useful (Newton 1979). I did both, and the distance between pairs
was identified by territory analysis. In continuously suitable habitat, nesting pairs are
often separated from one another by approximately equal distances. This regular spacing
was consistent and breeding density was limited by the territorial behavior of the eagles
(Newton 1979). Regular or over-dispersion was observed in the Mojave Desert
ecoregion, as expected. This pattern, however, was limited by the small number of active
nest sites over the course of my study. Within the Great Basin ecoregion a more random
pattern was detected. This type of pattern was indicative of a patchy or restricted nesting
space, but did not take into account supernumerary nests, or the differences separating the
years of breeding.
Nearest neighbor distances of 7.9 km (Great Basin ecoregion) and 11.4 km
(Mojave Desert ecoregion) were both comparable to other studies where the nearest
neighbor distances ranged from 8 km to 15.9 km, with an average of 11 km (from 9
studies) (Watson 2010).
These findings led me to believe that there was better quality, but more limited
nesting habitat in the Great Basin ecoregion than compared with the Mojave Desert
ecoregion. For a better analysis of spacing, I would use the GMASD statistic (which
calculates the ratio of the geometric mean to the arithmetic mean of the squared inter-nest
distance) to test whether nests were more evenly distributed than if birds selected the nest
sites at random (Brown 1975).
57
Habitat Suitability Model
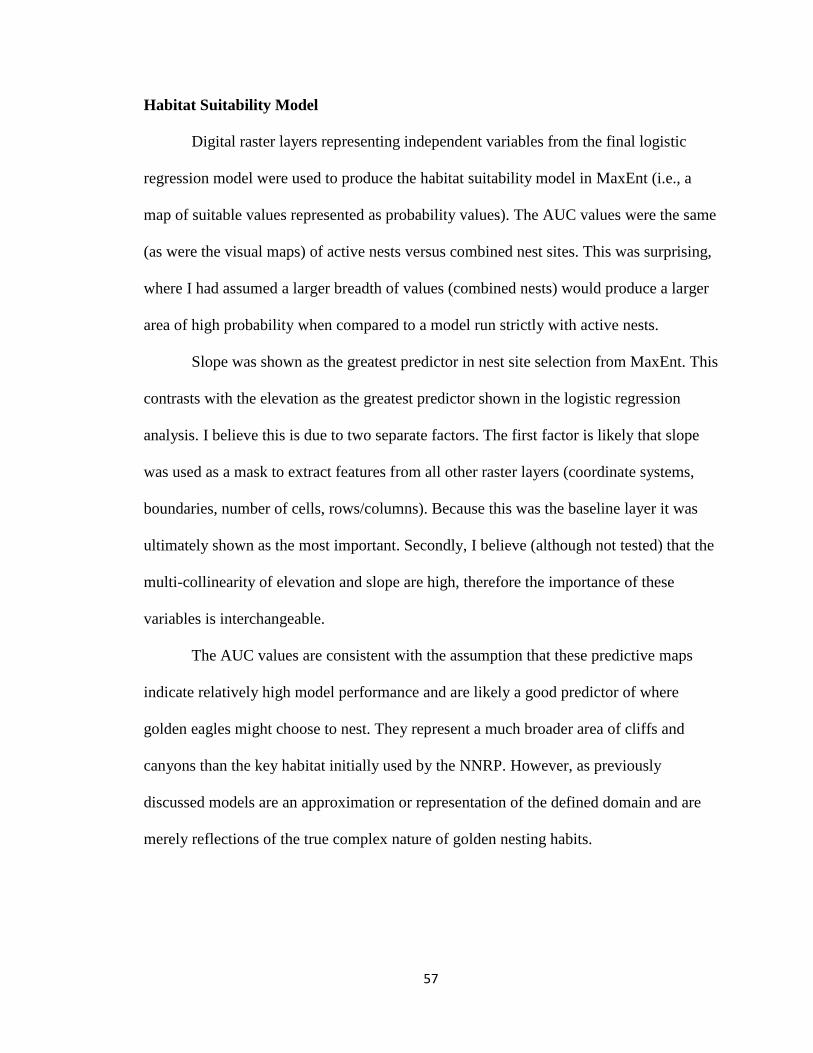
Digital raster layers representing independent variables from the final logistic
regression model were used to produce the habitat suitability model in MaxEnt (i.e., a
map of suitable values represented as probability values). The AUC values were the same
(as were the visual maps) of active nests versus combined nest sites. This was surprising,
where I had assumed a larger breadth of values (combined nests) would produce a larger
area of high probability when compared to a model run strictly with active nests.
Slope was shown as the greatest predictor in nest site selection from MaxEnt. This
contrasts with the elevation as the greatest predictor shown in the logistic regression
analysis. I believe this is due to two separate factors. The first factor is likely that slope
was used as a mask to extract features from all other raster layers (coordinate systems,
boundaries, number of cells, rows/columns). Because this was the baseline layer it was
ultimately shown as the most important. Secondly, I believe (although not tested) that the
multi-collinearity of elevation and slope are high, therefore the importance of these
variables is interchangeable.
The AUC values are consistent with the assumption that these predictive maps
indicate relatively high model performance and are likely a good predictor of where
golden eagles might choose to nest. They represent a much broader area of cliffs and
canyons than the key habitat initially used by the NNRP. However, as previously
discussed models are an approximation or representation of the defined domain and are
merely reflections of the true complex nature of golden nesting habits.
58
REFERENCES
Bergo, G. 1948. Habitat and Nest Site Features of Golden Eagles in Hordaland, West
Norway. Fauna Norvegica Series C, Cindus, 7:109-113.
Bittner, J., and J. Oakley. 1999. Status of Golden Eagles in southern California. Golden
Eagle symposium. La Paz, Mexico: Raptor Research Foundation Annual Meeting.
Brown, D. 1975. A test of randomness of nest spacing. Wildfowl, 102-103.
Burnham, K., and D. Anderson. 2002. Model selection and multimodel inference: a
practival information theoretic approach. New York: Springer-Verlag.
Collopy, M. W., and Jr., T. C. Edwards. 1989. Territory Size, Activity Budget, and Role
of Undulating Flight in Nesting Golden Eagles. Journal of Field Ornithology,
60(1):43-51.
Cramp, S., and K. Simmons. 1980. The Birds of Western Palearctic Vol.2. Oxford:
University Press.
Donald D D., J. Young, C.L. McIntyre, P.J. Bente, T.R. McCabe, and R. E. Ambrose.
1995. Nesting by Golden Eagles on the North Slope of the Brooks Range in
Northeastern Alaska. Journal of Field Ornithology, Vol. 66, No. 3, pp.373-379.
Donazar, J., O. Ceballos, and C. Fernandez. 1989. Factors influencing the distribution
and abundance of seven cliff-nesting rapotrs: a multivariates study. In B.-U.
Meyburg, & R. Chancellor, Raptors in the Modern World (pp. pp.545-552).
Berlin, London, Paris: WGBP.
Driscoll, D. E. 2010. Protocol for Golden Eagle Occupancy, Repoduction, and Prey
Population Assessment. Apache Jct. AZ: American Eagle Research Institute.
59
Dunstan, T. C. 1989-1990. The golden eagle. Audubon Wildlife Report. Missoula, MT:
U.S. Department of Agriculture, Forest Service, Intermountain Research Station,
Fire Sciences Laboratory.
Ecosphere Environmental Services. 2008. Golden Eagle Monitoring at Carbon Mountain:
Final Summary Report for the 2003-2007 Breeding Seasons. Durango, Colorado:
U.S. Bureau of Reclamation, Western Colorado Area Office.
Fernandez, C. 1993. Nest Selection for Nesting Golden Eagles: Influence of Accessibility
and Human Derangements. Alauda, 61: 105-110.
Fraser, J., F. Martin, L. Frenxeil, and Mathisen, J. 1984. Accounting for measurement
errors in Bald Eagle reproduction surveys. Wildlife Society Bulletin, 48:595-598.
Good, R., R. Nielson, H. Sawyer, and L. McDonald. 2004. Population level survey of
Golden Eagles (Aquila chrysaetos) in the western United States. Arlington, VA:
Western EcoSystems Technology, Inc.; Fish and Wildlife Service.
Gulf South Resource Corporation. 2012. Golden Ealge Conservation Plan for Nellis Air
Force Base and the Nevada Test and Training Range.
Hawk Mountain. 2007. Conservation Status Report of the Golden Eagle. Retrieved
January 2011, from www.hawkmountain.org: www.hawkmountain.org
Hoffman, S., and J. Smith. 2003. Population trends of migratory raptors in western North
America, 1977-2001.
Holldenbeck, J. P., V.A. Saab, and R.W. Frensel. 2011. Habitat Suitability and Nest
Survival of White-Headed Woodpeckers in Unburned Forests of Oregon. The
Journal of Wildlife Management, 75(5):1061-1071.
60
Hunt, W., R. Jackman, T. Hunt, D. Criscoll, and L.Culp. 1997. A population study of
golden eagles in the Altamont Pass Wind Resrouce Area: population tren analysis.
University of California, Santa Cruz: Predatory Bird Reserach Group.
Isaacs, F. B. 2011. Golden Eagles Nesting in Oregon. 1st Annual Report. Philomath, OR:
Oregon Eagle Foundation, Inc.
Kochert, M., K. Steenhof, C. M., and E. Craig. 2002. Golden Eagles. In The Birds of
North America No. 684 (p. 684). Philadelphia, PA: A. Pool and F. Gill.
Lee, D. S., and W.R.Spofford. 1990. Nesting of Golden Eagles in the Central and
Southern Appalachians. The Wilson Bulletin, Vol. 102, No.4, pp. 693-698.
Leslie, D. 1992. Population status, habitat and nest-site characteristics of a raptor
community in easter Colorado. Master's Thesis, Colorado State University, For
Collins.
Mayfield, H. 1961. Nesting success calculated from exposure. Wilson Bulletin, 73: 255-
261.
McGahan, J. 1968. Ecology of the Golden Eagle. The Auk, Vol. 85, No. 1, pp 1-12.
Merow, C., M.J. Smith and John A. Silander, J. 2013. A practical guide to MaxEnt for
modeling species' distributions: what it does, and why inputs and settings matter.
Ecography, 1058-1069.
Mosher, J., and C. White. 1976. Directional Exposure of Golden Eagle Nests. Canadian
Field Naturalist, 90:356-359.
Murphy, J. 1975. Status of the Golden Eagle in central Utah 1967-1973. Raptor Research
Report, 3:91-96.
Nellis Natural Resource Program (NNRP), 2011. GIS data. Las Vegas, NV.
61
Nevada Department of Wildlife. 2004. Nevada's Wildlife Action Plan.
Newton, I. 1979. Population Ecology of Raptors. T&A.D. Poyser, Calton.
Newton, I. 1989. Population limitation in raptors. Proceedings of the Northeast raptor
management symposium and workshop (pp. 3-12). Washington D.C.: National
Wildlife Federation.
Nielson, R., L. McManus, T. Rintiz, and L. McDonald. 2014. Monitoring Abundance of
Golden Eagles in the Western United States. Jounral of Wildlife Management,
Vol. 78, No.4, pp. 721-730.
Olendorff, R., A. Miller and R. Lehman. 1981. Suggested practicies for raptor protection
on powerlines: the state of the art in 1981. Raptor Research Report No. 4.
Page, J., and D.J. Siebert. 1972. Inventory of Golden Eagle Nests in Elko County,
Nevada. Elko, Nevada: Bureau of Land Management.
Pagel, J. E., D.M. Whittington and A.T. George. 2010. Interim Golden Eagle Technical
Guidance: Inventory and Monitoring Protocols; and Other Recommendations in
Support of Golden Eagle Management and Permit Issuace. U.S. Fish and Wildlife
Service.
Palmer, R. 1988. The handbook of North American Birds, Volume 5. New Haven,
Connecticut: Yale University Press.
Phillips, S. J., R.P. Anderson and R.E. Schapire. 2006. Maximum entropy modeling of
species geographic distributions. Ecological Modeling, 231-259.
Predatory Bird Research Group. 1995. A pilot golden eagle population study in the
Altamont Pass Wind Resource Area. Golden Colorado: U.S. Department of
Energy.
62
R Development Core Team. (n.d.). R: a language and environment for statistical
computing. www.R-project.org. R Foundation for Statistical Computing.
Sancho, J. A., and Olga Ceballos Ruiz, C. F. 1989. Factors Influencing the Distribution
and Abundance of Seven Cliff-nesting Raptors: A Multivariate Study. Raptors in
the Modern World, 545-552.
Smith, D., and J. Murphy. 1979. Breeding response of raptors to jackrabbit density in the
easter Great Basin Desert of Utah. 12(1-14).
Steenhof, K., and I. Newton. 2007. Assessing Nesting Success and Productivity. Raptor
Research and Management, 181-191.
Steenhof, K., M. Kochert and T. Mcdonald. 1997. Interactive effects of prey and weather
on Golden Eagles reproduction. Journal of Animal Ecology, 66(3): 350-362.
Sugiura, N. 1978. Further analysis of the data by Akaike's Information Criterion and the
finite corrections. Communication in Statistics-Theory and Methods, A7:13-26.
Thompson, S. P., R.S. Johnstone and C.D. Littlefield. 1982. Nesting History of Golden
Eagles in Malheur-Harney Lakes Basin, Southeastern Oregon. Raptor Research.
Troy, J., J. Veech and M.Green. 2014. Habitat Suitability Modeling for the Newell's
Shearwater on Kauai. Journal of Fish and Wildlife Management, 5(2):315-329.
United States Geological Survey (USGS). 2010. Precipitation History in the Mojave
Desert from 1893-2001.
United States Geological Survey (USGS). 2015. The National Map. Retrieved 2012, from
Map Viewer and Download Platform: http://nationalmap.gov/viewer.html
Watson, A. 1957. The breeding success of golden eagles in the northeast Highlands.
Scottish Naturalist, 57:341-344.
63
Watson, J. 2010. The Golden Eagle. Yale University Press.
Watson, J., and R. H. Dennis. 1992. Nest-site selection by golden eagles in Scotland.
British Birds 85(9):469-481.
Watson, J., S. Rae and R. Stillman. 1992. Nesting Density and Breeding Success of
Golden Eagles in Relation to Food Supply in Scotland. Journal of Animal
Ecology, Vol. 61, No. 3, pp. 543-550.