Embed Size (px)
Citation preview

RESEARCH DEPARTMENT
RISK OUTLOOK
June 2015

Index
1. EXECUTIVE SUMMARY 3
2. MACROECONOMIC REPORT 8
3. SECURITIES MARKETS INDICATORS 29
Equities & Equity Futures – selected indicators 29
Bonds & Credit Derivatives 35
Investment Management 41
Trading 45
4. LOOKING AHEAD AND CONCLUDING REMARKS 48
5. LIST OF GRAPHS 53

3 | Research Department | RISK OUTLOOK | June 2015
1. Executive Summary
By early May 2015, the economic recovery of the
Eurozone remains fragile, but the prospect of the
economy picking up has some traction in the
data. Nevertheless, important caveats must be
recognised. Not long ago, in late 2014, along with the
problems related to Greece’s public debt
management, a flight-to-safety was noticed, with
more investors turning to treasuries and sovereign
bonds.
The latest World Economic Outlook (April 2015)
reveals a slightly more optimistic but still prudent
IMF: “(…)The distribution of risks to near-term
global growth has become more balanced in
relation to October 2014 but is still tilted to the
downside. (…)”. The European and Japanese
economies risk experiencing a period of economic
stagnation. Economic developments in emerging
economies are not promising and are driven by low
growth prospects and a decline in commodity prices.
The latest figures from the US GDP, along with the
very latest PMI indexes from Markit (April 2015) for
Europe, reveal an unexpected underperformance,
hinting that the probable higher GDP growth rate in
2015Q1 may not be followed by a similarly strong
2015Q2. These figures give some substance to
the questions on the limits of the current growth
cycle in developed economies. A question that
resonates with the most recent advice from several
international financial institutions on the need for a
comprehensive policy approach to the economy,
given the existing evidence that markets are
repeating behaviours that led to the last financial
crisis.
In early 2015, the ECB’s assessment of the
Eurozone (EZ) remains cautious. The risk of low
inflation in the medium-term led the ECB Governing
Council to announce additional non-standard
monetary measures in January 2015 (to be deployed
in March), despite the lack of unanimity, with some
members advocating a “wait and see” option. The
ECB finally promised to arrange a €60 billion per
month quantitative easing plan for the next
couple of years.
Oil prices continued a downward trend in 2015Q1,
with Brent’s price dropping by more than 50% in one
year, only to slightly rebound, hovering about a loss
of 40% by early May. The euro depreciated against
the dollar by about 20% in one year (early May data).
The external trade balance in the EZ maintained a
clear and stable surplus and the GDP managed to
return to positive values in 2014 (+0.9%). Moreover,
the stock market bloomed in the first four months
of 2015, with at least a seven-year record high,
when considering the 300 largest European
companies. Sovereign debt yields fell to nominal
all-time lows in a number of European countries.
The still recent market turmoil shows the frailty level
in several markets and economies, most affected by
the crisis that started seven years ago. Confidence
in a better outlook for these economies, such as
the Portuguese, is not being fully supported by
economic fundamentals. The low oil price and

4 | Research Department | RISK OUTLOOK | June 2015
geopolitical instability have taken a toll in some of the
most recent and important buyers, leading to a steep
fall in Portuguese exports to several countries. A
trend that the Portuguese economy, at least for the
time being, has not managed to counterbalance by
gaining enough market share elsewhere. One of the
key questions for 2015 is whether exports will
regain momentum, as the European Commission
predicts in its spring 2015 economic forecasts.
For Portuguese CEOs, the lack of demand
continues to be the single most important
difficulty for the development of economic activity
and the threat of diminishing profitability also seems
to be dampening investment prospects. On a brighter
note, there are now positive prospects for the labour
market for 2015.
Another key issue is determining the extent to
which the decrease in investments that marked
the Portuguese economy since the 2008 crisis is
to blame for a seemingly sluggish recovery, when
compared with some of Portugal’s most important
economic partners. Data from the European
Commission also reveals that, in 2014, the stock of
capital per employee in Portugal is just about half the
EZ average, comparing badly to the so-called
peripheral countries (Greece, Spain, Ireland and
Italy). For the time being, the Portuguese economy
seems to be dragging along, unable to fully take
advantage of the low oil price/low euro combination.
The latest data on non-performing loans in
Portugal, both for non-financial corporations
(NFC) and for households, kept beating previous
historical highs, albeit with lower increments
among NFC and following an apparently stable rule
of thumb: the larger the loan, the higher the number
of non-performing contracts. Taking a closer look at
private corporations by size of workforce and non-
financial holdings, only micro-, small- and
medium-sized enterprises (SME) are now clearly
below the respective indebtedness level of late
2007. According to recent analyses by Banco de
Portugal, most of the deleveraging among private
corporations occurred in the context of debt
write-offs resulting from bankruptcies
(particularly in the real estate and construction
sectors) and only a minor fraction comes from actual
deleveraging of enduring companies. A situation that
Banco de Portugal expects will endure in the coming
years. New bank loans have been slowly decreasing,
although with high volatility. Thus, the higher
indebtedness, mainly among large corporations and
non-financial holdings, even with GDP growing
again, could only be explained by a higher issuance
of debt securities and trade credits. This is not
necessarily happening with SMEs. The conclusion of
a still fragmented access to capital markets is
strengthened by the sustained - if not increasing -
small versus large loan interest rate spread and the
absence of SMEs from stock markets. Moreover,
even though nominal interest rates have been
clearly decreasing, the real cost of money has
been increasing.
For Portuguese households, the credit crunch has
been ongoing for more than four years now and
there has been a slow but stable deleveraging.
The real estate market is one of the focal points for

5 | Research Department | RISK OUTLOOK | June 2015
risk transmission across multiple sectors. The high
real estate market illiquidity, combined with non-
performing loans has put banks under stress and
brought about potential conflicts of interest in
highly verticalised financial groups with stakes in
insurance, mutual funds and asset management,
and even regulatory arbitrage. Nonetheless, the
recent increase in prices has been barely
accompanied by banking appraisal values, which
signals that banks are still very prudent and
probably not as important as market players as
they were in the past.
The frequently quoted sentence that the EZ is
recording historically low interest rates and, more
generally, a historically low price of money must be
taken with caution. Even though the 10-year
sovereign yields in Portugal have been at the lowest
nominal value in history, the 12-month Euribor
spread (a usual reference for return on savings
deposits) makes sovereign yields – ceteris
paribus – much more attractive now than before
2009. When sticking to comparing the same class of
investments, the yield of Portuguese 10-year
sovereign bonds maintains a spread vis-a-vis
Germany that is still clearly above its level prior
to the financial crises or even after. Furthermore,
upon entering a protracted low inflation period
combined with low growth, austerity weariness in
several EZ countries and important political
dissent within the EZ could erode the sovereigns’
ability to maintain the fiscal revenue at the levels
required to service the debt, which may threaten
the EZ’s integrity. Against this background,
monetary policy instruments intended to fight
deflation risks could turn out to be themselves a
risk factor. Achieving real economy yields, which
divert investments from search-for-yield and bubble-
prone markets seems to be critical at this point.
Another looming risk that should be stressed
comes from market-based financing. It has been
signalled as a significant risk, namely in China and in
the USA, and it is being tracked with increasing
interest in Europe. The European Commission has
put forward a plan to build a Capital Markets Union,
responding to calls for the strengthening of the
internal market of financial services, the diversifying
of funding sources and the mitigation of the effects of
the banking crisis on taxpayers. However, in its
current version, it is strikingly omissive (for instance,
it fails to address fiscal terms), which advises
moderate enthusiasm regarding its effectiveness.
Against the backdrop of increasing liquidity
provisions, almost all the major stock exchanges
(including the Portuguese) have begun to gain
value. Volatility has clearly decreased in the first
months of 2015 in most financial markets. The use of
internet searches as proxies for the spontaneous
behaviour of agents reveals an increasing interest for
negative terms in the second half of 2014, probably
due to the recent news about Portuguese banks.
Over 2015Q1, the search for positive terms was
stronger. Meanwhile, the Economic Sentiment
Indicator for the Portuguese economy recorded
a seven-year maximum in March 2015.
The Cyclically-Adjusted Price-Earnings Ratio
(CAPE) for the Portuguese Stock Exchange was

6 | Research Department | RISK OUTLOOK | June 2015
below 14 at the end of 2014, which contrasts with the
value observed in 2014Q1 (18.7). Additionally,
Portugal’s Composite Indicator of Systemic Stress
(CISS) has trended upwards in the eight-month
period ending in February 2015, reaching lower
figures in March. The increasing level of systemic
stress during this period stems mainly from the
financial intermediaries segment and from the
equity market, and may be justified by
extraordinary events that affected two prominent
firms of the PSI20 index.
With regard to bond and credit derivatives, QE
programmes exert a downward pressure on bond
yields. Threats of deflation triggered the ECB to
massively purchase sovereign bonds in secondary
markets, and sovereign yields witnessed a sharp
fall (particularly after March 2015). Bond yields are
reaching historical nominal minimum levels in almost
all Member States, with the Portuguese 10-year
sovereign yield being similar to the 10-year
sovereign yields of the US or the UK. This may
eventually distort investors’ incentives to hold
Portuguese bonds and may undermine the ability
to raise additional capital.
By now, the most relevant feature in sovereign bond
markets should probably not be nominal yields. By
21 April 2015, the difference between the
Portuguese and the German 10-year sovereign
yields was nearly 200 basis points, eight times
higher than in 2008. These spreads are passed
on to the real economy and widen the gap
between Member States. Moreover, even though
ECB and IMF officials have been downplaying the
consequences, in terms of contagion, of a rupture
between Greece and its EZ partners, the potential
repercussions of such a rupture on countries like
Portugal are an important risk factor.
With regard to funds and investment management,
2014 was marked by the winding up of Banco
Espírito Santo (BES), and the inevitable
consequences that affected the several branches of
the financial group. Regarding the asset
management companies connected to BES, the loss
of investors was unavoidable but no relevant
evidence of a flight-to-safety abroad has been
recorded in the aftermath of the winding up. The
most probable scenario was that assets ended up
being channelled to competitor banks’ investment
instruments.
Evidence of significant co-movement among
mutual fund investors was found in Portugal, as
well as of flight-to-quality. Recent market
developments suggest that investor confidence in
mutual funds is back on the path to recovery and that
mutual fund investors are more willing to invest in
riskier fund categories.
The most recent figures on the relative weight of
market platforms reveal a comeback of lit markets.
Venue fragmentation and trading dispersion still
persist, however, posing a challenge to market
oversight.
Looking ahead, the extent of the effectiveness of
ECB’s attempts to revive its transmission
mechanisms to financially support the real economy
and bring inflation closer to the monetary policy

7 | Research Department | RISK OUTLOOK | June 2015
target will determine the outlook for numerous
economies in the upcoming months. The dual goal
of strengthening bank capital and deleveraging
the most indebted banks, along with the need to
fuel credit to the real economy, has proven hard
to attain.
One additional note of concern relates to the
profitability of the banking sector, which remains
an important threat to financial and economic
stability in Europe. The upcoming months should
also bring developments in the discussion of
institutional reform in the EZ and in the EU as a
whole.
Lastly, the increasing importance of capital markets
reinforces interdependence between international
financial institutions. The competent supervision
authorities from different jurisdictions are urged to
work in close cooperation and establish a
comprehensive framework to avoid regulatory
arbitrage, and to detect and curb systemic risks
in useful time.

8 | Research Department | RISK OUTLOOK | June 2015
2. Macroeconomic Report
“Financial markets may be mispricing risk. There is
evidence that markets are repeating behaviours that
led to the financial crisis in 2007”.
OECD, Interim Economic Assessment, 18 March
2015
The recent macroeconomic background
promoted a bolder monetary policy in Europe:
In early May 2015,1 several macroeconomic, political
and social indicators for the Eurozone (EZ) syndicate
both the optimistic and the pessimistic outlook for the
remainder of the year. As in several occasions during
the last year and a half, yet again the prospect of
economy picking up has some traction in the
data but, like then, important caveats must be
recognised.
At the end of 2014, and by the time a bolder
intervention from the ECB became more and more
probable, the macroeconomic scenario was one of
increasing concern. After a relatively long period of
low volatility in most markets, accompanied by
moderate economic optimism in some distressed
economies, economic expectations and market
behaviour shifted significantly from late September
onwards, reviving some (not so) old doubts and
1 Quantitative data available until 22 April 2015 is used and
depicted. Some inputs are considered until early May 2015.
questions. The IMF revised downward its
macroeconomic prospects for global growth for 2014
and 2015, with a particularly gloomier outlook for the
EZ. By the end of 2014, the real economic data for
Germany and most EZ economies proved to be
below expectations, contrasting with better economic
indicators for the US and the UK. Altogether, the
probability of a triple dip recession, with the
impending threat of a Japan 1990’s-like evolution in
the EZ was gaining momentum.2 Combined with
geopolitical distress in some critical regions of the
world (from Ukraine and Africa to Syria and Iraq),
conditions for turmoil were in place in several
markets.
Meanwhile, public dissent was noticed, most
notoriously in France, Italy and Germany, regarding
the flexibilisation of the EZ’s national budget goals.
The Eurogroup did not allow Greece to leave the
Economic Adjustment Programme ahead of
schedule and sovereign yields in countries like
Greece, Spain and Italy soared, as they also did in
Portugal. In Portugal, five days after the 10-year
sovereign yields broke below 3% (a historically low
figure in nominal terms at the time), yields went up
again by about 25%, reminding markets that the
previous calmness could be disrupted very rapidly. In
the beginning of 2014Q4, most of the stock
exchange gains of the year had been erased in
several markets, a situation that not all markets
2 Referring to the economic stagnation with the low inflation/deflation period that crippled the Japanese economy, mainly, in the 1990’s.

9 | Research Department | RISK OUTLOOK | June 2015
proved to be able to revert until the end of the year.
Furthermore, unsatisfactory results from the second
Targeted Longer-Term Refinancing Operations
(TLTRO)3 held by the ECB became evident by late
December. The TLTRO was intended to free
European banks and NFC from a considerable
fraction of their more illiquid and probably low-quality
assets, aiming at creating more favourable
conditions to boost lending to the real economy.
In a nutshell, by the end of 2014, along with the
problems stemming from Greece’s sovereign debt
management, flight-to-safety movements were
identified, with more investors turning to the US,
German and also French and AAA sovereign
treasuries and bonds. There were also doubts over
the actual end of the euro crisis that had been
announced by prominent European political leaders.
The first months of the full deployment of
Quantitative Easing in Europe:
In early 2015, the ECB’s assessment of the EZ
remained cautious. The risk of low inflation in the
medium term led the ECB Governing Council to
announce additional non-standard monetary
measures in January, despite the lack of unanimity,
with some members advocating a “wait and see”
option. The ECB finally promised to deploy a €60
billion per month Quantitative Easing (QE) plan
3 Only by January 2015 and after several months of TLTRO and direct purchases in the European covered bond and asset backed securities markets, the ECB balance sheet reverted from the
for the next couple of years, aiming at private and
public debt. This QE4 initiative was announced to
start in the beginning of March 2015.
Oil prices continued a downward trend in the first
months of 2015, with Brent’s price dropping more
than 50% in one year, only to slightly rebound,
hovering about a loss of 40% by early May. The euro
depreciated against the dollar by about 20% in one
year (early May data). The external trade balance in
the EZ maintained a clear and stable surplus and the
GDP managed to return to positive growth in 2014
(0.9%). The stock market bloomed in the first four
months of 2015, with at least a seven year record
high, when considering the 300 largest European
companies. Sovereign yields fell to nominal all-
time lows in more than 20 European countries.
In March, the ECB revised the economic outlook for
the EZ with optimism, in line with the European
Commission's forecasts. Despite the high level of
uncertainty, macroeconomic prospects and credit
activity seem to respond positively to the non-
standard policies announced in January. With the
new asset purchase programme, the ECB is
reducing banks’ funding costs, aiming at bring down
borrowing costs for businesses and households.
By early May 2015, despite the risk of
underestimating the threat of contagion of an EZ
break up caused by the political and financial crisis
downward trend it was in (due to a higher pace of loan repayments from European banks owing to the ECB). 4 Further detail on this programme is presented in the Bonds &
Derivatives section.

10 | Research Department | RISK OUTLOOK | June 2015
between the EZ and Greece, the institutional
consensus on the macroeconomic prospects for the
Eurozone are positive. According to the IMF5, the
recent evolution of external macroeconomic
variables sustain an upward revision of the near-term
prospects.
First notes on Portugal:
Referring to the Portuguese economy, the IMF
sustains a more positive approach, precisely quoting
the euro-dollar depreciation (at its lowest level in 12
years), the record low sovereign yields (historical
minimum) and low oil prices (the lowest since 2009).
But the still recent market turmoil of late 2014,
highlighted above, exposed the frailty in several
markets and economies, most affected by the crisis
that started seven years ago. Confidence in a
better outlook for these economies, such as the
Portuguese, is not being fully supported by
economic fundamentals. Besides, sovereign debt
is still mounting, and the high external debt is yet to
show a decent decrease. In fact, Portugal ended
2014 with a positive GDP growth (+0.9%), mainly
supported by private consumption, which more than
compensated for the negative contribution from
external demand. It should be noted that, between
5 In a statement on the Portuguese economy on 17 March 2015 http://www.imf.org/external/np/ms/2015/031715.htm
Graph 1 – GDP growth (yoy) and forecasts for
selected countries
Sources: AMECO, European Commission, Winter 2015 forecast.
*Estimate; p-Provisional.
Graph 2 – Portuguese exports (€) of goods by
destination - 2014
Source: INE, calculations by CMVM.

11 | Research Department | RISK OUTLOOK | June 2015
2013 and 2014, household savings as a percentage
of disposable income fell from 8.7% to 6.9% and
credit to consumption picked up to reach a four-year
high by March 2015. GDP growth was in itself at odds
with what would be expected if the Portuguese
economy was aligned with its most relevant partners;
it compared poorly, for instance, to Spain. Portugal
recorded the lowest growth rate of the year in
2014Q4 (0.7%, compared with the previous year).
On the contrary, Spain continued to gain momentum,
finishing with a 2.0% GDP growth between the final
quarters of 2013 and 2014. Moreover, throughout
2014, trade imbalances deepened (fuelled by higher
imports due to internal consumption). The first data
for 2015 shows a mixed evolution, with the
Portuguese goods exports and imports decreasing in
January (when compared with the same period of
2014), to recover in the following month. Whereas
lower imports can be mostly explained by an
abnormal base effect, the uncertainty in goods
exports is worrisome. Low oil prices and some
geopolitical instability have taken a toll in the
consumer drive of the most recent and important
buyers, leading to a steep fall in Portuguese
exports to several countries. A trend that the
Portuguese economy, at least for the time being,
has not managed to counterbalance by gaining
enough market share elsewhere.
The single most important market contributing to the
external trade evolution in Portugal in the first months
of 2015 was Angola, stricken by the steep fall in oil
prices, its most important source of revenue. Even
though the effect on exports to Angola could be
somewhat expected, it is troubling to notice that other
destinations did not compensate this fall. In fact,
Portugal performed badly with its non-EZ partners in
early 2015, loosing demand in Angola, Russia,
Turkey, Saudi Arabia, USA, China and Algeria. The
relatively better performance in the Netherlands and
France was too little to balance things out.
The situation has been particularly serious in oil
producing countries such as Angola or Brazil. In
2014, Angola was the fourth destination of
Portuguese exports and Brazil the eleventh. The
economic impact in the Portuguese economy
goes beyond a shrinking demand. In recent years,
many Portuguese companies directed their main
activity towards Angola or Brazil to exploit the
potential of those economies and mitigate the impact
of weak domestic prospects. This led many
Portuguese to migrate to Angola, Mozambique or
Brazil. If the prospects are not reverted relatively
quickly, the situation can lead to further erosion in
SME profitability and to a significant return of working
age people. With the currently slow pace of net
job creation in Portugal, this could create
additional stress to the Portuguese social
welfare and could hinder the recovery of an
already fragile economy. In the case of Angola, the
impossibility to repatriate capital, together with the
devaluation of the kwanza, are additional sources of
concern to Portuguese companies that are highly
dependent on the Angolan market.
All these troubling signs come on top of a seven-
month downward trend in the economic activity

12 | Research Department | RISK OUTLOOK | June 2015
indicator6, which finally stabilised in February 2015.
Moreover, the latest data (February) for the Near
Term Production Quantitative Indicators reveal
negative signs in the industry, construction and
services sectors. On a brighter note, the Near Term
Qualitative Indicators continued to exhibit an upward
trend, in spite of the abrupt fall in the Consumer
Confidence Index (April 2015). Conversely, the
beginning of 2015 brought a significant decrease in
the investment intentions stated by Portuguese
companies, compared with what they reported in
mid-2014 (a decrease in combined investment
intentions of -2.2%, against the 1.1% increase
reported earlier).7
For Portuguese CEOs, the lack of demand
continues to be the single most important
difficulty. The threat of diminishing profitability
also seems to be dampening investment
prospects. Note that managers are increasingly
using their companies’ own resources to support the
intended investment, and resorting less to banking
credit.
On a brighter note, positive labour market
expectations do exist, in line with one of the
improving indicators for the Portuguese economy in
2014: a decline of the unemployment rate to 13.7%
in 2015Q1. This decline was made possible by an
actual increase in the number of jobs available, by
the still enduring emigration flow, but also by the
success of public policies actively boosting
6 Computed by Statistics Portugal.
temporary jobs (internships and apprenticeships).
Are the first 2015 external trade results to be
confirmed? Will exports regain momentum as the
European Commission predicts in its spring
economic forecasts? And to what extent is the
huge decrease in investment that marked the
Portuguese economy since the 2008 crisis to
blame for a seemingly sluggish recovery when
compared with some of Portugal’s most
significant economic partners? According to the
IMF, the potential growth of the Portuguese economy
should hover around 1.25% in the upcoming years,
due to low investment, considered insufficient to
revert the effects of the accumulated capital
decrease of prior years. Data from the European
Commission also show that, in 2014, the
Portuguese stock of capital per employee was
just about half the EZ average, comparing poorly
to Greece, Spain, Ireland and Italy.
These are some of the questions to follow in the
upcoming months and whose answers will determine
the seriousness of the hardship and vulnerability of
the Portuguese economy, for instance, in the event
of a change of cycle in the global economy. For the
time being, the Portuguese economy seems to be
dragging along, unable to fully take advantage of
the low oil price/low euro combination.
Some further insights on economic prospects:
The last time the expectation of a reinvigorated
economic growth had to be revised can be traced
7 Statistics Portugal, Investment Survey, January 2015.

13 | Research Department | RISK OUTLOOK | June 2015
back to the World Economic Outlook (WEO) of
October 2014, when the global macroeconomic
outlook for the coming months and years became
less optimistic (the IMF revised downwards the 2014
and 2015 global growth rates). On their part, the IMF
dedicated some attention to the hypothesis of a
Secular Stagnation Scenario. This Secular
Stagnation Scenario speaks volumes on the
worrisome consequences that a low-growth, low-
inflation environment could potentially have and, if
this scenario should materialise, it could affect
developed economies in a most significant way.
The latest WEA (April 2015) reveals a slightly
more optimistic but still prudent IMF8: “(…) The
distribution of risks to near-term global growth has
become more balanced in relation to October 2014,
but is still tilted to the downside. (…)”. For the IMF,
macroeconomic prospects are not consistent across
the world: positive recovery signs in advanced
economies but economic decline in emerging
economies. The forecasts point to an increasing
discrepancy between the two sides of the Atlantic: a
3.5% growth rate in the US, against 1.1% in Europe.
The European and the Japanese economies risk
experiencing a period of economic stagnation.
The IMF recommends accommodative monetary
policies, complemented with structural reforms and
better fiscal frameworks, in order to pick up growth
and reverse the poor investment climate in those
8 In line with the latest OECD Interim Economic Assessment, consulted on 18 March http://www.oecd.org/eco/outlook/economicoutlook.htm
regions. Moreover, economic developments in
emerging economies are not promising and are
driven by low growth and commodity prices. The net
effect of commodity prices on commodity-
importing countries is not clear and will probably
depend on the magnitude of the dollar appreciation
and on the evolution of commodity prices, as those
two elements can cancel each other out.
Furthermore, government consolidated gross debt
as a percentage of the GDP in Portugal has risen in
recent years, increasing 34.0 percentage points
between 2010 and 2014. For the EU-28, the change
equals to 8.6 percentage points, on average. In
2014, government consolidated gross debt
represented 130.2% of the Portuguese GDP, against
an average of 86.8% for EU countries.

14 | Research Department | RISK OUTLOOK | June 2015
Graph 3 – Differences in the latest consecutive GDP
forecasts for selected Countries
Source: AMECO, European Commission, Winter 2015 forecast. *Estimate; p-
Provisional.
Graph 4 – GDP at market prices (2005=100)
Source: Eurostat.
Graph 5– Government Consolidated Gross Debt as a
Percentage of the GDP
Source: Eurostat.
Graph 6– Per Capita GDP at market prices (€)
Source: Eurostat.

15 | Research Department | RISK OUTLOOK | June 2015
Following these insights, it may be fruitful to analyse
how the per capita GDP evolved in recent years. In
Portugal, per capita GDP at market prices exhibits a
negative trend between 2010 and 2012. More
importantly, Portugal has been diverging from its EZ
peers: in 2009 the per capita GDP of Portugal was
60% above the EZ's per capita GDP, having
declined to 56% in 2013/2014.
According to the latest data on non-performing loans,
both non-financial corporations (March 2015) and
households (December 2014) continue to beat
previous all time-highs in Portugal, albeit with lower
increments among the NFC. The analysis of the
different categories of Portuguese NFCs with
overdue loans is also revealing. Considering both the
difference between the biggest (above €5 million)
and the lowest (below €20 thousand), and the
difference between the second highest (€1 million to
€5 million) and the second lowest (€20 thousand to
€50 thousand) loan percentage intervals, the bigger
the loan, the higher the number of non-
performing contracts. This is a worrisome
indication of the health of the Portuguese economy.
In 2014, some signs of performance gap
improvement among the most extreme cohorts is
countered by an increased degradation in the quality
of loans ranging from €1 million to €5 million. Even
though not shown in the depicted time series, this
recent evolution – since the end of 2013Q1 - comes
more from lower creditworthiness among NFCs
that took large loans than from a significant
improvement among small borrowers.
Graph 7– Overdue loans - Portugal (in % of total
credit granted)
Source: Banco de Portugal, calculations by CMVM. * - Data for 2015Q1
(only for Non-Financial corporations).
Graph 8– Difference in the breakdown of the % of
non-financial corporations with overdue loans
Source: Banco de Portugal, calculations by CMVM. Note: Latest
available data - December 2014.

16 | Research Department | RISK OUTLOOK | June 2015
The global level of new loans has been erratic,
with no clear trend in the last couple of years but
at a lower level than before the crisis. Nominal
interest rates, on the other hand, have now returned
to pre-crisis levels or even lower: in a smother way
for loans up to €1 million, and with a remarkable
move since the second half of 2014 for loans above
€1 million.
Considering that non-performing loans are a good
proxy for financial distress in the economy, the
assorted indicators depict a gloomy scenario. With
very few exceptions – Germany is one of the most
notorious – credit quality in the EZ has diminished
since 2008.
Broadening the scope to all debt issuance, the
overall net issuance of debt securities in Portugal has
been negative for several quarters, reaching some of
the lowest figures of the series during 2014, and the
minimum for the issuance of long-term debt
securities in 2014Q4. For NFCs, after positive net
issuance in 2012 and 2013, 2014 brought a first half
of the year with the lowest (negative) figures at least
since 2005, with a slight recovery in the latter half of
the year.
Graph 9– Gross total doubtful and non-performing
loans in the balance sheets of domestic banking
groups and stand-alone banks (% of total debt
instruments and total loans and advances)
Source: ECB
Graph 10– New loans, respective interest
Source: Banco de Portugal, calculations by CMVM. Note: Latest
available data – 28 February 2015.

17 | Research Department | RISK OUTLOOK | June 2015
Graph 11– Net issuance of debt securities – Short-
vs Long-term - Portugal
Graph 12– Outstanding amounts of debt securities
issued by NFCs - Portugal
Source: Banco de Portugal, calculations by CMVM. Note: Latest
available data – 2014Q4.
Source: Banco de Portugal, calculations by CMVM. Note: Latest
available data – 28 February 2015.
Graph 13– Net issuance of debt securities by NFCs
- Portugal
Graph 14– Net issuance of long-term debt
securities by NFCs - Portugal
Source: Banco de Portugal, calculations by CMVM. Note: Latest
available data – 2014Q4.
Source: Banco de Portugal, calculations by CMVM. Note: Latest
available data – 2014Q4.

18 | Research Department | RISK OUTLOOK | June 2015
For Portuguese households the credit crunch has
been ongoing for more than four years now and the
relative weight of mortgage-based loans climbed
from 79% in December 2007 to 82% in February
2015. It is among consumer loans and not so much
among mortgage-secured credit that non-performing
loans have risen the most.
The latest available figures (February 2015) show,
nonetheless, a different pace in the still negative rate
of change in credit granted to Portuguese
households, possibly hinting at a change in the trend.
In late 2014, and for the first time in several years,
there was a positive change in consumer credit. An
occurrence that, for the time being, was not repeated
in 2015, although the negative rate of change
remains much smaller than in the period 2010 –
2013.
With the exception of 2014, consumer credit for EZ
households shows a reduction in the pace of
contraction. In Portugal, the overall outstanding
loans for households has decreased by 13.0% since
its peak in late 2010, while it increased by 0.9% in
the EZ during the same period.
Looking at the latest indebtedness data of private
corporations and individuals9 and considering not
only loans but also debt securities (nominal value)
and trade credits, the deleveraging process shows
significant results. There has been a slow but
stable reduction in the families’ indebtedness
9 The scope goes beyond households. It also considers self-employed entrepreneurs and non-profit institutions serving households.
level. In fact, the indebtedness ratio is the lowest
(85.4% of GDP) in the last known observation, in
December 2014 – lower than by December 2007. In
the case of private corporations, the last seven
quarters contributed decisively to move away from
the peak (162.5% of GDP) recorded in March 2013,
but by December 2014 (141.8% of GDP) it is still
higher than during the 2007-2010 period.
Graph 15– Change in credit extended to households
in Portugal and the Eurozone (mortgage and
consumer credit) - %
Source: ECB
19 | Research Department | RISK OUTLOOK | June 2015
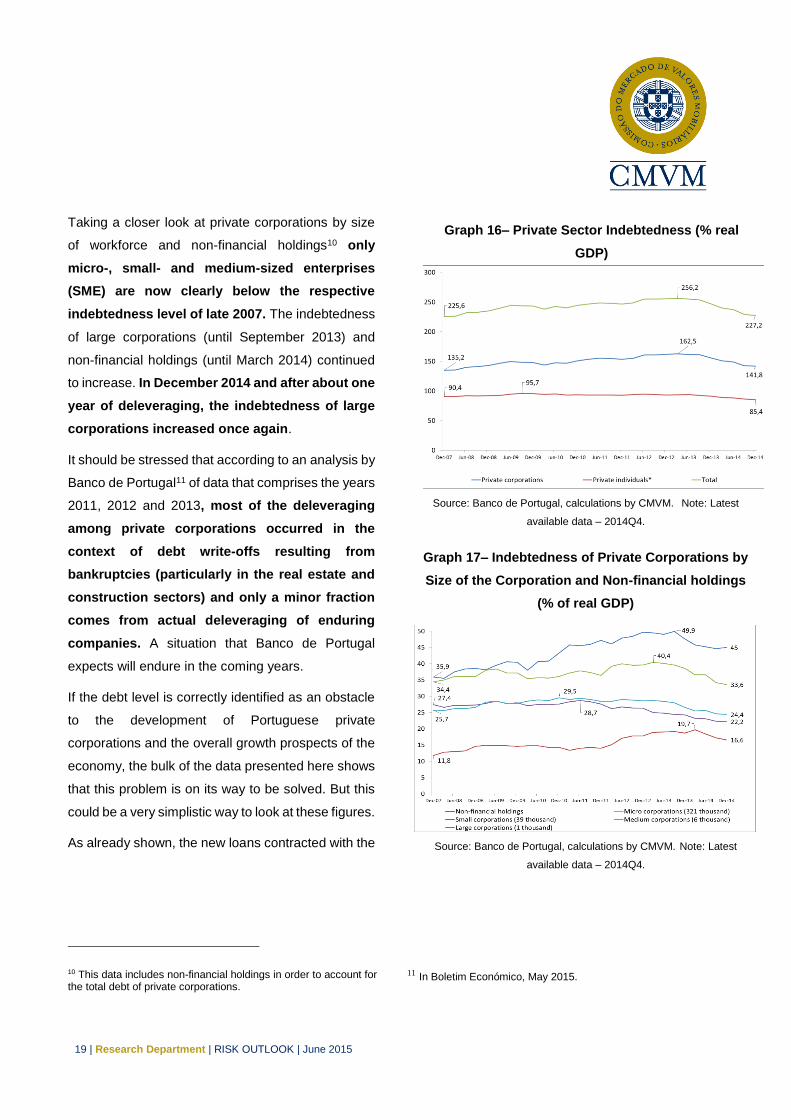
Taking a closer look at private corporations by size
of workforce and non-financial holdings10 only
micro-, small- and medium-sized enterprises
(SME) are now clearly below the respective
indebtedness level of late 2007. The indebtedness
of large corporations (until September 2013) and
non-financial holdings (until March 2014) continued
to increase. In December 2014 and after about one
year of deleveraging, the indebtedness of large
corporations increased once again.
It should be stressed that according to an analysis by
Banco de Portugal11 of data that comprises the years
2011, 2012 and 2013, most of the deleveraging
among private corporations occurred in the
context of debt write-offs resulting from
bankruptcies (particularly in the real estate and
construction sectors) and only a minor fraction
comes from actual deleveraging of enduring
companies. A situation that Banco de Portugal
expects will endure in the coming years.
If the debt level is correctly identified as an obstacle
to the development of Portuguese private
corporations and the overall growth prospects of the
economy, the bulk of the data presented here shows
that this problem is on its way to be solved. But this
could be a very simplistic way to look at these figures.
As already shown, the new loans contracted with the
10 This data includes non-financial holdings in order to account for the total debt of private corporations.
Graph 16– Private Sector Indebtedness (% real
GDP)
Source: Banco de Portugal, calculations by CMVM. Note: Latest
available data – 2014Q4.
Graph 17– Indebtedness of Private Corporations by
Size of the Corporation and Non-financial holdings
(% of real GDP)
Source: Banco de Portugal, calculations by CMVM. Note: Latest
available data – 2014Q4.
11 In Boletim Económico, May 2015.

20 | Research Department | RISK OUTLOOK | June 2015
banking system have been slowly decreasing,
although with high volatility, mainly loans above €1
million. Thus, the higher indebtedness, mainly
among large corporations and non-financial
holdings, even with GDP growing again, could only
be explained by the rise of debt securities and
trade credits. But, as stated, this is not necessarily
happening with micro- and small-sized enterprises.
The conclusion of a still fragmented access to capital
markets is strengthened by the sustained - if not
increasing - small versus large loan interest rate
spread and the absence of SMEs from stock
markets.
Nevertheless, for Portuguese CEOs, access to
new capital or liquidity is not one of the main
obstacles to business. Time and again, data from
Statistics Portugal (INE)'s Investment Survey has
identified lack of demand as the main difficulty
for business development in Portugal, as
previously stated in this report.
On the other hand, a progressive phasing out from
debt to self-financing is shown when the CEOs are
enquired on the sources of financing. Moreover,
even though nominal interest rates have been
clearly decreasing, the real cost of money has
been increasing.
In part, the nominal price fall is explained by a
reduction in transportation costs (lower oil
prices), but core inflation has also been
diminishing. This could lower the probability of
prior viable businesses to endure and can, in the
near- to medium-term, pose significant solvency
risks. In the end, the soundness of the lasting debt
among private corporations will depend on the
soundness of the investments and on the
fundamentals of the economy.
In the meanwhile, the ECB took bolder monetary
policy decisions as a reaction to the feeble aggregate
demand of the EZ and to the successive decrease in
inflation departing further and further away from
ECB’s price stability goal (i.e. EZ inflation hovering
around 2%). The full blown QE that the ECB has
been deploying since the beginning of March came
after a period when seemingly all the liquidity that the
ECB injected was insufficient to budge the velocity of
money, at least in the intended direction.
Nevertheless, the still recent QE could have changed
the picture on this subject.
Adding up to the still existing inflation differences that
create a considerably more challenging background
for corporations looking to thrive in Portugal (when
compared to the ones in Germany), there is still a
price depression slowly but steadily spreading
across the EZ countries. The mere
announcement of the QE programme (in January
2015) could have played a role in the recent
increase in the Harmonized Index of Consumer
Prices (HICP).
The real estate market has been one of the focal
points for risk transmission across multiple sectors.
From the US-born sub-prime crisis to the latter
bubbles in Spain and UK, weariness over real
estate has increased, making it a crucial area of
financial stability analysis. Currently, China is
probably the most real estate bubble-prone
economy, but Brazil, the Netherlands and some

21 | Research Department | RISK OUTLOOK | June 2015
regions of the UK are frequently under the radar for
new bubble identification. In Portugal, no actual
bubble burst occurred in the aftermath of the financial
crisis but real estate investors took an unavoidable
toll. The housing market contracted at least since the
beginning of 2010 until the end of 2013Q1.
The high real estate market illiquidity, combined
with non-performing loans put banks under
stress and brought about potential conflicts of
interest in highly verticalised financial groups
with stakes in insurance, mutual funds and asset
management, and even regulatory arbitrage. This
has been one of the action matters for the
Portuguese tri-party financial supervision authorities
over the last few years.
The current data on the real estate market shows a
pickup in the number of houses sold and more
significantly in prices. Nonetheless, the increase in
prices (more notorious in regions with more tourist
appeal such as Lisbon and the Algarve) has been
barely accompanied by real estate banking
appraisal values, which signals that banks are
still prudent and probably not so important as
market players as they were in the past. The
Portuguese real estate market had a revival during
2014, mainly in the high-end housing market.
Commercial renting also shows good signs,
especially in Lisbon. For the resurgence of the high-
end housing market, which is boosting the whole
12 The Portuguese government put in place a programme where it exchanges a resident permit for a €500.000 investment in the country (frequently done via real estate investments).
market, a mix of new sources of demand (from China
and France, mainly due to the Golden Visa
Programme12), but also a return of Portuguese
investors to the market are seldom quoted as main
drivers. According to some recent statements by
real estate agents from the biggest firms
operating in the Portuguese market, local
investors could be fleeing from financial markets
due to both a lack of trust and lower yields.
To what extent will this movement continue to drive
the market? To what extent will prices pick up in other
segments? How will this movement affect (positively
or negatively) other sectors via capital flows? For the
time being, in the aftermath of a couple of very harsh
years for all market players, a moderate increase in
prices and sales contributes to lowering the riskiness
coming from this market and to mitigate some of the
still ongoing distress. Nevertheless, under an
environment of increasing liquidity provisioning
to financial markets and under a global
movement of search-for-yield, the real estate
market should be kept under close surveillance,
both domestically and internationally.

22 | Research Department | RISK OUTLOOK | June 2015
Graph 18 – Velocity of Money in the Eurozone
Source: ECB, Eurostat, calculations by CMVM.
Note: Latest available data – 2014Q4
Graph 19– Spread between 12-month Euribor and
Harmonised Index Consumer Prices (HICP) - Portugal
and Germany (percentage points)
Source: Bloomberg, Calculations by CMVM.
Note: Latest available data – 31 March 2015
Graph 20– HICP – Selected countries and Eurozone
(percent change)
Source: Bloomberg, Calculations by CMVM. Note: Latest available data
– 31 March 2015
Graph 21– Number of Houses Sold
Source: Bloomberg, Calculations by CMVM. Note: Latest available data
– 31 December 2014.

23 | Research Department | RISK OUTLOOK | June 2015
Looming and latent risks from a macroeconomic
perspective
To better put in perspective the current levels of
interest rates, sovereign yields and asymmetries
between the European Union and the EZ countries,
a group of additional indicators is considered and
computed. To begin with, the frequently quoted
sentence that the EZ is recording historically low
interest rates and, more generally, a historically
low price of money must be taken with caution.
ECB reference rates, Euribor and even sovereign
yields are nominally at or close to minimum historical
values, but a different picture emerges when inflation
is discounted. The HICP also records the lowest
values in several countries, with outright negative
price changes occurring in Portugal, Spain and
Greece, among other countries.
Furthermore, several competing investment options
record historical minimums, but this says little of the
evolution of their relative attractiveness from the
point of view of yield seeking investors. For
instance, even though the 10-year sovereign
yields in Portugal have been at the lowest
nominal value in history, the 12-month Euribor
spread (a usual reference for return on savings
deposits) makes sovereign yields – ceteris
paribus – much more attractive now than before
2009.
Graph 22– House Price Index (yoy) - %
Source: Bloomberg, Calculations by CMVM. Note: Latest available data
– 2014Q4
Graph 23– Housing Banking Appraisal Values by
Region and Total
(euros/m2)
Source: INE, calculations by CMVM. Note: Latest available data – 28
February 2015

24 | Research Department | RISK OUTLOOK | June 2015
Additionally, when sticking to comparing the same
class of investments, the yield spread (vis-à-vis
Germany) of Portuguese 10-year sovereign
bonds is still clearly above its level prior to the
financial crisis or even after. This happens both
when considering nominal and real data (discounted
by each country’s HICP). For sovereigns, the real
interest rate that each country has to pay reveals
a scenario that is far from the pre-crisis level. The
nominal and the real effort to sustain each euro of old
or new debt has diminished for most of the EZ
countries since the crisis highs but it has not
collapsed to historical lows as an untrained eye
would state while looking only at nominal yields.
The fragmentation of the sovereign market becomes
quite evident when comparing sovereign yield
spreads. Entering a protracted low inflation
period could erode sovereigns’ ability to
maintain the fiscal revenue at the levels required
to service the debt and could undermine the
capacity to decrease spending without triggering
a deflation spiral.
On the other hand, the reasons for the actual
decrease in real yields and spreads could reveal an
additional problem given that macroeconomic
fundamentals have not vigorously improved. The
external and sovereign debts have but increased in
the last years in countries like Portugal and the
prospects for economic growth are feeble.
Graph 24 – Spread between Portuguese 10-year
sovereign bond yields and 12-Month Euribor
(percentage points)
Source: Bloomberg, calculations by CMVM. Note: Latest available data
– 31 March 2015

25 | Research Department | RISK OUTLOOK | June 2015
Graph 25–Nominal Bond Yields (10-year
government bond yield) – Percentage Points
Graph 26– Spread Towards German 10-Year Bond
Yield – in Nominal Terms – Percentage Points
Source: Bloomberg, calculations by CMVM. Note: Latest available
data – 28 February 2015
Source: Bloomberg, calculations by CMVM. Note: Latest available
data – 28 February 2015
Graph 27–Real Bond Yields (10-year government
bond yield minus HICP inflation rate) – Percentage
Points
Graph 28– Spread Towards German 10-Year Bond
Yield – in Real Terms – Percentage Points
Source: Bloomberg, calculations by CMVM. Note: Latest available
data – 28 February 2015
Source: Bloomberg, calculations by CMVM. Note: Latest available
data – 28 February 2015

26 | Research Department | RISK OUTLOOK | June 2015
The additional yield that sovereigns still pay when
compared to lower risk, investments within the EZ
and across the globe, along with a global shortfall of
secure assets (like US and German sovereign debt),
could have been spiking “high yield” sovereign bond
demand, thus lowering yields for riskier sovereign
debt, creating a market driven in a manner not far
from the workings of a junk bond market. This
apparently increasing global search for yield
could be hampering risk assessment and sound
price formation, and in the event of an
unexpected exogenous shock, it could lead to
the unfolding of a systemic event.
Against this background, monetary policy
instruments intended to fight deflation risks
could turn out to be themselves a risk factor. In
other words, if not carefully envisaged and
articulated with complementary policy actions that
prove to be clearly effective in fuelling sound
economic investments and the indispensable
demand, monetary policies could be a risk factor.
Achieving real economy yields, which divert
investments from search-for-yield and bubble-
prone markets seems to be critical at this point.
The subject of euro sustainability and resilience
recently appeared in the public agenda again, to be
quickly rebuffed by declarations of complete
commitment from ECB officials. The economic
fundamentals portrayed here and the remainder non-
13 This composite indicator aggregates data from 23 different series (DAX, Jones Industrial, Euro Stoxx 50, FTSE 100, Nasdaq 100, Russell 2000, S&P 500, Germany 10-year sovereign bonds, France 10-year sovereign bonds, UK 10-year sovereign bonds,
economic background recommend that this risk is
not neglected but instead considered one of the most
serious in consequences and with moderate
probability of occurrence. The expectations of a
protracted period of low or negative inflation
combined with low growth, austerity weariness
in most of the EZ countries and important
political dissent within the EZ could put at risk
not only the external debt sustainability in
several countries but also the very integrity of
the EZ.
Worldwide, there have been lower inflation tensions,
with some research centres stating that overall
inflation in 2014 should have decreased to somewhat
short of 4%. Not surprisingly, with global economic
growth not accelerating significantly over the last 12
months (data from mid-April 2014 until mid-April
2015) commodity prices have decreased (zinc is an
exception).
At the same time, the co-movement of the returns of
a series of different financial instruments has
changed considerably over recent years, meaning
that contagion risk or/and interconnectedness
haven’t had constant intensity. The variance
explained by the first principal component increased
in 2014 and the first two months of 2015, signalling
a potential increase in contagion risk.13 The
increasing financial integration of public and private
debt markets around the world might be a plausible
USA 10-year sovereign bonds, AAA Sovereign Debt, BBB Private debt, EUR/CHF, EUR/GBP,EUR/JPY, EUR/USD, VIX and prices of gold, silver, oil, wheat and natural gas).
27 | Research Department | RISK OUTLOOK | June 2015
explanation for such co-movement.
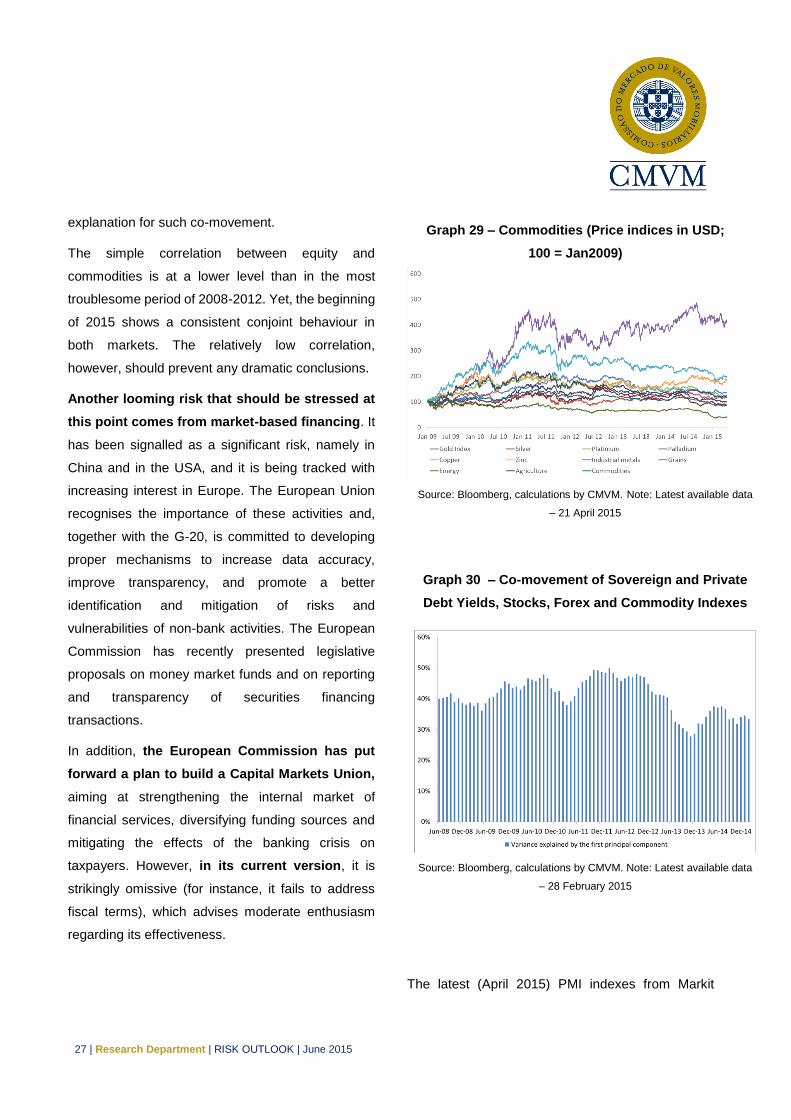
The simple correlation between equity and
commodities is at a lower level than in the most
troublesome period of 2008-2012. Yet, the beginning
of 2015 shows a consistent conjoint behaviour in
both markets. The relatively low correlation,
however, should prevent any dramatic conclusions.
Another looming risk that should be stressed at
this point comes from market-based financing. It
has been signalled as a significant risk, namely in
China and in the USA, and it is being tracked with
increasing interest in Europe. The European Union
recognises the importance of these activities and,
together with the G-20, is committed to developing
proper mechanisms to increase data accuracy,
improve transparency, and promote a better
identification and mitigation of risks and
vulnerabilities of non-bank activities. The European
Commission has recently presented legislative
proposals on money market funds and on reporting
and transparency of securities financing
transactions.
In addition, the European Commission has put
forward a plan to build a Capital Markets Union,
aiming at strengthening the internal market of
financial services, diversifying funding sources and
mitigating the effects of the banking crisis on
taxpayers. However, in its current version, it is
strikingly omissive (for instance, it fails to address
fiscal terms), which advises moderate enthusiasm
regarding its effectiveness.
Graph 29 – Commodities (Price indices in USD;
100 = Jan2009)
Source: Bloomberg, calculations by CMVM. Note: Latest available data
– 21 April 2015
Graph 30 – Co-movement of Sovereign and Private
Debt Yields, Stocks, Forex and Commodity Indexes
Source: Bloomberg, calculations by CMVM. Note: Latest available data
– 28 February 2015
The latest (April 2015) PMI indexes from Markit

28 | Research Department | RISK OUTLOOK | June 2015
reveal unexpected underperformance by European
economies, hinting that the probable higher GDP
growth rate in 2015Q1 may not be sustained in
2015Q2. These figures give some substance to the
questions on the limits of the current growth rate
cycle in developed economies. A question that
resonates with the most recent advice from several
international financial institutions on the need for a
comprehensive policy approach to the economy,
given the existing evidence that markets are
repeating behaviours that led to the last financial
crisis. Overall, high demand for AAA sovereign
debt subsists across the globe, along with
search-for-yield strategies and an increase in
cash hoarding by the richest investors. This triad
does not represent a significant difference from the
one witnessed one year ago. Like then, it represents
a frail background for predicting sustainable and
enduring growth and, consequently, for predicting
alleviation of overall risk perspectives for the near
future.
Graph 31 - Correlation between Equity and
Commodities
Source: Bloomberg, calculations by CMVM. Note: Latest available data
– 21 April 2015

29 | Research Department | RISK OUTLOOK | June 2015
3. Securities Markets
Indicators
Equities & Equity Futures – selected
indicators
The turmoil that began in mid-October 2014 was
prolonged until the end of 2014. By now it looks like
a blimp in an exuberant upward trend, more or less
common to most of the international stock
exchanges. Nikkey, S&P500, ISEQ, Eurostoxx 500
and MSCI World have all recorded the highest
levels at least since January 2009 in the most
recent weeks. In some cases, even historical record
highs have been broken during the first months of
2015. PSI20 exhibited one of the highest returns
since the beginning of 2015 (26.6% on 21 April). The
slightly better economic prospects could partially
justify this, but the ECB’s QE policy along with the
still accommodating stance of the monetary policy by
the FED and the loose monetary policy in Japan are
the prime suspects for boosting the stock exchange
markets worldwide in the first four months of 2015.
Volatility clearly decreased in the first months of 2015
in almost all financial markets.
Graph 32 – Stock Market Indices
Source: Bloomberg. Note: Latest available data – 21 April 2015
Graph 33– Equity Realised Volatility
Source: Bloomberg. Note: Latest available data – 21 April 2015

30 | Research Department | RISK OUTLOOK | June 2015
By mid-April, VIX recorded the higher value (lower
risk) compared to VSTOXX and PSI20 VaR.
Throughout April, some increase in volatility and
Value-at-Risk in PSI20 could be explained by
lingering doubts on the European negotiations on
Greece’s additional financial aid and by the potential
contagion that an ill outcome could bring, while, in
the second half of 2014, the increase was related to
the winding up of BES.
If one looks at the relationship between the earnings
yield (E/P) of stock indexes and 10-year Treasury
bond yields (Y), in the long run, both variables tend
to move in the same direction. Intuitively, bonds and
stocks compete for investment funds and those
funds tend to move towards the more attractive
investment.14
As of May 2015, the difference between the stock
market earning yield (E/P) and the 10-year Treasury
bond yield (Y) ranges between 3% and 4% in some
economic regions, but not in Portugal. This is to say
that, according to this model, stocks are cheap, when
compared to Treasury bonds. Concurrently, the
likelihood of having a bubble burst in the near future
is higher for the bond market, as this market appears
to be overvalued vis-à-vis the equity market.
14 Criticism often laid on the Fed model is that it compares a
nominal quantity (Y) to a real quantity (E/P).
Graph 34– Difference between the stock market
earning yield and the 10-year Treasury bond yield
Source: Bloomberg. Note: Latest available data – 29 May 2015

31 | Research Department | RISK OUTLOOK | June 2015
In the case of Portugal, the indicator has exhibited a
large negative value since 2011 but with an upward
trend since 2013. Until 2012, this emanated mainly
from the large default risk perceived by investors on
Portuguese sovereign debt (which continues to
present a large spread in comparison to German
bonds with the same maturity), but from then on, the
comparatively steeper fall in the Portuguese stock
market earnings also played a relevant role.
Concerning investor sentiment and stock market
activity, the positive sentiment recorded an upward
trend since January 2014, while negative sentiment
decreased during the first half of the year. In the
second semester of 2014, there is an increasing
interest for negative search terms, probably due
to the news about the Portuguese banking
sector. The search for positive terms was again
stronger over the first quarter of 2015.
Meanwhile, the Economic Sentiment Indicator for
the Portuguese economy recorded a seven-year
maximum in March. Both measures correlate with
aggregate stock market returns. However, the
strength of these correlations varies over time. The
correlation of stock market returns with the positive
sentiment is positive for 75% of the 52-rolling weeks
from January 2009 to March 2015, and with the
negative sentiment, it is negative for 83% of the 52-
rolling weeks under analysis.
Graph 35– Value-at-Risk, selected indices
Source: Bloomberg. Note: Latest available data – 21 April 2015
Graph 36 – Positive and Negative Sentiment (weekly
data) and Economic Sentiment Indicator
Source: Google Trends, European Commission, Calculations by CMVM.
Note: Latest available data – 28 February 2015

32 | Research Department | RISK OUTLOOK | June 2015
Graph 37- CAPE – S&P 500
Source: Bloomberg and CMVM (own calculations). Note: Latest available
data – 31 December 2014.
Graph 38– PSI20 – CAPE and Earnings
Source: Bloomberg, calculations by CMVM. Note: Latest available data –
2014Q4
Graph 39- CAPE – MSCI EMU
Source: Bloomberg and CMVM (own calculations). Note: Latest available
data – 31 December 2014.
Graph 40– Price to Book Ratio - Banks
Source: Bloomberg, calculations by CMVM.

33 | Research Department | RISK OUTLOOK | June 2015
The Cyclically-Adjusted Price-Earnings Ratio
(CAPE) of S&P500 is very close to its 15-year
historical average at the end of 2014, while, in the
case of MSCI EMU, it also deviates slightly from the
10-year historical average.15 Nevertheless, using
state space models (not depicted) or a lengthier
historical average, we witness above average CAPE.
Regarding Portugal, CAPE is below 14 at the end
of 2014, which contrasts with the 18.7 observed
for 2014Q1. This evolution may be justified by the
extraordinary events that affected two relevant
PSI20 firms: the bankruptcy of Banco Espírito
Santo, and important losses in short-term
investments of Portugal Telecom in Grupo Espírito
Santo commercial paper. The structural earnings of
Portuguese firms dropped by more than 20%
between 2011 and 2014.
Similarly to European and US banks, the price to
book ratio of Portuguese banks has decreased since
the beginning of the century. However, after the
European sovereign debt crisis, the Portuguese
financial institutions have revealed higher financial
stress, probably due to higher negative forward
looking investor confidence.
Analysing the weight of the net present value of
growth opportunities (NPVGO16) on stock prices of
15 A difference that, for the Eurozone, is amplified when using the
alternative approach, which relies on an unobserved component model specification to disentangle the trend and the cycle components from the series of earnings. 16 NPVGO is calculated considering 12 firms quoted in Euronext
Lisbon. Stock prices, earnings per share and cost of capital are
Graph 41– Net Present Value of Growth Opportunities
Source: Bloomberg, calculations by CMVM. Latest available data 2014Q4
Graph 42– PSI20 monthly average dividend yield
Source: Bloomberg, calculations by CMVM. Note: Latest available data –
30 April 2015
value-weighted. 𝑃0 = 𝐸𝑃𝑆1
𝑟0 + 𝑁𝑃𝑉𝐺𝑂0, where 𝑃0 is the stock
price on period 0, 𝐸𝑃𝑆1 are the earnings per share on period 1,
𝑟0 is the cost of capital of firms on moment 0 (assumed constant
and equal to 8.5%) and 𝑁𝑃𝑉𝐺𝑂0is the net present value of
growth opportunities on period 0.
34 | Research Department | RISK OUTLOOK | June 2015
Portuguese firms, a positive trend is apparent,
suggesting that investors are putting more emphasis
on the future growth opportunities and dividends. It is
yet to be determined if the behaviour in the second
half of 2014 is a mere blimp or a reversion of the
trend.
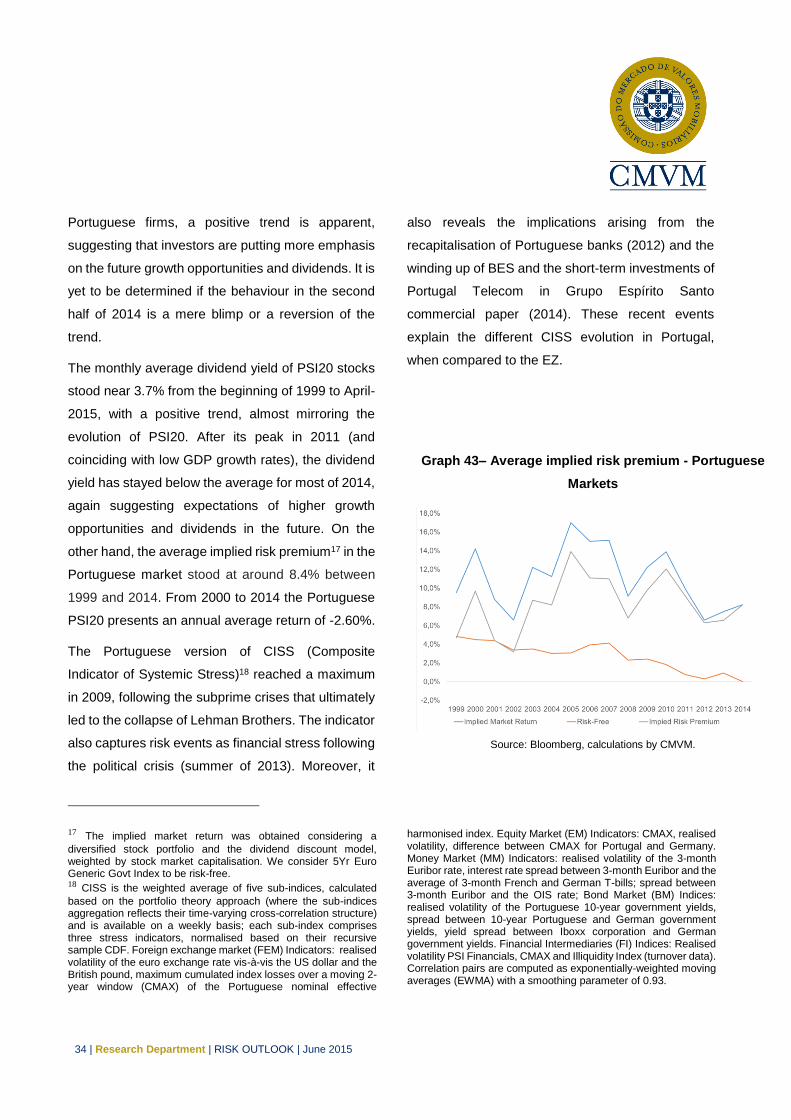
The monthly average dividend yield of PSI20 stocks
stood near 3.7% from the beginning of 1999 to April-
2015, with a positive trend, almost mirroring the
evolution of PSI20. After its peak in 2011 (and
coinciding with low GDP growth rates), the dividend
yield has stayed below the average for most of 2014,
again suggesting expectations of higher growth
opportunities and dividends in the future. On the
other hand, the average implied risk premium17 in the
Portuguese market stood at around 8.4% between
1999 and 2014. From 2000 to 2014 the Portuguese
PSI20 presents an annual average return of -2.60%.
The Portuguese version of CISS (Composite
Indicator of Systemic Stress)18 reached a maximum
in 2009, following the subprime crises that ultimately
led to the collapse of Lehman Brothers. The indicator
also captures risk events as financial stress following
the political crisis (summer of 2013). Moreover, it
17 The implied market return was obtained considering a
diversified stock portfolio and the dividend discount model, weighted by stock market capitalisation. We consider 5Yr Euro Generic Govt Index to be risk-free. 18 CISS is the weighted average of five sub-indices, calculated
based on the portfolio theory approach (where the sub-indices aggregation reflects their time-varying cross-correlation structure) and is available on a weekly basis; each sub-index comprises three stress indicators, normalised based on their recursive sample CDF. Foreign exchange market (FEM) Indicators: realised volatility of the euro exchange rate vis-à-vis the US dollar and the British pound, maximum cumulated index losses over a moving 2-year window (CMAX) of the Portuguese nominal effective
also reveals the implications arising from the
recapitalisation of Portuguese banks (2012) and the
winding up of BES and the short-term investments of
Portugal Telecom in Grupo Espírito Santo
commercial paper (2014). These recent events
explain the different CISS evolution in Portugal,
when compared to the EZ.
Graph 43– Average implied risk premium - Portuguese
Markets
Source: Bloomberg, calculations by CMVM.
harmonised index. Equity Market (EM) Indicators: CMAX, realised volatility, difference between CMAX for Portugal and Germany. Money Market (MM) Indicators: realised volatility of the 3-month Euribor rate, interest rate spread between 3-month Euribor and the average of 3-month French and German T-bills; spread between 3-month Euribor and the OIS rate; Bond Market (BM) Indices: realised volatility of the Portuguese 10-year government yields, spread between 10-year Portuguese and German government yields, yield spread between Iboxx corporation and German government yields. Financial Intermediaries (FI) Indices: Realised volatility PSI Financials, CMAX and Illiquidity Index (turnover data). Correlation pairs are computed as exponentially-weighted moving averages (EWMA) with a smoothing parameter of 0.93.

35 | Research Department | RISK OUTLOOK | June 2015
CISS is at a low level (around 0.1) during the first
semester of 2014 and then exhibits an upward trend
until February 2015, meaning that the level of
systemic stress in the Portuguese financial
system has increased in recent months. The
increasing level of systemic stress during this period
comes mainly from the financial intermediaries
segment and from the equity market. However, the
cross-correlation component reveals a relative
divergence of some of the segments, an evolution
which is in line with more tranquil periods.
Bonds & Credit Derivatives
In the aftermath of the financial crisis that eventually
led to the sovereign debt crisis, a bust and boom
cycle seems apparent in the sovereign debt yield of
countries like Portugal. Especially since mid-2010,
the 10-year sovereign yields soared and peaked in
mid-2012, only to begin a clear descent path that
brought yields close to or even below pre-crisis
figures.
The still weak economic prospects and steady
declines in prices raised concerns among Central
Banks. The Bank of England, the Bank of Japan, the
US Federal Reserve and more recently the ECB
Graph 44– CISS for Portugal, contributions coming
from each of the sub-indices and the overall
contribution from cross-correlations (weekly)
Source: ECB, BdP, Bloomberg, Calculations by CMVM. Note: Latest
available data – 27 March 2015

36 | Research Department | RISK OUTLOOK | June 2015
engaged in accommodative monetary policies.
Quantitative easing programmes, in particular, exert
a downward pressure on bond yields. Threats of
long periods of deflation led the ECB to
massively purchase sovereign bonds in the
secondary market. Sovereign bond yields in the EZ
are being pushed close to zero, reaching minimum
nominal historical levels in almost all member states.
In early May 2015, both 2- and 5-year Germany
sovereign bonds recorded negative yields. On 21
April, the yield on 10-year Portuguese sovereign
bonds was below 2%.
The ECB purchase programme is contributing to
lower bond profitability, compromising the sovereign
bond’s role as government credit instruments:
Portuguese 10-year sovereign bond yields are
similar to the 10-year US or UK sovereign bond
yields. This can eventually distort investors’
incentives to acquire Portuguese bonds and
undermine the country’s ability to raise
additional capital. The evolution of sovereign bond
yields in the EZ is being closely followed by several
market analysts as the ultimate proof of the success
or failure of the QE.

37 | Research Department | RISK OUTLOOK | June 2015
Graph 45- 10-Year Sovereign Debt Yields Graph 46- 10-Year Sovereign Debt Yields - Other
Countries
Source: Bloomberg, calculations by CMVM. Note: Latest available
data – 21 April 2015.
Source: Bloomberg, calculations by CMVM. Note: Latest available
data – 21 April 2015.
Graph 47- Spread between 10-year and 2-year
Sovereign bond yields
Graph 48- Portuguese sovereign debt yield curve
Source: Bloomberg, calculations by CMVM. Note: Latest available
data – 21 April 2015.
Source: Bloomberg, calculations by CMVM. Note: Latest available
data – 21 April 2015.

38 | Research Department | RISK OUTLOOK | June 2015
ECB - Nonstandard Monetary policy
The risk of low inflation in the medium term led
the ECB Governing Council to announce
additional non-standard monetary measures in
January 2015. The asset purchase programme
was extended to include the Public Sector
Purchase Programme (PSPP), supplementing
the Asset Backed Securities and the third
Covered Bond Purchase program, launched in
September 2014.
The Expanded Asset Purchase Programme
(APP) has a monthly target of €60 billion from
March 2015 until, at least, September 2016.
The new PSPP is conducted by the ECB and
national central banks (NCBs) and is directed
towards the purchase of euro denominated
bonds issued by (i) Governments and national
agencies in the EZ and (ii) from a list of
international and supranational institutions.
The eligible criteria of PSPP establishes that
marketable debt instruments must have a
remaining maturity of two to 30 years, with an
issue share and issuer limit of 25% and 33%,
respectively. In addition, bond purchases have
to respect ECB´s capital key on a monthly
basis. While the ECB cannot buy debt
instruments of supranational institutions, NCBs
are only allowed to buy public sector bonds
from their jurisdiction.
The purchase of supranational debt
instruments is conducted by Banco de España
and Banque de France; unless there is an
insufficient amount of bonds issued under the
NCBs' jurisdiction. In this situation, NCBs are
allowed to purchase supranational bonds. The
total purchase of supranational debt under
PSPP has a ceiling of 12%.
The PSPP will have a risk sharing of 20%: 8%
of the additional purchase made by the ECB
and 12% made by the NCB.
It is possible to buy bonds at a negative yield
maturity if it is above the deposited rate facility:
at -0.2% since September 2014.
On April 13, German 10-year bond yields
traded at 0.16% while both the two-year and
five-year recorded negative yields (-0.28% and
-0.13% respectively). Regarding the monthly
asset purchase objective, it is a matter of time
before German 10-year yields drop below zero
or, in the worst case scenario, below -0.2%. In
the latter German bonds would no longer be
eligible under the APP. This could jeopardise
the effectiveness of the programme and lately
compromise the ECB’s primary objective.
Public sector bond purchases are limited by the
ECB's capital key, where Germany accounts
for 25%, and by the purchase ceiling for
supranational bonds.

39 | Research Department | RISK OUTLOOK | June 2015
For the time being, the spread of 10-year sovereign
yields between EZ member states is narrowed.
Financial market fragmentation in the last two years
has shrunk but it did not return to pre-crisis levels. On
21 April 2015, the difference between the
Portuguese and German 10-year sovereign yields
was nearly 200 basis points, eight times higher than
in 2008. These spreads are passed on to the real
economy and widen the gap between Member
States. As a result, Portuguese companies
currently face higher borrowing costs than in
2008, in relation to their German competitors.
Different obstacles to credit access hinder
competitiveness and harm efforts to regain
market attractiveness.
Over the past few years, the Portuguese sovereign
yield curve has experienced a parallel downward
shift and the slope became steeper. This is also the
case for other European member states. But the
spread between 10-year and 2-year bond yields is
today much more pronounced in Portugal than in any
Graph 49- Spreads vis-a-vis Germany
CDS of 5-year sovereign debt
Source: Bloomberg, calculations by CMVM. Note: Latest available data
– March 2015
Graph 50- High yield bond issuance (€ Billion)
Source: Dealogic via AFME.
Eventually, a substantial amount of the monthly
€60 billion is at risk of not being invested unless
the ECB revises the PSPP criteria. Although
there might be a shortage of safe trading assets,
negative yields reveal a certain aversion to risk
and a lack of confidence in the market. Agents
seem to prefer costly assets (in practice, negative
yields are perceived as a tax or cost for the
investor) rather than holding profitable but risky
investments.

40 | Research Department | RISK OUTLOOK | June 2015
other member state (except for Greece). On 1
January 2008, the said spread for Portugal and
Germany was 40 and 34 basis points (bp),
respectively; it reached 200 and 37 bp, respectively,
on 21 April 2015.
After a highly unstable period, Portuguese sovereign
yields are following an adjustment path, but the
spreads can also signal different economic prospects
for Portugal and Germany. The economic outlook
remains fragile, and there are still doubts on the
solution to the unsolved Greek sovereign debt
problem. Even though ECB and IMF officials have
been downplaying the consequences, in terms of
contagion, of a rupture between Greece and its
EZ partners, the potential repercussions of such
a rupture on countries like Portugal are an
important risk factor.
CDS spreads did not fall with the magnitude of the
sovereign yields, at least for Portugal. By the end of
March 2015, the spread of Portugal vis-à-vis
Germany was 3.6 times higher than in March 2008
(111.48 bp on 31 March 2015). Different risk
premiums between member states is now more
evident than before the financial crisis.
Sovereign debt of the most fragile EZ economies has
been spiking investors’ interest, but the search for
yield is also directed towards private debt. According
to Dealogic data, high yield bond issuance has
been increasing, with issuances from the USA
and Europe significantly above 2009 levels. In
19 Sovereign debt is not included.
2014Q2, European high yield bond issuance has
outpaced the American one.
Even though the analysis focuses on high yield
issuers19 (with rating equal to or lower than BB+) it is
possible that, during the period under review,
substantial changes have occurred in the universe of
eligible bonds. Issuance volumes are probably
moving from investment-grade companies to (high
yield) companies that have been recently
downgraded. In 2014Q4, machinery,
telecommunications and cars/trucks were the
leading industries in high yield issuance in European
developed markets.

41 | Research Department | RISK OUTLOOK | June 2015
Investment Management
The year 2014 was marked by the Winding up of
Banco Espírito Santo (BES) and the inevitable
consequences that affected the several branches of
the financial group. With regard to the Asset
Management companies connected to BES, the
loss of investors was unavoidable, but no
relevant evidence of flight-to-safety abroad was
recorded in the aftermath of the winding up. The
most probable scenario was that assets ended up
being channelled to investment instruments of
competitor banks.
In Portugal , up until March, the year 2015 brought a
recovery of Assets Under Management (AuM) of
Individual Portfolio Management (+5.0% since
December 2014), while Collective Investment
stagnated in the same period. AuM of Collective
Investment schemes in Transferable Securities (CIS
in TS) continued to increase in 2015Q1 (+9.5%),
while AuM of Alternative Investment Funds
continued to decrease (-3.5%). Real Estate funds
also recorded a reduction in AuM (-2.1%) in spite of
the higher real estate prices. With the exception of
flexible funds, the evolution of CIS in TS by fund type
reveals a continuous upward trend in AuM. Equity
Funds lead the sector with a significant increase
(+16.8%) during the first three months of 2015.
The AuM of Securitisation Funds barely changed
since the end of 2014 (a slight decrease), apparently
not affected by ECB’s policy in this area (to buy funds
in the securitisation market).
Graph 51– Investment management in Portugal (€
Billion)
Source: CMVM.
Graph 52– Collective investment in Portugal by fund
type and private equity investment (€ Billion)
Source: CMVM.

42 | Research Department | RISK OUTLOOK | June 2015
Graph 53– CIS in TS by fund type (€ Million) Graph 54– Net Inflows by Investment Instrument
(subscriptions minus redemptions) - € Million
Source: CMVM. Note: Latest available data – 2015Q1 Source: CMVM, APFIPP, ASF (Ex-ISP), BdP and IGCP.
Graph 55– Investment management in Portugal by
fund class (€ Billion)
Graph 56– Variation of Net Asset Value by
Investment Instrument - € Million
Source: CMVM. Source: CMVM, APFIPP, ASF (Ex-ISP), BdP and IGCP.

43 | Research Department | RISK OUTLOOK | June 2015
In terms of the dynamics of subscriptions and
redemptions, up to March, the year has been positive
for Public Debt (sold to individuals as Savings
Certificates [Certificados de Aforro] and Treasury
Bonds [Certificados do Tesouro]) in line with 2014.
But this is not expected to continue throughout the
year, as those products were refurbished with a
much less competitive return. All the remainder of the
investment instruments analysed had net in the
period (subscriptions minus redemptions close to
zero).
Regarding fund flows, PCA is used to construct linear
combinations of fund flows in order to detect general
patterns in how investors reallocate money across
fund categories.20 The first two principal components
explain most (56%) of the total variance in the data.
The first principal component (named ‘generic
demand’) weighs positively (although not uniformly)
across all fund categories, and hence may be
perceived as a generic demand effect, accounting for
the general shifts in and out of en masse investment
funds. The fact that the first principal component
alone explains about 37% of the variance in net flows
suggests significant co-movement among fund
investors in Portugal. It can be argued that this first
principal component captures a broad investor
sentiment pertaining to the investment fund sector.
20 Funds are aggregated into Bond Funds (including Bond Funds
of Funds and Bond Hybrid Funds), Equity Funds (which also encompasses Equity Funds of Funds, Equity Hybrid Funds), Money Market Funds and Treasury Funds. This approach is based on the idea that a set of variables shares a latent structure, and
Graph 57– Principal Components of Mutual
Fund Flows - Portugal
Source: CMVM. Note: latest available data – February 2015
PCA is then used to isolate the underlying common features across several time series while expurgating idiosyncratic characteristics.

44 | Research Department | RISK OUTLOOK | June 2015
In contrast, the second principal component
indicates that the next most important driving force
behind fund flows is a polarity between safer (Money
Market Funds, Treasury Funds and Bond Funds) and
riskier fund categories (Equity Hybrid Funds, Equity
Funds and Equity Funds of Funds). This risk-safety
contrast suggests that, controlling for the generic
demand effect, when cash flows out of the riskier
fund categories, it tends to flow into the safer
categories, in what is generally referred to as “flight-
to-quality”. This, in turn, supports the idea that flight-
to-quality movements are also present within
fund flows in Portugal.
There has been a steady increase in demand for
investment funds from 2012 onwards, stemming
from positive net inflows into both safe and risky fund
categories. In particular, demand for safer funds
remained high until mid-2013, due to increasing net
inflows into Money Market Funds and Treasury
Funds. Towards the end of 2013, however, while
demand for risky funds continued to be positive,
safer funds recorded substantial outflows
(particularly Money Market Funds), suggesting a shift
away from safe funds and into risky fund categories.
During the second half of 2014, both the generic
demand and the demand for safer funds exhibit a
significant drop, on the back of a widespread
decrease in net inflows across virtually all fund
categories, suggesting a loss in investor confidence.
However, since the end of 2014, general demand for
investment funds shows a noteworthy recovery,
supported by substantial net inflows to Bond Funds,
but also Equity Funds. Furthermore, flight-to-quality
reverses to negative values, determined by net
outflows from Treasury Funds. Taken together, these
recent developments suggest that investor
confidence in investment funds is back on the
path to recovery and that fund investors are more
willing to invest in riskier fund categories.

45 | Research Department | RISK OUTLOOK | June 2015
Trading
In most developed markets, the weight of lit venues
(i.e., traditional regulated markets) in the overall
trading activity of stocks has been decreasing,
especially if compared to pre-crisis levels or even to
late 2008 figures. Portugal has been trailing some of
its European partners where this phenomenon has
been less intense. Nevertheless, the average weight
of the lit market decreased from 58.7% in 2013 to
56.3% in 2014 (72.4% in 2009), as the off-book trade
(i.e., transacted over the counter) increased to an
average weight of 39.6% (37.3% and 25.2% in 2013
and 2009, respectively). The most recent figures
represent a comeback of lit markets, as they
represented less than 50% of trading in several
quarters. This venue fragmentation and trading
dispersion poses a challenge to market
oversight: important regulatory provisions still
differ between traditional exchanges and other
trading platforms.
Having established “where” and moving to “how
much”21 reveals that, in the second half of 2014,
aggregate liquidity declined in Portugal, Italy and
France, only to pick up again in the beginning of
2015. Market liquidity22 increased during the last
months in the
21 The available data on liquidity refers only to lit market trading.
22 The Liquidity Composite Index (LCI) is computed by means of a principal component analysis on nine liquidity proxies (bid-ask spread, effective bid-ask spread, Roll’s measure, market turnover,
Graph 58- Lit venue market share
(Portugal and Europe)
Source: Fidessa, calculations by CMVM.
Graph 59- Lit venue market share
(Portugal and World)
Source: Fidessa, calculations by CMVM.
turnover ratio, Lhh, Amihud Illiquidity Indicator, Zero’s measure and Market Error-Correction). When LCI crosses the X-axis (denoting a value of zero), it means that the liquidity in that period equals the average liquidity of the full period considered in the sample. Conversely, a negative (positive) LCI indicates that liquidity is lower (higher) than the sample average.
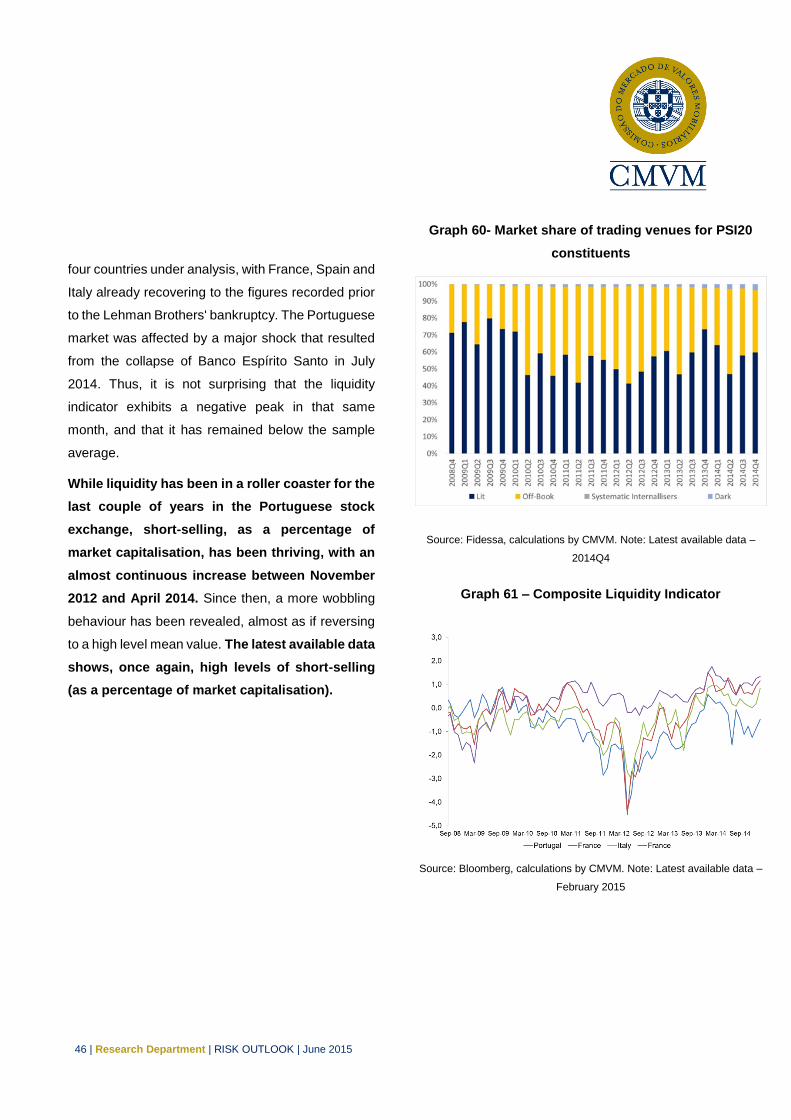
46 | Research Department | RISK OUTLOOK | June 2015
four countries under analysis, with France, Spain and
Italy already recovering to the figures recorded prior
to the Lehman Brothers' bankruptcy. The Portuguese
market was affected by a major shock that resulted
from the collapse of Banco Espírito Santo in July
2014. Thus, it is not surprising that the liquidity
indicator exhibits a negative peak in that same
month, and that it has remained below the sample
average.
While liquidity has been in a roller coaster for the
last couple of years in the Portuguese stock
exchange, short-selling, as a percentage of
market capitalisation, has been thriving, with an
almost continuous increase between November
2012 and April 2014. Since then, a more wobbling
behaviour has been revealed, almost as if reversing
to a high level mean value. The latest available data
shows, once again, high levels of short-selling
(as a percentage of market capitalisation).
Graph 60- Market share of trading venues for PSI20
constituents
Source: Fidessa, calculations by CMVM. Note: Latest available data –
2014Q4
Graph 61 – Composite Liquidity Indicator
Source: Bloomberg, calculations by CMVM. Note: Latest available data –
February 2015
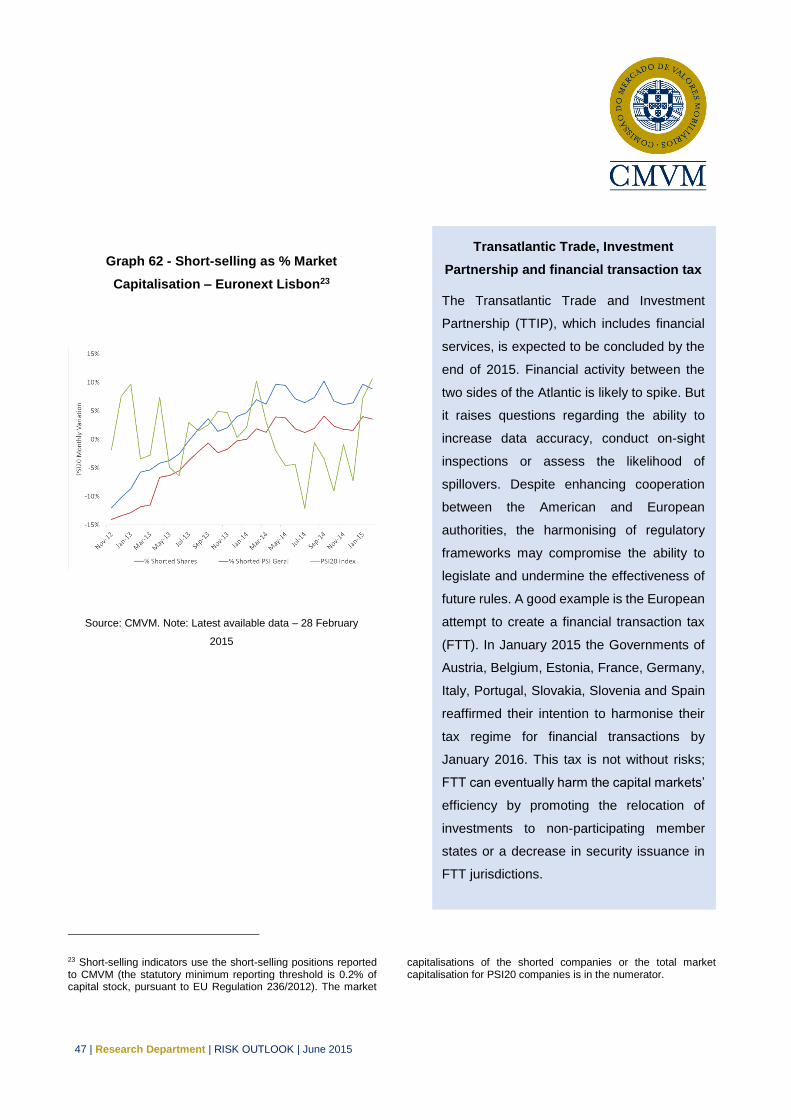
47 | Research Department | RISK OUTLOOK | June 2015
Graph 62 - Short-selling as % Market
Capitalisation – Euronext Lisbon23
Source: CMVM. Note: Latest available data – 28 February
2015
23 Short-selling indicators use the short-selling positions reported to CMVM (the statutory minimum reporting threshold is 0.2% of capital stock, pursuant to EU Regulation 236/2012). The market
capitalisations of the shorted companies or the total market capitalisation for PSI20 companies is in the numerator.
Transatlantic Trade, Investment
Partnership and financial transaction tax
The Transatlantic Trade and Investment
Partnership (TTIP), which includes financial
services, is expected to be concluded by the
end of 2015. Financial activity between the
two sides of the Atlantic is likely to spike. But
it raises questions regarding the ability to
increase data accuracy, conduct on-sight
inspections or assess the likelihood of
spillovers. Despite enhancing cooperation
between the American and European
authorities, the harmonising of regulatory
frameworks may compromise the ability to
legislate and undermine the effectiveness of
future rules. A good example is the European
attempt to create a financial transaction tax
(FTT). In January 2015 the Governments of
Austria, Belgium, Estonia, France, Germany,
Italy, Portugal, Slovakia, Slovenia and Spain
reaffirmed their intention to harmonise their
tax regime for financial transactions by
January 2016. This tax is not without risks;
FTT can eventually harm the capital markets’
efficiency by promoting the relocation of
investments to non-participating member
states or a decrease in security issuance in
FTT jurisdictions.

48 | Research Department | RISK OUTLOOK | June 2015
4. Looking Ahead and
Concluding Remarks
Looking ahead, the extent of the effectiveness of
the ECB’s attempts to revive its transmission
mechanisms in order to financially support real
economy and bring inflation closer to the
monetary policy target will determine the outlook
for numerous economies in the upcoming
months. The results of the latest stress tests on the
EZ banking system revealed that several banks in a
variety of member states were in need of capital,
which somewhat contributes to the sentiment that the
crisis in the European banking sector endures. The
recent case of Banco Espírito Santo in Portugal, or
the even more recent bond default of Heta Asset
Resolution A.G. (the “bad bank” of Hypo Alpe-Adria-
Bank International A.G., created by the Austrian
government) also contributed to revive and highlight
the sentiment of a still debilitated banking sector in
Europe. In a nutshell, the profitability of the EZ
banking sector still poses an important threat to
financial and economic stability in Europe.
An environment of low interest rates and low growth
prospects poses several challenges to financial
stability. The combination of low inflation and excess
liquidity can lead to the emergence of Ponzi financial
schemes. Agents are prompted to take more risks
and actively search for higher yields. In the medium-
term, and in the absence of higher domestic
return rates, investments may be diverted to third
economies. Europe may face important capital
outflows, with negative repercussions on market
confidence and liquidity. The impacts should be
more pronounced in an open, small and fragile
economy as Portugal. This also resonates with
doubts on the ability of the Portuguese exports to
regain momentum (as predicted in the European
Commission’s spring 2015 economic forecasts)
and with the question regarding the
consequences of the already significant
decrease in investment that has marked the
Portuguese economy since 2008.
The ECB has been increasingly assuming a looser
monetary policy stance and it has broadened its
intervention in volume and in scope (namely by
directly buying corporate and sovereign debt in
secondary markets). This did not come without
criticism and some risks have been pointed out by
several leading economists and even partially
admitted by ECB officials. It may entail risks,
especially if the monetary policy measures are not
precisely targeted. With TLTRO, the ECB signalled
that the new lending facilities would not fund
additional real estate credit. However, with the ABS
and covered bonds purchase programme and, since
March 2015, with a full blown QE policy, it is
questionable if some of the targeted liquidity will
not end up on the usual bubble-prone markets.
This preoccupation finds support in the
exuberant evolution of most stock market
indexes worldwide, which has seldom been
accompanied by strong economic growth.
The dual objective of strengthening bank capital and
49 | Research Department | RISK OUTLOOK | June 2015
deleveraging the most indebted banks, along with
the need to fuel credit to the real economy, has
proven hard to attain. To stress the risks of the QE,
one should highlight that ECB officials have been
louder in asking for complementary fiscal policy
measures, a field of action that is reserved to national
governments. The fiscal policy stance in the EZ is
also posed to be a risk factor in the following
months. If the QE is not accompanied by higher
aggregate demand, the negative effects of the QE
alone, or at least its ineffectiveness, could prove
to be real.
Another downside effect can be a drying-up bond
market liquidity, with a negative impact on
volatility, as it might be illustrated by the recent
abnormal fluctuation of German bond yields.
Furthermore, with the proliferation of negative
sovereign yields in the EZ, yield seeking investors
can increase exposure to less safe bonds. This can
prove beneficial to the Portuguese sovereign market
but even the attractiveness of Portuguese bonds
could be significantly reduced as their yields come
close to or go below zero. Although not a near-term
risk, this could jeopardise the country’s ability to raise
additional capital in the market.
The reasoning for these adverse effects of the QE
could stem from the initial proneness for new
bubbles: the low effectiveness of policy
transmission could end up leading to increasing
risks of bubble formation in the securities and
real estate markets. It could even lead to the
reinforcement of deflationary forces via
“artificially” deflecting capital from lower yield
real economy investments towards the
exuberant behaviour of the ballooned securities
and real estate markets. Thus, further inducing
savings to ride and fuel new bubbles, and hindering
new investment and actual demand that could
stimulate investment. In other words, if excess
liquidity does not flow to households and non-
financial corporations, growth and prices may not
pick-up. If this scenario materialises, long-term
economic prospects for Europe may be rather
pessimistic: a period of persistent low inflation,
weak economic growth, low corporate
profitability, and high unemployment rate. In
particular, member states under strong adjustment
processes will face additional difficulties to recover.
The first, although still scarce macroeconomic
indicators for 2015 show that growth prospects are
positive; the “road to deflation” seems to have been
stopped and some signs of successful transmission
have been recorded, with increases in consumption
and production. But the latest (April 2015) PMI
indicators, both for the services and industry sectors
hint at an alignment in the major EZ economies, one
that reveals that the economy could no longer be
accelerating in the beginning of 2015Q2. This is
certainly a subject worth following closely in the
upcoming months. If the GDP growth rate does not
pick up more or less evenly in the EZ, and in a
lasting way, in this environment of very low
interest rates, several latent risks in the banking,
insurance and investment management sectors
could materialise.
In general, equity markets have responded positively

50 | Research Department | RISK OUTLOOK | June 2015
to expansionary monetary policies, but the effect can
be distortive. European and American stock markets
have reached historic highs, although not without
higher volatility. This raises the question as whether
there are signs of equity market overvaluation. The
empirical evidence in the US and in the UK (which
have undergone QE programmes in recent years)
warns not to ignore the hypothesis of potential risk
for several markets and, eventually, for financial
stability. Although economic growth has been more
noticeable, especially in the US, securities markets
have been hitting historical records, which do
not seem to be completely aligned with economic
fundamentals. In the UK, securities markets have
been close to exuberant and there are indications of
potential over-heating in the real estate market
(especially in the London region and high-end
dwellings), also while global inflation keeps
subsiding.
Could the QE in Europe, especially as the single
policy instrument to deal with low inflation, low
growth and still ill-solved consequences of the
financial crisis, ultimately put additional aches in
the already worrisome search-for-yield
behaviour? Will the European Commission's Junker
plan, intended to stimulate private investment,
provide the balance required to shift investment
towards the real economy?
In conclusion, the challenges of the ECB and
European leaders are twofold: to preserve
financial stability and avoid the so-called ‘secular
stagnation’ in the Eurozone.
The discussion of institutional reform in the EZ
and in the EU as a whole is bound to reappear in
the agenda, upon the conclusion of the election
of the new European Commission. The
institutional reform to be implemented, will come
amidst an increase in external (G20 and IMF) and
internal (France and Italy) pressure to revise both the
national budgetary targets and the role of public
investment in the not so indebted European
countries, as well as the role of fiscal policy
altogether. The ECB has also been an
increasingly vocal player in asking (though
asymmetrically, country-wise) for a clear,
reinforced intervention on fiscal policy, to help
boost aggregate demand, which, by now, the
ECB recognises as being a hindrance on
European economic prospects in the near and
medium run. However, the enduring uncertainty
regarding the outcome of the political debate
between Greece and its EZ partners on the unsolved
problem of a depressed Greek economy and its debt
obligations has prevented further advances in the
medium- to long-term discussion on institutional
reforms.
As regards the reduction of borrowing costs, Member
States are still facing several obstacles in credit
access, and this problem is expected to remain in the
agenda. Sovereign spreads are still higher than
before the crisis. As a result, financial market
fragmentation persists and increasing
divergences in the EZ can create a negative
snowball effect in distressed economies. Besides
the macroeconomic impact (fiscal revenues,
competitiveness, investment), financial markets

51 | Research Department | RISK OUTLOOK | June 2015
can suffer from a potential liquidity squeeze.
For Portugal, IMF voices concerns about the high
level of sovereign and private debt. Albeit in an
expected downward trend, household and non-
financial corporate gross debt will remain higher than
in other advanced economies at least until 2020,
according to the IMF. Furthermore, high credit level
constitutes a barrier to the proper functioning of the
bank-lending channel. This also raises the
question as to what extent can the Portuguese
economy benefit from ECB’s expansionary
policy.
In addition, and considering the capital requirements
introduced by Basel III, banks are encouraged to
improve the quality of their assets and compelled to
act as buffers to cushion pro-cyclical or systemic
risks. In order to strengthen their capital structure,
banks may need to raise additional capital, stressing
the importance of capital markets and the need to
reinforce the interdependence between international
financial institutions. Competent supervision
authorities from different jurisdictions are urged to
work in closer cooperation and establish a
comprehensive framework to avoid regulatory
arbitrage, as well as to detect and curb systemic
risks in useful time.
Moreover, market based financing is on the rise
and is identified by the IMF and the ECB as an
increasing risk to financial stability. Market-based
financial intermediation comprises a large spectrum
of activities and a broad variety of products (some
highly opaque and complex), which are difficult to
identify and address. The European Union
recognises the importance of these activities and,
together with the G-20, is committed to developing
proper mechanisms to increase data accuracy,
improve transparency, and promote more efficiency
in the identification and mitigation of risks and
vulnerabilities in market-based financing activities.
The European Commission has recently presented
legislative proposals on Money Market Funds and on
the reporting and transparency of securities financing
transactions. Imposing access to more
comprehensive information, upholding thorough
surveillance and better, more harmonised regulation
can promote confidence and upgrade market-based
financing from a looming risk to an important
instrument for economic efficiency.
In addition, the European Commission has put
forward a plan to build a Capital Markets Union. Even
though it is proposed to strengthen the internal
market for financial services, diversify sources of
funding and mitigate the banking crisis effects on
taxpayers, in its current version, it is strikingly
omissive (for instance, it fails to address fiscal
terms), which advises moderate enthusiasm
regarding its effectiveness. There have been recent
and ongoing regulatory changes within the European
Community and, as a consequence, also in the
Portuguese regulatory framework. Such
developments aim at achieving further
harmonisation, less information asymmetry,
increasing overall transparency, facilitating market
access to new non-institutional investors and
issuers, bolstering security and market trust and
allowing for more comprehensive market

52 | Research Department | RISK OUTLOOK | June 2015
supervision, with a wider scope of intervention and
instruments for supervisors to deploy. Looking
ahead, there are bound to be effects involving asset
management (via the Alternative Investment Fund
Managers Directive - AIFMD), securities markets (via
the Markets in Financial Instruments Directive II –
MiFiD II and the Financial Market Regulation IFMR),
market infrastructures and derivatives (via the
European Market Infrastructure Regulation EMIR),
market abuse (via Directive 2014/57/EU and EU
Regulation 569/2014), transparency (via EU
Directive 2013/50/EU) and the operation of Central
Securities Depositories (via the Regulation on
Settlement and Central Securities Depositories).
For the time being, these are some of the currently
predictable future focal points, many derived from the
recent past, that could pose challenges and lead to
significant shifts in the status quo, with potential
impacts for Portugal, the Eurozone and also on the
global economy and global markets.

53 | Research Department | RISK OUTLOOK | June 2015
5. List of Graphs
Graph 1 – GDP growth (yoy) and forecasts for selected countries ................................................................... 10
Graph 2 – Portuguese exports (€) of goods by destination - 2014 ................................................................... 10
Graph 3 – Differences in the latest consecutive GDP forecasts for selected Countries ................................... 14
Graph 4 – GDP at market prices (2005=100) .................................................................................................... 14
Graph 5– Government Consolidated Gross Debt as a Percentage of GDP ..................................................... 14
Graph 6– Per Capita GDP at market prices (€) ................................................................................................. 14
Graph 7– Overdue loans - Portugal (in % of total credit granted) ..................................................................... 15
Graph 8– Difference in the breakdown of the % of non-financial corporations with overdue loans .................. 15
Graph 9– Gross total doubtful and non-performing loans in the balance sheets of domestic banking groups
and stand-alone banks (% of total debt instruments and total loans and advances) ........................................ 16
Graph 10– New loans, respective interest ......................................................................................................... 16
Graph 11– Net issuance of debt securities – Short- vs Long-term - Portugal ................................................... 17
Graph 12– Outstanding amounts of debt securities issued by NFC - Portugal ................................................. 17
Graph 13– Net issuance of debt securities by NFCs - Portugal ........................................................................ 17
Graph 14– Net issuance of long-term debt securities by NFCs - Portugal ....................................................... 17
Graph 15– Change in credit extended to households in Portugal and the Eurozone (mortgage and consumer
credit) - %........................................................................................................................................................... 18
Graph 18 – Velocity of Money in the Eurozone ................................................................................................. 22
Graph 19– Spread between Euribor 12 Months and Harmonised Index Consumer Prices (HICP) - Portugal
and Germany (percentage points) .................................................................................................................... 22
Graph 20– HICP – Selected countries and Eurozone (percent change) .......................................................... 22
Graph 21– Number of Houses Sold .................................................................................................................. 22
Graph 22– House Price Index (yoy) - % ............................................................................................................ 23

54 | Research Department | RISK OUTLOOK | June 2015
Graph 23– Housing Banking Appraisal Values by Region and Total (euros/m2) ............................................. 23
Graph 24 – Spread between Portuguese 10-year sovereign bond yields and 12-Month Euribor (percentage
points) ................................................................................................................................................................ 24
Graph 25–Nominal Bond Yields (10-year government bond yield) – Percentage Points ................................. 25
Graph 26– Spread Towards German 10-Year Bond Yields – in Nominal Terms – Percentage Points ............ 25
Graph 27–Real Bond Yields (10-year government bond yields minus HICP inflation rate) – Percentage
Points ................................................................................................................................................................. 25
Graph 28– Spread Towards German 10-Year Bond Yields – in Real Terms – Percentage Points .................. 25
Graph 29 – Commodities (Price indices in USD; 100 = Jan2009) .................................................................... 27
Graph 30 – Co-movement of Sovereign and Private Debt Yields, Stocks, Forex and Commodity Indexes ..... 27
Graph 31 - Correlation between Equity and Commodities ................................................................................ 28
Graph 32 – Stock Market Indices ...................................................................................................................... 29
Graph 33– Equity Realised Volatility ................................................................................................................. 29
Graph 34– Difference between the stock market earning yield and the 10-year Treasury bond yield ............. 30
Graph 35– Value-at-Risk, selected indices ....................................................................................................... 31
Graph 36 – Positive and Negative Sentiment (weekly data) and Economic Sentiment Indicator ..................... 31
Graph 37- CAPE – S&P 500.............................................................................................................................. 32
Graph 38– PSI20 – CAPE and Earnings ........................................................................................................... 32
Graph 39- CAPE – MSCI EMU .......................................................................................................................... 32
Graph 40– Price to Book Ratio - Banks ............................................................................................................. 32
Graph 41– Present Net Value of Growth Opportunities .................................................................................... 33
Graph – PSI20 monthly average dividend yield ................................................................................................ 33
Graph 43– Average implied risk premium - Portuguese Markets...................................................................... 34
Graph 44– CISS for Portugal, contributions coming from each of the sub-indices and the overall contribution
from cross-correlations (weekly) ........................................................................................................................ 35
Graph 45- 10-Year Sovereign Debt Yields ........................................................................................................ 37

55 | Research Department | RISK OUTLOOK | June 2015
Graph 46- 10-Year Sovereign Debt Yields - Other Countries ........................................................................... 37
Graph 47- Spread between 10-year and 2-year Sovereign bond yields ........................................................... 37
Graph 48- Portuguese sovereign debt yield curve ............................................................................................ 37
Graph 49- Spreads vis-a-vis Germany .............................................................................................................. 39
Graph 50- High yield bond issuance (€ Billion) ................................................................................................. 39
Graph 51– Investment management in Portugal (€ Billion) ............................................................................... 41
Graph 52– Collective investment in Portugal by fund type and private equity investment (€ Billion) ............... 41
Graph 53– CIS in TS by fund type (€ Millions) .................................................................................................. 42
Graph 54– Net Inflows by Investment Instrument (subscriptions minus redemptions) - € Million ..................... 42
Graph 55– Investment management in Portugal by fund class (€ Billion) ........................................................ 42
Graph 56– Variation of Net Asset Value by Investment Instrument - € Million ................................................. 42
Graph 57– Principal Components of Mutual Fund Flows - Portugal ................................................................. 43
Graph 58- Lit venue market share (Portugal and Europe) ................................................................................ 45
Graph 59- Lit venue market share (Portugal and the World) ............................................................................ 45
Graph 60- Market share of trading venues for PSI20 constituents ................................................................... 46
Graph 62 - Short-selling as % of Market Capitalisation – Euronext Lisbon ...................................................... 47