Embed Size (px)
Citation preview

Financ ial Ser v ices Author it y
Financ ial Ser v ices Author it y
Financ ial Ser v ices Author it y
Financ ial Ser v ices Author it y
Prudential Risk Outlook 2011 Financial Services Authority
The Financial Services Authority25 The North Colonnade Canary Wharf London E14 5HSTelephone: +44 (0)20 7066 1000 Fax: +44 (0)20 7066 1099Website: www.fsa.gov.ukRegistered as a Limited Company in England and Wales No. 1920623. Registered Office as above.
PUB REF: 004040
Prudential Risk Outlook
2011

FSA-PRO-2011 Text.indd 1 16/03/2011 13:19

Prudential Risk Outlook
2011
FSA-PRO-2011 Text.indd 2 16/03/2011 13:19

© Financial Services Authority 201125 The North Colonnade Canary Wharf London E14 5HSTelephone: +44 (0)20 7066 1000 Fax: +44 (0)20 7066 1099Website: www.fsa.gov.ukAll rights reserved
FSA-PRO-2011 Text.indd 3 16/03/2011 13:19

Contents
Chairman’s foreword 3
Executive summary 7
Section A – The macroeconomic context 13
Section B – The UK financial sector 29
Section C – Credit risks 57
Section D – The low interest rate environment 81
FSA-PRO-2011 Text.indd 1 16/03/2011 13:19

JOB: FSA-CRO-2011 | Page 3 | Proof 1 Mar-16-11FSA-PRO-2011 Text.indd 2 16/03/2011 13:19

Prudential Risk Outlook 2011Chairman’s foreword
3
JOB: FSA-CRO-2011 | Page 3 | Proof 1 Mar-16-11
Chairman’s foreword
Two of the FSA’s statutory objectives are maintaining confidence in the UK financial system and contributing to the protection and enhancement of the stability of the UK financial system. It primarily does this through micro-prudential regulation and supervision. But in order to do so effectively we need to place our work within the context of a clear understanding of overall macroeconomic and financial trends. And regulated firms need to take account of that context in their assessment and management of risks. This Prudential Risk Outlook (PRO) sets out that context.
It is one of two parallel documents. Its sister publication is the Retail Conduct Risk Outlook, which we published in February. In previous years these documents were combined in our Financial Risk Outlook. We have now split them as we head towards an increasingly distinct focus on prudential and conduct issues ahead of the restructuring of the FSA into the Prudential Regulation Authority (PRA) and the Financial Conduct Authority (FCA). That restructuring, however, also involves the creation of the Financial Policy Committee (FPC), which is specifically focused on macro-prudential issues. The FPC, which is already in place in interim form and on which FSA Chief Executive Hector Sants and I sit, will take responsibility for the content of the Bank of England’s Financial Stability Report (FSR), starting with the FSR to be published this summer. So, in future years we will not produce a separate PRO: it will effectively be combined with the Bank’s FSR.
Over the past two years the capital and liquidity position of the UK banks has significantly improved, increasing resilience to shocks. But this year’s Outlook describes still important risks to financial stability. It highlights, in particular:
• still incomplete progress in the deleveraging required to create a less vulnerable system;
• progress towards improved global capital and liquidity standards and the need, as that progress is achieved, to understand possible risk transfers and migrations to other parts of the financial system;
• a number of important areas of credit risk, relating in particular to vulnerable euro-area countries, to commercial real estate, and potentially, in emerging markets facing rapid property price inflation; and
• the risks created by a sustained period of low interest rates which could crystallise as and when interest rates return to more normal levels.
FSA-PRO-2011 Text.indd 3 16/03/2011 13:19

Prudential Risk Outlook 2011Chairman’s foreword
4
JOB: FSA-CRO-2011 | Page 4 | Proof 1 Mar-16-11
This PRO, like the FRO last year, also sets out the macroeconomic parameters which the FSA will be using in its supervisory stress tests of major banks. This ongoing process of bank-by-bank stress testing complements the European-wide stress tests being conducted this Spring by the European Banking Authority (EBA).
In the face of these still important risks it is vital that banks focus on achieving still further progress to sound funding positions, maintain high capital ratios and adequate provisions, and that banks, insurance companies and other financial institutions focus strongly on the specific risks to which their business mix exposes them.
Adair Turner March 2011
FSA-PRO-2011 Text.indd 4 16/03/2011 13:19

JOB: FSA-CRO-2011 | Page 4 | Proof 1 Mar-16-11 FSA-PRO-2011 Text.indd 5 16/03/2011 13:19

JOB: FSA-CRO-2011 | Page 7 | Proof 1 Mar-16-11FSA-PRO-2011 Text.indd 6 16/03/2011 13:19

Prudential Risk Outlook 2011Executive summary
7
JOB: FSA-CRO-2011 | Page 7 | Proof 1 Mar-16-11
Executive summary
Section A: The macroeconomic contextThe world economy recovered in 2010, following its largest post-war contraction. But the return to growth has been uneven. Developed countries, some burdened by high levels of private and public sector indebtedness, grew more slowly while rapid growth in Asia has created inflationary pressures in commodities markets. The UK economy recovered briskly in the first half of the year but slowed in the second half with output contracting in the final quarter of 2010. Deleveraging in the private sector picked up pace from the previous year, supported by government spending and the more favourable macroeconomic environment.
The coalition government has set out plans for fiscal consolidation. With a continuing need for gradual deleveraging in parts of the household and corporate sectors, the impetus for growth will have to come from corporate investment and overseas trade, requiring steady growth in the world economy. Rebalancing of the UK economy and adjusting to more sustainable debt levels in the more leveraged sectors will take time.
Our central scenario, based on a consensus of the main private sector forecasting institutions, is for UK economic growth to resume in 2011 after the contraction at the end of 2010. But it is also important to consider alternative scenarios and we outline three examples:
1. weak global and particularly European growth leading to slower UK growth;
2. rapid global growth leading to higher inflation and rising interest rates; and
3. two-track global growth with developed economies lagging behind emerging markets and the UK facing both slow growth and rising inflation and interest rates.
Our key messages to firms include:
• Demand for credit in the UK is likely to grow more slowly than nominal GDP for a number of years as households and parts of the corporate sector, such as commercial real estate (CRE) companies, reduce indebtedness relative to their income.
• But until this deleveraging is achieved, continuing high levels of indebtedness in parts of the household and corporate sectors will leave the UK economy vulnerable to economic shocks.
FSA-PRO-2011 Text.indd 7 16/03/2011 13:19

Prudential Risk Outlook 2011Executive summary
8
JOB: FSA-CRO-2011 | Page 8 | Proof 1 Mar-16-11 JOB: FSA-CRO-2011 | Page 9 | Proof 1 Mar-16-11
Section B: The UK financial sector
Banks’ profitability, balance sheet, asset mix and capitalIn 2010 the major UK-owned banks were profitable in aggregate and made further progress in building capital. Since the 2008 crisis, the FSA has used an interim capital framework by which banks are expected to hold sufficient core tier 1 capital to enable them to absorb potential losses in a severe stress scenario and still have a core tier 1 ratio of at least 4%. This section includes a description of our updated ‘anchor’ stress test scenario for the period 2011-2015.
Regulators internationally have agreed new capital and liquidity standards for banks. These address the excessive leverage and over-reliance on short-term wholesale funding that lay behind the financial crisis. But the shift to a more stable banking system will take time and this is reflected in the extended transition periods agreed for implementing the new Basel III standards. Making a number of assumptions, we illustrate how the major UK banks should be able to reach core tier 1 ratios significantly above Basel III levels by 2019, provided dividend payout rates are not excessive. Although major UK banks continue to target returns on equity of 12 to 15%, those may not be achievable in future, even if economic growth remains on track. The logical corollary of higher equity capital requirements, which will reduce the riskiness of banks, is that shareholders should be willing to accept lower returns on equity.
Our key messages to firms include:
• To meet Basel III standards, some firms will need to strengthen capital positions further and will wish to ensure that dividend and remuneration policies are consistent with the need to build up capital to meet these revised standards.
• As firms strengthen capital positions, management and shareholders should review the appropriateness of target returns on equity. Too-high targets should not drive firms to imprudent risk taking.
Liquidity and funding in the banking systemIn 2010 UK banks took some steps towards addressing the funding vulnerabilities that were a significant cause of the financial crisis. More stable funding means a reduced reliance on short-term wholesale debt and a greater share of stable customer deposits and long-term debt in banks’ liabilities. Over the past year, holdings of liquid assets across the banking system have increased, the share of interbank deposits has decreased and customer deposits have risen. In addition, the maturity of wholesale unsecured debt securities issued by banks has lengthened and the pace of new issuance has been above pre-crisis levels. Banks have also agreed voluntary Special Liquidity Scheme (SLS) repayment plans with the Bank of England ahead of contractual maturities. Despite this considerable progress, important funding challenges remain ahead. Banks and building societies will need to refinance a substantial hump of official support and private sector debt over the next two years.
Our key messages to firms include:
• When market conditions allow, firms should take opportunities to get ahead of plans for issuing medium and long-tem debt in order to improve their liquidity positions, even if short-term wholesale funding is cheaper now.
FSA-PRO-2011 Text.indd 8 16/03/2011 13:19

JOB: FSA-CRO-2011 | Page 8 | Proof 1 Mar-16-11
Prudential Risk Outlook 2011Executive summary
9
JOB: FSA-CRO-2011 | Page 9 | Proof 1 Mar-16-11
Risk transfer between banks, insurance companies and the ‘shadow banking system’As international regulators seek to raise capital standards, limit maturity transformation and control risk-taking in the banking sector, a key question is to what extent and how other parts of the financial system will take on those risks. Among the areas to monitor are:
• UK insurance companies, which are significant investors in the debt and equity instruments of UK and overseas banks;
• ‘shadow banking’, which can be most usefully defined to cover the sub-set of non-bank credit intermediation which involves either leverage or maturity transformation; and
• hedge funds, which have the potential to pose risks to financial stability if they are individually very large or, as a group, have similar, leveraged positions.
Issues affecting the insurance sectorBoth UK life and general insurers were, collectively, profitable in 2009 and capital positions are generally sound. But UK life insurers face a number of medium- to long-term pressures on profitability, including persistently subdued demand for long-term savings products, increased competition from other types of savings and investment products, and regulatory and legislative changes. And, for general insurers, the low interest rate environment has constrained investment income. As a result, they need to focus further on the profitability of their underwriting, taking lower prospective investment returns into account in pricing and underwriting decisions.
General insurers appear to have entered a cycle of granting more generous terms and conditions, supported by favourable assessments of prospective claims costs and risks. Claims inflation is likely to continue across general insurance lines, and – combined with wider inflationary pressures – could pose risks to firms. We remain concerned by continued significant releases of reserves from earlier underwriting years which may be used to compensate for current poor underwriting performance.
Our key messages to firms include:
• Prospective lower investment returns in the current low interest rate environment strengthen the need for prudent underwriting and reserving. Actuaries should identify and appropriately react to any increased risk of a reserve shortfall on any class of business. Senior management should understand the key assumptions underlying their reserving decisions.
Section C: Credit risks This section discusses five broad areas of credit risk to UK firms, comprising just under 40% of the UK banking system’s aggregate global assets.
Euro-area country risksUK banks are most exposed to borrowers in Ireland and Spain. Exposures to sovereign debt are relatively small, and exposures to banking systems only moderate. The most important exposures are instead to households and to non-financial companies, including CRE companies. In the short run, the more likely cause of potential risk for the major UK banks is
FSA-PRO-2011 Text.indd 9 16/03/2011 13:19

Prudential Risk Outlook 2011Executive summary
10
JOB: FSA-CRO-2011 | Page 10 | Proof 1 Mar-16-11 JOB: FSA-CRO-2011 | Page 11 | Proof 1 Mar-16-11
the funding constraint which could arise if falling market confidence produced a generalised tightening of funds supply.
Credit risks on UK household lendingCredit losses on unsecured lending to UK households have so far been significantly greater than those on secured lending. Low mortgage interest rates and lower-than-expected unemployment amongst mortgage borrowers have helped to limit mortgage arrears and repossessions. Within this overall favourable picture, however, it is important to note three caveats. First, lender forbearance might be, at least to some extent, disguising the scale of problems; second, experience varies significantly by region and customer segment; and third, the picture may change, particularly when interest rates rise.
Credit risk on commercial property lending in the UKLoans to CRE companies now represent about one third of UK banks’ total lending to non-financial companies worldwide and around a half of the total exposure of UK banks to UK non-financial companies. Prices of secondary properties fell by more than those of prime properties during the market crash and whereas prime prices have recovered, secondary prices have hardly recovered or fallen further. More than 20% of outstanding UK CRE loans are in breach of financial covenant or in default. Lenders have been exercising forbearance by extending loans at maturity when the borrower cannot access other finance. But levels of write-offs are almost certain to rise, barring a strong economic recovery and associated rise in property prices.
Credit risks on property lending in the United StatesWrite-offs on US residential property lending appear to have peaked but are likely to remain elevated for some time. Many homeowners are currently benefiting from low interest rates, mortgage modifications and forbearance, leaving them at a high risk of defaulting if lender appetite for forbearance shifts and interest rates rise. Tax rises and expenditure cuts by cash-strapped state and municipal governments may also squeeze homeowners in some regions.
Credit risks in emerging marketsWhereas developed world credit risks have already crystallised, credit risks in emerging markets are primarily a concern for the future. In aggregate, UK banks’ exposures to major emerging economies grew to over 12% of total assets as of Q3 2010, from around 6% five years earlier. The rapid growth in lending can be associated with increasing credit risk, especially against a background of strong aggregate credit growth and rising property prices.
Our key messages to firms in relation to credit risks include:
• in their stress testing, firms should consider a range of policy options in the euro-area peripheral countries, including a prolonged period of austerity and possible restructuring of bank and sovereign debt;
• lenders and their auditors should ensure that impairments on household lending are fully recorded, including forbearance cases, and that provisioning practices reflect realistic estimates of future cash flows;
FSA-PRO-2011 Text.indd 10 16/03/2011 13:19

JOB: FSA-CRO-2011 | Page 10 | Proof 1 Mar-16-11
Prudential Risk Outlook 2011Executive summary
11
JOB: FSA-CRO-2011 | Page 11 | Proof 1 Mar-16-11
• firms should have in place workable exit strategies for all of their loans to CRE companies and ensure that decisions to extend loans or exercise forbearance are consistent with them, and reflect realistic assumptions about prospective loans repayment;
• firms should prioritise prudent credit risk management over expansion in markets experiencing rapid credit and asset price growth; and
• firms should stress test their books against the risks of significant falls in asset prices, reversals of capital flows and rising interest rates in emerging economies.
Section D: The low interest rate environmentSince the crisis, low short-term interest rates have been vital to financial stability, reducing debt servicing costs, underpinning asset prices, and limiting credit losses. But low interest rates themselves create new risks and returning to more normal rates generates others.
For firms, the impact of low interest rates on margins has depended on the mix of their assets and liabilities, the extent to which interest rate risks were hedged out when loans were originally put on the books, and the balance between back books and new lending volume.
The steep yield curve provides a strong incentive to borrow short term or at floating rates. Experience during previous periods of monetary tightening, such as in 1994, shows that such positions involve significant risk. Even if they do not take on significant interest-rate risk themselves, firms may face higher credit risk if their customers have become more exposed to rising interest rates. In addition, low short-term interest rates increase the risk that customers seek unsustainable levels of total indebtedness.
Our key messages to firms include:
• in their stress testing of both banking and trading books, firms should prepare for a range of interest-rate scenarios; and
• in their credit assessments, firms should assess the vulnerability of their customers to rising interest rates.
FSA-PRO-2011 Text.indd 11 16/03/2011 13:19

JOB: FSA-CRO-2011 | Page 13 | Proof 1 Mar-16-11FSA-PRO-2011 Text.indd 12 16/03/2011 13:19

Prudential Risk Outlook 2011Section A – The macroeconomic context
13
JOB: FSA-CRO-2011 | Page 13 | Proof 1 Mar-16-11
Section A – The macroeconomic context
Section A: The macroeconomic context This section begins with a description of the UK and global macroeconomic context. It then focuses on a crucial issue with both macroeconomic and financial stability implications – whether deleveraging in overextended parts of the UK household and corporate sectors will progress in a steady or a disruptive fashion. It concludes by setting out our base case economic outlook and alternative scenarios, which firms should consider in assessing potential risks. It consists of six parts:
• A.1 Global and UK economic environment;
• A.2 Global imbalances and the UK;
• A.3 UK household sector and progress with deleveraging;
• A.4 Non-financial corporations;
• A.5 UK base case economic outlook; and
• A.6 Alternative, more adverse scenarios.
20122011201020092008200720062005
Cha
nge
year
-on-
year
Chart A1: GDP growth in selected economies
USUK Euro zone
Consensus forecast
China
-8%-6%-4%-2%0%2%4%6%8%
10%12%14%16%
80
90
100
110
120
130
140
150
Chart A2: Commodity prices
Crude Oil (West Texas Intermediate) $/BBL
F M M J A S O N FJDJ20112010
A
Commodity research Bureau Spot Index FoodstuffsCommodity research Bureau Spot Index Metals
Inde
x (J
an 2
001
= 10
0)
Source: National sources; Consensus Economics Source: Thomson Reuters Datastream
Chart A3: UK economic indicators
2009 2010 – last year’s base case 2010 – actual
GDP growth Annual -4.9% 1.4% 1.3%
Unemployment (LFS) rate (annual average) 7.7% 8.1% 7.9%
CPI growth (Q4 on Q4 previous year) 2.1% 1.8% 3.4%
Sources: ONS, Consensus Forecasts, BloombergNote: Last year’s base case taken from our 2010 Financial Risk Outlook and based on a consensus of the main private sector forecasting institutions in February 2010. LFS: Labour force survey
FSA-PRO-2011 Text.indd 13 16/03/2011 13:19

Prudential Risk Outlook 2011Section A – The macroeconomic context
14
JOB: FSA-CRO-2011 | Page 14 | Proof 1 Mar-16-11 JOB: FSA-CRO-2011 | Page 15 | Proof 1 Mar-16-11
2010200920082007200620052004200320022001
Chart A4: Contributions to real UK output growthC
ontri
butio
n an
d ch
ange
yea
r-on
-yea
r
InvestmentStockbuildingNet trade
Private consumption
Government consumption GDP (% real change pa)
-8%
-6%
-4%
-2%
0%
2%
4%
6%
2010to Q3
2009200820072006200520042003200220012000
Chart A5: UK real export growth and contributions
Con
tribu
tion
and
chan
ge y
ear-
on-y
ear
Other goodsManufactures
Services
Total goods and servicesWorld trade
-15%
-10%
-5%
0%
5%
10%
15%
20%
Source: Office for National Statistics, UK Economic Accounts Source: Office for National Statistics, UK Economic Accounts, Monthly Review of External Trade Statistics
A.1 Global and UK economic environmentThe world economy returned to growth in 2010 (Chart A1). In the advanced economies, monetary and fiscal stimulus measures continued to support demand and private consumption recovered. Within this overall picture, however, there was significant variation by country. Despite a solid rebound in US GDP growth, unemployment remained high and the economy faced persistent headwinds from still-fragile property markets and high public and private sector indebtedness. The German economy recovered strongly but sovereign debt crises and the subsequent need for austerity measures dampened growth in much of rest of the EU. Emerging and developing economies were much more robust, growing by more than 7% on average, with the resulting strong demand pushing both commodities and consumer price inflation higher (Chart A2). One risk to future global growth is the possibility of a significant and persistent rise in energy prices: for example, if instability in the Middle East deepened further and affected oil production.
The UK’s economic recovery continued in the first three quarters of 2010, supporting household income and corporate profits – but the final quarter of the year saw a significant contraction in output. Even taking into account the impact of the unusually cold weather, growth clearly slowed towards the end of the year. Growth over the whole year was just below our base case a year ago (Chart A3). Recovery was broad-based, with the exception of net trade – where exports grew but imports grew faster (Charts A4 and A5).
Unemployment remained stable, confounding predictions that it would rise even as the economy recovered. Many businesses appear to have adjusted to lower demand by controlling wage growth and switching to part-time work rather than shedding workers. However, there remains a risk that job losses will increase if the pace of output growth slows, especially if employers have been hoarding labour in anticipation of a strong recovery. Section C explains how lower-than-expected unemployment has helped to limit growth of arrears in household lending.
Inflation was higher than expected, driven by the rising prices of imported food and commodities. As set out in the Bank of England’s February Inflation Report, VAT, energy and import prices could have contributed between two and four percentage points to CPI inflation in the fourth quarter of 2010.1 That has squeezed households’ real discretionary incomes and may help to explain why the savings rate fell back in the second half of the year (Chart A19).
1 Bank of England, Inflation Report, February 2011, pp. 34-35 (Box)
Two-speed global recovery
UK growth slowing down
FSA-PRO-2011 Text.indd 14 16/03/2011 13:19

JOB: FSA-CRO-2011 | Page 14 | Proof 1 Mar-16-11
Prudential Risk Outlook 2011Section A – The macroeconomic context
15
JOB: FSA-CRO-2011 | Page 15 | Proof 1 Mar-16-11
Chart A6: UK private non-financial corporate and household debtD
ebt a
s a
shar
e of
GD
P
Private non-financial corporations (loans and bonds) Households (loans)Private non-financial corporations + households
2010
2009
2008
2007
2006
2005
2004
2003
2002
2001
2000
1999
1998
1997
1996
1995
1994
1993
1992
1991
1990
1989
1988
1987
0%
50%
100%
150%
200%
250%
2010200820062004200220001998199619941992
Chart A7: Growth in nominal GDP and lending to the UK private sector
Nominal GDPTotal lending to households andprivate non-financial corporations
-10%
-5%
0%
5%
10%
20%
15%
Cha
nge
year
-on-
year
Source: Office for National Statistics, UK Economic Accounts Source: Office for National Statistics, UK Economic Accounts
Continued UK growth will require steady expansion in the global economy and a rebalancing of domestic demand from the public to the private sector. Against this background, a key medium to long-term issue for the world economy is the persistence of imbalances between ‘debtor’ and ‘creditor’ economies. A crucial issue for UK growth and financial stability is the level of debt in the household sector and in over-leveraged parts of the non-financial corporate sector, notably commercial property companies. Those parts of the economy need a period of gradual deleveraging, in which nominal income grows more rapidly than debt, if vulnerability is to be reduced. Encouragingly, nominal GDP grew more strongly than UK private sector credit in 2010 for the first time since the 1990s (Charts A6 and A7). In the remainder of this section, we look in more detail at global imbalances before assessing the progress made in deleveraging by overextended borrowers in household and corporate sectors.
A.2 Global imbalances and the UKOver the past decade, trade and capital flow imbalances have built up between high savings, ‘creditor’ economies (such as China, Germany and Japan) that have large current account surpluses and low savings, ‘debtor’ economies (such as the US, UK and parts of the euro-area periphery) that have had persistent current account deficits. In the long term these imbalances could become unsustainable because borrowers in debtor countries become increasingly indebted to savers in creditor countries. They narrowed briefly during the contraction in global output in 2009, as domestic demand in debtor countries fell. But they have re-emerged as the pattern of economic activity in the recovery has largely mirrored that before the crisis (Chart A8). Lasting global growth will require lower savings rates and expanding domestic demand in creditor countries so that debtor countries are able to increase their savings and reduce their indebtedness without triggering a renewed global downturn.
The UK current account has been in deficit since the 1980s. After narrowing during the crisis, the deficit increased again in 2010 (Chart A9). Some exports, particularly of manufactured goods, are growing but the UK has a large deficit in goods trade, partly offset by a surplus in services trade and income from foreign investments.
Looking at net lending and borrowing by sector, the UK government in 2010 was a net borrower from UK households, UK companies and overseas (the counterpart of the current account deficit) as net government spending continued to support domestic demand (Chart A10). The government’s plans for fiscal consolidation imply that the current account deficit must narrow and/or that UK households and companies will reduce their current surpluses or move into deficit.
Global imbalances and high leverage in parts of the UK household and
corporate sectors are key issues for
medium to long-term UK
growth
Global rebalancing
halted in 2010...
…and the UK current account
deficit increased
FSA-PRO-2011 Text.indd 15 16/03/2011 13:19

Prudential Risk Outlook 2011Section A – The macroeconomic context
16
JOB: FSA-CRO-2011 | Page 16 | Proof 1 Mar-16-11 JOB: FSA-CRO-2011 | Page 17 | Proof 1 Mar-16-11
2010(to Q2)
200920082007200620052004200320022001
Chart A8: Global current account balancesS
hare
of W
orld
GD
P
UKJapanSpain
Germany
USChina
Oil exporters
-3%
-2%
-1%
0%
1%
2%
3%
Q32010
H12010
H22009
H12009
H22008
H12008
H22007
H12007
H22006
H12006
Chart A9: UK current account balance
Sha
re o
f GD
P
Services (finance)Income (banks & building societies)Income (exc banks & building societies)
Goods
Services (exc finance)Transfers
Current account balance
-10%
-8%
-6%
-4%
-2%
0%2%
4%
6%
8%
Source: IMF International Financial Statistics Source: Office for National Statistics, UK Economic Accounts
2010 to Q32009200820072006200520042003200220012000
Chart A10: UK net lending/borrowing by sector
Sha
re o
f GD
P
Private non-financial corporations Households and non-profit institutions servicing householdsRest of worldGovernment and public corporations
-12%
-10%
-8%
-6%
-4%
-2%
0%
2%
4%
6%
Source: Office for National Statistics, UK Economic AccountsNote: this chart excludes net lending/borrowing of the financial sector, which equals the sum of net lending/borrowing by the other four sectors.
A.3 UK household sector and progress with deleveragingUK household debt, in particular mortgage debt, increased rapidly in the run-up to the crisis. This increased the vulnerability of many household borrowers to income and interest rate shocks. A period of deleveraging is therefore desirable. But the way in which deleveraging is achieved is crucial to both financial stability and macroeconomic recovery. The optimal path would combine a flat or slowly rising stock of total debt, with deleveraging arising as nominal incomes rise at a faster pace. Rapid falls in the stock of debt, either via a dramatic fall in lending flows, or via high defaults, would be more disruptive. This sub-section therefore looks at the evolution of household leverage both before and since the crisis.
Increasing leverage and vulnerability pre-crisisThere are four key measures of household sector leverage: the debt-to-GDP ratio, the ratio of debt to post-tax income, the ratio of secured debt to housing stock (also known as asset leverage) and the proportion of post-tax income spent on debt interest payments. In the years leading up to the financial crisis, household debt rose relative to income and to GDP (Charts A11 and 12). The household savings rate declined from 12% in 1992 to 2% in 2007. Rising leverage resulted in the household sector becoming a net borrower from other sectors of the economy, accumulating more financial liabilities than assets, having been a net lender for much of the 1990s (Chart A10).
Leverage increased before
the crisis
Four key measures of
household leverage
FSA-PRO-2011 Text.indd 16 16/03/2011 13:19

JOB: FSA-CRO-2011 | Page 16 | Proof 1 Mar-16-11
Prudential Risk Outlook 2011Section A – The macroeconomic context
17
JOB: FSA-CRO-2011 | Page 17 | Proof 1 Mar-16-11
0%
20%
40%
60%
80%
100%
120%
Chart A11: Household debt as a share of GDPD
ebt s
hare
of G
DP
Secured borrowingTotal borrowing Unsecured borrowing
104%
101%
1987 1989 1993 1995 1999 2001 2003 2005 20092007199719910%
50%
100%
150%
200%
200920072005200320011999199719951993199119891987
Chart A12: Household debt as a share of post-tax income
Deb
t sha
re o
f inc
ome 153.7%
145.8%
Source: Office for National Statistics, UK Economic Accounts Source: Office for National Statistics, UK Economic Accounts
32.9%
30.7%
Chart A13: Household secured debt as a share of value of housing stock
Sec
ured
deb
t sha
re o
f hou
se v
alue
0%
5%
10%
15%
20%
25%
30%
35%
40%
1991 1993 1995 1997 1999 2001 2003 2005 2007 2009
10.7%
6.8%
Chart A14: Household debt interest payments as share of post-taxincome
Deb
t int
eres
t pay
men
ts a
s a
shar
e of
inco
me
0%
2%
4%
6%
8%
10%
12%
14%
16%
1987 1989 1991 1993 1995 1997 1999 2001 2003 2005 2007 2009
Sources: Office for National Statistics, UK Economic Accounts; FSA estimates Source: Office for National Statistics, UK Economic Accounts
This debt growth was facilitated by lower nominal interest rates than in the early-1990s. As a result, the share of income spent on debt interest payments (Chart A14) remained below early-1990s levels, but increased dramatically from 2003 to 2008 as many people took on debt at higher loan-to-income ratios (Chart A12).
Debt growth did not lead to a boom in residential housing investment but rather fuelled and indeed was stimulated by rising house prices (Chart A18). As a result of this rise in house prices, asset leverage (Chart A13), while rising pre-crisis, still remained below early-1990s levels. Among those taking on increased debt were higher-risk households who had previously been denied access to credit, but who were now able to borrow on the basis of discounted initial mortgage offers in the anticipation that subsequent house prices rises would enable them to remortgage.
The net result of these trends was to create two vulnerabilities. First, a small but important tail of over-stretched borrowers who were vulnerable to even small income, employment and house price shocks. Second, a more general vulnerability of many borrowers to high interest rates.
Post-crisis trends The initial impact of the crisis in 2008-2009 was for household debt-to-GDP and asset leverage to increase further as GDP and house prices both fell. However, as the Bank of England reduced the Bank Rate to 0.5%, debt servicing costs fell to historically low levels (Chart A14). This, as explained in Section C, helped limit mortgage arrears, provisions, and write-offs, and so far has prevented any disruptive process of deleveraging via debt default.
A tail of overstretched
borrowers and a more general
vulnerability to high interest
rates
FSA-PRO-2011 Text.indd 17 16/03/2011 13:19

Prudential Risk Outlook 2011Section A – The macroeconomic context
18
JOB: FSA-CRO-2011 | Page 18 | Proof 1 Mar-16-11 JOB: FSA-CRO-2011 | Page 19 | Proof 1 Mar-16-11
Q32010
Q12010
Q32009
Q12009
Q32008
Q12008
Q32007
Q12007
Chart A15: Nominal household income growth and contributions from inflation and income constituents
Cha
nge
year
-on-
year
Real net property incomeReal labour income
Real adjustment for changein net equity in pension fundsInflation
Real net taxes and transfers
Nominal gross disposable income
-10%-8%-6%-4%-2%0%2%4%6%8%
10%
Chart A16: Gross debt measures for the household sector
Q4 2009 Q3 2010
Debt: GDP 103.5% 101.0%
Debt: post-tax income 149.0% 145.8%
Interest payments: post-tax income 7.6% 6.8%
Mortgage debt: housing stock 31.1% 30.7%
Source: Office for National Statistics, UK Economic Accounts Source: Office for National Statistics, UK Economic Accounts
In 2010, some deleveraging occurred on all of these four indicators (Chart A16). The total stock of household debt was broadly unchanged but overall household income continued to benefit from government transfers – although to a lesser extent than in 2009 – leading to a lower ratio of debt to post-tax income (Chart A15). Debt-to-GDP is still higher than before the crisis, but is now gradually falling. In the 1990s, debt-to-GDP also increased during the recession and then progressively declined in the recovery as debt continued to rise but nominal GDP grew more quickly (Charts A11 and A17).
To reduce the vulnerability of high levels of debt relative to income, further gradual deleveraging will be desirable. Ideally this would be driven by nominal income growth, with the overall stock of lending stable or increasing slightly rather than falling rapidly. This optimal path may be most likely in conditions of roughly stable, rather than rapidly rising or falling house prices.
Chart A17: Comparison of household debt-to-GDP: 1990s vs. 2000s recessions and following recoveries (change from beginning of the recessions)
Changes
Q4 1990 to Q1 1993 Q2 2008 to Q3 2010
Nominal stock of debt 12.1% 1.3%
Nominal GDP(4-quarter average) 10.2% 0.4%
Debt as a share of GDP 1.1%(from 66.2% to 67.3%)
0.9%(from 100.1% to 101.0%)
FTSE all-share indexNationwide house price index
Chart A18: UK house and equity prices
Inde
x: J
an 1
997
= 10
0
0
50
100
150
200
250
300
350
40020
11
2010
2009
2008
2007
2006
2005
2004
2003
2002
2001
2000
1999
1998
1997
Sources: Office for National Statistics, UK Economic Accounts Source: Office for National Statistics, UK Economic Accounts
Some deleveraging in 2010 on all four
measures
Ideally deleveraging
should be driven by rising nominal income with debt
stable
FSA-PRO-2011 Text.indd 18 16/03/2011 13:19

JOB: FSA-CRO-2011 | Page 18 | Proof 1 Mar-16-11
Prudential Risk Outlook 2011Section A – The macroeconomic context
19
JOB: FSA-CRO-2011 | Page 19 | Proof 1 Mar-16-11
2009200720052003200119991997199519931991
Chart A19: UK household savings and net worth
Net worth ratio (right-hand axis)Savings ratio (left-hand axis)
Sav
ings
: Inc
ome
Net w
orth: Income
0%
100%
200%
300%
400%
500%
600%
700%
800%
-2%-1%0%1%2%3%4%5%6%7%8%9%
10%11%12%13%14%
2010to Q3
20062002199819941990
Chart A20: Household sources and uses of funds
GD
P
Gross fixed capital formationSavingNet borrowing
Net acquistion of financial assets
-2.0%
-1.5%
-1.0%
-0.5%
0%
0.5%
1.0%
1.5%
2.0%
Sources
Uses
Source: Office for National Statistics, UK Economic Accounts Source: Office for National Statistics, UK Economic Accounts; Bank of England, Bankstats
For much of 2010 this broadly favourable pattern of deleveraging seemed to be emerging. Net mortgage lending remained marginally positive and house prices stabilised and in some regions recovered after significant falls in 2009. Towards the end of 2010, however, slightly less favourable trends began to emerge. House prices fell back again (Chart A18), particularly in some regions (see Section C for important regional differences in housing market conditions and risks). The number of housing transactions remained low reflecting both buyers and sellers postponing decisions while the economic outlook is still uncertain. Higher deposit requirements by mortgage lenders also limited the number of first-time buyers entering the housing market and existing homeowners trading up (Section C). According to the 2010 Q4 Bank of England Credit Conditions Survey, household demand for secured lending for house purchase fell markedly and unexpectedly in the fourth quarter of 2010 and was expected to fall further in the first three months of 2011.
The pace of future household deleveraging will also depend on the savings rate. During the crisis, households saved more in reaction to falling asset prices and employment uncertainty. However, the UK household savings ratio has since declined from 7.5% in mid-2009 to 5% in the third quarter of 2010 (Chart A19). Low interest rates limit the incentive to save, and stabilising unemployment and asset prices during 2009/10 may have reassured households about their financial situation. The higher cost of living may also have squeezed income available for saving.
In 2010, households continued using their savings in part to rebuild housing equity. The ratio of secured debt to housing value edged down further (Chart A13). Since the crisis, UK households have increased savings and reduced their reliance on borrowing as a source of funding, reversing the trend of the previous decade (Chart A20).
The Bank of England’s Monetary Policy Committee’s central judgement is that the household savings rate may fall over the next few years as reduced economic uncertainty leads to a decline in precautionary saving and improved corporate profitability supports household spending through higher equity prices and dividend payments.2 However, there is a risk that savings may need to rise from current levels to restore household net worth, particularly in the face of a large pension gap. Household net worth is still significantly lower than its pre-crisis peak and, with house price appreciation unlikely to restore it over the next few years, households may choose to increase their savings instead.
2 Bank of England February 2011 Inflation Report.
Savings rate declined in
2010…
…and likely to decline further, but with a risk
that it may rise in order to restore
household net worth
FSA-PRO-2011 Text.indd 19 16/03/2011 13:19

Prudential Risk Outlook 2011Section A – The macroeconomic context
20
JOB: FSA-CRO-2011 | Page 20 | Proof 1 Mar-16-11 JOB: FSA-CRO-2011 | Page 21 | Proof 1 Mar-16-11
Chart A21: Change in non-residential investment’s share of GDPover boom periods
Cha
nge
from
sta
rt to
end
of b
oom
(per
cent
age
poin
ts)
1976-791963-68 1982-88 2003-07
1994-00
-0.5
0
0.5
1.0
1.5
2.0
2.5
20102009200820072006200520042003200220012000
Chart A22: UK private non-financial corporations’ bank debt by sector
Sha
re o
f GD
P
Other private non-financial corporate lendingConstruction lendingReal estate lendingTotal private non-financial corporate bank lending
0%
5%
10%
15%
20%
25%
30%
35%
40%34.8%
31.8%
Source: Office for National Statistics, UK Economic AccountsNote: boom/bust categorised by subtracting IMF estimate of potential output (or historical average) from actual GDP growth.
Source: Bank of England, Bankstats; Office of National Statistics, UK Economic Accounts
Chart A23: Lending to UK private non-financial corporations
Cha
nge
year
-on-
year
Small- and medium-sized enterprises, contributionOther private non-financial corporations excluding small- and medium-sized enterprises, contributions
-10%
-5%
0%
5%
10%
15%
20%
25%
30%
Q32010
Q22010
Q12010
Q42009
Q32009
Q22009
Q12009
Q42008
Q32008
Q22008
Q12008
All private non-financial corporations, year-on-year growth
£bn
Chart A24: Net new lending to private non-financial corporations
Net real estate lending Net other lendingNet construction lending
-10
-6-4-2
-8
02468
1012
Q12008
Q22008
Q32008
Q42008
Q12009
Q22009
Q32009
Q42009
Q12010
Q22010
Q32010
Q42010
Source: Bank of England, Trends in Lending, Bankstats Source: Bank of England, Bankstats Note: Net new lending includes gross lending, repayments and write-offs.
26.6%
14.6%
Chart A25: Private non-financial corporations' debt servicing costs
Sha
re o
f gro
ss o
pera
ting
surp
lus
0%
5%
10%
15%
20%
25%
30%
35%
40%
45%
200920072005200320011999199719951993199119891987 2010200920082007
Chart A26: Contributions to annual growth of UK private non-financial corporations' post-tax profits
Cha
nge
year
-on-
year
Property income paid (FISIM adjusted)
Gross operating surplus
TaxProperty income received (FISIM adjusted)
Gross disposable income (FISIM adjusted)
-80%
-60%
-40%
-20%
0%
20%
40%
60%
80%
Source: Office for National Statistics, UK Economic AccountsNote: debt servicing costs = total debt interest divided by gross operating surplus (before tax and interest payments).
Source: Office for National Statistics, UK Economic Accounts Note: post-tax profit measured as gross disposable income.
FSA-PRO-2011 Text.indd 20 16/03/2011 13:19

JOB: FSA-CRO-2011 | Page 20 | Proof 1 Mar-16-11
Prudential Risk Outlook 2011Section A – The macroeconomic context
21
JOB: FSA-CRO-2011 | Page 21 | Proof 1 Mar-16-11
A.4 Non-financial corporationsThe build-up of debt in the UK non-financial corporate sector in the run-up to the crisis had some similarities to that in the household sector. Credit growth was primarily associated with increased leverage and rising asset prices rather than an investment boom. In contrast to previous economic expansions, the share of non-residential investment in UK GDP actually fell between 2003 and 2007 (Chart A21).
This partly reflected the fact that the increase in corporate leverage was concentrated in commercial real estate (CRE) companies and companies that were subject to leveraged buy-outs. Chart A22 shows the growing share of lending to UK CRE companies during the 2000s, which remains more than half of the stock of UK bank lending to UK companies. Many companies in other sectors reduced their indebtedness and seem to have entered the crisis in a strong financial position. In aggregate, the non-financial corporate sector became a net lender to the other sectors of the economy.
The crisis led to a contraction in bank lending, and a reduction in the aggregate stock of non-financial corporate debt. Net repayment of bank lending was primarily by large companies, which were able to replace bank loans with the proceeds of bond and equity issuance. Small and medium companies, which are more reliant on bank lending, were more constrained by tighter credit conditions (Chart A23). Companies cut their business investment further. Net new lending to CRE companies initially declined more slowly than to other companies, mainly because they were able to draw down previously-granted facilities, although ‘ever-greening’ or rolling over of loans by banks also played a role (Chart A24). Low official interest rates meant that aggregate corporate debt servicing costs also fell to historically low levels (Chart A25). Many companies used interest rate swaps to convert fixed rate debt to a floating rate to benefit from very low short-term rates.
In 2010, as the economy recovered, the non-financial corporate sector returned to profitability. Net income continued to be supported by lower interest payments and benefitted from better operating income and a much-improved return on financial investments (Chart A26), primarily in the form of dividends from overseas operations. Aggregate leverage declined, whether measured relative to GDP, gross operating surplus or assets (Charts A27, A28, A29 and A30). But debt-to-GDP is still higher than before the crisis and the deleveraging process in the non-financial corporate sector has been slower than following the 1990s recession, partly because the contribution of inflation to nominal GDP growth has been lower (Chart A31).
Pre-crisis increase in debt was
concentrated in lending to CRE
companies
2010 recovery in profitability led
to a fall in leverage
FSA-PRO-2011 Text.indd 21 16/03/2011 13:19

Prudential Risk Outlook 2011Section A – The macroeconomic context
22
JOB: FSA-CRO-2011 | Page 22 | Proof 1 Mar-17-11 JOB: FSA-CRO-2011 | Page 23 | Proof 1 Mar-17-11
20092007200520032001199919971995199319911989
97.4%
88.5%
Chart A27: Private non-financial corporations' debt(securities and loans) as a share of GDP
Sha
re o
f GD
P
0%
20%
40%
60%
80%
100%
120%592.4%
534.7%
Chart A28: Private non-financial corporations’ debt (loans andsecurities) as a share of gross operating surplus
Sha
re o
f gro
ss o
pera
ting
surp
lus
0%
100%
200%
300%
400%
500%
600%
700%
200920072005200320011999199719951993199119891987
Source: Office for National Statistics, UK Economic Accounts Source: Office for National Statistics, UK Economic Accounts
46.7%
39.8%
Chart A29: Private non-financial corporations' debt-to-assets ratio
Deb
t as
a sh
are
of a
sset
s
0%
20%15%10%5%
25%30%
35%40%
45%50%
20092007200520032001199919971995199319911989
Chart A30: Gross debt measures for the non-financial corporate sector
Q4 2009 Q3 2010
Debt: GDP 93.1% 88.4%
Debt: gross operating surplus 556.0% 534.7%
Interest payments: gross operating surplus 17.9% 14.6%
Debt: assets 41.1% 39.8%
Source: Office for National Statistics, UK Economic AccountsNote: debt-to-assets ratio = total debt divided by total debt plus total equity.
Source: Office for National Statistics, UK Economic Accounts
Chart A31: Comparison of private non-financial corporations’debt-to-GDP ratio: 1990 vs. 2000s recessions and following recoveries (change from beginning of the recessions)
Changes
Q4 1990 to Q1 1993 Q2 2008 to Q3 2010
Nominal stock of debt 7.2% 1.4%
Nominal GDP (4-quarter average) 10.2% 0.4%
Debt as a share of GDP -1.4%(from 51.6% to 50.2%)
0.9%(from 87.5% to 88.4%)
Sep2010
May2010
Jan2010
Sep2009
May2009
Jan2009
Sep2008
May2008
Jan2008
Sep2007
May2007
Jan2007
Chart A32: Net funds raised by UK private non-financial corporations
£bn
Loans Bonds OtherEquities
Total
-20
-15
-10
-5
0
5
10
15
20
25
Source: Office for National Statistics, UK Economic Accounts Source: Bank of England, Bankstats
Corporate borrowing from UK banks continued falling in 2010. Non-financial companies remained net issuers of bonds and equity (Chart A32), but capital market issuance slowed markedly from 2009 levels. With spreads on new syndicated bank loans narrowing to near pre-crisis levels, large companies appear largely to have completed the phase of replacing bank debt with bond finance. And the number of ‘rescue’ rights issues fell.

JOB: FSA-CRO-2011 | Page 22 | Proof 1 Mar-16-11
Prudential Risk Outlook 2011Section A – The macroeconomic context
23
JOB: FSA-CRO-2011 | Page 23 | Proof 1 Mar-16-11
In the second half of 2010, net lending to CRE companies fell more sharply while the rate of decline in other corporate lending began to decrease (Chart A24). This might suggest that drawdown of facilities that were agreed before the crisis has begun to tail off, although part of the decrease was due to transfers of loans from the UK businesses of Irish banks to the Irish National Asset Management Agency (NAMA). Leverage of CRE companies remains very high. The Bank of England estimates that about half of UK CRE companies are either making a loss or spend more than three-quarters of their profits on interest payments (compared to one-third for all non-financial companies).3 Section C discusses credit risks in the UK commercial property sector in more detail.
Many companies in other sectors appear in good financial health with corporate holdings of cash and other financial assets (including loans to overseas subsidiaries) at high levels. Consequently, the corporate sector in aggregate became a bigger net lender to the other sectors of the economy in 2010 (Chart A10).
Historically, it is not unusual for periods of recovery from recession to coincide with net repayments of debt by non-financial companies. In the initial stage of a recovery, businesses have unused capacity (machines and workers) and can expand production without new investment for which they might need to borrow. Companies may also be cautious about taking on additional leverage – for example, to finance acquisitions – when economic prospects remain uncertain. Looking forward, however, sustained UK economic growth is likely to require a pickup in net borrowing by UK companies outside the over-leveraged CRE sector. An increase in lending to non-financial companies would support private investment. Given the government’s planned fiscal tightening, corporate investments need to increase to re-balance the economy and maintain economic growth. Business investment saw a marked recovery in 2010, after the fall in 2009. Although the long-term decline in investment as a proportion of GDP experienced by the UK is an international trend, the share of investment in UK GDP remains below the average for advanced economies.
3 Bank of England, Financial Stability Report, December 2010, Chart 3.10 p.32
Increased in lending and investment required to
sustain recovery
FSA-PRO-2011 Text.indd 23 16/03/2011 13:19

Prudential Risk Outlook 2011Section A – The macroeconomic context
24
JOB: FSA-CRO-2011 | Page 24 | Proof 1 Mar-16-11 JOB: FSA-CRO-2011 | Page 25 | Proof 1 Mar-16-11
A.5 UK base case economic outlookOur central scenario, based on a consensus of the main private sector forecasting institutions, is for UK economic growth to resume in 2011 after the contraction at the end of 2010 (Chart A33).
Chart A33: Base case for UK economic indicators in 2011
2010 Actual 2011 Base case
GDP growth over year 1.3% 1.7%
Unemployment (LFS) rate (annual average) 7.9% 7.9%
CPI growth (Q4 on Q4 previous year) 3.4% 3.6%
Cha
nge
year
-on-
year
Debt stockNominal GDP
Q12012
Q32011
Q12011
Q32010
Q12010
Q32009
Q12009
Q32008
Q12008
Q32007
Q12007
Q32006
Q12006
Q32005
Q12005
Chart A34: UK private non-financial corporate and household debt, and nominal GDP
A scenario fordeleveraging:debt stockgrows at halfnominal GDP
-6%-4%-2%0%2%4%6%8%
10%12%14%
Sources: ONS, Consensus Forecasts (survey date: February 14, 2011) for GDP and CPI base case, Bloomberg median forecast for unemployment (survey date: February 22, 2011).
Source: Office for National Statistics, UK Economic Accounts; Consensus Economics; FSA calculationsNote: nominal GDP forecast is from Consensus Economics.
Cha
nge
year
-on-
year
Chart A35: UK house prices
-25%
-15%-10%-5%
-20%
0%5%
10%15%20%25%
1997 1999 2001 2003 2005 2007 2009 2011 2013 2015 2017 2019
Source: Halifax, Bloomberg, Tullett PrebonNote: Historical house prices are from Halifax. Future prices are implied by the forward market and sourced from Bloomberg.
Growth is driven by a pick up in net trade, acceleration in business investment and a continued modest rise in household consumption. But, as discussed in the Bank of England’s February Inflation Report, the recovery is likely to be dampened by fiscal consolidation, high commodity prices and slow productivity growth. The increase in VAT, and higher energy and import prices continue to push up inflation, which is likely to remain above the 2% target in 2011.
Credit growth remains subdued and below the rate of growth of GDP, as business investment is financed largely from corporate earnings. Households continue to deleverage gradually and house prices decline slightly (Charts A34 and A35). In the illustration shown in Chart A34, credit grows at half the rate of nominal GDP, which would lead to a fall in the ratio of private sector debt to GDP from over 189% currently to 180% by the end of 2012 – the same level as at the end of 2006.
Even in this relatively benign base case scenario, many households and companies will remain vulnerable to economic shocks, such as higher interest rates or falling income, until the process of adjustment to lower leverage has run its course.
Base case scenario is for continued UK
growth, driven by net trade,
business investment and a
modest rise in consumption
FSA-PRO-2011 Text.indd 24 16/03/2011 13:19

JOB: FSA-CRO-2011 | Page 24 | Proof 1 Mar-16-11
Prudential Risk Outlook 2011Section A – The macroeconomic context
25
JOB: FSA-CRO-2011 | Page 25 | Proof 1 Mar-16-11
A.6 Alternative scenariosEffective risk management needs to assess the potential implications of a range of possible scenarios. One way to do this is via a stress scenario which considers the potential impact of adverse developments on a number of different parameters – e.g. growth, unemployment, house prices. In Section B we set out the quantitative scenario that we will use when stress testing major bank capital adequacy during 2011.
It is also useful to consider alternative scenarios that describe internally consistent sets of possible developments – some positive and some negative – which can be used to assess how different types of risks might emerge in different conditions. We set out below three such scenarios. They are similar to those published in the Financial Risk Outlook for 2010. As last year, the first two describe scenarios in which there are some naturally offsetting combinations of factors which are positive and negative for different aspects of financial stability. The third scenario is the most worrying, a scenario in which interest rates need to rise even while the UK economy remains depressed. These scenarios are not forecasts and we do not comment on their probability.
1. Weak global and European growth: weak external demand slows UK economyIn this scenario global growth continues but at a more moderate pace, with a combination of fiscal austerity in some deficit countries and the bursting of property bubbles in emerging economies depressing demand. Commodity and energy prices fall from their current high levels. Within the Euro area, peripheral economies contract as fiscal austerity and continued weak banking systems depress domestic demand. The German economy slows. Sovereign risk premia for peripheral euro-area countries remain high, and funding stresses place some limits on credit growth.
Within this context, UK recovery is held back by weak exports to euro-area countries, modest growth in world trade and slow growth of credit. With income growth flat, households and companies are unable to reduce leverage without cutting back on borrowing and precautionary savings rise. Disinflationary pressures grow and the Bank of England keeps interest rates at very low levels.
Implications for prudential risksSlow growth, rising unemployment and property price falls lead to rising arrears, provisions and losses in both household and corporate debt (CRE in particular) in both the UK and other countries. UK banks and insurers face mark-to-market losses on sovereign and bank securities. These adverse consequences are somewhat offset by the fact that very low interest rates enable the vast majority of mortgage borrowers to keep servicing their debt.
2. Rapid global growth, higher inflation and rising interest ratesRapid growth in emerging economies leads to inflation in commodities, energy and imported manufactured goods. Property bubbles in emerging markets do not yet burst but continue to grow, creating future potential risks. German export-led growth remains strong and concerns about euro-area peripheral countries reduce somewhat as nominal demand growth makes debt burdens look more sustainable. The UK economy grows at a robust pace and unemployment falls. But with inflation rising, central banks respond by raising policy interest rates faster than current expectations while strong growth and inflation expectations push up long-term interest rates.
Alternative scenarios can be
used to assess how risks might
emerge in different
conditions
Scenario in which global growth is
weak but Bank of England keeps
interest rates at low levels
Scenario in which rising inflation leads to higher
interest rates
FSA-PRO-2011 Text.indd 25 16/03/2011 13:19

Prudential Risk Outlook 2011Section A – The macroeconomic context
26
JOB: FSA-CRO-2011 | Page 26 | Proof 1 Mar-16-11
Implications for prudential riskRobust growth, falling unemployment, and rising property prices moderate overall household and corporate arrears. Internationally-diversified banks benefit from expansion in emerging markets. But some highly-indebted households are squeezed by a combination of inflation and higher interest rates, and some highly-indebted companies (particularly in CRE) are forced into default by rising interest expense.
3. Two-track global economy: developed economies lag behind emerging marketsStrong global growth continues, led by emerging markets, driving inflation of commodities, energy and imported goods prices. But euro-area growth is held back by continued concerns about debt sustainability in peripheral countries, producing severe funding market stresses. In the UK, growth and net trade are insufficient to offset fiscal consolidation and weak household spending in the face of rising unemployment, falling house prices, continued high indebtedness and squeezed real incomes. Employers that had been holding on to surplus staff in anticipation of a robust recovery in demand lay staff off, adding to public sector job cuts. Persistent inflationary pressures require the Bank of England to raise the Bank Rate. House prices fall and housing transactions decline in the face of rising mortgage debt-servicing burdens and uncertain economic prospects.
Implications for prudential risk Rising unemployment and interest rates lead to increasing mortgage arrears and repossessions, particularly in regions most vulnerable to public sector job cuts. Corporate arrears and losses rise, particularly but not only in CRE. Credit demand is weak in both the household and corporate sectors. Banks lacking international diversification are particularly affected by these UK-specific factors.
Key messages to firms
• Demand for credit in the UK is likely to grow more slowly than nominal GDP for a number of years as households and parts of the corporate sector, such as commercial property companies, reduce indebtedness relative to their income.
• Continuing high levels of indebtedness in parts of the household and corporate sectors will leave the UK economy still vulnerable to economic shocks.
• Our base case outlook, from Consensus forecasts, is for continuing UK economic growth driven by private sector demand, particularly from investment and net trade, combined with a steady (rather than disruptive) process of deleveraging.
• But in their stress testing, firms should prepare for a range of more adverse macroeconomic scenarios, such as those set out above. They should consider their resilience to the interest rate risks discussed in Section D.
Scenario in which growth is weak and
unemployment increases but
interest rates rise against a
backgroundof persistent inflationary
pressures
FSA-PRO-2011 Text.indd 26 16/03/2011 13:19

JOB: FSA-CRO-2011 | Page 26 | Proof 1 Mar-16-11 FSA-PRO-2011 Text.indd 27 16/03/2011 13:19

JOB: FSA-CRO-2011 | Page 29 | Proof 1 Mar-16-11FSA-PRO-2011 Text.indd 28 16/03/2011 13:19

Prudential Risk Outlook 2011Section B – The UK financial sector
29
JOB: FSA-CRO-2011 | Page 29 | Proof 1 Mar-16-11
Section B – The UK financial sector
Regulators internationally have agreed new capital and liquidity standards for banks. These address the excessive leverage and over-reliance on short-term wholesale funding that lay behind the financial crisis. But the shift to a more stable banking system will take time and this is reflected in the extended transition periods agreed for implementing the new Basel III standards. In the meantime, the international banking system will continue to have a heightened vulnerability to shocks.
This section analyses the progress that the banking system has made in reducing these vulnerabilities, as well as considering the risks created or transferred between banks and other parts of the financial system, together with risks specific to the insurance industry. It consists of:
• B.1 Profitability in the banking sector;
• B.2 Banks’ balance sheets, asset mix and capital;
• B.3 Liquidity and funding in the banking sector;
• B.4 Risk transfer between banks, insurance companies and the ‘shadow banking system’; and
• B.5 Issues affecting the UK insurance sector.
B.1 Profitability in the banking sectorBanks need to be profitable to build their capital bases to support future lending growth. In 2008 and 2009 huge losses were incurred by some banks as a result of mark downs on trading assets and provisions on loans (Chart B1). This sub-section considers the pace at which the industry has returned to more normal profitability levels and some remaining vulnerabilities (more detailed issues relating to asset quality, potential provisions and future loan losses are considered in Section C).
In 2010 the largest five UK-owned banks were profitable in aggregate and made further progress in building capital and adjusting their balance sheets. Returns on assets were broadly similar to 2009 but lower leverage meant aggregate return on equity fell (Charts B2 and B3). With higher regulatory capital requirements, returns on equity may not return to pre-crisis levels. Two major UK banks announced that they were lowering their future return on equity targets.
In aggregate UK banks were
profitable in 2010 but returns on
equity may not return to pre-
crisis levels
FSA-PRO-2011 Text.indd 29 16/03/2011 13:19

Prudential Risk Outlook 2011Section B – The UK financial sector
30
JOB: FSA-CRO-2011 | Page 30 | Proof 1 Mar-16-11 JOB: FSA-CRO-2011 | Page 31 | Proof 1 Mar-16-11
Chart B1: UK bank profits, trading losses and provisions during the crisis
£bn
Pre-trading/banking impairment & writedown earnings
Losses of ‘Big 4’ UK banks during the crisis
Trading losses (writedowns & impairments)Banking losses (writedowns)Profit/(loss) attributable to ordinary shareholders
-80
-60
-40
-20
0
20
40
60
1H09FY08FY071H09FY08FY071H09FY08FY071H09FY08FY071H09FY08TotalRBSLBGHSBCBarclays
FY07
Chart B2: Return on equity
Per
cent
Big 5 aggregateMin-max range
20102009200820072006-80%
-60%
-40%
-20%
0%
20%
40%
Source: Public data, FSA estimatesNote: Reversed out ‘Earnings’ is a notional balancing item. LBG is pro-forma Lloyds + HBOS for 2007/08, combined business for 2009 impairments and statutory for 2009 profit. RBS is pro-forma/proportional throughout.
Source: SNL Financial, FSA calculationsNote: Big 5 defined as Barclays, HSBC, Lloyds Banking Group, RBS, Standard Chartered.
Chart B3: Return on assets
Per
cent
Big 5 aggregateMin-max range
20102009200820072006-2%
-1%
0%
1%
2%
Chart B4: Net interest marginP
erce
nt
Big 5 aggregateMin-max range
201020092008200720060.0%
1.0%
2.0%
3.0%
Source: SNL Financial Source: SNL Financial
Despite very low interest rates and tight wholesale funding conditions globally, overall net interest margins have not fallen significantly since the crisis (Chart B4). Section D discusses the effects of low interest rates on margins, particularly in the UK retail market. Asset quality has been the key determinant of relative profitability (Chart B5). Levels of provisions fell in 2010 as credit losses declined in some of the sectors that were most troubled during the crisis in the UK and the US. But some banks made significant additional provisions against exposures in Ireland and Spain and some are still dealing with the aftermath of poor quality lending before the crisis in a number of markets, now managed to a significant extent through their non-core businesses. Investment banking revenues – important for some but not all major UK banks – began 2010 strongly but fell in the second half of the year, particularly in fixed income markets. Box B1 discusses investment banking in more detail.
Asset quality was the main
determinant of relative
profitability
FSA-PRO-2011 Text.indd 30 16/03/2011 13:19

JOB: FSA-CRO-2011 | Page 30 | Proof 1 Mar-16-11
Prudential Risk Outlook 2011Section B – The UK financial sector
31
JOB: FSA-CRO-2011 | Page 31 | Proof 1 Mar-16-11
Chart B5: Provisioning rateP
erce
nt
Big 5 aggregateMin-max range
201020092008200720060.0%
0.5%
1.0%
1.5%
2.0%
2.5%
3.0%
3.5%
Chart B6: Global investment banking revenue pool
Inve
stm
ent b
anki
ng re
venu
es,T
op 2
0 Fi
rms,
€bn
-150
-100
-50
0
50
100
150
200
250
1999 2000 2001 2002 2003 2004 2005 2006 2007 2008 2009 2010
Equities & advisory Mark to market lossesFixed income (ex marks)
Source: SNL Financial Source: Barclays
Box B1: Trends in investment bankingGlobal investment banking revenues were lower in 2010 after a record year in 2009 (Chart B6). Since the crisis, many firms have publicly committed to refocus their business models on servicing customers rather than taking proprietary positions. A number of firms have invested heavily in expanding their client coverage and front office technology, including client portals and high-frequency trading capacity. While this should mean a reduction in risk-taking, the crowding of firms into the same business model could increase competitive pressures and erode margins. Recent examples where firms have invested in technology and flow trading capabilities include foreign exchange, rates, equities and marketing equity products such as exchange-traded funds. Lower turnover in many markets in the second half of 2010 put further pressure on the profitability of customer-focused businesses.
A concern is that firms may react to lower profitability by taking more risk and expanding their trading books again. Two areas where risk exposures appear to be increasing are trading of lower-rated credit securities – including US asset-backed securities issued before the crisis – and the high-yield loan market. Firms should ensure that any increases in trading inventory, underwriting commitments or outright risk taking are undertaken in a controlled manner rather than through creep resulting from competitive pressures. Necessary risk controls include, for example, aged inventory limits, concentration limits and effective funds transfer pricing for liquidity risk. In addition, current plans to improve IT infrastructure and risk management systems should be prioritised alongside investment in client-servicing technology.
During the crisis, losses to banks from falls in the value of securitised structures (sometimes labelled ‘toxic’ assets) were very significant. Chart B7 shows the results of an FSA exercise to categorise US$240 billion of losses experienced by a sample of ten investment firms (some reported global losses and some European or UK entity losses only) between January 2007 and March 2009. The largest categories of losses were on holdings of: asset-backed securities (ABSs); super-senior tranches of collateralised debt obligations (CDOs) backed by ABSs; and credit protection bought from monoline insurers on the same types of instruments. The results highlight how the huge losses during the crisis were concentrated in this relatively narrow range of related instruments – mostly linked to the US housing market, in which most investment firms had built up large, leveraged positions. Conversely a number of high-volume trading activities – such as equities, interest rate and foreign exchange cash and derivatives trading – remained steadily profitable for the majority of firms throughout the crisis.
Many investment banks have
shifted to a more customer flow-based business
model…
…but lower turnover has
reduced profitability…
…with a risk that firms will return
to risk-taking without sufficient
controls
Losses during the crisis were
concentrated in a narrow range of
related instruments,
linked to the US housing market
FSA-PRO-2011 Text.indd 31 16/03/2011 13:19

Prudential Risk Outlook 2011Section B – The UK financial sector
32
JOB: FSA-CRO-2011 | Page 32 | Proof 1 Mar-16-11 JOB: FSA-CRO-2011 | Page 33 | Proof 1 Mar-16-11
Chart B7: Categorisation of investment banking losses on trading positions (January 2007 – March 2009)
Trading Book(US$bn)
Banking Book(US$bn)
Total(US$bn)
Mark-to-market losses on holdings of super senior tranches of CDOs of ABSs 53 34 87
Counterparty exposures to monoline insurers in relation to protection bought on super senior tranches of ABSs and CDOs
28 9 37
Mark-to-market losses on holdings of ABSs and exposures to SIVs and conduits
16 35 51
Corporate credit derivatives (index and bespoke) 11 0 11
Other (including counterparty defaults, equity and interest rate derivatives losses and hedge fund-related losses)
36 18 54
Total 144 96 240
Chart B8: Pre-crisis growth in US private sector debt by borrower type
US
deb
t as
a %
of G
DP
by
borr
ower
type
Financial CorporateHousehold
0%
50%
100%
150%
200%
250%
300%
200520001995199019851980197519701965196019551950
Source: FSA survey of 10 investment banks Source: US Federal Reserve Flow of Funds; Datastream; FSA calculations
Chart B9: Total assets of UK banks and building societies (selected items)
% change of total assets -7% -2% 0% -4%
Components as a % of total assets 2008H2
2009H1
2009H2
2010H1
2010H2
Cash/balances at central banks(excludes client money) 2% 3% 4% 5% 5%
Deposits with, and loans to, credit institutions 5% 6% 7% 4% 4%
Loans and advances to customers 45% 44% 44% 42% 44%
Debt securities 12% 12% 12% 13% 11%
Reverse repurchase agreements and cash collateral on securities borrowed 6% 6% 7% 7% 8%
Derivatives 23% 21% 17% 20% 18%
Chart B10: Level 3 Assets/Total Assets
Per
cent
Big 5 AggregateMin-max range
2010H1200920080.0%
0.5%
1.0%
1.5%
2.0%
2.5%
3.0%
Source: FSA returns Source: SNL Financial, FSA calculations Note: Big 5 defined as Barclays, HSBC, Lloyds Banking Group, RBS, and Standard Chartered.
B.2 Banks’ balance sheets, asset mix and capitalThe size and mix of banks’ balance sheets, relative to their capital resources, have a crucial impact on their vulnerability to risk. In the pre-crisis years, banks’ balance sheets grew rapidly in a number of countries, in particular with a growth of trading assets and complex patterns of intra-financial system claims (Chart B8). Here we consider how far trends in overall asset size and mix, combined with increasing capital resources, have reduced vulnerability.
At the overall asset size and mix level, the changes have been modest, but with some favourable developments (Chart B9). The size of UK banks’ aggregate balance sheets has decreased since the crisis. Within the total, liquid assets, including cash balances with central banks and holdings of government securities, have risen as a percentage. Together with the changes in the maturity of funding considered in Section B.3, this has reduced liquidity-related risks. Lending to customers has been broadly stable as a share of overall balance sheets with shrinking of non-core businesses at those banks most affected by the crisis offset by growth at other firms, notably in Asia. Issues relating to the quality of credit exposures are considered in Section C.
Liquidity buffers have increased…
FSA-PRO-2011 Text.indd 32 16/03/2011 13:19

JOB: FSA-CRO-2011 | Page 32 | Proof 1 Mar-16-11
Prudential Risk Outlook 2011Section B – The UK financial sector
33
JOB: FSA-CRO-2011 | Page 33 | Proof 1 Mar-16-11
There has been an apparent reduction in the complex interconnectedness of the financial sector. Derivatives seem to be on a declining trend as a share of total balance sheet, although their share has been volatile, partly reflecting exchange rate movements. The share of interbank lending has also fallen but repo claims have edged higher, partly as a result of rising liquidity buffers. Higher trading book capital requirements should over time discourage growth in more risky securities and derivatives, such as credit correlation books. Since the crisis, the largest five UK-owned banks have reduced holdings of so-called ‘level 3’ assets (Chart B10). These are instruments valued entirely on the basis of internal models because significant valuation inputs are unobservable in the market (so part of the decline may reflect reclassification because liquidity has returned to some markets). Level 3 assets now comprise around 1% of UK banks’ overall assets. Firms should continue to take opportunities to shed or unwind non-core risky assets as market conditions allow.
Capital position of the major UK banksThe capital strength of the major UK banks has improved significantly over the past couple of years. To assess the solvency of these banks effectively, especially during periods of stress, we use an interim capital framework, which was introduced in 2008. This supervisory framework is currently applied in the UK pending the planned implementation of the new Basel III capital standards agreed in September 2010, including through changes to EU law. Banks are expected to hold sufficient core tier 1 capital to enable them to absorb potential losses in a severe stress scenario specified by the FSA and still have a core tier 1 ratio of at least 4% of risk-weighted assets. They are also expected to hold total tier 1 capital greater than 8% of risk-weighted assets in normal economic conditions. We estimate 6-7% to be a comparable post-stress tier 1 number to the post-stress core tier 1 number of 4%.
Under the FSA Handbook, firms are obliged to hold total capital resources (including tier two capital, such as dated subordinated debt) which meet the minimum capital requirements of the current Capital Requirements Directive, as implemented by our rules (Pillar 1), including the 8% minimum for credit risk. In addition, under Pillar 2 each firm will hold total capital resources that are consistent with the individual capital guidance given to it by the FSA, including our assessment of any capital add-ons needed for risks not covered by the Pillar 1 capital requirements, and supplemented by a capital planning buffer available to be drawn down in stressed economic conditions.
Charts B11 to B13 show how the core tier 1, tier 1 and total capital positions of the major UK banks in aggregate have strengthened since the crisis. Also shown is an estimated leverage ratio measure on a Basel II basis (Chart B14). The FSA does not currently set a leverage ratio requirement but welcomes its inclusion as part of the Basel III package.
Stress testingTo ensure adequately robust stress testing by firms, we define an ‘anchor’ stress test scenario. As well as being the stress scenario we use in our supervisory stress testing of the major banks, we expect banks, building societies, investment firms and insurers – including those outside the scope of our supervisory stress testing – to consider this ‘anchor’ scenario as representative of the minimum forward-looking adverse conditions in which they should assess their ability to meet minimum capital ratios. Banks and building societies should use our stress scenario to ‘anchor’ the severity of their own stress test scenarios when setting capital planning buffers as part of pillar 2 capital. Depending on their own particular exposures, firms may choose to produce alternative but similarly severe scenarios that address other macroeconomic and financial risks.
…and holdings of level 3 assets
have fallen
The capital strength of major
UK banks has improved
FSA-PRO-2011 Text.indd 33 16/03/2011 13:19

Prudential Risk Outlook 2011Section B – The UK financial sector
34
JOB: FSA-CRO-2011 | Page 34 | Proof 1 Mar-16-11 JOB: FSA-CRO-2011 | Page 35 | Proof 1 Mar-16-11
Current Core Tier 1
Chart B11: Major UK banks’ aggregated Basel II core tier 1 ratioP
erce
nt
0%
2%
4%
6%
8%
10%
12%
H22007
H12008
H22008
H12009
H22009
H12010
Current Tier 1
Chart B12: Major UK banks' aggregated Basel II tier 1 ratio
Per
cent
0%
2%
4%
6%
8%
10%
12%
H22007
H12008
H22008
H12009
H22009
H12010
Source: FSA calculationsNote: Major UK banks defined as Barclays, HSBC, Lloyds Banking Group, RBS, Standard Chartered and Santander.
Source: FSA calculationsNote: Major UK banks as Chart B11.
Current Total Capital
Chart B13: Major UK banks' aggregated Basel II total capital ratio
Per
cent
0%
2%
4%
8%
6%
12%
10%
16%
14%
H22007
H12008
H22008
H12009
H22009
H12010
Current Tier 1/Total Assets
Chart B14: Major UK banks' aggregated tier 1 leverage ratio(tier 1/assets)
Per
cent
0%
1.0%0.5%
1.5%
2.5%
2.0%
4.0%3.5%
3.0%
5.0%4.5%
H22007
H12008
H22008
H12009
H22009
H12010
Source: FSA calculationsNote: Major UK banks as Chart B11.
Source: FSA calculationsNote: Major UK banks as Chart B11.
The ‘anchor’ stress test scenario we have used over the past year was described in the 2010 Financial Risk Outlook. It modelled a ‘double dip’ global recession in which UK GDP fell a further 2.3% from the end of 2009 to the end of 2011 as part of a global economic slowdown (Chart B15). The stress scenario also included large falls in UK housing, commercial property and equity prices and a steep rise in unemployment. The actual performance of the UK economy during 2010 was more favourable than the stress scenario, as would normally be expected (Chart B16). Specifically:
• UK GDP growth exceeded the stress scenario, which projected flat GDP in 2010 before a significant contraction in 2011;
• both commercial and residential property prices were more stable than in the stress scenario; and
• the rate of unemployment has not risen at anything like the pace modelled in the stress scenario.
FSA-PRO-2011 Text.indd 34 16/03/2011 13:19

JOB: FSA-CRO-2011 | Page 34 | Proof 1 Mar-17-11
Prudential Risk Outlook 2011Section B – The UK financial sector
35
JOB: FSA-CRO-2011 | Page 35 | Proof 1 Mar-17-11
Chart B15: UK GDP growth in FSA ‘anchor’ stress test scenariosP
erce
ntag
e ch
ange
in G
DP
on
a ye
ar e
arlie
r
Q3
2015
Q1
2015
Q3
2014
Q1
2014
Q3
2013
Q1
2013
Q3
2012
Q1
2012
Q3
2011
Q1
2011
Q3
2010
Q1
2010
Q3
2009
Q1
2009
Q3
2008
Q1
2008
-7%-6%-5%-4%-3%-2%-1%0%1%2%3%4%5%6%7%8%
2010 stress testONS 2011 stress testBoE February fan
Chart B16: Key UK macroeconomic variables: comparison of stress test projections for 2010 with actual data
2010 stress scenario 2010 actuals
GDP change (over 2010, %) -0.1 1.3
House price change, nominal(Q4 2010 on Q4 2009, %) -16.0 -1.7
Commercial property price change, nominal(Q4 2010 on Q4 2009, %) -12.4 6.9
Unemployment rate (Q4 2010, %) 11.0 7.9
Source: Office for National Statistics, Consensus Economics, Bank of England, FSA calculationsNote: For an explanation of the fan, see the Bank of England Inflation Report, February 2011, page 6, chart 1.
Source: Office for National Statistics, Consensus Economics, FSA calculationsNote: ILO unemployment rate; Halifax house price index; IPD capital index.
Chart B17: Key UK macroeconomic variables from FSA ‘anchor’ stress test scenarios in 2010 and 2011
2010 scenario 2011 scenario
Period covered by scenario 2010-2014 2011-2015
GDP change (start of scenario to trough, %) -2.3 -4.3
House price change, nominal(start of scenario to trough, %) -23.0 -20.7
Commercial property price change, nominal(start of scenario to trough, %) -37.8 -36.4
Unemployment rate (peak, %) 13.3 12.4
Chart B18: UK property prices in FSA ‘anchor’ 2011 stress test scenario
Inde
x (Q
4 20
10 =
100
)
Q3
2015
Q1
2015
Q3
2014
Q1
2014
Q3
2013
Q1
2013
Q3
2012
Q1
2012
Q3
2011
Q1
2011
Q3
2010
Q1
2010
Q3
2009
Q1
2009
Q3
2008
Q1
2008
IPD capital index Halifax house price index
60
80
100
120
140 FSA stress scenario
Source: Office for National Statistics, Consensus Economics, FSA calculationsNote: ILO unemployment rate; IPD capital index; the 2010 scenario used the Halifax house price index, whereas the 2011 scenario uses the DCLG house price index.
Sources: DCLG, IPD, FSA calculations
We have now defined an updated ‘anchor’ scenario for 2011 to 2015 (Chart B15). The new scenario has a broadly similar shape to the 2010 scenario, with deterioration in the UK and global economies through 2011/12 (Chart B17). UK residential and commercial property prices fall substantially, reaching a low point in 2012/13 before recovering (Chart B18). The UK unemployment rate peaks in 2013 before falling to under 8% by the end of the scenario (Chart B19). Our scenario includes stressed projections for economies in America, Europe and Asia to which UK banks have significant exposure. Key economic variables in those economies follow a consistent path to those for the UK.
Transition to Basel III requirementsWe are planning to keep in place an interim capital framework until the new global Basel III capital requirements – agreed by the Basel Committee on Banking Supervision (BCBS) in 2010 – take effect. Those requirements comprise the following main elements:
• An increase in the minimum common equity capital ratio to 4.5% of risk-weighted assets to be phased in between 2013 and 2015.
The FSA has updated its
‘anchor’ stress test scenario for
2011-2015
The BCBS has agreed new
international standards for
bank capital…

Prudential Risk Outlook 2011Section B – The UK financial sector
36
JOB: FSA-CRO-2011 | Page 36 | Proof 1 Mar-16-11 JOB: FSA-CRO-2011 | Page 37 | Proof 1 Mar-16-11
ONS 2011 stress test
Chart B19: UK unemployment in FSA ‘anchor’ 2011 stress test scenario
Une
mpl
oym
ent,
% o
f lab
our f
orce
5%
6%
7%
8%
9%
10%
11%
12%
13%
14%
Q3
2015
Q1
2015
Q3
2014
Q1
2014
Q3
2013
Q1
2013
Q3
2012
Q1
2012
Q3
2011
Q1
2011
Q3
2010
Q1
2010
Q3
2009
Q1
2009
Q3
2008
Q1
2008
Chart B20: Projected aggregate core tier 1 ratio (Basel III definition) of major UK banks on 1 January 2019
Assuming 5.0% growth of risk weighted assets
Dividend Payout
10% 40%
Returnon equity
10% 10.8% 8.5%
15% 15.6% 11.5%
Assuming 2.5% growth of risk weighted assets
Dividend Payout
10% 40%
Returnon equity
10% 12.7% 10.1%
15% 18.7% 13.5%
Source: Office for National Statistics; FSA calculationsNote: ILO unemployment rate.
Source: FSA calculationsNote: Major UK banks as defined on Chart B11.
• The addition of a capital conservation ‘buffer’, comprising common equity, of 2.5% of risk-weighted assets to be phased in between 2016 and 2019, giving a total common equity capital ratio of 7%. The buffer will be available to absorb losses during periods of economic and financial stress. It can be extended counter-cyclically in periods when national authorities judge that excess credit growth is leading to a build-up of system-wide risk.
• A minimum tier 1 capital ratio of 6% (to be phased in between 2013 and 2015) and a minimum total capital ratio of 8%.
• Tougher rules for deductions of, for example, intangibles and minority interests from common equity rather than total capital. For some banks this tighter definition of core tier 1 capital will be a significant change, requiring a material increase in capital resources.
• The introduction of a leverage ratio (tier 1 capital/total on and off-balance sheet assets) as a backstop to the risk-based capital requirements, to be tested at 3% from 2013 to 2017.
In addition, the BCBS and Financial Stability Board have agreed that banks which are systemically important at a global level should have higher capacity to absorb losses than the standards applied to all internationally-active banks. Options under consideration include larger capital buffers – comprising common equity and perhaps ‘early trigger’ contingent capital – or a minimum requirement for ‘bail-in-able’ debt, or a combination of these measures. Large global banks have tended to have lower capital and liquidity ratios than small banks.
The FSA has begun discussions with the major UK banks about the transition to the new capital standards. Some banks will need to strengthen their capital positions further. The long transition period has been agreed to allow banks, if needed, to build capital gradually through retained earnings and without unduly constraining lending to support economic growth. Banks may also raise capital externally.
Chart B20 illustrates how the major UK banks in aggregate might exceed a 7% common equity requirement (minimum plus capital conservation buffer) by 2019 based on retained earnings over the intervening period. The table includes a scenario in which risk-weighted assets are projected to grow at 5% per annum, in line with consensus expectations of medium-term growth in UK nominal GDP, and a scenario with a slower rate of 2.5% that might be consistent with a period of deleveraging by UK households and companies. It also shows different assumptions for return on equity, which determines the rate at which firms generate equity internally, and dividend payouts or what proportion of earnings is retained.
…with extended transition periods
Some UK banks will need to strengthen
capital positions but they have
time
FSA-PRO-2011 Text.indd 36 16/03/2011 13:19

JOB: FSA-CRO-2011 | Page 36 | Proof 1 Mar-16-11
Prudential Risk Outlook 2011Section B – The UK financial sector
37
JOB: FSA-CRO-2011 | Page 37 | Proof 1 Mar-16-11
4% Core tier 1Basel III Minimum and conservation buffer
Payout 10% Payout 40%
Cor
e tie
r 1 ra
tioChart B21: Illustrative core tier 1 ratios for major UK banks 2011-2019
0%
2%
6%
4%
8%
10%
12%
Jan 12011
Jan 12012
Jan 12013
Jan 12014
Jan 12015
Jan 12016
Jan 12017
Jan 12018
Jan 12019
15% Return on equity 10% Return on equity
0% 10%5% 15% 20% 25% 30% 35% 40% 45% 50% 55% 60%Dividend payout ratio
Chart B22: Illustrative core tier 1 ratios for major UK banks in 2019 making different dividend payout assumptions
Cor
e tie
r 1 ra
tio
0%2%4%6%8%
10%
14%
12%
16%18%20%
Source: FSA calculationsNote: Major UK banks as Chart B11.
Source: FSA calculationsNote: Major UK banks as Chart B11.
It should be noted that the projections have a wide margin of error, reflecting our current interpretation of the Basel III proposals and that Basel III rules are subject to revision and implementation in EU Capital Requirements Directives and FSA rules.
Overall, Chart B20 illustrates a favourable picture, in which the major UK banks should be able to reach Core Tier 1 ratios significantly above Basel III levels, provided dividend payout rates are not excessive, and with returns on equity between 10% and 15%. The following caveats must however be noted:
• the position of individual banks will vary relative to this aggregate view;
• the 7% benchmark does not take account of a potential add-on for systemically-important banks; and
• the BCBS is undertaking a fundamental review of the trading book, targeted for completion by the end of 2011, which may lead to higher capital requirements.
Although major UK banks continue to target returns on equity of 12 to 15%, those may not be achievable in future, even if economic growth remains on track. The corollary of higher equity capital requirements, which will reduce the riskiness of banks, is that shareholders should be willing to accept lower returns on equity (with bank stocks having a lower equity beta). Banks that seek to maintain unchanged return-on-equity targets will only be able to achieve these if they can increase return on risk-weighted assets, and may be tempted to do so by taking increased risk or by underestimating risk. Supervisors need to remain vigilant to ensure that banks do not take excessive risks in an attempt to maintain return on equity in this way.
These points highlight the importance of taking a prudent approach towards dividend pay-out ratios and remuneration to conserve capital within firms. Charts B21 and B22 illustrate the sensitivity of both the rate at which banks can build capital and the final projected core tier 1 ratio in 2019 to the rate at which dividends are paid out. Assuming growth in risk-weighted assets of 5% per annum and a return on equity of 10%, UK banks’ aggregate core tier 1 capital ratios would be 2.3 percentage points higher by 2019 with a payout ratio of 10% than one of 40%. Especially with the introduction of tougher supervisory deductions from capital after 2013, core tier 1 ratios would remain flat on these assumptions if payout ratios remained at 40%.
Firms and investors should
review targets on equity as capital
strength increases
Banks may need to take a prudent
approach to pay and dividend
payouts to conserve capital
FSA-PRO-2011 Text.indd 37 16/03/2011 13:19

Prudential Risk Outlook 2011Section B – The UK financial sector
38
JOB: FSA-CRO-2011 | Page 38 | Proof 1 Mar-16-11 JOB: FSA-CRO-2011 | Page 39 | Proof 1 Mar-16-11
Chart B23: Aggregate risk weighting by asset type for majorUK banks (end 2010, est.)
Ris
k w
eigh
ting
Cor
pora
tes
Ret
ail
Mor
tgag
es
Non
-Mor
tgag
eR
etai
l
Ope
ratio
nal
Ris
k
Mar
ket R
isk
Cou
nter
party
Cre
dit R
isk
Oth
er
Fina
ncia
lIn
stitu
tions
Sec
uriti
satio
ns
Pub
lic S
ecto
r
0%
5%
10%
15%
20%
25%
30%
35%
40%
Retail mortgagesCredit cards and overdraftsCorporate loansUnsecured personal loans
Chart B24: Aggregate risk weights by asset class for major UK banks
Ris
k w
eigh
ting
0%
10%
20%
30%
40%
50%
60%
70%
80%
Sep2008
Dec2008
Mar2009
Jun2009
Sep2009
Dec2009
Mar2010
Jun2010
Sep2010
Source: FSA calculationsNote: Major UK banks as Chart B11.
Source: FSA calculationsNote: Major UK banks as Chart B11.
In seeking to achieve higher risk-based capital ratios, one possibility open to banks is to slow the rate of growth in risk-weighted assets relative to non-risk-weighted total assets. That might mean a relative switch from asset types with higher capital requirements – such as lending to companies with low credit ratings and complex or risky trading book activities – towards those with lower capital requirements, such as residential mortgage lending and lending to governments. Box B2 illustrates the variation in capital requirements by asset type for banks using the internal ratings-based approach under Basel II. The new leverage ratio, however, will act as a constraint on such a shift. And, as discussed in Sections A and C, growth in UK residential mortgage lending may remain modest as household sector deleveraging continues.
Box B2: Capital requirements by asset type on the internal models-based and standardised approaches under Basel II
Under the Basel II capital regime (with no changes envisaged under Basel III), there are two broad approaches to calculating capital requirements:
• a standardised approach in which capital requirements are specified by the rules; and
• an internal ratings-based approach in which banks with models approved by regulators and subject to a number of regulatory constraints are able to set capital requirements based on their own loss experience.
Chart B23 illustrates the variation in capital requirements for different categories of exposures based on the average of internal ratings-based approaches as implemented by a sample of six UK banks. Capital requirements for corporate lending are significantly higher, reflecting historical loss experience. There is also variation across banks using the internal ratings-based approach.
Overall capital requirements rose by less than many expected as the UK economy entered a cyclical downturn (Chart B24). That may reflect efforts by firms, encouraged by the FSA, to ensure that their risk weights are calculated on a forward-looking, through-the-cycle basis, rather than over-reacting to point-in-time variations in loss experience. Interpretation of changes in risk weights over time is complicated by model changes as firms have sought to develop their approaches to estimating risk. In the case of residential mortgages, however, it also reflects the fact (discussed in Section C) that arrears, provisions and write-offs on residential mortgages have remained low. It is vital that risk weights reflect future possible risks as well as current experience, allowing, for example, for the potential impact of possible increases in interest rates.
FSA-PRO-2011 Text.indd 38 16/03/2011 13:19

JOB: FSA-CRO-2011 | Page 38 | Proof 1 Mar-16-11
Prudential Risk Outlook 2011Section B – The UK financial sector
39
JOB: FSA-CRO-2011 | Page 39 | Proof 1 Mar-16-11
Key messages to firms
• Banks should continue to take opportunities to shed or unwind non-core, risky assets as market conditions allow;
• To meet Basel III standards, some banks will need to strengthen capital positions further. In their planning, banks should consider the possibility of higher capital requirements than announced so far: for example, potential capital add-ons for systemically important banks, and higher capital requirements against trading books. The long transition period has been agreed to allow banks, if needed, to build capital gradually through retained earnings and to prevent any undue constraints on lending to the real economy. Banks will wish to ensure that dividend and remuneration policies are consistent with the need to build up capital to meet these revised standards;
• As banks strengthen capital positions, management and shareholders should review the appropriateness of target returns on equity. Too-high targets should not drive banks to imprudent risk taking.
B.3 Liquidity and funding in the banking sectorIn 2010 UK banks took some steps towards addressing the funding vulnerabilities that were a significant cause of the financial crisis and required the UK authorities to underpin the system with Treasury funding guarantees and exceptional Bank of England liquidity support. The following describes the policy response to those funding weaknesses, the progress banks have made and the challenges ahead.
Vulnerabilities and crisisThe 2010 Financial Risk Outlook described how UK banks and building societies became increasingly dependent on risky sources of funding before the crisis:
• Their assets increased quickly as customer lending grew and they expanded into wholesale markets.
• Customer deposits did not increase as rapidly (Chart B25). The UK household sector became a net debtor and the growing combined deficits of the household and corporate sector, reflected in a persistent current account deficit, were financed by borrowing from abroad (see Section A).
• Many UK banks made increasing use of mortgage-backed securitisation as a source of funding. That lengthened the average maturity of their wholesale debt securities, even before the crisis (Chart B26). But since these debt securities financed residential mortgages which were of still longer contractual maturity, aggregate maturity transformation within the banking system increased. There was no similar pickup in unsecured issuance (Chart B27). And using securitisation proved unstable because the investor base comprised predominantly leveraged institutions undertaking significant maturity transformation across their balance sheets, such as other banks, money funds, asset-backed commercial paper (ABCP) conduits and structured investment vehicles (SIVs), which were vulnerable to a drying up of market liquidity.
Before the crisis banks became dependent on
risky sources of funding…
…including securitisation to
a largely leveraged
investor base…
FSA-PRO-2011 Text.indd 39 16/03/2011 13:19

Prudential Risk Outlook 2011Section B – The UK financial sector
40
JOB: FSA-CRO-2011 | Page 40 | Proof 1 Mar-16-11 JOB: FSA-CRO-2011 | Page 41 | Proof 1 Mar-16-11
Mar
-95
Sep
-95
Mar
-96
Sep
-96
Mar
-97
Sep
-97
Mar
-98
Sep
-98
Mar
-99
Sep
-99
Mar
-00
Sep
-00
Mar
-01
Sep
-01
Mar
-02
Sep
-02
Mar
-03
Sep
-03
Mar
-04
Sep
-04
Mar
-05
Sep
-05
Mar
-06
Sep
-06
Mar
-07
Sep
-07
Mar
-08
Sep
-08
Mar
-09
Sep
-09
Mar
-10
Dec
-10
Loans Deposits
Chart B25: Outstanding lending to and deposits of UK householdsand non-financial corporations
Am
ount
Out
stan
ding
(£bn
)
0200400600800
1,000
1,400
1,200
1,6001,8002,000
Chart B26: Breakdown of wholesale debt securities issued by UK banks and building societies, by maturity
Sha
re
Certificates of deposit/Commercial paperBonds with original maturity less than 5 yearsBonds with original maturity over 5 years
1997 1998 1999 2000 2001 2002 2003 2004 2005 2006 2007 2008 2009 20100%
10%20%30%40%50%60%70%80%90%
100%
Source: Bank of England (BankStats), FSA calculationsNote: Lending data is M4 excluding the effects of loan transfers and securitisations.
Source: Bank of England. (Bank stats) Includes building societies from 2008 onwards ‘Bonds with original maturity less than 5yrs’ include issues and redemptions of covered bonds, but do not include CMBS/RMBS/securities issued by securitisation.
• In addition, some UK banks and building societies were also dangerously reliant on short-term wholesale funding, including from abroad, and therefore vulnerable to a wholesale ‘run’. This comprised both interbank borrowing and increasingly repo financing. Globally, financial institutions shortened the maturity of their wholesale bond issuance between the 1990s and 2000s (Chart B28). Maturity transformation in the global banking system and associated vulnerability to liquidity risk increased.
In the crisis, securitisation, bank debt and money (beyond very-short maturities) markets dried up. Several UK banks faced a funding crisis and the UK authorities provided unprecedented funding and liquidity support. The Treasury’s Credit Guarantee Scheme (CGS) guaranteed the issuance of medium and long-term debt. And the Bank of England Special Liquidity Scheme (SLS) allowed banks and building societies to borrow Treasury bills against the collateral of securities (predominantly residential mortgage-backed), which could then be sold or used to raise funds in the repo market. Together the CGS and SLS provided over £300 billion of support, which equated to over 10% of the liabilities of the major UK banks.
Policy responseThe FSA’s policy goals for the UK banking system include:
• to repay this explicit government support;
• to cease to be reliant on implicit government support; and
• to move to a more stable basis of funding.
More stable funding means a reduced reliance on short-term wholesale debt and a greater share of stable customer deposits and long-term debt in banks’ liabilities. Our new liquidity policy, implemented in 2010, requires firms to be able to survive a severe name-specific as well as market-wide stress for three months. Firms must hold liquid assets to cover expected outflows under these scenarios. Liquid assets are limited to central bank reserves and highly-rated government bonds denominated in major currencies.
…and short-term wholesale borrowing
In the crisis several banks
faced a funding crisis, requiring unprecedented
official support
UK banks need to move to more
stable funding…
…FSA liquidity policies will
encourage this transition…
FSA-PRO-2011 Text.indd 40 16/03/2011 13:19
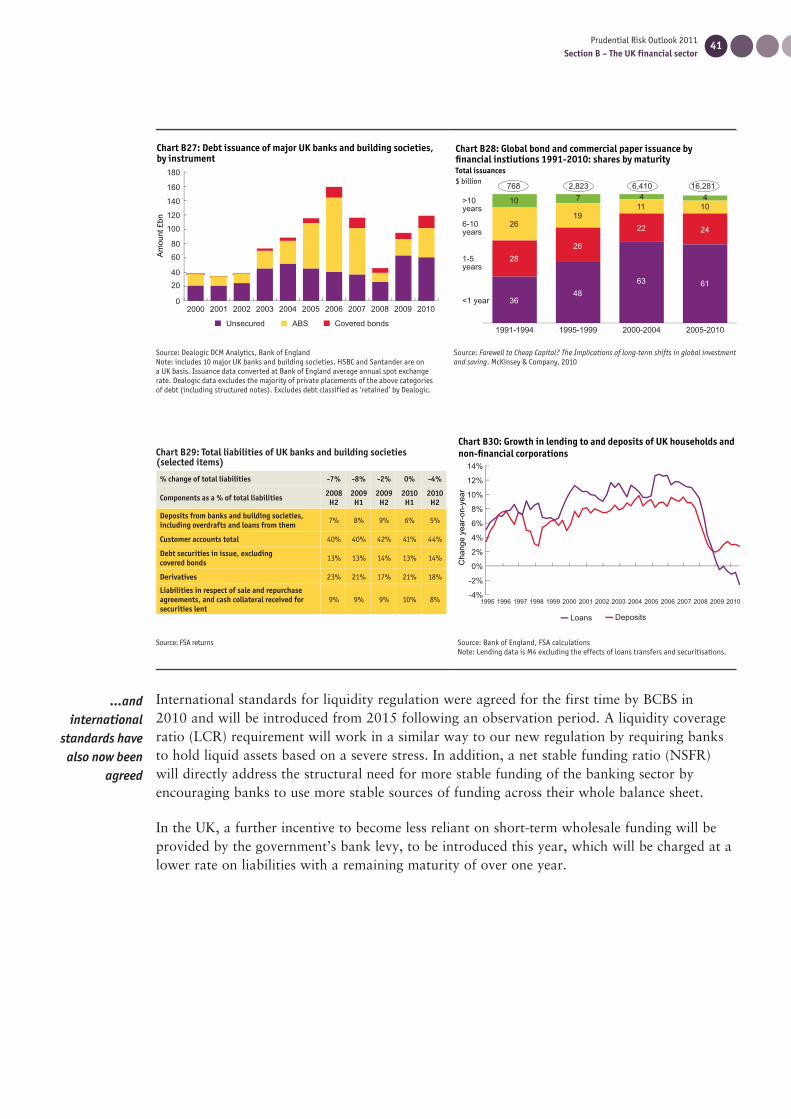
JOB: FSA-CRO-2011 | Page 40 | Proof 1 Mar-16-11
Prudential Risk Outlook 2011Section B – The UK financial sector
41
JOB: FSA-CRO-2011 | Page 41 | Proof 1 Mar-16-11
Unsecured ABS Covered bonds
Chart B27: Debt issuance of major UK banks and building societies,by instrument
Am
ount
£bn
0
4020
60
80
100
120
140
160
180
2000 2001 2002 2003 2004 2005 2006 2007 2008 2009 2010
2005-20102000-20041995-19991991-1994
Chart B28: Global bond and commercial paper issuance by financial instiutions 1991-2010: shares by maturityTotal issuances$ billion
36
28
26
10
768
<1 year
1-5years
6-10years
>10years
48
26
19
72,823
63
22
114
6,410
61
24
104
16,281
Source: Dealogic DCM Analytics, Bank of EnglandNote: includes 10 major UK banks and building societies. HSBC and Santander are on a UK basis. Issuance data converted at Bank of England average annual spot exchange rate. Dealogic data excludes the majority of private placements of the above categories of debt (including structured notes). Excludes debt classified as ‘retained’ by Dealogic.
Source: Farewell to Cheap Capital? The Implications of long-term shifts in global investment and saving. McKinsey & Company, 2010
Chart B29: Total liabilities of UK banks and building societies (selected items)
% change of total liabilities -7% -8% -2% 0% -4%
Components as a % of total liabilities 2008H2
2009H1
2009H2
2010H1
2010H2
Deposits from banks and building societies, including overdrafts and loans from them 7% 8% 9% 6% 5%
Customer accounts total 40% 40% 42% 41% 44%
Debt securities in issue, excluding covered bonds 13% 13% 14% 13% 14%
Derivatives 23% 21% 17% 21% 18%
Liabilities in respect of sale and repurchase agreements, and cash collateral received for securities lent
9% 9% 9% 10% 8%
DepositsLoans
Chart B30: Growth in lending to and deposits of UK households andnon-financial corporations
Cha
nge
year
-on-
year
1995 1996 1997 1998 1999 2000 2001 2002 2003 2004 2005 2006 2007 2008 2009 2010-4%
-2%
0%
2%
4%
6%
8%
10%
12%
14%
Source: FSA returns Source: Bank of England, FSA calculationsNote: Lending data is M4 excluding the effects of loans transfers and securitisations.
International standards for liquidity regulation were agreed for the first time by BCBS in 2010 and will be introduced from 2015 following an observation period. A liquidity coverage ratio (LCR) requirement will work in a similar way to our new regulation by requiring banks to hold liquid assets based on a severe stress. In addition, a net stable funding ratio (NSFR) will directly address the structural need for more stable funding of the banking sector by encouraging banks to use more stable sources of funding across their whole balance sheet.
In the UK, a further incentive to become less reliant on short-term wholesale funding will be provided by the government’s bank levy, to be introduced this year, which will be charged at a lower rate on liabilities with a remaining maturity of over one year.
…and international
standards have also now been
agreed
FSA-PRO-2011 Text.indd 41 16/03/2011 13:19

Prudential Risk Outlook 2011Section B – The UK financial sector
42
JOB: FSA-CRO-2011 | Page 42 | Proof 1 Mar-16-11 JOB: FSA-CRO-2011 | Page 43 | Proof 1 Mar-16-11
Chart B31: Breakdown of UK household bank deposits (excluding mutuals) (showing split of interest bearing time deposits by maturity after 2008)
Pro
porti
on o
f HH
dep
osits
Non-interest bearingInterest bearing sightInterest bearing time (pre-2008) all maturitiesISAs
1998 1999 2000 2001 2002 2003 2004 2005 2006 2007 2008 2009 20100%
10%20%30%40%50%60%70%80%90%
100%
0%10%20%30%40%50%60%70%80%90%
100%
Chart B32: New fixed rate retail time deposits by maturity
Pro
porti
on
Under one year Over two yearsOne to two years
201020092008
Source: Bank of England, FSA calculations Source: Bank of England
Progress in 2010The broad mix of aggregate liabilities of the UK banking system has not changed markedly since the crisis (Table B29). Progress is likely to remain slow as small percentage changes equate to large cash amounts, banks are dependent on funding market conditions and abrupt changes could be detrimental to customers. Nonetheless, some components have begun to move in the direction of greater funding stability:
• Holdings of liquid assets across the banking system have increased (Chart B9). Most of the major UK banks improved their liquidity position during 2010. On our metrics, they increased the period for which they could survive in a stress scenario on the assumption that no existing funding is renewed on the contractual maturity date.
• The share of interbank deposits has decreased slightly and customer deposits have risen (Chart B29). Bank deposits of UK household and companies grew faster than their bank borrowing (Chart B30).
• As a result, the UK ‘customer funding gap’, which had been increasing since the mid-1990s, began to narrow in 2010 at a slightly faster rate than projected in the scenarios we presented in the 2010 Financial Risk Outlook.
• Sight deposits of households and non-financial companies have grown more quickly than time deposits since the crisis, partly reflecting the lower opportunity cost of holding non-interest bearing deposits at low interest rates (Chart B31). But within household deposits, the percentage share which is likely to be relatively ‘sticky’ may have increased. The increase in the value of UK deposits covered by the Financial Services Compensation Scheme to £85,000 is likely to have reduced the share of retail deposits susceptible to runs. And within household time deposits, maturities have lengthened as banks have competed aggressively for long-term deposits (Chart B32).
• The value of wholesale unsecured debt securities in issue has been broadly unchanged since 2008 even as the aggregate size of banks balance sheets has shrunk. But the maturity of those securities has lengthened, with the shares of commercial paper and certificates of deposit continuing to decline and more recently an increase in the share of debt securities with a maturity of over five years (Chart B26). Unlike before the crisis, this increase in average maturity is not driven by medium-term, secured bonds funding long-term assets
Holdings of liquid assets have
risen…
…the UK customer funding gap has begun to
narrow…
…the maturity of out-standing
wholesale debt has lengthened…
FSA-PRO-2011 Text.indd 42 16/03/2011 13:19

JOB: FSA-CRO-2011 | Page 42 | Proof 1 Mar-16-11
Prudential Risk Outlook 2011Section B – The UK financial sector
43
JOB: FSA-CRO-2011 | Page 43 | Proof 1 Mar-16-11
but by an increased proportionate role of medium-term, unsecured debt funding the totality of the balance sheet (Chart B27).
• Banks have agreed voluntary repayment plans with the Bank of England to return SLS Treasury bills ahead of contractual SLS maturities.
The pace of issuance of medium and long-term unsecured and unguaranteed debt is a particularly important indicator of increasing funding stability. As Chart B27 shows, this is now running appreciably above pre-crisis levels. A desirable feature is that debt issuance has been spread across different types of instruments, maturities and investors: for example, UK banks targeted Japanese, Swiss, Canadian and Australian investors with issues in their local currencies as well as issuing in sterling, US dollars and euro. They also issued a high volume of private placements alongside public issues.
Extension of the maturity of short-term borrowing (from inter-bank, commercial paper or CD markets) is also important. FSA liquidity gap measures which consider potential wholesale funding run-offs, illustrate considerable progress in extending these maturities, but also showed in May (at the time of the Greek sovereign debt crisis) the potential for maturities to shorten in conditions of market uncertainty. And it is vitally important that risk analysis focuses on the true maturity of wholesale funding instruments, allowing for put options as well as final maturity (see Box B3).
Box B3: Innovation in short-term bank borrowingOne innovation was issuance of ‘put-able’ certificates of deposit (CDs), which have a longer final maturity but can be ‘put’ back to the bank by the investor after a notice period such as 95 days. These have been issued to US money funds to meet their new regulatory restrictions on asset maturity. While adapting to meet the changing needs of investors is welcome, there is a risk that adverse market conditions could trigger widespread exercising of the put options by investors. Under our liquidity rules, they are treated as maturing on the first ‘put’ date. Supervisors will continue to monitor any concentrations of funding at maturities just beyond the three-month stress period used in our liquidity regulations.
Securitisation markets also recovered, primarily as a source of funding rather than credit risk transfer. But banks need to find a more stable investor base for residential mortgage-backed securities than before the crisis, ideally long-term investment institutions and asset managers. Banks’ funding plans are consistent with a more modest role for securitisation than pre-crisis.
Funding challenges aheadDespite this considerable progress, there remain important funding challenges ahead. Banks and building societies will need to refinance a substantial hump of official support and maturing private sector debt over the next two years. The SLS is due to expire in 2012 and by then firms will need to have returned the remaining Treasury bills and refinanced the associated collateral securities in the private market. Over £110 billion of government-guaranteed issuance under the CGS is still outstanding (Chart B33).
…UK banks began to repay
the Bank of England SLS in
2010…
…and wholesale debt issuance
returned to pre-crisis levels
But significant funding
challenges remain with
wholesale debt issuance needs in
2011 likely to exceed 2010
FSA-PRO-2011 Text.indd 43 16/03/2011 13:19

Prudential Risk Outlook 2011Section B – The UK financial sector
44
JOB: FSA-CRO-2011 | Page 44 | Proof 1 Mar-16-11 JOB: FSA-CRO-2011 | Page 45 | Proof 1 Mar-16-11
Chart B33: Maturity profile of debt issued by major UK banksand building societies
£bn
0
2010
304050
7060
8090
100
2010 2011 2012 2013 2014 2015 2016 2017 2018
UnsecuredABS Covered bonds
Government guaranteed
200
250
300
350
400
450
500
550
2005 201120102009200820072006 2012
Actual Deleveraging scenario
Chart B34: Customer funding gap of UK banks and building societies: actual and illustrative scenario
£bn
Source: Dealogic DCM Analytics, FSA calculationsNote: Includes 10 major UK banks and building societies (HSBC and Santander are on a UK-only basis). Dealogic data excludes the majority of private placements of the above categories of debt (including structured notes). Maturity profile does not include debt classified as ‘retained’ by Dealogic.
Source: Bank of England (BankStats), FSA calculations and estimates Note: Customer funding gap defined as difference between loans to and deposits from UK households and private non-financial corporations; lending data is M4 excluding the effects of loan transfers and securitisation.
2010Issuance
2006Issuance
2012Total maturities
2011Total maturities
Chart B35: Debt issued by major UK banks and building societies maturing in 2011-12, compared to issuance in 2010
£bn
0
4020
8060
100
140120
160
200180
Unguaranteed debt Debt issuance
Government-guaranteed debtSLS T-bills (nominal value)
2014201320122011
Chart B36: Bank debt maturities in selected EU countriesS
hare
of o
utst
andi
ng d
ebt
0%
20%10%
30%40%50%
70%60%
80%90%
100%
Ger
man
y
Spa
in
Italy
Uni
ted
Kin
gdom
Fran
ce
Bel
gium
Net
herla
nds
Sw
eden
Gre
ece
Por
tuga
l
Irela
nd
Source: Dealogic DCM Analytics, Bank of England, FSA calculations Note: SLS repayment schedule in line with the December Financial Stability Report by the Bank of England. The data covers all SLS users and are based on voluntary repayment plans. Dealogic data excludes the majority of private placements of the above categories of debt (including structured notes). Excludes debt classified as ‘retained’ by Dealogic. Includes 10 major UK banks and building societies. HSBC and Santander are on a UK-only basis.
Source: Dealogic DCM Analytics Note: Based on outstanding amounts as at 3 March 2011.
One source of funding will be if UK household and corporate deposits continue to grow more quickly than their borrowing. That will depend on the pace of deleveraging in the economy (see Section A). One reasonable deleveraging scenario might be for lending to grow at half the rate of growth of nominal GDP (according to consensus forecasts), but for deposits to increase more rapidly, in line with nominal GDP. On that basis, UK banks might have an additional £34 billion of deposit funding (around 0.5% of their aggregate liabilities) to replace maturing wholesale funding by mid-2012 (Chart B34).
Growth in deposit funding, however, is far from assured: for example, UK household deposits actually declined slightly in the third quarter of 2010 as households preferred to save through investment in mutual funds. And competition for retail deposits will remain intense so that deposit margins may remain narrow even as official interest rates rise, particularly on term deposits.
FSA-PRO-2011 Text.indd 44 16/03/2011 13:19

JOB: FSA-CRO-2011 | Page 44 | Proof 1 Mar-16-11
Prudential Risk Outlook 2011Section B – The UK financial sector
45
JOB: FSA-CRO-2011 | Page 45 | Proof 1 Mar-16-11
Overall, it is clear that deposit growth, while important, cannot be sufficient to refinance maturing wholesale debt and official support over the next two years. Banks will therefore need to raise significant amounts of wholesale debt, probably on a larger scale than 2010, and perhaps more than the record issuance of 2006 (Chart B35). Overseas banking systems will also be seeking to refinance large values of maturing bonds (Chart B36).
Many banks are looking to increase borrowing through issuance of structured notes to high-net-worth investors. A typical structured note pays a high initial interest rate but exposes investors to risk of lower coupons or extension of the final maturity date if market indices, interest rates or exchange rates behave in a certain way. In their liquidity planning, firms need to take account of any implicit promise to investors that they will buy back the note before maturity if market prices move against them.
In response to these funding challenges, both UK and overseas banks also expect to increase their issuance of covered bonds. It is unclear whether investor demand will fully keep pace with planned issuance. New Basel III liquidity rules allow a role for covered bonds issued by other banks within banks’ liquidity buffers. We continue, however, to have concerns about the increase in systemic interconnectedness which would result if new covered bond issues were primarily bought by other banks.
A further concern with secured funding is that it reduces available assets for repaying depositors in a bank resolution. While covered bonds are likely to form an important part of the future funding of UK banks, we will continue to cap issuance by individual banks to limit this asset encumbrance.
Another potential regulatory development which may have implications for medium-term funding markets is that of ‘bail-in’ bonds. Making senior unsecured debt ‘bail-in-able’ (i.e., capable of being rapidly written down or converted to equity in order to recapitalise a potentially failing bank) is attractive because it would improve the ability of banks to withstand extreme shocks without resorting to taxpayer bail-outs. The proposals made by the European Commission and being discussed by the Financial Stability Board are intended to expose shareholders, subordinated debt investors and potentially senior debt investors in all banks to risk of loss if banks fail, respecting the creditor hierarchy. In response, investors would be likely to seek to protect themselves against greater risks following issuer failure by switching to secured funding instruments, such as repo and covered bonds. If bail-in bonds are to be among the means used to achieve ‘higher loss absorbency’, regulators may have to require that such bonds (combined with equity and subordinated debt) exceed a minimum percentage of banks’ risk-weighted assets.
Firms’ issuance plans will also be vulnerable to political, financial or macroeconomic shocks that cause investors to retreat from the primary markets for a period. There is a risk that key investor groups – such as US money market funds in the market for three to 12-month bank paper – behave in a ‘herd-like’ manner at times. It is therefore vital that firms take opportunities to issue medium and long-term debt when market conditions allow, even if the term structure of interest rates means short-term funding is cheaper in the short run. We will continue to review funding plans in detail with firms and provide feedback to them.
Possible pinch points include
competition for retail deposits, and issuance of
structured notes and covered
bonds
Bail-in proposals may raise the cost
of unsecured senior debt in the
short term but would improve
our ability to resolve banks
without taxpayer support
Major UK banks should be
proactive in issuing medium-
and long-term debt when market
conditions allow
FSA-PRO-2011 Text.indd 45 16/03/2011 13:19

Prudential Risk Outlook 2011Section B – The UK financial sector
46
JOB: FSA-CRO-2011 | Page 46 | Proof 1 Mar-16-11 JOB: FSA-CRO-2011 | Page 47 | Proof 1 Mar-16-11
Key messages to firms
• When market conditions allow, banks should take opportunities to get ahead of plans for issuance of medium and long-term debt in order to improve their liquidity positions, even if for the present short-term wholesale funding is cheaper.
• Banks and building societies should use scenario planning and stress testing to consider the impact on their funding of name-specific and market-wide stresses. They should have robust contingency funding plans, including, where appropriate, pre-positioning securities for and testing access to central bank discount windows.
• ‘Bail-in’ proposals may increase the cost of unsecured senior bank debt. But they would bring a welcome improvement in the ability of banks to withstand extreme shocks without the need for government bail-outs.
B.4 Risk transfer between banks, insurance companies and the ‘shadow banking system’As international regulators seek to raise capital standards, limit maturity transformation and control risk-taking in the banking sector, a key question is: to what extent and how will other parts of the financial system take on those risks? Transfer of risk may be desirable where the risks better match the liabilities and risk appetite of other financial entities. For example, life insurers have long-dated liabilities and are well placed to hold long-dated assets. And risk-taking by non-banks may be less concerning because non-banks are more likely to be able to fail without damaging the wider financial sector and economy. For example, many hedge funds fail each year without causing any systemic problems. But growth in leverage and maturity transformation outside the banking system may be a significant concern if it threatens wider financial stability, either directly or through contagion to the banking sector. Prudential oversight of linkages and risk transfers within the overall financial system is therefore essential. Links between banks and insurers, shadow banking institutions and hedge funds could be particularly important. We therefore consider these in turn below.
Insurance company provision of funding and liquidity to banksUK insurance companies are significant investors in the debt and capital instruments of UK and overseas banks. For the eight large UK insurance groups surveyed in 2010, bank equity and debt instruments accounted for around 14% of their total assets (Charts B37 and B38). Insurance company investment strategies will play an important role in determining whether bank funding evolves towards the desired more stable pattern. The pattern of insurance company funding of banks therefore needs to be carefully monitored.
Recently we have examined several proposals for insurance companies to provide additional liquidity to banks through sizeable securities lending transactions in which they would lend gilts in exchange for collateral securities such as RMBS. From banks’ perspectives, such transactions are attractive as they obtain liquid assets for the purpose of FSA liquidity regulations that can also be used to obtain funding in the repo market. At the same time, the bank avoids the interest rate and spread risks associated with holding gilts outright. The insurer is paid a borrowing fee and continues to receive the economic return on the gilts to hedge its long-term liabilities. Because insurers are not involved in maturity transformation, they may have less need of the liquidity value of the gilts than banks, though they still need to consider carefully their potential short-term cash needs.
Higher regulatory standards for
banks may lead to a transfer of
maturity transformation and leverage to
other parts of the financial sector
UK insurers are major investors
in banks
Banks have been looking to borrow
gilts from insurers against
collateral, including RMBS, to enhance their
liquidity…
FSA-PRO-2011 Text.indd 46 16/03/2011 13:19

JOB: FSA-CRO-2011 | Page 46 | Proof 1 Mar-16-11
Prudential Risk Outlook 2011Section B – The UK financial sector
47
JOB: FSA-CRO-2011 | Page 47 | Proof 1 Mar-16-11
Chart B37: UK insurers' exposure to bank equity & debt, 1H 2010
United Kingdom,£22.7bn 25%
Europe,£41.9bn 45%
Rest of the world,£27.6bn 30%
EuropeRest of the worldUnited Kingdom
Chart B38: UK insurers' exposure to bank equity & debt, 1H 2010
£bn
0
10
5
15
20
25
30
35
SecuredBonds
SubordinatedBonds
UnsecuredBonds
Equity Other
Source: FSA survey of 8 large UK insurance groups Source: FSA survey of 8 large UK insurance groups
Such transactions, however, expose both the insurance company and the bank to counterparty risks, with an increased possibility of contagion between the banking sector and the insurance sector in a crisis. These counterparty risks need to be properly controlled: for example, through restrictions on the quality and diversification of counterparties and, from the insurer’s perspective, collateral. We expect to discuss any sizeable transactions with firms and may impose limits on aggregate or individual transactions. We will give particular scrutiny to proposed intra-group transactions, which may not be done on an ‘arm’s length’ basis.
The implementation of Solvency II may have an important influence on insurance company demand for medium and long-term securities. Solvency II is a new, more risk-sensitive EU-wide framework of capital requirements for insurers and is expected to come into force on 1 January 2013. Some commentators have expressed fears that it will create incentives for EU insurers to reduce their holdings of longer-dated credit instruments, including bank debt. The incentives for insurers’ allocation of assets will depend on a number of factors, including:
• the final calibration of the market risk module4 of the Solvency Capital Requirement (SCR); and which individual firms are permitted to use internal models for the calculation of the SCR;
• the extent to which insurers hold assets that match their liabilities in terms of cash-flow over the long term, particularly having regard to the ‘prudent person principle’;
• formulating the discount rate curve used in determining technical provisions; and
• the availability and pricing of interest rate and other swaps that insurers might use to extend the duration of their assets as an alternative to holding long-maturity bonds.
We will continue to work with both the industry and the European Commission to achieve greater clarity on the impact of Solvency II.
4 The market risk module includes the interest rate risk sub-module, the spread risk sub-module and the illiquidity premium sub-module, which are most relevant for the long-term credit holdings of UK insurers.
…giving rise to counterparty
risks which need to be controlled
Solvency II
FSA-PRO-2011 Text.indd 47 16/03/2011 13:19

Prudential Risk Outlook 2011Section B – The UK financial sector
48
JOB: FSA-CRO-2011 | Page 48 | Proof 1 Mar-16-11 JOB: FSA-CRO-2011 | Page 49 | Proof 1 Mar-16-11
20102005200019951990198519801975197019651960
Chart B39: US financial sector assetsP
erce
nt o
f nom
inal
GD
P
Banks GSEIssuers of ABS Security broker-dealersFunding corporations
MMMFs Agency and GSE-mortgage poolsFinance companies
0%
50%
100%
150%
200%
250%
300%
Chart B40: Shadow banking activities in the UK
Selected shadow banking entitiesand activities
Size in the UK
Structuredinvestment vehicle None
ABCPconduits
Most conduit vehicles incorporated in offshore financial centres. As at end Q3 2009 conduits sponsored by UK banks had more than US$100bn ABCP outstanding
Moneymarketfunds
Less that 0.5% (about £4bn) of total assets of regulated MMFs within Europe is domiciled in the UK. Most funds are domiciled in France (36%), Ireland (29%) and Luxembourg (26%)
Hedge funds andother leveragedasset managers
Most hedge funds managed from the UK are domiciled in offshore centres, such as the Cayman Islands(around 60% of assets)
Non-bank mortgage lenders and other finance companies
Asset finance amounted to more than £20bn in 2009
Securities lendingcash collateral reinvestment
UK investment institutions have aroundUS$1.3 trillion of securities that are part of securities lending programmes; of which about 12.5% is typically lent out and around 2.5% is typically lent against cash collateral (more than US$30 billion)
Source: Federal Reserve Source: FSA
Shadow bankingHigher capital and liquidity standards in the regulated financial sector may also create incentives for risk-taking to move outside: for example, to so-called ‘shadow banking’ and to hedge funds.
Shadow banking can be most usefully defined as covering the sub-set of non-bank credit intermediation which involves either leverage or maturity transformation. For example, it does not cover a non-leveraged pension fund buying and holding to maturity a corporate bond, but it does cover:
• non-bank entities which have ‘money-like’ callable or very short-term liabilities that they invest in slightly longer-term assets to deliver enhanced yield – this includes money market mutual funds (MMMFs);
• vehicles such as SIVs and conduits which issue short to medium-term liabilities such as ABCP to fund purchases of long-term credit securities; and
• the complex web of secured financing linkages, particularly through the repo market, which connects MMMFs, banks, broker dealers, hedge funds and other financial institutions.
The shadow banking sector grew very large before the crisis in a number of countries, but particularly in the US (Chart B39). During the crisis it shrank significantly, but it remains important. Although shadow banking can in principle exist in parallel to the banking system, in practice the two are usually deeply inter-connected.
A relatively low value of shadow banking activity occurs through entities incorporated in the UK and therefore potentially subject to FSA regulation (Chart B40). But the UK and continental European banking systems were and are closely interconnected with US shadow banking activities, and are therefore exposed to any potential instability risks. These interconnections include:
• originating loans to be packaged into asset-backed securities;
• providing liquidity facilities to conduits;
• introducing corporate clients to conduit funding;
• providing repo financing for leveraged entities;
• issuing short-term paper to MMMFs; and
• marketing their own MMMFs to their customers.
Risks may also move to the
shadow banking sector…
FSA-PRO-2011 Text.indd 48 16/03/2011 13:19

JOB: FSA-CRO-2011 | Page 48 | Proof 1 Mar-16-11
Prudential Risk Outlook 2011Section B – The UK financial sector
49
JOB: FSA-CRO-2011 | Page 49 | Proof 1 Mar-16-11
In the crisis, many banks provided capital or liquidity support to shadow banking entities that they had established, such as MMMFs and conduits, when those experienced problems, despite those entities being supposedly independent and bankruptcy-remote.
We are currently involved with FSB work to examine the financial stability risks posed by shadow banking at a global level. These include the potential for systemic risk to arise from high levels of aggregate leverage and maturity transformation; and from regulatory arbitrage if banks are able to structure their activities in ways that avoid regulatory capital and liquidity requirements without significantly reducing underlying risk exposures.
Hedge fundsAnother potential place for risk-taking activities formerly undertaken by banks is hedge funds. Higher trading book capital requirements and plans in the US to prohibit proprietary trading by banks have already led some to close trading desks, with key individuals moving to, or leaving to start hedge funds. Hedge funds have the potential to pose systemic risks if they are individually very large or as a group have similar, leveraged positions, creating the risk of a downward self-reinforcing spiral of falling liquidity and asset prices. It is important therefore to track hedge fund leverage, the scale of their presence in key financial markets and the extent of their maturity transformation.
We conduct two six-monthly surveys to monitor these trends in the UK hedge fund sector: a survey of FSA-authorised banks with prime brokerage operations called the Hedge Fund as Counterparty Survey (HFACS); and a Hedge Fund Survey (HFS), in which investment managers are asked about the hedge fund assets they manage.5 The most recent surveys in April and September 2010 showed that most hedge funds had made positive returns since the crisis. Overall, there was no clear evidence to suggest a significant systemic risk to the financial system as at September 2010. But that position could change and future surveys will be used to identify emerging risks. Looking briefly at the key indicators:
• On average, fund leverage (measured as cash and synthetic borrowing compared to net equity or net asset value) had been relatively stable since November 2009 for most fund strategies. It did rise significantly in the April 2010 survey for fixed-income arbitrage funds, the most leveraged category – but that fell back by September 2010. Overall levels of leverage remained fairly modest (Chart B41).
• One way of assessing the extent of hedge funds’ presence within particular markets is to look at their ‘footprint’ (aggregating long and short positions) as a proportion of estimated overall market size (Chart B42). The convertible bond market is where surveyed hedge funds continued to have the biggest presence. They were also significant players in the much larger interest rate and commodity derivatives markets. As we estimate our survey covers only around one-fifth of hedge funds globally, the overall footprints of all hedge funds in these markets will be larger.
• Finally, it is important to assess the extent of maturity transformation being undertaken by hedge funds and their vulnerability to a ‘run’ by investors or providers of leverage. On average, surveyed hedge funds increased the maturity of their financing from prime brokers between the April and September surveys, with only around 10% of funding at maturities of less than five days and only 14% at less than 30 days (Chart B43). However, the ability of finance providers to alter terms is unknown (such as with special clauses), so a rapid removal of financing may still occur during stressed markets.
5 FSA, Assessing the Possible Sources of Systemic Risks from Hedge Funds, 28 February 2011. www.fsa.gov.uk/pubs/other/hf_survey.pdf
…which the FSB is currently examining
And hedge funds may also increase
their risk taking as banks
pull back...
…but the most recent FSA survey
suggested leverage had
been stable in the hedge
fund sector…
…hedge funds’ footprint in key
markets had not risen
significantly…
… and funds had been increasing the maturity of their financing
FSA-PRO-2011 Text.indd 49 16/03/2011 13:19

Prudential Risk Outlook 2011Section B – The UK financial sector
50
JOB: FSA-CRO-2011 | Page 50 | Proof 1 Mar-16-11 JOB: FSA-CRO-2011 | Page 51 | Proof 1 Mar-16-11
Sep-10 SurveyApr-10 SurveyOct-09 Survey
TotalOtherMulti-strategy
Managedfutures
Globalmacro
Emergingmarkets
Fixedincome
arbitrage
Credit long/short
Equitylong/short
Chart B41: Hedge fund leverage: cash and synthetic borrowingfor selected strategies
Per
cent
age
of n
et a
sset
val
ue
0%
200%
400%
600%
800%
1000%
1200%
1400%
1600%
Chart B42: Hedge fund footprint within selected marketsFootprint (long market value + short market value) as a % of market size; cash and the gross notional value of derivatives
Oct 2009Survey
Apr 2010Survey
Sep 2010Survey
Listed equities 0.5% 0.6% 0.6%
Corporate bonds 0.3% 0.3% 0.3%
G10 bonds with a 0-1 year duration 1.2% 0.6% 0.7%
G10 bonds with over 1 year duration 0.8% 1.0% 1.3%
Non-G10 sovereign bonds 0.1% 0.2% 0.2%
Financial institution bonds 0.2% 0.1% 0.0%
Convertible bonds 10.1% 8.1% 8.3%
Structured/securitised products 0.2% 0.3% 0.3%
Credit derivatives 0.8% 1.0% 1.1%
Additional derivative marketsForeign exchange 0.3% 2.4% 0.8%
Interest rate derivatives 2.9% 4.7% 4.0%
Commodity derivatives 2.5% 4.8% 3.7%
Source: FSA Hedge Fund Survey Source: FSA Hedge Fund Survey
<5 days 6 days-15 days
16 days-30 days
31 days-90 days
91 days-180 days
181 days-1 year
1 year+
Sep-10 SurveyApr-10 Survey
Chart B43: Hedge fund financing terms
Sha
re o
f tot
al fi
nanc
ing
0%10%20%30%40%50%
70%
60%
80%90%
100%
Chart B44: Average prime brokerage margin requirements
Mar
gin
requ
irem
ent/L
ong
mar
ket v
alue
0%5%
20%15%10%
25%30%35%40%45%50%
Apr-05
Oct-05
Apr-06
Oct-06
Apr-07
Oct-07
Apr-08
Oct-08
Apr-09
Oct-09
Apr-10
Oct-10
Pre Lehman ave 29%
Post Lehman ave 38%
Source: FSA Hedge Fund Survey Source: FSA Hedge Fund as Counterparty Survey
The HFACS also allows us to examine the counterparty credit risks that banks have to hedge funds. Concentration of hedge fund exposures among banks has reduced somewhat over the past two years but the top five lenders still comprise over 60% of aggregate net counterparty exposures. However, individual exposures remain manageable relative to bank capital and collateral margin requirement levels have risen since the crisis (Chart B44). Although higher margins are welcome, cyclical behaviour of margins and haircuts is a potential concern if it amplifies a pattern of rising leverage and abundant liquidity in good times and decreasing leverage, squeezed liquidity and asset fire sales in periods of stress. One macro-prudential tool that has been proposed as a means of cooling overheating in securities markets is a regulatory floor on margins on securities financing.6 Whatever the regulatory approach, it is essential that banks do not allow collateral margin requirements to fall in good times to levels that will create risks if there is a sudden turn in market sentiment and liquidity.
6 See The Role of Margin Requirements and Haircuts in Procyclicality BIS Committee on Global Financial System, March 2010 (www.bis.org/publ/CGFS36.htm)
FSA-PRO-2011 Text.indd 50 16/03/2011 13:19

JOB: FSA-CRO-2011 | Page 50 | Proof 1 Mar-16-11
Prudential Risk Outlook 2011Section B – The UK financial sector
51
JOB: FSA-CRO-2011 | Page 51 | Proof 1 Mar-16-11
Chart B45: Profitability of UK life insurers£m
2004 2005 2006 2007 20092008-2,000
0
2,000
4,000
6,000
8,000
10,000
12,000
14,000
Net business flows Trendline
Chart B46: UK life insurance sector net business flows
Net
bus
ines
s flo
ws/
inflo
ws
-40%
-30%
-20%
-10%
0%
10%
20%
30%
40%
50%
1999 2000 2001 2002 2003 2004 2005 2006 2007 2008 2009 2010E
Source: FSA returns Source: FSA calculationsNote: Net business flows defined as premium inflows less claims and surrenders.
B.5 Issues affecting the UK insurance sector
Life insurance: future profitability under pressureIn the short term, life insurers’ profitability is driven by developments in asset markets. Given their substantial exposure to equities and corporate bonds, asset price falls at the time of the banking crisis meant the sector was, in aggregate, loss-making in 2008 (Chart B45). But the subsequent recovery in equity prices and narrowing of sterling corporate bond spreads helped firms to return to profit in 2009.
Despite the cyclical improvement in profitability, UK life insurers continue to face a number of medium to long-term pressures on profitability. In particular, while new business flows are reportedly positive (up around 5% in the first nine months of 2010), net cash flows for the sector (premium inflows less claims and surrenders), shown in Chart B46, have been negative since 2008. In part this is a result of unavoidable factors such as increased annuity payouts as people retire, but it also reflects persistently subdued demand for long-term savings products, increased competition from other types of savings and investment products, and the steady decline of products such as with-profits policies.
Future new business volumes and persistency of existing products will depend on the household savings rate and the extent to which real household income continues to be squeezed (see Section A). Any rise in inflation would also increase the liability exposure of firms with liabilities that are not fixed in nominal terms, such as some annuity providers that have inflation-linked guarantees to the extent that these are not fully matched by inflation-linked assets at similar maturities.
Life insurance sector returned to
profit in 2009…
…but faces significant
medium-term challenges
FSA-PRO-2011 Text.indd 51 16/03/2011 13:19

Prudential Risk Outlook 2011Section B – The UK financial sector
52
JOB: FSA-CRO-2011 | Page 52 | Proof 1 Mar-16-11 JOB: FSA-CRO-2011 | Page 53 | Proof 1 Mar-16-11
Chart B47: UK life insurers' coverage of Minimum Capital Requirement
Cap
ital r
eser
ves/
MC
R
0.0x
0.5x1.0x1.5x2.0x2.5x3.0x3.5x
4.0x4.5x5.0x
2005 2006 2007 2008 2009 2010E
Source: FSA returns
Sound capital positionDespite being exposed to asset market turbulence, UK life insurers as a sector did not experience an acute liquidity and capital crisis over the past two years. The capital position of UK life firms remains sound both on a Pillar 1 (see Chart B47 for the coverage of the Minimum Capital Requirement) and Pillar 2 basis, although still somewhat below pre-crisis levels.
This reflects not just insurance business models and funding structures – insurance firms are funded by policyholders who can only claim fully when an insured event occurs and are indirectly far less exposed to liquidity risks than banks – but also that insurers’ capital management had improved in recent years following the implementation of the FSA Individual Capital Assessment regime. Solvency II, the new, strengthened EU-wide requirements on capital adequacy and risk management for insurers, will further enhance risk management standards and require more risk-sensitive measurement of assets and liabilities. It aims to align the regulatory requirements placed on firms closely with the risks they are exposed to, and should give firms a clearer understanding of how their risk profile influences their technical provisions and capital requirements.
Key risksInsurers writing annuities are vulnerable to credit risk as we highlighted in the Financial Risk Outlook 2010. During the crisis, widening credit spreads on holdings of bonds – partly due to illiquidity in credit markets, partly reflecting higher expected losses – reduced the value of matching assets by more than the corresponding reduction in base liabilities, resulting in a reduction in available capital. The size of the increase depended on how much of the spread widening was attributed to the ‘illiquidity premium’ – the larger the premium, the lower the need for additional capital. As credit spreads on sterling bonds have continued to narrow and as we have addressed cases where firms had taken more credit for the illiquidity premium than we judged prudent, risks have become less acute. However, firms should remain alert to the possibility of further market shocks and widening credit spreads.
Capital position remains sound
FSA-PRO-2011 Text.indd 52 16/03/2011 13:20

JOB: FSA-CRO-2011 | Page 52 | Proof 1 Mar-16-11
Prudential Risk Outlook 2011Section B – The UK financial sector
53
JOB: FSA-CRO-2011 | Page 53 | Proof 1 Mar-16-11
Expense ratioClaims ratio
Chart B48: UK general insurers' combined ratio andinvestment income
Com
bine
d ra
tio
Investment incom
e
0%
20%
40%
60%
80%
100%
120%
0%
2%
4%
6%
8%
10%
12%
14%
16%
2005 2006 2007 2008 2009
Investment income as % ofnet premiums written (RHS)
Chart B49: UK general insurers' coverage of Minimum Capital Requirement
Cap
ital r
eser
ves/
MC
R
0.0x
0.5x
1.0x
1.5x
2.0x
2.5x
3.0x
3.5x
4.0x
2005 2006 2007 2008 2009 2010E
Source: FSA returns Source: FSA returns
In addition to existing challenges in their operating environment, the cumulative impact of a number of regulatory and legislative changes affecting the life insurance sector will create further pressures for firms over the next few years. The recent European Court of Justice ruling on gender equality will have an impact on annuity pricing, while Solvency II and the changes emanating from the UK Retail Distribution Review will both be implemented from 2013 onwards. In addition, the low-cost National Employment Savings Trust, which will be introduced as part of the new mandatory workplace pension scheme, might affect new business volumes.
General insuranceGeneral insurance underwriting profitability is measured by the combined ratio – a ratio of losses and expenses to earned premiums – with below 100% indicating profitability. When underwriting is loss-making – as the UK sector has been since 2007 (Chart B48) – firms rely on investment returns to make an overall profit. With its investments primarily in government securities, the sector avoided any significant impact from falls in equity and corporate bond markets in 2008/09. But the low interest rate environment has constrained investment income. As a result, firms need to focus increasingly on the profitability of their underwriting, taking lower prospective investment returns into account in pricing and underwriting decisions.
UK general insurers are generally well capitalised and Minimum Capital Requirement (MCR) coverage is slightly above its pre-crisis levels (3.7 times versus 3.3 times) (Chart B49). Within the sector, the capital position of London market insurers is also relatively stable. Low numbers of insured catastrophes in 2009/10 combined with the current level of insurance capacity across the market have resulted in a relatively high level of available capital.
The Tohoku earthquake, following catastrophes in Australia and New Zealand in early 2011, will result in material insurance losses. But it is too soon to predict the scale of those losses, especially given uncertainty about the extent of property damage inflicted by the tsunami. The extent of the third quarter US windstorm season will be important now.
Key challengesGeneral insurance, whether domestic or commercial, faces the perennial challenge of accurately pricing risk, be it in setting appropriate premiums or adequate technical provisions (unpaid claims reserves), or in assessing appropriate capital requirements against risk.
Firms appear to have entered a cycle of granting more generous terms and conditions, supported by favourable assessments of prospective claims costs and risks. Past soft phases of the
Firms will need to respond to a
number of regulatory and
legislative changes
General insurers to focus on profitable
underwriting as investment
income remains under pressure
Sector generally well capitalised
FSA-PRO-2011 Text.indd 53 16/03/2011 13:20

Prudential Risk Outlook 2011Section B – The UK financial sector
54
JOB: FSA-CRO-2011 | Page 54 | Proof 1 Mar-16-11
underwriting cycle have shown that underwriters can grant additional cover through changes in terms and conditions. Expressed in qualitative terms, this extra cover is often ignored in the quantitative assessment of expected claims costs and in the potential variability in those costs, which underlie the important disciplines of pricing, reserving and capital assessment.
Claims inflation is likely to continue across general insurance lines, and combined with wider inflationary pressures could pose risks to firms. For example, although motor insurance premiums have risen by a third over the past 12 months, claims are estimated to be up 30% from 2009. The key driver of higher claims is an increase in the frequency and size of bodily injury claims, which have been large enough to offset the effect coming from the falling overall number of reported accidents.7 As a result, premium increases and other changes to underwriting, pricing or distribution strategies may only ensure that insurers keep pace with current costs, and may not be sufficient to correct inadequate pricing in the past or to reflect the possible future frequency and cost of claims.
Also, while reserve releases may reflect prudent reserving practices or indicate changes in underlying risks, we remain concerned by continued significant releases of reserves from earlier underwriting years which may be used to compensate for current poor underwriting performance. If historically-high levels of reserve releases continue, there may be an increased risk of reserve shortfalls across a range of business classes.
Key messages to insurers
• Life insurance firms should not only react to short-term market pressures but also ensure that they understand the combined impact on their business models of anticipated longer-term major environmental developments, such as changes in savings patterns and regulatory and legislative changes (including, in particular, the implementation of Solvency II).
• Given uncertainties in the current operating environment, it is particularly important that firms operate robust strategic planning and have in place appropriate risk management processes to: enable them to react to changes; fulfil contractual obligations; and appropriately protect policyholder interests.
• Prospective lower investment returns in the current low interest rate environment strengthen the need for prudent underwriting and reserving. Therefore, general insurers should ensure that the actuarial function has sufficient independence and authority to calculate and recommend reserves at an appropriate level, without undue pressure from senior management and marketing functions. Actuaries should identify and appropriately react to any increased risk of a reserve shortfall on any class of business. Senior management should understand the key assumptions underlying their reserving decisions.
• Firms should consider the impact of a rise in inflation on their main lines of business and regions. This is likely to affect primarily general insurers but life insurers should also ensure inflation prospects are adequately considered. Firms should evaluate the likely impact on their liabilities, the degree to which their existing investment policy would protect them and the steps that they would take in the pricing and underwriting of future business to respond to this changed environment. Higher inflation may increase exposures for those firms with liabilities that are not fixed in nominal terms, such as annuity providers.
• All insurers should continue to develop flexible implementation plans for Solvency II, as there is still some uncertainty about the details of the directive. Some firms may not be engaging early enough or with sufficient resources.
7 Actuarial Profession, Press Release 25 October 2010.
…claims inflation is a key risk…
…and reserves releases are a
concern
FSA-PRO-2011 Text.indd 54 16/03/2011 13:20

JOB: FSA-CRO-2011 | Page 54 | Proof 1 Mar-16-11 FSA-PRO-2011 Text.indd 55 16/03/2011 13:20

JOB: FSA-CRO-2011 | Page 57 | Proof 1 Mar-16-11FSA-PRO-2011 Text.indd 56 16/03/2011 13:20

Prudential Risk Outlook 2011Section C – Credit risks
57
JOB: FSA-CRO-2011 | Page 57 | Proof 1 Mar-15-11
Section C – Credit risks
The previous section described the capital and funding positions of UK banks and building societies. The other main driver of systemic stability is asset quality. This section discusses five broad areas of credit risk to UK firms:
• C.1 Country risks in the Euro area;
• C.2 UK household lending;
• C.3 UK commercial property;
• C.4 US residential and commercial property; and
• C.5 Emerging markets.
Together these categories of credit exposure account for just under 40%8 of the UK banking sector’s total global assets, but a much higher percentage of credit exposures to the non-financial sector. Within the UK (which accounts for 40% of total assets) exposures to UK households and non-financial companies are 55% of the total, with exposure to Other Financial Corporations (OFCs) the other major category (Chart C1 and C1a). Outside the UK, meanwhile, 30% of overseas exposures are to the US, 8% to peripheral euro-area countries and 17% to major emerging economies (Chart C2 and C2a).
8 We estimate that major UK banks’ US residential property and CRE exposures account for £394bn – see C.4.
FSA-PRO-2011 Text.indd 57 15/03/2011 23:26

Prudential Risk Outlook 2011Section C – Credit risks
58
JOB: FSA-CRO-2011 | Page 58 | Proof 1 Mar-15-11 JOB: FSA-CRO-2011 | Page 59 | Proof 1 Mar-15-11
Chart C1: Sectoral breakdown of UK banks’ UK assets(% of total, end-September 2010)
8%7.7%
5.9%
28%
33.4%
17%
UK households (mortgages)
UK commercial real estateUK households (other)
UK private non-financial corporations(excluding commercial real estate)UK other financial corporationsOther
Chart C1a: UK banks’ UK assets (end-September 2010)in billions
of £as share
of total (%)
UK households (mortgages) 1,003.4 33.4
UK households (other) 177.9 5.9
UK commercial real estate 239.1 8.0
UK private non-financial corporations 230.2 7.7
UK other financial corporations 842.0 28.0
Other 511.2 17.0
Total 3,003.8
Source: Bank of England Table A4.1 Source: Bank of England Table A4.1
Chart C2: Geographic breakdown of UK banks’ non-UK assets(% of total, end-September 2010)
8.4%
33.3%
17.3%
30.3%
10.7%
USA
Other developed economies(excluding USA and peripheraleuro-area)
Peripheral euro-area economies Selected emerging and other economiesOther economies
Chart C2a: UK banks’ non-UK assets (end-September 2010)
in billionsof £
as shareof total (%)
USA 1,223.3 30.3
Peripheral euro-area economies 338.5 8.4
Other developed economies (excludingUSA and peripheral euro-area)
1,341.0 33.3
Selected emerging economies 695.7 17.3
Other economies 432.7 10.7
Total 4.031.1
Source: Bank of England Form CE Source: Bank of England Form CE
Definitions1. ‘UK households (mortgages)’ = M4 lending secured on dwellings (Bank of England Table A4.1).
2. ‘UK households (other)’ = M4 consumer credit and lending to unincorporated businesses (Bank of England Table A4.1).
3. ‘UK CRE’ = lending to companies whose main activity is the development, buying, selling and renting of real estate (Bank of England Table C1.2).
4. ‘UK OFCs’ = M4 lending to other financial corporations (Bank of England Table A4.1).
5. ‘UK PNFCs’ (excluding CRE) = M4 lending to private non-financial corporations (Bank of England Table A4.1) less UK CRE lending.
6. ‘Other’ = UK MFIs’ total assets less assets held by non-UK residents (Bank of England Table A1.4.1.1) less sum of items above. This includes interbank assets and UK MFIs’ holdings of UK government debt.
7. USA
8. ‘Peripheral euro-area economies’ covers: Belgium; Greece; Ireland; Italy; Portugal; and Spain.
9. ‘Other developed economies (excluding USA and peripheral Euro area)’ covers: Andorra; Austria; Cyprus; Denmark; Finland; France; Germany; Iceland; Liechtenstein; Luxembourg; Malta; Netherlands; Norway; Slovakia; Slovenia; Sweden; Switzerland; the Vatican; Australia; Canada; Japan; and New Zealand.
10. ‘Selected emerging and other economies’ covers: Brazil; Russia; India; China; Hong Kong; Singapore; South Korea; South Africa; Mexico; and Taiwan.
11. ‘Other economies’ covers all countries not identified above.
FSA-PRO-2011 Text.indd 58 15/03/2011 23:26

JOB: FSA-CRO-2011 | Page 58 | Proof 1 Mar-15-11
Prudential Risk Outlook 2011Section C – Credit risks
59
JOB: FSA-CRO-2011 | Page 59 | Proof 1 Mar-15-11
Spain (LHS)Portugal (LHS)Italy (LHS)
Ireland (LHS)Belgium (LHS)
Greece (RHS)
Chart C3: Five-year sovereign credit default swap spreads forselected euro-area economies
Bas
is p
oint
s
Basis points
0
100
200
300
400
500
600
800
700
0.0
200
400
600
800
1000
1200
Jan2010
Mar2010
May2010
Jul2010
Sep2010
Nov2010
Jan2011
Chart C4: ECB lending as a share of monetary and financialinstitutions' total balance sheets
Sha
re
May2010
Jun2010
Jul2010
Aug2010
Sep2010
Oct2010
Nov2010
Dec2010
0%
8%6%
4%2%
10%12%14%
16%18%20%
FranceBelgiumIreland Portugal Spain
GermanyItalyGreece
Source: Markit Sources: European Central Bank and national central banks
C.1 Euro-area country risksOver the past year, a lot of attention has been paid to country risks in the euro-area periphery, in particular Greece, Ireland, Portugal and Spain. Concerns about debt sustainability, along with investor uncertainty about policy responses, drove sovereign spreads wider in 2010 (Chart C3). Spikes in spreads were most pronounced in April to May 2010 (around the Greek rescue package) and November 2010 (around the Irish rescue package). Market sentiment picked up in January 2011, partly in anticipation of increased European Financial Stability Facility (EFSF) capacity, an expanded EFSF mandate and more detail on the permanent European Stability Mechanism. Optimism about EFSF reform then waned during February and early March, before the euro area summit on 11 March unexpectedly agreed to expand the facility’s effective lending capacity to €440bn, among other changes. Initial market reactions to the proposed reforms were positive, but many countries will need to roll over large amounts of debt this year, and should the final package disappoint, or should concerns about debt sustainability persist, sovereign debt issuance could yet become more difficult.
Banks in Greece, Ireland and Portugal have become increasingly reliant on ECB funding in recent months, reflecting continued difficulty in retaining deposits and obtaining funds from wholesale markets (Chart C4). In addition to ECB funding, some Irish banks rely heavily on emergency liquidity assistance from the Irish central bank. In contrast, in aggregate, Spanish banks have reduced their reliance on ECB funding.
The crucial issue for UK banks, and for the FSA, is the size and mix of their exposures to the more vulnerable peripheral economies, sovereigns, and banking systems. By country, UK banks are most exposed to borrowers in Ireland and Spain, with much smaller exposures to Portugal and Greece (Charts C5 to C9). In all four countries, however, exposures to sovereign debt are relatively small, and exposures to banking systems only moderate. The most important exposures are instead to households and to non-financial companies, including commercial real estate companies. As of Q2 2010, direct claims on these real economy sectors amounted to £64.8 billion for Ireland and £44.6 billion for Spain.
Our supervisory stress testing for the major UK banks is global in scope. For firms with material Irish and Spanish exposures, we have applied specific stresses to those books based on economic scenarios of broadly equivalent severity to our anchor scenario for the UK. These feed into the additional Pillar 2 capital requirements, including capital planning buffers, assessed for firms as a whole.
UK banks are exposed to the
real economy in Ireland and Spain
but have limited direct exposure to
banks and sovereigns in
peripheral euro-area countries
FSA-PRO-2011 Text.indd 59 15/03/2011 23:26

Prudential Risk Outlook 2011Section C – Credit risks
60
JOB: FSA-CRO-2011 | Page 60 | Proof 1 Mar-15-11 JOB: FSA-CRO-2011 | Page 61 | Proof 1 Mar-15-11
Chart C5: European banking systems’ exposures to Greek borrowersS
hare
of t
otal
equ
ity
Public sectorBanks Non-bank private sector
Other exposures
UK Germany France Spain Italy OEA
*
0%
20%
40%
60%
80%
0%
20%
40%
60%
80%
Chart C6: European banking systems’ exposures to Portuguese borrowers
Sha
re o
f tot
al e
quity
UK Germany France Spain Italy OEA
Public sectorBanks Non-bank private sector
Other exposures
Source: Bank for International Settlements and European Central Bank Source: Bank for International Settlements and European Central Bank
Chart C7: European banking systems’ exposures to Irish borrowers
Sha
re o
f tot
al e
quity
Public sectorBanks Non-bank private sector
Other exposures*
UK Germany France Spain Italy OEA0%
20%
40%
60%
80%
Chart C8: European banking systems’ exposures to Spanish borrowers
Sha
re o
f tot
al e
quity
Public sectorBanks Non-bank private sector
Other exposures*
UK Germany France Italy OEA0%
20%
40%
60%
80%
Source: Bank for International Settlements and European Central Bank Source: Bank for International Settlements and European Central Bank
Notes: Data correct as of end-Q2 2010. All exposures are on an ultimate-risk basis, except for those of German banks (immediate-borrower basis). OEA = Other Euro area. Exposures to Ireland include exposures to DEPFA BANK. Exposures shown as a share of banking system equity.
UK banks have increased provisions against their Irish exposures in 2010: for example, Lloyds increased the stock of provisions against its Irish loan book to £7.8 billion, corresponding to 54% of its impaired Irish loans, and 28% of its total Irish exposures; and RBS raised provisions for Ulster Bank Group to £6 billion, about 44% of Ulster’s non-performing loans, and 12% of total Ulster loans. UK banks also made additional provisions against Spanish exposures. Provisions may increase further if government austerity measures lead to additional unemployment and falls in property prices, in line with the FSA stress scenario. As these economies are energy importers, they would also be more vulnerable in the event of a significant and sustained rise in oil prices. But in the long run, UK banks will benefit if measures to tackle excessive government debt, restructure banking systems and restore competitiveness within the Euro area lay a foundation for renewed economic growth.
FSA-PRO-2011 Text.indd 60 15/03/2011 23:26

JOB: FSA-CRO-2011 | Page 60 | Proof 1 Mar-15-11
Prudential Risk Outlook 2011Section C – Credit risks
61
JOB: FSA-CRO-2011 | Page 61 | Proof 1 Mar-15-11
Chart C9: UK banking system’s exposure to peripheral euro-area countries, end-Q2 2010
Type of exposure Size of exposure(£ billions)
GREECE
Banks 1.1Public sector 1.9Non-bank private sector 5.1Other exposures 3.2Total 11.4
IRELAND
Banks 20.8Public sector 2.3Non-bank private sector 64.8Other exposures 37.4Total 125.3
PORTUGAL
Banks 3.7Public sector 1.5Non-bank private sector 9.6Other exposures 4.5Total 19.4
SPAIN
Banks 19.2Public sector 6.1Non-bank private sector 44.6Other exposures 21.3Total 91.2
Source: Bank of International Settlements
In addition to risks from direct exposures, there may be indirect credit risks to the UK banks if the crisis worsens: German and French banks have significant exposures to Spain and, to a lesser extent, Portugal. German banks also have significant exposures to Ireland. As of the end of the third quarter of 2010, UK banks’ exposures to German and French banks totalled nearly £150 billion.
In the short term, however, the more likely cause of potential risk for the major UK banks is the funding constraint which could arise if falling market confidence produced a generalised tightening of funds supply. While improving the capital position of UK banks puts them in a relatively good position to secure funds even in troubled markets, funding for all banks, including several UK ones, became more difficult in May (when concerns about Greece were most acute). Major UK banks and building societies were then able to issue approximately US$5 billion of medium-term debt, just a third of the 2010 monthly average. Euro-denominated funds were particularly hard to obtain, with issuance by major UK banks and building societies falling to just over €700 million, more than 80% below their average run-rate for euro funding. As emphasised in Section B, this highlights the importance of terming out funding whenever market conditions allow.
Key messages to firms
• Firms should monitor their exposure to the peripheral euro-area countries and consider potential impact channels, including through bank funding markets.
• In their stress testing, firms should consider a range of policy options in the peripheral euro-area countries, including a prolonged period of austerity and possible restructuring of bank and sovereign debt.
• When market conditions allow, banks should take opportunities to get ahead of plans for issuing medium and long-term debt to improve their liquidity positions, even if short-term wholesale funding is currently cheaper.
Spillover effects through bank
funding markets present the most
immediate risk to UK banks
FSA-PRO-2011 Text.indd 61 15/03/2011 23:26

Prudential Risk Outlook 2011Section C – Credit risks
62
JOB: FSA-CRO-2011 | Page 62 | Proof 1 Mar-15-11 JOB: FSA-CRO-2011 | Page 63 | Proof 1 Mar-15-11
US - Secured (LHS)Euro area - Secured (LHS)
UK - Secured (LHS)
Euro area - Unsecured (RHS)US - Unsecured (RHS)UK - Unsecured (RHS)
Chart C10: Household sector write-off rates R
ate
Rate
0%
0.5%
1.0%
1.5%
2.0%
2.5%
3.0%
0%
1.0%
2.0%
3.0%
4.0%
5.0%
6.0%
7.0%
8.0%
1993 1995 1997 1999 2001 2003 2005 2007 20090.0
0.5
1.0
1.5
2.0
2.5
3.0
3.5
4.0
Q22009
Q32009
Q42009
Q12010
Q22010
Q32010
Q42010
Chart C11: Major UK banks' loan loss reserve (provisions stock) byretail asset class
Card accountsSecured Other unsecured
£ bn
Sources: Bank of England Financial Stability Report Dec 2010 (Bank of England, European Central Bank and Federal Reserve)Note: Write-off rates are annualised quarterly write-offs divided by the corresponding loans outstanding at the end of the previous quarter, expressed as a four-quarter moving average.
Source: FSA regulatory data
C.2 Credit risks on UK household lendingWhereas levels of write-offs on secured household lending in some other countries, such as the USA, have reached high levels, in the UK they have remained relatively low – as they have in most of the Euro area. In comparison, UK write-offs on unsecured household lending have been significantly higher than in the Euro area for some time and currently exceed the level of unsecured write-offs in the US (Chart C10). Loan loss provisions are also high. The absolute value of provisions held against unsecured and credit card lending by the four major UK banks is more than three times that against residential mortgage lending, despite the outstanding balance of residential mortgage lending being ten times larger than unsecured credit (Chart C11).
Unsecured creditWrite-offs on unsecured lending started rising well before the crisis (Chart C10), reflecting the business models of some lenders to target less-creditworthy borrowers but also illustrating that debt levels had already become unsustainable in parts of the household sector. Personal insolvencies also began to rise in 2005/6. Research by the Consumer Credit Counselling Service has shown that clients who are recommended to bankruptcy typically have lower-than-average income but high debts and they are typically not homeowners, so have no mortgage debt.9
Despite the reductions in Bank Rate in 2008, interest rates charged on credit cards and personal loans have fallen little, if at all. Unsecured borrowers have therefore not benefitted significantly from lower interest rates. Nonetheless, arrears appear to have stabilised in 2010 and numbers of personal insolvencies began to decline over 2010. That may reflect lender forbearance (see below) as well as the improving economy.
Wide margins have helped lenders absorb high credit losses on unsecured household lending, but banks need to ensure they are adequately provisioned against realistic estimates of future cash-flows. The level of provisions held against UK unsecured retail exposures (excluding credit cards) by the four largest UK banks has been fairly stable since mid-2009, even as borrowers with arrears above 10% of the outstanding loan balance have come to comprise an increasing share of total arrears. Credit card provisions rose through most of 2010, but fell back in the final quarter (Chart C11).
9 Consumer Credit Counselling Service Research Desk Dashboard Q2 2010.
Total unsecured UK household
lending losses are larger than total secured lending
losses
Write-offs on unsecured
lending began to rise well before
the crisis…
…arrears stabilised in 2010
and personal insolvencies fell…
… but borrowers with arrears of
more than 10% of the loan balance
increased their share of total
arrears
FSA-PRO-2011 Text.indd 62 15/03/2011 23:26

JOB: FSA-CRO-2011 | Page 62 | Proof 1 Mar-15-11
Prudential Risk Outlook 2011Section C – Credit risks
63
JOB: FSA-CRO-2011 | Page 63 | Proof 1 Mar-15-11
Chart C12: Arrears and possessions on residential mortgagesA
rrea
rs ra
te (1
)
Possessions rate
(2) Arrears (LHS scale) Possessions (RHS)
0%
0.5%
1.0%
1.5%
2.0%
2.5%
3.0%
3.5%
4.0%
0%
0.2%0.1%
0.3%0.4%0.5%0.6%0.7%0.8%0.9%1.0%
1982
2010
2008
2006
2004
2002
2000
1998
1996
1994
1992
1990
1988
1986
1984 200920072005200320011999199719951993
Chart C13: Write-off rates on secured lending to households
Rat
e
0%
0.02%
0.04%
0.06%
0.08%
0.10%
0.12%
Source: Council of Mortgage LendersNote:(1) Loans 6+ months in arrears as a percentage of mortgages outstanding.(2) Properties taken into possession in period as a percentage of mortgages outstanding.
Source: Bank of England, FSA calculationsNote: Write-off rates are annualised quarterly write-offs as a percentage of M4 lending secured on dwellings, expressed as a four quarter moving average, to Dec 2010.
1979
1981
1983
1985
1987
1989
1991
1993
1995
1997
1999
2001
2003
2005
2007
2009
2010
First-time buyersHome-movers
Chart C14: Median mortgage interest payments as a share ofhousehold post tax income
Sha
re
0%
5%
10%
15%
25%
20%
30%
Chart C15: Unemployment rate in recession
Quarters since start of recession
Rat
e
0%
2%
4%
6%
8%
10%
12%
11109876543210
1990-91
2008-09
1980-81
Source: Council of Mortgage Lenders Source: Office for National StatisticsNote:(1) Quarter 0 refers to: Q4 1979 for the 1980s; Q2 1990 for the 1990s; Q1 2008 for
the 2000s.(2) Unemployment is all unemployment aged 16 and over.
Residential mortgagesArrears on UK residential mortgages rose between 2008 and early 2010 but appear to have peaked at well below 1990 to 1992 levels (Chart C12). Similarly, repossessions on UK residential mortgages have been below the levels seen in the 1990s (Chart C12). Residential mortgage write-offs remain very low as a share of lending (Chart C13). But they did come close to early-1990s levels in 2009, perhaps as a result of sharp house price falls, which raised loss given default.
The lower arrears and repossessions that we have seen during this downturn are primarily explained by two factors. First, mortgage interest rates (which increased dramatically between 1988 and 1990) have fallen in this downturn. This has resulted in improved mortgage affordability (Chart C14). Second, the overall unemployment rate is not as high as in the early-1990s (Chart C15). Moreover, the most significant increases in unemployment have occurred in the 16-24 year old age group, which is minimally exposed to mortgage debt (Chart C16).
Within this overall favourable picture, however, it is important to note three caveats. First, lender forbearance may, at least to some extent, be disguising the scale of problems. Second,
Mortgage arrears and repossessions in the UK are well
below levels in the previous recession…
… lower arrears and repossessions
are a result of lower interest
rates and lower unemployment
FSA-PRO-2011 Text.indd 63 15/03/2011 23:26

Prudential Risk Outlook 2011Section C – Credit risks
64
JOB: FSA-CRO-2011 | Page 64 | Proof 1 Mar-16-11 JOB: FSA-CRO-2011 | Page 65 | Proof 1 Mar-16-11
experience has varied considerably by region and customer segment. And third, the picture may change, particularly when interest rates rise.
Chart C16: Unemployment rate by age group
Rat
e
16-17 18-24 25-49 50+
0%
5%
10%
15%
20%
25%
30%
35%
40%
1992 1994 1996 1998 2000 2002 2004 2006 2008 2010
Chart C17: Breakdown of UK residential mortgages in arrears or subject to forbearance
7%
15%
63%
15%
6 or more months in arrears plus possessions 1 month to less than 3 monthsin arrears
3 months to less than 6 months in arrears Forbearance Provided
Source: Office for National StatisticsNote: Rate is defined as percentage of labour force.
Source: FSA thematic workNote:(1) the arrears figures are as at December 2009.(2) Forbearance Provided is for a twelve month period from April 2009 to March 2010,
and represents the number of contractual changes made to a mortgage to provide forbearance for a period of customer financial stress.
(3) Forbearance processes included in the numbers are: a) capitalisation of existing arrears on the mortgage into the balance to remove the arrears; b) a temporary or permanent transfer of all or part of mortgage onto interest only terms; c) extending the term of the mortgage to reduce monthly repayments; d) extending the term of the mortgage after the term expires and the customer is unable to fully repay the balance outstanding; and e) reduced payments or payment holidays which are not accruing arrears.
Lender forbearanceIt is possible that increasing lender forbearance is an additional factor keeping reported defaults at modest levels. Lender forbearance will often be an appropriate response to customers experiencing temporary financial difficulties to help them stay in their homes. We do not have data to compare levels of forbearance today with the 1990s recession. However, the lower interest rate environment combined with the steeper falls in house prices during this downturn mean that lenders have stronger incentives to exercise forbearance than in the early-1990s.
Many loans where lenders are exercising forbearance do not show up in arrears figures reported to the Council of Mortgage Lenders or the FSA: for example, a temporary or permanent transfer of a mortgage onto interest-only terms, extending the term of the mortgage, and agreeing reduced payments or payment holidays with a borrower. Reported arrears figures should, therefore, not be regarded as a complete measure of the underlying levels of loan impairment (Chart C17). Lenders and their auditors must ensure that impairments are fully recorded and that provisioning practices reflect estimates of future cash flows. Forbearance techniques should not be used to prevent loans being categorised as non-performing to avoid prudent provisioning.
It is also a concern that the number of customers with long-term arrears has risen (Chart C18). This suggests that for some borrowers, lender forbearance is not curing the underlying repayment issue.
But more borrowers are in
financial distress than suggested
by headline arrears figures…
…and the level of long-term arrears
has been increasing
FSA-PRO-2011 Text.indd 64 16/03/2011 11:18

JOB: FSA-CRO-2011 | Page 64 | Proof 1 Mar-15-11
Prudential Risk Outlook 2011Section C – Credit risks
65
JOB: FSA-CRO-2011 | Page 65 | Proof 1 Mar-15-11
H2H1H2RH1RH2H1H2H1H2H1H2H1H2H1
Chart C18: Mortgage arrears by length of delinquencyA
rrea
rs ra
te (1
)
6+ to 12 months3+ to 6 months 12+ months
0%
0.5%
1.0%
1.5%
2.0%
2.5%
3.0%
2004 2005 2006 2007 2008 2009 2010
Chart C19: Performance of mortgages sold by loan-to-value bandbetween April 2005 and March 2009
Arr
ears
and
repo
sses
sion
s as
perc
enta
ge o
f out
stan
ding
mor
tgag
es
From 3 months in arrears 1 August 2009Repossessed or possession order in place on 1 August 2009
Up to 3 months in arrears 1 August 2009
>=95%>=90%<95%
>=80%<90%
>=70%<80%
>=60%<70%
>=50%<60%
>=40%<50%
>=30%<40%
>=20%<30%
>=10%<20%
<10%0%
2%
4%
6%
8%
10%
12%
Source: Council of Mortgage LendersNote:(1) Loans in arrears as a percentage of mortgages outstanding(2) R = revised.
Source: FSA (Product Sales Database and Arrears Dataset). The sample contains around 70% of all regulated mortgages sold between 1 April 2005 and 31 March 2009. We measured performance of these loans on 1 August 2009. See CP10/16, Annex 3, Section 7 for the ‘Notes on data and methodology’ www.fsa.gov.uk/pubs/cp/cp10_16.pdf
Chart C20: Residential and buy-to-let loans(including receiver-of-rent cases) in arrears over 3 months
Arr
ears
rate
(1)
0%
0.5%
1.0%
1.5%
2.0%
2.5%
3.0%
3.5%
4.0%
Buy-to-let (inc. Receiver-of-Rent)Owner Occupied
H22005
H12006
H22006
H12007
H22007
H12008
H22008
H12009
H22009
H12010
H22010
All mortgagesMortgages tocredit impaired
borrowers
Mortgages byspecialistlenders
Self-certifiedmortgages
Chart C21: Performance of mortgages sold by typebetween April 2005 and March 2009
Up to 3 months in arrears on 1 August 2009From 3 months in arrears on 1 August 2009Repossessed or possession order in place on 1 August 2009
0%
5%
10%
15%
20%
25%
30%
Arr
ears
and
repo
sses
sion
s as
perc
enta
ge o
f out
stan
ding
mor
tgag
es
Source: Council of Mortgage LendersNote: (1) Loans in arrears as percentage of mortgages outstanding.
Source: FSA (Product Sales Database and Arrears Dataset). The sample contains around 70% of all regulated mortgages sold between 1 April 2005 and 31 March 2009. We measured performance of these loans on 1 August 2009. See CP10/16, Annex 3, Section 7 for the ‘Notes on data and methodology’ www.fsa.gov.uk/pubs/cp/cp10_16.pdf
Regional and customer segment variationsAlthough the general experience with arrears and repossessions in this recession has been far more favourable than in the early 1990s, there are important regional and customer segment variations, with cases of arrears and repossessions concentrated in particular groups of more risky borrowers. During the boom, the UK mortgage market expanded and some banks, building societies and specialist mortgage lenders provided loans to a ‘tail’ of over-stretched customers. The risks created by this ‘tail’ of poor lending are now being realised.
Arrears rates are higher for borrowers with high loan-to-value (LTV) loans (Chart C19), an indicator that the lender was prepared to take greater risk at the time the loan was agreed, and for borrowers with buy-to-let loans (Chart C20). Arrears are also more frequent for loans where income was self-certified, loans that were made by specialist lenders and loans that were made to customers with impaired credit histories (Chart C21).
Some types of borrowers are
being hit harder than others
FSA-PRO-2011 Text.indd 65 15/03/2011 23:26

Prudential Risk Outlook 2011Section C – Credit risks
66
JOB: FSA-CRO-2011 | Page 66 | Proof 1 Mar-16-11 JOB: FSA-CRO-2011 | Page 67 | Proof 1 Mar-16-11
Chart C22: Performance of mortgages sold by regionbetween April 2005 and March 2009 (measured on 1 August 2009)
0%
2%1%
3%4%
5%
6%7%8%
10%9%
Sco
tland
York
shire
and
Hum
ber
Nor
th W
est
Nor
th E
ast
Wes
tM
idla
nds
Eas
tM
idla
nds
Wal
es
Eas
t
Sou
th W
est
Sou
th E
ast
Gre
ater
Lond
onN
orth
ern
Irela
nd
All
regi
ons
Arr
ears
and
repo
sses
sion
s as
perc
enta
ge o
f out
stan
ding
mor
tgag
es
From 3 months in arrears on 1 August 2009 Up to 3 months in arrears on 1 August 2009
Repossessed or possession order in place on 1 August 2009
Chart C24: Share of mortgage loans in negative equity by region
Sha
re(1
)
Sco
tland
York
shire
and
Hum
bers
ide
Nor
th W
est
Nor
th E
ast
Wes
tM
idla
nds
Eas
t M
idla
nds
Wal
es
Eas
t Ang
lia
Sou
th W
est
Gre
ater
Lo
ndon
Sou
th E
ast
Nor
ther
nIre
land
0
2%
4%
6%
8%
10%
12%
Source: FSA (Product Sales Database and Arrears Dataset). The sample contains around 70% of all regulated mortgages sold between 1 April 2005 and 31 March 2009. We measured performance of these loans on 1 August 2009. See CP10/16, Annex 3, Section 7 for the ‘Notes on data and methodology’ www.fsa.gov.uk/pubs/cp/cp10_16.pdf
Sources: FSA, Product Sales Database, Hometrack, Department for Communities and Local GovernmentNote:(1) Share of mortgage loans outstanding in negative equity (2) Data as at Q4 2010.
UKSouthEast
SouthWest
EastAnglia
LondonWestMidlands
EastMidlands
ScotlandWalesNorthWest
Yorks andHumber
NorthEast
NorthernIreland
Chart C23: Regional house price falls from peak and recovery from trough
Cha
nge
-50%
-40%
-30%
-20%
-10%
0%
10%
20%
30%
Fall from Peak Recovery from trough Net Position
Source: Department for Communities and Local Government, FSA calculationsNote: Calculations based on December 2010 data. Recovery from trough not included for Northern Ireland as house prices are still falling.
UK regions are being affected very differently by arrears. To date, arrears in the North and Wales are significantly higher than those in London, the South East and the South West (Chart C22). Large house price falls and a slower housing market recovery in the North (Chart C23), have resulted in higher concentrations of negative equity (Chart C24). This has contributed to higher arrears in those regions. Looking forward, the northern regions and Wales may continue to be exposed to higher arrears, given regional differences in unemployment and vulnerability to fiscal tightening (Chart C25).
Firms should be alert to the higher credit risks posed by particular regions and customer segments, especially where they have a concentration of loans to such borrowers.
The northern regions and Wales
have seen more borrowers in
difficulty than the southern
regions
FSA-PRO-2011 Text.indd 66 16/03/2011 11:18

JOB: FSA-CRO-2011 | Page 66 | Proof 1 Mar-16-11
Prudential Risk Outlook 2011Section C – Credit risks
67
JOB: FSA-CRO-2011 | Page 67 | Proof 1 Mar-16-11
Chart C25: UK Regions – financial and economic indicators
Residential mortgage arrears and repossession
Houseprices
Housingequity Unemployment Vulnerability to
fiscal tightening
Region
Repo
sses
sed
or p
osse
ssio
n or
der i
n pl
ace
on 1
Aug
ust 2
009
In a
rrea
rs g
reat
er th
an o
r equ
al to
3 m
onth
s on
1 A
ugus
t 200
9
Cure
rate
*
Hou
se p
rice
gro
wth
ove
r the
last
yea
ras
at D
ecem
ber 2
010
Hou
se p
rice
diff
eren
ce fr
om p
eak
as a
t Dec
embe
r 201
0
Med
ian
loan
-to-
valu
e at
ori
gina
tion
(res
iden
tial
mor
tgag
e sa
les
2005
– 2
010)
Neg
ativ
e eq
uity
by
regi
on (
Q4 2
010)
Une
mpl
oym
ent r
ate
(Oct
ober
– D
ecem
ber 2
010)
Aver
age
unem
ploy
men
t rat
e(Q
4 20
09 –
Q4
2010
)
Chan
ge in
une
mpl
oym
ent r
ate
on y
ear
(Oct
ober
– D
ecem
ber 2
010)
Publ
ic s
ecto
r sha
re o
f tot
al e
mpl
oym
ent
(Q3
2010
)
Per c
apit
a w
elfa
re s
pend
ing
rela
tive
to n
atio
nal a
vera
ge (
100,
200
8/20
09)
Capi
tal s
pend
ing
on h
ousi
ng a
s sh
are
of
regi
onal
gro
ss v
alue
add
ed, r
elat
ive
to
nati
onal
ave
rage
(10
0, 2
008/
09)
Capi
tal s
pend
ing
on e
duca
tion
as
shar
e of
regi
onal
gro
ss v
alue
add
ed, r
elat
ive
to
nati
onal
ave
rage
(10
0, 2
008/
09)
Curr
ent s
pend
ing
on p
ublic
ord
er a
s sh
are
of re
gion
al g
ross
val
ue a
dded
rela
tive
to
nati
onal
ave
rage
(10
0, 2
008/
09)
North East 1.8% 2.4% 26% -4% -11% 65.8 6.5% 10.2% 9.4% 1.0% 25% 112 133 182 141
N. Ireland 0.8% 3.7% 78% -15% -40% 60.3 11.2% 8.0% 6.9% 2.0% 30% 118 290 123 181
Wales 1.5% 2.5% 40% 0% -12% 66.9 5.2% 8.4% 8.7% -0.2% 26% 116 119 88 130
North West 1.5% 2.6% 42% 0% -8% 67.7 7.1% 7.5% 8.2% -1.0% 22% 107 129 105 127
Yorkshire and Humber 1.5% 2.4% 39% -1% -10% 67.4 6.2% 9.3% 9.2% 0.1% 22% 98 102 126 111
Scotland 0.6% 1.8% 65% 5% -2% 68.8 2.7% 8.0% 8.1% 0.3% 24% 108 164 94 90
West Midlands 1.4% 2.3% 41% 4% -8% 67.8 6.0% 9.8% 9.1% 0.5% 21% 103 89 107 109
East Midlands 1.4% 2.2% 38% 5% -9% 68.5 6.7% 8.0% 7.6% 0.8% 19% 94 61 116 96
East England 0.8% 1.6% 51% 6% -5% 65.1 3.8% 6.6% 6.6% 0.1% 17% 90 53 99 79
London 0.9% 1.8% 52% 6% -4% 68.2 2.4% 9.0% 9.1% -0.2% 18% 99 116 72 97
South East 0.6% 1.5% 59% 7% -4% 65.6 2.9% 6.1% 6.2% -0.1% 17% 87 50 94 75
South West 0.7% 1.4% 51% 3% -8% 63.3 3.2% 6.1% 6.1% -0.3% 20% 98 57 110 83
UK 1.1% 2% 47% 4% -6% 66.7 5.3% 7.9% 7.8% 0.1% 21% 100 100 100 100
Source: FSA (PSD and arrears dataset) DCLG, FSA calculation FSA(PSD)
FSA PSD,Hometrack, DCLG, FSA calculation
ONS HMT, FSA calculation ONS, HMT, FSA calculation
Note: Regions performing equal to or better than the UK average have been colour-coded green, the worst three regions have been colour-coded red, and the remaining regions have been colour-coded amber. Thus, the colour-coding is a comparative ranking and does not illustrate the degree of divergence from the national average. The latter can be inferred directly from the numbers but not the colour-coding.*Cure rate is defined as the percentage of arrears cases, greater than or equal to 3 months, where repossession is avoided.
Chart C26: Number of prime residential mortgage products, by loan-to-value band
Num
ber o
f pro
duct
s av
aila
ble
Max 60% LTVMax 75% LTV
Max 80% LTVMax 85% LTV
Max 90% LTVMax 95% LTV
Max 100% LTV
0
500
1,000
1,500
2,000
2,500
3,000
3,500
Dec
201
0Fe
b 20
11
Oct
201
0A
ug 2
010
Jun
2010
Apr
201
0Fe
b 20
10D
ec 2
009
Oct
200
9A
ug 2
009
Jun
2009
Apr
200
9Fe
b 20
09D
ec 2
008
Oct
200
8A
ug 2
008
Jun
2008
Apr
200
8Fe
b 20
08D
ec 2
007
Oct
200
7A
ug 2
007
Chart C27: Initial interest rates on mortgages, by loan-to-value band
Inte
rest
rate
Q2
2005
Q4
2005
Q2
2006
Q4
2006
Q2
2007
Q4
2007
Q2
2008
Q4
2008
Q2
2009
Q4
2009
Q2
2010
Q3
2005
Q1
2006
Q3
2006
Q1
2007
Q3
2007
Q1
2008
Q3
2008
Q1
2009
Q3
2009
Q1
2010
Q3
2010
3.0%
3.5%
4.0%
4.5%
5.0%
5.5%
6.0%
6.5%
30% - 50%0% - 30%75% - 85% 85% - 90% 90% - 95%
50% - 75%
Source: Moneyfacts Source: FSA (Product Sales Database)Note: Initial interest rates for 95%+ LTV bands not shown due to a small number of mortgages in the category in 2009-2010.
Potential future developmentsFirms have tightened their underwriting standards since the crisis. In response to house price falls together with the experience of higher arrears on high LTV loans, many lenders have withdrawn from offering loans above 90% LTV (Chart C26). And loan pricing is now linked more clearly to the level of LTV (Chart C27).
But it is important to be aware that while overall arrears and repossessions are below the levels seen in the 1990s, potential vulnerabilities remain. If interest rates or unemployment were to rise appreciably, problems in the tail of more risky lending discussed above would intensify. And arrears and defaults could well become more widespread. Section D discusses risks to mortgage lenders associated with rising interest rates in more detail.
Arrears and write-offs could
deteriorate if interest rates
increase or economic
conditions worsen
FSA-PRO-2011 Text.indd 67 16/03/2011 11:18

Prudential Risk Outlook 2011Section C – Credit risks
68
JOB: FSA-CRO-2011 | Page 68 | Proof 1 Mar-15-11 JOB: FSA-CRO-2011 | Page 69 | Proof 1 Mar-15-11
Key messages to firms
• Lenders and their auditors should ensure that impairments are fully recorded, including forbearance cases, and that provisioning practices reflect realistic estimates of future cash flows.
• Firms should be alert to the higher credit risks posed by particular regions and customer segments, especially where they have a concentration of exposures to such borrowers.
• Despite the fact that arrears and repossessions are nowhere near the levels seen in the 1990s, they could yet deteriorate, particularly as interest rates increase and if economic conditions worsen.
FSA-PRO-2011 Text.indd 68 15/03/2011 23:26

JOB: FSA-CRO-2011 | Page 68 | Proof 1 Mar-15-11
Prudential Risk Outlook 2011Section C – Credit risks
69
JOB: FSA-CRO-2011 | Page 69 | Proof 1 Mar-15-11
1993 1995 1997 1999 2001 2003 2005 2007 2009
Private non-financial corporationsUnincorporated businesses
Other financial corporations
Chart C28: Write-off rates on corporate lendingR
ate
0%
0.5%
1.0%
1.5%
2.5%
2.0%
3.0%
Source: Bank of England
C.3 Credit risks on commercial property lending in the UKUK bank write-offs on lending to UK non-financial companies and unincorporated businesses have risen since the crisis but remain well below levels seen during the early-1990s recession (Chart C28). As described in Section A, much of the corporate sector is in good financial health and has benefitted from low debt-servicing costs. Within this overall picture, however, important credit risks have crystallised and still remain in specific credit categories, and above all in commercial real estate (CRE), where the scale of eventual problems may currently be disguised by extensive forbearance strategies.
Section A explained that the pre-crisis increase in debt in the UK corporate sector was concentrated in CRE companies and lending was used primarily to raise the leverage of CRE companies, as property prices rose, rather than for investment in new property development. Unlike Ireland and Spain, the UK did not experience a property construction and development boom in the 2000s.
Loans to CRE companies now represent about one third of UK banks’ total lending to non-financial companies worldwide. In the UK, real estate lending is even more significant, accounting for around a half of the total exposure of UK banks to UK non-financial companies. Despite sharp falls in property prices, write-offs on lending to UK CRE companies have so far been below those on lending to companies in other industrial sectors.
There are good reasons, though, for believing that write-offs in the CRE sector will rise markedly in future. Between July 2007 and July 2009 indices of UK commercial property prices fell by more than 40% to levels last seen in 1997. At December 2010 they remained 35% below their peak. Consequently, the quality of lenders’ exposures to CRE companies has deteriorated markedly. Total arrears for UK banks and building societies on ‘other secured’ lending, which largely comprises loans to CRE companies, increased from 1.4% at around the peak of the market in mid-2007 to 7.6% in September 2010. In its semi-annual report on UK commercial property lending, De Montfort University estimated that £34bn of UK loans were in breach of financial covenant and £20 billion in payment default at June 2010 – taken together more than 20% of outstanding CRE loans.
UK banks have significant
exposures to CRE companies
More than 20% of outstanding UK CRE loans are in
breach of financial
covenant or in default
FSA-PRO-2011 Text.indd 69 15/03/2011 23:26

Prudential Risk Outlook 2011Section C – Credit risks
70
JOB: FSA-CRO-2011 | Page 70 | Proof 1 Mar-15-11 JOB: FSA-CRO-2011 | Page 71 | Proof 1 Mar-15-11
Chart C29: 'Other secured' arrears (mostly commercialreal estate)
Sha
re
Aggregate arrears
0%
5%
10%
15%
20%
25%
30%
35%
40%
45%
Q3
2010
Q2
2010
Q1
2010
Q4
2009
Q3
2009
Q2
2009
Q1
2009
Q4
2008
Q3
2008
Q2
2008
Q1
2008
Q4
2007
Q3
2007
Q2
2007
Q1
2007
201020092008200720062005200420032002200120001999
Prime Secondary
Chart C30: Commercial property prime and secondary yields
Yie
ld
3%
4%
5%
6%
10%
9%
8%
7%
11%
Source: FSA, Mortgage Lending and Administration ReturnNote: Data is for the 40 largest lenders. Spikes and bars show minimum, maximum and interquartile range. Share of outstanding loans.
Source: CB Richard Ellis
Industrials
Regional Offices
M25 Offices
CL Offices
Shopping Centres
Retail Warehouses
Shops
All Property
Chart C31: Capital value changes from trough to January 2011
ChangePrime Secondary
-20% -10% 0% 10% 20% 30% 40% 50%
Chart C32: Primary reason cited as cause of breach of financialcovenants by commercial real estate borrower
18%14%
13%
10%
4%
3%
December2009
(inner ring)
June2010
(outer ring)46%
51%
19%
22%
Interest wholly or partly unpaidLTV convenant breachedPrincipal wholly or partly unpaidCombination Other
Source: CB Richard Ellis Source: De Montfort University
The UK CRE lending market is concentrated, with the top ten lenders accounting for around 80% of the outstanding debt. Within these top ten, loss experience is highly divergent, reflecting very different loss rates by class and type of CRE company. For some lenders, arrears have remained quite contained while for others they are very high (Chart C29). These differences reflect relative exposures to prime and secondary properties, and the relative prudence (or otherwise) of lending practices before the crisis. While some UK banks and building societies have made sizeable provisions against exposures to CRE companies, we consider that the risks that persist in the CRE market demand that firms are vigilant in ensuring that provisions remain adequate.
Prime and secondary property prices and rental yields (the ratio of rental income to property price) have behaved very differently over the past three years (Chart C30). Prices of secondary properties fell by more than those of prime properties during the market crash and, whereas prime prices have recovered to a degree since 2009, secondary prices have hardly recovered or fallen even further (Chart C31). As a result, the value of lenders’ collateral has fallen and caused many borrowers to breach their LTV covenants. At June 2010, around £34 billion of loans, or 15% of total CRE loans, was in breach of financial covenant.
Sizeable provisions have been made, but
firms need to ensure that these remain adequate
FSA-PRO-2011 Text.indd 70 15/03/2011 23:27
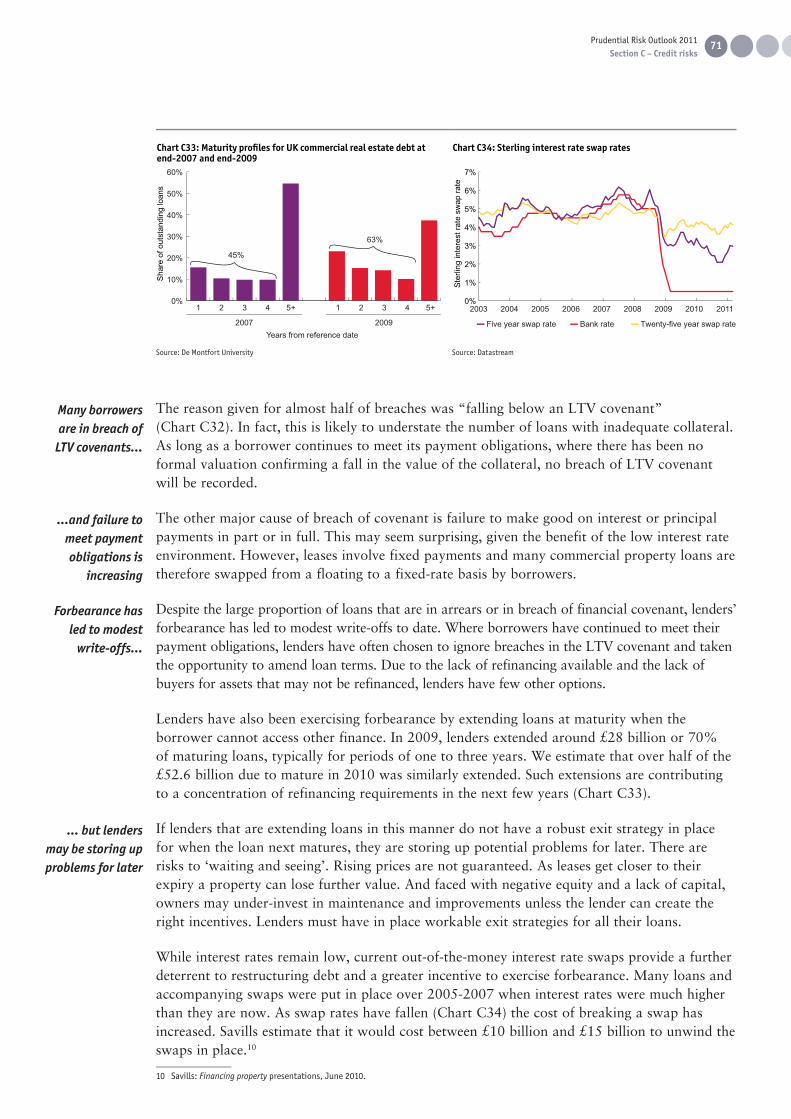
JOB: FSA-CRO-2011 | Page 70 | Proof 1 Mar-15-11
Prudential Risk Outlook 2011Section C – Credit risks
71
JOB: FSA-CRO-2011 | Page 71 | Proof 1 Mar-15-11
Chart C33: Maturity profiles for UK commercial real estate debt atend-2007 and end-2009
Sha
re o
f out
stan
ding
loan
s
0%
10%
20%
30%
40%
50%
60%
1 2 3
2007Years from reference date
4 5+ 1 2 3
2009
4 5+
45%
63%
201120102009200820072006200520042003
Chart C34: Sterling interest rate swap rates
Bank rateFive year swap rate Twenty-five year swap rate
0%
1%
2%
3%
4%
5%
6%
7%
Ste
rling
inte
rest
rate
sw
ap ra
te
Source: De Montfort University Source: Datastream
The reason given for almost half of breaches was “falling below an LTV covenant” (Chart C32). In fact, this is likely to understate the number of loans with inadequate collateral. As long as a borrower continues to meet its payment obligations, where there has been no formal valuation confirming a fall in the value of the collateral, no breach of LTV covenant will be recorded.
The other major cause of breach of covenant is failure to make good on interest or principal payments in part or in full. This may seem surprising, given the benefit of the low interest rate environment. However, leases involve fixed payments and many commercial property loans are therefore swapped from a floating to a fixed-rate basis by borrowers.
Despite the large proportion of loans that are in arrears or in breach of financial covenant, lenders’ forbearance has led to modest write-offs to date. Where borrowers have continued to meet their payment obligations, lenders have often chosen to ignore breaches in the LTV covenant and taken the opportunity to amend loan terms. Due to the lack of refinancing available and the lack of buyers for assets that may not be refinanced, lenders have few other options.
Lenders have also been exercising forbearance by extending loans at maturity when the borrower cannot access other finance. In 2009, lenders extended around £28 billion or 70% of maturing loans, typically for periods of one to three years. We estimate that over half of the £52.6 billion due to mature in 2010 was similarly extended. Such extensions are contributing to a concentration of refinancing requirements in the next few years (Chart C33).
If lenders that are extending loans in this manner do not have a robust exit strategy in place for when the loan next matures, they are storing up potential problems for later. There are risks to ‘waiting and seeing’. Rising prices are not guaranteed. As leases get closer to their expiry a property can lose further value. And faced with negative equity and a lack of capital, owners may under-invest in maintenance and improvements unless the lender can create the right incentives. Lenders must have in place workable exit strategies for all their loans.
While interest rates remain low, current out-of-the-money interest rate swaps provide a further deterrent to restructuring debt and a greater incentive to exercise forbearance. Many loans and accompanying swaps were put in place over 2005-2007 when interest rates were much higher than they are now. As swap rates have fallen (Chart C34) the cost of breaking a swap has increased. Savills estimate that it would cost between £10 billion and £15 billion to unwind the swaps in place.10
10 Savills: Financing property presentations, June 2010.
Many borrowers are in breach of
LTV covenants…
…and failure to meet payment obligations is
increasing
Forbearance has led to modest
write-offs…
… but lenders may be storing up problems for later
FSA-PRO-2011 Text.indd 71 15/03/2011 23:27

Prudential Risk Outlook 2011Section C – Credit risks
72
JOB: FSA-CRO-2011 | Page 72 | Proof 1 Mar-15-11 JOB: FSA-CRO-2011 | Page 73 | Proof 1 Mar-15-11
Residential investment Secondary industrialSecondary retailSecondary office
Primeindustrial
Prime retailPrime office
Chart C35: Average maximum loan-to-value ratios for different UK commercial real estate sectors
Rat
io
55%
60%
65%
70%
75%
80%
85%
1999 2000 2001 2002 2003 2004 2005 2006 2007 2008 2008 2010mid-year
Residential investment Secondary industrialSecondary retailSecondary office
Primeindustrial
Prime retailPrime office
Chart C36: Average income-to-interest cover ratio for UKcommercial real estate sectors
Inte
rest
cov
er ra
tio
1.0%
1.2%
1.4%
1.6%
1.8%
2.0%
2.2%
1999 2000 2001 2002 2003 2004 2005 2006 2007 2008 2008 2010mid-year
Source: De Montfort University Source: De Montfort University
20102009200820072006200520042003200220012000
Chart C37: Annual commercial real estate transactions
£ bi
llion
Rest of UK officesIndustrial Leisure and otherCentral London offices Retail
0
10
20
30
40
50
60
70
Chart C38: Company liquidations and unemployment
Une
mpl
oym
ent r
ate
Num
ber of liquidations
Unemployment Company liquidationsPeriods of recession
0
2
4
6
8
10
12
14
2010
2008
2006
2004
2002
2000
1998
1996
1994
1992
1990
1988
1986
1984
1982
1980
1978
1976
1974
1972
0
1000
2000
3000
4000
5000
6000
7000
Source: Property Data Source: Office for National Statistics, The Insolvency Service
In exercising forbearance, lenders are hoping to avoid contributing to a downward spiral of property prices based on forced sales. But levels of write-offs are almost certain to rise, barring a strong economic recovery and associated rise in property prices. Where loans were written on an interest-only basis, unless they have been restructured following covenant breaches to capture free cash flow, there is unlikely to have been a reduction in the level of debt. To reduce their exposures, therefore, existing lenders will need new debt and equity investors to refinance the borrowers. But new lending remains very subdued; lenders originated only £4.7 billion of new loans in the first half of 2010, and refinanced only £4.3 billion. At the same time new lending terms are much tighter than prior to the bust (Charts C35 and C36). Lower LTV ratios require borrowers to inject more equity. DTZ estimate that over the next three years the equity gap on UK CRE – the gap between the current level of loans and what banks will be willing to lend on those same properties – will total £54 billion.
If a borrower cannot refinance, the other option is to sell to someone who can. The value of property transactions recovered somewhat over 2010 (Chart C37). But most of the transactions were for prime property, whereas much of the refinancing required is for secondary property. In the absence of additional equity investors, banks may have to exchange debt for equity, with associated write-offs, or continue to extend loans.
Even in a benign scenario write-
offs are likely to rise due to a
persistent funding gap…
…and a harsher economic
environment could lead to a
downward price spiral and more
severe losses
FSA-PRO-2011 Text.indd 72 15/03/2011 23:27

JOB: FSA-CRO-2011 | Page 72 | Proof 1 Mar-15-11
Prudential Risk Outlook 2011Section C – Credit risks
73
JOB: FSA-CRO-2011 | Page 73 | Proof 1 Mar-15-11
A risk is that economic growth is weaker than expected, increasing cash-flow stress for tenants and causing insolvencies to rise again (Chart C38). In those circumstances, lenders would face higher default rates with a risk of uncoordinated forced selling leading to a downward price spiral. That risk would be heightened if such sales coincided with maturing commercial mortgage-backed securities (CMBS), of which there is nearly £50 billion secured on UK commercial property. Whereas bank lenders can choose to extend debt if borrowers are unable to refinance at maturity, CMBS investors are much less likely to agree such a response. For example, senior and equity tranche holders may have different incentives. CMBS maturities are therefore more likely to trigger forced sales of properties than secured lending. Maturity dates of outstanding EU CMBS are concentrated in 2012 and 2013.
Key messages to firms
• Firms should ensure they fully understand the composition of their CRE loan book and in particular the strength of the underlying cash flows, both in terms of average lease length remaining and the ability of tenants to continue to meet their obligations.
• Some firms have to date made sizeable provisions against loans to CRE companies. However, in the current environment, it is particularly important that lenders and their auditors ensure that provisioning practices continue to reflect realistic estimates of future cash flows.
• Firms should have in place workable exit strategies for all of their loans to CRE companies and ensure that decisions to extend loans or exercise forbearance are consistent with those, and reflect realistic assumptions about the extent to which loans may or may not be fully repaid.
FSA-PRO-2011 Text.indd 73 15/03/2011 23:27

Prudential Risk Outlook 2011Section C – Credit risks
74
JOB: FSA-CRO-2011 | Page 74 | Proof 1 Mar-15-11 JOB: FSA-CRO-2011 | Page 75 | Proof 1 Mar-15-11
Chart 39: Estimates of exposure of UK banks to US household and commercial sectors
$ billion
HouseholdGuaranteed RMBS and MBS CDOs 109
Other RMBS 22
Secured loans 95
Unsecured loans 77
CommercialCMBS and MBS CDOs 13
Property/Development loans 25
Non-property loans 52
Total 394of which non-guaranteed property 156
of which non-property 129
200920072005200320011999199719951993199119891987
Chart 40: US property prices
CREResidential
Inde
x (D
ec 2
000
= 1)
0.0
0.5
1.0
1.5
2.0
2.5
Source: 2010 annual accounts of the three UK banks with the largest operations in the USNote: Guaranteed RMBS is backed by Freddie Mac, Fannie Mae and Ginnie Mae.
Source: Standard & Poor’s, Moody’sNote: Data is indexed to 1 at December 2000.
Chart 41: US banks’ commercial mortgage arrears and write-offs
ArrearsWrite-offs
Sha
re
-2%
0%
2%
4%
6%
8%
10%
12%
14%
1991 1993 1995 1997 1999 2001 2003 2005 2007 2009
Source: Federal ReserveNote: Data is expressed as a share of outstanding loans.
C.4 Credit risks on residential and commercial property lending in the United StatesThe financial crisis was triggered by the bursting of the bubble in the US housing market and weak property markets continue to weigh on the US recovery. As shown earlier (Chart C10), write-offs on residential mortgage lending have been higher in the US than in the UK. Some UK banks have significant exposures to US residential and commercial property markets. For example, the three UK banks with the largest overall exposures to the US have unguaranteed exposures of around US$156 billion to the residential and commercial property markets (Chart C39). Write-offs on US commercial and residential property appear to have peaked but are likely to remain elevated for some time.
The US CRE market has not seen even the mild recovery in headline capital values for prime properties that has been seen in the UK (Charts C30 and C40), but overall the US CRE market is in a similar predicament to the UK market: many borrowers find themselves in negative equity and/or breaching LTV covenants; a high concentration of refinancing is due in the next few years; lenders are extending loans at less than commercial terms; new lending remains low; and arrears remain elevated (Chart C41). There has been a modest rebound in transactions in 2010 driven by foreign investor interest in prime property; but, as in the UK, recovery is expected to be slow and write-offs are likely to rise, with the same risks applying.
Recovery in US property markets
is still fragile, and credit losses could remain at
high levels
FSA-PRO-2011 Text.indd 74 15/03/2011 23:27

JOB: FSA-CRO-2011 | Page 74 | Proof 1 Mar-15-11
Prudential Risk Outlook 2011Section C – Credit risks
75
JOB: FSA-CRO-2011 | Page 75 | Proof 1 Mar-15-11
Chart C42: US residential mortgage arrears and write-offs
Write-offs30 Day 60 Day 90 Day In Foreclosure
Sha
re
0%
2%
4%
6%
8%
10%
12%
14%
16%
Q2
2010
Q4
2010
Q4
2009
Q2
2009
Q4
2008
Q2
2008
Q4
2007
Q2
2007
Q4
2006
Q2
2006
Q4
2005
Q2
2005 201120102009200820072006200520042003200220012000
Chart C43: US sales of existing and new homes
1000
s of
hou
ses 1000s of houses
Existing homes (rhs)New homes(lhs)
0
200
400
600
800
1000
1200
1400
1600
0
1000
2000
3000
4000
5000
6000
7000
8000
Source: Mortgage Bankers Association, Federal ReserveNote data is expressed as a percent of outstanding loans.
Source: Bureau of Census, National Association of Realtors
Arrears on US residential property loans stabilised and write-offs fell during 2010. However, there are reasons to think that they could easily increase again, or at least remain elevated. Around 50% of modified loans are delinquent again within 12 months, and so they may boost arrears over the coming quarters.
Efforts by US banks to avoid foreclosure and losses from distressed sales on their residential loans have led to an increase in long-term arrears (Chart C42). Due to changes to state laws around foreclosure processes, the average number of days a loan is delinquent increased from 196 in Jan 2009 to 344 days in January 2011. The average number of days loans are in the foreclosure process increased from 319 to 523 days over the same period.11 That suggests that losses may have been postponed rather than avoided altogether, unless a strengthening US economic recovery and pickup in employment improve borrowers’ financial positions.
Credit performance in the mortgage market remains weak and the overhang of foreclosures is placing downward pressure on the US economy (Chart C43). Many homeowners are currently benefiting from low interest rates, mortgage modifications and forbearance leaving them at a high risk of defaulting if lender appetite for forbearance shifts and interest rates rise. Tax rises and expenditure cuts by cash-strapped state and municipal governments may also squeeze homeowners in some regions.
One positive factor in lenders’ exposures to US property, however, has been holdings of private-label RMBS, whose prices have risen markedly. At the height of the crisis, investors had no appetite for non-agency RMBS, especially sub-prime, at any price. Consequently, private-label RMBS were trading at yields that reflected a very significant illiquidity premium. Since the crisis, yields on Treasury bonds and high-grade corporate bonds have fallen to low levels in response to the stimulus from US monetary policy as investors have begun to chase yield. In the process they have reassessed the risk priced into private-label MBS and spreads have narrowed. With little new issuance, the existing pool is expected to shrink over time, reinforcing demand for existing RMBS and further narrowing of spreads. In anticipation of rising prices, some investment banks have built up holdings with associated risks of a price correction (see Section B).
11 Source: LPS Applied Analytics
Residential mortgage
foreclosures and write-offs are
being contained but could easily
increase again
Even though there has been
little new issuance, strong
secondary market demand for
private label RMBS has led to
narrowing of spreads
FSA-PRO-2011 Text.indd 75 15/03/2011 23:27

Prudential Risk Outlook 2011Section C – Credit risks
76
JOB: FSA-CRO-2011 | Page 76 | Proof 1 Mar-15-11 JOB: FSA-CRO-2011 | Page 77 | Proof 1 Mar-15-11
Chart C44: Commercial mortgage-backed securities –option adjusted spread
Spr
ead
in b
asis
poi
nts
0
200
400
600
800
1000
1200
201120102009200820072006
Source: Bloomberg
Similar dynamics are at play in the CMBS market which has seen strong secondary market activity (Chart C44). And, unlike in Europe, there appears to be a nascent new issue market for CMBS in the US.
Key messages to firms
• Write-offs on US property, commercial and residential, look likely to remain elevated. In this environment, banks should ensure that provisioning practices reflect realistic estimates of future cash flows.
FSA-PRO-2011 Text.indd 76 15/03/2011 23:27

JOB: FSA-CRO-2011 | Page 76 | Proof 1 Mar-17-11
Prudential Risk Outlook 2011Section C – Credit risks
77
JOB: FSA-CRO-2011 | Page 77 | Proof 1 Mar-17-11
Q22010
Q42009
Q22009
Q42008
Q22008
Q42007
Q22007
Q42006
Q22006
Q42005
Q22005
Q42004
Chart C45: UK-owned banks consolidated foreign exposuresto developed economies (share of total assets)
Sha
re
Banks Public sector Non-bank private sector
0%5%
10%15%20%25%30%35%40%45%50%
Q22010
Q42009
Q22009
Q42008
Q22008
Q42007
Q22007
Q42006
Q22006
Q42005
Q22005
Q42004
Chart C46: UK-owned banks consolidated foreign exposures to selected emerging market and other economies (share of total assets)
perc
ent
Banks Public sector Non-bank private sector
0%
2%
4%
6%
8%
10%
12%
14%
Source: Bank of England; FSA calculations Source: Bank of England; FSA calculationsNote: Includes Brazil, Russia, India, China, Hong Kong, Singapore, South Korea, South Africa, Mexico and Taiwan.
2010(projection)
2009200820072006 2010(projection)
2009200820072006
Chart C47: Capital flows to selected emerging and other economies
$bn
Portfolio (debt and equity)Direct Bank lending and other investment
-400
-300
-200
-100
0
100
200
300
400
Chart C48: Residential property prices
Inde
x (Q
1 20
06 =
100
)
8090
100110120130140150160170180
Singapore TaiwanHong Kong
Q12006
Q32006
Q12007
Q32007
Q12008
Q32008
Q32009
Q32010
Q12009
Q12010
Source: IMF IFS database, China National Bureau of Statistics, FSA calculationsNote: Includes Brazil, Russia, India, China, Hong Kong, Singapore, South Korea, South Africa, Mexico; 2010 projects existing YTD figures over the full year.
Source: DatastreamNote: Q1 2006 = 100.
C.5 Credit risks in emerging marketsWhereas the developed world credit risks described so far have already crystallised, credit risks in emerging markets are primarily a concern for the future. Many emerging market economies have recovered strongly since 2008/9, easing near-term credit risks in these countries. This has come even as a number of developed economies remain weighed down by slow growth, private sector deleveraging and concerns about sovereign debt – as discussed in Section A. The two-speed global recovery is expected to continue in 2011: the IMF’s World Economic Outlook (January 2011 update) forecasts growth of 6.5% in emerging economies in 2011, against 2.5% in the advanced economies.
The growth of emerging economies creates new business opportunities for UK banks. Some already have established presences in these high-growth markets. Others are seeking to increase their exposures. In aggregate, UK banks’ exposures to major emerging economies grew to over 12% of total assets as of the third quarter of 2010, from around 6% five years earlier (Charts C45 and C46). The shift to emerging markets has been broad based, with public sector, bank and non-bank private sector exposures in these countries all growing as a share of UK banks’ aggregate balance sheets. Banks have also expanded investment banking activities: for example, in Hong Kong. Rapid growth in lending, however, can be associated with increasing credit risk, especially against a background of strong aggregate credit growth and rising property prices.
UK banks are shifting their business from developed to
emerging markets…

Prudential Risk Outlook 2011Section C – Credit risks
78
JOB: FSA-CRO-2011 | Page 78 | Proof 1 Mar-15-11
Chart C49: Commercial real estate pricesIn
dex
(Q1
2006
= 1
00)
8090
100110120130140150160170180
Singapore (office space)China Hong Kong (private offices)
Q12006
Q32006
Q12007
Q32007
Q12008
Q32008
Q32009
Q32010
Q12009
Q12010
Chart C50: UK bank exposures to selected emerging and other economies and real house price changes
Riskadjustmentultimate claims (US$bn),Q3 2010
Growth(% yoy)
Contributionto total growth in UK banks’ foreign claims(percentage points)
Realhouseprice changes(% yoy)atQ32010
Australia 93.2 -7.4% -0.2 8.5Brazil 79.8 31.2% 0.5 –China 86.3 69.4% 0.9 5.2Hong Kong 253.5 18.2% 1.0 18.4India 83.0 45.1% 0.7 1.2Korea 100.4 24.4% 0.5 -0.7Singapore 72.2 19.1% 0.3 18.9South Africa 87.4 5.6% 0.1 -4.7Taiwan 43.0 49.2% 0.4 7.0
Other advanced economies(excluding UK) and offshore centres 2,710.6 -0.6% -0.4
Other emerging economies 343.0 31.4% 2.2Grand Total 3,952.4 6.1% 6.1
Source: DatastreamNote: Q1 2006 = 100.
Source: Bank of England, BIS, national sources, DatastreamNote: For India, a 15-city unweighted mean house price has been used and the change refers to Q2 2010 over H1 2009.
Major emerging economies experienced large capital inflows during 2009 and 2010, much of which has come in the form of portfolio investment – purchases of debt and equity securities – and bank lending rather than direct investment (Chart C47). These inflows may partly represent a structural shift in asset allocation from advanced to emerging economies as these asset markets grow relative to advanced markets. But they were also driven by a cyclical search for yield, as speculative ‘hot money’ flowed out of the advanced economies – where interest rates are currently being held at historical low levels – in pursuit of higher returns.
Strong capital inflows might have been contributing to overheating of some asset markets in these economies. The rapid increase in residential and commercial property prices in emerging economies (Charts C48 and C49) could be of particular concern for the UK banks active in these mortgage markets. Real house prices rose by 18%, 19% and 11% year-on-year in Hong Kong, Singapore and Beijing respectively as of the third quarter of 2010, although there are some more recent signs of cooling (Chart C50).
In the first months of 2011, capital inflows into emerging economies slowed, reflecting investor concerns over inflation and monetary tightening, negative sentiment from events in the Middle East, and perhaps an asset allocation shift back towards advanced economies in anticipation of stronger growth. It is too early to know the significance of these developments, but if these booms were to reverse sharply – for example, through slowdowns in domestic economic activity or because of a reversal of hot money inflows – some UK banks might face losses, notwithstanding macro-prudential measures taken by local regulators, such as setting LTV ceilings.
Key messages to firms
• Firms should prioritise prudent credit risk management over expansion in markets experiencing rapid credit and asset price growth.
• Firms should stress test their books against the risks of significant falls in asset prices, reversals of capital flows and rising interest rates in emerging economies.
…where hot money inflows may have been fuelling rising
asset prices, despite the recent
correction…
…particularly in property markets,
to which UK banks are
exposed
FSA-PRO-2011 Text.indd 78 15/03/2011 23:27

JOB: FSA-CRO-2011 | Page 78 | Proof 1 Mar-15-11 FSA-PRO-2011 Text.indd 79 15/03/2011 23:27

JOB: FSA-CRO-2011 | Page 81 | Proof 1 Mar-15-11FSA-PRO-2011 Text.indd 80 15/03/2011 23:27

Prudential Risk Outlook 2011Section D – The low interest rate environment
81
JOB: FSA-CRO-2011 | Page 81 | Proof 1 Mar-15-11
Section D – The low interest rate environment
In response to the financial crisis, the Bank of England reduced the Bank Rate from 5% to 0.5% between October 2008 and March 2009. In addition the Bank of England Monetary Policy Committee has implemented a programme of asset purchases (quantitative easing), which aimed to help meet the inflation target by injecting money directly into the economy. Low short-term interest rates have played a major role in stabilising the economy, but have also been vital to financial stability, reducing debt servicing costs, underpinning asset prices, and limiting credit losses.
But low interest rates themselves create new risks: and the return to more normal rates generates others. This section looks at these risks considering in turn:
• the varied impact of low interest rates on different borrowers and on the margins of firms; and
• the risks potentially created by a sustained period of low interest rates, which could crystallise when interest rates return to more normal levels.
Low interest rates: heterogeneous impact on borrowers and firmsThe overall impact of low interest rates has been to reduce debt service levels, with loan arrears and resulting losses below the levels seen in the early-1990s recession. As Chart D1 shows, household mortgage interest payments as a percentage of post-tax income have been reduced by over a third.
The impact has, however, varied greatly by specific customer group, and somewhat by firm. This is because the overall reductions in short-term interest rates have been accompanied by a much-increased dispersion of specific interest rates applicable to different lending products and funding sources. This dispersion is partly, but not wholly, driven by the steepness of the yield curve.
• On the asset side, different mortgage customers now face dramatically different mortgage rates. Initial mortgage rates are now far more differentiated by LTV band than before the crisis (Chart D2). And the rates paid by customers with different mortgage contract types have diverged dramatically (Chart D3). Customers who secured Bank Rate ‘tracker’ contracts at margins of 1% above Bank Rate before the crisis are now paying total interest rates of only 1.5%, while SVRs are typically above 3%, and, on average, outstanding fixed-rate mortgages continue to be in excess of 5% (reflecting, in part, the steepness of the yield curve). Whereas before the crisis, new variable-rate mortgage customers typically enjoyed lower rates than existing customers, the pattern is now reversed (Chart D4).
Low interest rates have reduced debt-service
levels, but the impact has varied
by firm and customer group
FSA-PRO-2011 Text.indd 81 15/03/2011 23:27

Prudential Risk Outlook 2011Section D – The low interest rate environment
82
JOB: FSA-CRO-2011 | Page 82 | Proof 1 Mar-21-11 JOB: FSA-CRO-2011 | Page 83 | Proof 1 Mar-21-11
Chart D1: Household debt interest payments as share ofpost-tax income
Deb
t int
eres
t pay
men
ts a
s a
shar
e of
inco
me
0%
2%
4%
6%
8%
10%
12%
14%
16%
200920072005200320011999199719951993199119891987
10.7%
6.8%
Chart D2: Initial interest rates on mortgages, by loan-to-value band
Rat
e
3.0%
3.5%
4.0%
4.5%
5.0%
5.5%
6.0%
6.5%
2005
Q2
2005
Q3
2005
Q4
2006
Q2
2006
Q3
2006
Q4
2006
Q1
2007
Q2
2007
Q3
2007
Q4
2007
Q1
2008
Q2
2008
Q3
2008
Q4
2008
Q1
2009
Q2
2009
Q3
2009
Q4
2009
Q1
2010
Q2
2010
Q3
2010
Q1
0%-30% 30%-50% 50%-75% 75%-85% 85%-90% 90%-95%
Source: Office of National Statistics, UK Economic Accounts Source: FSA, Product Sales DatabaseNote: Initial interest rates for 95%+ LTV bands are not shown due to a small number of mortgages in the category in 2009-2010.
Chart D3: Average whole-book UK mortgages rates, by type
Rat
e
0%
1%
2%
3%
4%
5%
6%
7%
2008Q1
2008Q3
2009Q1
2009Q3
2010Q1
2010Q3
All SVR-linkedFixed Bank rate AllTracker
20112010200920082007200620052004
Chart D4: Divergence between new and stock variable householdlending rates
Rat
e
0%
1.0%
2.0%
3.0%
4.0%
5.0%
6.0%
7.0%
New variable secured lending rate Stock variable secured lending rate
Source: FSA calculations, Product Sales Database (PSD)Note: Categories are as reported in PSD. ‘Tracker’ refers to mortgages on rates guaranteed to move with the Bank Rate or another index (such as LIBOR); and ‘SVR-linked’ refers to mortgages on rates priced relative to banks’ Standard Variable Rate (including discounted and capped products).
Source: Bank of England, BankstatsNote: The stock lending rate is the effective secured lending rate prevailing on all loans on lenders’ balance sheets. The new lending rate is the effective secured rate prevailing on new lending each month.
• Ratesforbanks’retailfunding,meanwhile,areequallyvaried,butingeneralhavefallenmuchlessthantheBankRate,greatlydecreasingtheapparentprofitabilityofretaildepositgathering.Sightdepositrateshavefallensignificantly,butsincethereductionislimitedbythelowerboundtointerestratesofzeropercent,marginsbetweenvariable‑ratesightdepositsandvariable‑ratemortgageshavenarrowed(ChartD5).Competitionformedium‑termretaildepositshasbeenparticularlyintense,drivingashifttowardslongertenors(ChartD6)andlesserdeclinesinratespaidforlonger‑termfunds(ChartD7).Thesemedium‑termratesremain,however,belowtypicalrateschargedonfixed‑ratemortgagesatsimilartenors.

JOB: FSA-CRO-2011 | Page 82 | Proof 1 Mar-15-11
Prudential Risk Outlook 2011Section D – The low interest rate environment
83
JOB: FSA-CRO-2011 | Page 83 | Proof 1 Mar-15-11
Jan08
Apr08
Jul08
Oct08
Jan09
Apr09
Jul09
Oct09
Jan10
Apr10
Jul10
Oct10
Chart D5: Major UK banks' average interest earned and paid onfloating-rate mortgages and sight deposits
Rat
e
0%
1.0%
2.0%
3.0%
4.0%
5.0%
6.0%
7.0%
Effective sight deposit rate Effective variable mortgage rate
0%10%20%30%40%50%60%70%80%90%
100%
Chart D6: New fixed rate retail time deposits by maturity
Sha
re o
f tim
e de
posi
ts
Under one year Over two yearsOne to two years
201020092008
Source: Bank of England, Bankstats Source: Bank of England, Trends in Lending January 2011Note: Sterling only. Gross new business balances on fixed-rate retail time deposits expressed as a percentage of the total. Currently compiled using data from 23 UK monetary financial institutions. From January 2010 onwards, building society balances are included. Non-seasonally adjusted.
Chart D7: UK deposit rates
Rat
e
Jan07
Apr07
Jul07
Oct07
Jan08
Apr08
Jul08
Oct08
Jan09
Jan11
Apr09
Jul09
Oct09
Jan10
Apr10
Jul10
Oct10
Sight deposits (offered rate)Term deposits, >2 yearTerm deposits, >1 year and <2 yearTerm deposits, <1 year
0%
1.0%
2.0%
3.0%
4.0%
5.0%
6.0%
7.0%
Chart D8: Short-term interest ratesR
ate
0.0%
1.0%
2.0%
3.0%
4.0%
5.0%
6.0%
7.0%
2005Q2
2005Q4
2006Q2
2006Q4
2007Q2
2007Q4
2008Q2
2008Q4
2009Q2
2009Q4
2010Q2
2010Q4
3 month LIBORBank rate
Source: Bank of England, BankstatsNote: All rates are average paid on new business in each month, except the sight deposit rate, which is a weighted average of current market offerings.
Source: DatastreamNote: Period average rates.
• On the wholesale funding side, meanwhile, three-month LIBOR, which diverged significantly from the Bank Rate in the immediate post-crisis dislocation, has returned to a more normal, close relationship (Chart D8). In this environment, using short-term wholesale funding to support variable-rate mortgages or corporate lending may seem attractive, but the FSA’s new liquidity policies deliberately seek to limit reliance on short-term wholesale funding, which grew to dangerous levels in the pre-crisis period. The cost of medium-term wholesale funds – which can be used either to support fixed-rate lending or swapped for variable-rate funds – is for some banks still swollen by high credit spread costs (proxied on Chart D9 by the five-year CDS). And access to such funds cannot be assumed, but depends on market capacity and sentiment (both general and name-specific), which changes over time.
FSA-PRO-2011 Text.indd 83 15/03/2011 23:27
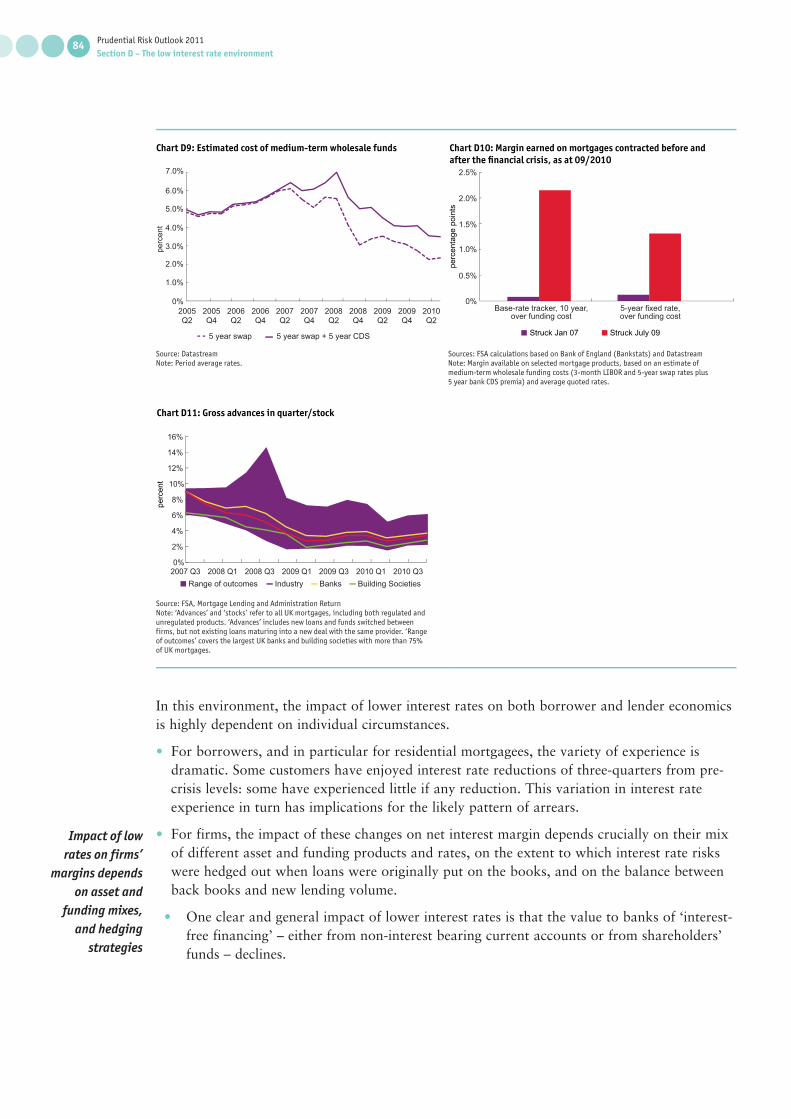
Prudential Risk Outlook 2011Section D – The low interest rate environment
84
JOB: FSA-CRO-2011 | Page 84 | Proof 1 Mar-15-11 JOB: FSA-CRO-2011 | Page 85 | Proof 1 Mar-15-11
2005Q2
2005Q4
2006Q2
2006Q4
2007Q2
2007Q4
2008Q2
2008Q4
2009Q2
2009Q4
2010Q2
Chart D9: Estimated cost of medium-term wholesale fundspe
rcen
t
0%
1.0%
2.0%
3.0%
4.0%
5.0%
6.0%
7.0%
5 year swap 5 year swap + 5 year CDS Struck July 09Struck Jan 07
5-year fixed rate,over funding cost
Base-rate tracker, 10 year,over funding cost
Chart D10: Margin earned on mortgages contracted before andafter the financial crisis, as at 09/2010
perc
enta
ge p
oint
s
0%
0.5%
1.0%
1.5%
2.5%
2.0%
Source: DatastreamNote: Period average rates.
Sources: FSA calculations based on Bank of England (Bankstats) and DatastreamNote: Margin available on selected mortgage products, based on an estimate of medium-term wholesale funding costs (3-month LIBOR and 5-year swap rates plus 5 year bank CDS premia) and average quoted rates.
Chart D11: Gross advances in quarter/stock
perc
ent
Industry Banks Building SocietiesRange of outcomes
0%
2%
4%
6%
8%
10%
12%
14%
16%
2010 Q32010 Q12009 Q32009 Q12008 Q32008 Q12007 Q3
Source: FSA, Mortgage Lending and Administration ReturnNote: ‘Advances’ and ‘stocks’ refer to all UK mortgages, including both regulated and unregulated products. ‘Advances’ includes new loans and funds switched between firms, but not existing loans maturing into a new deal with the same provider. ‘Range of outcomes’ covers the largest UK banks and building societies with more than 75% of UK mortgages.
In this environment, the impact of lower interest rates on both borrower and lender economics is highly dependent on individual circumstances.
• For borrowers, and in particular for residential mortgagees, the variety of experience is dramatic. Some customers have enjoyed interest rate reductions of three-quarters from pre-crisis levels: some have experienced little if any reduction. This variation in interest rate experience in turn has implications for the likely pattern of arrears.
• For firms, the impact of these changes on net interest margin depends crucially on their mix of different asset and funding products and rates, on the extent to which interest rate risks were hedged out when loans were originally put on the books, and on the balance between back books and new lending volume.
• One clear and general impact of lower interest rates is that the value to banks of ‘interest-free financing’ – either from non-interest bearing current accounts or from shareholders’ funds – declines.
Impact of low rates on firms’
margins depends on asset and
funding mixes, and hedging
strategies
FSA-PRO-2011 Text.indd 84 15/03/2011 23:27

JOB: FSA-CRO-2011 | Page 84 | Proof 1 Mar-15-11
Prudential Risk Outlook 2011Section D – The low interest rate environment
85
JOB: FSA-CRO-2011 | Page 85 | Proof 1 Mar-15-11
• Other impacts, however, vary hugely by specific contract term. Firms which made Bank Rate ‘tracker’ mortgage loans at low margins before the crisis have suffered a severe margin squeeze not suffered by those with greater pricing flexibility: for example, with mortgages linked to an administered standard variable rate (SVR). The duration of the profit squeeze will depend both on whether the margin is fixed for the lifetime of the product or only for an initial period, on whether – in the case of products fixed for an initial period only – the interest rate subsequently reverts to the SVR or a pre-determined ‘tracker’ spread over the Bank Rate, and on how long the Bank Rate stays at very low levels.
• And firm profitability can be significantly affected by the firm-specific balance between back books written pre-crisis and mortgages or other loans sold over the past two years. On average, contracts struck before the crisis will, if funded on a matched basis, be far less profitable than more recent sales (Chart D10). Overall, the ratio of new lending advances to the stock of lending has fallen, but with significant variation between firms (Chart D11). Firms whose capital and funding position have enabled them to grow market share have been more able to benefit from higher new lending margins.
Overall, as was shown in Section B.1, total net interest margins of the five major UK-owned banks have not changed significantly. Beneath this aggregate picture, however, firms have had to manage a complex and varied set of changes in specific lending and deposit margins and some specific categories of firms, such as some building societies, have been more challenged than others.
FSA-PRO-2011 Text.indd 85 15/03/2011 23:27

Prudential Risk Outlook 2011Section D – The low interest rate environment
86
JOB: FSA-CRO-2011 | Page 86 | Proof 1 Mar-15-11 JOB: FSA-CRO-2011 | Page 87 | Proof 1 Mar-15-11
Inde
xChart D12: Nominal yield slope, standardised by volatility
1970 1974 1978 1982 1986 1990 1994 1998 2002 2006 2010-10%
-5%
0%
5%
10%
15%
20%
Chart D13: Sterling swaption prices
Impl
ied
vola
tility
5 year swap, 5 years ahead 5 year swap, 2 years ahead
10%
12%
14%
16%
18%
20%
22%
24%
Jan08
Apr08
Jul08
Oct08
Jan07
Apr07
Jul07
Oct07
Jan09
Apr09
Jul09
Oct09
Jan10
Apr10
Jul10
Oct10
Jan11
Sources: Bank of England, FSA calculationsNote: Nominal yield slope is estimated as the absolute difference between the 10- and 3-year gilt yields. Volatility is estimated as the 12-month, rolling standard deviation of the nominal yield slope.
Source: Datastream
Chart D14: Sovereign bond yields, 10 year
Per
cent
Jan90
Jan92
Jan94
Jan96
Jan98
Jan00
Jan02
Jan04
Jan06
Jan08
Jan10
USUKGermany
2%
4%
6%
8%
10%
12%
14%
Chart D15: New mortgages, by type
Per
cent
Fixed All SVR-linkedTracker
0%
20%
40%
60%
80%
100%
2005 2006 2007 2008 2009 2010
Source: Datastream Source: FSA, Product Sales Database (PSD)Note: Categories are as reported in PSD. ‘Tracker’ refers to mortgages on rates guaranteed to move with the Bank Rate or another index (such as LIBOR); ‘SVR-linked’ refers to mortgages on rates priced relative to banks’ Standard Variable Rate (including discounted and capped products). This chart shows proportions of total value of new mortgages, where product type has been defined, issued in each quarter.
New credit risks encouraged by the low interest rate environmentThe low level of the Bank Rate has contributed to historically high steepness in the sterling yield curve, as interest rates are expected eventually to rise to a more normal level. Making some adjustment for uncertainty around the path of interest rates, the current steepness of the yield curve represents a strong incentive to borrow at short-term or floating interest rates – and a disincentive to extend maturity of funding, as discussed in Section B. Short-term borrowing and lending at a longer-term, fixed rate would establish a ‘carry’ position on the yield curve (Chart D12). Historical experience during previous periods of monetary tightening, such as in 1994, shows that such positions involve significant risk. Market indicators of interest rate risk – such as prices of swaptions – also suggest that risks are currently high (Chart D13). Despite the steepness of the yield curve, long-term interest rates remain at low levels by historical standards, although they have been rising since mid-2010 (Chart D14). There is a risk that rising short-term rates will trigger a significant increase in long-term rates.
The steep yield curve provides a strong incentive
to borrow short-term or at floating rates…
FSA-PRO-2011 Text.indd 86 15/03/2011 23:27

JOB: FSA-CRO-2011 | Page 86 | Proof 1 Mar-17-11
Prudential Risk Outlook 2011Section D – The low interest rate environment
87
JOB: FSA-CRO-2011 | Page 87 | Proof 1 Mar-17-11
0%10%20%30%40%50%60%70%80%90%
100%
Chart D16: Regulated mortgage sales broken down byloan-to-income bands
Sha
re
>=0.5 <1 >=1 <1.5 >=1.5 <2>=2 <2.5 >=2.5 <3 >=3 <3.5<0.5
2005(Q2-Q4)
2006 2007 2008 2009 2010(Q1-Q3)
>=3.5 2010 (to Q3)20092007
0 10 20 30 40 50 60 70 80Debt service ratio
Chart D17: Debt-service ratios associated with newvariable-rate mortgages
Pro
porti
on o
f Mor
tgag
es
0%
1.0%
2.0%
3.0%
4.0%
5.0%
Source: FSA, Product Sales Database Source: FSA, Product Sales Database and FSA calculations
Firms are, to some degree, constrained in their ability to take large positions on the yield curve by capital requirements for interest rate risk and by liquidity regulations (see Section B). For example, current FSA regulations require banks to evaluate the effect on their banking books of a sudden and unexpected change in interest rates of 200 basis points both upwards and downwards. Firms should also be running a range of interest rate stress scenarios on their trading books, including historical scenarios (e.g. 1994 bond market sell off), hypothetical scenarios and point-of-weakness stress tests, designed to stress risk factors where a bank has a significant exposure.
Even if they do not take on significant interest rate risk themselves, however, firms may face higher credit risk if their customers have become more exposed to rising interest rates. In a variety of ways different customer groups may have sought to gain benefit from very low short-term variable rates, but at the expense of greater risk exposure:
• Clients with trading operations, such as hedge funds and other financial institutions may have taken carry positions deliberately;
• Many companies have sought to reduce their immediate debt servicing costs by borrowing short term or swapping long-dated funding to floating rates using interest rate swaps; and
• UK households have clearly been switching towards variable rate products in the mortgage market (Chart D15), as the steepness of the yield curve has translated into a wide margin between fixed and variable rates.
In addition, low short-term interest rates increase the risk that customers seek, and firms accept, unsustainable levels of total indebtedness:
• Banks may be tempted by low interest rates to show excessive forbearance towards distressed customers, given the reduced economic impact of interest income foregone. That may store up future loan loss problems. Sections C2 and C3 discussed this risk in UK household and commercial real estate lending.
• Households may be tempted by low debt servicing costs to stretch their income leverage. In the UK mortgage market, the percentage of new loans at more than 3.5 times income was as high in 2010 as at the pre-crisis peak (Chart D16). For the time being, extremely low mortgage interest rates have made high loan-to-income mortgages appear affordable. But lenders need to be sure that such mortgages will remain manageable for borrowers when interest rates normalise.
…potentially exposing firms to
greater credit risk if interest rates
rise more rapidly than expected

Prudential Risk Outlook 2011Section D – The low interest rate environment
88
JOB: FSA-CRO-2011 | Page 88 | Proof 1 Mar-15-11 JOB: FSA-CRO-2011 | Page 89 | Proof 1 Mar-15-11
2% incremental stressBase
0 10 20 30 40 50 60 70 80Debt Service Ratio
Chart D18: Debt-service ratios of variable-rate mortgages issued in2010 (to Q3), and after a 2% rise in interest rates
Pro
porti
on o
f Mor
tgag
es
0%
1.0%
2.0%
3.0%
4.0%
5.0%
Chart D19: Relationship between debt-service ratios on mortgages originated in 2005-9 and impairment (as of August 2009)
Pro
babi
lity
of Im
pairm
ent
0%
4.0%
3.0%
2.0%
1.0%
5.0%
6.0%
7.0%
8.0%
9.0%
0% 5% 10% 15% 20% 25% 30% 35% 40% 45% 50% 55% 60%
Debt Service Ratio
Source: FSA, Product Sales Database and FSA calculations Source: FSA, Product Sales Database, CML and FSA calculationsNote: Debt service ratio is the ratio of annual payments to annual income (after tax and national insurance contributions).
0%10%20%30%40%50%60%70%80%90%
100%
0%1%2%3%4%5%6%7%8%9%10%
Chart D20: Margin on tracker mortgages sold
Sha
re o
f new
loan
s
Bank R
ate
1% or less over base
2005 2006 2007 2008 2009 2010
2.1 - 3% over base1.1 - 2% over base>3% over base
Bank base rate (avg over qtr)
Source: FSA, Product Sales Database (PSD); Bank of England, BankstatsNote: Initial gross interest rate is an optional reporting field; tracker mortgages where initial gross interest rate was reported range from 36–78% of those sold in each quarter. PSD mortgages sold are reported per quarter so an average Bank Rate over each quarter was calculated in order to establish margin.
High levels of variable rate borrowing create vulnerability to interest rate increases. In the mortgage market, for instance, the distribution of debt servicing ratios (DSRs) for variable rate mortgages shifted towards safer lower levels in 2009 and 2010 compared with pre-crisis years (Chart D17). But future increases in interest rates would significantly raise these debt burdens (Chart D18). Given that arrears levels are correlated with DSRs (Chart D19), this suggests that arrears might rise as variable rates increase. Borrowers who have taken out Bank Rate ‘tracker’ mortgages over the past two years at higher margins than before the crisis may be particularly vulnerable (Chart D20).
Rising interest rates, however, will not feed through mechanically to equivalently higher mortgage interest rates for all borrowers. As explained above, the reductions in the Bank Rate did not affect borrowers and lenders uniformly and rising rates will have a similarly differentiated effect. For new borrowers, competition may well lead to narrowing spreads on new ‘tracker’ mortgages (and may also affect spreads on new fixed-rate deals) as the Bank Rate rises and to the extent that banks are able to rebuild deposit margins. Spreads may not fall to pre-crisis level but they seem likely to decline from the levels of over 200 basis points seen in recent years (Chart D20).
FSA-PRO-2011 Text.indd 88 15/03/2011 23:27

JOB: FSA-CRO-2011 | Page 88 | Proof 1 Mar-16-11
Prudential Risk Outlook 2011Section D – The low interest rate environment
89
JOB: FSA-CRO-2011 | Page 89 | Proof 1 Mar-16-11
For existing customers, SVRs, which fell less than the Bank Rate on the way down, may rise less than the Bank Rate on the way up: the position of existing customers with higher-margin Bank Rate trackers will therefore depend on whether these trackers revert to an SVR basis after a period of time. Even if they do not, good credit quality customers may be able to avoid paying high margins above the Bank Rate by remortgaging, and the scale of remortgaging activity is likely to increase if spreads on new deals narrow. In aggregate, therefore, debt servicing costs relative to income are likely to increase somewhat less than a mechanical calculation of the impact of a rising Bank Rate might suggest.
The impact is, however, likely to vary considerably by customer segment. In particular less-creditworthy borrowers may be unable to re-mortgage and benefit from possible narrower spreads on new deals. The tighter credit conditions around high LTV loans in combination with house price falls has meant that many borrowers have insufficient equity in their home to enable them to re-mortgage or trade up – they are so-called ‘mortgage prisoners’. It is possible therefore that some of the least creditworthy borrowers will be most exposed to rising interest rates.
Credit exposures on interest rate swapsOne source of credit risk that may decline as interest rates rise – but remains significant as long as rates remain low – is counterparty exposure on uncollateralised interest rate swaps. Falls in long-term swap rates over recent years have left firms with large credit risk exposures to counterparties on existing swaps, on which they are receiving fixed rates. If one of these counterparties were to default, the firm would face a loss when it replaced the existing swap in the market at current lower rates. Financial firms typically provide collateral to mitigate this counterparty credit risk or they trade through a central counterparty clearing house. But swaps with non-financial corporate or sovereign customers are not normally collateralised, creating a direct link between interest rate risk and credit risk.
Swap-related credit exposures to companies in the heavily-indebted commercial property sector are a particular problem for some firms (see Section C). A number of firms also have sizeable long-term swap exposures to certain sovereigns. In these cases, firms typically look to hedge some or all of the counterparty credit exposure dynamically using credit default swaps or other instruments (so-called ‘credit value adjustment’, or CVA, hedging), so that changes in long-term interest rates can have a secondary impact on those credit market prices.
Key messages to firms
• In their stress testing of both banking and trading books, firms should prepare for a range of interest rate scenarios, including historical scenarios (e.g. 1994 bond market sell off), hypothetical scenarios and point-of-weakness stress tests, designed to stress risk factors where a bank has a significant exposure.
• In their credit assessments, firms should assess the vulnerability of their customers to rising interest rates.
Out-of-the money swaps could be
another source of credit risk
FSA-PRO-2011 Text.indd 89 16/03/2011 11:19

Financ ial Ser v ices Author it y
Financ ial Ser v ices Author it y
Financ ial Ser v ices Author it y
Financ ial Ser v ices Author it y
Prudential Risk Outlook 2011 Financial Services Authority
The Financial Services Authority25 The North Colonnade Canary Wharf London E14 5HSTelephone: +44 (0)20 7066 1000 Fax: +44 (0)20 7066 1099Website: www.fsa.gov.ukRegistered as a Limited Company in England and Wales No. 1920623. Registered Office as above.
PUB REF: 004040
Prudential Risk Outlook
2011