Embed Size (px)
Citation preview

RISK MANAGEMENT IN BOT PROJECT
by
Hsu-Hsun Hsiao
B.S. Civil and Environmental EngineeringNational Taiwan University, 1996
SUBMITTEDENGINEERING
TO THE DEPARTMENT OF CIVIL AND ENVIRONMENTALIN PARTIAL FULFILLMENT OF THE REQUIREMENTS FOR THE
DEGREE OF
MASTER OF SCIENCE IN CIVIL AND ENVIRONMENTAL ENGINEERINGAT THE
MASSACHUSETTS INSTITUE OF TECHNOLOGY
May 2000
© 2000 Hsu H Hsiao. All rights reserved.
The author hereby grants to MIT permission to reproduce and to distribute publicly paper and electronic copiesof this thesis document in whole or in part.
Signature of Author.......Department of Civil and Environmental Engineering
Certified by..,...Lecturer Massood V. Samii
Thesis Supervisor
I,
Accepted by....... ..... ....................................... .................. . ............Daniele Veneziano
Professor of Civil and Environmental EngineeringChairman, Department Committee on Graduate Studies

RISK MANAGEMENT IN BOT PROJECT
by
Hsu-Hsun Hsiao
Submitted to the Department of Civil and Environmental Engineeringin partial fulfillment of the requirements for the Degree of Master of
Science in Civil and Environmental Engineering
Abstract
With the growing demand of public services and the tight budget on government,BOT is one of the best alternatives to solve this problem. However, in order to createa successful BOT project, it is necessary to clearly identify, evaluate and manage therisk associated with the project.
First, the concept of risk and the risk management system is introduced. The firstmain objective is to create a risk management model. By applying this model, therisk associated with BOT project is identified by different phases of the project andthe methods used to allocate and mitigate the risk from different parties' perspectivesare also proposed.
Two case studies are discussed in the order that the first one, Hong Kong CrossHarbor Tunnel Project, is the base case to verify and reexamine our model. Thesecond one, Taiwan High Speed Rail Project, is an on-going project but fails to meetits requirement at the initial stage.
Based on the two case studies, the answer to the creation of a successful BOT projectis that an active participation of government in risk sharing is necessary.
Thesis Supervisor: Massood V. Samii
Title: Lecturer of Civil and Environmental Engineering

Acknowledgment
I would like to thank many people for helping me accomplish my thesis. First of all, Iwould like to thank Professor Massood Samii. It is his best instruction and assistance thatI am able to complete this thesis. Besides, I would like to thank all my friends who havehelped me edit the paper and supported me at MIT. Finally, I would like to give greatestappreciation to my parents. It is their warmest supports that give me the best life in MIT.

Table of Contents
Abstract 2
Acknowledgment 3
Chapter 1 Risk Management 9
1.1 Introduction 9
1.2 Basic Concepts of Risk 12
1.2.1 Defining Risk and Uncertainty 121.2.2 Risk Criteria 141.2.2.1 Normative Approach 141.2.2.2 Descriptive Approach 191.2.3 Normative and Descriptive Approaches: A comparison 221.2.4 Other Criteria 23
1.3 Risk Management 30
1.3.1 Risk Management Overview 301.3.2 Risk Management Framework 311.3.2.1 Risk Identification 321.3.2.2 Risk Classification 361.3.2.3 Risk Analysis 421.3.2.4 Risk Response 471.3.2.5 Risk Attitude 50
Chapter 2 Risk in Build-Operate-Transfer Project 51
2.1 An Overview: BOT Concept 51
2.1.1 Introduction to BOT 512.1.2 History Background: How the Concept Evolved 522.1.3 Current Market 56
2.2 Contractual Organization 60
2.3 Project Financing 62

Defining Project FinancingSources of Finance
2.4
2.4.12.4.22.4.32.4.42.4.52.4.6
Chapter 3
3.1
3.2
Chapter 4
4.1
4.1.14.1.2
4.2
4.2.14.2.24.2.3
Chapter 5
5.1
5.2
5.3
Risk Analysis
IntroductionTypes of Risks in BOTDevelopment PhaseConstruction PhaseOperation PhaseOn-going Risk
Case Study: Hong Kong Cross Harbor Tunnel
Project Background
Project Analysis
Case Study: Taiwan High Speed Rail Project
Introduction
Project BackgroundProject Development
Risk Analysis
ProblemsRisk AllocationSummary
Conclusion: Role of Government
Passive Role: Owner as Regulator/Inspector
Active Role: Owner as Facilitator/Guarantor/Investor
Summary
2.3.12.3.2
70
707071727576
79
79
80
86
86
8687
91
919297
99
100
101
103

List of Figures
Figure 1.1 Overrun of actual cost compared with cost estimated 11at time of appraisal
Figure 1.2 Overrun of project completion times 12
Figure 1.3 Three Types of Utility Function Curves 18
Figure 1.4 Prospect Theory Type Value Function 21
Figure 1.5 Mean-Variance Criterions 24
Figure 1.6 The Risk Management Framework 32
Figure 1.7 Risk Identification 33
Figure 1.8 Risk Classifications 36
Figure 1.9 The Risk Hierarchy 39
Figure 1.10 Spider Diagram 44
Figure 1.11 Cumulative Frequency Curve 46
Figure 1.12 Performance Bond for Risk Transfer 49
Figure 2.1 Private Infrastructure Projects by Sectors, 1984-1995 58
Figure 2.2 Contractual Structures of a typical BOT 61
Figure 3.1 Distribution of Revenue 82
Figure 4.1 An Interest Rate Swap 95

List of Tables
Table 1.1 A simple illustration of EV rule 15
Table 2.1 Telecommunication Projects with Private Participation in 58Developing Countries by Region, 1990-1998
Table 2.2 Top ten Private Infrastructure Projects, 1984-1995 59
Table 2.3 Resources for Finance 69
Table 2.4 Types of risks by phases 70
Table 2.5 Summary of BOT Project Risk 77
Table 3.1 Details of the Hong Kong Cross Harbor Tunnel project 80
Table 3.2 Predicted and Actual Traffic Flows for Hong Kong 84Cross Harbor Tunnel
Table 4.1 Timetable for the development of HSR project 90
Table 4.2 Role of Government in Risk Sharing Mechanism of 98THSR Project

1 Risk Management
In this chapter, before we start with the risk management in BOT project, a
general overview of the basic concept of risk and the techniques we use to quantify the
risk will be discussed. Finally, the framework of constructing a risk management system
will be illustrated step by step given different types of risks.
1.1 Introduction
What is risk? The Oxford English Dictionary tells us that risk is "Hazard, chance
of, or of bad consequences, loss." Not until the mid 17 th century, did the word "risk"
enter the English language'. The dictionary definition may satisfy notion scientists when
they talk about risk, but it is too narrow when also looking at risk taking. Risk and risk
taking, both forming the basis of risk management, can be viewed from a multi-
disciplinary perspective. Several studies have attempted to discuss this issue. Yates and
Stone (1992) looked at the elements that can be the building blocks of risk constructing.
Psychologists examined the personality correlates to risk (Kogan and Wallach, 1964).
Researchers in economics (Knight, 1921), sociology (Heimer, 1988), and management
(Sitkin and Pablo, 1992) have examined the role of risk in each specific area. In that
spirit, this thesis mainly focuses on the application of risk management in BOT project.
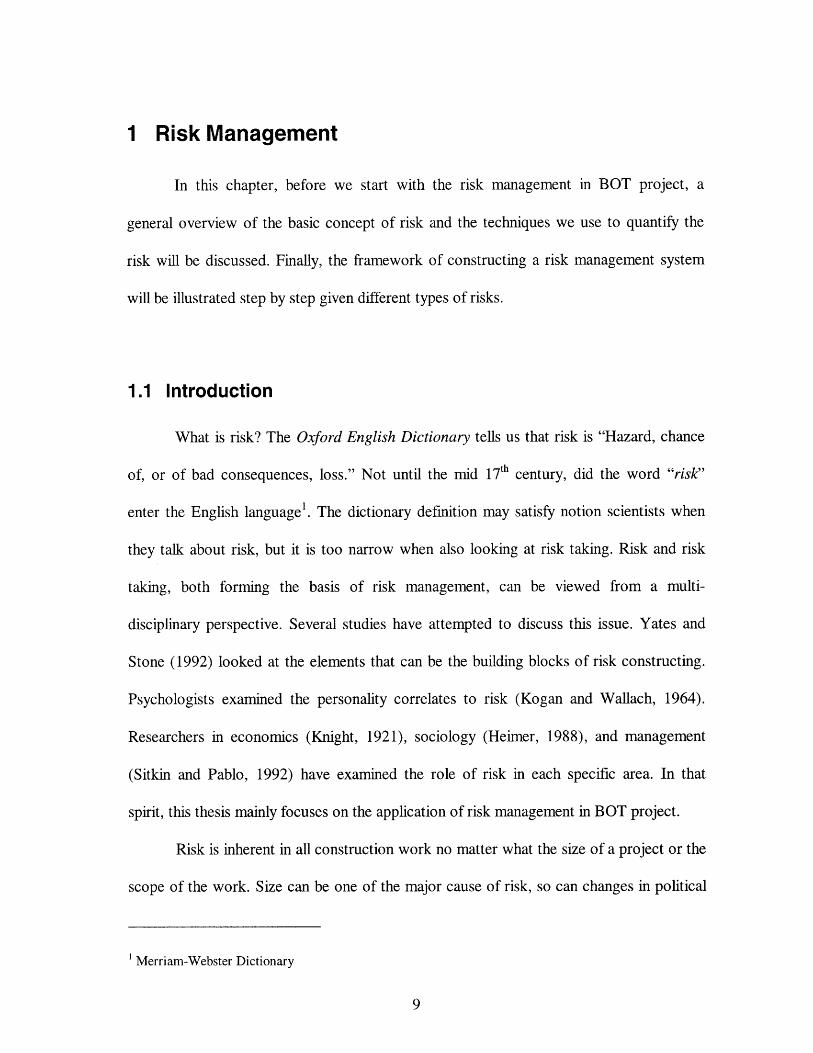
Risk is inherent in all construction work no matter what the size of a project or the
scope of the work. Size can be one of the major cause of risk, so can changes in political
1 Merriam-Webster Dictionary

or economic planning. Other factors carrying risk with them include the complexity of
the project, location, speed of construction and familiarity with the type of work. The
evidence of many projects all over the world reveals that these risks are not being
adequately dealt with. Figure 1.1 and Figure 1.2 shows that the extent of cost and time
overruns of project financed by the World Bank reviewed between 1974 and 1988.1
Among the 1778 projects reviewed during this period, 63% of them with cost overruns
and 88% with time overruns.
Time and cost overruns can invalidate the economic case for a project, turning a
potentially profitable investment into a loss-maker. Targets are sometimes missed
because of unforeseen events that even an experienced project manager cannot anticipate.
More often it happens because of events that are predictable in general, but not in specific
terms. For example, industrial disputes, delayed decision or unexpected ground
conditions may all be anticipated, but likelihood and impact are hard to predict with any
precision, as no two construction projects are the same.
No matter in commercial or manufacturing industry, risk is endemic to all
investment decisions. Through out the decision-making process, an important factor that
always goes hand in hand with risk is return. In other words, each investor, faced with
different risk/return profile, has his own attitude to risk. For example, the investor can opt
for a risk-free investment by purchasing government short-term treasury bills securities
issued at a lower fixed rate of return than other long-term securities. Investors in financial
market recognize that risk play an important role in their allocation of assets across
diversified portfolio. It is crucial to estimate the volatility of each asset along with its rate
World Bank, "Annual review of project performance results", 1990
10

of return since merely given expected return will not provide sufficient information for
the investor to evaluate the decision.
The two most important questions are whether the returns on the project justify
the risks, and the extent of the loss if everything goes wrong. Clearly, the decision-
maker's perception of risk is more likely to be influenced by the probability of loss and
the amount of that loss than by a variance in gamble. In order to achieve a sound
decision, several techniques are applied to quantify risk as an aid to decision-making
process. These techniques must be based on a proper understanding of both the terms
involved and the basic concepts. In the next section, these basic concepts forming the
foundation of risk management and the criterions to quantify risk are discussed.
Figure 1.1 Overrun of actual cost compared with cost estimated at time of appraisal
ou -
c-
. 50-0
O
0 40-0e-r
, 30
E 20-
10-
74 75 76 77 78 79 80 81 82 83 84 85 86 87 88
Year of Project Review
(Resource: World Bank)

Figure 1.2 Overrun of project completion times
I I I I I I I 1 1
74 75 76 77 78 79 80 81 82 83
Year of Project Review
I I I I I 1
84 85 86 87 88
(Resource: World Bank)
1.2 Basic Concepts of Risk
1.2.1 Defining Risk and Uncertainty
The environment in which decision-making takes place can be divided into three
types':
o Certainty
o Risk
o Uncertainty
Certainty exists only when one can exactly specify what will happen during the
period of time covered by the decision. In other words, certainty means where each action
1 Luce R. Duncan, Raiffa Howard, "Games and Decision; introduction and critical survey," 1957
80 -
70 -
60 -
50 -
............................ .......................... ................... /....I.................. ..

is known to lead invariably to a particular outcome. This does not, of course, happen very
often in construction industry.
It can be sure that certainty has a major difference between the other two types.
There's much ambiguity among the concept of risk and uncertainty. Based on a general
consensus, it is believed that each action in a risky situation leads to several known
outcomes, each of which occurs with a specific probability. For example, flipping a fair
coin gives an analogous illustration of risk. A person knows what the outcomes are, as
well as their probabilities, though she cannot be certain about what the exact outcome is.
Uncertainty, by contrast, might be described as a situation in which there are no
information or historic data relating to the situation. In other words, no one has idea about
the probability of each outcome. Buying a particular stock in NYSE can be exemplified
as a case for uncertainty. Someone knows that the stock price may either go up or down
tomorrow, however, she cannot be certain about the probability of any of these outcomes.
A company has to operate in an environment where there are many uncertainties.
The aim is to identify, analyze, evaluate and operate on risks. Accordingly, the company
is converting uncertainty to risk. Furthermore, as we think more about uncertainty and
risk, we would find out that risk is a more relevant term in construction project. As a
result, throughout this thesis we confine ourselves to using risk to encompass uncertainty.
A risky situation is, therefore, one in which the decision maker is not sure which
outcome will occur. This uncertainty may lead to an erroneous choice, and eventually, a
loss. So, several criterions are used to evaluate and quantify risk in order to make a sound
decision. Typically, risky choice can be classified as being part of the normative and

descriptive approach'. The normative approach suggests some rules for choice under risk.
The term normative implies that the suggested rule is the best under certain
circumstances and, thus, tells people how they should make choices under risk. The
descriptive approach takes a different way. Instead of telling decision makers how they
should make choices, it looks at the ways people actually make decisions in situation
involving risk and tries to come up with models that describe what they do.
1.2.2 Risk Criteria
In this section, some of the most important criteria of making choices under risk
are discussed here by grouping all of these into three categories:
" Normative Approach
" Descriptive Approach
o Other Approach
Basically, both normative and descriptive approaches provide some reasonable
criterions when making choices under risk. But as we will see later, people often do not
behave according to the rules suggested by normative approach.
1.2.2.1 Normative Approach
There are two main normative rules for choice under risk:
o The Expected Value Rule
o The Expected Utility Rule
Zur Shapira, "Risk Taking: A Managerial Perspective", 1995

1.2.2.1.1 The Expected Value (EV) Theory
Statistical decision theory suggests that expected value (EV) is the best rule for
choice under risk (Raiffa, 1968). A simple game situation will illustrate this criterion.
Suppose someone is playing a game of tossing a fair coin. He is to guess what side the
coin will fall on. If he guesses correctly, he will win $10, but if he is wrong, he will get
nothing. The question is: How much is he willing to pay for participating in the game?
We can get the answer by setting up a payoff matrix as below:
Table 1.1: A simple illustration of EV rule
Outcomes Probability Payoff Expected Value (EV)
Head 0.5 $10 EV= $10*0.5=$5
Tail 0.5 $0 EV=$0*0.5=$0
The answer is $5 by adding up the expected value from all possible outcomes. To
rephrase the rule more precisely: Multiplying the payoff of each outcome by its specific
probability of occurrence and adding the products.
EV = ,[piMi(xi)]
pi: probability distribution of each outcome
Mi(xi): function of outcome x denoted by I
Under the criterion of expected value, the decision maker's option is based on the
rule:
Strategy option = MAXi {EVi)

The above example is very simplistic, but it shows that the most important crucial
factor that must be analyzed is the probability distribution. If the factor is not realistic
then the complete analysis will give the wrong information. Furthermore, people's
decision-making in the risk environment is not always consistent with the theory of EV.
This is because the principle objection to using EV maximization is that it ignores the
attitude to risk. According to Daniel Bernoulli's study in 1738 known as the St.
Petersburg Paradox, he postulated that, when approaching risky choices, people do not
simply use the face value rule of outcomes (such as expected value). Rather, they use
some psychological value of these outcomes, which he termed the utility of outcomes. We
will discuss this in the later section.
Summary of the steps involved in calculating the expected value (EV) theory
1.2.2.1.2 The Expected Utility (EU) Rule
The expected utility rule is a simple transformation of the expected value rule. It
is still a summation of probabilities times their respective values, except that the values
are subjective values called utilities, rather than the actual monetary values. The utility
function is depicted in the form of a curve with the utility scale on the vertical axis and
16
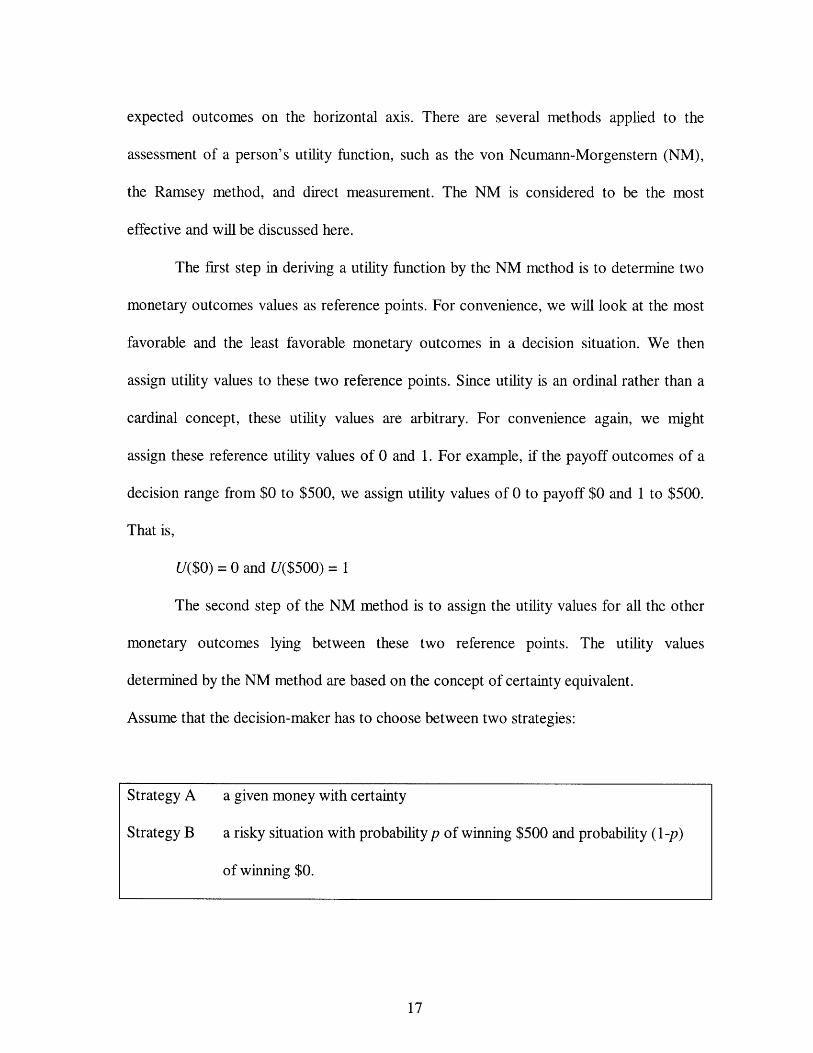
expected outcomes on the horizontal axis. There are several methods applied to the
assessment of a person's utility function, such as the von Neumann-Morgenstern (NM),
the Ramsey method, and direct measurement. The NM is considered to be the most
effective and will be discussed here.
The first step in deriving a utility function by the NM method is to determine two
monetary outcomes values as reference points. For convenience, we will look at the most
favorable and the least favorable monetary outcomes in a decision situation. We then
assign utility values to these two reference points. Since utility is an ordinal rather than a
cardinal concept, these utility values are arbitrary. For convenience again, we might
assign these reference utility values of 0 and 1. For example, if the payoff outcomes of a
decision range from $0 to $500, we assign utility values of 0 to payoff $0 and 1 to $500.
That is,
U($0) = 0 and U($500) = 1
The second step of the NM method is to assign the utility values for all the other
monetary outcomes lying between these two reference points. The utility values
determined by the NM method are based on the concept of certainty equivalent.
Assume that the decision-maker has to choose between two strategies:
Strategy A a given money with certainty
Strategy B a risky situation with probability p of winning $500 and probability (1-p)
of winning $0.

To determine a certainty equivalent of strategies A and B, we can change the
parameter values of either strategies until a certainty equivalent is obtained. For
convenience, assume the p = 0.5 and (l-p) = 0.5. When the certain money of strategy A
reaches $100, it makes the decision-maker indifferent between strategies A and B. Its
utility equates to the expected utility of strategy B:
U($100) = p*U($500) + (1-p)*U($0) = 0.5*1 + 0.5*0 = 0.5
So forth and on, we can calculate the values lying between U($500) and U($100)
in the same way and then plot all these utility values versus the payoff outcomes to form
the utility function curve.
The utility function of a person serves as a measure of that person's risk
tendencies. In general, utility curves can be grouped into three categories as shown in
Figure 1.3, dependent on whether the decision-maker is a risk-seeking, risk-neutral, or
risk-averse person. A linear function describes a risk-neutral person a concave function, a
risk-averse person; and a convex function, a risk-seeking person.
Figure 1.3 Three Types of Utility Function Curves
.4 'i ,I U
100
80
S60
40
20
0
-A: Risk Averter's
- -- B: Risk Neutral's
- - - - - -C: Risk Lover's
0 5 10 15 20 25
Payoff

Curve A illustrates the utility curve of an individual who always takes certain
money as the priority. He is risk averse.
Curve B represents the behavior of a person who is neutral to risk. He is
indifferent to between certain and uncertain money.
Curve C shows the utility function of a risk seeking individual, who is willing to
take gambles rather than a certain payoff.
It should be noted that, in many cases, precise objective probabilities are not
available. For instance, there is no probability for the price of any security traded on, say,
NYSE on the next day. If someone wishes to use expected utility rule, the probability
distribution has to be estimated. Such estimation can only be subjective.
Both EV and EU rules are decision criteria used for risky options. EV is a simple
method since it is easy to use and understand. However, the disadvantage of EV is that it
ignores attitude to risk. Both EV and EU rule can guarantee the same result only if the
decision-maker is risk-neutral.
1.2.2.2 Descriptive Approach
In many situations the amount of data required for making a rational choice may
be overwhelming. For instance, there are over 1,700 securities in New York Stock
Exchange, whose prices are changing all the time. Several methods have been developed
to solve this problem. The most well known of these is prospect theory.
1.2.2.2.1 Prospect Theory
Kahneman and Tverskichy (1979) developed a model of choice under risk that
accounts for paradoxes described earlier. They illustrate the theory by conducting the
19

following experiment. People have to choose which game they prefer in both situation 1
and 2.
Situation 1
Gamble A: sure win of $400
Gamble B: 50% chance of winning $1,000
50% chance of winning $0
Situation 2
Gamble C: sure loss of $400
Gamble D: 50% chance of losing $1,000
50% chance of losing $0
Most people prefer Gamble A over Gamble B, and Gamble D over Gamble C.
Situation 1 depicts risk aversion and situation 2, risk seeking. Kahneman and Tversky
(1979) thus proposed prospect theory to account for this pattern of risky choice.
Prospect theory has three important elements to it: a value function that plays the
role of a utility function, a decision weights function that plays the role of probabilities,
and an editing rule. Uncertain prospects are characterized by the value function and the
decision weights and summed up in a similar way to expected utility.
The value function is shown in Figure 1.4. It has three characteristics. First, it
defines values as deviations from a certain reference point. Second, both gains and losses
diminish in value, suggesting that people are more sensitive to changes around the
reference point. Third, it is steeper for losses than for gains, reflecting the assumption that

people are more sensitive to losing a certain amount than to gaining the same amount. A
major aspect of the value function is the reference point. Although, in general, many
points can play the role of a reference, Kahneman and Tervsky proposed that the asset
position also plays the role of adoption level, hence implying an almost instantaneous
adjustment to a new asset position. Thus, wealth does not matter much, because if a
person wins 1 million, she will immediately adapt to this new wealth and respond in a
risk-averse manner to the gambles in Situation 1 and respond in a risk-seeking manner in
Situation 2. Kahneman and Tervsky argued that changes in wealth are a more important
determinant of risky choice than the absolute value of wealth. That is, within a very wide
range of options, a millionaire and a poor person would respond in a similar way to the
gambles in the situations just described.
Figure 1.4 Prospect Theory Type Value Function
0
Gains & Losses
An important feature of prospect theory is the editing rule. Given a choice
between risky alternatives, decision-makers edit the choice problem until they arrive at a
3
simple choice between edited alternatives that can be compared in either the domain of
gains or the domain of losses.
1.2.2.3 Normative and Descriptive Approaches: A Comparison
The normative approach to risky choice emphasizes the statistical basis for
decision-making. When there are large samples of repeated events, expected values
provide the most sound summary statistic for choice under risk. In the expected value
formula, the most likely outcome gets the highest weight, and the least likely outcome
gets the lowest weight. Furthermore, utility theory proposes that the subjective value of
outcomes be calculated, and, following Savage's (1954) suggestion, subjective
probabilities are entered instead of objective ones.
The descriptive approach stems from the studies that people do not always follow
the normative rules toward risky choice. Instead, descriptive approach uses decision
weights rather than probabilities. It also suggests that decision-maker edit the choice until
the alternatives can be compared in terms of gains or losses.
Around 1970, evidence has been growing of the incompatibility of the two
approaches. The normative approach tells people what they should do, whereas the
descriptive approach is an attempt to get an account of what people actually do. Several
studies from Raiffa and Tervsky suggested that only through developing normative,
descriptive, and perspective models of choice could improvements in decision-making be
achieved.

1.2.2.4 Other Criteria
In this section, we are going to discuss about some risky choice criteria which can
not be grouped into either normative or descriptive approaches but still play an important
role for decision-making. As we may know, it is sometimes unrealistic to use one rule of
thumb toward risk decision, as we can see from the contradiction between normative and
descriptive approaches. In addition to the elements we pointed out previously to evaluate
risky situation, here are some other rules, which are considered as important as well by
decision-makers.
1.2.2.4.1 Mean-Variance (M-V) Criterion
A basic characteristic of risk is volatility. For example, the Dow Jones Industrials
Index goes up and down in a pattern that cannot be predicted. The changes in this index
create a distribution that implies risk. This volatility, in other words, risk, is measured by
the variance of the distribution. It is the expected value of the squared deviations from
the expected return. Symbolically,
Variance = o = ,pri [ri - E(r)]2
Whereas,
pri: probability of each scenario i,
ri: return on each scenario i,
E(r): expected return on all scenarios.
Indeed, the concept of variance is the cornerstone in the mean-variance approach
to the analysis of decision under uncertainty.' This approach suggests that, in choosing
Harry Markowitz, "Portfolio Selection", Journal of Finance, March 1952
23

among risky alternatives, people should consider both the expected return and the
variance of the probability distribution over the possible outcomes. The criteria suggest
that, if two alternatives have the same variance, then people should choose the one with
higher expected return. If, on the other hand, the two alternatives have the same expected
return, people should choose the one with lower variance. It can be stated as1: A
dominates B if
E(rA) > E(rB)
and
GA • GB
and at least one inequality is strict.
Given another example to clarify the criterion as shown in Figure 1.5. Assume
that for three projects I, 11, and HI, all having the same expected value but oc > on > oMu.
In this case, project El is preferred to both project I and TI.
Figure 1.5 Mean-Variance Criterions
Zvi Bodie, Alex Kane, Alan J. Marcus, " Risk and Risk Aversion", Investment, 1999
24
~X~

1.2.2.4.2 Certainty Equivalence
Because we can compare utility values to the rate offered on risk-free investment
while choosing between a risky one and a safe one, we may interpret a risky alternative
utility value as its "certainty equivalent" rate of return to an investor. That is, the
certainty equivalent rate of a risky alternative is the rate that risk-free investments would
need to offer with certainty to be considered equally as attractive as the risky alternative.
If, in other words, an individual is offered a choice to decide between a project with
certain net present value, NPV, and the other with expected net present value, ENPV, that
are equal, the one with uncertainty must offer higher return for compensation for risk
bearing.
1.2.2.4.3 Risk Premium
A discount rate reflects the investor's time value of money and the rate of return
the property must earn to justify the investment. Some projects are almost risk free, such
as the case of a tenant prepared to sign a long term lease on a building at the early design
stage, whereas a project which is considered risky will attract a premium to the discount
rate.
The risk premium will be added to the risk free discount rate in order to
compensate for the risk taking. In other words, though investor can put his money in a
risk free security, the riskier investment provides an attractive premium for the investor to
be willing to bear the risk. There is no formula which derives an appropriate risk
premium; each investor has to decide how much risk he wants to take and what premium
is appropriate for him to assume the risk.

The difficulty in choosing the appropriate risk free discount rate is rooted in the
inaccuracy of the term risk free. Financial commitments always carry certain risks which
can be neither eliminated nor transferred. The term risk free is intended to imply not
absolutely absence of all risk, but virtually absence of default risk. In financial term, the
risk free rate is taken as that which would apply if lenders viewed a borrower's credit and
collateral so favorably that they were certain of repayment at the scheduled time.
The determination of the appropriate risk premium is based upon the trade off
between risk and return. The concept of discounting implies that future risk is discounted
more heavily than is near-term risk. A single risk-adjusted discount rate, therefore, is a
poor proxy for the impact of risk on value over the project's lifetime, because risk does
not increase exponentially with the passage of time. Indeed, most uncertainty happened at
the early development and planning stage. Once the construction has been started and the
tenants have been found, the associated risk or uncertainty diminishes. One way to solve
this issue is to use different discount rates for different stages. This is also how we
categorize the risks for BOT project by different phases through out the project's lifetime.
1.2.2.4.4 Risk-Adjusted Discount Rate: NPV Rule
It is tempting to consider the risk premium as the requirement for an additional
rate of return. In other words, it has been suggested that one way of taking risks into
account in investment appraisal is to use risk-adjusted discount rates. A real discount rate
used in the calculation of net present value of a project may be viewed as composed of
three parts: a time value of money, a risk premium and an adjustment for inflation.
The risk premium is added to reflect the investor's view of the degree of
sensitivity of the project to risky factors. The size of the premium depends on the degree
26

of risk associated with project and the investor's attitude toward risk. The greater the risk
is, the greater the premium. The adjusted discount rate consists of these three factors:
rt = rf + RP + i
rt: risk-adjusted discount rate
rf: risk free rate
RP: risk premium
i: inflation rate
After the discount rate has been decided, the net present value of project can be
simply calculated by discounting the cash flows by time span. This is so called the
discounted cash flow (DCF) formula.'
C tPV =C1 + rt
where rt refers to the adjusted discount rate and Ct is the cash flow in the period t. To find
out the net present value we add the initial cash flow (usually negative) Io:
NPV = Io + PV = Io + C
(1 + rt)
If, based on professor Samii's suggestion, we take the tax rate and depreciation into
consideration, we can simply modify the formula as follow:
Ct ta*D StNPV = Io + (1 - ta) ( + rt ( + + (I+r/(i+rte (1+rtt (1+rt
Richard A. Brealey, Stewart C. Myers " Chapter 3: How to Calculate Present Value", Principle of
Corporate Finance, 1996.

C,: net revenue
ta: tax rate
D: depreciation
St: salvage value of the property at the time t
Note that the salvage value is merely calculated at the end of property life time, and the
Ct in each period is the net revenue (revenue minus operating cost). This formula is more
appropriate for our study since most BOT projects do need to consider the factors as
stated in the modified DCF formula.
The decision rule based on the discount rate is that always choose the project with
positive NPV since it provides net profit, taking into account opportunity cost of capital
and the risk of the project.
Although the NPV rule is very useful in modern financial world, there are still
some factors that make it problematic.1 One major problem is that the discount factor is
part of a compounding function, which assumes that the risks associated with future costs
and revenue grows geometrically with time. This assumption is justified on the grounds
that the accuracy of our forecasting decreases with time.
The second issue is the correct projection of cash flow. Over time, external
economic situation may changes variably enough to affect the projection of cash flow.
This can be seen in many of our BOT cases which ended up with totally failure.
The third issue is the correct selection of discount rate. The discount rate usually
reflects the opportunity cost of capital plus a risk premium to compensate for risk
1 Massood V. Samii, Construction Finance, 1998

bearing. The risk premium, by its nature, is very arguable in the way that what value
should be added to the discount rate.
The fourth issue is that the cash flow analysis cannot capture all the benefits that a
project may bring to an organization. It can only capture direct benefits in terms of
revenue generation. Benefits to other divisions of an organization, such as economy of
scope or improvement in a company image, are not included with this method.
Finally, it is doubtful to use only one discount rate through out the whole project
life. This is based on the assumption that the risk in each phase is the same. However, as
we mentioned before, this is not quite true since most uncertainties arise in the
development and planning stage. Once the construction has been undertaken, partial
uncertainties would eliminate and so forth reduce the total risk. For example, there are
more uncertainties for an R&D lab project during the planning phase since no one knows
the chance for new product development. However, once you have a breakthrough in the
development and the new product begins to sell on the market, the relative risks, such as
operation cost, revenue (from negative to positive) are reduced. Assume we use the same
discount rate for both the planning and operation phase, we might probably decline this
profitable proposal.
In brief, we describe the basic rules and concepts to make decision in a risky
situation. But when it comes to the more complex project, we need to manage the risk in
a more systematic way. Typically, a peculiar risk management system is developed to
analyze the risk as well as to quantify it and deal with it. We will discuss this in the next
section.

1.3 The Risk Management System
Attention to risk is essential to ensure good performance, whether you are
managing a company, a project or providing service for your client. The main issue
related to risk management is how we quantify the risk and how to deal with it. There are
many techniques developed to give answer to this issue.
1.3.1 Risk Management Overview
Risk management is not new, nor does it employ black box magical techniques. It
is a system aiming to identify and quantify all the risks to which a project is exposed to so
that a sound decision can be made to manage the risks.
Risk management cannot remove all risks from project; it is not synonymous with
insurance. Its principle aim is to ensure that risks are managed efficiently. The client and
his project manager must recognize that certain risks will remain to be carried by the
client. This residual risk must be allowed for in the client's estimate of time and cost.
Risk management system must be practical, reasonable and cost effective. Risk
management need not be complicated nor require the collection of vast amounts of data.
It is a matter of judgment, common sense, analysis, experience and a willing or gut to
assure the risk.
Effective management of risky projects demands rapid and realistic prediction
about the future expectation and the alternative courses of action of positive decision-
making. It requires flexible attitudes and procedures. We can see from many public
projects that ended up with totally failure simply because of the lack of proper risk
management system. So far, risk management is most frequently used in private sector

projects.' The public sector should follow their example. It is urgent for politicians and
government to notice this issue, and to examine current procedures used in the planning
and implementation of projects, because some of these are causing unnecessary delay,
avoidable cost overrun, and poor performance.
1.3.2 Risk Management Framework
The process of risk
systems in Figure 1.6 which
management system must be
stages are:
Risk identification
Risk classification
Risk analysis
Risk attitude
Risk response
management is broken down into the risk management
shows the sequence for dealing with risk. Naturally the risk
applied to each option under consideration. Generally, the
Identify the source and types of risks
Consider the type of risk and its effect on the person or
organization
Evaluate the consequences associated with the type of risk,
or combination of risks, by using analytical techniques.
Assess the impact of risk by using various risk
measurement techniques
Any decision about risk will be affected by the attitude of
the person or organization making the decision
Consider how the risk should be managed by either
transferring it to another party or retaining it
1P.A. Thompson, J.G. Perry, "Engineering Construction Risk," 1992

Figure 1. 6 The Risk Management Framework
1.3.2.1 Risk Identification
Figure 1.7 shows the factors to be considered in the risk identification phase; the
various aspects are discussed in sequence. It is worth stating that an identified risk is not
a risk, it is a managerial problem. Inevitably, bad definition of a risk will breed further
risk.
When attempting to identify risk, it is rather like trying to map the world. Maps of
the world tend to be centered on the location of the mapmaker. Much of the world is not
visible from where you stand. Some territory which is familiar and obvious to you may
not be so obvious to everyone. Similarly, looking at a large project from the top, with
multiple layers of planning, complex vertical and horizontal interactions, and sequencing

problems, resembles looking into the world map through a fog. Management's ability to
influence the outcome is limited to what they can see. A clear view of the event is the
first requirement, focusing on the sources of risk and the effect of the event.
Figure 1. 7 Risk Identification
TotalDependence
1.3.2.1.1 Sources of Risk
The sources of risk and the effects of risk, which must be clearly distinguished,
are listed below. The sequence is:

Source Event Effect
The main objective is to compile a list of the main risk resources, a description of
their likely consequences, and an approximation of their potential damage on cost and
time. Some risks are controllable, such as a lack of co-ordination between the mechanical
engineering services specialist contractors and the suspend ceiling specialists contractors.
Other risks, such as the risk caused by exceptionally inclement weather, cannot be
controlled, but a contingency provision can be made by considering the worst scenario. It
is not always obvious to think in terms of the source, the event, and the effect. For
instance, the event of a boiler exploding might have been caused by defective design, or
defective workmanship resulting in the project being delayed and costing more. In the
case of late completion of a project the contractor might be liable to pay liquidated
damages and the client suffers the consequential loss.
Controllable and Uncontrollable Risks
Controllable risks are those risks which a decision-maker undertakes voluntarily
and whose outcomes is within our direct control. In contrast, uncontrollable risks are
which we cannot influence.
The distinction between controllable and uncontrollable risks is very important to
construction industry. For instance, a decision-maker would probably assure the risks
associated with the new technology introduced in building. Such risks may be

performance risks, where the true capability of technician is uncertain, or financial risks,
resulting from uncertain installation cost or maintenance expense. However, these risks
can be tolerated if additional benefits or reasonable premium, such as accumulation of
experience, prestige, or favorable financial support are likely to occur. By exploiting
available expertise and through careful planning, we may be able to control the eventual
outcome.
By contrast, uncontrollable risks, such as weather condition, or relative statutory
change, usually result from the sources which the decision-maker is unable to avoid
through existing technology or by any available method.
Dependent and Independent Risks
Two sources of risk in an investment project are dependent if a knowledge of the
magnitude of one, influences the estimates for the other. There may be dependency
between the set of controllable risks and the set of uncontrollable risks. For example, the
expected life of a building component is mainly dependent on its design, the standard of
workmanship, and the quality of materials.
When considering the dependency between risks, there are three types of
dependence:
o No dependence because the variables are mutually exclusive
o Total dependence
o Partial dependence
1 Roger Flanagan, George Norman, "Risk Management and Construction", 1993

1.3.2.2 Risk Classification
There are three ways of classifying risk: by identifying the consequence, type and
impact of risk, as shown in Figure 1.8
Figure 1. 8 Risk Classifications
of Risk

1.3.2.2.1 Types of Risk
Basically, we group risk into two types:
o Market risk, which is common to many assets, is also called systematic
risk or non-diversifiable risk
o Specific risk, which is specific to individual asset, is also called
unsystematic risk, pure risk or diversifiable risk
Nearly all the work classifying the types of risk is related to portfolio theory,
which considers investment in stocks and equities. Such risks are divided into market
risk, which is related to the way general market behaves, and specific risk, which is
specific to a particular company. Almost all shares respond, to some extent, to
movements in the market and this response can be measured by the beta coefficient. For
example, a share with beta coefficient of 1.5 will, on average, move 1.5 % for each 1%
move in the market. This is sometimes called the CAPM model. A diversified portfolio of
such shares would be 1.5 times as variable as the market index. The beta coefficient is
thus a measure of the variability of the portfolio. Specific risk is measured by the beta
coefficient for a particular company's share price against the market or sector share
movement.
According to the portfolio theory, total risk can be reduced by well-diversified
portfolio. But not all risks can be reduced by diversification. The only risk that can be
removed through diversification is the specific risk, which is also called unsystematic
risk or pure risk. This is the risk that is specific to each company. By selecting many well
negatively correlated securities in portfolio, all the unsystematic risk specific to each
company can be cancelled by each other risk affect. However, all the securities in

portfolio are still exposed to the market risk, which is unavoidable in any aspect, such as
interest rates, inflation rate, or exchange rate.
One of the principles of the theory is that investors should not expect to be
rewarded for taking on risks which can be avoided. Instead, they should expect to be
rewarded only for unavoidable or market risk. Thus, portfolio theory is in agreement with
the adage of 'not keeping all your eggs in one basket', since efficient capital markets will
not offer rewards for specific risk.
This argument is valid in the construction industry. Contractors, who diversify
into the various sub-segments of the market such as civil engineering, oil and gas
engineering or public and private, are more resilient to economic shocks. The same is true
for the developer: speculative housing and offices should be complemented with
retirement homes, car parking facilities and so on in different localities.
Moreover, a company systematic risk can be split into two components: business
and financial risk. Business risk is the result of a company trading with its assets,
financial risk arises directly out of the gearing process. Whilst the former is borne by the
equity and debt holders, the latter brings risk only to the equity holders. The tradition that
debt capital has priority over equity capital in both the distribution of the company's
annual net cash flow and in any final liquidation distribution, ensures that the risk of a
reduced or zero dividend is borne only by shareholders. The severity of the financial
market is directly related to the level of gearing.
1.3.2.2.2 Impact of Risk
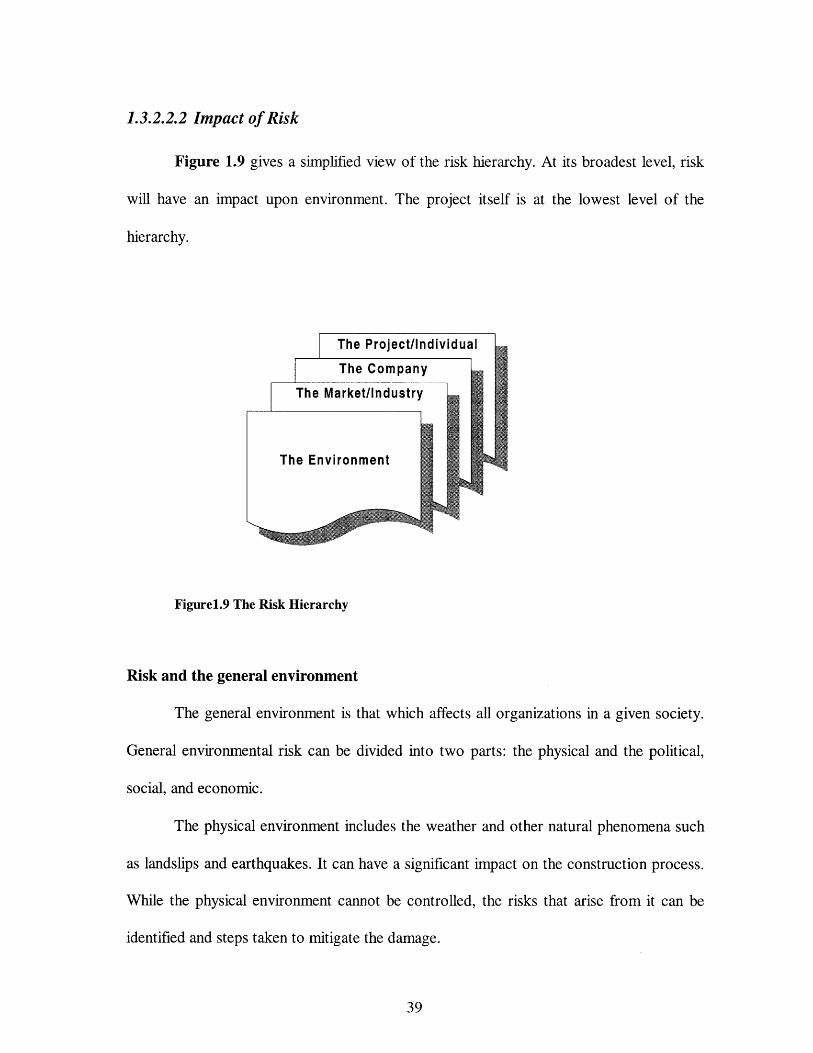
Figure 1.9 gives a simplified view of the risk hierarchy. At its broadest level, risk
will have an impact upon environment. The project itself is at the lowest level of the
hierarchy.
Figurel.9 The Risk Hierarchy
Risk and the general environment
The general environment is that which affects all organizations in a given society.
General environmental risk can be divided into two parts: the physical and the political,
social, and economic.
The physical environment includes the weather and other natural phenomena such
as landslips and earthquakes. It can have a significant impact on the construction process.
While the physical environment cannot be controlled, the risks that arise from it can be
identified and steps taken to mitigate the damage.

The political, social and economic environment is partially controllable. The
government can control events in its own country but not in the world. For example, the
property crash resulted from a property boom followed by falling demand, a rent freeze,
taxation, and a harsh monetary policy. The cause of the environmental risk was
controllable, but only by government, and the effect of on the property and construction
industry was devastating.
Nobody can ignore environmental risks. Although pressure can be brought to bear
upon the government to influence or change decisions, in general, most events are
uncontrollable by the individual or the company. In these circumstances, attention must
be given to evaluating the risk exposure.
The market/industry risk
Market risk relates to any event that might affect the complete industry, such as a
national strike of all building workers. Throughout the developed world, the construction
industry is characterized by its client-oriented service. Typically, the industry contains a
small number of relatively large firms and a very large number of small firms. The
likelihood is that large firms will analyze their exposure in a more systematic way than
small firms.
All companies will want to ensure they maintain their market share of available
projects, be they members of the design or the construction team. This means that they
must constantly evaluate competition and price level. Since they are all interdependent
the reactions of any one firm to market risk may have to take account of the likely actions
of other firms in the industry.
The Company Risk

Any company operates within market. The company will have a number of
current projects at any one time, each project generally being a profit center. Company
risk and project risk are intrinsically linked because the company must provide resources
and assistance to its own project.
To avoid over exposure to many risky projects, some company will form a
separate company for a particular project. For example, the Channel Tunnel is being
undertaken by Transmarche Link which is a special consortium.
Project/Individual Risk
Project risk and company risk are strongly correlated as we mentioned before. But
when analyzing whether a project is feasible or not, the risk involved in the specific
project is not exactly the same to which the company exposed. So, choosing a particular
discount rate, which is different from those used by the company, for the project is
reasonable.
1.3.2.2.3 Consequence of Risk
When considering the consequences of a risk occurring, the relevant factors
relating to effects of the risk are taken into account. Most professionals will tend to rely
upon expert judgment and knowledge, tempered with some information, if it is available,
about past events.
There are many sources of risks where no reliable data are available. Rather than
ignore these sources, the course of action should be considered within the overall risk
management system.
1.3.2.3 Risk Analysis
The most important task of risk management is to analyze risk to provide an
integral solution to decision-maker. A simple method for considering project risks would
be to analyze any risk independent of others, with no attempt to estimate the probability
of occurrence of that risk. The estimated effects of each risk could then be accumulated to
provide total project outcome values.
Another approach, though more complex, greater realism and confidence can be
achieved by applying probabilities to risks and considering the inter-dependencies
between the risks. The two most useful techniques for doing so are sensitivity analysis
and probability analysis, as we will discuss later.
The essence of risk analysis is that it attempts to capture all feasible options and
to analyze various outcomes. By giving specific weighted number to each option,
decision-maker is able to quantify risk and respond to it.
The choice of risk analysis technique to be used should be based on following
factors,
E The type and size of project
o The information available
o The cost of the analysis and the time available to carry it out
o The experience of the analyst
The application of any risk analysis technique requires that the uncertain data can
be given a range of different values. For example, if the duration and costs for specific
activities are uncertain, use a range of values within which the decision maker believes
they are likely to lie.

Most quantitative risk analysis techniques require the speed and accuracy of
computer. With the assistance of computer, many programs are designed for specific
cases and organizations.
1.3.2.3.1 Sensitivity Analysis
Sensitivity analysis is a technique used to consider the effect on the whole project
subject to changes in the value of each risk which is considered to be potentially serious
to the project. In other words, sensitivity analysis is used to identify the impact on the
total of a change in a single risky variable.
The analysis involves repetitive calculation of the effects on the project outcome
of a range value of the variables. Project outcome is usually considered in terms of speed
of construction, final costs or an economic criterion such as NPV or IRR (Internal rate of
return). For example, there are probabilities that the cost on the high-speed railway
station would increase by 5%, 10% and 15%. We are able to recalculate the NPV with
the change in the cost of station then plot the percentage changes in the station costs
against the percentage changes in NPV.
The result of a sensitivity analysis can be shown graphically on a spider diagram
as illustrated in Figure 1.101. This example is based upon analyzing the possible costs to
the contractor of a contract to construct the reservoir. The spider diagram shows the
results of calculating the sensitivity on site. For instance, it indicates that a decrease in
output when grouting can have a significant effect on the overall cost to the contractor.
The sensitivity analysis provides clues to further investigation. It shows the value of
1 Peter Thompson, John Perry, "Engineering Construction Risk", 1992

information regarding variables for a project, which of the parameters should be
considered, and which it might be considered ignored. Evidence has shown that the
consideration of the eight largest risks will typically cover up to 90% of the total. (Porter,
1981). Consequently, the identification of these risks by sensitivity analysis can yield
savings on information and costs. However, there is also a limitation to sensitivity
analysis. Each risk is considered independently with no attempt to quantify their
probabilities of occurrence. Besides, in reality a variable would not change without other
project factors changing, which is the case not reflected in sensitivity analysis.
Figure 1.10 Spider Diagram: Dearden Clough Reservoir, Sensitivity analysiscovering uncertainties in estimated construction cost.
--- --- Tunnel
- Grouting
-Strike
- - - - Tunnel delay
- - - Emabankment
Change in cost of contract: %
o
Cuc_ -oi

1.3.2.3.2 Probability Analysis
As discussed in previous section, there are some limitations to sensitivity analysis.
However, probability analysis overcomes many of the limitations by specifying a
probability distribution for each risk, and then considering the effects on the risks in
combination. The result of the analysis is a range of values in which the final outcome
could lie. An essential step in this type of risk analysis is estimating the range of
probabilities within which the possible outcomes of a given process may occur.
Random sampling is used where calculation of data inserted into an equation
would be difficult or impossible. It is used in a probabilities analysis in the following
way.
L The range of values for the risks being considered is estimated and a
suitable probability distribution of each risk is chosen.
E A value for each risk within its specific range is selected; this value should
be chosen randomly.
o The outcome of the project is calculated combining the values selected for
each risk.
One commonly used technique to construct the probability distribution is by
applying Monte Carlo simulation. It is called Monte Carlo because it makes use of
random numbers to select outcomes. It requires sets of random numbers to be generated
for use in testing various options. Random numbers could be selected in a variety of ways
such as throwing a dice. In reality, using computer program is the most effective way.
In Monte Carlo simulation a large number of hypothetical projects are generated
to reflect the characteristics of the actual project. Each simulation is accomplished by

replacing a risky variable with the random number drawn from the probability
distribution used to describe that variable. It is usual to make at least 100 iterations which
then build up into a frequency distribution for the whole project. Cumulative frequency
curves, as shown in Figure 1.11, are also usually presented as part of the results. From
these it is simple to read off the likelihood that a certain activity will not exceed a given
time or cost.
Figure 1.11 Cumulative Frequency Curve
IUU
00
C-
n
Time/Cost
1.3.2.3.3 Decision Tree
In most major projects there are choices in how to achieve the objectives, so that
at the start of the project the decision maker is faced with a variety of alternatives. These
alternatives can be shown graphically in a decision tree showing the decision making
process and the options available.
A measure of the value for each possible outcome is required in order to give
meaning to the decision tree. The most commonly used is the expected value (EV), which
is the sum of the payoffs weighted by their probabilities. The decision-maker has to

place a probability on each outcome. The probabilities are likely to be rough assessment
so it is advisable to draw a number of decision trees using slightly different probability
values.
1.3.2.4 Risk Response
The response to, or the allocation of, risk can be grouped into four basic forms:
a Risk retention
D Risk reduction
o Risk transfer
u Risk avoidance
Proper allocation of risk must be considered the ability to absorb risk and the
premium offered to bear the risk. For example, a contractor will pay for the insurance to
transfer the risk to surety. On lump sum contracts, clients are passing more risk to
contractors and trade contractors. As we mention before, risks and rewards should go
hand in hand in order to encourage specific party to bear the specific risk.
1.3.2.4.1 Risk Retention
Risks that produce small, repetitive losses are those most suited to retention. Not
all risk can be transferred, but even if they were capable of being transferred it may not
prove to be economical to do so. The risk will then have to be retained. Besides, it is
preferable to retain a portion of the risk in certain circumstances. For example, a
reduction in an insurance premium with a corresponding retention in the form of limited
excess provision in the event of a claim, may be preferred to full coverage; the gamble is

between paying the premium and the probability of the event occurring and the
consequential loss that would result. In summary the relevant factors are:
u The cost of the insurance premium;
o The maximum probable loss;
o The likely cost of the loss;
o The likely cost of paying for the loss, if uninsured.
1.3.2.4.2 Risk Reduction
One of the ways of reducing the risk exposure is to share risks with other parties.
For instance, the general contractor will attempt to reduce his risk exposure to pay
liquidated damages for late completion by imposing liquidated damages clauses in sub-
contract agreement.
Similarly with the contractual arrangement, the use of management fee types of
contract will remove the adverse attitude of contractors and should reduce the likelihood
of claims from contractors and should reduce the likelihood of claims from the contractor
for direct loss and expense.
1.3.2.4.3 Risk Transfer
Transfer risk does not reduce the criticality of the source of risk; it just removes it
to another party. In some cases, transfer can significantly increase risk because the party,
to whom it is being transferred, may not be aware of the risk they are being asked to
absorb.
The most common form of risk transfer is by means of insurance which changes
an uncertain exposure to a certain cost. On construction projects, fault-free building

cannot be guaranteed and defects may be discovered long after practical completion.
Latent defects which cannot reasonably be discovered at the stage of a building's
completion period are a fact of life.
One advantage of current arrangement of risk transfer by means of insurance is it
reduces the likelihood of litigation between different parties. As a matter of fact, surety
acts as an intermediate deputy who bears the risk with reasonable awarding. Based on
Professor John Miller's statement, the relationship between each party and surety can be
shown in Figure 1.12.1
Payment bond and performance bond are provided by surety to ensure the project
will be completed in the event of default by the contractor. Bond is the form of insurance
paid by the principal.
Figure 1.12 Performance Bond for Risk Transfer
(Resource: John B. Miller. Law in the construction industry)
Professor John B. Miller, "Law and the Construction Industry", 1998

1.3.2.4.4 Risk Avoidance
Risk avoidance is synonymous with refusal to accept risks. It is usually associated
with pre-contract negotiation but it may well be extended to decisions made in the course
of execution of the project. The use of exemption clauses is an example to avoid specific
risk or the consequence resulted from the risk.
1.3.2.5 Risk Attitude
As we mentioned before, risk always goes hand in hand with reward. The
premium that gives the basic judgment of whether one should bear the risk is quite
different among individuals. In other words, the attitude toward risk choice is based on
each individual's risk preference. Simply speaking, there are three types of people:
o Risk loving
o Risk averse
o Risk neutral.
Most of the risk theories are based on the rational of risk aversion. It is more
unpleasant to lose a given sum than to gain the same amount since one would change his
standard of living to which his is accustomed.

2 Risks in Build-Operate-Transfer Project
2.1 An Overview: BOT Concept
2.1.1 Introduction to BOT
Although the term Build, Operate, Transfer, sometimes referred to as BOOT
(Build, Own, Operate, Transfer), is relatively new, the practice of this concept has been
around for several centuries. The main objective of this concept is to allow private sectors
or individuals to develop and operate public infrastructure projects.
The host government would establish main objectives of a specific project and
assume the role of defender of the public interest, while the consortium or private sector
would take the role of contractor to design, build, finance and operate the project. The
concessionaire would assume the responsibility for the completion of the project, any risk
involved in different stages and the operation performance. The consortium would be
granted a concession period, after which the contract might be renewed at the option of
the government, or title would be transferred from the concessionaire to the government.
The BOT theme has several variations:
BOO: Build, Own, Operate (without any obligation to transfer ownership)
BTO: Build, Transfer, Operate
BRT: Build, Rent, Transfer
BOOST: Build, Own, Operate, Subsidize, Transfer

DBFO: Design, Build, Finance, Operate (similar to BTO, the government will
retain title to the land and lease it to the private concern over the life of
the concessionary agreement)
Traditionally, most infrastructure service, such as railroad, power supplies and
water sanitation, is delivered as a public good by government. The government takes the
responsibility of designing, building, financing, operating and maintaining the physical
project. However, physical infrastructure is increasingly more expensive, and even in the
developed world many governments can no longer afford to utilize the necessary
resources to allow them to provide sufficient infrastructure service to sustain its economy
to flourish or prosper continually. In addition, many public services are considered low-
efficiency or poorly management due to the lack of incentives of competitiveness, which
is the key factor to survive in the private market. So the idea of BOT was proposed as not
only a substitute to relieve the tight budget on government but also a vehicle to improve
the quality of service. In a BOT project, the consortium usually provides equity financing
in the amount of 10 to 30% of the total cost and seeks debt financing for the balance of
the investment. The host government may provide assistant to the consortium in the form
of initial land acquisition and favorable tax relief in equipment, material, or income.
2.1.2 History Background: How the concept evolved
The historical development of private sector involvement in the provision of
infrastructure as the term is understood today has its root in Europe, in the beginning of a
demand for mass travel and long distance transport in the second half of the seventeenth
century. The Industrial Revolution stimulated the booming in western society. At that
time, the needs for infrastructure facilities, such as railroads, power plants, canals and

turnpikes increased explosively. Undoubtedly, large cash was required to support these
projects. Governments of the time had only rudimentary tax system arrangements
primarily to service heads of state and any wars they might embark on. Infrastructure was
therefore left to individuals to finance and build. However, as the revenues generated
from the improvement in industrial production, governments were able to fund their own
infrastructure, but where large or specialist undertakings were suggested the concession
or franchise arrangement was adopted.
In the mid-1800's, French was the leading activists of this concept. According to
Monod' the need for water distribution initiated the first concession being granted in
1782 to the Perier brothers in Paris. The most notable spread in the use of concession
occurred after 1830 in France. However, the use of concession was not only confined to
France but soon widely found in Spain, Italy, Germany and Belgium. The use of
concession contracts declined in industrialized countries as the initial infrastructure was
completed.
One of the best-known BOT projects in modern world is the Suez Canal which
opened on 17 November 1869 with a 99-year concession. The total length of the canal is
195 km connecting the Mediterranean and Red Sea. Ferdinand de Lesseps was given the
responsibility for forming the company to build and operate the canal. It was to be
financed by European capital with Egyptian financial support. The land was donated by
the Egyptian government which relaxed many of the taxes generally levied on important
materials and equipment. The consortium was to pay all the costs of design and
construction. The government would receive 15% of the annual profits from the canal's
operation, 10% would be paid out to the initial shareholders, and the 75% would accrue
to the company. Also, in 1958, the concession agreement was modified to include a
provision stating that 80% of all workers must be Egyptian. Construction began in 1859
and was scheduled for completion in 1864 at a total cost of £8 million, a sum that grossly
underestimated the real cost of the project. In 1863 British engineer Sir John Hawkshaw
projected the eventual total cost would be £10 million when the project was to be
completed in 1868- four years later than expected. However, in 1875, the interest on the
debt of the Egyptian government in the course of financing a portion of the project was so
high that even exceeded the gross income of the entire country. Finally, the company
found a solution to transfer the title to British government.
Industrialized countries generally funded new infrastructure between the late
1800s and the 1970s from their respective fiscal resources or sovereign borrowings.
These governments also played a role in identifying needs, implement strategic policy
and procuring the either by direct ownership or a closely controlled franchise. This
traditional approach was followed by less developed countries today by means of issuing
government bonds or direct loans from organization such as World Bank, Asian
Development Bank and the International Monetary Fund.
However, a truly fever of privatization emerged in the late 1970s. It challenged
the traditional approach of establishing infrastructure, which place pressures on the
governments, in both developed and developing countries, to change the current policies
and set up new rules for the game. There were two influences for this change. First, the
existing and limited additional infrastructure is unable to keep pace with economic
1 Monod J., "The private sector and the management of public drinking water supply", World Bank, 1982.

growth. Cited from the Economist on 6 March 1993 to give an example of this situation
stating that':
Between 1970 and 1991 Britain built an extra 9% of main roads and motorways. During the same
period, passenger cars drove 116% more miles; vans and goods vehicles, 75% more. Crowded Britain is
not unique. Between 1970 and 1990 America's vehicle miles almost doubled, while the amount of its urban
roads rose by just 4%.
There is no exception in the developing countries, sometimes so-called "Newly
Industrialized Countries", which are countries now establishing their infrastructure and
with the GDP moving constantly. Many Southeast Asia countries and Latin American
countries apply. All these countries have a common symptom of suffering from limited
infrastructure to sustain its high-rocketing economic expansion. According to the World
Bank statistics data (1998), Philippine has only 19.8% of the surface covered by road,
compared with 100% in UK. In Bangkok, the current traffic congestion shaves 1% from
gross national product and costs an average 40 days in commuting time. All these
countries are facing this problem of economic growth outstripping infrastructure
development.
Second, the importance placed on health and welfare demands. The longevity of
population had resulted in the dramatic increases of health and medical costs. Most
governments were heavily in debt to these social expenses. It became clear that these
governments had fiscal shortcomings in funding public infrastructure. One of the best
ways to relieve this constraint is by adopting the idea of privatization which grants
private sectors the title to design, build, operate and maintain specific infrastructure by its
1 C Walker, A.J. Smith, " Privatized Infrastructure: the Build Operate Transfer Approach", 1995

own financing within a predetermined concession period. This requires massive
investments and regulatory changes to control these significant projects.
In the United States, the construction of privately built and operated toll roads was
commonplace during Revolutionary days. But real privatization fever hit the United
States in the 1980s and 1990s when newspapers began to announce the privatization of
prison and school systems.' In addition, while the construction industry was in a great
recession during the 1970s, many companies saw a revival opportunity of obtaining
contract through BOT approach. This also relieved pressure on the host government tight
budget. Since the risks associated with the projects were high, many agreements with
host government allowed developer return on investment to exceed 25 percent. The U.S.
federal government today acknowledges BOT and encourages the implementation of
BOT-related transportation projects since it sees BOT as a primary way to make U.S.
companies more competitive globally. The Untied States indeed has taken several steps
to implement and support the privatization movement.
2.1.3 Current Market
Based on history, the economic growth of a country is related to its availability of
public infrastructure. There is no doubt that the developing country is where eagerly
needs more infrastructure to keep pace with its fast-growing economic. For example,
according to World Bank statistics, the developing countries invest $250 billion dollars
each year in new infrastructure (World bank Working Paper, 1990). The Asian market is
where most of the big money will be spend on infrastructure development in the next two
decades. For example, china plans to spend $92 billion per annum between 1995 to the

end of the century, South Korea $400 billion on infrastructure, and Taiwan about $245
billion. Another study indicates that East and South Asia will require at least $1.2 to 1.5
trillion in infrastructure investment between 1990 and 2000.
The wave of private sector participation in infrastructure now sweeping the globe
started in Chile, New Zealand, and the United Kingdom in the early 1980s. From 1984 to
1994, there are more than 900 privatized infrastructure projects got under way and more
than 2,200 are under preparation in 86 countries. Since 1984, the value of privatizations
has totaled US$357 billion and that of new investment projects more than US$308
billion. Thus private investment in infrastructure amounted to US$60 billion a year on
average. Privatization activity has been dominated by sales of power companies and
telecommunications companies licenses as shown in Figure 2.12. The sales of
transportation and sanitation companies are also important. If we take a closer look at the
specific sector, telecommunications investments tend to be funded mostly with retained
earnings, reflecting strong market growth and consumers' willingness to pay for service.
The liberalization of telecommunications that started in a few countries in the 1980s
turned into a worldwide trend in the 1990s. Now more than 90 developing countries open
their telecommunications sector to private participation between 1990 and 1998. These
countries transferred to the private sectors the operation and construction risk of more
than 500 projects. The transactions involved investment commitments of US$214 billion.
Two-thirds of that amount has been invested in expanding and modernizing networks; the
other third has gone to government as license fee. According to the World Bank PPI
Project Database, the data reflect that most of the privatization contracts among
1 Sidney M. Levy, "Build, Operate, Transfer: Paving the Way for Tomorrow's Infrastructure", 19962 World Bank PPI Project Database.

developing countries are Greenfield projects, which include BOT and BOO contracts. As
to the total investment, Latin America and East Asia lead the way with 52 percent and 20
percent, respectively. Table 2.1 shows the total investment by region.
Figure 2.1 Private Infrastructure Projects by Sectors, 1984-1995
250
200
150
100
50
0Gas Water Waste Transport Telecom Power
n Privatization and Operation
* New Investment
(Source: World Bank, PPI Project Database)
Table 2.1 Telecommunication Projects with Private Participation in DevelopingCountries by Region, 1990-1998
East Asia and the Pacific 14 64 42,269
Europe and Central Asia 24 254 32,382
Latin America and the Caribbean 22 99 110,919
Middle East and North Africa 6 13 2,979
South Asia 4 41 19,073
Sub-Saharan Africa 24 50 6,420
(Source: World Bank, PPI Project Database)

The fast growing countries of Asia are emphasizing new investment, which
account for more than 70% of the new privatized infrastructure in this region, as witness
the top ten new private infrastructure projects in Table 2.2. Two countries in the region
are the clear front runners- the Philippines, mostly in power, and China, mostly in power
and transport. Even the United States with its mature infrastructure is not immune to the
spreading of this new delivery mechanism toward a private/public alliance. With the us
department of transportation's announcement that it will need to spend $51.5 billion
annually just to maintain the condition and performance of the federal highway system,
and $16.7 billion each year to improve the system, it is no wonder that the Intermodal
Surface Transportation Efficiency Act allows state government to issue contract with
private consortium to design, build, finance, operate and maintain the projects within its
own objectives and specific concession duration.
Table 2.2 Top ten Private Infrastructure Projects, 1984-1995
LocationFrance/UnitedKingdomTaiwan
Japan
Europe
ArgentinaThailand
China
MalaysiaMexico
Thailand
ProjectsChannel Tunnel
Taipei Mass Rapid Transit SystemKansai International Airport
Concert Pan-European Telecom ServiceBuenos Aires Water and Sewer Service
TelecomAsia Communication Network
Daya Bay Nuclear Power Plant, Phase 1North-South toll ExpresswayPetacalco coal-fired Power PlantBangkok Elevated Road and Train System
ContractBOT, 55 years
BOT
BOT
BOO
ROT, 30 years
BTO, 25 year
BOO
BOT, 30 yearsBOT
BOT, 30 years
Cost(US$ billions)
19.0
17.0155.34.04.03.73.43.0
2.98
(Source: World Bank Private Sector Note #45)
I-I---~---

2.2 Contractual Organization
The BOT contractual structure may vary from different projects to reflect the
distinction and unique of specific project. Typically, a contractual arrangement is shown
in Figure 2.2.
From the government perspective, it is essential to determine the needs of
governments since all these infrastructure services such as electricity, water sanitation,
telecommunication, and transportation are significant prerequisites of society. It includes
the following three points:
* Governments must address and set long-term policy objectives for their
people.
* Governments should continually balance their budgets to ensure that taxation
levels do not rise to smother the very growth the infrastructure provides. Not
to do so endangers the stability of society and the government.
* Government generally encourages efficiency and growth.
Bases on the above three points of a successful government, the objectives of this new
partnership from the government perspective are as follow:
* Relief of financial burden
* Better service to the public
* Reduction in inefficient bureaucracy
* Encouragement of growth
* More flexibility to balance the budget to use in other areas such as education,
arts and social welfare.

However, the success of this new partnership has to go hand in hand with the concern of
whether the "project" is profitable and operated successfully or not. The marriage of
public/private can be deemed successful only if both sides can reach a win-win solution.
From a concessionaire perspective, its objectives to fulfill this contractual
structure are as follow:
* Assume the construction phase is performed successfully and on time.
* Monitor the operation phase of the project to ensure the shareholders'
benefits.
* Ensure the payoffs of loan are paid as schedule.
Figure 2.2 Contractual Structures of a typical BOT
InvestmentBankers
Advisors
InvestmentBankers, Legal
CounselAdvisor
Deed of trustGuarantee
Trustee
(Source: Walker. Privatized Infrastructure)
P
E,

2.3 Project Financing
2.3.1 Defining Project Financing
When it comes to define the meaning of project finance, we may find the answer
obscure since the methodologies and tools used in project finance vary from project to
project, and country to country. The variability arises from the different viewpoints or
criteria toward the unique mix of debt and equity between lenders and investors. Usually
lenders tend to focus on the downside risks while investors tend to look at the upside
opportunity. A more precise definition as follow':
A financing of a particular economic unit in which a lender is satisfied to look
initially to the cash flows and earnings of that economic unit as the source offunds
from which a loan will be repaid and to the assets of the economic unit as
collateral for the loan.
Project financing should be distinguished from conventional direct financing or
so-called corporate financing. As to the conventional direct financing, lenders to the firm
look to the firm's entire asset portfolio to generate the cash flow to payoff their loans.
They also have full recourse to all assets and revenue of the economic entity. The assets
and their financing are integrated into the firm's asset and liability portfolios. Often, such
loans are not secured by any collateral. The critical distinguishing feature of a project
financing is that the project is a distinct legal entity; project assets, project-related
contracts, and project cash flow are segregated to a substantial degree from the
sponsoring entity. The financing structure is designated to allocate financial returns and
risks more efficiently than the traditional financing structure. In a project financing, the
1 Peter K. Nevitt, "Project Financing", Euromoney.
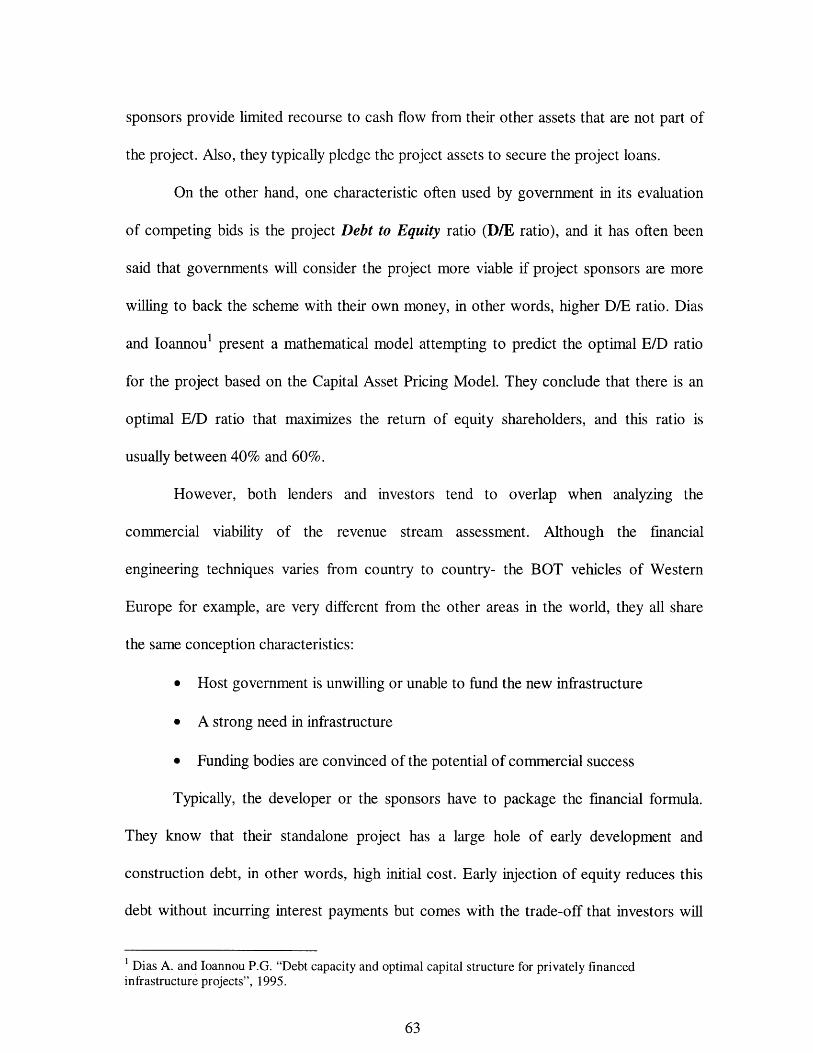
sponsors provide limited recourse to cash flow from their other assets that are not part of
the project. Also, they typically pledge the project assets to secure the project loans.
On the other hand, one characteristic often used by government in its evaluation
of competing bids is the project Debt to Equity ratio (D/E ratio), and it has often been
said that governments will consider the project more viable if project sponsors are more
willing to back the scheme with their own money, in other words, higher D/E ratio. Dias
and Ioannou1 present a mathematical model attempting to predict the optimal E/D ratio
for the project based on the Capital Asset Pricing Model. They conclude that there is an
optimal E/D ratio that maximizes the return of equity shareholders, and this ratio is
usually between 40% and 60%.
However, both lenders and investors tend to overlap when analyzing the
commercial viability of the revenue stream assessment. Although the financial
engineering techniques varies from country to country- the BOT vehicles of Western
Europe for example, are very different from the other areas in the world, they all share
the same conception characteristics:
* Host government is unwilling or unable to fund the new infrastructure
* A strong need in infrastructure
* Funding bodies are convinced of the potential of commercial success
Typically, the developer or the sponsors have to package the financial formula.
They know that their standalone project has a large hole of early development and
construction debt, in other words, high initial cost. Early injection of equity reduces this
debt without incurring interest payments but comes with the trade-off that investors will
1 Dias A. and Ioannou P.G. "Debt capacity and optimal capital structure for privately financedinfrastructure projects", 1995.

push for high tolls to maximize their dividends. The lenders may see this pressure as
adding risk to the future cash flow predictions. A balance, therefore, has to be attained
through the finance engineering vehicles based on all the risks involved. In the following
sections, these finance vehicles used today will be discussed from different parties'
perspectives and how the related risks are mitigated.
In summary, the ultimate goal in project financing is to arrange a borrowing for a
project that will benefit the sponsor and at the same time be completely non-recourse to
the sponsor, in no way affecting its credit standing or balance sheet, while at the same
time providing sufficient credit support through guaranteed or undertakings if a sponsors
or third party, so that lenders will be satisfied with the credit risk. Structuring a project-
finance package entails deciding how much of the project resources should come in the
form of equity and the rest will be debt.
2.3.2 Sources of Finance
Usually the sources of a project finance comes from two areas:
* Equity
* Debt. There are two kinds of debts: subordinate debt and senior debt.
Subordinate debt is sometimes called mezzanine financing or quasi-equity;
and senior debt will usually be secured or asset based.
Equity is provided by shareholders; shareholders include project sponsors, who
are the driving force behind a project, as well as passive investors, who hold equity
positions without being involved in project promotion. Shareholders' return depends
merely on the project's profit. In addition, equity holders take more risk than debt
creditors since they are the last to get paid. Therefore, they are likely to expect higher

return to compensate their risk; Debt refers to fund lent by financier. Lenders receive
payments according to a predetermined rate. Their payment does not depend on the profit
of the company.
Equity
The equity investment in a project financing represents the risk capital. It forms
the basis for lenders or investors advancing more senior forms of capital to the project.
Usually it makes up 20 to 40 per cent of the total financing. Although the equity investors
are the last to get paid, the potential profits are substantial. Lenders consider equity as a
margin of safety. There are two important reasons for creditors to require equity
investment in financing package:
* Lenders expect the projected cash flow may be able to payoff the operation
cost, debt service and a comfortable margin of safety to cover any
contingency that might arises. The more debt the lender put into the cash flow
projection, the more risk the lender assume.
* Lenders look at equity as a collateral for their loans. They want investors to
have enough stakes to see through the project to a successful completion
rather than walk away easily.
The appropriate D/E ratio depends on how the investors negotiate with the senior
lenders. Many factors should be taken into consideration, such as commercial interest
rate, system risk, and the prediction of future economy which might have an immense
impact on the projection of cash flow. One point worthy to mention here is that usually
the meaning of off-balance sheet financing is easily mistaken as the conception that
project financing requires little or no equity investment by the sponsors. In practice, as

mentioned before, the lenders are reluctant to fully finance a project by its own since they
are not the equity risk taker. However, unless guarantees are available from very
creditworthy guarantors, lenders will always require a substantial equity investment to
ensure the sponsors' continued interest and devotion to the completion and success of the
project.
Equity investment can take in two forms: preferred stock and common stock. The
preferred stock pays dividends and is senior to common stock. Preferred stock has fixed
return, while return on common stock depends the financial performance of the company.
Mobilizing equity can be straightforward. The sponsor can reallocate the
resources from the corporate to invest in the project company. The financing techniques
used nowadays are far more complicated and sophisticated than those used 20 years ago
and many resources are explored to fulfill today's need. The possible sources of equity
investment in BOT are:
* Sponsors own capital and subordinated loans, which are sometimes used to
complement the equity.
* Investment fund, a few of which have been recently formed to provide equity
in private infrastructure projects.
* Multilateral institutions, such as the International Finance Corporation (IFC)
and regional development bank, such as Asian Development Bank (ADB),
which has established equity division to directly invest in BOT projects.
* International equity market, where projects sponsors can issue equity shares to
the public or place shares privately with institutional investors.

Local capital markets, where sponsors can issue equity shares to the public or
to local institutional investors such as pension funds and insurance companies
that may be interested in the project company.
Subordinated debt
Subordinated loans are senior to equity capital but junior to senior debt and
secured debt. Subordinated debt usually has the advantage of being fixed rate, long-term,
unsecured and maybe considered as equity by senior lenders for purpose of calculating
D/E ratio. Sponsors can sometimes use subordinated debt as an initial injection of capital
in order to secure senior loans. It also has the advantage of being advances required by
investors to cover construction cost over-run or debt service. Subordinated loans usually
come from finance companies, risk capital companies and risk portfolio managers of
insurance companies.
Subordinated debt is also called quasi-equity since it has similar characteristics of
equity investment. However, subordinated debt by a sponsor has the following
advantages over capital contributors:
* From the tax viewpoint, the interest on debt is deductible for income tax
purpose
* The payoff of loan is predetermined hence the schedule and rate of payment is
certain beforehand, whereas the dividends policy may change each year.
* It still preserves the right to convert to stock if an initial agreement is made.
* A greater market for debt service than equity finance.

Senior Debt
The senior debt usually constitutes the largest part of the financing and is usually
accounts for more than 50 per cent of the total. It has the first priority to be paid off in the
case that sponsors get into financial difficulty. Senior debt usually comes from
commercial bank lenders. After the debt crisis in 1980s, commercial banks consider large
project as risky investment, particularly if the loans are non-recourse. Each bank,
therefore, has its limitation toward debt financing in large projects. It is unlikely that a
single commercial bank is able to meet all the requirements for a single project. So now
commercial banks provide finance through syndications of lenders. In addition to the
commercial banks, other senior debt resources are as follow:
* Specialized fund sponsored by governments
* The IFC and most regional development bank
* Suppliers' credit
* International capital market, which increasingly tapped through issuing
various kink of bonds
* Local capital markets in developing countries
Senior debt falls into two categories: secured and unsecured debt. An unsecured
loan is debt backed by the general credit of the borrower, and is not secured by a
perfected security interest in any asset. Unsecured loans are only available to the most
creditworthy companies with long histories of financially successful operation and good
relationship with their lenders. Banks and other commercial finance companies are the
source for senior debt. Banks are usually balance sheet lenders and the least expensive
source for project financing. Secured loans are available to most projects where the assets

securing the debt have value as collateral, which means that such assets can readily be
converted to cash. Banks are good resources for secured loans. A secured loan is superior
to unsecured loan in the event of financial difficulties. The secured creditor in control of
key assets of a project is in a position to demand that its debt service, payments of interest
and principle continue, even though the unsecured creditors are paid nothing. Table 2.3
gives a summary of possible financing resources:
Table 2.3 Resources for Finance
Equity
(20 to 40 per cent of total financing)
* Sponsors' own capital
* Multilateral Institution
* International equity markets
* Local capital markets
* Investment fund
* Governments' official lending
agencies
Debt
(60 to 80 per cent of total financing)
* Institution investors (pension
funds, insurance companies, and
mutual fund)
* International commercial banks
* IFC
* Bond markets
* Suppliers' credit
* Specialized infrastructure funds
* Government-guaranteed official
loans

2.4 Risk Analysis
2.4.1 Introduction
Risks are unavoidable in any project. The main scheme of the arrangement of
BOT contract is to identify each risk and allocate each risk to different parties based on
the agreement of the contract. As mentioned in Chapter 1, the first step of risk
management system is to identify and classify the risk and then the decision-maker has to
respond to each risk based on his own risk preference. In this section, risk inherent in
BOT projects will be identified and the measures used to deal with it will be discussed.
2.4.2 Types of Risks in BOT
A list of the main risk resources should be compiled for the decision-maker to
assess the possible outcomes of uncertainty inherent in projects. Based on Woodward et
al suggestion, we can simply classify the BOT risks by different phases of the project.
There are three main time frames of the project: development, construction and
operation phase. In each phase, each risk associated with it are different from the other,
therefore different measures should be taken. Table 2.4 summarizes the risks associated
with BOT by different phases of the project.
Table 2. 4 Types of risks by phasesDevelopment Phase* Technology Risk* Credit Risk* Bid Risk
Construction Phase* Completion Risk* Cost Overrun Risk* Performance Risk

Operation Phase* Operation Cost Overrun* Performance Risk* Liability Risk* Equity Resale Risk* Off-take risk
On-going Risks* Interest Rate Risk* Exchange Rate Risk
2.4.3 Development Phase
At this stage, the main risk is rejection by the host government. The risk is high
but involves relatively small losses. These risks are borne primarily by the sponsors.
Technology Risk
A technology may not be economically viable or the regulation regarding its use
may change. This risk is much more concerned in the project where new technology is
not approved feasible or economic viable during the phase of development. Usually,
project sponsors have to assume this risk through their equity participation.
Credit Risk
Credit risk refers to the creditworthiness of the sponsors or the project itself. The
lenders may make their decisions based on how they rate the credit of the concerned
parties and project through various reliable agencies. Usually there are three ways to
allocate this risk. First, the credit of sponsor can be enhanced through the issuing of
letters of credit from commercial banks. Second, under the guarantee of credit rating
agency, the lenders need not rely solely on the sponsors' creditworthiness. In other cases,
the credit report agency, such as Standard & Poors, rates the credit of specific project
based on the credit strength and the capability of the concessionaire. Third, government

acts as a guarantor to assure the lenders of the selected consortium's credit reliability.
This is considered useful while there is insufficient credit history of the sponsor.
Bid Risk
Bid risk refers to the rejection by the government of the bidding to the project.
Reasons for rejection include commercial weakness and failure to obtain licenses,
permissions and clearance. The risk is high but involves relatively small losses, such as
the expenditure for feasibility study or the cost for preparation of the bidding package.
The sponsor usually assumes this risk.
2.4.4 Construction Phase
Any interruption in construction phase might result in the delay of the projected
cash flow projection and thus delay the scheduled payment of loans. Main risk is failure
to complete the project with accepting performance and within an acceptable time frame
and budget. This risks mainly fall on the sponsors. They in turn hedge the risks by
purchasing insurance or surety bond and require guarantees from the contractors and
subcontractors in the form of a predetermined agreement. The risk involve in this phase is
high and involves potentially significant losses. From the lenders' perspective, the
construction risk is the most important in the sense that their loan security- underlying
assets of the project, would be of little value if the project fails at this phase. Therefore,
lenders are likely to require recourse to the sponsors' other resources before the physical
asset is completed.
Completion Risk
Project can be delayed due to all sorts of reasons, but poor interface coordination
and late design changes are very common. As BOT projects rely on the income from the

completed facilities to service their debts, the rolled-up interest from a delayed project
can be substantial and can seriously damage the projected revenue stream. Fro example,
the Channel Tunnel project was allegedly delayed by late changes in the signaling system
specification and thus resulted in one-year delay out of a seven-year contract.
A recent trend is to require the contractors to provide guarantee on completion
time in the form of performance and completion bond. In returns, they assign segments of
completion risk to the equipment and material suppliers. In this case, the completion risk
is transferred to the surety or bond issuer, for which a premium is charged.
Some sponsors prefer a turnkey arrangement in which the contracted company is
responsible for completion of the whole project, but these are difficult to obtain for BOT
projects. However, a lump-sum contract requires the contractor to comply with specific
timeline and fulfill the completion of predetermined critical stages of the project. This
can be measured by a rate of minimum operating efficiency. Less positive measures
include the imposition of heavy liquidated damages based on expected loss. On the other
hand, more positively, it is also common to use performance incentives for the work
completed before the deadline.
Sometimes the delay might be resulted from the unforeseen underground
condition. This also results in substantial losses on cost and time depending on the site
condition. Under BOT arrangement, usually the cost for changed condition is not covered
by the contract due to the nature of the lump sum, fixed-price contract. To avoid or
mitigate this risk, the contractor usually includes a risk premium in his bidding cost.
Cost Overrun Risk

Any cost overrun must be borne by the sponsor or contractor, but it may be
funded by lenders or by precommitted cost overrun arrangement. A common question
aroused from cost overrun risk is that the syndicate of loans might question the feasibility
and viability of the project on going and is likely to take several actions to threaten the
consortium already on the down side.
The overrun risk can be mitigated in the following methods:
* Establish a price escalation clause in the off-take contracts
* Additional capital injected by project sponsors. For example, Eurotunnel had
gone through several major equity offerings to meet its increasing
construction cost
* Use completion bond issued by the indemnity companies to mitigate the risk
* Fixed price lump sum contract. Most BOT projects are arranged in lump sum
contract. However, the effectiveness of fixed price contracts depends on the
degree in which the host government can avoid uncertainty and changes to
specification
* A standby contingency fund from original lenders. In many BOT projects, the
host government provide a contingency fund to alleviate the risk in the event
of force majeure
* Establish an escrow fund for completion from sponsors
Performance Risk
Sponsors and contractors may fail to meet the requirement of quality or fail to
provide serviceable end product to fit the specification. Under such condition, like
completion risk, can result in the delay of the project and thus increase the cost. In order

to mitigate this risk, contractors and sponsors can purchase a performance bond from
surety. Surety assumes this risk with a charged premium paid by the contractors who are
unwilling to risk the damages caused by unacceptable performance. The other advantage
for buying a performance bond is to reduce the chance of time consuming legal process
for which all damages are covered by indemnity clauses provided by the third party.
2.4.5 Operation Phase
Operation cost overrun risk
Labor and material used during operation of the completed facility, such as fuel in
a cogeneration plant, may turn out to be more expensive than anticipated. Contractual
arrangement similar to those described in the construction phase, including price
escalation clauses in the off-take contracts, are appropriate.
Sponsor Performance Risk
Operation and maintenance contractors may not meet the quality standards. Like
any other performance risk, this is borne by the contractors.
Liability Risk
The risk of death or injury on the operating facility may be allocated to the
insurance company by prepaying the premium.
Equity Resale Risk
Contractors and other sponsors may not be able to sell their share in a project
upon its completion because the secondary market for sponsor equity positions can be
very limited. Because of this limited secondary market, some sponsors prefer to use a
subordinate loan for project capital - one that supports senior borrowings from third
party. As debt, the borrowing will eventually be paid. The sponsor lender can preserve

the advantage of an equity stock position through stock conversion rights under the
subordinated loan agreement.
Off-take Risk
The risk that the project may not meet revenue projections because of market
price changes occurs in all types of projects. It is referred to as, generally, the overall
economic risk of the project. Off-take agreement may guarantee the minimum revenue
generated from the purchasers. Sometimes government may guarantee no second facility
for a specific time. For example, in the case of Malaysia North-South highway project,
the government guaranteed to provide additional finance in the event of a drop in traffic
volume in the fist 17 years. Another good example for using such kind of incentives is
the Sydney Harbor Tunnel project. Under the so-called "revenue stream Agreement", the
project company will receive a guaranteed cash flow based on the agreed projections of
tunnel and bridge traffic. The government has to pay for the shortfall if the traffic falls
below 10% of the forecast demand.
2.4.6 On-going Risk
Interest Rate Risk
Changes in interest rate affect the cash flow of the lenders who use fixed-income
securities. Coupon swaps are a convenient way to hedge interest risk. A coupon swap is
an exchange of one coupon or interest payment for another that has a different
configuration but the same principle amount. Lenders in project finance usually have
access to certain floating and fixed-rate debt markets.
Exchange Rate Risk

Exchange rate affects international project in which project revenues and
expenditure are paid in foreign currency.
To mitigate this risk, financial manager can convert the exposed cash flows into
the desired home currency. Short-term transaction can be readily hedged in the foreign
exchange forward or future markets. However, for a longer term hedging, it is more
appropriate to hedge with either long-date forward currency or currency swap. Financial
manager can also convert the exposed cash flow into the desired currency using currency-
collateralized loans and foreign exchange options. In the case of Malaysia North-South
Highway, the government guaranteed the project company that it would make the
shortfalls if any adverse exchange rate movement exceeds 15% on its offshore debt, or if
interest rate movement exceeds 20% on its floating rate offshore debt. These guarantees
instilled confidence in the lenders that the project company will still be able to complete
the project under adverse money market.
Underlying is a summary table for risks involved in BOT project, the parties
assuming the risk, and the mechanism used to allocate the risk.
Table 2.5 BOT Project Risk SummaryRisk Participant Mechanism
Development Phase
Technology Risk Sponsors Equity
Subordinated debt
Credit Risk Sponsors, Lenders Credit rating agency
Bid Risk Sponsors Equity
Construction Phase

Completion Risk Contractors Performance Incentives &
Sponsors guarantees; Turnkey Contracts
Contractor
Cost Overrun Risk Sponsor Fixed price contract & completion
Contractor bond
Performance Risk Sponsors Performance bond
Operation Phase
Cost Overrun Risk Sponsors Fixed price contract
Performance Risk O&M Contractors Equity, performance guarantees
Equity Resale Risk Sponsors Subordinated Debt
Off-take Risk Sponsors Take-and -pay; take-or-pay;
advanced payments
Liability Risk Insurance Company Insurance contracts

3 Case Study: Hong Kong Cross Harbor Tunnel
3.1 Project Background
The project is important in the sense that it marks the beginning of BOT
development in Hong Kong. The project was outset at the 1950s with the need for fixed
cross harbor link, which the government of the day could not afford to build. In the
1950s, the data shows that there was a 27% increase in the bus passenger per annum due
to the increasing number of illegal immigrant. At that moment, the main transportation to
link up the city of Victoria on Hong Kong and the Kowloon on the mainland was carried
by ferry services. In 1954, a feasibility studies show that the tunnel is the best option, and
in 1956 the government proposed that private sector might be allowed to participate in
this project with its own financing.
Following a long and complicated process, a Hong Kong consortium was formed
in 1965 comprising Wheelock Marden & Co., Ltd, Hutchison international Ltd, Kowng
Wan Ltd, and Sir Elly Kadoorie Successsors Ltd, operating under the title of 'the Cross
Harbor Tunnel Company Limited'. Tenders for the construction work were invited in
1966, but uncertainty caused by the Cultural Revolution in China meant that the lenders
were more unwilling to fund the project. The construction contract was not signed until
1969 while a negotiation with Lloyd's Bank Ltd, of London for a loan of £14.7 million
backed by UK export credit guarantees were successfully concluded. The relevant
legislation, the Hong Kong Tunnel Ordinance (CAP 203) was enacted in June of that
year. The construction contract was awarded to a consortium led by Costain International
Ltd. The tunnel opened to traffic ahead of schedule in August 1972 with a toll of HK$5.
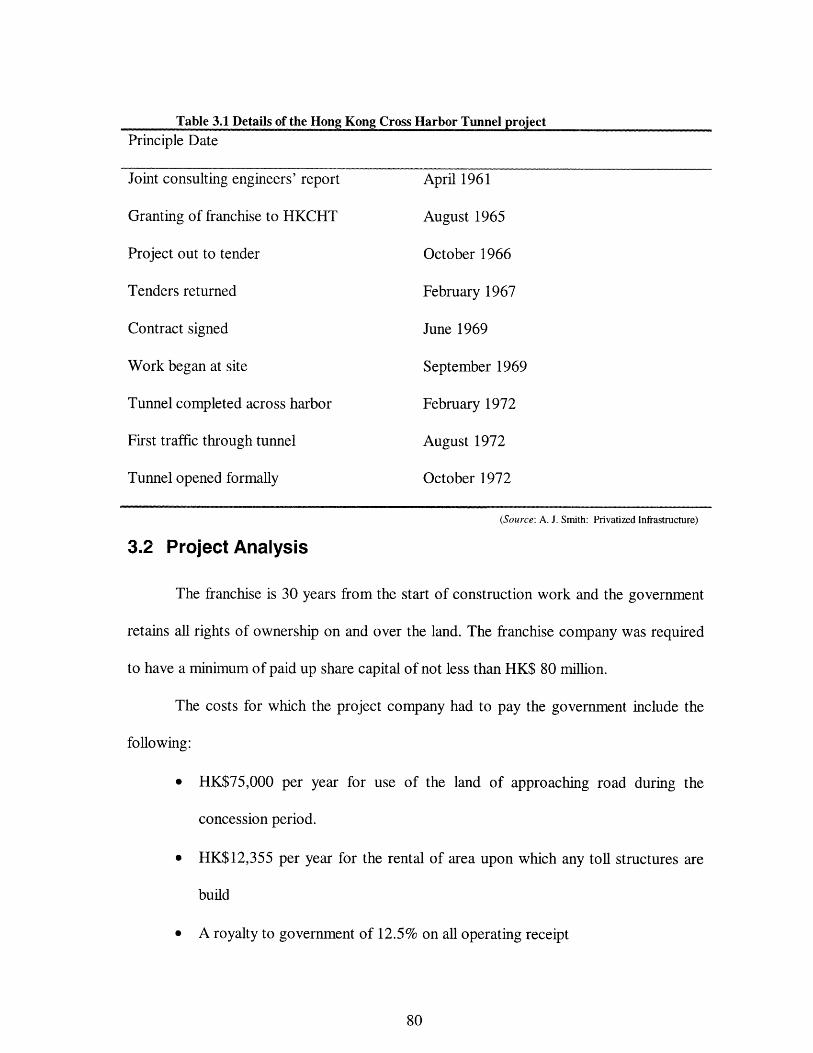
Table 3.1 Details of the Hong Kong Cross Harbor Tunnel projectPrinciple Date
Joint consulting engineers' report April 1961
Granting of franchise to HKCHT August 1965
Project out to tender October 1966
Tenders returned February 1967
Contract signed June 1969
Work began at site September 1969
Tunnel completed across harbor February 1972
First traffic through tunnel August 1972
Tunnel opened formally October 1972
(Source: A. J. Smith: Privatized Infrastructure)
3.2 Project Analysis
The franchise is 30 years from the start of construction work and the government
retains all rights of ownership on and over the land. The franchise company was required
to have a minimum of paid up share capital of not less than HK$ 80 million.
The costs for which the project company had to pay the government include the
following:
* HK$75,000 per year for use of the land of approaching road during the
concession period.
* HK$12,355 per year for the rental of area upon which any toll structures are
build
* A royalty to government of 12.5% on all operating receipt

* HK$ 12 million for the construction of road works and approach roads by the
government
Within one year, the tunnel was approaching its design capacity. By 1979 the
tunnel was approaching its design capacity of 90,000 vehicles per day, and by 1984
traffic was running at over 100,000 vehicles per day. Present day traffic flow is about
120,000 vehicles per day. After four years (1976) of operation, the tunnel began to make
profit, and by 1977 all debt was paid off. By the early 1980, the project was described as
a "cash cow". A 1986 local newspaper article stated:
the Cross Harbor Tunnel Company generates the sort of profits that many firms only dream of -
HK$ 144 million after taxes on a turnover of HK$ 269 million.
Their financial model identified interest rates as the controlling sensitivity factor,
and the scenarios they projected the interest rate as 6, 7, and 8%. However, during the
period of in which the tunnel was built and paid for, the prevailing interest rate was 5%.1
In 1974, the Cross Harbor Tunnel Co. Ltd offered 25% of its equity to the public after
first refusal by the ferry companies. Within a year, the market price of the shares tripled.
A HK$5 passage tax was imposed by the government, raising the toll to HK$10. Among
the HK$10, the government receives about 61% of the total toll revenue. Figure 3.1
shows the distributions of revenue among the parties. The company report for 1992 gave
44,912,073 vehicle journeys for the year which equates to 85 vehicles/minute going
through 14 booths. The same report gives the operating profit after tax as
HK$236,362,000 which translates to $450/min. This early example of BOT has been
approved a success in all aspects.

Figure 3.1 Distribution of Revenue
HK$
$1.21
$1.
This BOT do create a win-win situation for all parties- lenders are happy for the
debt are paid off quickly; the shareholders are happy for the project is profitable; the
users are happy as evidenced by their continued patronage. There are several factors
contributing to this success:
* The cash flow stream is one of the most important factors in BOT project. To
create such win-win situation, the financial projection based on the forecasting
of traffic volume is very important. The forecasting was done by the UK Road
Research Laboratory. Their report gave three scenarios of prediction termed
as minimum, probable and possible traffic. From Table 3.2, we can tell the
prediction is very accurate that the cash flow projection falls in the expected
range.
Asia Magazine. February 1993.
* Hong Kong Government(royalties, wayleave rates)
* Hong Kong Governmentpassage tax
O Operation Expenses
0 Shareholders Profit

* Higher than expected traffic flow was generated by the vibrant economic. The
GDP at that time increased at an average of 6.8% each year reaching a level of
US$14,545 between 1981 and 1991.
* Construction cost overrun and completion delay risk are efficiently avoided.
This is done by adoption of new construction techniques by a team of
experienced contractors and consultants
* Lower than expected interest rates (8%) for the construction phase
* Early completed of the project. The initial schedule was 54 months but the
actually period is 35 months, which is almost one and half year ahead
meaning a earlier cash flow generated and debt payoff
* The political risk are largely mitigated by the sponsor of Britain's prime
minister Harold Wilson in pushing through loan agreement without Hong
Kong Government guarantees
This project, certainly one of the first true modern-day BOT project, shows that
government was taking an approach in many ways similar to the historical pattern of
British colonial administration. The administration government would be willing for the
private sectors to involve if they were prepared to take the risks.
As mentioned before, the clauses for the payment of the construction of roads,
and the rental for using ancillary roads show that government was unwilling to take any
risk of the project. In such case, all of the risks involved are 100% assumed by the
concessionaire and lenders, and all these risks were appropriately mitigated or
compensated by the vibrant market. However, as we can see from this early scheme, if
one possible damaging outcome occurs, the franchisee would be easily in a financial
difficulty without the back up of local government. In such case, the risk exposure to the
consortium is relatively higher to the other BOT schemes with the supporting from the
host government directly or indirectly. Therefore, from the sponsors' perspective, this
relies on a more efficient risk management during the development, construction and
operation phases.
However, usually things don't go so smoothly. The economic may fluctuate thus
the demand may not be expected; the interest rate may not be as low as expected thus
resulting in a higher borrowing cost. Therefore, in order to achieve a win-win solution,
the host government should take part of the risk instead of leaving it to the sponsors and
lenders. As we can see from the next chapter, the local economic is on the downside
while the Taiwan's BOT project is on going. As a result, the consortium almost failed to
acquire the required funding and resulted in the delay of the construction.
Table 3.2 Predicted and Actual Traffic Flows for Hong Kong Cross Harbor Tunnel
Year
1972
1973
1974
1975
1976
1977
1978
1979
1980
1981
Actual
26174
34190
38915
41626
49480
59348
74121
87178
95632
104613
Predicted
Probable
38509
40562
42615
44669
46723
Not given
Not given
Not given
Not given
Not given
Minimum
24787
26118
27450
28781
30113
31445
32776
34108
35439
36771

1983 108187 Not given 39435
1984 100763 Not given 40767
(Source: Joint Consulting Report 1961)
I · 1 I I

4 Case Study: Taiwan High Speed Rail Project
4.1 Introduction
4.1.1 Project Background
The concept of private sector participation in the infrastructure project is not new
in itself. In France, most major infrastructure facilities (railways, electricity, etc)
established in the late 19 th and early 2 0 th centuries, were initiated by some foresighted
businessmen who considered these projects as economically viable and technologically
feasible. The same thing occurs in the United States and many other industrialized
countries.
In Taiwan, there are three reasons for government to adopt the BOT scheme
toward High Speed Rail project.
First, after the rapid economic growth during the 60s and 70s, Taiwan had
accumulated abundant capital resources to finance its own infrastructure projects. At that
time, most of the infrastructure projects are funded directly by government as it could
finance the project with adequate capital instead of pledging outside resources. After the
80s, however, due to the increasing size of project and the complexity involved, projects
need more tremendous investments, which might soon wear down the government's
budget. Second, government attempted to distribute more resources on the other areas,
such as education, high-tech research, art and social welfare. This reallocation of
resources thus resulted in a big gap between the desired and available funding for project
financing. Third, government is continuing to pursue an aggressive program toward the

high-tech industry, which has made Taiwan as the 3 rd largest countries in computer
hardware production. The international financial community continues to recognize
Taiwan's economic strength and potential to grow through their investments in large-
scale projects. Taiwan's economic achievements have resulted in an average increase of
6.4% per capita income over the past 10 years (1988-1998) 1. In order to meet the
requirement for future growth, a rapid public transportation system is needed to keep
pace with economic growth.
Therefore, a new delivery system is needed to cover this gap while at the same
time support the development of the infrastructure project. Under these circumstances,
one important approach proposed for building new infrastructures facilities is the build-
operate-transfer (BOT) concept. The Taiwan High Speed Rail System (THSR) linking
Taipei and Kaohsiung is first selected as a justification in which HSR is funded, built,
and operated by the Taiwan High Speed Rail Corporation, Ltd. (THSRC) for a defined
period (35 years of operation concession and 50 years of land development). This railway
system provides a new and rapid link along the West Corridor, which is the most
populated area on island. Most of the economic activities are distributed along this
Corridor acting as a transportation artery connecting Taipei (North) and Kaohsiung
(South).
4.1.2 Project Development
In the early time of the project, the government planned to develop a new
transportation link connecting West Corridor by fiscal budget. After a long time of
feasibility study, technical research and statute legislation, the government decided to
1ROC Ministry of Economic Affairs Report.

switch from the original scheme to BOT approach, which allowed the private sectors to
participate in infrastructure project. Soon after the delivery mechanism had been decided,
the project was contracted out with a total of NT$ 431.6 billion (US$ 14.4 billion). In the
following, the detail of how this transition occurs and how the contract was awarded will
be discussed.
The HSR has been part of Taiwan's long-term policy since 1989. The High Speed
Transit System 2020 (HSTS) study completed in 1990, outlined pairs of arterial transport
systems linking major cities. HSTS also outlined a High Speed Rail system to collect and
distribute inter-city passenger trips along the West Corridor. Following describes how the
project developed and finally transited to the BOT.
In 1989, the Ministry of Transportation and Communications (MOTC) pursuant
to section 1113(3) of the Environmental Planning and Assessment Act 1989 (EPA),
exhibited an Environmental Impact Statute (EIS)l in respect of the proposed two tracks
around 400 km in length from Sung-Sang (next to downtown Taipei) to Dro-Inn (next to
downtown Kaohsiung). As a result of the EIS process and in view of the submissions
received, which indicated a broad community concern over the project, the Government
convened a Commission of Inquiry. 2
In 1991, the Commission of Inquiry suggested that the project should not be
constructed under fiscal constraints, and an upgrading of the existing north-south
traditional rail system with improvement in other transportation vehicle should be
implemented in priority. As a result, the Government did not accept the Commission's
findings.
1 ROC Ministry of Transportation and Communication2 MOTC #1173 Report.

In September 1992, the then Minster of MOTC announced the preparation of an
EIS relating to a HSR link for West Corridor. As a result of the EIS, a proposal
containing the main elements of the HSR and accessing transit links, and land acquisition
form State owned enterprises emerged. The MOTC was the proponent of the proposal
within the meaning of the EPA Act and proposed a fixed price construction project with a
HSR Authority bearing operation responsibility.
A formal decision, in accordance with the EPA 1989 to build the HSR link was
made in 1993 by the Minster of MOTC. At the Legislative Yuan's Capital Works
Committees meeting of 1995, the Premier of Council of Economic Planning and
Development advised the MOTC granted approval for the POHSR to call form
expressions of interest for the construction, financing, and operation of the HSR. The
Capital Works Committee of Cabinet has given its approval for the MOTC to seek
Expressions of Interest from private sector participation and has not committed the
provision of Government funding for the project. The document of Seeking Expressions
of Interest explicitly stated that the registered private sector proponent will be expected to
bear all the construction risk and traffic risk and that bids should be developed on this
basis
Invitations for Preliminary Proposals to finance, design, construct, operate, and
maintain the HSR were received in 1997 from two proponents: Chinese HSR Consortium
and Taiwan HSR Consortium. MOTC-instituted Assessment Panel evaluated each
proposal against the published criteria and declared the Taiwan HSR Consortium was the
first priority selection to negotiate on the project. The Assessment Panel considered that

the THSRC proposal provided the best offer for provision of the link and recommended
THSRC to undertake a more detailed investigation and submit an affirmative offer.1
Finally, the Government signed up the Construction & Operation Agreement
(C&O A) with the Consortium for the design, construction, operating, and maintaining of
the project. The Taiwan High Speed Rail Corporation (THSRC) was formed and
registered in May 1998 and the C&O A was signed in July the same year. The concession
calls for THSRC to build and operate the Taiwan High Speed Rail for a period of 35
years. It also grants THSRC the right to undertake property development around station
areas for a period of 50 years. Underlying is the timetable for the development of THSR
BOT project.
Table 4.1 Timetable for the develonment of HSR nroiect
ortant Milestones'C Institute of Transportation Commissions AmDec andese Engineering Consultant Incorporation to perform a Highad Rail feasibility study.:utive Yuan approves the establishment of High Speed Railaratory Office (now changed to Bureau of Taiwan Highad Rail)
:utive Yuan approves High Speed Rail route
slative Yuan passes enactment of the "Statute for)uragement of Private Participation in Major Transportationistructure Projects"slative Yuan passes High Speed Rail Plan with attachedlition that private investment must be 40% or greaterronmental Protection Administration, Executive Yuan,aws and approves the environmental impact assessment forHigh Speed Rail Plan..au of Taiwan High Speed Rail announces that it will solicitate investment in construction of the High Speed Railem via a BOT model.Executive Yuan agrees in principle to add Miaoli, Changhua,Yunlin stations.selection committee evaluates Taiwan High Speed Railsortium as having the best application proposal.
1 Guidelines for Private Sector Participation in the Provision of Infrastructure
--- ~ -- ~~------- '- "---

ntract negotiations between Bureau of Taiwan High Speedil and the Taiwan High Speed Rail Consortium are completed.
e Taiwan High Speed Rail Corporation is formally established.
e MOTC signs a construction, operation and station areavelopment contract, a memorandum items committed byvernment and a contract performance memorandum with thewan High Speed Rail Corporation.
Sources: BOTHRS
4.2 Risk Analysis
4.2.1 Problems
THSR BOT project currently fall behind a lot from its initial schedule. According
to the C&O Agreement, the project was supposed to start the construction work in June
1998, but not until August 1999 did the THSRC secure sufficient financing for the
project. There are three main reasons for this delay:
1) The concession company cannot acquire sufficient loans from banks to start the
project. The syndicate of bank is lack of confidence in the viability of the project
and lack of any security for their loans, in this sense that they consider the
investment is too risky and the expected return is not enough to cover their risk.
2) Fault by government. The government was responsible for most of the preparation
work, including land acquisition, approaching road construction and the related
statue legislation. There is a delay in the land acquisition, which is agreed to be
100% acquired before the construction starts.
3) Asia Crisis. After government contracted the project, the Asia Crisis hit almost
every east-Asian country including Taiwan. The result is obvious that banks and
financier were tightening their lending policy and took a more precautious
approach toward risky investment. Besides, the sponsors were also suffering
losses from the currency exchange especially in the imported material and foreign
technical support.
Although most of the failures occur in the development phase so far, the other
risks do exist in other phases will also be discussed. The answers for these problems can
be concluded from the previous case study and the risk management model mentioned
before.
4.2.2 Risk Allocation
Based on the previous case study and several techniques stated before, the risks
associated with the THSR Project are first identified and group by different phases of the
project. Then the methods of how these risks are mitigated and allocated among different
parties are discussed.
Development Phase:
1) The land acquisition delays risk. The government should assume this risk. As
stated in the contract, there is no rigid time schedule for delivery of the land.' This
put the consortium in a more risky situation. As proved from the case, part of the
construction work is delayed by the land acquisition process. By establishing the
exemption provisions or force majeure clause, the risk of consortium can be
shifted while the government is unable to provide the land according to the time
schedule. A good example is the Indonesia toll road projects (Sidney Levy, Build,
Operate, Transfer), the government takes a successful role in expediting the
process. Government should communicate with the legislative body to dispatch
HSR BOT contract chapter 3: Execution Provisions

the budget and the change of statutes. Besides, government should enforce the
acquisition law more determinedly to avoid any disturbance or delay which might
cause losses to the project.
2) Credit Risk. This is one of the most important risks involved in our case, since
most of the delays are caused by the inability to acquire sufficient loans. Although
the consortium consists of many top end companies, the creditworthiness is still
low due to the inexperience of the involving parties, and thus creditworthiness is
solely based on the credit of the project. In order to solve this problem,
government should play a very important role as a facilitator/guarantor or investor
in the project. To increase the credit of the sponsors or project, there are two
approaches to solve this issue.
First, government takes part in the loan portfolio as a creditor, such as
providing "soft loan". In accordance with Article 22 of the Statute for the
Encouragement of Private Participation in Major Transportation Projects
(SEPP), the government provides a US$ 9.3 billion favorable mid- or long-
term loan to the project company1 . A good example is the successful
Malaysian North/South Highway BOT project 2, in which the government
allocated a loan of US$235 million towards construction costs of the project,
repayable over 25 years a fixed annual interest rate of 8%. From the
government perspective, as an investor, it is required by the public to be
more active on the operation and management of the project. From the
BOTHSR website: Financial report.2 C Walker & Smith: Privatized Infrastructure: Chapter 14.

lenders' perspective, this provides the lenders some kind of level of
guarantee that the project is economically viable.
Second, establish an agreement to secure the senior debt. The security under
a secure loan can be of any asset, predetermined rights or the on-going
project. However, there is no guarantee that a security agreement can be
easily perfected and enforced if the principal is in difficulty. Government can
reinforce the secured agreement by guarantee the lenders that a minimum
portion of the secured asset would be liquidated to the syndicate. According
to the recent report', the THSRC has already secured sufficient loans under
the condition that the government commit the loan of Long Term Fund and
assist in establishing the Tripartite Contract, which sets out payment
procedures and methods of the price for the enforced purchase that will be
made upon the expiry of C&O Contract. This is to protect the best interests
of syndicate.
Construction Phase
3) Completion Risk/Performance Risk. This risk is usually assumed by the
sponsor and the government. The consortium (THSRC) has to provide a $500
million completion bond until six months after the entire HSR line is complete
and operational.2 This risk is allocated partially to the contractors and
subcontractors once the project is mobilized into the construction phase in the
form of providing performance or completion bond. This risk is reduced by the
active and fully participation of the government in the project as a supervisor. For
1 Newsletter of BOTHSR, February 05, 2000.2 HSR BOT Contract Chapter 3: Execution Provision

example, the MOTC request the consortium to provide management report on the
progress in the design and construction of the HSR, and the contents of the design
examination report shall be set out in the quality guarantee plan. This helps to
track the problems regarding to the project instantly instead of facing a failure at
the final stage.
4) Interest Rate Risk. Under the current agreement, the government agreed to cover
all the losses due to the changes of interest rate from the date of the contract
submitted to the end of the concession period. In addition, the interest rate on
long-term fund is fixed. For the other floating-rate basis loans from the
commercial banks, the risks can be eliminate by entering into an agreement with a
financial institution under which it agrees to pay fixed rate of interest and receive
a floating rate of interest. This scheme can be illustrated as Figure 4.1. The
project sponsors receive a loan from bank by paying LIBOR PLUS 1% interest;
by entering into another swap contract, the sponsors pay a fixed rate interest of
8% and receive a LIBOR in return, so the total interest rate the sponsors have to
pay is fixed at 9%.
Figure 4.1 An Interest Rate Swap
Swap
CounterpartyLIBOR-
Source: John Finnerty. Project Finance
5) Foreign Exchange Risk. The Asia Crisis had totally collapsed the local
economics. One obvious effect is the devaluation of local currency. In Taiwan,

the currency is devalued almost 30%.1 Though the revenue is paid in NT$, some
of the expenditures, such as consulting fee, railway electrical sub-system
construction and imported material are paid in foreign currency. This results in
the increasing of the costs. According to the estimation of the THSRC, the total
amount due to this loss is around US$ 0.5 billion.2 The consortium neglected this
economic risk since the then economics was vibrant and almost no one would
expect a financial crisis. This risk is usually assumed by the sponsor. The
sponsors can reallocate this risk in the currency future or forward market for the
short-term cash flow; for a long-term cash flow or payment, it is more appropriate
to hedge the risk in currency swap market.
6) Reliability Risk. This risk is assumed by the sponsors and contractors. The
consortium is requested to provide submit an insurance pal to the MOTC for their
reference and records within three months after signing the BOTC.3 The
contractors, suppliers and professional consultants are also required to apply for
insurance plan under the regulation of Comprehensive Property Insurance and
Public Accident Liability Insurance.
Operation Phase
7) Income Risk. From the Hong Kong Cross Harbor case, for the type of toll road
BOT project, the income projection depends largely on the prediction of demand.
In that case, the actual demand is higher than the expected due to the strong
vibrant economic, which stimulated the local demand. In respect of income
stream, it is very risk in the sense that the market will fluctuate intensively with
1Ministry of Economic Affairs: Statistics Information Database2 THSRC website: financial report of HSR.3 HSR BOT Contract Chapter 3: Insurance

the economic, which might totally out of the control and expectation. One widely
used method is to provide a guaranteed market, for which the government and the
sponsors share the income risk. This arrangement includes the traffic volume
support agreement, and the "no second facility" protection. In the case of traffic
volume support the government guarantees a minimum of level of revenue. "No
second facility" protection, where the government guarantees that there would be
no competing facilities for a specific time, could provide the consortium with a
monopoly, so this technique is used with cautious. In addition, the government
also granted the rights to develop the commercial real estate along the
transportation facility. This incentive attracts the sponsors for the potential
revenue projection based on the expected prosperity of the surrounding area.
8) Political Risk. Tax incentives. Providing the concession company a tax deduction
on income as an incentive to promote the future operation of the project and relief
part of the tax burden. Besides, the government guarantees the tax rate would be
fixed during the operation phase to reduce the risk of change of policy.'
4.2.3 Summary
Based on the above risk analysis, most of the risks, whether already mitigated or
not yet specified in the contract, the government does take an important in the risk
sharing, no matter in the role of a facilitator, guarantor or a regulator. Recently, the role
of government has assumed more and more importance in securing project finance. As
competition for available financial resources intensifies, the lenders look on more solid
evidence of investment. In this sense, the sponsors need more solid and strong supports
1 HSR BOT contract Chapter 3.

from the government to increase its creditworthiness and mitigate its risks as well. In
THSR case, one year after the project contracted out, the syndication lenders finally
committed to the loan, based on the participation of government in the form of a
favorable loan and a guarantee from the government that the best interest of the lenders
would be protected. Besides, the government also plays a significant role that makes it
easier for both consortium and lenders to assess and reduce the various political and
economic risks involved. Following is a summary table of the role of government in the
risk sharing of THSR BOT project.
Table 4.2 Role of Government in Risk Sharing Mechanism of THSR Project
Risk Role and methods used by Government
Land Acquisition Risk Regulator: enforcing acquisition law.
Facilitator: expedite the budgetary legislation.Credit Risk Loan Creditors: long-term favorable fund;
Guarantor: Tripartite Contract.Completion/Performance Risk Supervisor: supervise the C&O process
Consumer: keep maximum interests of the publicInterest Rate Risk
Provide a fixed interest rate loan.
Reliability Risk Regulator: Request insurance for all parties under
current statute.Income Risk
Guarantor/Promoter: guarantee the minimum revenue.
Political RiskPromoter: promoting the project, such as tax reduction.

5 Conclusion: Role of Government
In chapter 1 and chapter 2, we discuss how the risk is managed and what type of
risks are associated with BOT project. In chapter 3, through studying the HK Cross
Harbor Tunnel project, the risks associated with this toll-road type BOT project are
identified and the approaches used to mitigate the risks are also discussed. Finally, the
main objective of this thesis is to apply the risk management model build in previous
chapters attempts to examine and testify the on-going project, Taiwan High Speed Rail
Project, to find out what the problem is and how the project was deferred at its initial
stage.
Through these analyses and comparisons, it demonstrates a clear point that the
government plays a critical role in the risk allocation mechanism of BOT project.
Although the role of the host government is an owner in the BOT contractual structure,
there are many facets in which the government also plays an important role to create a
win-win situation. This can be characterized as two groups: traditional (passive) role and
active role. The traditional role of government is identified from a historical perspective
and clearly demonstrated in the typical BOT contractual structure as a regulator and
inspector. The active role refers to government taking a more positive and dynamic role
as a facilitator/guarantor, promoter and customer to assist in the success of the project.
The main topic covered by this paper is to give an overview on the different facets of
government and how it helps to reduce and allocate the risks among the other parties.

5.1 Passive Role: Owner as Regulator/Inspector
It is government's theoretical role to intervene the private business and protect the
maximum interests of the public it represents. These safeguards might be legal or
economic, and the extent of intervention depends on the general level of economic
development and the government's own perception of the stability in the society. In
THSR project, there are some aspects, in which the government appropriately intervenes
as a regulator/inspector:
a) Government's role as regulator will usually be give effect through its legislative
powers. For example, in our case, the land acquisition law is enforced by the
government, which takes the advantage of its authorities toward public interests.
Others statutes, such as the Public Accident Liability Insurance, requires all the
parties involved are under this cover. This is also to protect the public interests in
case of any damage to the public property.
b) As an inspector, the government appropriately intervenes in the construction and
operation of the facility. This is accomplished by each incremental step of each
phase to correct any error or identify any operation problem before the whole
system is failed, such as providing the operation statement each month or by each
critical time stand. This is specifically appropriate in our case since both side
(regulator and sponsors) are lack of experience in this debuting BOT project thus
resulting in increasing the risk of failure. The purpose of this intervention is to
ensure that the facility is constructed, used and maintained in accordance with the
specifications and agreements.
100

Besides the above statements where we can see the proper role of
regulator/inspector in this project, I would also like to point out some issues that need to
improve. My recommendations are as follow:
a) As a regulator, the government should enforce the law more determinedly such as
to avoid the land acquisition delay.
b) Although this is the first BOT project in Taiwan, there will be many projects
introduced or proposed in the near future. It is urgent for government to establish
a mechanism for ensuring compliance with the requisite rules and regulations for
BOT project.
c) Inspection on the monopoly of the THSRC. Although it is essential to provide a
guaranteed market as an incentive for the sponsors, the government is also
required to pay attention to this issue to avoid the negative effects such as
overpricing and unsatisfactory services.
5.2 Active Role: Owner as Facilitator/Guarantor/Investor
Basically, there are two ways for government to facilitate the use of private
sector investment in public infrastructure project. First, by making it easier for private
sector to assess, control and reduce the various political, sovereign and economic risks
involved. Second, by using a variety of inducements and guarantees to make the
investment more attractive to potential funders in terms of increased returns or in terms of
greater safeguards for the revenue stream.
In THSR, the role of government as a facilitator is as follow,
a) Tax incentives. Provide tax deduction on revenue stream.
b) Interest rate. Provide a favorable fixed interest rate long-term loan.
101

c) Guaranteed market. Establishing "No second facility" agreement to guarantee
there will be no similar facility to compete with the current project.
d) Property development rights. Government granted the rights to the sponsors to
develop the commercial real estate along the line of the transportation facilities.
This is one of the most important incentives for the sponsors.
My recommendations for improvement are as follow:
a) As a facilitator, the government should speed up the budgetary legislation for land
acquisition. Until now, the legislative body approves only 80% of the total cost. 1
b) The currency exchange rate is very unstable while most Asian countries are
suffering from the financial crisis. It is an effective and powerful incentive to
attract international funders, construction companies or electrical system
designers by inducing the exchange rate guarantees. It can also reduce the risk of
cost overrun assumed by the sponsors. In fact, as mentioned before, the THSR
final total cost is increased by around 5% due to the cost increase in imported
materials and supplies.
c) As far as we know, not until the government does approve the soft loan did the
syndicate lenders commit to their financial support to the consortium. Although
this put the government in a debt holders' position, a emphasis on public interest
and to create a win-win situation is more important than anything else. This
reveals a more convincing evidence of the important role of government as a
facilitator.
102
i BOTHSR website. "Financial Report"

The government acts as a guarantor mostly on the trilateral relationship between
the sponsors and the lenders. The bankers are the one who are concerned about whether
their loans would be paid in accordance to the contract. So it is very important for the
lenders to evaluate and assess the project revenue stream based on the creditworthiness of
the project and the project company. However, since there is no relative previous history
regarding the project, the creditworthiness of the project is so low that the syndicate
banks are unwilling to take the risk. My suggestions for the government to increase the
creditworthiness of a risky, debuting project are as follow:
a) Debt holders. By providing the long-term soft loan, the government is assumed to
actively participate in the risk/return portfolio of the project for a specific time, in
which reduces the creditworthiness risks born by the lenders.
b) Tripartite Agreement. As a guarantor for the tripartite agreement, the government
guarantees the syndicate banks of the project asset as a security and the minimum
default reimbursement. This is to ensure the maximum profits of the lenders are
protected.
5.3 Summary
Due to the inexperience in BOT project, Taiwan government, in High Speed Rail
Project, committed the mistake that it considers itself as simply a host owner with
minimum risk. In order to create a win-win situation, an aggressive and active
participation of the host government is necessary. Government can accomplish this
objective by taking the role of facilitator, guarantor, investor, and regulator and assume
part of the risks to create the maximum benefits of the public and society.
103

References
A.J. Smith. Privatized Infrastructure: the Role of Government. Thomas TelfordPublishing, 1999
Alan C.Shapiro. Multinational Financial Management. Prentice Hall, 1996
Beileman, Carl and Fletcher, Donna. "On Allocating Risks: the Essence of ProjectFinance". Sloan Management Review. Spring 1990.
C Walker and A. J. Smith. Privatized Infrastructure: the BOT approach. Thomas TelfordPublishing, 1995
Carol A. Heimer. Reactive Risk and Rational Action: Managing Moral Hazard inInsurance Contracts. 1988.
Eric Lonergan. "Bridging the Funding Gap". Project & Trade Finance, 1995
J. Frank Yates. Risk Taking Behavior. John Wiley & Sons, Inc, 1992.
John D. Finnerty. Project Financing: Asset-based Financial Engineering. John Wiley &Sons, Inc. 1996
Jose A. Trujillo. "Infrastructure Financing with Unbundled Mechanism". Financier, 1998.
Martin Stewart Smith. "Private Financing and Infrastructure Provision in EngineeringMarkets". Law Policy in International Business, 1995
Nathan Kogan, Michael Wallach. Risk Taking. Greenwood Publishing Group, 1983.
Peter K. Nevitt. Project Financing. Euromoney, 1989
Peter Thomson and John Perry. Engineering Construction Risk. Thomas Telford ServicesLtd, 1992
Pompiliu Verzariu. "Developments in China's Power Sector". Journal of Project Finance,1997
Richard A. Brealey and Stewart C. Myers. Principle of Corporate Finance. McGraw Hill,1996
Richard F. Griffiths. Dealing with Risk. Manchester University Press, 1983
Roger Flanagan and George Norman. Risk Management. Blackwell ScientificPublications, 1993
104

Sim B. Sitkin. The Legalistic Organization. 1994
Tiong, Robert. BOT Project: Risks and Securities. Construction and Economics, 1990.
Sydney M. Levy. Build, Operate, Transfer: Paving the Way for Tomorrow'sInfrastructure. John Wiley & Sons, Inc. 1996
World Bank. Private Participation Infrastructure Database. World Bank
World Bank. "Infrastructure for development". World Development Report 1994. WorldBank, 1994
Zur Shapira. Risk Taking: a Managerial Perspective. Russell Sage Foundation, 1995
105