Embed Size (px)
Citation preview
Risk Management Beyond VaR Page 1 of 22 10-Apr-2013
Risk Management Beyond VaR David M. Rowe
President David M. Rowe Risk Advisory
Federal Reserve Bank of Atlanta
2013 Financial Markets Conference April 10, 2013
The Rise of Value-at-Risk
In the mid-1980s, a series of huge, well publicized and highly embarrassing losses occurred at some of Wall Street’s biggest and supposedly most sophisticated trading firms. These events gave birth to financial risk management as a distinct professional activity. In the 25 to 30 years since then, many tools and techniques have been developed to measure, monitor and (hopefully) control risk. The common characteristic of virtually all this work is that it utilized classical statistical techniques to derive measures of short-term volatility. The poster child, or whipping boy depending on your point of view, for this technique is what we have some to know as Value-at-Risk or VaR. Some analysts, such as Nassim Nicholas Taleb, argue that this entire enterprise was simply wrongheaded and positively dangerous. I beg to differ.
For better or worse, I am old enough to remember the world before VaR. Market risk controls consisted of a complex web of micro position limits. In the fixed income arena, these included:
controls on total net duration adjusted open positions
limits on duration adjusted mismatches at multiple points along the yield curve,
a limit on the sum of the absolute values of such tenor specific mismatches,
gross position limits and
issuer concentration limits.
In the options arena, this maze of limits included controls on
delta sensitivity for each specific underlying price or rate,
gamma sensitivity or the marginal change in delta as underlying prices changed, and
vega sensitivity to changes in implied volatility.
These limits usually applied both to sensitivities for individual underlying reference entities and to various aggregates of these sensitivities such as all equity positions or certain categories of equities grouped by industry, geography or credit rating.
Very importantly, this maze of limits conveyed no instinctive sense of how much risk they allowed. Market risk committees were repeatedly asked for higher limits despite having no real sense of the risks inherent in the limits already in place. In this context, VaR emerged as the first effective communication tool between trading and general management. For the first time it was possible to aggregate risks across very different trading activities to provide some sense of enterprise-wide exposure.
Like all useful innovations, however, VaR had notable weaknesses from the beginning. The first weakness of VaR was that, inadvertently or deliberately, it was oversold to senior management. Financial risk managers must bear some responsibility for creating a false sense of security among senior managers and watchdogs. For far too long,

Risk Management Beyond VaR Page 2 of 22 10-Apr-2013
many were prepared to use the sloppy shorthand of calling VaR the “worst case loss.” A far better alternate shorthand description is to call VaR “the minimum twice-a-year loss.” This terminology conveys two things. First it indicates the approximate rarity of the stated loss threshold being breeched. Second, it begs the right question, namely “How big could the loss be on those two days a year?” To put it bluntly, VaR says nothing about what lurks beyond the 1% threshold.
Victims of Our Hidden Assumptions
A central weakness of financial risk management has been to neglect the important distinction between “risk” and “uncertainty” that Frank Knight enunciated in his 1921 book Risk, Uncertainty and Profit. Knight defines “risk” as randomness that can be analyzed using a distributional framework and “uncertainty” as randomness that cannot be so analyzed. Situations in the “risk” domain are characterized by repeated realizations of random events generated by a process that exhibits stochastic stability or, at least, a high degree of stochastic inertia. In layman’s terms, this means that the nature of the randomness changes only slowly over time. Risk, in this sense, was the basic subject of Peter Bernstein’s well known book Against the Gods: The remarkable story of risk. It is not surprising that an early review by The Economist of what went wrong with risk management during the Global Financial Crisis was titled The Gods Strike Back.
By now, it certainly has become obvious that far greater attention must be paid to extreme tail events if risk management is to play a more effective role in drawing attention to lurking dangers. Unfortunately, achieving these improvements will not be easy. This is primarily because it requires more than a few narrow technical adjustments to our current practices. It is an all too common human tendency to fall back on techniques we know even if they are not really applicable to the problem at hand. As we often observe, “When your only tool is a hammer every problem looks like a nail.” Just tinkering with fat tailed distributions or applying some aspects of extreme value theory will not address “risk management beyond VaR.”
One of the most important lessons Nassim Taleb has driven home is that theoretical statistical methods have an inherent but often unrecognized bias when attention turns to the issue of tail risk. To be tractable mathematically, statistical distributions, even those with infinite tails, need to have moments that converge. The key characteristic that allows these moments to converge is rapid attenuation of the probability in the tails. If we measure the standard deviation, skewness or kurtosis of a normal distribution using ever wider segments of the real number line around zero, these estimates will converge toward limiting values. Absent sufficiently rapid thinning of the tails, moment estimates can diverge indefinitely, being effectively infinite. When we overlay a theoretical distribution on a finite sample, we typically choose a mathematically tractable distribution that “fits” the sample observations we have available based on minimizing some measure such as a squared error penalty function. Thus, by the very act of limiting ourselves to a mathematically tractable distribution, we have implicitly imposed rapidly diminishing probability density in the tails.
Having imposed (or fitted) a theoretical distribution on a finite sample, we then use the tails of that theoretical distribution to make assertions about behavior of the underlying process being examined. Taleb’s essential contribution is to hammer home the point

Risk Management Beyond VaR Page 3 of 22 10-Apr-2013
that this is both an invalid and a positively dangerous line of reasoning.1 An important implication of this is that improving our understanding of tail risk will require some difficult cultural changes rather than some minor adjustments to our distributional analysis.
Uncertainty must receive much greater attention and a larger share of the resources devoted to risk management. What organizations will find to be most difficult, however, is that a process for effective assessment of uncertainty is more holistic but also much softer, more amorphous and less easily defined than the things risk managers do currently. Such a process will require dealing with more unstructured information that is not amenable to precise quantification. Inputs from country risk officers, industry analysts and macroeconomists must be integrated into regular deliberations about risk. The success of such a process also will require senior managers to abandon the comfortable idea that all forms if risk, including fundamental Knightian uncertainty, can be reduced to a single summary statistic like VaR. If organizations are to have a reasonable chance to avoid the worst effects of the next crisis, executives and board members must be willing to devote the time and energy to grapple with risk in all its messy multi-dimensionality.
Stress Testing – Static and Otherwise
Stress testing is an obvious adjunct to measures such as VaR when seeking to address extreme tail risk. Unfortunately it is far from obvious how to implement stress testing effectively. We humans have a difficult time incorporating highly unlikely events into our thought processes. More often than not we either ignore them as too unlikely to be relevant or obsess about them beyond any justifiable degree of concern. Which of these extreme mental states prevails usually depends on whether we have recently experienced something that dramatizes a given event. Thus, most people today have an unrealistically high level of concern about the individual risk from a terrorist attack but worry little about being struck by lightning. This attitude prevails even though, for most of us in the industrial world, the odds of injury or death from these two sources are comparably remote. Surely this reaction is induced by recurring news stories of terrorism in action in several remote parts of the world.
Stress testing in organizational risk management is complicated by this human tendency to swing from complacency to obsession and back again. The usual reaction of many to any given stress test is to dismiss the exercise as useless because “that could never happen.” On the other hand, whole organizations can be paralyzed by fear in the aftermath of a specific disastrous event. The trick, to quote Kipling, is to “keep your head when all about you are losing theirs.” How then can an organization incorporate extreme stress scenarios into its decision-making without being whipsawed between complacency and despair?
A Three Pronged Attack
I believe that a useful starting point for stress testing is to apply a three pronged approach. The three components can be characterized as follows.
The Market’s Greatest Hits – This involves defining stress scenarios that replicate the relative changes in all applicable market variables for selected historical events. Typical historical events to be included might be:
1 Rowe, D. Op Risk and Black Swans, Risk magazine, September 2004, p. 114, also available at:
http://www.dmrra.com/publications/Risk%20Magazine/200409%20Operational%20Risk%20and%20Black%20Swans.pdf

Risk Management Beyond VaR Page 4 of 22 10-Apr-2013
The October 1987 stock market crash in the US
Britain’s forced withdrawal from the ERM in September 1992
Selected dates during the Asian currency crisis of 1997/98
The Russian debt crisis and devaluation of August 1998
to name a few.
The big advantage of this exercise is that no one can defend the position that “this scenario could never happen” because it has. The big drawback is that the market movements being simulated usually have nothing to do with the vulnerabilities of the current trading positions. While such simulations may alleviate the anxiety of some who lived through the trauma of these events, they represent a scattershot approach that is not guaranteed to highlight the sources of current potential for extreme losses.
The Achilles Heel Approach – This approach involves what I have termed “pessimization” and others call constrained loss maximization. The idea is to examine the existing portfolio in a systematic way to define its particular vulnerabilities and then construct stress scenarios that exploit these vulnerabilities to the full.2 Among other things, this type of exercise can reveal cases where traders are systematically “selling the wings” by writing out-of-the-money options. Often this will not become obvious in standard VaR results without analyzing the market scenarios that generate losses beyond the 1% cut-off point.
Structural Imagination – The third prong of a comprehensive approach is to use structural imagination in assessing current socioeconomic and geopolitical conditions to define dangerous scenarios. This requires thinking through both the initial and potential secondary effects of a hypothetical disaster. Like the market’s greatest hits, this approach fails to tailor the scenarios to current vulnerabilities. In contrast, however, it is forward looking and driven by current external conditions. The exercise also is useful in forcing an assessment of secondary implications that may not be immediately obvious. Furthermore, by engaging a wide range of staff from a variety of functions across the institution it can stimulate thought about how to respond. Such advance thinking about consequences and potential responses can facilitate faster reaction in the midst of an actual crisis when speed is of the essence.3
Beyond Comparative Static Analysis
A legitimate criticism of traditional stress tests, including those based on the three-pronged approach just described, is that they are purely exercises in comparative static analysis. Part of the reason such stress tests are only part of the answer is that crises rarely occur instantaneously. The closest example I can think of to a one-day crisis is the almost 23% drop in the Dow-Jones Industrial Average on October 19, 1987.
In general it is good to keep in mind Einstein’s admonition that, “The only reason for time is so that everything doesn't happen at once." Every major crisis unfolds over time rather than instantaneously. Certainly the Global Financial Crisis did so. The typical pattern is that some harmful events create immediate damage and also create weaknesses elsewhere. This increased the chances that further events, which might
2 See Rowe, D., Building Pessimized Scenarios, Risk magazine, January 2006, p. 90, also
available at: http://www.dmrra.com/publications/Risk%20Magazine/200601%20Building%20Pessimised%20Scenarios.pdf 3 Excellent examples of stress scenarios based on imagination are those described in the
Financial Risk Outlook series published annually by the UK Financial Services Authority.

Risk Management Beyond VaR Page 5 of 22 10-Apr-2013
otherwise have been absorbed with limited impact, will create further damage, creating additional weaknesses, and so forth.
This pattern implies the need to think about stress scenarios in dynamic as well as static terms. Clearly such scenarios cannot be modeled at the level of detail that is possible for comparative static analysis. Indeed, trying to do so will result in the exercise bogging down in unsupportable detail. Gaining insight into the broad, although sometimes loose, cause and effect process that could play out over time is the important point. Such thinking is similar in spirit and substance to war game exercises conducted by the military. It has two big advantages. It can alert us to early warning signals of circumstances that might trigger initial harmful events. By thinking through the potential impact of the initial events, we also can gain insight into their potential secondary and tertiary implications over time. In some cases this will allow organizations to insure, hedge or, more likely, avoid the consequences of such follow-on events.
The Myth of Sisyphus
In the end, of course, stress testing is a bit like trying to cure the common cold. Like infectious viruses, crises come in too many varieties to allow a single silver bullet solution. The effort to anticipate a crisis and protect against its consequences is rather like Sisyphus and his stone that always rolls back to the bottom of the hill no matter how many time he laboriously shoves it to the top. Nevertheless, applying a three pronged approach to comparative static analysis combined with thoughtful consideration of dynamic scenarios can do a great deal to limit exposure to a potential crisis and to assist in responding more effectively when a crisis actually does occur. In all this analysis, however, it is imperative that we make a concerted effort to learn from past mistakes and to absorb lessons from relevant research outside our own area of expertise. It is to these that I now turn.
Lessons from the Subprime Crisis
There is an old Norwegian proverb that says, “Too soon old, too late smart.” Certainly many of us had this feeling after the sudden collapse of the subprime mortgage market in late 2008. If we are unwilling to take a hard look at where our thinking failed, however, we run the risk of being “Too soon old, never smart.” I certainly do not claim that what follows is an exhaustive list of places where our thinking went wrong, but these are the lessons that stand out in my mind
Beware Statistical Entropy
At the heart of most risk analysis techniques developed over the past 25 to 30 years lies the methods and assumptions of classical statistics. Central to these methods is the assumption of a “stable random process.” In such a process, the value of any single draw is unknowable in advance but sizable samples will exhibit broadly similar characteristics such as the mean, the dispersion (standard deviation), the degree of symmetry or lack thereof (skewness), the tendency for probability in the tails to dwindle rapidly or slowly (kurtosis). The larger the sample size, the more nearly identical will such characteristics be across randomly selected sets.
Classical statistical analysis recognizes that sampling techniques can never produce fully exact values for these characteristics and has developed measures for the uncertainty of such estimates. The most common of these is the “standard error of estimate,” which is simply the standard deviation of the implied distribution of possible values for the true underlying parameter.
Risk Management Beyond VaR Page 6 of 22 10-Apr-2013
What is vital for general business executives to recognize, however, is that these errors of estimate assume stability of the underlying stochastic process. This is often a realistic assumption when dealing with physical processes. It is virtually never the case, however, in a social scientific setting. Structural change is the constant bane of econometric forecasters. Such changes are driven by a wide variety of influences including technological advances, demographic shifts, political upheavals4, natural disasters and, perhaps most importantly, behavioral feedback loops.
Structural change creates a fundamental dilemma for socio-statistical analysis. Classical statistics argues that the more data the better since, assuming stochastic stability, this results in smaller estimation errors. For analysis based on time series, however, a larger data set implies incorporation of a greater range of structural changes that undermine the classical assumption of stochastic stability.
This makes it all the more important for risk managers to focus obsessively on what I call “statistical entropy.” Like water, information can never rise higher than its source. In the case of information, that source is the set of data on which an analysis is based. In assessing the reliability of any risk estimate, including such things as credit ratings, always start with a review of the volume and quality of the available data. No amount of complex mathematical/statistical analysis can possibly squeeze more information from a data set than it contains initially.5
A glaring example of failure to focus on the weakness of the available data was the way many banks and investors blindly accepted the AAA rating for senior tranches of subprime mortgage portfolios. Before the crisis, such holdings were often treated as equivalent to AAA corporate bonds. Of course, rating agencies have about a century of experience in rating bonds. This provides a wealth of experience and data to support the effort. Subprime mortgages were a fairly recent phenomenon and their default experience had been dominated by a period of comparatively benign housing markets with stable to rising prices. Determining how much subordination was necessary to bring the chance of any failure of timely payment of principal or interest down to a target level required making an estimate of behavior deep into the tail of the default distribution.
A casual look at the available data for conducting this analysis would have made one thing clear. Any estimate of the required level of subordination would necessarily be surrounded by significant uncertainty. We know that this market was undermined by serious erosion in underwriting standards to meet the apparently insatiable appetite for these securities in 2005 and 2006. Even before consideration of this type of structural change, however, the limited volume of data supporting the original AAA rating alone should have made banks wary of building up uncontrolled volumes of such securities.
The fundamental lesson to take from this experience is always to ask how much uncertainty surrounds risk estimates given the volume and applicability of the available data. When such uncertainty is clearly excessive, be especially cautious in taking on corresponding exposures.
4 Sometime in the early 1980s I came across an old working paper entitled An Econometric
Model of Iran. Unfortunately it was written in 1978, a year prior to the Iranian Revolution! This is one of the most dramatic instances of being blindsided by structural change I can recall. 5 Indeed, in complex settings it is virtually impossible to extract 100% of the information that does
exist. Something is always lost in the process of aggregating and summarizing. This is why I refer to the “Law of Statistical Entropy” rather than the “Law of the Conservation of Information,” drawing an analogy to the Second rather than the First Law of Thermodynamics.

Risk Management Beyond VaR Page 7 of 22 10-Apr-2013
Recognize Self-Referential Feedback
Perhaps the most important reason to include dynamic analysis through time in our stress tests is to capture some sense of potentially dangerous self-referential feedback. Such feedback can take either favorable or unfavorable forms. Unfavorable feedback is the type we most often remember, since it can be sudden and frightening. Favorable feedback loops, however, can serve to lull us into complacency and allow dangerously brittle circumstances to develop largely unchecked.
Self-Justifying Success
Sometimes the success of certain innovations creates secondary consequences that seem to justify the initial success. The early development of the subprime mortgage market is a classic example. When subprime mortgages played only a small part in the US housing finance market, defaults were driven mainly by idiosyncratic events that befell individual families. Such events might be the death of the primary breadwinner, a major uninsured property loss or a sizable medical bill. The important characteristic of these drivers of default is that they tended to be statistically independent across borrowing households. This meant that the risk of such events could effectively be diversified through a geographically distributed portfolio.
By reducing the variance of default risk through diversification, subprime mortgage investors could offer rates lower than those of small local lenders and still expect to earn an attractive return relative to the risk. This created an initial surge of lending to supply the raw material for such securities. This increased lending, however, stimulated greater housing demand and pushed up prices in the face of a sluggish supply response. Rising prices, in turn, seemed to vindicate the appropriateness of such loans. Defaults dropped substantially as prices rose, since financially troubled households could readily find a buyer and liquidate their investment at a profit.
Trust Your Structural Imagination
In the midst of a bull market that appears to be driven by what Alan Greenspan first referred to as “irrational exuberance,” it can be difficult indeed to stand up and tell your organization to “STOP!” It is in precisely this situation that risk managers need to take their structural instincts seriously. As the economist Herb Stein was fond of saying, “If something cannot continue forever, IT WILL STOP!” The only question is not whether it will stop but when and how this will occur. Timing will always be impossible to predict with any precision. Nevertheless, some thought concerning the structural mechanics on the upside often can offer valuable clues as to early warning signals of an eventual reversal. This is where applying a dynamic framework, rather than simply focusing on comparative static scenarios, can be very effective.
From Virtuous Circle to Vicious Cycle
The apparent success of subprime mortgage market in 2004-2006 was driven by the “virtuous circle” of easier credit driving up prices which provided a safety valve allowing borrowers who encountered difficulties to withdraw from the market on favorable terms and thereby avoid default. In retrospect it is obvious that this heavy dependence on continued home price increases had created a dangerously brittle circumstance. When price increases slowed dramatically in early 2006 and then turned negative in the second half of that year, this key support for the market was removed. By early 2007, troubled borrowers found it increasingly difficult to sell at a profit and, in many cases, even to sell at a price that would cover their mortgages. The “virtuous circle” of rising prices and falling defaults suddenly reversed. Increasing foreclosures led to rising
Risk Management Beyond VaR Page 8 of 22 10-Apr-2013
liquidation sales, putting further downward pressure on prices in a self-reinforcing “vicious cycle.”
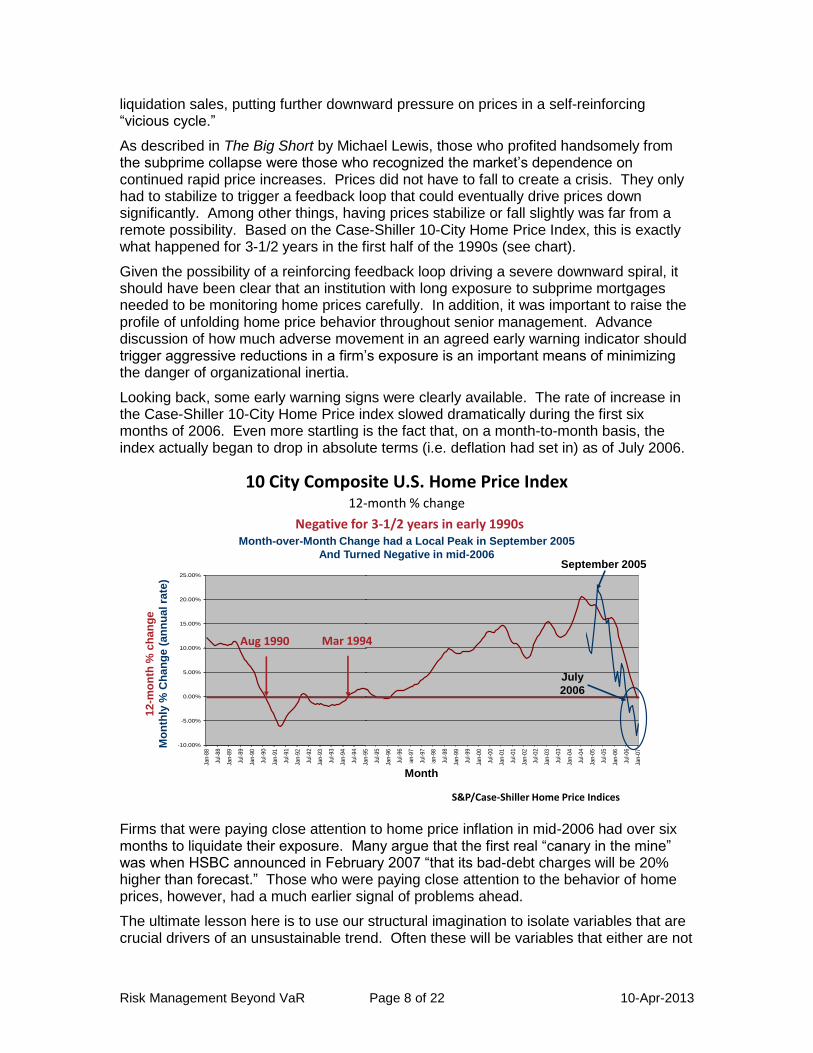
As described in The Big Short by Michael Lewis, those who profited handsomely from the subprime collapse were those who recognized the market’s dependence on continued rapid price increases. Prices did not have to fall to create a crisis. They only had to stabilize to trigger a feedback loop that could eventually drive prices down significantly. Among other things, having prices stabilize or fall slightly was far from a remote possibility. Based on the Case-Shiller 10-City Home Price Index, this is exactly what happened for 3-1/2 years in the first half of the 1990s (see chart).
Given the possibility of a reinforcing feedback loop driving a severe downward spiral, it should have been clear that an institution with long exposure to subprime mortgages needed to be monitoring home prices carefully. In addition, it was important to raise the profile of unfolding home price behavior throughout senior management. Advance discussion of how much adverse movement in an agreed early warning indicator should trigger aggressive reductions in a firm’s exposure is an important means of minimizing the danger of organizational inertia.
Looking back, some early warning signs were clearly available. The rate of increase in the Case-Shiller 10-City Home Price index slowed dramatically during the first six months of 2006. Even more startling is the fact that, on a month-to-month basis, the index actually began to drop in absolute terms (i.e. deflation had set in) as of July 2006.
10 City Composite U.S. Home Price Index
Annual & Change
-10.00%
-5.00%
0.00%
5.00%
10.00%
15.00%
20.00%
25.00%
Jan
-88
Jul-
88
Jan
-89
Jul-
89
Jan
-90
Jul-
90
Jan
-91
Jul-
91
Jan
-92
Jul-
92
Jan
-93
Jul-
93
Jan
-94
Jul-
94
Jan
-95
Jul-
95
Jan
-96
Jul-
96
Jan
-97
Jul-
97
Jan
-98
Jul-
98
Jan
-99
Jul-
99
Jan
-00
Jul-
00
Jan
-01
Jul-
01
Jan
-02
Jul-
02
Jan
-03
Jul-
03
Jan
-04
Jul-
04
Jan
-05
Jul-
05
Jan
-06
Jul-
06
Jan
-07
Month
An
nu
al %
Ch
an
ge
12
-mo
nth
% c
han
ge
Mo
nth
ly %
Ch
an
ge (
an
nu
al ra
te)
Month-over-Month Change had a Local Peak in September 2005
And Turned Negative in mid-2006September 2005
10 City Composite U.S. Home Price Index12-month % change
Negative for 3-1/2 years in early 1990s
Aug 1990 Mar 1994
July
2006
S&P/Case-Shiller Home Price Indices
Month
Firms that were paying close attention to home price inflation in mid-2006 had over six months to liquidate their exposure. Many argue that the first real “canary in the mine” was when HSBC announced in February 2007 “that its bad-debt charges will be 20% higher than forecast.” Those who were paying close attention to the behavior of home prices, however, had a much earlier signal of problems ahead.
The ultimate lesson here is to use our structural imagination to isolate variables that are crucial drivers of an unsustainable trend. Often these will be variables that either are not
Risk Management Beyond VaR Page 9 of 22 10-Apr-2013
considered in our risk models or are only included based on data for a relatively favorable period of history. Then it is essential to insist that the unfolding realizations of such variables have very high visibility in senior risk management deliberations. Once a crisis actually hits, it is too late to begin thinking through the structural process involved and also too late to avoid serious financial damage in any case.
The Role of Complexity
Necessary Complexity - Complaints about complexity are hardly new, nor are they without foundation in fact. Since the dawn of the Industrial Revolution, the world has become progressively more complicated. While such complexity causes a degree of discomfort and frustration for everyone, most of us believe these negatives are far outweighed by the associated comforts and conveniences that technological advance makes possible. This familiar phenomenon can be observed in the evolution of financial derivatives. Despite daunting complexity that has hampered broad public understanding, financial derivatives play a significant positive role in diversifying risk and shifting it, at a cost, from those less able to bear it to those more able and willing to do so. Nor are only the basic forms of derivative contracts socially useful. In late 2000 I wrote a column entitled In Defense of Exotics6. My main point at that time was that many options that are more difficult to price and hedge than traditional European puts and call arise from specific end-user requirements. Examples of these are such structures as knock-out and average rate options that introduce path dependency.
Gratuitous Complexity - That said, while complexity is often a necessary byproduct of beneficial advances it is not a good thing in and of itself. Unnecessary complexity demands time and resources for training just to stay current with unfolding innovations. More insidiously, however, complexity can be a tool for the highly sophisticated to take advantage of those less knowledgeable, either consciously or inadvertently. This is largely what transpired in the interest rate derivative market in the early 1990s and was repeated in the subprime mortgage market in the mid-2000s.
In one of the most infamous cases, in the early 1990s Bankers’ Trust entered into a swap with Gibson Greeting Cards in which Gibson received a then above market fixed rate of 5.5% while paying LIBOR-squared divided by 6%. In this transaction, net payments remain in favor of Gibson for LIBOR up to almost 5.75%7 Beyond this point, however, losses mount rapidly since increases in LIBOR soon cause the floating leg payments to rise more than twice as fast as the increase in payments on a simple LIBOR leg.8 The question that must be asked of such a structure is what rationale it has other than to hide the risk, which justifies a higher fixed rate, behind a haze of complexity.
History Rhymes
America’s favorite folk philosopher Mark Twain is often quoted to the effect that, “History doesn’t repeat itself…but it does rhyme.” Perhaps one of the few benefits of growing older, besides a host of good war stories, is an improved ear for the rhyme of history. By early 2005 I had sensed some poetic consistency between unfolding events in the CDO market and those in the swap market over a decade earlier.
6 See Rowe, D.; In Defense of Exotics; Risk; September, 2000, p. 105, also available at:
http://www.dmrra.com/publications/Risk%20Magazine/200009%20In%20Defense%20of%20Exotics.PDF. 7 The effective breakeven point on this swap is LIBOR of 5.7445 since (5.7445^2)/6 = 5.49988.
8 The incremental increase in the effective floating rate is the change in LIBOR times LIBOR/3.

Risk Management Beyond VaR Page 10 of 22 10-Apr-2013
CDOs structured with tiered loss tranches had attracted a variety of investors with a wide range of risk/reward profiles into the debt markets. Everyone understood that default correlation was central to the distribution of total credit losses in a CDO. Nevertheless I argued that the casual, even simplistic, manner in which correlations were treated in quoting prices for these instruments should give one pause. Rather than building on the characteristics of the actual underlying instruments in a portfolio, each tranche was priced on the basis of one pair-wise correlation across all names. Not only that, but the single common correlation used for all names was different for different tranches, leading to what was known as the correlation smile. Some attempts were made to address this anomaly by introducing a fat-tailed multivariate distribution of default drivers instead of the usual assumption of a multivariate normal distribution. This was in much the same spirit as introducing leptokurtosis into the distribution of underlying price changes to reduce the logical inconsistency of the traditional volatility smile produced by Black-Scholes option prices. Unfortunately it proved to be a seriously inadequate extension of the Gaussian Copula model for capturing the high dimensional structure of multi-variate correlations.
The assumption of a single constant default correlation across all pairs of underlying names was, and is, a simplification of breathtaking proportions. Furthermore, despite some promising proprietary research, no generally accepted market convention has ever been developed that offers a reasonably robust means of addressing default correlations in a CDO pricing context.
Déjà vu All Over Again
Despite the obviously weak foundation for treating default correlation in the pricing of CDOs, the market began to introduce even greater complexity in the form of CDO-squared structures. These were compound structures where the tranches of a CDO-squared were composed of tranches of simple CDOs or mixed pools of such tranches. There was even talk at one point of CDO-cubed structures where the tranches would be composed of tranches of a CDO-squared security. I pointed out at the time that reaching for higher yield by accepting greater complexity and less transparency sounded very much like what that other American folk philosopher Yogi Berra called “déjà vu all over again.”
Little did I know in early 2005 that the problem of unmanageable complexity was about to get worse. The concept of CDO-squared structures was being applied in the burgeoning market for subprime securities. Even simple subprime CDOs were more complex than corporate CDOs because the underlying collateral was far more varied and relevant details were far harder to assemble. Then securities began to emerge in which unsold mezzanine tranches of simple subprime CDOs were rolled into new complex CDOs, effectively CDO-squared structures. At this point, complexity was well and truly out of control.
Not All Prices are Created Equal
One lesson that risk managers should take from this sorry experience is that not all prices are created equal. Of the criticisms leveled at the efficient markets hypothesis (EMH), the one that I believe has the most relevance is the impact of imperfect information. Classic economic theory starts from the assumption of perfect and costless information. Having spent my whole career trying to squeeze information from raw data, often at great effort and expense, I am acutely aware that real world markets violate this assumption. Market efficiency is fairly easy to demonstrate in the pricing of goods and services driven by fundamental supply and demand. It is in the market for investments,
Risk Management Beyond VaR Page 11 of 22 10-Apr-2013
where value derives from uncertain future performance, that things become especially problematic. EMH advocates argue that it is not necessary for all market participants to have full information. It is only necessary for a critical segment of the market to have relevant information and to act upon it for prices to be driven to their rational equilibrium levels.
Quite clearly the ever increasing complexity of collateralized debt obligations, driven by compound repackaging and lack of ready access to the characteristics of the underlying collateral, tested this premise to the breaking point. When the information required by investors to make sensible independent judgments becomes sufficiently complex and inaccessible, the normal efficiency of markets can fail. Simply put, the EMH requires a minimum degree of transparency for markets to operate effectively. When this condition is violated in the extreme, it is essential to remember that, valuable as they are in a wide variety of circumstances, markets are not magic.
The lesson for risk managers in all this is that complexity breeds opacity which creates irresolvable uncertainty. Assuring sufficient transparency for markets to perform their function effectively should be an important role for public policy. Obviously, however, attempts to accomplish this are far from assured. Many people benefit from opacity and will struggle hammer and tong to preserve it. Personally I favor a market-driven approach to promoting transparency.9 Realistically, however, transparency will never be uniform or complete. When transparency drops below some critical level, organizations are effectively operating in the dark. As risk managers we need to be prepared to assert that “the risk cannot be estimated” when the raw data to do a proper analysis are unavailable. Producing a risk estimate with our standard risk measurement techniques based on whatever data are available, regardless of how limited they may be, is professionally irresponsible. The sensible response is the same as when our lights fail while driving at night – SLOW DOWN!
Systemic Risk Lessons from Beyond Finance
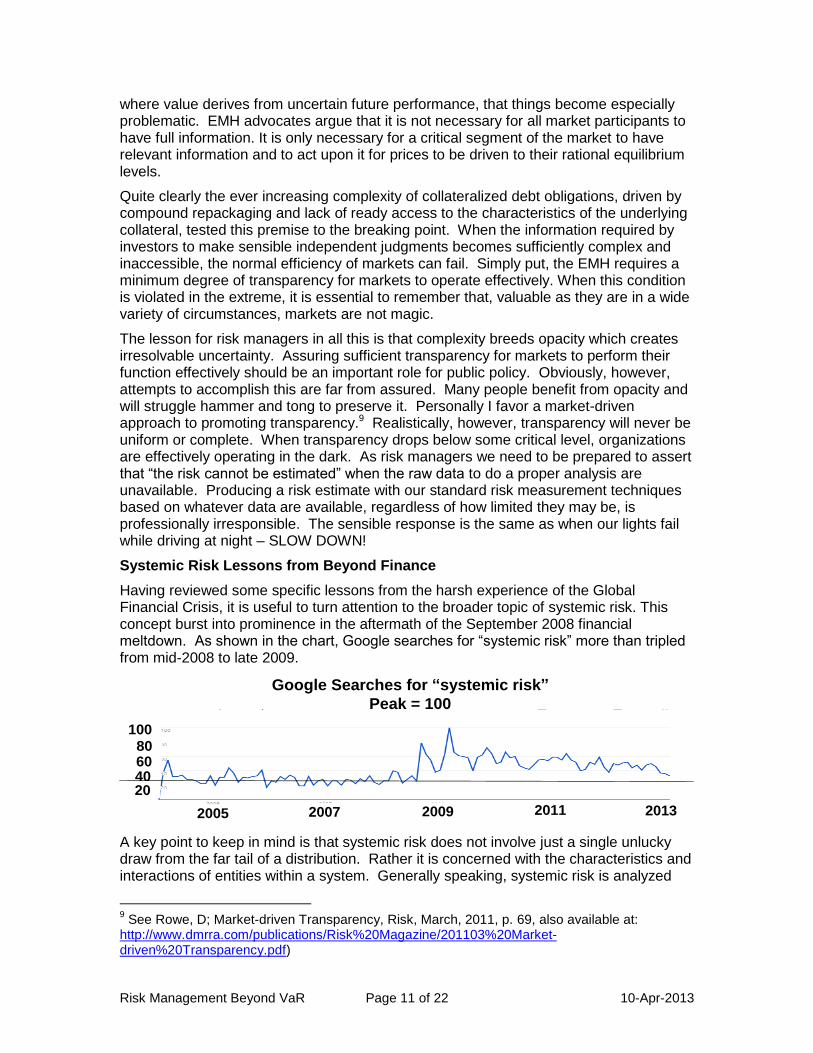
Having reviewed some specific lessons from the harsh experience of the Global Financial Crisis, it is useful to turn attention to the broader topic of systemic risk. This concept burst into prominence in the aftermath of the September 2008 financial meltdown. As shown in the chart, Google searches for “systemic risk” more than tripled from mid-2008 to late 2009.
2005 2007 2009 2011 2013
10080604020
Google Searches for “systemic risk”
Peak = 100
A key point to keep in mind is that systemic risk does not involve just a single unlucky draw from the far tail of a distribution. Rather it is concerned with the characteristics and interactions of entities within a system. Generally speaking, systemic risk is analyzed
9 See Rowe, D; Market-driven Transparency, Risk, March, 2011, p. 69, also available at:
http://www.dmrra.com/publications/Risk%20Magazine/201103%20Market-driven%20Transparency.pdf)
Risk Management Beyond VaR Page 12 of 22 10-Apr-2013
relative to “extremely complex, highly interconnected, dynamic, adaptive systems.” Quite clearly this description fits well with the characteristics of modern financial systems. It is worthwhile, however, to recognize that other systems also fit this description. These include systems studied by disciplines such as:
Immunology
Infectious disease control
Pharmaceuticals
Fisheries management
Forest fire control
Air traffic control
Telecommunications networks and the internet
Power grid management
Each of these disciplines has given serious thought as to what structural characteristics of a complex, highly interconnected, dynamic, adaptive system make it prone to periodic severe crises and what characteristics tend to make these systems resistant to such crises. Macroeconomics and finance have all too often focused inward and ignored the potentially valuable lessons we might learn from these other disciplines. The following sections discuss a few of the lessons we would do well to incorporate into our thinking.
The Role of Super Nodes
An interesting example of this line of thinking is in a 2009 paper by Andrew Haldane, Executive Director for Financial Stability at the Bank of England.10 He discusses a variety of ways to characterize highly interconnected networks. One interesting concept for this purpose is the degree distribution of the network. The degree of any node in the network is the number of connections it has to other nodes. If pair-wise connections were distributed randomly the degree distribution of the network would be normal, with a fat center and rapidly thinning tails. In fact, many networks exhibit degree distributions that are thin in the middle and fat in the tails. Both nodes with very few links and ones with a massive number of links are over-represented. Two obvious examples of such networks are the internet (think Google, MSN, Yahoo, Facebook, etc.) and derivative markets (think JP Morgan, Goldman Sachs, Citibank, RBS, Barclays, Credit Suisse, Deutsche Bank, etc.)
Haldane points out that networks with “long-tailed distributions have been shown to be more robust to random disturbances, but more susceptible to targeted attacks.” This is because most random shocks strike at the periphery of the network where their impact is distributed and can be absorbed easily. On the other hand, failure of one of the massively connected nodes can have catastrophic consequences throughout the whole network by placing severe stress on a large number of other connected nodes. One implication is that long periods of apparent stability, where peripheral shocks are readily damped and absorbed, does not offer useful insight to the impact of a shock that mortally wounds a super node.11 This can lead to the anomaly that Hyman Minsky described as “stability is destabilizing.” With large heavily capitalized institutions being able to absorb most peripheral shocks, day-to-day volatility tends to be constrained.
10
Haldane, A., Rethinking the Financial Network, April 2009, also available at http://www.bankofengland.co.uk/publications/speeches/2009/speech386.pdf 11
This is similar to the point emphasized by Taleb that observations in the middle 99% of a distribution don’t give reliable insight to behavior in the tails.

Risk Management Beyond VaR Page 13 of 22 10-Apr-2013
This easily leads to a casual attitude toward more leverage, resulting in less structural ability to absorb a genuine systemic shock.
Let Small Fires Burn
Another lesson arises from the area of forest management and forest fire prevention. For many years, the US Forest Service followed a policy of quenching every small fire as quickly as possible. Exceptions to this policy were first introduced in 1972. The rationale for this change was that “reduction of hazard fuels in selected areas reduces risks and costs.”12 The key idea was that small fires consume brush and other dry tinder that provides fuel for fires. Periodic small blazes consume this fuel without doing irreparable damage to the trees themselves. Extinguishing every small fire allowed such dry tinder to build up progressively over time. Eventually it reached a stage where a fire could spread quickly out of control, becoming so massive that it enveloped the crown of the trees and effectively destroying large sections of the forest.
Hide or Flee
Communicable diseases have long been a fertile subject for fiction writers. They represent a universal situation that places individuals and societies under stress. Examples from literature include The Plague by Albert Camus and Love in the time of Cholera by Gabriel Garcia Marquez. A common theme in such works is the dilemma of whether the best way to avoid infection is to hide or to flee. Both strategies are designed to avoid contact with others who have already succumbed to the disease. The broader societal consequences of the two strategies, however, can be very different. Hiding effectively amounts to voluntary quarantine and supports the public health goal of disrupting the spread of the disease. While flight can be effective for an individual, it risks contributing to the spread of the epidemic when the person fleeing has already contracted the disease and proceeds to infect other previously unaffected areas.
In financial markets, the analogy to hiding is to withdraw from participation in market activities for fear that counterparties will fail to fulfill their obligations. The analog to flight is liquidating market holdings already in place because the quality of the assets has become highly uncertain. (Think of the wholesale unloading of Enron stock in the aftermath of revelations of liquidity problems and management conflicts of interest or a traditional bank run such as occurred at Northern Rock in the UK in September of 2007.) Unlike the communicable disease situation, however, both these reactions tend to exacerbate a developing financial crisis.
Feedback, uncertainty and innovation can be closely related and, in combination, can produce incentives to hide or flee. Innovation often leads to added complexity that increases uncertainty. Such uncertainty can foster a panic reaction when a sudden shock hits. As the quality of subprime mortgage securities suddenly became suspect, investors “fled” the market, creating major losses for banks that were substantial holders. Not having a clear idea of who may be a safe counterparty, the tendency was to “hide” by avoiding as many interactions as possible. Thus, when banks were suddenly unsure of each other’s capital adequacy in the aftermath of these wide-spread loss announcements, they became unwilling to lend to each other for fear of who would be next to announce a big financial write-down.
Contributors to Contagion
12
US Dept. of Agriculture and US Dept. of Interior, Fire Management Policy Review, Dec 15, 1988,
Risk Management Beyond VaR Page 14 of 22 10-Apr-2013
Homogeneity - Another interesting relationship is between nodal diversity and network stability. When the nodes in a network pursue diverse strategies the network tends to be stable. When nodes are broadly similar, the network is increasingly susceptible to systemic crises. This is true of ecological systems such as fisheries and also of financial systems. One example originated in the salmon industry in Chile. Salmon are not native to the cold waters of southern Chile, but they have been widely farm raised in this area. The methods of aquaculture used involved both breeding techniques to develop salmon that were resistant to known diseases and the heavy use of antibiotics to suppress diseases that did arise. In 2009, however, a previously unknown strain of infectious salmon anemia appeared that proved impervious both to genetic resistance and to antibiotic treatment. As a result, production collapsed by 87% in one season.
Homogeneity can play a similarly dangerous role in financial markets. When many institutions pursue similar strategies and measure risk in similar ways, the whole system becomes susceptible to a significant failure in one area. Quite clearly the wide-spread tendency to view AAA subprime mortgage tranches as completely safe and highly liquid allowed the exposure to these instruments to pervade the system, creating a systemic crisis when the market collapsed.
Super-Nodes and the Small, Small World - Another characteristic of networks with concentrated super-nodes is the “small world” phenomenon. The mechanics of “six degrees of separation” works through super-connected individuals. I happen to have worked for Alan Greenspan who knows Nicolas Sarkozy from the time when Sarkozy was French Minister of Finance. I have to assume that, as president, Sarkozy knew virtually every member of the Assemblée Nationale. That leaves me three remaining links from every member of the legislature to reach anyone in any village in France.
One implication of this small world property of networks is the potential for local disturbances to make long leaps. For example, the swine flu started in Mexico but spread globally by infected carriers moving among major world airports (transportation super nodes.) This also is how the subprime collapse infected money center banks (another form of super node) around the world. These, in turn, distributed subprime securities to many local municipal and corporate investors who were directly affected by this market’s collapse. Absent the role of super-nodes as conduits of contagion, the consequences of the collapse would have been far more localized.
Brewing the Perfect Storm
Reviewing the period of The Great Moderation from 1983 through 2006, many of the forces I have described appear to have been in play in financial markets. The formation of mega global financial institutions through mergers and acquisitions led to a world with fewer but larger financial super-nodes.
Increasing globalization kept inflation in check as many third world countries became effective participants in global markets. This, in turn, allowed central banks around the world to keep interest rates low without fear of stoking serious upward pressure on prices. As a result, both inflation and interest rates were low. With occasional exceptions, so was the volatility of prices, interest rates and exchange rates. Even periodic shocks such as the US stock market drop in 1987, the US Savings and Loan crisis, the Asian currency crisis, the dot com bust and the September 11 attacks were absorbed without a major decline in real economic activity. Gradually the dangerous attitude developed that “we have entered a new era” or “this time is different.”
Risk Management Beyond VaR Page 15 of 22 10-Apr-2013
Risk premiums declined to unrealistically low levels as investors accepted more and more leverage to achieve what they deemed to be minimum returns. Not just firms but individuals were willing to assume ever greater structural risks in exchange for higher current returns or lower current cost.13 Steady economic expansion and low interest rates encouraged many middle class families to stretch to build second homes or borrow to enter the buy-to-rent market and many low income households assumed mortgage obligations they had no reasonable expectation of repaying if home prices fell. This led to periodic asset price bubbles, most recently in the housing market.
In mid-2006, a panel I chaired was titled “Where is all the risk?” In general, an eerie sense of calm seemed to pervade the markets. Our traditional distributional based measures of risk such as VaR indicated that we were living in a relatively safe world. In effect, the careless growth in leverage throughout the economy was a nearly perfect analog to progressive accumulations of highly flammable tinder in the forest. Absent the spark to ignite a crisis, such leverage seemed quite benign. In fact, however, it set the stage for a major conflagration once a crisis started. Increasing leverage had weakened many institutions’ ability to cope with a serious shock. Prolonged low levels of VaR were not just in contrast to the growing vulnerability of major institutions to a serious shock, they were an important cause of that vulnerability.
Former Fed Chairman William McChesney Martin was fond of saying that the thankless job of a central bank was “to take away the punch bowl just as the party gets going.” As mentioned earlier, Alan Greenspan is widely cited for coining the term “irrational exuberance,” but I remember another less widely noted comment. “History,” he said, “is seldom kind to periods of unrealistically low risk premia.” In fact, modest economic corrections (allegorical “small fires”) can be instrumental in constraining the build-up of structural vulnerabilities like those that preceded the Global Financial Crisis. One danger is that if central banks seek to act on this insight, politicians may try to undermine their now widely accepted independence, thereby making it harder to impose periodic corrections that are needed to prevent less frequent, but far more damaging, economic conflagrations.
Technology Implications
Choices Have Consequences
Authorizing the use of internal value-at-risk models for calculating regulatory capital was a major advance in bank supervision. It was accompanied by a new demand for “best practice risk methods” as the supervisory benchmark. While we didn’t fully realize it at the time, this effectively replaced sluggish advances in prescriptive regulation with far more dynamic competition among banks over what constitutes “best practice.”
At the same time, however, the Basel Committee’s decision set off a major scramble to extend existing VaR models to consistent enterprise-wide coverage. There also was the need for more detailed documentation and a regular process of archiving and back-testing results. Banks had just over 2½ years to meet the initial date for regulatory use of such models and few were willing to bear the stigma of failing to be among the first wave of approved institutions.
13
One example of this was the growth in low interest foreign currency mortgage loans, often in Japanese yen, that exposed many people to significant exchange rate risk. See Rowe, D., A yen for financing, Risk, April 2007, p. 83, also available at: http://www.dmrra.com/publications/Risk%20Magazine/200704%20A%20Yen%20for%20Financing.pdf
Risk Management Beyond VaR Page 16 of 22 10-Apr-2013
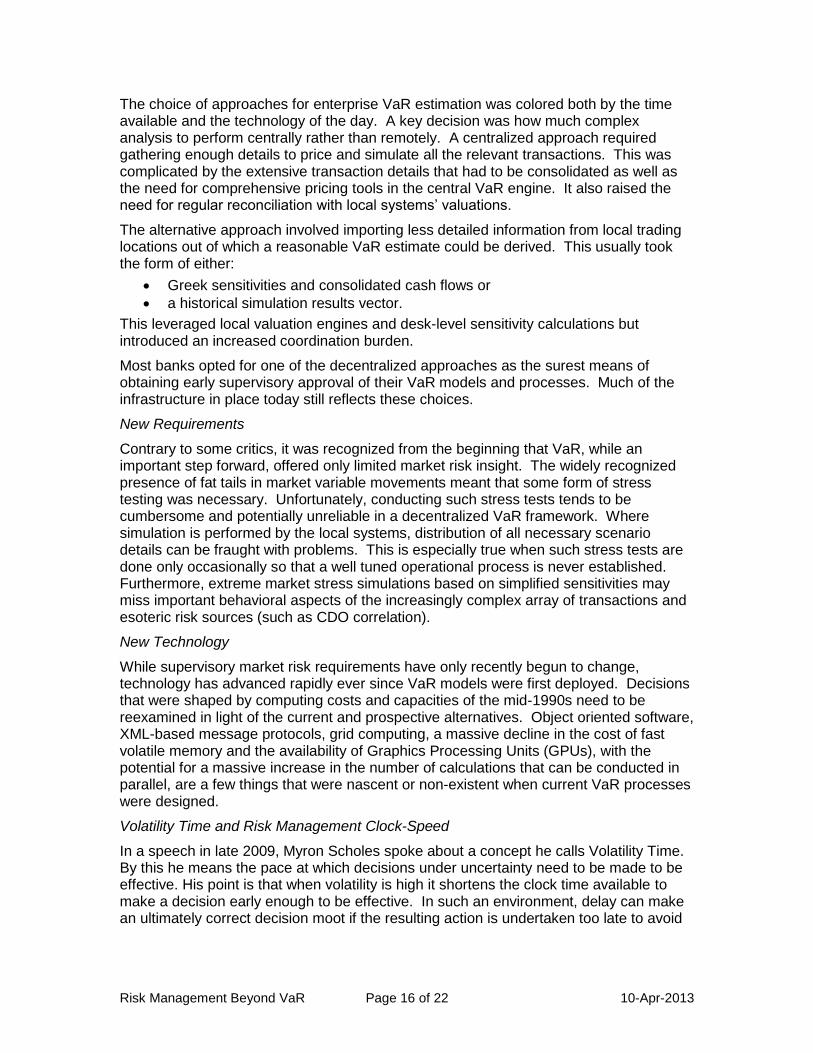
The choice of approaches for enterprise VaR estimation was colored both by the time available and the technology of the day. A key decision was how much complex analysis to perform centrally rather than remotely. A centralized approach required gathering enough details to price and simulate all the relevant transactions. This was complicated by the extensive transaction details that had to be consolidated as well as the need for comprehensive pricing tools in the central VaR engine. It also raised the need for regular reconciliation with local systems’ valuations.
The alternative approach involved importing less detailed information from local trading locations out of which a reasonable VaR estimate could be derived. This usually took the form of either:
Greek sensitivities and consolidated cash flows or
a historical simulation results vector.
This leveraged local valuation engines and desk-level sensitivity calculations but introduced an increased coordination burden.
Most banks opted for one of the decentralized approaches as the surest means of obtaining early supervisory approval of their VaR models and processes. Much of the infrastructure in place today still reflects these choices.
New Requirements
Contrary to some critics, it was recognized from the beginning that VaR, while an important step forward, offered only limited market risk insight. The widely recognized presence of fat tails in market variable movements meant that some form of stress testing was necessary. Unfortunately, conducting such stress tests tends to be cumbersome and potentially unreliable in a decentralized VaR framework. Where simulation is performed by the local systems, distribution of all necessary scenario details can be fraught with problems. This is especially true when such stress tests are done only occasionally so that a well tuned operational process is never established. Furthermore, extreme market stress simulations based on simplified sensitivities may miss important behavioral aspects of the increasingly complex array of transactions and esoteric risk sources (such as CDO correlation).
New Technology
While supervisory market risk requirements have only recently begun to change, technology has advanced rapidly ever since VaR models were first deployed. Decisions that were shaped by computing costs and capacities of the mid-1990s need to be reexamined in light of the current and prospective alternatives. Object oriented software, XML-based message protocols, grid computing, a massive decline in the cost of fast volatile memory and the availability of Graphics Processing Units (GPUs), with the potential for a massive increase in the number of calculations that can be conducted in parallel, are a few things that were nascent or non-existent when current VaR processes were designed.
Volatility Time and Risk Management Clock-Speed
In a speech in late 2009, Myron Scholes spoke about a concept he calls Volatility Time. By this he means the pace at which decisions under uncertainty need to be made to be effective. His point is that when volatility is high it shortens the clock time available to make a decision early enough to be effective. In such an environment, delay can make an ultimately correct decision moot if the resulting action is undertaken too late to avoid
Risk Management Beyond VaR Page 17 of 22 10-Apr-2013
losses or other damage. In effect, “volatility time” accelerates relative to chronological time.
A related concept is Risk Management Clock-speed.14 This is essentially the rate at which risk information is assembled, processed and made available to risk managers to support their decisions. Slow Risk Management Clock-speed can be fine when volatility is low and Volatility Time is unfolding at a leisurely pace. Unfortunately, when Volatility Time accelerates it can overwhelm a risk management information system operating at slow Clock-speed. In a crisis, decisions are required in minutes or hours rather than days or weeks. In this environment, decisions increasingly are made in a heuristic fashion and are informed by analysis of data that are either stale and/or poorly structured to address the issue at hand.
The problem of slow Risk Management Clock-speed is a pervasive legacy of information systems that often have grown by accretion over years if not decades. Global communication band-width was a serious constraint in the 1990s and systems were designed to economize on this comparatively scarce resource. In addition, most source systems had no message-based means of transmitting incremental event-driven output to external systems. As a result, periodic (usually daily) production of batch files became the standard method for feeding data into central risk systems. Even in the best of circumstances, this approach meant that data would be at least 16 hours out of date. For a global trading operation with a daily close at the end of the New York business day, data for the opening of trading in Asia would often be from two days earlier.
A second problem that slows Risk Management Clock-speed is incomplete data coverage. When a counterparty encounters serious problems, having complete information on exposure in all areas of business is crucial. We know that when Lehman Brothers failed many firms were unable to determine the full extent of their net exposure for days or even weeks. This hampered actions to limit losses. Even in institutions where aggregate exposure was known at the enterprise level, it was not always easy for individual trading desks to isolate the specific trades that were now in default. This slowed the process of booking the necessary hedges to rebalance the book and created unwanted market risk in an extremely volatile environment.
A final problem is poor organization of the data and limited ability to tabulate and analyze non-standard aggregations. UBS had a significant centralized data effort that allowed them to simulate the impact of many macro-economic events. Unfortunately, US housing prices were not among the variables whose impact could be evaluated in this way.
Buy or Build – Is it really a binary decision?
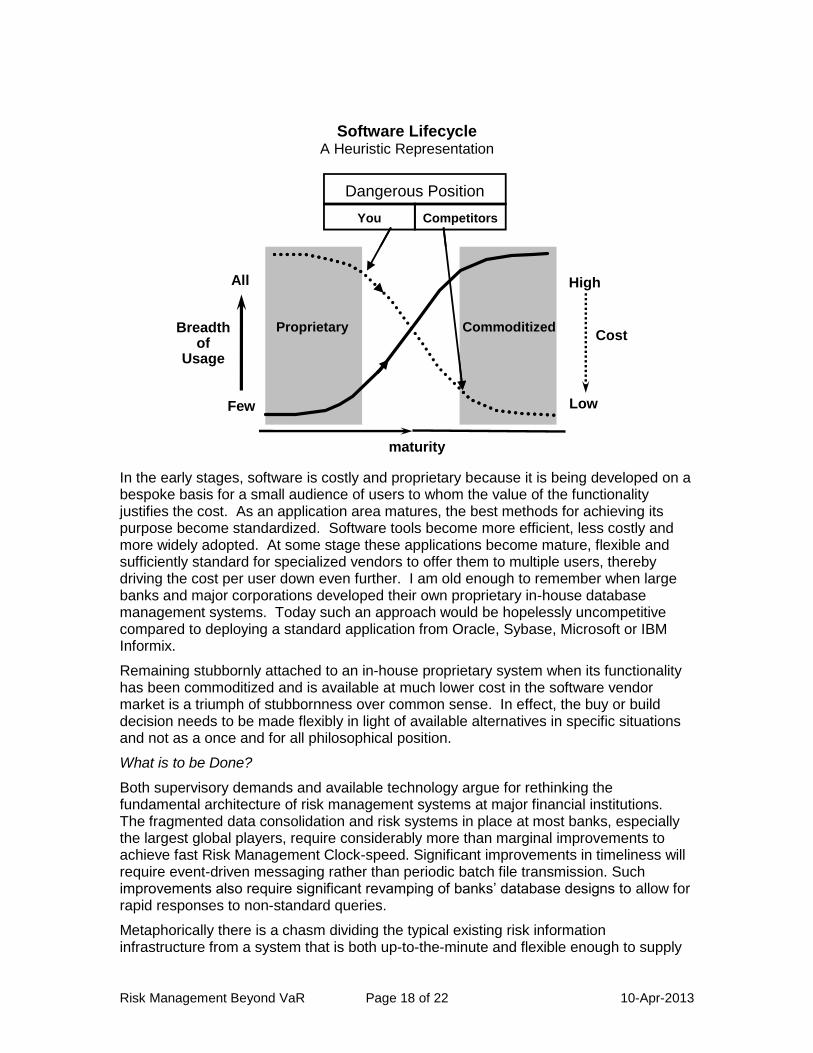
Too many firms think of buying or building their risk (or other) technology as a binary philosophical decision. One view or the other becomes an institutional article of faith not open to question. In fact, a more sensible approach is to consider this a situational decision to be made, and potentially changed, in individual instances based on the state of both hardware and software alternatives. In fact, as shown heuristically in the following graphic, software goes through a predictable life cycle.
14
I first heard this concept enunciated in an exchange with Keith Smith of RiskCovered Limited.
Risk Management Beyond VaR Page 18 of 22 10-Apr-2013
Software Lifecycle A Heuristic Representation
CommoditizedProprietaryBreadth of
Usage
All
Few
Cost
High
Low
maturity
Dangerous Position
You Competitors
In the early stages, software is costly and proprietary because it is being developed on a bespoke basis for a small audience of users to whom the value of the functionality justifies the cost. As an application area matures, the best methods for achieving its purpose become standardized. Software tools become more efficient, less costly and more widely adopted. At some stage these applications become mature, flexible and sufficiently standard for specialized vendors to offer them to multiple users, thereby driving the cost per user down even further. I am old enough to remember when large banks and major corporations developed their own proprietary in-house database management systems. Today such an approach would be hopelessly uncompetitive compared to deploying a standard application from Oracle, Sybase, Microsoft or IBM Informix.
Remaining stubbornly attached to an in-house proprietary system when its functionality has been commoditized and is available at much lower cost in the software vendor market is a triumph of stubbornness over common sense. In effect, the buy or build decision needs to be made flexibly in light of available alternatives in specific situations and not as a once and for all philosophical position.
What is to be Done?
Both supervisory demands and available technology argue for rethinking the fundamental architecture of risk management systems at major financial institutions. The fragmented data consolidation and risk systems in place at most banks, especially the largest global players, require considerably more than marginal improvements to achieve fast Risk Management Clock-speed. Significant improvements in timeliness will require event-driven messaging rather than periodic batch file transmission. Such improvements also require significant revamping of banks’ database designs to allow for rapid responses to non-standard queries.
Metaphorically there is a chasm dividing the typical existing risk information infrastructure from a system that is both up-to-the-minute and flexible enough to supply
Risk Management Beyond VaR Page 19 of 22 10-Apr-2013
needed non-standard information in a crisis. It is obviously unrealistic to think that any institution will resolve this problem through a crash program, nor is such an approach even advisable. What institutions can and should be doing is to recognize the magnitude of the problem and begin to establish a long-range plan to address it. Such a plan should concentrate on:
leveraging today’s technology rather than conforming to decades old constraints,
improving the ability to analyze and to diagnose potential sources of severe losses,
improving dynamic efficiency through the capacity for incremental enhancement of the system rather than massive periodic upgrades.
This inevitably will require developing a vision for a coherent architecture that allows functional modifications and extensions without creating ever greater maintenance problems. Also central to the success of such an effort is a senior executive who can balance issues around analytical tradeoffs, computational demands, requirements for timeliness and budget realities.15
Beyond Technology - Overcoming the Challenge of Two Cultures
Technology is not the only obstacle to improving bank risk management capabilities. Another problem is similar to the situation described in 1959 by C.P. Snow in his essay The Two Cultures and the Scientific Revolution16. Snow highlighted the often willful lack of communication between scientists and literary intellectuals.17 In all too many cases, Snow argued, formal training compounded inherently different mindsets to produce a nearly complete lack of understanding and communication across these two cultures. He was evenhanded in assigning blame. Scientists, he found, often had little interest in or exposure to imaginative literature. He quotes one scientist (admittedly one of less than first rank) as saying, “Books? I prefer to use my books as tools.” On the other side, literary intellectuals often treated their realm as the whole of culture, blithely oblivious to the scientific edifice of the physical world as “in its intellectual depth, complexity and articulation, the most beautiful and wonderful collective work of the mind of man.”
Snow’s essay came to mind as I reflected on a similar problem that afflicts the practice of modern finance and risk management, namely the split between “quants” and the larger community of traditional finance managers. Quantitative pricing techniques and statistical risk management are little more than opaque black boxes for all too many general financial executives. What is more, those who do understand the technical details often have limited insight into broader structural and behavioral issues. In late 2009, the London economist Roger Bootle made some rather rude remarks about risk managers and their failings. When asked during the following Q&A what he proposed risk managers should do differently his answer was, “I think they should read less mathematics and more history and literature.” This suggestion illustrates the magnitude of the task we face.
15
See Rowe, Risk information – balancing priorities, Risk, December 2004, p. 71, also available at: http://www.dmrra.com/publications/Risk%20Magazine/200412%20Risk%20Information%20-%20Balancing%20Priorities.pdf 16
Snow, C.P., The Two Cultures and the Scientific Revolution, Cambridge University Press, 1959. 17
Snow was a trained scientist who also wrote imaginative literature. As such, he was uniquely qualified to assess the problem of The Two Cultures.
Risk Management Beyond VaR Page 20 of 22 10-Apr-2013
In some cases a lack of technical insight has little or no serious consequences. After all, few of us can understand the technical mechanics of a modern automobile but that does not inhibit our ability to drive. In the case of financial management, however, the impact of Two Cultures can be serious indeed. This is primarily because running a financial institution demands a constant series of large and small decisions under uncertainty. Such decisions can never be effective if they are made mechanically. Effective decisions must reflect experience and judgment conditioned by the available empirical evidence. As finance has become ever more complex and quantitative, the communications gap between finance’s Two Cultures has become ever more consequential. Most senior bank managers have limited ability to weigh the subtle details of modern finance and few state-of-the-art quants are well equipped to assist them (even if they were motivated to do so.)
One example of the consequences of this cultural divide is the fragile nature of the Gaussian Copula Model for pricing CDOs that was noted earlier. This “model” is really little more than a descriptive framework for traders to communicate with each other. It is not a structural model whose properties can be empirically tested against some corresponding complex reality. Sometimes it is said that implied correlations from this model are analogous to implied volatilities in option markets (which have similar inconsistencies across options differing only in their strike prices.) In the option market, however, there is an observable historical price volatility that can be tracked against market implied volatilities. No such objective historical analog is available for CDO implied correlations. One crucial implication of this is that implied correlations, and hence objective prices for CDO tranches, are critically dependent on market liquidity. Absent liquidity, valuing such tranches is reduced to little more than guesswork. If banks’ senior management had realized this critical dependence on liquidity to determine fair values, they might have hesitated to hold such massive amounts of these securities on their balance sheets.
A closely related problem is the blind faith that even supposedly sophisticated senior bank managers placed in the AAA rating assigned to senior tranches of subprime mortgage CDOs. A combination of blind faith in rating agencies and/or the seemingly sophisticated analytics being applied prompted many bank mangers to treat these securities as equivalent to AAA corporate bonds. A little thought to the paucity of data available to estimate behavior deep in the tails of the loss distribution of subprime portfolios should have raised serious doubts about both the reliability and stability of such AAA ratings. Most senior bank managers simply didn’t have sufficient quantitative insight to recognize the need to ask the question in the first place.
In his conclusion, Snow says, “Closing the gap between our cultures is a necessity in the most abstract intellectual sense, as well as in the most practical. When those two senses have grown apart, then no society is going to be able to think with wisdom.” It seems to me that the same is true of financial institutions. If they are going to be able to “think with wisdom” in the future we must begin to close the gap between the cultures of quantitative finance and general financial management.
Dangerous Adaptation – It’s Epidemiology Not Roulette
Adaptation is one of the most powerful phenomena in nature. It is the means by which species survive changes, often major changes, in their environments. In this sense we are conditioned to look upon adaptation as a favorable characteristic. It is important to remember, however, that effective adaptation has its dark side as well, because it also can be a source of strength and resilience for dangerous threats. The 2009 outbreak of
Risk Management Beyond VaR Page 21 of 22 10-Apr-2013
flu caused by the H1N1 virus is a classic example of the challenges faced by epidemiologists. As in many previous cases, this was a new and previously unknown virus. While similar to know viruses, it had developed a mutation that made it resistant to known forms of prevention and treatment.
Those of us in financial risk management would do well to recognize that, in terms of adaptation, the problems we face are similar to those confronting epidemiologists. We are not external observers of a distinct and independent system. Risk management is an integral part of the system the risk of which we seek to control. Among other things, this points out the ultimate futility of trying to control financial institutions by detailed micro-regulations. This is particularly relevant when such regulations evolve not over weeks or months but over years. The underlying institutions and systems adapt much faster than such rules and regulations can possibly be updated.
One classic example of financial sector adaptation is the behavioral adjustments traders made to the introduction of value-at-risk as the standard metric for controlling market risk.18 Once traders were constrained by a fairly comprehensive measure of 99% risk, one way to take positions with additional risk, and the associated expected return, was to sell out-of-the-money options. Since the value of these did not change significantly in response to daily market moves of 2 to 2-1/2 standard deviations, they had little impact on the reported 99% VaR figure. In the face of larger Black Swan events, however, losses could accelerate rapidly as such options approached an at-the-money position. The corrosive feedback effect was that the widespread use of VaR as a control metric encouraged exactly the type of risk-taking that VaR fails to measure, namely exposure to extreme events. VaR doesn’t just fail to address the most extreme losses, it actually encourages behavior that increases their magnitude. This is a perfect example of how controlling one form of risk can induce increased risk in other, often more virulent, forms.
The subprime mortgage experience highlights a related issue known as Goodhart’s Law.19 One way of stating this is that when a reliable indicator is made a target of social, economic or organizational policy it quickly loses its effectiveness as a meaningful indicator. There are multiple grounds for criticizing the methodology of the rating agencies in determining how much subordination was required before a tranche of a subprime CDO should qualify for AAA status. An additional problem, however, was that once the agencies published their methodologies the market began to game them in every way possible. Such gaming undermined what limited reliability these ratings had initially.
A closely related adaptation was the massive increase in the volume of subprime mortgage securities which altered the nature of the market itself. By driving home prices higher, the easy availability of financing temporarily supported the idea that lending on the basis of collateral only, rather than the borrowers’ ability to repay from future income, was an acceptable banking strategy.
18
See Rowe, D.; Corrosive feedback, Risk, January 2009, p. 99, also available at: http://www.dmrra.com/publications/Risk%20Magazine/200901%20Corrosive%20Feedback.pdf
19 The law was named for Charles Goodhart, a former advisor to the Bank of England and
Emeritus Professor at the London School of Economics.
Risk Management Beyond VaR Page 22 of 22 10-Apr-2013
Summary
It is perfectly acceptable to recognize that the shortcomings of banks’ risk technology and risk management processes will not be solved quickly or cheaply. What is not acceptable is simply ignoring the issue of how far current risk management information systems and other resources fall short of what is required until the next crisis drives the point home…again.
While politicians and regulators are busy fighting the last war, it is essential for risk managers to remain alert to how markets and institutions are adapting their products and strategies. Dealing with such an ever shifting problem will require information systems and analytical tools well beyond those currently in place. Even if we take responsible steps to improve risk management information resources, however, we must always remember that ours is a profession in which there are no final victories. Adaptation is the fundamental reason that any claims that regulation can assure that “This will never happen again” cannot and should not be taken seriously. Human beings are too ingenious and too much a part of the highly adaptive biological system for such claims to be sustained. Only constant vigilance, with special attention to the risk inherent in the adaptive changes taking place around us, will allow organizations to avoid the worst consequences when the next crisis occurs, as it inevitably will. As Shakespeare has Cassius say, “The fault, dear Brutus, is not in our stars, but in ourselves…”


![The VaR Measure - Sharifgsme.sharif.edu/~risk/DownFiles/[02] The VaR Measure.pdf · Title: Risk Management and Financial Institutions Author: John Hull Subject: Chapter 8 Created](https://img.pdfslide.us/doc/110x75/5b5655017f8b9ab7348c4e49/the-var-measure-riskdownfiles02-the-var-measurepdf-title-risk-management.jpg)