Embed Size (px)
Citation preview

Risk Based Environmental Monitoring (EM) and EM Data Management and Trending
An Industry Roundtable Discussion
Marsha Stabler Hardiman and Cheryl Zaman ZadehNovember, 2015 PDA Metro Chapter Meeting
Presenters
Cheryl Zaman Zadeh, MS.• Over 20 years experience in the
Pharmaceutical and Medical Device industries
• Microbiologist and Senior Consultant, ValSource LLC
Marsha Stabler Hardiman• Over 15 years experience
defining EM User Requirements for Pharmaceutical and Biotech
• Director, Novatek International
Presentation Outline
• Definition Environmental Monitoring (EM)• Regulations• Room Classifications• Risk-based EM• Risk Assessment Tool• Data Trending• EM Software• Q & A

What is Environmental Monitoring?• Sampling of controlled environments for non-viable and viable air
particulates as well as surface viables• Allows for assessment of effectiveness of cleaning/disinfection• Allows for identification of trends• Facilitate early detection of potential problems

The FDA believes:
1. Manual systems have large inherent operational risks, therefore they are difficult to validate.
2. If it isn't documented, it wasn't done.3. If it wasn't done using an appropriate process, it wasn't done properly.
Regulations

The FDA believes:From: Friedman, Rick L [mailto:[email protected]] Sent: Tuesday, January 13, 2009 10:18 PMTo: [email protected]: Re: FDA and a computerized environmental monitoring program
Computer trending for pattern recognition is the most efficient and effective way to handle such large quantities of data.
Rick Friedman

RiskManagement
ProcessUnderstanding
Process Optimization
Harmonized Risk and PAT SolutionProcess Analytical Technology
The Roadmap to Compliance

Room Classification• ISO 14644 assigns ISO classification levels to be used for the
specification of air cleanliness in cleanrooms and associated controlled environments
Classification – defined per ISO 14644-1• level (or the process of specifying or determining the level) of
airborne particulate cleanliness applicable to a cleanroom or clean zone, expressed in terms of an ISO Class N, which represents maximum allowable concentrations (in particles per cubic meter of air) for considered sizes of particles

Room Classification - Non-Viable Airborne Particulates
ISO 14644-1 maximum allowable particle concentrationsAirborne particulate cleanliness shall be designated by a classification number
ISO 5 – Unidirectional airflow, aseptic processing, exposure of sterile products and packaging components
>0.5 µm - 3,520 particles/m3
ISO 6 – Possible background to ISO 5 – not required>0.5 µm - 35, 200 particles/m3
ISO 7 – Background to ISO 5>0.5 µm - 352,000 particles/m3
ISO 8 – Non-sterile areas, prep, terminally sterilized>0.5 µm - 3,520,000 particles/m3
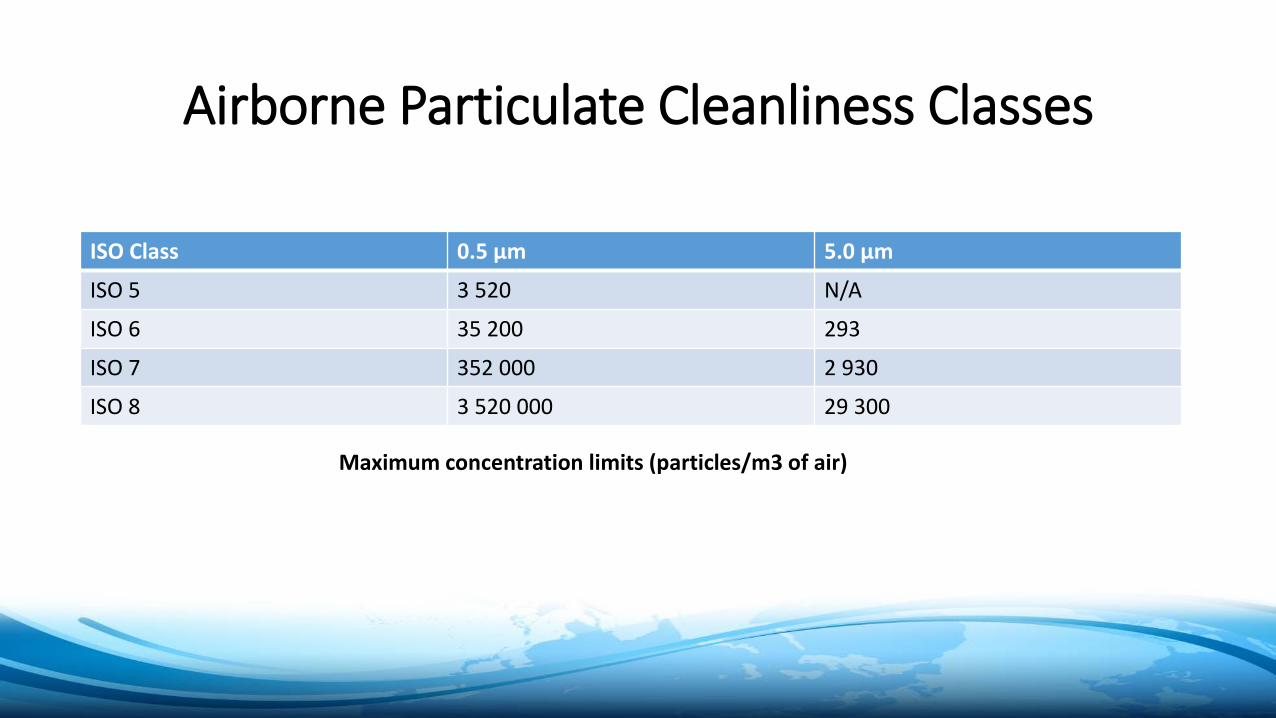
Airborne Particulate Cleanliness Classes
ISO Class 0.5 µm 5.0 µm
ISO 5 3 520 N/A
ISO 6 35 200 293
ISO 7 352 000 2 930
ISO 8 3 520 000 29 300
Maximum concentration limits (particles/m3 of air)

Common Misperception with ISO 14644B 4.1.1 - Minimum number of sample point locations based
on formula:NL = √A
(NL = (square root) of A)• NL is the minimum number of sampling locations (rounded up to a• whole number)• A is the area of the cleanroom or clean zone in square meters.
Room grid based on room areaSpecific to nonviable particulate sample locations for cleanroom classification – evaluates air quality against design – not routine EM

USP <1116>• Significant changes made to USP <1116> in late 2012• This Chapter is NOW specific to EM of aseptic processing
environments• Sterile products, bulk “sterile” drug substances, sterile
intermediates, excipients, medical devices (i.e., contact lens solutions)
• Risk based sample locations and frequencies with documented rationale
• Table 2 suggests sampling frequency in relation to product risk• Rate of occurrence of excursions in place of CFU levels
• Contamination recovery rates – percentage of plates showing any microbial recovery regardless of the number of CFU
• Alert and action levels are defined relative to these percentages

USP CHAPTER <1116>
Snap Shot Report
November 5, 2015 13
• Gives a quick snapshot based on whatever you filter for.
• Includes overall rate for each test category for each ISO class.

USP <1115>• Describes Microbial Assessment of Non-sterile Product Manufacturing
Environments• Part of Risk-Based Microbiological Control Program
• Contamination Recovery Rates from <1116> are not intended for non-sterile environments
• Contamination likely depends on level of human activity and levels of gowning
• Sampling locations should be selected based on risk evaluation• Frequency of monitoring should reflect the potential risk associated with
the dosage form• Products that are resistant to microbial contamination require little to no monitoring
AAMI TIR 52
• New AAMI TIR on Environmental Monitoring• Complete• Published in April 2014
TIR 52 Environmental Monitoring for the Manufacture of Terminally Sterilized Healthcare Products

EM Program’s of the Past• Maybe this is your current EM Program
• If so, you are not alone and this is the time to start to change your program to a risk based one
• Viable and Non-Viable• Center of the Room
• Surface Viable• Center of Each Wall• Floor - corner of each room, center of room
IS THIS WRONG?
IS THIS RISK BASED?

EM Program Risk-based Approach
Two way approach – similar but different based on prior knowledge:
1 – New EM Program2 – Reassessment of Current/Existing EM Program

New EM Program• New Facility?• New Controlled Environment additions to existing facility?• Any Prior Knowledge contamination types and levels?Prior knowledge is an input
Assess Microbial Risk of New Area• Product Type• Process
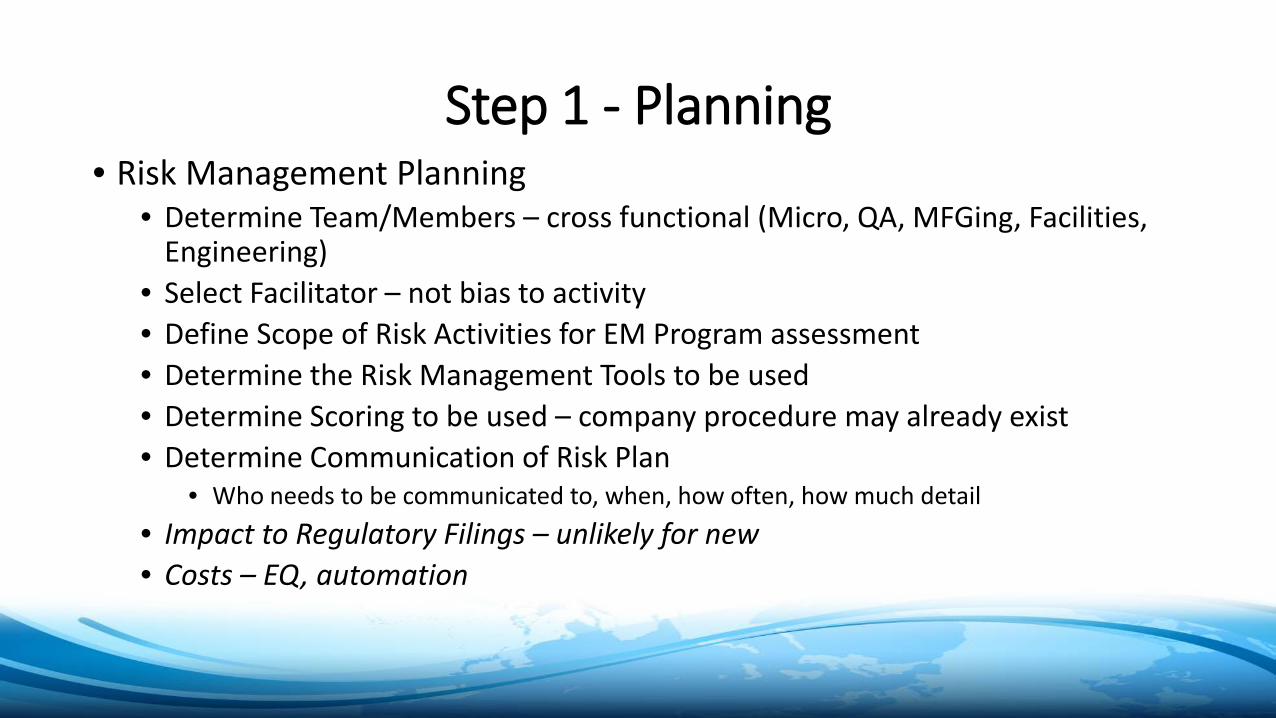
Step 1 - Planning• Risk Management Planning
• Determine Team/Members – cross functional (Micro, QA, MFGing, Facilities, Engineering)
• Select Facilitator – not bias to activity• Define Scope of Risk Activities for EM Program assessment• Determine the Risk Management Tools to be used• Determine Scoring to be used – company procedure may already exist• Determine Communication of Risk Plan
• Who needs to be communicated to, when, how often, how much detail• Impact to Regulatory Filings – unlikely for new• Costs – EQ, automation

Step 2 - Assess Activity Affecting Microbial State of Control
• Brainstorm• Fishbone• Cross functional team – Microbiologists, Manufacturing, Engineers,
Quality, Facilities• May want to break down by sub-teams for different rooms if large facility
No need to discuss current controls in place at this pointSimply identifying all areas of microbial risk

MICROBIALCONTROL
MATERIALS
MACHINE MOTHER NATURE
CAUSES OF MICROBIAL CONTAMINATION
Floods
Power Outages
HVAC
EQ 2
EQ 1Behavior
Batch Records
Gowning Materials
METHODS
MAN (HUMAN)
Gowning
Awareness
Raw Materials
Training
Airlocks
Sinks
FiresUtilities
Hoses
Carts/Cart Wheels
Charging Vessel
Cleaning Agents/Supplies
Raw Material Weighing/Dispensing
Cleaning
Tablet Coating
Washers

Step 3 - Assess Activity and Flow• Gemba each room/area if possible
• If construction phase, do via paper until you can get in the area• Best case - Work with engineers prior to design and construction start to identify
microbial risk points and plan them OUT• Assess planned personnel flow• Assess planned material flow• Sample site locations should be based on risk of activity• Likelihood of contamination from process
• Open or Closed Process• People likely largest contributors of room contamination if closed process
• Maybe you have a wet process – Gram negatives• Contamination from other products

Step 4 – Perform Risk Assessment
• Next use the information obtained in the brainstorming activity and floor assessment as a foundation to perform a risk assessment
• Include known controls and risk mitigations• Cross functional team – Microbiologists, Manufacturing, Engineers,
Quality, Facilities• Preliminary Hazard Analysis (PHA) or Failure Modes and Effects
Analysis (FMEA)

FMEA Process Example• Identify Hazards
• Example: Not meeting Air Quality Viable EM Levels• Identify Harms
• Example: Airborne contamination in controlled environment• Identify Hazardous Conditions
• Contamination of Room EQ• Contamination of product contact surfaces
• Contamination of People• Contamination of work surfaces
• Determine Severity, Occurrence and Detection Scores• Determine Risk Priority Number (RPN)• Determine Control Measures in Place
• Example: Cleaning/Disinfection• Example: HVAC System
• Determine if Additional Controls are Needed• Example: More Gowning
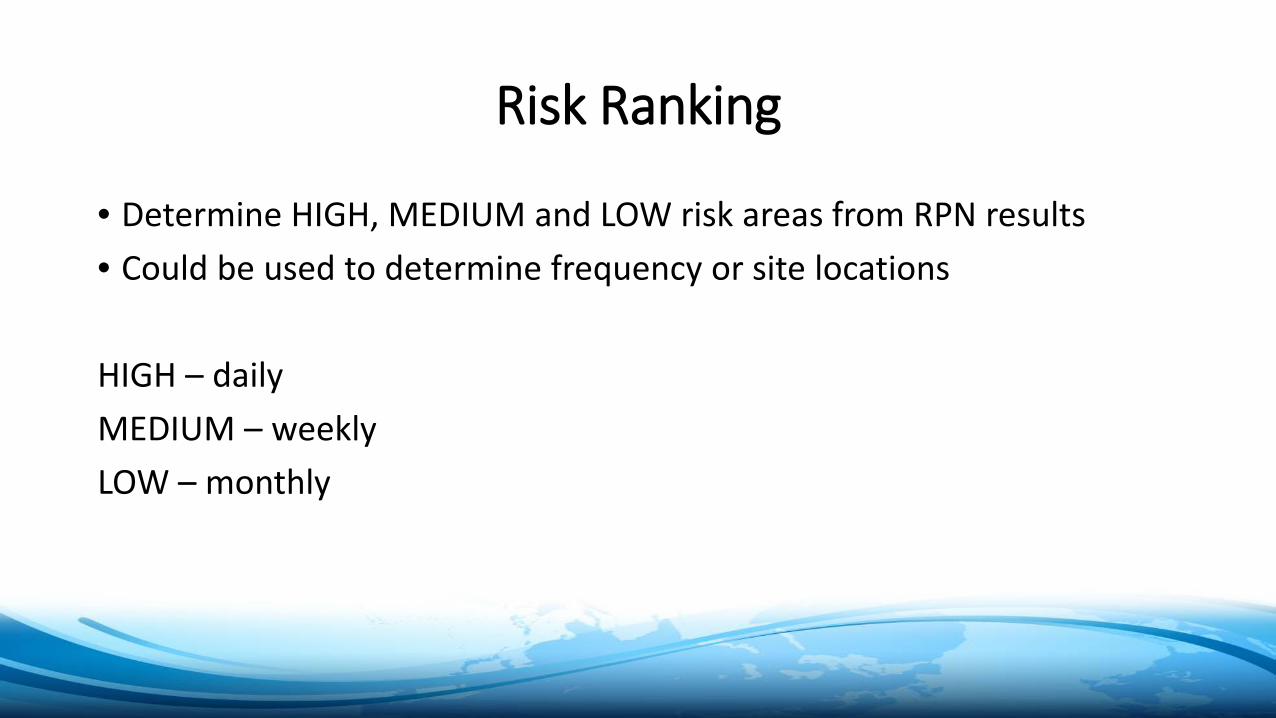
Risk Ranking
• Determine HIGH, MEDIUM and LOW risk areas from RPN results• Could be used to determine frequency or site locations
HIGH – dailyMEDIUM – weeklyLOW – monthly

Step 5 - Selection of Sample Locations and Sampling Frequencies
• Use all prior tools to now select your sample sites• Document your rationale based on the risk of contamination• Same sized (area) and same class rooms may have different numbers
of required sample sites based on risk of contamination in each room• Make it about the activity, flow and VALUE ADDED• UNDERSTAND THE PROCESS IN EACH ROOM and the MICROBIAL RISK
POINTS• Ability to assess effectiveness of sanitization – for that reason floor
and wall locations may still be needed in your program – reduced number and justification/thought process

Reassessment of Current EM Program
• Remember that slide on EM Programs of the Past?• Maybe you are saying - YES THAT IS ME!!!!
• Time to make some changes• Years of DATA which is KNOWLEDGE which you will use to make
changes to your existing EM Program• Sample site locations• Frequency• Type of media• Incubation
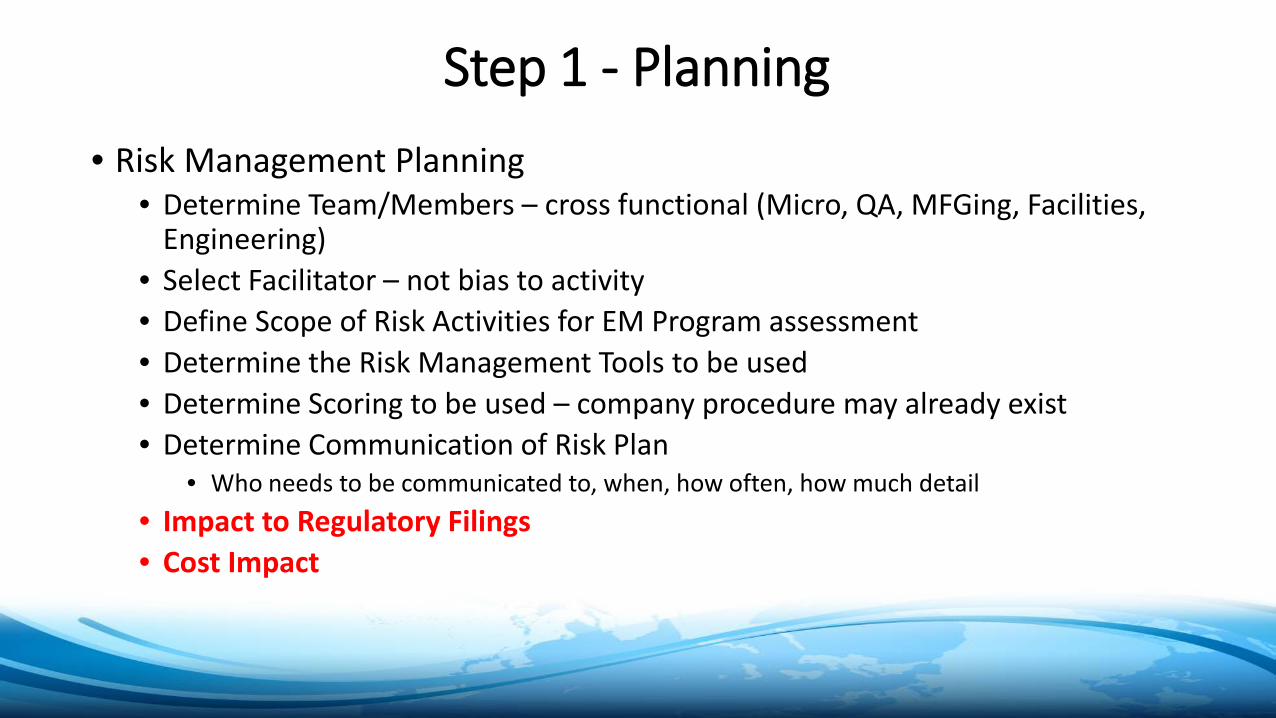
Step 1 - Planning• Risk Management Planning
• Determine Team/Members – cross functional (Micro, QA, MFGing, Facilities, Engineering)
• Select Facilitator – not bias to activity• Define Scope of Risk Activities for EM Program assessment• Determine the Risk Management Tools to be used• Determine Scoring to be used – company procedure may already exist• Determine Communication of Risk Plan
• Who needs to be communicated to, when, how often, how much detail• Impact to Regulatory Filings• Cost Impact

Step 2 – Previous Risk Assessment Review
• Do you have a Product and/or Process Risk Assessment which already identifies the microbial contamination risk points in your processes?
• HOPEFULLY – YES• If No – This is your step 2, Q8/Q9/Q10 or ISO 14197• Cross-functional activity• Fishbone from New EM Program Slides
• Assume Yes• Perform a review of this document to identify your microbial risk points as a
starting place

Step 3 – Data Review Current EM
• Assess current EM locations and results• What are your trouble spots – frequent alerts/actions or recovery of
objectionable organisms• Flag these – likely keeper for your new EM Program

Step 4 – Floor Walk/Gemba• Assess EQ, material and people flow ON THE FLOOR• Talk to current Production Operators
• Ask them what they see as microbial risk points• They have VAST knowledge from being on the floor everyday
• Cross functional – smaller group than risk assessment• Microbiology Lead• MFGing support• Most process knowledge
• Where have you had bioburden or water or compressed air contamination concerns?
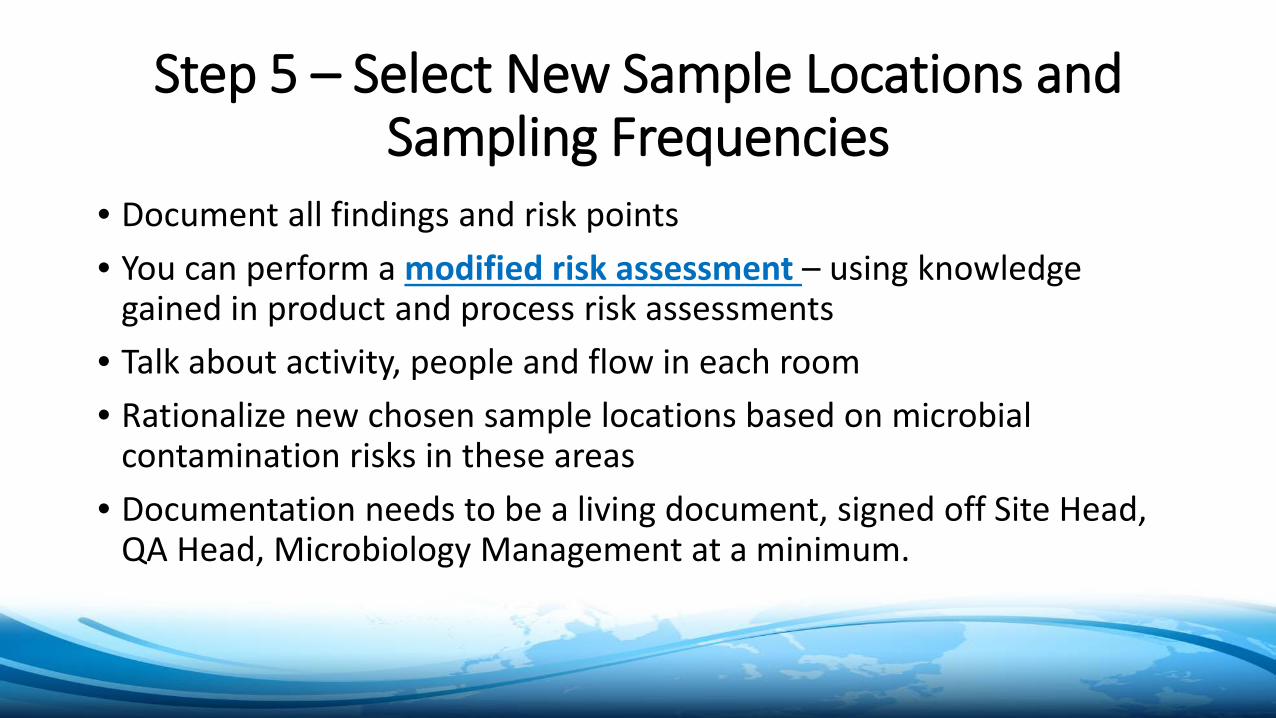
Step 5 – Select New Sample Locations and Sampling Frequencies
• Document all findings and risk points• You can perform a modified risk assessment – using knowledge
gained in product and process risk assessments• Talk about activity, people and flow in each room• Rationalize new chosen sample locations based on microbial
contamination risks in these areas• Documentation needs to be a living document, signed off Site Head,
QA Head, Microbiology Management at a minimum.

Example of Modified Risk Assessment
• Room Number• Room Description• Classification• Current Number V/NV/S locations• Microbial Risks in Rooms• People Movements/Flow• Number Proposed New V/NV/S locations• Comments discussing rationale based on risk

Execute Protocol
• If new sample locations and frequency are very different than your prior EM Program, suggest execution of protocol to collect baseline data
• Aid in setting alert/action levels
New EM Risk Model
EM-REM
Environmental Monitoring Risk Evaluation Model
Evaluate if current samples are risk based or not – rationalize risk based sample site selections

Risk Based EM – EM-REM*
• Risk – combination of the impact of the hazard or unwanted event and its likelihood of occurring and harming the patient
• Focus on proximity of sample location to potential contamination• Severity of product contamination is always HIGH risk
• Consider this a constant• Remove from assessment
• Focus on product and process knowledge, material flow, people flow, duration of time that people in working in the area
*Contamination Control in Healthcare Product Manufacturing, Volume 3, Jeanne Moldenhauer and Russell Madsen, PDA DHI Technical Books, Chapter 11 Hal Baseman and Mike Long- Intervention Risk Assessment Model (IREM)

EM-REM
• Use Key Word* risk assessment approach instead of using general, subjective terms for the level of risk (often, frequently, rarely)
• Example: Duration of activity:• Long, Medium, Short – subjective• > 10 minutes, greater than 1 minute but less than 10 minutes, less
than 1 minute – objective, measurable
*Contamination Control in Healthcare Product Manufacturing, Volume 3, Jeanne Moldenhauer and Russell Madsen, PDA DHI Technical Books, Chapter 11 Hal Baseman and Mike Long- Intervention Risk Assessment Model (IREM) and other published citations
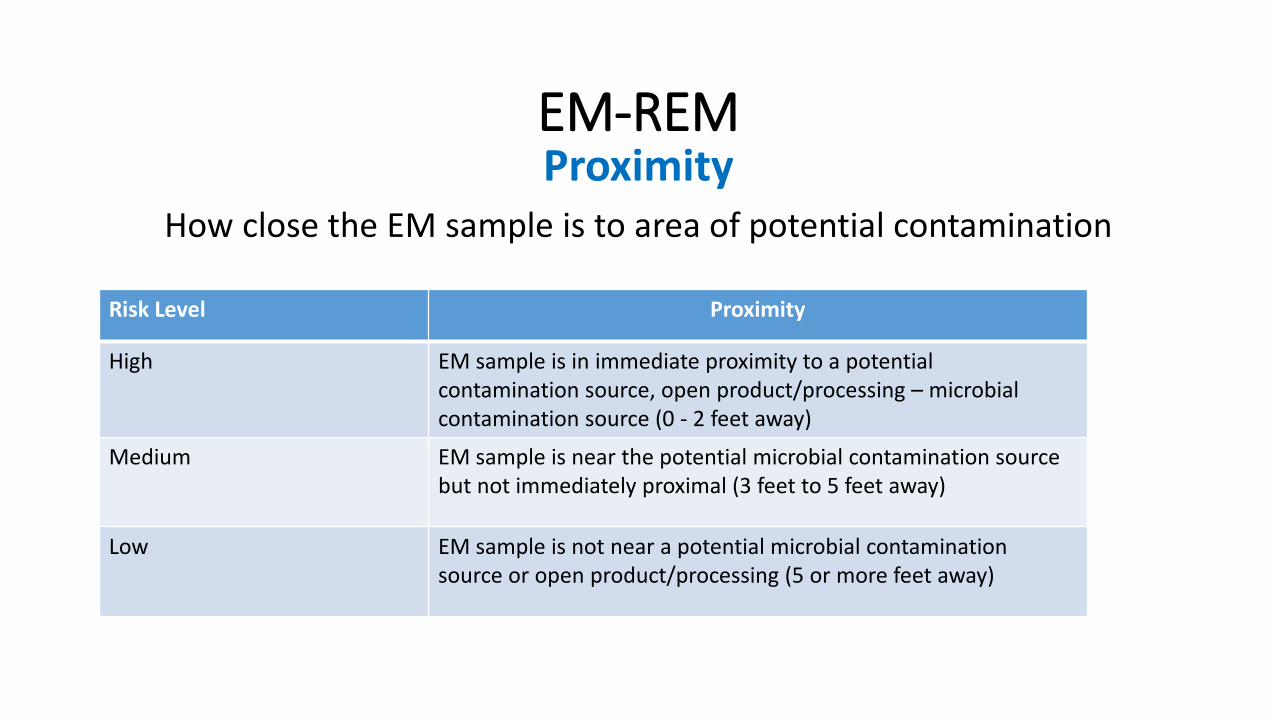
EM-REMProximity
How close the EM sample is to area of potential contamination
Risk Level Proximity
High EM sample is in immediate proximity to a potential contamination source, open product/processing – microbial contamination source (0 - 2 feet away)
Medium EM sample is near the potential microbial contamination sourcebut not immediately proximal (3 feet to 5 feet away)
Low EM sample is not near a potential microbial contamination source or open product/processing (5 or more feet away)

EM-REM
Number of PPL Routinely Present in Area• The more people in the area of the sample location, the higher the risk of contamination
• The longer the activity, the more risk for contamination• Traffic Flow – high, medium, low• Number of People ---- more ppl, more risk• Utilize batch record data, talk to operators, time the actual events to determine and set up a scale for your own EM
risk assessment
Risk Levels Number of People Working Near Sample Site
HIGH 8 or more people
MEDIUM 2-7 people
LOW 0 or 1 person

EM-REM
Duration – TimeThe longer the activity, the more risk for contamination
Risk Levels Time People are in Location
HIGH >6 – 8/10+ hours (Entire Shift)
MEDIUM >1 – 6 hours
LOW Less than 1 hour

Risk Based EM
• Two Level Risk Block Assessment Method:• Used to consider relationship of all three-risk elements• Two three block risk tables:• 1- Duration/Time and Number of People – to provide a risk level• 2 – Risk Class and Proximity
Determine if sample location is high, medium or low riskGoal – select and rationalize risk based sample locations as part of your EM Program (ensure high risk locations have sample sites)
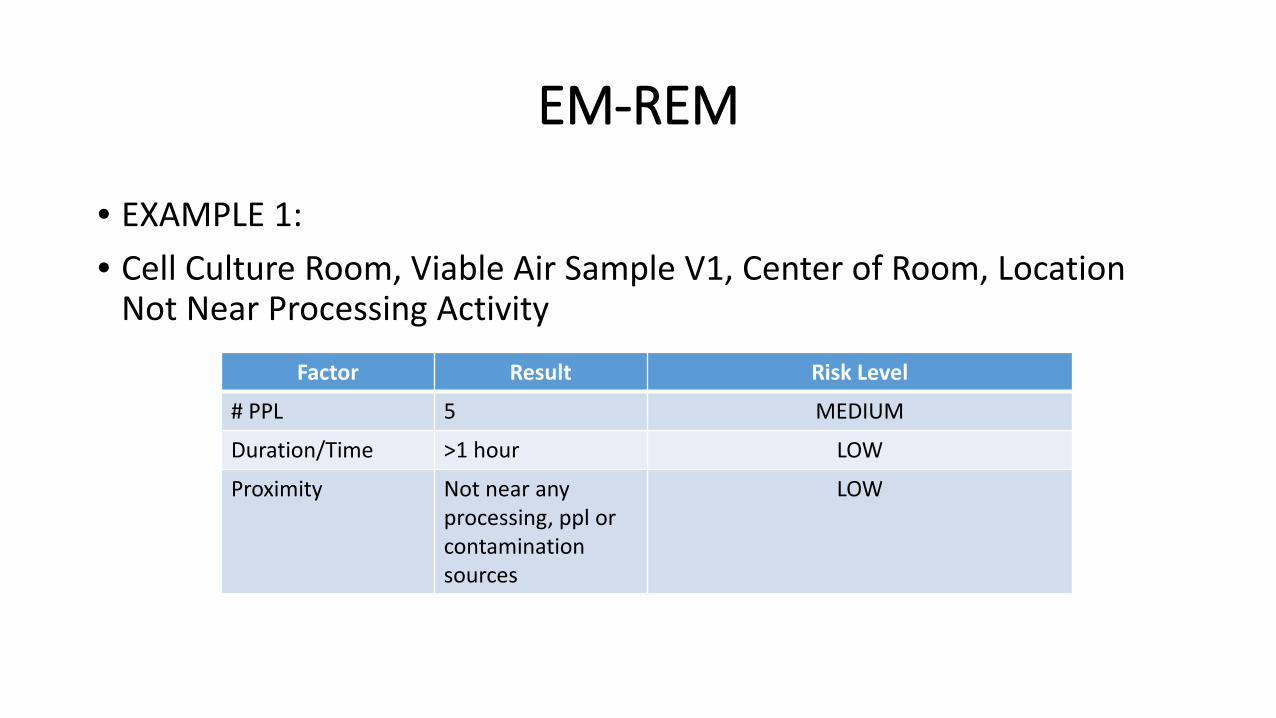
EM-REM
• EXAMPLE 1:• Cell Culture Room, Viable Air Sample V1, Center of Room, Location
Not Near Processing Activity
Factor Result Risk Level
# PPL 5 MEDIUM
Duration/Time >1 hour LOW
Proximity Not near any processing, ppl or contamination sources
LOW
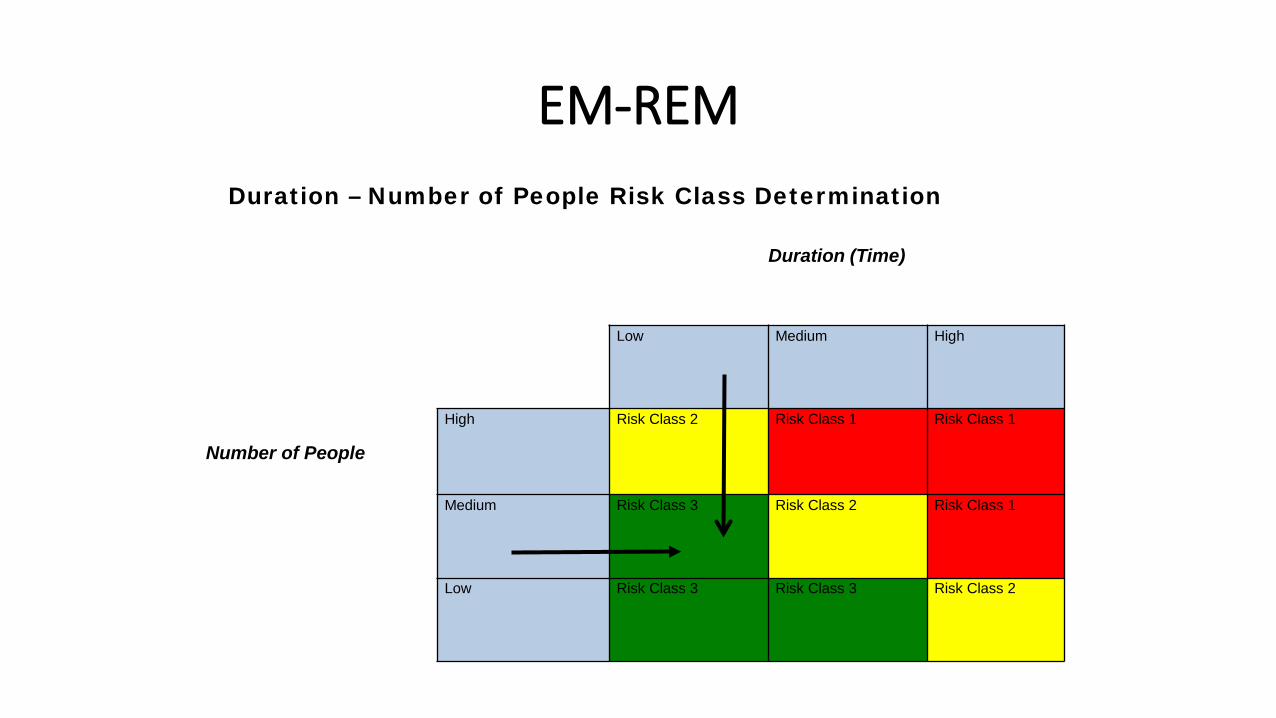
EM-REM
Number of People
Duration (Time)
Low Medium High
High Risk Class 2 Risk Class 1 Risk Class 1
Medium Risk Class 3 Risk Class 2 Risk Class 1
Low Risk Class 3 Risk Class 3 Risk Class 2
Duration – Number of People Risk Class Determination

EM-REM
Risk Class(From Table above)
ProximityLow Medium High
High Risk Priority 2 Risk Priority 1 Risk Priority 1
Medium Risk Priority 3 Risk Priority 2 Risk Priority 1
Low Risk Priority 3 Risk Priority 3 Risk Priority 2
Proximity – Risk Class Comparison Table
This is a LOW risk sample location

Risk Based EM
• EXAMPLE 2:• Floor RODAC F2 - Next to Floor Drain in Wash Room
Factor Result Risk Level
Duration/# PPL 8 HIGH
Time 3 hours MEDIUM
Proximity Next to drain HIGH

EM-REM
Number of People
Duration (Time)
Low Medium High
High Risk Class 2 Risk Class 1 Risk Class 1
Medium Risk Class 3 Risk Class 2 Risk Class 1
Low Risk Class 3 Risk Class 3 Risk Class 2
Duration – Number of People Risk Class Determination

EM-REM
Risk Class(From Table above)
ProximityLow Medium High
High Risk Priority 2 Risk Priority 1 Risk Priority 1
Medium Risk Priority 3 Risk Priority 2 Risk Priority 1
Low Risk Priority 3 Risk Priority 3 Risk Priority 2
Proximity – Risk Class Comparison Table
This is a HIGH risk sample location

Risk Based EM
• Opportunity to evaluate the risk and consider risk reduction for high risk locations that score HIGH or maybe even MEDIUM risk
• Evaluate changes to process to reduce the risk of the location and rescore• Risk assessment allows for training of operators on high risk areas in
the room• Use risk assessment to evaluate overall process and determine
priorities in implementing changes to the process• Allows for identification of high risk locations to rationalize EM
locations• Now need to tie in controls to select sample locations

Purification Room 1234 tial Sources Micro amination
Sample Location Sample ID # of People
Duration / Time
Risk Class Proximity
Risk Priority of
Sample Comments
Materials, ctivity Area Inside Door to Room V1, NV1, F1 M L 3 H 2
High Traffic Flow - all ppl enter room through this area, #P: 5 ppl working in this room
Materials, ctivity
Area between BSC and Chromatography Table V2, NV2, F2 M H 1 H 1 High activity area – 2 ppl
working all day Materials,
ctivity Area Near EQ X and Stainless Steel Table V3, NV3, F3 M H 1 H 1 High activity area – 2 ppl
working all day
Traffic Flow Area in front of door to exit/return corridor V4, NV4, F4 M L 3 H 2 Traffic Flow to Exit Room
High y Area
Stainless steel table center of room – top shelf S1 M H 1 H 1
Center work area for operators in the room, high activity area, batch records and equipment will touch table top shelf.
e
Stainless steel table center of room – bottom shelf S2 M H 1 H 1 Low shelf on table will be used –
risk from near floor
ment, People Stainless steel table with EQ XX S3 M H 1 H 1
High activity area in room with equipment XXX, people, batch records on table.
ment, s
Shelf on the shelving unit between airlock in and out of room
S4 M L 3 M 3 Supply Work In Progress (WIP) storage area.
Wall Between EQ 1 and EQ 2 Table Area W1 M L 3 M 3 Assess cleaning of walls

Risk Based EM
Conclusion• Risk assessment in EM is a tool to gain understanding of the high risk
locations in each room• Objective is:
• to gain knowledge so you can make informed decisions about process and select risk based EM sample locations
• Determine where to improve the process and reduce risk
• Control of risk = good process design• Good process design begins with a firm understanding of the process

Simplified EM Process

Environmental Monitoring Common RISKS…Irregular monitoring intervals…Inadequate detailing of test locations (sample points)…High volume of data difficult to track/manage…Lack of effective pattern recognition…Lack of effective lot traceability…Missed samples…Notifications on any deviation found are communicated manually…Manual reconciliation of actual vs. planned samples taken…Regulatory Compliancy…Costly Validation…Low operational efficiency
Environmental Monitoring HIGHEST RISK
By the time a trend of activity is developed and recognized, the condition
causing the trend is likely to have changed, making it difficult to support
corrective action activities and nearly impossible to perform meaningful
preventive actions.

Remediation of Risk via Quality Automation = Control
Risk Mitigation Using Risk-Based Approach
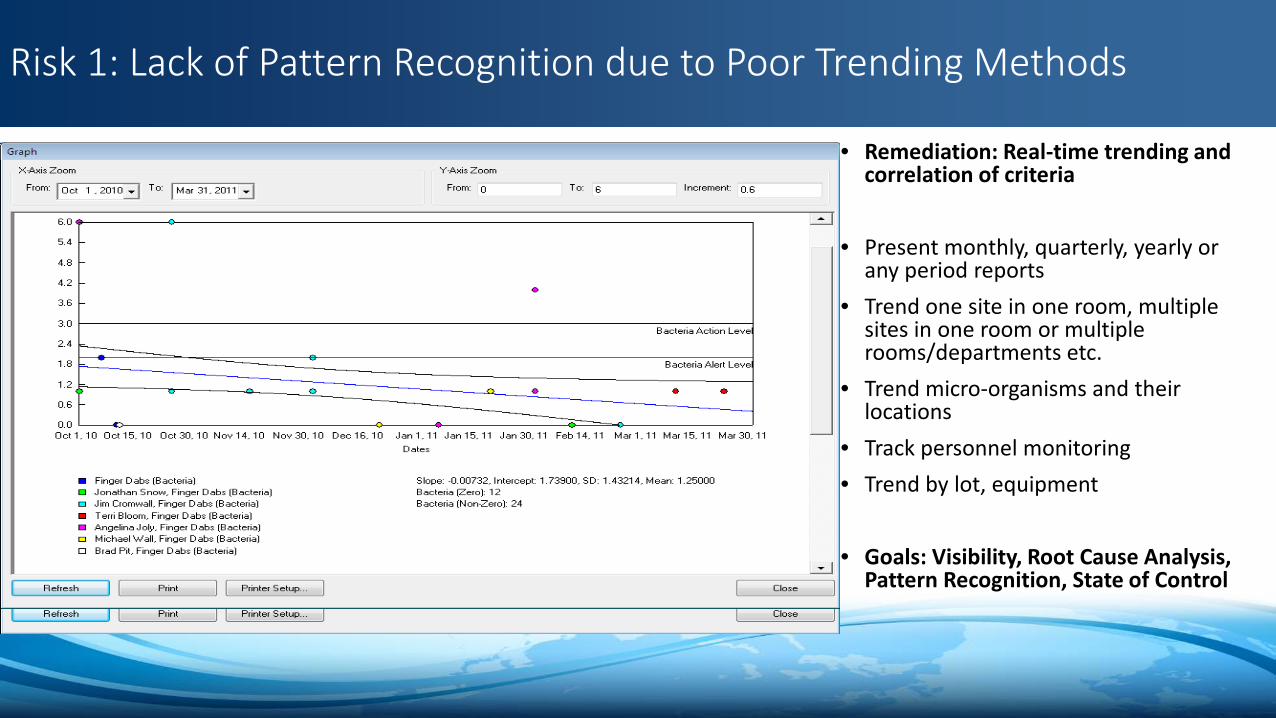
Risk 1: Lack of Pattern Recognition due to Poor Trending Methods
• Remediation: Real-time trending and correlation of criteria
• Present monthly, quarterly, yearly or any period reports
• Trend one site in one room, multiple sites in one room or multiple rooms/departments etc.
• Trend micro-organisms and their locations
• Track personnel monitoring• Trend by lot, equipment
• Goals: Visibility, Root Cause Analysis, Pattern Recognition, State of Control

Risk 2: Ineffective Sampling Due to Poor Sample Site Setup
• Remediation: Tracking and mapping of sample sites coupled with trending methods
• Setup effective sample sites based on room status (active/at rest).
• System scheduling and tracking
• Mapping of sites. Create your own map or import from Visio, Autocad or other.
• Sample status identified and tracked –chain of custody
• Use trending and dispersion mapping tools to analyze your site setup

Risk 3: Repetitive Excursions Due to Incomplete EM Process
• Remediation: Maintain control of your process by trending all the necessary EM data
• Manage all viable/non-viable tests• Include media fills and pre-
filtration bioburden• Monitor all utilities: water, clean
steam, compressed gas, etc • Monitor personnel • Record alert/action specifications,
media, incubation, lot, equipment, etc
• Trend to analyze all aspects of the complete EM process to improve state of control.

Risk 4: Errors Due to Improper Tracking and Scheduling
• Remediation: Regular monitoring, tracking and scheduling of samples
• Monitor any frequency of test• Perform Routine, Non-routine,
Batch, Process, At Rest, Dynamic monitoring as needed
• Track schedule and filter by due date, status, department, disposition, etc
• Lot and sample traceability

Risk 5: Excursions Due to Poor Analysis of Detected Micro-Organisms
• Remediation: Automated system that allows for micro-organism identification and analysis
• Identify your micro-organisms and store pictures with your identification.
• View the distribution of your genus, species, strain etc
• View the distribution by room, department, etc.
• Trend micro-organisms detected in a specific area or correlate with other environmental information

Risk 6: Inaction Due to Improper Identification and Follow-ups of Excursions
• Remediation: System allows effective setup of limits, provides tools to monitor excursions, allows for effective CAPA
• Use frequency analysis to help setup limits
• Rolling specifications• System automatically provides visual
and email notifications when an OOS or excursion occurs.
• Investigations can be initiated and tracked within the system
• Excursion reports • Dispersion mapping associates
excursions to sites on the map

Risk 7: Ineffective Analysis Due to High Volume of Data
• Remediation: A truly paperless and rapid data entry system
• Rapid data entry screen is the most flexible way to enter data in batches or copy it across different criteria
• Barcoding/RFID technology can provide additional automation
• Connectivity to instruments• Notebook PC and push screens

Take Away
Meaningful process = meaningful data
Use knowledge to apply findings back to your process for continuous improvement

References• ISO 14644-1 “Cleanrooms and
Associated Controlled Environments - Part 1: Classification of Air Cleanliness”, 1999
• www.particle.com• www.sterile.com• www.biovigilant.com• www.biomerieux-usa.com• www.emdmillipore.com• www.biosci-intl.com• www.pmeasuring.com• www.golighthouse.com• www.climet.com• USP <1115> and <1116>
Extra Reading Materials
www.pda.orgbookstore