Embed Size (px)
Citation preview

Aven CH179.tex 17/5/2007 10: 57 Page 1429
Risk and hazard analysis

Aven CH179.tex 17/5/2007 10: 57 Page 1430

Aven CH179.tex 17/5/2007 10: 57 Page 1431
Risk, Reliability and Societal Safety – Aven & Vinnem (eds)© 2007 Taylor & Francis Group, London, ISBN 978-0-415-44786-7
Further development of a Causal model for Air Transport Safety (CATS);building the mathematical heart
B.J.M. AleRisk Centre TU-Delft, Delft, The Netherlands
L.J. BellamyWhite Queen BV, Hoofddorp, The Netherlands
R. van der BoomMinistry of Transport and Waterworks, The Hague, The Netherlands
J. CooperJPSC consultants, London, UK
R.M. Cooke, L.H.J. Goossens, A.R. Hale, D. Kurowicka & O. MoralesTU-Delft, The Netherlands
A.L.C. RoelenNLR, Amsterdam, The Netherlands
J. SpougeDNV, London, England
ABSTRACT: The development of the Netherlands international airport Schiphol has been the subject of fiercepolitical debate for several decades. One of the considerations has been the safety of the population living aroundthe airport, the density of which has been and still is growing. In the debate about the acceptability of the risksassociated with the air traffic above The Netherlands extensive use has been made of statistical models relatingthe movement of airplanes to the risks on the ground. Although these models are adequate for the debate and forphysical planning around the airport, the need has arisen to gain a more thorough understanding of the accidentgenesis in air traffic, with the ultimate aim of improving the safety situation in air traffic in general and aroundSchiphol in particular. To this aim a research effort has started to develop causal models for air traffic risksin the expectation that these will ultimately give the insight needed. The concept was described in an earlierpaper. In this paper the backbone of the model and the way Event Sequence Diagrams, Fault-trees and BayesianBelief nets are linked to form a homogeneous mathematical model suitable as a tool to analyse causal chainsand quantify risks is described.
1 INTRODUCTION
As we described in earlier papers (Ale et al, 2005,Ale et al, 2006), the Netherlands ministry of Trans-port and Waterworks embarked on a project to modelthe accident genesis of air transport accidents with theaim of quantifying the risks of air traffic and support-ing the development of further measures and methodsto reduce these risks and improve safety. The modelis being developed by a consortium including DelftUniversity of Technology (TUD), Det Norske Veritas
(DNV), NationalAerospace Laboratory (NLR), WhiteQueen (WQ) and JPSC consulting.
The original design was based on work done inpreparatory projects on air traffic risk estimation(DNV 2002, Roelen et al, 2000) and work done inthe area of occupational safety, linking technologi-cal risks to management influences (Ale et al 1998,Bellamy et al, 1999). This design called for the combi-nation of three modelling techniques in a single model:Event Sequence Diagrams (ESD), FaultTrees (FT) andBayesian Belief Nets (BBN).
1431

Aven CH179.tex 17/5/2007 10: 57 Page 1432
Since then it has been decided to convert the ESD’sand the FT’s into BBN’s and construct the CATS modelas one integrated BBN. This allows using distribu-tions of values rather than point estimates whereverappropriate. It allows a convenient and consistent han-dling of dependencies and interdependencies through-out the model. It finally takes away the need forartificial transfer points in the model between ESD’s,FT’s and BBN’s.
This however did not take away the need to firstdevelop the ESD’s, FT’s and BBN’s separately as theseand their quantification form the basic material onwhich the integrated CATS BBN is built.
In this paper we use the term accident as definedby ICAO (ICAO, 2002). Usually such an accidentinvolves the end of a flight, but there are exceptions1.
2 CAUSALITY
Any effort to construct a model describing chains ofcausality of events in a system must be based on theassumption that causality exists and that causality evenin systems as complex as the aviation industry can bedescribed (ESREL 2007).
Several lines of discussion are continuing. Some ofthese are triggered by the perceived incomprehensi-bility of low probability – high consequence events.Some of these by the notion that analysis of causalityseems to have no end and some by the more legalisticdiscussion on whether a probabilistic progression ofa sequence of events should lead to a negation of thecertainty of the cause after the fact.
The matter of causality is a highly philosophicalquestion. We describe our position with respect tothese questions briefly below, in order to justify thecontinuation of our efforts toward those in the scien-tific community that have reached the point of seeingno further point in causal analysis and modelling.
The discussion about the infinity of the chain ofcausality is an old one and goes back to the Greekatomists some 400 years BC (Russell, 1946). The whyquestion in this context can have two meanings: “towhat purpose” and “with what cause”. Both ques-tions can only be answered within a bounded system,because they imply that there is something causing thesystem to exist.
A bounded system can show behaviour that the mak-ers did not anticipate. In most cases the cause of thisbehaviour can be found as a combination of behavioursof parts of the system that the makers of the system didnot consider. Projective analyses take time and effort,and efficiency demands these analyses to be limited.The fact that a behaviour was not anticipated does not
1 Such as a passenger having a fall while walking through theaisle, hitting his head and dying.
imply that anticipation was impossible, merely that itwas deemed impractical.
Nevertheless, one could make the proposition thatcomplex systems show emergent behaviour that is notonly surprising, but could not be anticipated in prin-ciple. We share the position that this proposition isequal to proposing that the system is alive (Chalmers,1996). And although human beings are part of theaviation system we take the position that the aviationsystem is put together by humans and run by humansbut is in itself inanimate. (Arshinov and Fuchs, 2003,Goldstein, 1999).
As regards causality in the “legal” sense, this is anissue that also plays a role in the discussion about flooddefences: what causes a flood: high water or a lowdike. This is a question like what is the contributionof the left hand to the noise when clapping hands. Weconsider the cause of the flood to be the combinationof height of water and height of dike where the lat-ter is lower than the former. A cause therefore is amulti-attribute entity. More generally a cause is theoccurrence of a particular combination of the valuesof relevant parameters that give rise to an accident.
Finally there is the proposition of probabilistic res-onance (Hollnagel, 2006). Resonance implies thatthe periodicity of one parameter of a system cou-ples with the periodicity of another parameter, leadingto synchronisation and amplification of the two. Inthe proposal by Hollnagel, extremes of random varia-tions of values of parameters combine such that theircombined effect brings a system outside its – safe –operating envelope.. In the case of accidents the rareextremes of independent variables occur simultane-ously by chance, such as in the – sometimes referredto as typically Dutch – problem of assessing the pos-sibility and probability of extreme flood conditions.Here the unknown probabilities of extreme values ofheights of water have to be deduced from the distri-bution of more moderate heights. The probability ofextreme weaknesses of dikes has to be inferred fromthe more familiar state of the sea defences. These haveto be combined to result in the probability of the simul-taneous occurrence of the two, giving rise to a flood.(van Gelder, 2007)
We therefore take the position that causality canbe established in the – inanimate – aviation systemin principle. Whether it is worth the effort is a cost-benefit question and therefore profoundly political. Inthis project we intend to go as far as is necessary toprovide decision makers with ways to reduce risk, ifthey wish to do so.
3 QUANTIFICATION
The question also is raised (ESREL 2007) whetherquantified analysis has any use given the paucity of
1432

Aven CH179.tex 17/5/2007 10: 57 Page 1433
Loss of control56%
Forced landing4%
Controlled flight intoterrain25%
Fire/explosion3%
Structural accident1%
Collision on ground4%
Mid air collision2%
Abrupt manoeuvre3%
Uninhabitable cabin2%
Figure 1. Breakdown of accident categories.
accident data and therefore the residual uncertainty inthe final result.
This discussion takes place wherever the risksinvolving low probability high consequence eventshave to be managed. (Laheij et al, 2003). In acompetitive industry or everywhere else whereresources are limited, the ultimate decision is one ofcost against benefits. Costs are expressed as a number,be it US dollars, Euro’s or another currency. So in thefinal decision risk, – with all its complexity – will bereduced to a number. We consider an educated guess,based on carefully designed and constructed modelsto be better than straight judgement alone. (Ale, 2002;Jongejan et al, 2006)
4 THE EVENT SEQUENCE DIAGRAMS
Accident categories are used to collect similar types ofaccidents with similar groups of causal factors togetherfor analysis in one part of the model. The accident cat-egories chosen for the CATS project are defined in theNLR report (Roelen et al, 2000). They are: (1) Abruptmanoeuvre, (2) Uninhabitable cabin environment, (3)Loss of control (unrecovered), (4) Forced landing, (5)Controlled flight into terrain (CFIT) , (6) Mid-air col-lision, (7) Collision on ground, (8) Structural accidentand (9) Fire/explosion.
The relative importance of each accident categoryis illustrated in Figure 1, which shows the breakdownof the number of fatal accidents on large Westerncommercial jets world-wide during 1990–2005. Inthis dataset, which was constructed from the ADREPdatabase and data supplied by airlines (Roelen et al,2000), there were 151 fatal accidents causing over10,000 fatalities. Security events and personal acci-dents such as falls have been eliminated from thedataset as they are outside the scope of the CATSproject. Loss of control and CFIT are clearly the mostimportant accident categories, accounting for approx-imately 80% of fatal accidents and also for 80% offatalities.
To next ESD
From previous ESD
Loss ofsituationalawarenessduring theapproach
Decision erroroperation of
equipment error
GPWS failurenot installed
early model orsystem
malfunction
Impact
Impact
Go-around
CRM failurecross checking
monitoringchallenging
Continueapproach
GPWS failure(ignored)
Go-around
To next ESD
TonextESD
TonextESD
FrompreviousESD
Figure 2. Typical ESD (Controlled Flight Into Terrain).
An Event Sequence Diagram Figure 2 is a flowchartwith paths leading to different end states. Each paththrough the flowchart is a scenario. Along each path,pivotal events are identified as either occurring or notoccurring. The event sequence starts with an initiatingevent such as a perturbation that requires some kindof response from operators or pilots or one or moresystems (Stamatelatos and Apostolokis, 2002).
Conditional operators can be included to repre-sent different outcomes depending on whether thecondition is met or not.
Intentionally, the building blocks of the scenariosare kept broad and generic to cover many ‘similar’situations. The detailed specific or possible causes orcontributing factors of these events are not directly ofinterest at the scenario level. They are added, whensuch details are necessary, through other layers of themodel, such as Fault Trees of Bayesian Belief Nets.Event Sequence Diagrams are often combined withfault trees. In practice, Event Sequence Diagrams aretypically used to portray progression of events overtime, while fault trees best represent the logic corre-sponding to failure of complex systems (Stamatelatosand Apostolakis 2002). Fault trees are used to modelinitial and pivotal events in Event Sequence Diagramsin sufficient detail. The initiating and pivotal events inthe Event Sequence Diagram are the top events in thefault trees.
Only active events are put in the accident sequence.Latent events are dealt with in the Fault Trees andBayesian Belief Nets.
A typical example of an ESD is given in Figure 2,which depicts the ESD for controlled flight into theground.All ESD’s are described in Roelen et al (2006).
The choice of ESD’s and the demarcation betweenthem is to a certain extent arbitrary. In any case thedemarcation will disappear from a modelling point ofview when the ESD’s are converted and combined intoa single BBN. For the sake of development 35 differentaccident types are distinguished (Table 1). The demar-cation is according to the accident types listed aboveand the phase of the flight in which such an accidenttype may occur.
1433
Aven CH179.tex 17/5/2007 10: 57 Page 1434
Table 1. The accident types chosen to build ESD’s.
Taxi Take- Initial En- Appr- Lan-off climb route oach ding
Abrupt x x x xmanoeuvre
Cabin x x x x x xenvironment(fire, O2)
Uncontrolled x x x x xcollision withground
Controlled flight x x xinto terrain
Forced landing xMid-air collision x x xCollision on x x x
groundStructural x x x x x
overloadFire/Explosion x x x x x x
GATE
NO
IE1? YES Unrecovered?
NO
ACCIDENTYES
IE2? YES Unrecovered? YES ACCIDENT
NO
IE3?NO
NO GATE
YES Unrecovered?
NO
YES ACCIDENT
Figure 3. Conceptual picture of ESD’s strung together.
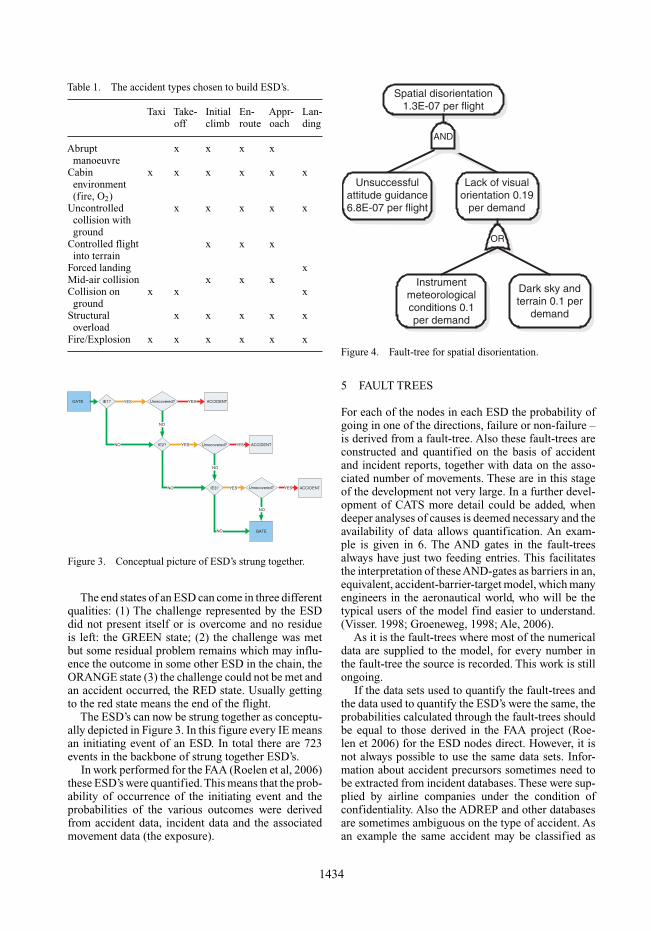
The end states of an ESD can come in three differentqualities: (1) The challenge represented by the ESDdid not present itself or is overcome and no residueis left: the GREEN state; (2) the challenge was metbut some residual problem remains which may influ-ence the outcome in some other ESD in the chain, theORANGE state (3) the challenge could not be met andan accident occurred, the RED state. Usually gettingto the red state means the end of the flight.
The ESD’s can now be strung together as conceptu-ally depicted in Figure 3. In this figure every IE meansan initiating event of an ESD. In total there are 723events in the backbone of strung together ESD’s.
In work performed for the FAA (Roelen et al, 2006)these ESD’s were quantified.This means that the prob-ability of occurrence of the initiating event and theprobabilities of the various outcomes were derivedfrom accident data, incident data and the associatedmovement data (the exposure).
Spatial disorientation1.3E-07 per flight
AND
Unsuccessfulattitude guidance6.8E-07 per flight
Lack of visualorientation 0.19
per demand
OR
Instrumentmeteorologicalconditions 0.1per demand
Dark sky andterrain 0.1 per
demand
Figure 4. Fault-tree for spatial disorientation.
5 FAULT TREES
For each of the nodes in each ESD the probability ofgoing in one of the directions, failure or non-failure –is derived from a fault-tree. Also these fault-trees areconstructed and quantified on the basis of accidentand incident reports, together with data on the asso-ciated number of movements. These are in this stageof the development not very large. In a further devel-opment of CATS more detail could be added, whendeeper analyses of causes is deemed necessary and theavailability of data allows quantification. An exam-ple is given in 6. The AND gates in the fault-treesalways have just two feeding entries. This facilitatesthe interpretation of theseAND-gates as barriers in an,equivalent, accident-barrier-target model, which manyengineers in the aeronautical world, who will be thetypical users of the model find easier to understand.(Visser. 1998; Groeneweg, 1998; Ale, 2006).
As it is the fault-trees where most of the numericaldata are supplied to the model, for every number inthe fault-tree the source is recorded. This work is stillongoing.
If the data sets used to quantify the fault-trees andthe data used to quantify the ESD’s were the same, theprobabilities calculated through the fault-trees shouldbe equal to those derived in the FAA project (Roe-len et 2006) for the ESD nodes direct. However, it isnot always possible to use the same data sets. Infor-mation about accident precursors sometimes need tobe extracted from incident databases. These were sup-plied by airline companies under the condition ofconfidentiality. Also the ADREP and other databasesare sometimes ambiguous on the type of accident. Asan example the same accident may be classified as
1434

Aven CH179.tex 17/5/2007 10: 57 Page 1435
Figure 5. Flight crew performance model quantified.
CFIT as well as landing short of the runway. The dif-ferences found in numerical outcomes, will be subjectof a further paper on the CATS model, once a fullerpicture is obtained.
6 THE BBN’S
The human operator plays an essential role at theexecution level of any risk bearing activity. In orderto account for the influence of the human opera-tor on accident causation, that role must be properlyrepresented in the causal risk model.
Thus, quantified models for people performance areneeded.The purpose of the human performance modelis to quantify the probability of a human error in cer-tain events in the ESD’s and of the Fault trees of theCausal Model for Air Transport Safety. These errorsare consistently modelled as the combination of thedemand for a certain action and the failure to do so.
The original design of CATS called for BBN’smainly when people were involved. Therefore threeof these have been envisaged: for a member of thecrew, for a person in maintenance and for a person inAir Traffic Control or Air Traffic Management. Themodel for Crew is already specified.
The flight crew performance is modelled as aBayesian Belief Net.
By representing the performance shaping factors ina BBN, we are not limited by the assumption that thePerformance Shaping Factors are independent. If nec-essary, dependencies between performance shapingfactors are easily introduced. We propose not to let thespecific task determine the (initial) error probability,but to take the associated event in the event sequencediagram or fault tree as the starting point.
Its structure is given in Figure 5, together with thequantification.
Factors – or variables – that are considered to havea significant influence on the human error probabil-ity in the crew and which can be given an operationaldefinition are considered here. Performance shapingfactors have been selected after a review of literatureand preliminary analysis of a large sample of acci-dents and incidents). These are among other training,fatigue, languages spoken, weather, procedures andexperience. The crew model is linked to every instancewhere an action or non action of the crew influencesthe probability of propagation of the fault through theBBN. In this way in as far the crew is a common causethese are modelled consistently.
Using a BBN as the modelling vehicle will allowthe modelling of the interdependencies between eventsin the model consistently. An example is given below,where there is a dependency between the probabil-ity of icing and the probability of engine failure. The
1435

Aven CH179.tex 17/5/2007 10: 57 Page 1436
Y = normal transform of visibility
-3
-2
-1
0
1
2
3
0 1000 2000 3000 4000 5000
-3
-2
-1
0
1
2
3
0 100 200 300 400 500
Y = normal transform of MAx
Figure 6. Normal transformations of Marginal Distributions.
probability of this dependency manifesting itself canand will be made conditional on the type of aircraft.
Management influences are modelled using theapproached developed in the IRISK project (Bellamyet al, 1999) and modified for CATS as described inAle et al (2006). Although the structure of the modelfor flight crew error probability is fixed, the value dis-tribution of the parameters can vary depending on thetask the crew has to perform.
The values and their distribution are obtained bysessions with experts according to procedure devel-oped by Cooke (1991).
Netica and Uninet software were used to performthe required mathematical operations.
7 CONVERSION TO BBN
A major problem to overcome in the developmet ofCATS was to couple the various modelling techniques.In addition solutions had to be found not only for theinterdependencies inside ESD’s, FT’s and BBN’s butalso between these. Based on experience in previousprojects it appeared that BBNs are an attractive mod-elling tool in which the user readily recognises hisproblem. The graphical problem representation is alsothe user interface with which the user can do ’what-if ’ analyses. BBNs can encapsulate fault-tree Booleanlogic, but they can also capture probabilistic ratherthan strict causal relations. BBNs can also integratewith decision options. The conditional probabilitieswill either result from data or from expert opinion.
There are however also drawbacks using BBN’s,especially the discrete versions.
Figure 7. From fault tree to BBN.
Discrete normal BBNs work well if indeed thenormality assumptions hold. If not, then
1. The individual variables must be transformed tonormal (requiring of course the marginal distribu-tions).
2. The conditional variance in normal units must beconstant; the partial regression coefficients apply tothe normal units of the transformed variables, notto the original units. This places a heavy burden onany expert elicitation.
3. If a parent node is added, after quantification, thenthe previously assessed partial regression coeffi-cients must be re-assessed.
To illustrate these issues, the densities for the num-ber of MissedApproach executions per 100,000 flightsand of Visibility, as obtained from data for the proto-type application are shown in Figure 6. The horizontalunits are the natural units of these two variables, andvertical units are the normal units. Normal units are
1436

Aven CH179.tex 17/5/2007 10: 57 Page 1437
Aircraft takesoff with
contaminatedwing Flight
crew fails to regain control
Unrecoveredloss of control
Collision with ground
Aircraft stalls after rotation
Single engine failure
Ice melts
Aircraft continues flight (ok)
Aircraft continues
flight (icing)
Dual engine failure
Total power loss
Flight crew fails to restore engine power
Fight crew shuts down wrong
engine
Flight crew fails to
maintain control
Aircraft unable to
reach airport
Aircraft lands off runway
Flight crew carries out powerless approach
Aircraft continues landing
Asymetric trust
Ice falls in engine
Ice melts
Figure 8. Part of CATS model dealing with icing followed by engine failure.
indicted on the horizontal axis as the intervals betweenthe arrowheads.
In the procedure used in CATS, nodes are associ-ated with arbitrary continuous invertible distributionsand arcs with conditional rank correlations, which arerealised by the (conditional) copula, indexed by (con-ditional rank) correlation. (see also Cooke and Bedford2001).
Use of non-constant conditional copulae would sig-nificantly complicate the Monte Carlo sampling andthe quantification. The current platform supports onlyconstant conditional copulae, as this is judged prudentfor a first implementation. Given that the conditionalcopulae are constant, there are great advantages tousing the joint normal copulae, which requires con-stant conditional copulae. Unlike the normal BBN,however, nodes and influences can be added or deletedwithout re-assessing previously assessed quantities.
The assessment burden for a Distribution Free Con-tinuous BBN is thus one dimensional distribution foreach node, and for each arc, a (conditional) rank cor-relation. These are obtained either from data or fromexpert judgement.
8 FROM FAULT-TREES TO BBN’S
The method developed for CATS translates a fault-tree into the equivalent BBN. This BBN is special
in the sense that any node can only take two valuesand that the state of downstream nodes is completelydetermined by Boolean combinations of the upstreamnodes. (in fact a fault-tree). By translating a fault-tree in this way Fault-trees and BBNs are just partsof a larger BBN and can be treated and quantified ina single operation In Figure 7 it is depicted how thefault-tree of Figure 4 is transformed into a BBN.
It may be slightly cumbersome to rewrite a fault treeto the corresponding Bayesian belief net. Moreoverone cannot see from the BBN graph to which gate agiven influence corresponds.This information must beretrieved from a conditional probability table. On theother hand we can easily see an influence of each gateon the top event as all intermediate failure probabilitiesof each gate are calculated.
The main difference between the FT and BBNapproaches is that a FT represents a binary functionwith basic events as inputs and the top event as theoutput. BBNs however represent a joint distributionbetween binary random variables (basic, intermedi-ate events and the top event). Hence BBN is a muchricher model then FT and will allow the existenceof repeated events as well as dependencies betweenevents.
The conversion of ESD’s to BBN’s is straight for-ward as they already are directional graphs of whichthe conditional probabilities of the nodes and the arcsare known.
1437

Aven CH179.tex 17/5/2007 10: 57 Page 1438
9 INTEGRATED BBN
The whole model can now be integrated in one singleBBN. In the paper we give two examples. One is thesection of the model dealing with Controlled FlightInto Terrain (CFIT), the other is associated with theinterdependencies between two ESD’s: the ESD deal-ing with contaminated wing and the ESD dealing withengine failure.
In the section of the model is shown dealing withthe ESD for icing and the ESD for engine failure.
The ESD for icing involves in essence a take-offwith contaminated wings (icing), which can lead to theaircraft stalling and the crew losing control at take-off.
If the crew manages to take off successfully theice may come loose. On an airplane having two tailmounted jet engines (such as a DC9) the ice may enterthe engines leading to engine failure on one or both ofthe engines (FSF 1993).
Other causes of engine failure are fuel starvation,maintenance errors and for instance the crew shuttingdown the one remaining engine once one engine hasfailed.
Therefore there are – direct – causes for enginefailure and causes origination in other ESD’s or haz-ards which only partly have been overcome. Figure 8shows the various pathways leading to complete loss ofpower. The dashed lines are pathways leading to othersections of the model in an orange state. As describedearlier this means that there are faults remaining in thecondition of the aircraft which may lead to increasedvulnerability of other mishaps. In model terms: toincreased probability of other failures.
10 VALIDATION
In this stage of development no definitive validationcan be performed. In any case validation will only bepossible to the extent that changes in safety perfor-mance of the past resulting from design decisions in thepast are calculated correctly. Once this validation hasbeen done, the model will be used first as an additionalinput to safety decisions in the Netherlands aerospaceindustries. It took about 20 years between the concep-tion of a causal model for chemical plants and theintroduction in the legal system in the Netherlands(Ale, 2003). A similar cautious introduction of thesesort of techniques in the Air Traffic industry should beexpected.
11 CONCLUSION
The structure and backbone of a Causal Model of AirTraffic Safety has been developed. The backbone con-sists of the string of 35 separate accident categorieswith repetitions in each flight phase, which are based
on a study of accidents and incidents over 2 decades.The probabilities of the various accidents pathwaysare quantified using first fault-trees developed fromaccidents and incident reports. A model for the errorprobability of crew members has been developed andquantified using expert judgement elicitation tech-niques. The model is integrated in a single integratedBayesian Belief Net, which allows consistent handlingof probabilities and their interdependence.
ACKNOWLEDGMENTS
The work described in this paper was fully funded bya grant of the Netherlands ministry of Transport andWaterworks.
REFERENCES
Ale, B.J.M., J.G.Post, L.J. Bellamy, 1998, The Interfacebetween the Technical and the Management Model for usein Quantified Risk Analysis In: A. Mosleh and R.A. Bari(Eds.), Probabilistic SafetyAssessment and Management,Springer, 1998.
Ale, B.J.M. (2002) Risk Assessment practices in the Nether-lands, Safety Science 40 (2002) 105–126, ISSN 0925-7535.
Ale, B.J.M. (2005), L.J. Bellamy, R.M. Cooke, L.H.J.Goossens, A.R. Hale, D. Kurowicka, A.L.C. Roelen, E.Smith, Development of a causal model for air transportsafety, in Kolowrocki (ed), Advances in Safety and Relia-bility (ESREL 2005), Taylor and Francis Group, London,ISBN, 0 415 38340 4.
Ale, B.J.M. (2006), L.J. Bellamy, R.M. Cooke, L.H.J.Goossens,A.R. Hale, A.L.C.Roelen, E. Smith, Towards a causalmodel for air transport safety – an ongoing researchproject, SAFETY SCIENCE,Volume 44, Issue 8, October2006, Pages 657–673.
Ale, B.J.M. (2006) The Occupational Risk Model, TU-Delft/TBM RC 20060731, ISBN 90-5638-157-1, Delft,2006.
Arshinov, Vladimir (2003) and Christian Fuchs (eds),Causality, Emergence, Self-Organisation, http://www.self-organization.org / results /book/EmergenceCausalitySelf-Organisation.pdf
Bellamy, L.J., (1999), J.I.H. Oh, A.R. Hale, I.A. Papazoglou,B.J.M. Ale, M. Morris, O. Aneziris, J.G. Post, H. Walker,W.G.J. Brouwer, A.J. Muyselaar IRISK, development ofan integrated technical and management risk control andmonitoring methodology for managing on-site and off-siterisks, EC contract report ENV4-CT96-0243 (D612-D).
Chalmers, D.J. (1996), The Conscious Mind: In Search of aFundamental Theory (Oxford: Oxford University Press).
Cooke R.M. 1991, “Experts in Uncertainty: Opinion andSubjective Probability in Science” in EnvironmentalEthics and Science Policy Series, Oxford University Press,June 1991.
Cooke R.M. (2001) and T. Bedford, Probabilistic Risk Anal-ysis, Foundations and Methods, ISBN 0 521 77320 2,Cambridge University Press, New York.)
1438

Aven CH179.tex 17/5/2007 10: 57 Page 1439
DNV, 2002, Causal Modelling Of Air Safety; Final Report,London, November 2002.
ESREL (2007) Reviewers remarks.FSF (1993) Flight Safety Foundation. Training, deicing and
emergency checklist linked in MD-81 accident followingclear-ice ingestion by engines, Accident Prevention, Vol.50, No. 12.
Gelder, Pieter van, 2007, Quantitative Methods for FloodRisk Management, Statistical Extremes and environmen-tal risk, faculty of sciences, university of Portugal, Lisbon,Portugal,feb 15–17, 2007.
Goldstein, Jeffrey (1999) Emergence as a Construct: Historyand Issues, Emergence, Vol. 1, No. 1, Pages 49–72. (doi:10.1207/s15327000em0101_4).
Groeneweg, J., (1998), “Controlling the Controllable”,DSWO press , Leiden, 1998, ISBN 90 6695 140 0.
Hollnagel, E. (2006) BarriersAndAccident Prevention, ISBN0-7546-4301-8, Ashgate, Burlington, USA.
ICAO, (2002), Manual of Aircraft Accident Investigation(Doc 6920), 4th EDITION, ICAO, Montreal, Canadahttp://aviation-safety.net/investigation/cvr/transcripts/cvr_sk751.php.
Jongejan, R.B. (2006), B.J.M. Ale, J.K. Vrijling, FN-criteriafor risk regulation and probabilistic design, International
Conference on Probabilistic Safety Assessment and Man-agement, May 13–19, 2006, New Orleans.
Roelen, A.L.C. R. Wever. A.R. Hale, L.H.J. Goossens, R.M.Cooke, R. Lopuhaä, M. Simons and P.J.L. Valk, 2000,Feasibility of the development of a causal model for theassessment of third party risk around airports, Part 1:Main report, NLR-CR-2000-189-PT-1, NLR Amsterdam,April 2000.
Roelen,A.L.C, van Doorn, B.A., Smeltink, J.W.,Verbeek, M.J.and Wever, R. (2006) Quantification of Event SequenceDiagrams for a causal risk model of commercial airtransport National Aerospace Laboratory NLR, ReportNLR-CR-2006-520, Amsterdam October 2006.
Russell, Bertrand, (1946) History of Western Philosophy,George Allen & Unwinn, London.
Stamatelatos, M. and G. Apostolakis, 2002. Probabilisticrisk assessment procedures guide for NASA managers andpractitioners, Version 1.1.
Visser, J.P., (1998), “Developments in HSE Management inoil and gas exploration and production”, in A.R. Hale andM. Baram, Safety Management, the challenge of change,Pergamon, 1998, ISBN 0-08-043075-9.
1439

Aven CH179.tex 17/5/2007 10: 57 Page 1440