Embed Size (px)
Citation preview
RISK ANALYSIS FORDAM SAFETY EVALUATION:
HYDROLOGIC RISK
By
Jery R. Stedinger, David C. Heath, and Kay ThompsonCornell University
Ithaca, NY 14853-3501
For
U.S.Army Corps of Engineers Institute for Water Resources
7701 Telegraph RoadAlexandria, VA 22315-3868
March 1996 IWR REPORT 96-R-13

The views, opinions, and/or findings contained in this report are those of the authors and shouldnot be construed as policy of the U.S. Army Corps of Engineers.

iii
PREFACE
This report was initiated under the U.S. Army Corps of Engineers’ Dam Safety Research Program.The report was prepared to fulfill part of several work units in the research program. These workunits focused on outlining dam safety standards, developing risk and uncertainty concepts, andspecifically studying aspects of risks of failure involving dams and spillways constructed by the Corps.
The purpose of this research project was to demonstrate the application of quantitative riskassessment techniques to hydrologic risk of dam safety analysis. A review of traditional andalternative methodologies is given, as is a discussion of some basic risk analysis concepts, tools, andtechniques. The report proposes a method for analyzing hydrologic risk in application to dam safety,and demonstrates through use of a sample analysis. The report should be viewed as an investigationinto the application of risk analysis techniques to dam safety analysis. This report is not intended asguidance for performing dam safety analysis. Furthermore, it is not suggestive of using risk analysisin place of traditional methods of analysis, rather it does suggest that risk analysis and the productsthereof provide additional information and serve as an aid in the decision making process.
The report consists of five chapters, a bibliography, and two appendices. The chapters providebackground information on the evolution of dam safety analysis, a general framework of quantitativeassessment of dam safety, and a sample analysis demonstrating how such an analysis is performed.The first appendix is an annotated bibliography of relevant research in the field, while the secondappendix technically describes the model used in the sample analysis.
This report was prepared by Jery Stedinger, David C. Heath, and Kay Thompson of CornellUniversity under terms of a contract with the U.S. Army Corps of Engineers Institute for WaterResources. Dr. Eugene Z. Stakhiv was the initial contract manager for the report and was succeededby Dr. David A. Moser of the Technical Analysis and Research Division and program manager of theRisk Analysis for Water Resources Investments Program. The Chief of the Technical Analysis andResearch Division is Mr. Michael R. Krouse and the Director of IWR is Mr. Kyle Schilling. Mr.Robert Daniel, Chief of Economics and Social Analysis Branch, Planning Division, HQUSACE, Mr.Earl Eiker, Chief of Hydrology and Hydraulics Branch, Engineering Division, HQUSACE, and Mr.James Crews, HQUSACE, served as technical monitors for the research program. Numerous fieldreviewers provided valuable insights and suggestions to improve early drafts.

iv

v
EXECUTIVE SUMMARY
Presently, based on historical and methodological development, the safety standard for high hazard dams is theProbable Maximum Flood (PMF). The PMF is assumed to provide, in effect, a “zero-risk” of failure, therebyensuring the safety of downstream populations. This gauge of maximum flood is principally based upon theconservative application of the Probable Maximum Precipitation (PMP); an estimate of the maximum possibleprecipitation depth over a given catchment in a given length of time. It is calculated by maximizing the moistureof a given storm in relation to the specified catchment over the duration of the event and the affected area, basedupon historical record. However, the PMF design standard has been questioned for two reasons. One, estimatesof the PMF have changed over time as data is collected. This change in the PMF estimates detracts from itsconceptual premise that a design meeting this standard yields one of zero risk. Second, the PMF standard doesnot allow for any trade-off among costs, economic benefits, and risk.
Budgetary concerns relating to large dam retrofit decisions in the U.S. have created a demand for justifying scarceappropriations. This has resulted in greater interest in risk-based analyses and possibly has caused an easing ofstandards. Recently, risk-based procedures have been encouraged for retrofit decisions when a structure has notpassed the latest PMF estimate, but still might be deemed safe enough, or used to evaluate whether the cost ofupgrading to full PMF is justified. The debate is not over safety, rather it is concerned with the best allocationof the Nation’s scarce resources. Risk-based analysis has been proposed as both an alternative and a complementto the PMF analysis and design standard. However, traditional risk-based methodologies have difficulty inapplication to this problem stemming from the possibility of low risk catastrophic events. A project solelydesigned on risk-based analysis invites the possibility of a catastrophic failure at a low risk. Furthermore, thereliance on expected value calculations in traditional risk-based analysis inherently depreciates the importanceof catastrophic losses through its means of computation. Consequently, research continues on developing risk-based decision variables that adequately account for the catastrophic consequences of failure.
This research contributes to the evolution of risk-based dam safety assessment methods by illustrating how damsafety risk assessment analysis might be improved by employing more detailed stochastic descriptions of therainfall and runoff processes, and improving the performance of warning systems, dams, and other structures.The products of a stochastic analysis, such as that explored, will provide further insights into the complexitiesof dam safety problems than traditional deterministic methods alone. These products include the pathways tofailure and their associated relative likelihoods, overall failure probabilities, and the trade-offs between safetyand costs. Using a detailed stochastic analyses will give decision-makers more information about the implicationsof adopting alternative solutions to dam safety problems, thus ameliorating the evaluation process.
The report develops and illustrates the concepts needed to perform a thorough probabilistic analysis of the damsafety issue, including the calculation of the probability of dam failure and the distributions for dollar damagesand loss-of-life as a result of the combinations of the many factors that result in large releases from a dam, andpossibly as a result of actual structural+ failure. Such an enterprise is both complicated and controversial as itrequires that probability distributions or particular values be assigned to meteorological and hydrologic variables,the status and performance of the structure, and the response and impact of releases from the dam on humanpopulations and their possessions. Quantitative risk assessment such as this described is based upon the premisethat man-made systems can fail. Thus, it suggests that in times of scarce resources, engineering analyses shouldconsider how to reduce the costs and consequences of failure in balance with the cost of such efforts. However,the analysis is not advocating the use of risk analysis in lieu of traditional design standard analysis. Rather, it

Risk Analysis for Dam SafetyEvaluation: Hydrologic Risk Executive Summary
vi
proposes the use of quantitative risk analysis as a complement to current design standard analysis. Usingquantitative risk analysis as an aid or tool in the decision making process, or as an integral component oftraditional design standards, gives decision-makers more information about the implications of adoptingalternative solutions to dam safety problems, and should aid in the evaluation of alternatives.

vii
TABLE OF CONTENTS
Preface . . . . . . . . . . . . . . . . . . . . . . . . . . . . . . . . . . . . . . . . . . . . . . . . . . . . . . . . . . . . . . . . . . . . . . . . . . . . . . . . iii
Executive Summary . . . . . . . . . . . . . . . . . . . . . . . . . . . . . . . . . . . . . . . . . . . . . . . . . . . . . . . . . . . . . . . . . . . . . . v
Table of Contents . . . . . . . . . . . . . . . . . . . . . . . . . . . . . . . . . . . . . . . . . . . . . . . . . . . . . . . . . . . . . . . . . . . . . . vii
Chapter 1 - Introduction . . . . . . . . . . . . . . . . . . . . . . . . . . . . . . . . . . . . . . . . . . . . . . . . . . . . . . . . . . . . . . . . . . 1Background and Alternative Methodologies . . . . . . . . . . . . . . . . . . . . . . . . . . . . . . . . . . . . . . . . . . . . 1
The Potential Quality of Results . . . . . . . . . . . . . . . . . . . . . . . . . . . . . . . . . . . . . . . . . . . . . . 3Practical Considerations and Complexity of the Analyses . . . . . . . . . . . . . . . . . . . . . . . . . . 4Acceptability of the Results . . . . . . . . . . . . . . . . . . . . . . . . . . . . . . . . . . . . . . . . . . . . . . . . . . 5
Goals for this Study . . . . . . . . . . . . . . . . . . . . . . . . . . . . . . . . . . . . . . . . . . . . . . . . . . . . . . . . . . . . . . . 6
Chapter 2 - A Framework for Dam-Safety Risk Analyses . . . . . . . . . . . . . . . . . . . . . . . . . . . . . . . . . . . . . . . . 7Describing Events . . . . . . . . . . . . . . . . . . . . . . . . . . . . . . . . . . . . . . . . . . . . . . . . . . . . . . . . . . . . . . . . 8A Computational Procedure . . . . . . . . . . . . . . . . . . . . . . . . . . . . . . . . . . . . . . . . . . . . . . . . . . . . . . . . 11
Chapter 3 - Presentation of Dam Safety Study Results . . . . . . . . . . . . . . . . . . . . . . . . . . . . . . . . . . . . . . . . . 15Display of Results . . . . . . . . . . . . . . . . . . . . . . . . . . . . . . . . . . . . . . . . . . . . . . . . . . . . . . . . . . . . . . . 15Frequency and Probability Models of Damage . . . . . . . . . . . . . . . . . . . . . . . . . . . . . . . . . . . . . . . . . 15Alternative Graphical Displays of the Risk and Losses . . . . . . . . . . . . . . . . . . . . . . . . . . . . . . . . . . 16
Exceedance Probabilities . . . . . . . . . . . . . . . . . . . . . . . . . . . . . . . . . . . . . . . . . . . . . . . . . . . 16Expected Damage from All Events Greater than Various Thresholds . . . . . . . . . . . . . . . . 17The Partitioned Multi-objective Risk Method . . . . . . . . . . . . . . . . . . . . . . . . . . . . . . . . . . . 19
Chapter 4 - Probabilistic Dam Performance Analysis . . . . . . . . . . . . . . . . . . . . . . . . . . . . . . . . . . . . . . . . . . 23Background . . . . . . . . . . . . . . . . . . . . . . . . . . . . . . . . . . . . . . . . . . . . . . . . . . . . . . . . . . . . . . . . . . . . 23Discussion of Results . . . . . . . . . . . . . . . . . . . . . . . . . . . . . . . . . . . . . . . . . . . . . . . . . . . . . . . . . . . . . 25Comparison with FEMA/Stanford Approach . . . . . . . . . . . . . . . . . . . . . . . . . . . . . . . . . . . . . . . . . . 31
Chapter 5 - Final Observations . . . . . . . . . . . . . . . . . . . . . . . . . . . . . . . . . . . . . . . . . . . . . . . . . . . . . . . . . . . . 35Thoughts on Progress in Dam Safety Risk Analysis . . . . . . . . . . . . . . . . . . . . . . . . . . . . . . . . . . . . . 35Closing Observations . . . . . . . . . . . . . . . . . . . . . . . . . . . . . . . . . . . . . . . . . . . . . . . . . . . . . . . . . . . . . 36
References . . . . . . . . . . . . . . . . . . . . . . . . . . . . . . . . . . . . . . . . . . . . . . . . . . . . . . . . . . . . . . . . . . . . . . . . . . . . 37
Appendix A - Annotated Bibliography . . . . . . . . . . . . . . . . . . . . . . . . . . . . . . . . . . . . . . . . . . . . . . . . . . . . . . 43
Appendix B - Description of Model Used in Sample Analysis . . . . . . . . . . . . . . . . . . . . . . . . . . . . . . . . . . . 63
Risk Analysis for Dam SafetyEvaluation: Hydrologic Risk Table of Contents
viii
List of Figures
Figure 1. Event Structure for Monte Carlo Simulation . . . . . . . . . . . . . . . . . . . . . . . . . . . . . . . . . . . . 10Figure 2. The Impact on Damage Distribution of Raising the Dam . . . . . . . . . . . . . . . . . . . . . . . . . . 13Figure 3. Damage Distributions Where Expected Damages Exceed Threshold . . . . . . . . . . . . . . . . . 18Figure 4. Exceedance Probability for 24-Hour Rainfall Depth . . . . . . . . . . . . . . . . . . . . . . . . . . . . . . 24Figure 5a. Distribution of Damages as a Plot of the Exceedance Probabilities, Thin-Tailed
Rainfall Distribution . . . . . . . . . . . . . . . . . . . . . . . . . . . . . . . . . . . . . . . . . . . . . . . . . . . . . . . 26Figure 5b. Distribution of Loss-of-Life as a Plot of the Exceedance Probabilities,
Thin-Tailed Rainfall Distribution . . . . . . . . . . . . . . . . . . . . . . . . . . . . . . . . . . . . . . . . . . . . 26Figure 6a. Expected Damages From Events That Exceed the Specified Thresholds,
Thin-Tailed Rainfall Distribution . . . . . . . . . . . . . . . . . . . . . . . . . . . . . . . . . . . . . . . . . . . . 27Figure 6b. Loss-of-Life From Events That Exceed the Specified Thresholds, Thin-Tailed
Rainfall Distribution . . . . . . . . . . . . . . . . . . . . . . . . . . . . . . . . . . . . . . . . . . . . . . . . . . . . . . . 27Figure 7a. Distribution of Damages as a Plot of the Exceedance Probabilities, Thick-Tailed
Rainfall Distribution . . . . . . . . . . . . . . . . . . . . . . . . . . . . . . . . . . . . . . . . . . . . . . . . . . . . . . . 28Figure 7b. Distribution of Loss-of-Life as a Plot of the Exceedance Probabilities,
Thick-Tailed Rainfall Distribution . . . . . . . . . . . . . . . . . . . . . . . . . . . . . . . . . . . . . . . . . . . . 28Figure 8a. Expected Damages From Events That Exceed the Specified Thresholds,
Thick-Tailed Rainfall Distribution . . . . . . . . . . . . . . . . . . . . . . . . . . . . . . . . . . . . . . . . . . . . 29Figure 8b. Loss-of-Life From Events That Exceed the Specified Thresholds, Thick-Tailed
Rainfall Distribution . . . . . . . . . . . . . . . . . . . . . . . . . . . . . . . . . . . . . . . . . . . . . . . . . . . . . . . 29Figure B-1. Storage Volume (Acre-Feet) . . . . . . . . . . . . . . . . . . . . . . . . . . . . . . . . . . . . . . . . . . . . . . . . 65Figure B-2. Reservoir Releases as Function of Elevation for 150-foot Spillway . . . . . . . . . . . . . . . . . . 67Figure B-3. Reservoir Releases as Function of Elevation for 450-foot Spillway . . . . . . . . . . . . . . . . . . 67Figure B-4. Damages in Million $ . . . . . . . . . . . . . . . . . . . . . . . . . . . . . . . . . . . . . . . . . . . . . . . . . . . . . . 70Figure B-5. Lives Lost as Function of Release . . . . . . . . . . . . . . . . . . . . . . . . . . . . . . . . . . . . . . . . . . . . 70Figure B-6. Dollar Damage in Million $ . . . . . . . . . . . . . . . . . . . . . . . . . . . . . . . . . . . . . . . . . . . . . . . . . 71Figure B-7. Loss-of-Life as Function of Elevation . . . . . . . . . . . . . . . . . . . . . . . . . . . . . . . . . . . . . . . . . 71
List of Tables
Table 1. Structure of Monte Carlo Simulation . . . . . . . . . . . . . . . . . . . . . . . . . . . . . . . . . . . . . . . . . . . . . . 11Table 2. Expected Damages ($million/yr) for the Initial Partitioning of Probabilities of Damages
in Figure 2 for use with PMRM . . . . . . . . . . . . . . . . . . . . . . . . . . . . . . . . . . . . . . . . . . . . . . . . . . 21Table 3. Expected Damages ($million/yr) for the Modified Partitioning of Probabilities of
Damages in Figure 2 for use with PMRM . . . . . . . . . . . . . . . . . . . . . . . . . . . . . . . . . . . . . . . . . . 21Table 4. Summary of Monte Carlo Results for Illustrative Dam-Safety Example . . . . . . . . . . . . . . . . . . . 25Table 5. Information Employed In FEMA/Stanford Analysis . . . . . . . . . . . . . . . . . . . . . . . . . . . . . . . . . . 33
1
CHAPTER 1 - INTRODUCTION
Selecting appropriate and reasonable design safety standards for high-hazard dams in the United States has poseda dilemma for the U.S. water resources engineering community. The failure of a large structure built by the U.S.Army Corps of Engineers, the U.S. Bureau of Reclamation, or the Tennessee Valley Authority due toextraordinary floods would result in the loss of an expensive structure, the services it provides, and would, inmany cases, cause immense economic costs and loss-of-life associated with the flood which would passdownstream. The emergency spillway of such a structure and the flood storage zone should be sized to survivea theoretical flood of a certain magnitude, providing both a reasonable level of safety and an acceptablecompromise between construction costs and the possible consequences of dam failure. The modern challengeis to quantify the costs of construction, the damage resulting from major floods, and the probability that floodsof different magnitudes might occur, so that the trade-off between the costs of construction, operation andmaintenance, possible damage due to failures, the benefits of flood damage prevention, and other services of thedam can be evaluated quantitatively.
Chapter 1 of this report provides a general overview of the evolution of dam safety standards and the relativemerits of three different approaches. This discussion is supplemented by the annotated bibliography in AppendixA. Chapter 2 develops a general framework for quantitative probabilistic assessment of dam safety issues usingan event diagram paradigm. The paradigm describes the interaction of the various factors which contribute tothe determination of the inflow flood, a reservoir's operation, and downstream damage. It also serves as thefoundation for the specialized Monte Carlo procedure used to calculate the probabilities of various failure events,the distribution of damage, and loss-of-life. Chapter 3 discusses methods suggested in general risk literature andwater resources literature to display and communicate the results of risk studies. The ideas of frequency, annualprobability, expected damage, and partial expected damage are developed, the Partitioned Multi-objective RiskMethod (PMRM) is discussed, and a simple example is used to illustrate the ideas. A stochastic dam safetyanalysis is presented in Chapter 4 to show how the many factors that contribute to the inflow hydrograph and theperformance of control structures can be incorporated into risk analysis. It also illustrates the use of criteriadeveloped in Chapter 3. Going through the steps necessary to develop a stochastic dam safety analysis prototypeprovides experience useful for identifying what additional factors need to be researched, how an operationalmodel might work, what it should include, and how useful probabilistic results might ultimately be.
Background and Alternative Methodologies
At the turn of the century, the selection of design inflow floods for dams using the flood-of-record and floodfrequency methods were found to be unsatisfactory; available records could not be trusted to reveal the possibleseverity of the unusual and intense meteorological events that cause the extraordinary floods which are of concern[Myers, 1967]. At the other end of the scale, flood-frequency techniques have been successful for traditionalfloodplain mapping and the design of levees, bridges, roads, and traditional flood-control structures [Feldman,1981]. These structures are designed to meet less severe standards than high-hazard dams.
In the 1930s, the storm transposition approach was developed for estimating a spillway's design flood from theworst rainfall observed in a region, transposed to the reservoir's catchment. For high-hazard dams, the safetystandard has become the Probable Maximum Flood (PMF), which is derived by conservative application (in termsof antecedent moisture, streamflow, snowpack, storm placement, and the time distribution of rainfall within thestorm) of the Probable Maximum Precipitation (PMP). The PMP is an estimate of the maximum possibleprecipitation depth over a given size catchment in a given length of time. It is calculated by maximizing the
Risk Analysis for Dam SafetyEvaluation: Hydrologic Risk Introduction
2
moisture in the worst storms of record, the transposition of those storms to the catchment (adjusting for maximummoisture, and barrier and terrain effects), and finally the use of an envelope curve over the duration and area todefine a maximum possible precipitation for the duration and drainage size of interest [Myers, 1967; Stallingset al., 1986].
Budgetary concerns relating to large dam retrofit decisions in the U.S. have created a demand for justifying scarceappropriations; this has resulted in greater interest in risk-based analyses and possibly has caused an easing ofstandards [Krouse, 1986]. Recently, a National Research Council committee reviewed the standards and methodsfor dam safety evaluation [NRC, 1985]. Risk-based procedures have been encouraged for retrofit decisions whena structure has not passed the latest PMF estimate, but still might be deemed safe enough, or to evaluate if thecost of upgrading to the full PMF is justified. Von Thun [1987] discusses the U.S. Bureau of Reclamation's dam-safety risk-evaluation methodology, which incorporates this idea, and illustrates the calculation of “risk costs.”Two conferences in 1985 addressed dam safety and risk assessment [McCann, 1986; and Haimes and Stakhiv,1986; also see Bowles, 1987, and Moser and Stakhiv, 1987]. Appendix A reviews many of these papers andother published studies. Terry Coomes [McCann, 1986, p. 4-4] has put the question clearly: “The debate is overmoney and the best allocation of the Nation's resources.”
The general application of risk assessment to dam safety evaluation will require estimation of the frequency ofvery unusual and extreme events on the order of the PMF. One approach is to assign the PMF an exceedanceprobability from 10 to as little as 10 , and then to extend a flood-flow frequency curve from the 100-year flood-4 -6
out to the PMF. The results depend on the probabilities used and the method of extension employed. Stedingerand Grygier [1985], Haimes et al. [1988], and Karlsson and Haimes [1989] show that the selection of adistribution can affect the ranking of retrofit alternatives.
An alternative approach is to attempt to estimate the frequency of large storms and floods using regional stormdata. Such an analysis is described by Yankee Atomic Electric Company [YAEC, 1984], which estimated theprobability that the Harriman Dam in Vermont would be overtopped by a flood. A 1988 NRC Committee onTechniques for Estimating Probabilities of Extreme Floods recommended several approaches to increase theavailable data pool and ways to focus on extreme flood and rainfall events [NRC, 1988]. Foufoula-Georgiou[1989] illustrate the derivation of the exceedance probabilities of extraordinary precipitation depths for twocatchments in Iowa.
Langseth and Perkins [1983] demonstrate risk-analysis procedures for dam safety evaluations. Following the1985 NRC Committee's charge to develop dam safety criteria, Stedinger and Grygier [1985], Von Thun [1987],Resendiz-Carillo and Lave [1987], Haimes et al. [1988] and Petrakian et al. [1989] illustrate such proceduresand discuss issues that arise. The Bureau of Reclamation [1986], Stakhiv and Moser [1986], and the TaskCommittee on Spillway Design Flood Selection [1988] provide examples of more comprehensive risk-analysismethodologies. Bohnenblust and Vanmarcke [1982], Kreuzer and Bury [1984], McCann et al. [1985], Bury andKreuzer [1986], and Bowles [1987] employ risk-analysis methodologies which include a variety of possiblecauses for dam failures, including piping, structural, and earthquakes.

Risk Analysis for Dam SafetyIntroduction Evaluation: Hydrologic Risk
3
Dam safety issues often fall into two categories:
1) setting safety standards for proposed dams
2) deciding whether existing structures provide adequate levels of safety, and if not what modifications arejustified.
The 1985 NRC Committee [NRC, 1985] suggests that decision-makers need not apply the same safety criteriato both categories and recognizes three major approaches to setting dam safety standards:
1) The deterministic probable-maximum-precipitation/probable-maximum-flood standard which requiresthat all new and existing high-hazard structures be able to survive their estimated PMF.
2) The probabilistic approach which prescribes that a structure's probability of failure not exceed somestandard for a particular failure mode or set of failure modes. A prescribed failure probability wouldthen correspond to a flood with that exceedance probability. The American Nuclear Society [1981]has used 10 as a safety target for hydrologic events. Many states use a 1,000-year event as a design-6
standard for small, low-hazard dams.
3) Quantitative risk-analysis procedures which attempt to quantify both the probabilities of extremehydrologic events and the consequences and incremental damage from the passage of those floods,including incremental damage from dam failure. Risk analysis for an existing structure attempts to finda reasonable balance between safety improvement costs and the resulting decrease in flood damageand losses.
Comparing the approaches for addressing dam safety problems is facilitated by considering different criteria.In particular, this report will consider:
a) the potential quality of the results relating to their economic or social efficiency and stability over time,b) practical considerations, including the complexity of the analysis and the availability of required inputs,
andc) the procedure's acceptance by the engineering community and the public.
The Potential Quality of Results
Of concern is the stability of a method's solutions over time with the accumulation of new data, and the durationof the solutions over the life of the structure. Because of the lack of long-term flood records available in practice,all three methods suffer some stability problems. Past experience has shown that PMF estimates can increasesignificantly over the life of a dam, necessitating (expensive) retrofits. Experience has also shown that difficultiesexist in applying the flood-frequency approach. Short historical records yield imprecise estimates of probabilitydistributions for floods. The instability of solutions in the risk-analysis method could result from changes in thepopulation and property values downstream from the dam, as well as changes in the estimated flood-frequencycurve for extreme events.

Risk Analysis for Dam SafetyEvaluation: Hydrologic Risk Introduction
4
Every dam safety decision is an implicit decision about the allocation of resources in the society. Money spentbuilding a new dam or upgrading an existing one leaves less money for other socially beneficial projects. Thistrade-off is especially evident when an agency has limited funds to improve dam safety. In this case, the agencymay want to maximize the benefit of available money by using those funds efficiently. Neither the deterministicmethod nor the probabilistic method really attempts to efficiently allocate resources in the dam retrofit situation.
In the case of the deterministic approach, estimating the magnitude of the PMF often leaves engineers with littleknowledge of the PMF's quantitative probability. Dam safety guidelines designed to meet their respective PMFestimates certainly vary. Using the flood-frequency approach is an attempt to make the probability of failuremore uniform across sites, but it still causes inefficient allocation of resources by not accounting for the fact thatthe costs of failure (in terms of lives lost and dollar and environmental damages) vary from project to project.The deterministic and flood-frequency methodologies do attempt to deal with this last issue by incorporatingcrude classification systems which, for example, categorize dams as high, medium, or low hazard; theseapproaches, however, fail to address the issue with any precision. A given budget allocation could result in alower probability of risk by explicitly acknowledging the probabilities and consequences of floods and failuresand allocating funds as efficiently as available cost and damage data allows.
In contrast to the deterministic and flood-frequency methods, the risk-analysis approach directly addresses theresource allocation issue. This approach provides a more site-specific analysis than the deterministic and flood-frequency approaches by incorporating pertinent damage information. Analysts can use estimated damageprobabilities to minimize the expected cost to society with a given budget. Of the three methods, only riskanalysis provides an estimate of the cost effectiveness of an allocation or combination of allocations. Bybalancing costs and losses and their probabilities, risk analysis provides a method for estimating the optimalallocation of resources. But the analyst does pay a price for the ability to achieve greater efficiency by way ofadded complexity.
Practical Considerations and Complexity of the Analyses
When choosing a method to apply to dam safety problems, engineers should consider the complexity of theanalytical methods and the resources needed to conduct a study. The best method should reflect a trade-offbetween the quality of the results, the time the analysis requires, the staff resources and managerial effortrequired, and the cost of the analysis.
The deterministic approach requires historical meteorological information which has been organized andpublished by the U.S. Weather Service, as well as hydrologic models to predict how the chosen regional stormwill impact the basin in question. All of the methodologies generally require a somewhat complicated hydrologicanalysis, but the deterministic method alone requires little quantitative probabilistic information.
The flood-frequency approach uses quantitative information about the probability of extreme events. Often,analysts estimate a distribution for extreme rainfall and use a hydrologic model to route a selected rainfall withthe prescribed exceedance probability. Even the assignment of a prescribed probability to the PMF and extensionof a frequency curve out from more common events, such as the 100-year flood, requires that one first estimatea PMF. This probably constitutes the simplest method for building a probability distribution for extreme floods.

Risk Analysis for Dam SafetyIntroduction Evaluation: Hydrologic Risk
5
Alternative methods of constructing distributions would need substantially more work given that researchers havenot developed the required frequency-based rainfall databases [NRC, 1988]. This situation would likely improveif engineers used the risk method more widely [Task Committee on Spillway Design Flood Selection, 1988].
Risk-analysis methods incorporate the occurrence probabilities used by the flood-frequency approach and alsoemploy quantitative estimates of the damage caused by floods of different magnitudes. Estimating quantitativedamage requires a site specific study of resources in a dam's floodplain. In general, using the risk-analysisapproach requires more resources and effort than either the deterministic or flood-frequency methods. Inparticular, analysts and engineers should emphasize developing better estimates of the likely character of damoperation, failures, and incremental damage.
These three methods possess different degrees of complexity which will affect the desires of engineers anddecision-makers to use them. Engineers and decision-makers who do not have a good understanding ofprobabilistic and statistical principles may resist working with probability-based methods. They may feeluncomfortable with the assumptions employed in quantitative risk studies. Some decision-makers have alsopointed at the possibly high cost of risk analysis, resulting from the analysis' complexity, as an argument againstits use [Cooper, 1987].
The availability of data needed to use each of the methods will also influence decisions about the appropriate damsafety evaluation method. Several methods for estimating PMFs have been developed and have differentmeteorological data needs. Proposals have been advanced for developing more accurate methods of estimatingthe extreme probabilities used by the flood-frequency and risk-analysis methodologies [NRC, 1988; Foufoula-Georgiou, 1989]; however, these more sophisticated methods have greater data requirements and are morecomputationally demanding. The PMF also suffers from a lack of precision.
Acceptability of the Results
The PMF method has a greater acceptability than the other methods because of its long history of use in theengineering profession. The relatively new proposal to use risk analysis may be less acceptable to the professionbecause it does not have the PMF's historical record to recommend it. Some engineers suggest that the U.S.currently has a good safety record which changes may jeopardize.
The issue of placing a monetary value on human life also affects the acceptability of the approaches. Somedecision-makers and engineers have opposed risk analysis because it may explicitly require or suggest theassignment of a monetary value to human lives which the PMF method does not explicitly do. In actuality, anydecision to build a dam, even one that can pass its estimated PMF, will put human beings, their property, and theenvironment at risk, and thus, places a finite value on all three [Baecher et al., 1980]. The PMF method allowsdecision-makers to conceal the fact that a value has been assigned to human life which is a situation that decision-makers may prefer. The risk-analysis method more clearly shows the monetary value placed on human life.

Risk Analysis for Dam SafetyEvaluation: Hydrologic Risk Introduction
6
Goals for this Study
Clearly, this is not the first study attempting to evaluate statistically the exceedance probability of the PMF,distribution of damage, or the chance of a flood overtopping a reservoir and failing. Newton [1983] considershow the return period of PMFs might be calculated. YAEC [1984] describes a stochastic simulation of rainfallevents and runoff in their analysis of the likelihood that the Harriman dam might be overtopped. The Bureau ofReclamation has for some time approximated the distribution of damage by extending the floodflow frequencycurve beyond the 100-year event out to the PMF, which is assigned some reasonable return period for theanalysis; this approach has been recommended for dam safety risk analysis by the National Research Council'sCommittee on Dam Safety [NRC, 1985], and has subsequently been explored by Grygier and Stedinger [1985],NRC [1988], Karlsson and Haimes, [1989] and others. Thus, this study does not propose a new approach.However, the trend is to take the use of risk analyses in dam safety evaluation more seriously [Bowles, 1987;McCann et al., 1985; Von Thun, 1987; Resendiz-Carrillo and Lave, 1987; Karlsson and Haimes, 1988ab;Haimes et al., 1988; Karlsson and Haimes, 1989; Petrakian et al., 1989]. As a result, there is increasing interestin better refining figures on the actual distribution of extreme rainfall and runoff events [NRC, 1988] and theperformance of dams and related control structures, so as to better predict the probabilities of various failures,distributions of dollar damages, loss-of-life, and other criteria.
This research is intended to contribute to the evolution of dam safety assessment methods by illustrating howdam-safety risk assessment might be improved by employing more detailed stochastic descriptions of the rainfalland runoff processes, and improving the performance of warning systems, dams, and other structures. Theproducts of a stochastic analysis should provide better insights into the complexities of dam safety problems thantraditional deterministic methods. These products include the pathways to failure and their relative likelihoods,overall failure probabilities, and the trade-offs between safety and costs. Using detailed stochastic analysesshould give decision-makers more information about the implications of adopting alternative solutions to damsafety problems, thus ameliorating the evaluation process.
The functions and distributions that have been employed in this study are in many cases straightforward.However, further research is needed to develop better models of many distributions, such as the distribution ofrain within a storm and the likely durations and magnitudes of flows a spillway can withstand before failure.Moreover, many details included here will not be needed in operational risk analysis of actual structures onceresearchers obtain a sense of which factors are important. For example, in the case of a large reservoir where thevolume of the inflow hydrograph controls the maximum reservoir elevation and outflow, the distribution oftiming within a storm may be of relatively little importance, whereas for a small structure where the peak of theinflow hydrograph controls the peak outflow, antecedent moisture conditions and initial rainfall losses mayhave relatively little effect. For actual dam safety studies it may be found that extending the flood flow frequencycurve from the 100-year flood to a PMF with some adopted return period is sufficient. This research is intendedto assist in the development of a framework within which such questions can be posed, studied, and resolved.
7
CHAPTER 2 - A FRAMEWORK FOR DAM-SAFETY RISK ANALYSES
Because the Probable Maximum Flood (PMF) is based on conservative assumptions about the values of manyfactors (see Hansen et al. [1982], the World Meteorological Organization [WMO, 1986], NRC [1985], the TaskCommittee on Spillway Design Flood Selection [1988], and NRC [1988]), it is often thought to be a veryconservative design standard [Newton, 1983]. In moving to risk-based analyses, the impact of the many factorswhich contribute to the probability of dam failure and the magnitudes of damage should be considered (seeNewton, 1983, Table 1). In particular, the probability that a flood might occur and exceed some threshold is thesum of the probabilities of all combinations of rainfall depths, rainfall distributions in space, rainfall distributionsacross time within a storm, and antecedent soil moisture levels that would yield a flood of that size or larger.Whereas the PMP is envisioned to be the worst probable combination of conditions possible and, therefore, isdefined by the single storm type that generates these conditions [WMO, 1986]. A probabilistic analysis shouldinclude the distribution of less severe storms and the many storm types (winter or summer; hurricane, frontal, orthunder storms) that can lead to such major flood events.
Likewise, the probability that a dam fails or that a given level of damage is exceeded, depends upon all the waysa given outflow discharge rate may be achieved, and thus depends upon the possible inflow floods, the reservoiroperating policy, initial reservoir levels, what outflow works and gates are operational, and whether the turbinescan be operated at capacity. Whether the structure fails depends on whether the emergency spillway can actuallypass its rated discharge without failing; on the margin, it may also hinge on the direction of the wind across thereservoir's pool and the resultant wave run-up on the dam (freeboard) as well as the amount of overtopping thestructure can withstand without failure.
Finally, the level of damage that results from the flood may depend on the time-of-year and time-of-day that theflood occurs. Other structures besides the dam and spillway may fail and contribute to loss-of-life anddownstream damage. Likewise, flood warning systems have the potential to reduce loss-of-life in major floods;but they may not work perfectly, particularly in the case of dam-break floods [Paté -Cornell, 1984; Paté-Cornelland Tagaras, 1986; Paté -Cornell, 1989].
Using risk-based criteria in dam safety studies requires estimating the probabilities of different events and theresulting damage. Estimates of the probabilities of large floods may be imprecise, and this has made someengineers reluctant to conduct risk analysis studies. Such uncertainties can be handled in several ways. Forexample, one can integrate the uncertainty of key parameters or events into the analysis by assigning probabilitiesto different sets of parameters and events, or one can use a sensitivity analysis approach to investigate the impactof different assumptions and parameter sets upon the results by rerunning the basic analysis with the differentassumptions. In the example given in Chapter 4, the number of functioning outlet gates is a random variableexplicitly describing the uncertainty in the gates mechanical operation. In addition, that analysis considers twoalternative distributions for rainfall depth, thus using sensitivity analysis to address concern over the appropriaterainfall distribution. It is also possible to incorporate rainfall distribution parameter uncertainty into the analysisby assigning probability distributions to the values of those parameters and employing the resulting posteriorrainfall distribution [Stedinger, 1983]. YAEC [1984] explicitly incorporates uncertainty in the parameters anddistributions of rainfall into its analysis by assigning probabilities to different rainfall distributions in its MonteCarlo simulation.
Risk Analysis for Dam Safety A Framework for Evaluation: Hydrologic Risk Dam-Safety Risk Analyses
8
Describing Events
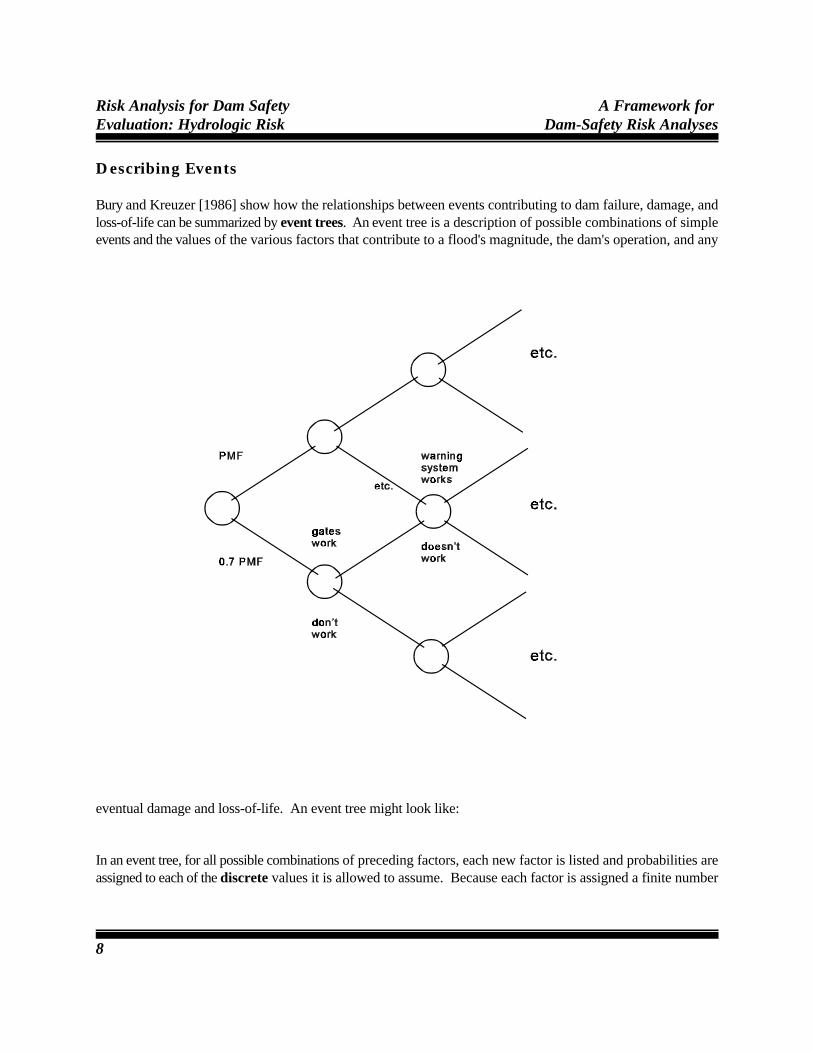
Bury and Kreuzer [1986] show how the relationships between events contributing to dam failure, damage, andloss-of-life can be summarized by event trees. An event tree is a description of possible combinations of simpleevents and the values of the various factors that contribute to a flood's magnitude, the dam's operation, and any
eventual damage and loss-of-life. An event tree might look like:
In an event tree, for all possible combinations of preceding factors, each new factor is listed and probabilities areassigned to each of the discrete values it is allowed to assume. Because each factor is assigned a finite number

A Framework for Risk Analysis for Dam SafetyDam-Safety Risk Analyses Evaluation: Hydrologic Risk
9
of discrete values, the total number of combinations of simple events is finite, but perhaps large. A probabilityfor each compound event or combination is determined by the probabilities assigned in the event tree.
Another conceptual framework employed in risk and reliability studies is a fault tree. A fault tree describes bysimple logical relationships all the ways in which a system can fail. Where an event tree describes all possiblecombinations of simple events or factors, a fault tree focuses only on those combinations which would cause somefailure. System failure may or may not occur, and each component is generally assumed to be working orinoperable. For example, a radio which is part of a flood warning system will fail to function if the outputamplifier has failed or the antenna is damaged or the batteries are dead and backup power is not available. Faulttree analyses are based upon a binary logic which is not well suited for dam safety analysis where many factors,such as rainfall, can assume a wide range of values, and where the interest is in the probability distribution fora range of outcomes which include different levels of damage and ways in which the reservoir might fail,consequently causing different levels of damage.
The orientations of both the narrow fault tree analysis framework and the more general event tree make themunsatisfactory for the detailed dam safety analysis conducted in this study. In particular, a paradigm is neededwhich allows the analysis to include a number of continuous random variables without discretizing theirprobabilities.
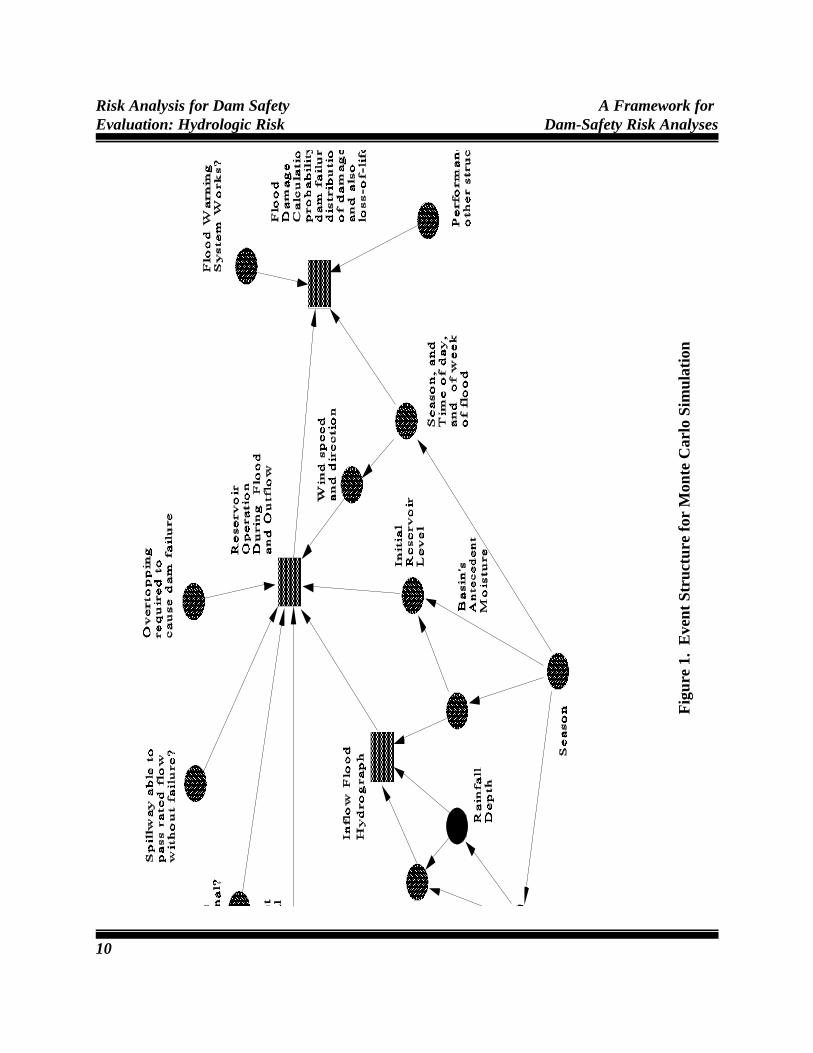
Figure 1 contains an event diagram or influence diagram describing how several hydrologic and operatingfactors can contribute to a major flood which would cause downstream flooding, the associated damage, as wellas the factors which may combine to result in dam failure. In the lower left corner, the circles describe seasonaland meteorological factors which combine to determine the inflow hydrograph. Such a flood needs to becontained in the reservoir and passed downstream by the reservoir's outlet works, turbines, and emergencyspillway, depending upon their ability to operate, and the reservoir's operating guidelines. Such event or influencediagrams have been used to describe the relationships between different factors and to structure decision issueswith inherent uncertainties [Howard and Matheson, 1984]. Shachter [1988] provides a rigorous system for theconstruction and manipulation of such descriptions of stochastic systems when the random variables can assumeonly a finite number of values, while Shachter and Kenley [1989] consider application to linear-quadratic-Gaussian models.
Many of the factors described by circles in the Event Diagram in Figure 1 are best described by continuousrandom variables; rainfall depth, the possible temporal distribution of rain within a storm, and initial reservoirlevels are three examples. This precludes the simple event tree evaluation in which each event can have only afew values. Likewise, Shachter's evaluation procedures for influence diagrams with discrete random variablesare not applicable. If one were willing to substitute a discrete representation for the various continuousdistributions and tolerate the resulting approximation error, then the event diagram could be converted into anevent tree by ordering the factors described by circles in such a way that the distribution of the events describedby each circle is completely specified by factors which appear higher in the list. This would determine the orderin which the variables would be introduced in the event tree. In fact, such an ordering is necessary if the eventdiagram is to serve as a prescription for the generation of floods and possible dam safety events. Thus, for bothpurposes, the event or influence diagram cannot contain loops or circular references.
Risk Analysis for Dam Safety A Framework for Evaluation: Hydrologic Risk Dam-Safety Risk Analyses
10
Fig
ure
1. E
vent
Str
uctu
re f
or M
onte
Car
lo S
imul
atio
n
A Framework for Risk Analysis for Dam SafetyDam-Safety Risk Analyses Evaluation: Hydrologic Risk
11
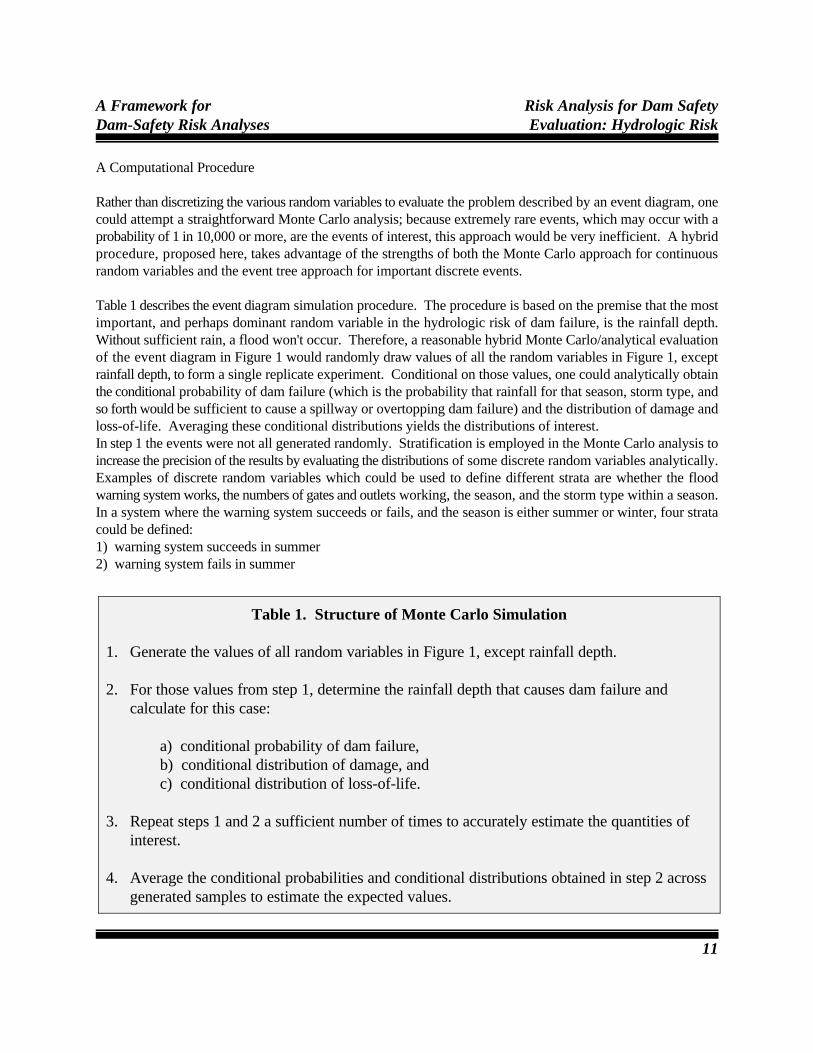
Table 1. Structure of Monte Carlo Simulation
1. Generate the values of all random variables in Figure 1, except rainfall depth.
2. For those values from step 1, determine the rainfall depth that causes dam failure andcalculate for this case:
a) conditional probability of dam failure,b) conditional distribution of damage, and c) conditional distribution of loss-of-life.
3. Repeat steps 1 and 2 a sufficient number of times to accurately estimate the quantities ofinterest.
4. Average the conditional probabilities and conditional distributions obtained in step 2 acrossgenerated samples to estimate the expected values.
A Computational Procedure
Rather than discretizing the various random variables to evaluate the problem described by an event diagram, onecould attempt a straightforward Monte Carlo analysis; because extremely rare events, which may occur with aprobability of 1 in 10,000 or more, are the events of interest, this approach would be very inefficient. A hybridprocedure, proposed here, takes advantage of the strengths of both the Monte Carlo approach for continuousrandom variables and the event tree approach for important discrete events.
Table 1 describes the event diagram simulation procedure. The procedure is based on the premise that the mostimportant, and perhaps dominant random variable in the hydrologic risk of dam failure, is the rainfall depth.Without sufficient rain, a flood won't occur. Therefore, a reasonable hybrid Monte Carlo/analytical evaluationof the event diagram in Figure 1 would randomly draw values of all the random variables in Figure 1, exceptrainfall depth, to form a single replicate experiment. Conditional on those values, one could analytically obtainthe conditional probability of dam failure (which is the probability that rainfall for that season, storm type, andso forth would be sufficient to cause a spillway or overtopping dam failure) and the distribution of damage andloss-of-life. Averaging these conditional distributions yields the distributions of interest.In step 1 the events were not all generated randomly. Stratification is employed in the Monte Carlo analysis toincrease the precision of the results by evaluating the distributions of some discrete random variables analytically.Examples of discrete random variables which could be used to define different strata are whether the floodwarning system works, the numbers of gates and outlets working, the season, and the storm type within a season.In a system where the warning system succeeds or fails, and the season is either summer or winter, four stratacould be defined:1) warning system succeeds in summer2) warning system fails in summer

Risk Analysis for Dam Safety A Framework for Evaluation: Hydrologic Risk Dam-Safety Risk Analyses
Clearly, the distribution for rainfall and antecedent moisture would depend upon the season, whereas the lives1
lost from dam failure would depend upon whether the warning system worked.
In the program, the number of replicates generated to calculate the damage distribution for each stratum is2
essentially proportional to the frequency with which that stratum occurs. Thus, the average damage distribution is thestraight average across all of the randomly generated damages distributions for all strata. This strategy ensures that ifwinter storms occur twice as frequently as summer storms, then two-thirds of the replicates will correspond to winterstorms and one-third to summer storms.
By ensuring that the stratified random variables occur in the samples with the theoretical frequencies, some of3
the randomness is removed from the experiment. The precision of the final results depends upon the variability ofreplicates within each stratum, and the weight assigned to them when they are averaged. If fixing the stratified randomvariables within each stratum significantly reduces the variances of the statistics being estimated, a significant increasein overall precision can be obtained.
12
3) warning system succeeds in winter4) warning system fails in winter.
If there is a 40% chance the warning system fails and a 60% chance it works and two-thirds of the storms arrivein the winter season and one-third in the summer, then the frequencies that would be assigned to the four stratawould be 3/15, 2/15, 6/15, and 4/15, respectively. In the Monte Carlo analysis, each stratum that was employed(corresponding to a set of values for the stratified variables) was sampled with a frequency proportional to itsprobability of occurrence.
Once a stratum is selected, random numbers for the non-stratified variables (such as the precipitation distributionwithin a storm and required overtopping to cause dam failure) are generated using the conditional distributionsfor those variables given that they are in that stratum.1
In this way, the model computes individual damage distributions for each stratum. The overall damagedistribution is calculated by averaging the individual stratum's distributions, weighted by the probability withwhich each stratum occurs. This stratified Monte Carlo procedure increases the precision with which the damage2
distributions can be computed with a given level of effort.3
Figure 2 illustrates the kind of information generated by the Monte Carlo procedure proposed in Figure 1. Figure2 displays the distribution of downstream damage and the cost of dam failure for the original hypothetical dam,and a proposed modification which would widen the spillway and raise the height of the dam. For floods withexceedance probabilities between 10 and 10 , widening the spillway increases the damage because of the larger-2 -4
spillway. With the larger spillway and greater height, the dam fails with a probability of approximately 10 ,-5
instead of 10 , without the modification. However, because the modified dam is higher than the original, if it fails-4
the downstream damage are larger than when the unmodified dam fails. The proposed modification has aconstruction cost, losses associated with any decrease in the available active storage zone or other operatingrestrictions, and a small increase in damage for floods with exceedance probabilities in the 10 to 10 range and-2 -4
for events with exceedance probabilities less than 10 .-5

Failure if No Action
Failure after Raising Dam and Modifying Spillway Costs from Larger
Dam's Failure
1.0E-71.0E-61.0E-51.0E-41.0E-31.0E-21.0E-10
20
40
60
80
100
Exceedance Probability
Dam
ages
(M
illio
ns
$)
A Framework for Risk Analysis for Dam SafetyDam-Safety Risk Analyses Evaluation: Hydrologic Risk
13
Figure 2. - The Impact on Damage Distribution of Raising the Dam
A display like Figure 2 shows in an uncondensed fashion the probabilities that various damage thresholds areexceeded and possible trade-offs between increased damage for infrequent (10 to 10 range) versus very rare-2 -4
events (less than 10 ). The Monte Carlo analysis would also yield the probabilities of dam failure from these-5
large flood events and contributing factors. Other useful and easy to calculate summary statistics includeexpected damage and loss-of-life, their variance, and the cost per expected life saved. Sophisticated decisionmethodologies, such as multi-attribute utility theory [Keeney and Raiffa, 1976] or the partitioned multi-objectiverisk method with the surrogate worth trade-off method or other analysis vehicles [Haimes et al., 1988; Karlssonand Haimes, 1988ab, 1989; Petrakian et al., 1989] could also be employed to help choose among alternatives.Chapter 3 discusses in more detail alternative approaches for displaying the distribution of property damage andloss-of-life.

14

15
CHAPTER 3 - PRESENTATION OF DAM SAFETY STUDY RESULTS
The purpose of dam-safety risk analyses is not so much to determine the average expected costs or loss-of-lifeassociated with a particular design, as it is to help those interested in a project understand the alternative trade-offs between costs and safety. For the purpose of assisting the decision-making and analysis process, severalcriteria may be useful. An interesting aspect of such an analysis is the allocation of costs and/or loss-of-life fora particular design between what have been termed high-probability/low-consequence events and low-probability/high-consequence events; thus, one could ask if the total expected damage was primarily due to many"common" floods, which cause modest damage, or primarily due to relatively rare or very unlikely floods, whichwould cause extraordinary damage. The Bureau of Reclamation [1986] has used risk-cost curves to illustrate thisissue. Karlsson and Y.Y. Haimes [1988ab] and Haimes et al. [1988] develop the Partitioned Multi-objective RiskMethod (PMRM) which provides a different approach. Recently, Reid [1987] suggested several ways ofpresenting the risk spectrum of a project to illustrate these issues.
Display of Results
The manner and form in which analysts present results from a dam safety risk analysis is important. Neitherdecision-makers nor the general public are accustomed to working with the very small probabilities of concernin dam safety analyses. Thus, it is important to present results in a manner which:
1) will be as straightforward and intuitive as possible,2) will be consistent with other presentations of probabilistic results which individuals may have
encountered, and3) will contribute to an understanding of the major issues of concern.
Reid [1987] proposes that results from quantitative risk analyses can be presented graphically in several waysthat illustrate:
1) the magnitude of the exceedance probabilities of different events,2) the relative likelihood of different events,3) the relative contribution of the total expected damage of events of different magnitudes, and4) the fraction of the total expected damage which is due to events causing damage less than various
thresholds.
These ideas are developed further in the following section.
Frequency and Probability Models of Damage
This study employs the distribution of property damage and loss-of-life in terms of exceedance probabilitiesbased on the probability for the maximum damage which will occur in a given year. Thus, the annual exceedanceprobability, p (x), associated with a damage level x is the probability in a given year that damage due to a singlee
flood within that year will exceed x. Let F(x) denote the cumulative distribution function (CDF), which is theannual probability that damage is less than or equal to x. Then
p (x) = 1 - F(x)e

Risk Analysis for Dam Safety Presentation OfEvaluation: Hydrologic Risk Dam Safety Results
16
Reid [1987], McCann et al. [1985], and others have done risk analyses and have displayed their results usingarrival rates (frequencies). Thus, they have worked with the frequency N(x) with which damage will equal orexceed a given damage level x in any year. This average arrival rate can exceed one for frequent events, whichwould reflect the fact that on average one or more significant rainfall events or minor floods causing minordamage can occur per year. For relatively infrequent events, there is little difference between the averagefrequency with which a damage level is exceeded and the probability a given level of damage is exceeded in anyyear.
The results of the study in Chapter 4 are reported using exceedance probabilities, rather than arrival rates, becauseexceedance probabilities are more consistent with the way that flood-damage studies are traditionally done andflood-frequency relationships are described. However, to be mathematically correct in the calculation of damage,the underlying calculations are performed using the frequency or arrival rate of flood-producing rains, yieldinga description of the frequency with which different damage levels would be exceeded [Ouellette et al., 1985].This allows for more than one damage-producing event per year. This can be important for events with arrivalrates on the order of 0.10 per year or more.
If a damage level x is exceeded with an average annual frequency of N(x), then for independent events theprobability that x is exceeded in a year is given by the Poisson distribution, yielding
p (x) = 1 - exp[ -N(x)].e
For N(x) less than 10 , this is essentially equivalent to p (x) = N(x). The Monte Carlo analysis determines the-2e
frequencies with which different damage levels would be exceeded. The relationship above allows conversionof the frequency distribution for different damage levels into the corresponding annual exceedance probabilities.
Alternative Graphical Displays of the Risk and Losses
Based upon the ideas put forward by Reid [1987], Chapter 4 presents the results of a Monte Carlo study bothin terms of the exceedance probabilities of different damage levels, and the expected damage from all eventsgreater than various thresholds. The significance of these two viewpoints is discussed below.
Exceedance Probabilities
One of the most fundamental concepts in probability theory is the assignment of probabilities to events. Afundamental notation is the cumulative distribution function (CDF), denoted F(x) = 1 - p (x), which gives thee
probability that a random variable X will be less than or equal to x. For problems such as flood-frequencyanalysis and dam safety, which are concerned with very unusual events, it is generally more convenient to workwith the complementary CDF, which is the annual exceedance probability p (x), or the probability that thee
random variable X would exceed any value x. Floods are often described by their return period. Thus, a 100-yearflood is one with a 0.01 exceedance probability, and the 10,000-year flood is one with an 10 exceedance-4
probability.
4
x
Presentation of Risk Analysis for Dam SafetyDam Safety Results Evaluation: Hydrologic Risk
17
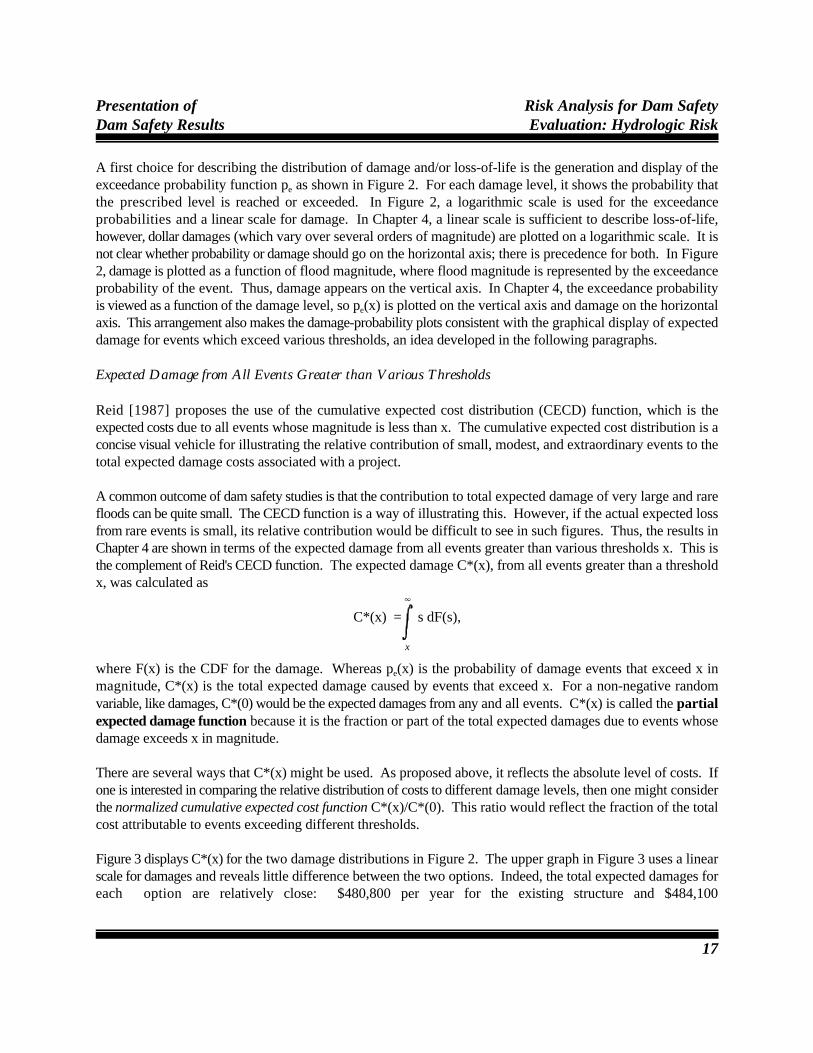
A first choice for describing the distribution of damage and/or loss-of-life is the generation and display of theexceedance probability function p as shown in Figure 2. For each damage level, it shows the probability thate
the prescribed level is reached or exceeded. In Figure 2, a logarithmic scale is used for the exceedanceprobabilities and a linear scale for damage. In Chapter 4, a linear scale is sufficient to describe loss-of-life,however, dollar damages (which vary over several orders of magnitude) are plotted on a logarithmic scale. It isnot clear whether probability or damage should go on the horizontal axis; there is precedence for both. In Figure2, damage is plotted as a function of flood magnitude, where flood magnitude is represented by the exceedanceprobability of the event. Thus, damage appears on the vertical axis. In Chapter 4, the exceedance probabilityis viewed as a function of the damage level, so p (x) is plotted on the vertical axis and damage on the horizontale
axis. This arrangement also makes the damage-probability plots consistent with the graphical display of expecteddamage for events which exceed various thresholds, an idea developed in the following paragraphs.
Expected Damage from All Events Greater than Various Thresholds
Reid [1987] proposes the use of the cumulative expected cost distribution (CECD) function, which is theexpected costs due to all events whose magnitude is less than x. The cumulative expected cost distribution is aconcise visual vehicle for illustrating the relative contribution of small, modest, and extraordinary events to thetotal expected damage costs associated with a project.
A common outcome of dam safety studies is that the contribution to total expected damage of very large and rarefloods can be quite small. The CECD function is a way of illustrating this. However, if the actual expected lossfrom rare events is small, its relative contribution would be difficult to see in such figures. Thus, the results inChapter 4 are shown in terms of the expected damage from all events greater than various thresholds x. This isthe complement of Reid's CECD function. The expected damage C*(x), from all events greater than a thresholdx, was calculated as
C*(x) = s dF(s),
where F(x) is the CDF for the damage. Whereas p (x) is the probability of damage events that exceed x ine
magnitude, C*(x) is the total expected damage caused by events that exceed x. For a non-negative randomvariable, like damages, C*(0) would be the expected damages from any and all events. C*(x) is called the partialexpected damage function because it is the fraction or part of the total expected damages due to events whosedamage exceeds x in magnitude.
There are several ways that C*(x) might be used. As proposed above, it reflects the absolute level of costs. Ifone is interested in comparing the relative distribution of costs to different damage levels, then one might considerthe normalized cumulative expected cost function C*(x)/C*(0). This ratio would reflect the fraction of the totalcost attributable to events exceeding different thresholds.
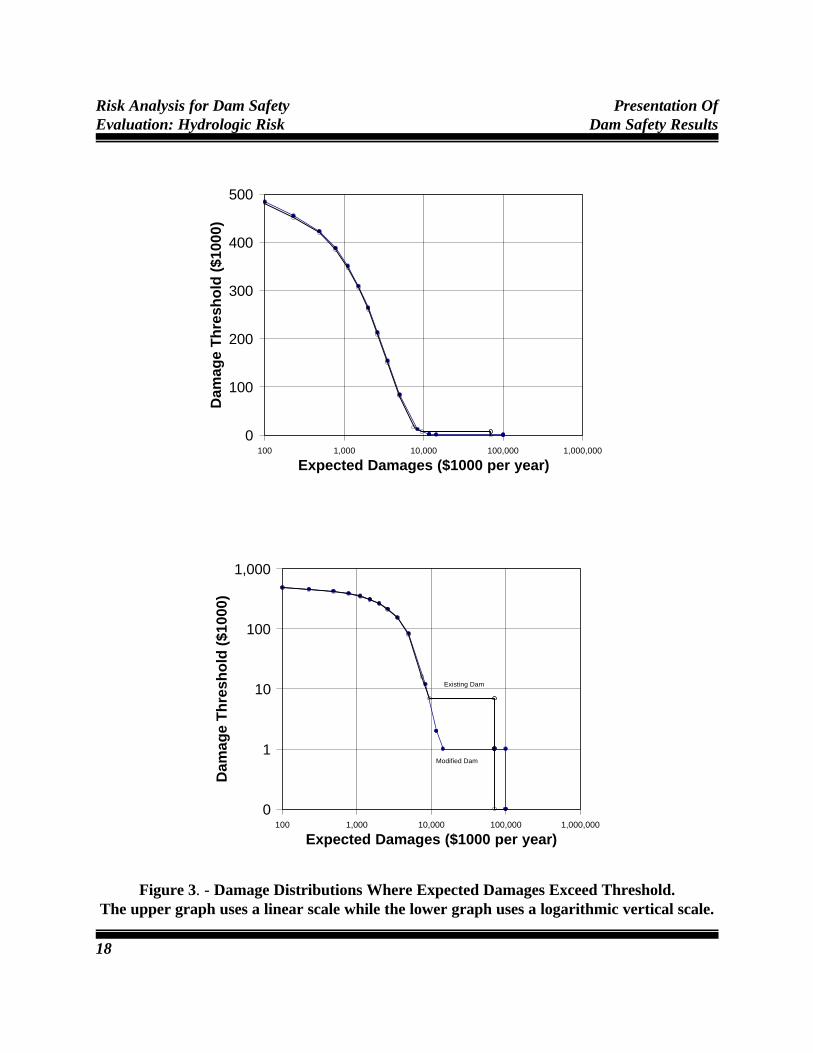
Figure 3 displays C*(x) for the two damage distributions in Figure 2. The upper graph in Figure 3 uses a linearscale for damages and reveals little difference between the two options. Indeed, the total expected damages foreach option are relatively close: $480,800 per year for the existing structure and $484,100
Existing Dam
Modified Dam
100 1,000 10,000 100,000 1,000,000
0
1
10
100
1,000
Expected Damages ($1000 per year)
Dam
age
Th
resh
old
($1
000)
100 1,000 10,000 100,000 1,000,000
0
100
200
300
400
500
Expected Damages ($1000 per year)
Dam
age
Th
resh
old
($1
000)
Risk Analysis for Dam Safety Presentation OfEvaluation: Hydrologic Risk Dam Safety Results
18
Figure 3. - Damage Distributions Where Expected Damages Exceed Threshold.The upper graph uses a linear scale while the lower graph uses a logarithmic vertical scale.

Presentation of Risk Analysis for Dam SafetyDam Safety Results Evaluation: Hydrologic Risk
19
per year for the modified dam and spillway. The difference is less than 1%. Such differences in expected damageneed to be compared with the construction, operating, and opportunity costs associated with various options.
The lower graph in Figure 3 uses a logarithmic scale for damages and shows a difference in the expected damagesdue to events causing great damage. For events costing more than $70 million, the modified dam has higherexpected damages. In fact, the existing structure cannot cause more than $70 million in damages; as indicatedin Figure 2, the modified structure causes $100 million in damages when it fails. When considering damagesgreater than thresholds between $10 million and $70 million, the existing dam has higher expected damages thanthe modified dam because of the tenfold larger probability that it might fail and cause $70 million in damages(versus $100 million for the modified dam). However, the contribution to total expected damages from damageevents in this range is quite small: the total expected damages for damage events exceeding the $20 millionthreshold is $7,000, compared to some $480,000 in expected damages associated with all events.
The Partitioned Multi-objective Risk Method
Karlsson and Haimes [1988ab, 1989] and Haimes et al. [1988] develop the Partitioned Multi-objective RiskMethod (PMRM) which considers explicitly the expected damage associated with relatively frequent andinfrequent events. To do this, the PMRM method employs probability ranges (such as exceedance probabilitiesof 10 through 10 or 10 and less). It then determines the conditional expected damage for the damage events-2 -4 -4
that correspond to these specified probability ranges. The PMRM's goal is to elucidate the relative damageassociated with very unusual and with more common events. It attempts to achieve this objective by calculatingthe conditional damage associated with events in different probability ranges.
Karlsson and Haimes [1989] also explore the calculation of the conditional damage in specific damage ranges;the resultant conditional expectations for the most extreme partition are generally very close to the lower damagebound, and thus vary little across alternative actions. The use of PMRM with specific damage ranges is thoughtto be less "intuitive" and is not recommended.
Consider four problems associated with the PMRM approach and the corresponding use of the conditionalexpectations of the damage associated with specified probability ranges.
1) The PMRM method does not make it clear which damage events correspond to each probability range. Thiscan make the interpretation of the conditional means difficult because one does not know to which events theycorrespond. Moreover, sensitivity analyses that consider modifications of the probability distributions assignedto different events will change the actual damage events associated with the PMRM probability ranges; thus, theexpected values assigned to different probability ranges will not be comparable, because they correspond todifferent sets of events.
2) The natural way to think of probability is the likelihood or frequency assigned to a fixed or specified damageor damage range; the PMRM works the other way around. Thus, it is likely to be difficult to understand.Calculating the conditional expectation of damage in particular damage ranges [Petrakian et al., 1989; Karlssonand Haimes, 1989] doesn't help. A natural and useful exercise is calculating the probabilities associated withimportant and meaningful damage ranges or the exceedance probabilities of key damage thresholds.
Risk Analysis for Dam Safety Presentation OfEvaluation: Hydrologic Risk Dam Safety Results
20
3) A major objective of the PMRM is highlighting the trade-off between low-consequence/high-probabilityevents, and high-consequence/low-probability events, which are combined in the overall expected costs E[X].In this regard, the PMRM falls short for it still averages together events whose exceedance probabilities rangeover several orders of magnitude. As a result, it does not provide the resolution of the distribution function p (x)e
for damage or of the partial expected damage function C*(x), which shows continuously as a function of damagelevel x the expected damage from events of that magnitude and greater to the total expected cost. Moreover, thesecond function relates a system's expected damage to specific levels of damage, not to wide probability rangeswhose relationship to actual events is unclear.
To illustrate the problem with averaging over probability ranges of two orders of magnitude, consider the damagefunctions in Figure 2. It is fairly easy to select probability ranges which make the relative advantages of the twoprojects look very different. Consider three natural exceedance probability intervals: [1, 1x10 ], [1x10 , 1x10⁻² -2
], and [1x10 , 0]. As shown in Table 2, in all three of these intervals the expected damage of the modified dam-4 -4
is greater than or equal to the original structure. Thus, the modification appears to be an unwise expenditureregardless of which probability range is of interest.
However, if the last two intervals are redefined to emphasize less frequent events, one could consider [1, 1x10 ],-2
[1x10 ,1x10 ], and [1x10 , 0]. As shown in Table 3, with this choice of probability intervals the modified dam-2 -5 -5
has the lower conditional expected costs for the last interval. In the first case, the modified structure appears tobe dominated by the original dam. In the second case, a trade-off is evident. Petrakian et al. [1989, p. 116] alsoobserved such reversals in project ordering with variations in the endpoints of the probability ranges. With thePMRM approach, the apparent relative advantages of alternative proposals can depend critically upon theselected probability range, because they determine over which events the conditional average is calculated. Thisis troubling given that, as observed by Petrakian et al. [1989, p. 113], "the choice of the partitioning points onthe probability axis is a somewhat arbitrary process." This alone is sufficient reason to question the method'suse.
4) A stated purpose for the PMRM method is to allow decision-makers to make a trade-off between low-consequence/high-probability events and high-consequence/low-probability events. To do so, construction costsand the conditional expected damages associated with different risk intervals should be expressed in units whichdecision-makers feel comfortable comparing. Were it possible to determine appropriate partitioning probabilities,it is unclear how a decision-maker should rationally trade-off construction costs of perhaps $15 million, versusexpected damages of $23 million, instead of $70 million should an event occur with an exceedance probabilityin the interval [1x10 , 0], versus expected damages of $8.18 million, instead of $7.38 million should an event-4
occur in the interval [1x10 , 1x10 ]. One natural solution is to multiply each conditional expectation by the-2 -4
probability of that interval. This gives the portion of the total expected damages, E[X], associated with eachprobability interval. The portion of the total expected damages attributable to a given probability interval is whatthe partial expected cost distribution C*(x) reveals.

Presentation of Risk Analysis for Dam SafetyDam Safety Results Evaluation: Hydrologic Risk
21
Table 2. Expected Damages ($million/yr) for the Initial Partitioningof Probabilities of Damages in Figure 2 for use with PMRM
Probability Range [1, 1x10 ] [1x10 , 1x10 ] [1x10 , 0]-2 -2 -5 -5
Modified Dam 0.4 8.32 100Existing Dam 0.4 8.02 70
Table 3. Expected Damages ($million/yr) for the Modified Partitioningof Probabilities of Damages in Figure 2 for use with PMRM
Probability Range [1, 1x10 ] [1x10 , 1x10 ] [1x10 , 0]-2 -2 -4 -4
Modified Dam 0.4 8.26 23Existing Dam 0.4 7.45 70

22
For the thin-tailed rainfall distribution, the probability distribution for rainfall that exceeds a threshold of D =4o
0.9654 inches was F(D|D>D ) = 1 - [1-k(D-D )/a] with a = 6556 in. and k = - 0.10; for the thick-tailed distributiono o1/k
D = 1.3481 in., a = 0.3689 in., and k = - 0.25.o
23
CHAPTER 4 - PROBABILISTIC DAM PERFORMANCE ANALYSIS
Background
This chapter presents an example to illustrate probabilistic dam safety risk analysis. The example is based uponthe physical characteristics, and hydrologic and meteorological parameters, of a dam in the Northeastern UnitedStates. The characteristics of the dam and the distributions used to describe various random meteorological andhydrologic events are described in Appendix B.
The drainage basin for the dam has an area of 600 square miles with an elevation difference of 1,000 feet. Thetotal length of the watercourse is 40 miles. The dam is an earth-filled structure which rises from a groundelevation of 931 feet to an elevation at the crest of 995 feet. An emergency spillway begins operation when thestorage level in the dam reaches an elevation of 976.5 feet. When full to the top of the embankment, the storagepool has a volume of 265,500 acre-feet. When full to the spillway crest, the storage pool contains 69,600 acre-feet of water. The total length of the dam is 5600 feet, including the 150-foot spillway. Water can escape fromthe dam in three ways:
1) through the sluiceway outlet works2) over the spillway3) over the the dam's crest, as described in Figure B-2 in Appendix B.
The damage and loss-of-life as a function of release and the reservoir operating policy for the dam are describedin Appendix B and Figures B-4 through B-7.
The analysis considers three structural alternatives. The first is the current dam configuration with a 150-footwide spillway, as described in Appendix B. The second option corresponds to widening the spillway to 450 feet.This alternative would allow the passage of larger floods without overtopping, but would also result in the releaseof larger volumes of water in all cases when the reservoir level exceeds the spillway crest. The third option is toraise the dam crest 10 feet to an elevation of 1005 feet while retaining the current 150-foot spillway. This allowsthe dam to store more water before being overtopped.
The analysis considers another issue as well possible uncertainty in the distribution of rainfall using sensitivityanalysis. Figure 4 displays the nominal distribution for rainfall depths described in Appendix B with a one-in-a-million-year rainfall depth of 24 inches.
For the purposes of illustration, the analysis also considers an alternative thick-tailed rainfall-depth distributionwith a one-in-a-million-year rainfall depth exceeding 50 inches. This allows an exploration of the relationship4
between the rainfall distribution and the derived damage and loss-of-life distributions, and also the impact ofdifferent rainfall distributions on the character of the results. Alternatively, one
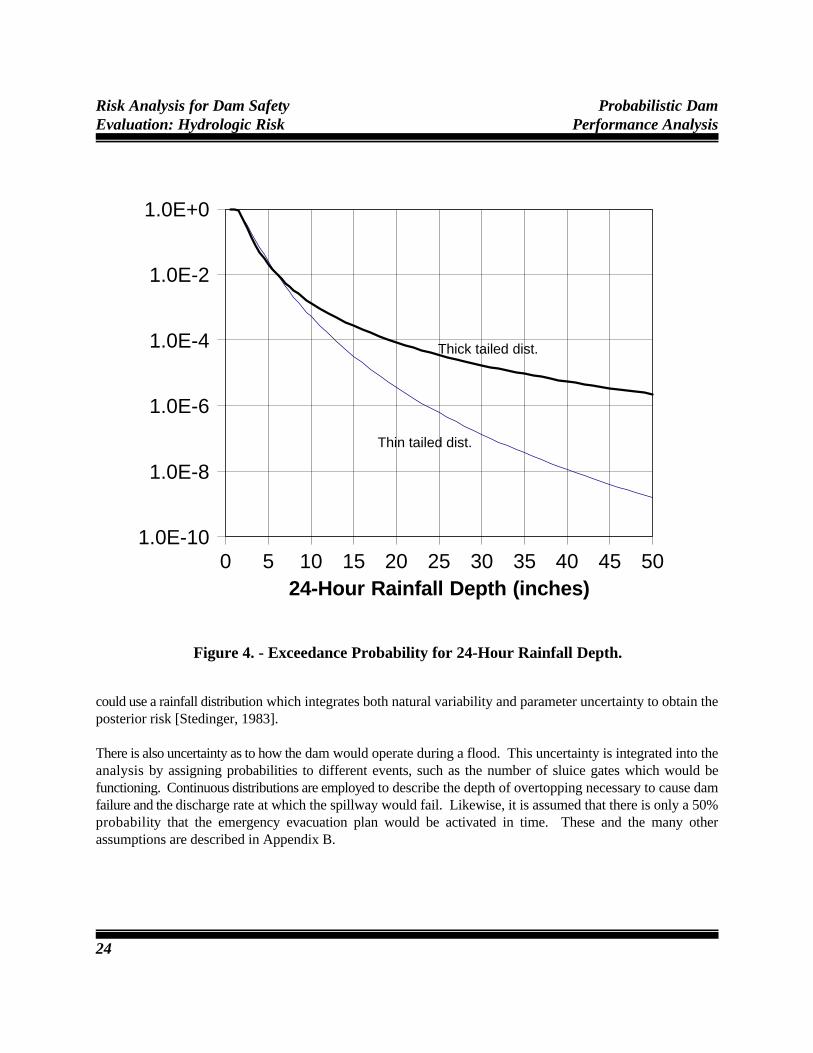
Thick tailed dist.
Thin tailed dist.
0 5 10 15 20 25 30 35 40 45 501.0E-10
1.0E-8
1.0E-6
1.0E-4
1.0E-2
1.0E+0
24-Hour Rainfall Depth (inches)
Risk Analysis for Dam Safety Probabilistic DamEvaluation: Hydrologic Risk Performance Analysis
24
Figure 4. - Exceedance Probability for 24-Hour Rainfall Depth.
could use a rainfall distribution which integrates both natural variability and parameter uncertainty to obtain theposterior risk [Stedinger, 1983].
There is also uncertainty as to how the dam would operate during a flood. This uncertainty is integrated into theanalysis by assigning probabilities to different events, such as the number of sluice gates which would befunctioning. Continuous distributions are employed to describe the depth of overtopping necessary to cause damfailure and the discharge rate at which the spillway would fail. Likewise, it is assumed that there is only a 50%probability that the emergency evacuation plan would be activated in time. These and the many otherassumptions are described in Appendix B.

Probabilistic Dam Risk Analysis for Dam SafetyPerformance Analysis Evaluation: Hydrologic Risk
25
Table 4. Summary of Monte Carlo Results forIllustrative Dam-Safety Example
P[Failure] E[DEATHS] E[Damages]Case (lives) (Million $)Thin-tailed rainfall distribution
150-foot spillway 2.3x10 1.47 25.1-5
450-foot spillway 6.3x10 1.52 27.7-6
Raise dam 10 feet 1.6x10 1.47 25.1-6
Thick-tailed rainfall distribution150-foot spillway 2.1x10 1.43 30.1-4
450-foot spillway 8.2x10 1.53 32.0-5
Raise dam 10 feet 3.3x10 1.43 30.0-5
Discussion of Results
Figures 5 through 8 below illustrate the probability distributions obtained for damage and loss-of-life using theMonte Carlo simulation procedure described in Chapter 2. Table 4 reports three statistics:
1) the overall average probability of the dam's being overtopped and failing, P[Failure]2) the expected loss-of-life, E[Deaths]3) the expected damage, E[Damages].
In practice, these numbers need to be compared with the cost of these and other alternatives.
From the statistics reported in Table 4, several anticipated trends manifest themselves. First, the wider spillwaydoes indeed lower the probability that the dam is overtopped and fails. Likewise, raising the dam crest resultsin a large decrease in the probability that the dam is overtopped and fails. Second, with either of the threeoptions, the probability of dam failure is larger with the thick-tailed rainfall-depth distribution; however, the otherstatistics change very little.
What is perhaps surprising is that with either rainfall distribution combined with the current crest elevation, theexpected lives lost and dollar damages are larger with the wider spillway. Also surprising is that with the current150-foot spillway, the expected loss-of-life and damage are almost independent of whether the dam is raised.
Figures 5 through 8 aid in understanding these results. Figure 5, with some reflection, reveals that for propertydamages less than $50 million, the emergency spillway does not come into operation. Thus, the damagedistributions are the same for all three options. Property damage levels between $50 and
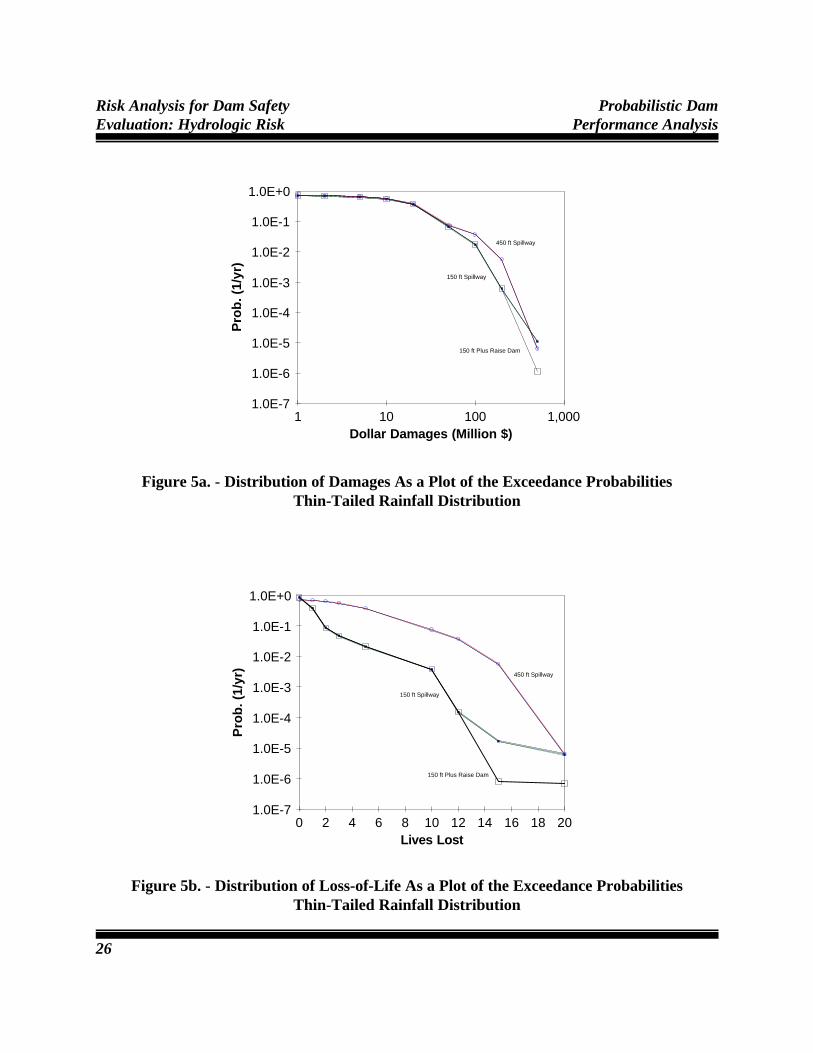
1 10 100 1,0001.0E-7
1.0E-6
1.0E-5
1.0E-4
1.0E-3
1.0E-2
1.0E-1
1.0E+0
Dollar Damages (Million $)
Pro
b. (
1/yr
)450 ft Spillway
150 ft Spillway
150 ft Plus Raise Dam
0 2 4 6 8 10 12 14 16 18 201.0E-7
1.0E-6
1.0E-5
1.0E-4
1.0E-3
1.0E-2
1.0E-1
1.0E+0
Lives Lost
Pro
b. (
1/yr
)
450 ft Spillway
150 ft Spillway
150 ft Plus Raise Dam
Risk Analysis for Dam Safety Probabilistic DamEvaluation: Hydrologic Risk Performance Analysis
26
Figure 5a. - Distribution of Damages As a Plot of the Exceedance ProbabilitiesThin-Tailed Rainfall Distribution
Figure 5b. - Distribution of Loss-of-Life As a Plot of the Exceedance ProbabilitiesThin-Tailed Rainfall Distribution

1 10 100 1,0000
10
20
30
Damage Threshold (Million $)
Exp
ecte
d D
amag
es (
Mill
ion
$ p
er y
ear)
450 ft Spillway
150 ft Spillway
450 ft Spillway
150 ft Spillway
0 2 4 6 8 10 12 14 16 18 200.00
0.50
1.00
1.50
2.00
Loss of Life Threshold
Exp
ecte
d L
ives
Lo
st p
er Y
ear
Probabilistic Dam Risk Analysis for Dam SafetyPerformance Analysis Evaluation: Hydrologic Risk
27
Figure 6a. - Expected Damages From Events that Exceed the Specified ThresholdsThin-Tailed Rainfall Distribution
Figure 6b. - Loss-of-Life From Events that Exceed the Specified ThresholdsThin-Tailed Rainfall Distribution
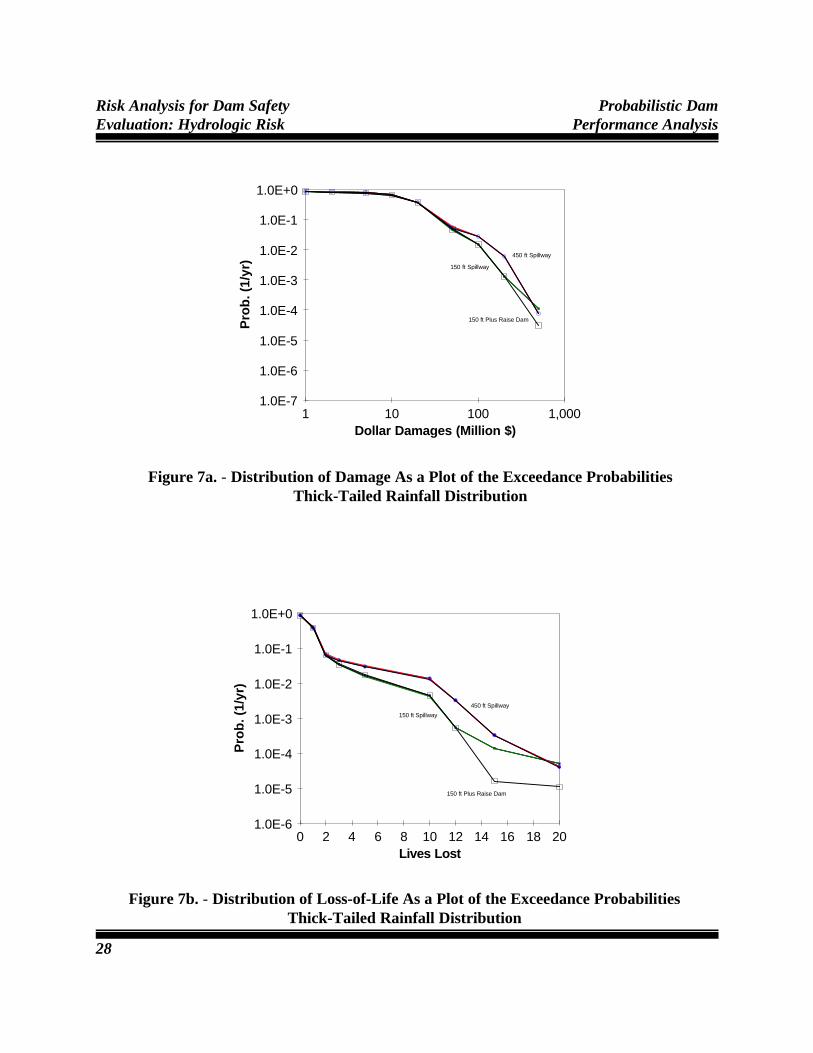
1 10 100 1,0001.0E-7
1.0E-6
1.0E-5
1.0E-4
1.0E-3
1.0E-2
1.0E-1
1.0E+0
Dollar Damages (Million $)
Pro
b. (
1/yr
) 450 ft Spillway
150 ft Spillway
150 ft Plus Raise Dam
0 2 4 6 8 10 12 14 16 18 201.0E-6
1.0E-5
1.0E-4
1.0E-3
1.0E-2
1.0E-1
1.0E+0
Lives Lost
Pro
b. (
1/yr
)
450 ft Spillway
150 ft Spillway
150 ft Plus Raise Dam
Risk Analysis for Dam Safety Probabilistic DamEvaluation: Hydrologic Risk Performance Analysis
28
Figure 7a. - Distribution of Damage As a Plot of the Exceedance ProbabilitiesThick-Tailed Rainfall Distribution
Figure 7b. - Distribution of Loss-of-Life As a Plot of the Exceedance ProbabilitiesThick-Tailed Rainfall Distribution
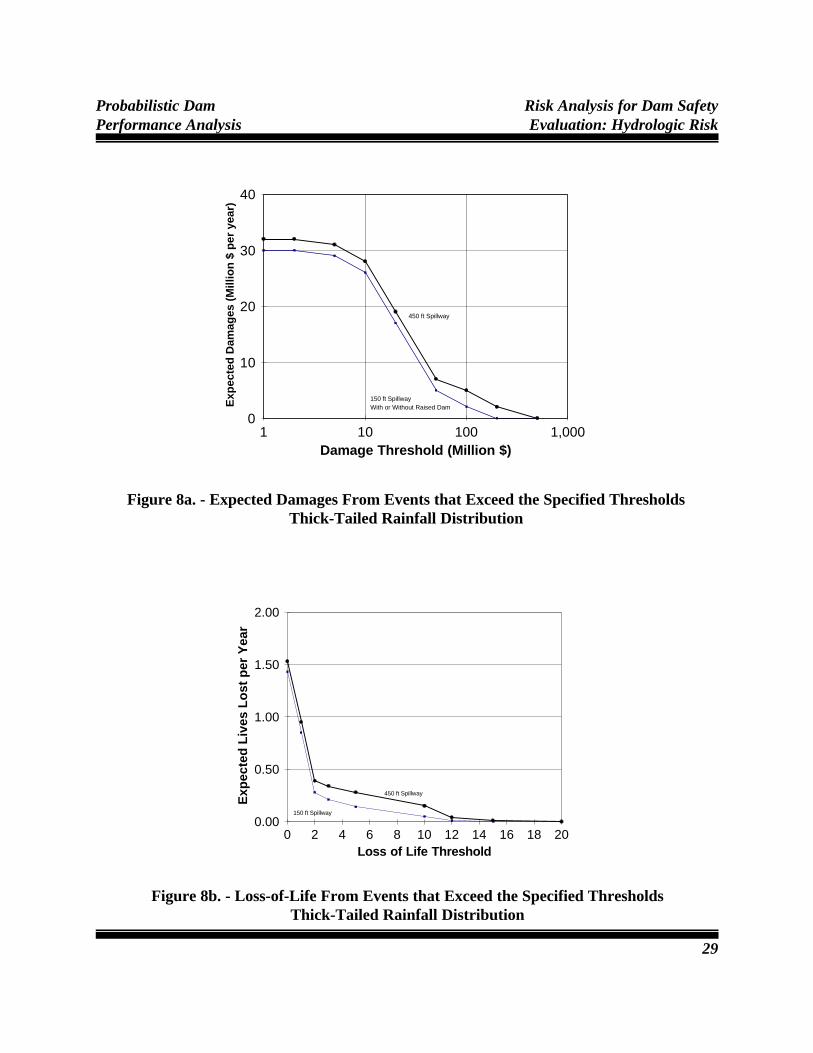
1 10 100 1,0000
10
20
30
40
Damage Threshold (Million $)
Exp
ecte
d D
amag
es (
Mill
ion
$ p
er y
ear)
450 ft Spillway
150 ft SpillwayWith or Without Raised Dam
0 2 4 6 8 10 12 14 16 18 200.00
0.50
1.00
1.50
2.00
Loss of Life Threshold
Exp
ecte
d L
ives
Lo
st p
er Y
ear
450 ft Spillway
150 ft Spillway
Probabilistic Dam Risk Analysis for Dam SafetyPerformance Analysis Evaluation: Hydrologic Risk
29
Figure 8a. - Expected Damages From Events that Exceed the Specified ThresholdsThick-Tailed Rainfall Distribution
Figure 8b. - Loss-of-Life From Events that Exceed the Specified ThresholdsThick-Tailed Rainfall Distribution
Risk Analysis for Dam Safety Probabilistic DamEvaluation: Hydrologic Risk Performance Analysis
30
$500 million correspond to events without dam failure but with large damaging floods passed downstream bythe spillways. For events in this range, the wider 450-foot spillway causes much greater damage for a giveninflow; or, as shown by Figure 5, for any damage level in this range, the 450-foot spillway option has a largerprobability of exceeding that level.
Similarly, for loss-of-life events corresponding to less than two lives, the emergency spillway does not come intoplay and the three options have identical loss-of-life distributions. Floods causing from 2 to 18 deaths still donot correspond to dam failure events and the 450-foot spillway results in a larger probability of each level in thatrange being exceeded.
Figure 7 shows the damage and loss-of-life distributions for the thick-tailed rainfall-depth distribution. Figure5 and Figure 7 are very similar, because the damage and loss-of-life thresholds corresponding to spillwayoperation and dam failure are the same. What changes are the probabilities that the various levels are exceeded.This is why the summary statistics for the two sets of results with different rainfall-depth distributions haveessentially the same character.
Figures 6 and 8 display the partial expected value function C*(x) for all losses that exceed the thresholds xindicated on the horizontal axis. The figures indicate that most, if not all, of the expected loss-of-life and damageare due to events that cause less than 3 deaths or $50 million in damages. These correspond to less than the 1percentile of the corresponding distributions; hence the expected loss-of-life and damage values are insensitiveto the rainfall-depth distribution for the very extreme events, in this example.
Likewise, the importance of relatively likely events in the calculation of expected loss-of-life and damage is thereason that the values of statistics for the 150-foot spillway with the current crest level, or the 10-foot highercrest, are almost identical. As Figures 5 through 8 all show, differences in the distributions of damage and loss-of-life between these two options only occur when the original dam is overtopped, a very rare event. In suchcases, the dam with the higher crest is better able to contain the flood, thus decreasing losses downstream, exceptin the even less likely case that the higher dam is overtopped and fails, causing an even larger flood wave thanthat resulting from the failure of the original dam. While the difference in dam failure probabilities for the 150-foot spillway with the two crest elevations is about an order of magnitude for both the thin-tailed and thick-tailedrainfall distributions, the expected loss-of-life and damage are virtually identical.
Figure 6 (or Figure 8 for the thick-tailed rainfall-depth distribution) actually explains why the 450-foot spillwayalternative has larger expected property damage and expected loss-of-life than the 150-foot spillway with thesame crest elevation. In the case of property damage, the expected property damage for events in the dam failurerange (over $500 million) are not detectable. That is, they are an insignificant proportion of the total expectedlosses because of the very small probability that these values are incurred. However, the difference in C*(x) inthe $50 million to $500 million range is much larger. The 450-foot spillway option has a higher C*(x) than the150-foot spillway option in this range, reflecting the larger expected costs that would be incurred by the largerspillway due to damage events in this magnitude range. Because of this difference, the total expected costsassociated with the 450-foot spillway exceed those of the current 150-foot spillway. In the under $50 millionproperty damage range, the two C*(x) property damage curves are parallel because the probabilities of thosedamage levels are the same with the two alternatives.

Probabilistic Dam Risk Analysis for Dam SafetyPerformance Analysis Evaluation: Hydrologic Risk
31
Figure 6 also shows the partial expected value function C*(x) for loss-of-life. Here, the threshold x along thehorizontal axis corresponds not to the actual number of lives lost in any flood, but to the expected number of liveslost due to various release rates from the dam. Thus, it is reasonable to consider the expected loss-of-lifecorresponding to all floods which would be expected to cause more than 0.5 deaths or 2.5 deaths or 10 deaths.In Figure 6, C*(x) for loss-of-life has the same general pattern as C*(x) for damage. The difference between thetwo partial expected value functions C*(X) for loss-of-life in Figure 6 accumulates in the range between 2 and12 deaths and is negligible above 12 deaths.
Figure 8 corresponds to Figure 6, but for the thick-tailed rainfall-depth distribution. The only apparent differenceis a modest change in the overall levels of the expectations. An anomaly is the decrease in the total expectednumber of deaths with the adoption of the thick-tailed distribution. This, however, is a result of the thick-taileddistribution having been chosen to yield a Generalized Extreme Value (GEV) annual 24-hour rainfall distribution[Hosking et al., 1985] with the same 2-year and 100-year rainfall depths of 2 and 6 inches, respectively, as thethin-tailed rainfall distribution, but with a shape parameter k of - 0.25 instead of - 0.10. The resultant thick-taileddistribution is thinner in the 2-year to 100-year rainfall range which produces floods causing less than two deaths;see Figure 4. Figures 6 and 8 show that most of the total expected loss-of-life in this example is due to floodswhich on average cause less than two deaths. Thus, the major loss-of-life risk in this example is due to modestflood events in which only one or two persons die. Of course, such events are not as dramatic as the dam's failurewhich would on average result in the loss of some 20 lives if the flood warning system also failed.
In conclusion, it is of interest to reflect on how these results might affect public opinion and the decisions oflegislators. In terms of the expected damage and loss-of-life, in this example it is unlikely that either of themodifications of the current dam could be justified. However, facilities may still be required to satisfy sometarget level of safety to avoid the occurrence of failures and the associated catastrophes. In this regard, raisingthe dam by some amount would allow a higher safety standard to be met without adversely affecting thepopulation immediately at risk below the dam.
Comparison with FEMA/Stanford Approach
McCann et al. [1985] describe a dam safety procedure developed for the Federal Emergency Management Agency(FEMA). The purpose of their analysis is to employ risk analysis as part of a screening procedure for"preliminary safety evaluation," for allocating funds among dams in a given jurisdiction for further study, andfor the upgrading of some structures. The techniques used are relatively simple and intended to save money orat least to allocate a budget reasonably. The analysis makes use of general regional relationships and quantitativeobservations of a dam's state to estimate the relative probability of failure from the various failure modes:foundation and piping, structural, seismic, and hydrologic, including upstream dam failures. They indicate thatthe procedure is intended to be a "preliminary and simplified approach designed to provide a relative, as opposedto an absolute assessment of risk" [McCann et al., Volume I, p. ii, 1985].
It is not necessarily appropriate to compare the FEMA/Stanford approach presented by McCann et al. [1985]with the Monte Carlo dam-safety risk-analysis procedure described here because they have such differentobjectives. First, the FEMA/Stanford approach is intended to provide a simple preliminary assessment of failurerisk from a very broad and comprehensive list of possible causes of dam failure. The Monte Carlo risk analysis
Risk Analysis for Dam Safety Probabilistic DamEvaluation: Hydrologic Risk Performance Analysis
32
procedures developed here are intended to provide a detailed and careful examination of the probability of failureand the distributions of property damage and loss-of-life from a wide range of flood events, including eventswhich would cause dam overtopping and dam failure; other sources of failure are not considered. Such detailedrisk analysis requires a reasonably extensive site-specific evaluation of the likely performance of a dam andreservoir in major floods, as opposed to the general regional relationships and simplified routing relationshipsemployed in the FEMA/Stanford model. The detailed risk analysis described in the previous chapter isappropriate to support the analysis of alternative design options. The FEMA/Stanford model is intended todetermine at what sites such studies might be warranted.
To make this point more clearly, an implementation of the FEMA/Stanford model was employed to do ahydrologic risk analysis for a dam which matched closely the example dam employed in this chapter. Thisimplementation was constructed by Moy, Moser, and Stakhiv of the Institute of Water Resources and revised byHeath, Nagarwalla, and Stedinger [1987]. The procedure is basically that described by McCann et al. [1985].
Table 5 below summarizes the description of the basin employed in the FEMA/Stanford model. As indicated atthe bottom of Table 5, the FEMA/Stanford analysis indicates that the probability of dam failure with the 150-footspillway is 9.0x10 (the reciprocal of the return period of 1,100 years) and with a 450 foot spillway was 4.5x10 .-4 -5
These probabilities are larger than those obtained with the stratified Monte Carlo simulation, even with the thick-tailed distribution. The difference is due to a number of factors, including differences in the flood routing models,descriptions of the operation of reservoir outlet works, the assumed pattern for rainfall in the FEMA/Stanfordmodels, and the probabilities of different temporal distributions employed in the Monte Carlo risk analysis. Moreimportantly, examination of the Monte Carlo risk-analysis statistics for this example, and the distributionvariances that occur with different designs, reveal that dam failure events are not the disasters which have themajor impact on total expected property damage and loss-of-life. These are issues that the initial FEMA/Stanfordscreening model as implemented does not address.

Probabilistic Dam Risk Analysis for Dam SafetyPerformance Analysis Evaluation: Hydrologic Risk
33
Table 5. Information Employed In FEMA/Stanford Analysis
To compare the FEMA/Stanford analysis methodology for dam-overtopping failures with a
more detailed hydrologic risk-analysis procedure, the following input is employed at each step
in response to the program's requests.
Item Data Comments
Name of Dam Test 1
Name Basin Test 1
Area of basin 600 sq. miles
Length of water course 40 miles
Elevation difference 1000 feet
Return period 10 years critical rainfall for 24 hours6
Precipitation 23.5 inches critical rainfall
Return period 100 years second rainfall depth 24 hours
Precipitation 6 inches
Runoff index 2 medium
Dam location 3 East of Rockies
Dam Condition g condition of dam is good
Storage @ Crest + 2 feet 298405 acre-feet; corresponds to spillway crest plus 2 feet
where failure occurs
Storage initial 5597 acre-feet; corresponds to average
condition for Monte Carlo runs.
Spillway rating 47063 cfs; Discharge at Crest full plus 2 feet.
Fraction working 1 Assumes all sluiceway gates working
Crest length 5600 feet; The program assumes spillway length is included in
crest length.
Spillway length 150 feet
Height of dam 64 feet (base to crest)
Resultant probability of dam failure is 1 in 1,100 per year.

34
35
CHAPTER 5 - FINAL OBSERVATIONS
Thoughts on Progress in Dam Safety Risk Analysis
Science and engineering tend to be evolutionary processes with each model, set of theories, or methodsuccessively replaced by more sophisticated concepts and procedures. Simplistic flood-frequency analyses andflood-of-record planning have been rejected for determination of the safety evaluation flood for large high-hazarddams because as implemented they are unreliable; subsequently, the PMP-PMF design standard has beenadopted. With the availability of larger and longer databases, better statistical modeling concepts, and greaternumerical processing capabilities, it is now time to move from use of the implicit risk associated with such adeterministic or selected worst-case design standard to a policy determined by a reasonable and explicit risktarget. Even better, decision-makers can try to balance the costs of reducing large floods and dam failureprobabilities against the resulting benefits. This requires a thorough risk assessment in terms of the probabilitiesof various natural phenomena, the likely response of natural and human-engineered systems to those events, andthe evaluation of the cost and consequences of the resulting disasters from various social, economic, andenvironmental perspectives.
Risk analyses have been readily adopted in many decision-making contexts, such as the design of modest flood-control works and floodplain planning. It is profitable to reflect on why progress has been so slow in the safetyevaluation of high-hazard dams. Several factors may be relevant.
1) Because the dam safety problem deals with such extraordinary rainfall and flood extremes, far beyond whatmay actually have occurred in a river basin or a region, the analysis has a high “fantasy factor”; engineers facea challenge imagining and explaining the PMF, without the additional burden of having to also develop theprobability distribution of such events.
2) In moving to risk-cost analyses engineers may be trying to fine-tune a spillway design when only roughestimates of the possible magnitude of events with return periods in the hundred-thousand year range are possible;thus, care should be exercised that the precision with which engineers can describe the natural phenomena ofinterest is commensurate with the sophistication of the analytical tools employed.
3) Use of a systematized PMP/PMF approach may give engineers a sense of accuracy that may or may not existin the calculation of a design standard. However, the uncertainties associated with the risk approach are moreapparent because of the method's ongoing development. The uncertainties associated with the recommendationsof quantitative risk analyses are certainly of concern to many engineers.
4) Finally, and probably most importantly, for 50 years the tradition in high-hazard dam spillway design andsafety evaluations has been to use a standard which, with various titles, has essentially corresponded to someapproximation of a PMP-PMF analysis. That analysis is now widely accepted and agreed upon by the dam designcommunity and is consistent with their desire to build dams that should not fail. To many, there should bevirtually no probability that large dams might fail and cause widespread loss-of-life and destruction. With sucha mindset, risk analysis is not an attractive or even a reasonable activity. Still, when existing dams are found tofall short of the latest estimate of the PMF, and the costs of a major retrofit are large, many ask: “How safe issafe enough?” and, “What price should we pay for safety?”
Risk Analysis for Dam SafetyEvaluation: Hydrologic Risk Final Observations
36
Closing Observations
This report has developed and illustrated the concepts needed to perform a thorough probabilistic analysis of thedam safety issue, including the calculation of the probability of dam failure and the distributions for dollardamages and loss-of-life as a result of the combinations of the many factors that result in large releases from adam, and possibly as a result of its actual structural failure. As one would expect, the enterprise is complicated,requiring that probability distributions or particular values be assigned to meteorological and hydrologicvariables, the status and performance of the structure, and the response and impact of releases from the dam onhuman populations and their belongings. One surprising finding in the course of the study was that the operatingrule assumed for reservoir operation could have a major impact on the damage and loss-of-life distributionsbecause of its importance during small and large (but not necessarily extreme) flood events.
Quantitative risk assessment such as that described here is based upon the premise that man-made systems canfail. Thus, engineering analyses should consider how to reduce the costs and consequences of failure in balancewith the cost of such efforts. Such an outlook is a rational and responsible position to adopt. In particularapplications, current economic and statistical analysis techniques, and the databases available for estimating theprobabilities of extraordinary precipitation events and their spatial and temporal character, may not be sufficientlydeveloped to support detailed risk analyses. However, as ASCE's Task Committee on Spillway Design FloodSelection [1988] notes, this situation should change as the profession gains experience and confidence with theuse of quantitative risk analysis for dam safety evaluations, builds the required databases, and develops thenecessary techniques. Detailed risk analyses may never have the desired analytical precision to make definitivedesign decisions, but uncertainties often remain when design decisions are made.
In any case, quantitative risk analysis is ready to complement current design standard formulation. It providesinsights into the complexities of dam safety problems. Products of risk analysis include the pathways to failureand their relative likelihoods, overall failure probabilities, and trade-offs between safety and costs. Usingquantitative risk analysis as a decision tool or as an integral component of traditional design standards, shouldgive decision-makers more information about the implications of adopting alternative solutions to dam safetyproblems, and should aid in the evaluation of alternatives.
37
REFERENCES
Alexander, G.N., Using the Probability of Storm Transposition for Estimating the Frequency of Rare Floods,Jour. of Hydology 1(1), 46-57, 1963.
American Nuclear Society (Working Group ANS-2.8), American National Standard for Determining DesignBasis Flooding at Power Reactor Sites, American Nuclear Society, La Grange Park, IL, February 1981.
Baecher, G.B., M.E. Paté , and R. de Neufville, Risk of Dam Failure in Benefit Cost Analysis, Water Resour.Res., 16(3), 449-456, 1980.
Bernier, J.M., Elements of Bayesian Analysis of Uncertainty in Hydrological Reliability and Risk Models, inEngineering Reliability and Risk in Water Resources, pp. 405-422 (NATO Advanced Study Institute, Tucson,AZ, May 1985), Duckstein, L., and E. Plate (eds.), M. Nijhoff, Dordrecht, the Netherlands, 1987.
Bohnenblust, H., and E.H. Vanmarcke, Decision Analysis for Prioritizing Dams for Remedial Measures: A CaseStudy, Research Report R82-12, Department of Civil Engineering, Massachusetts Institute of Technology,Cambridge, MA, June 1982.
Bowles, D.S., A Comparison of Methods for Risk Assessment of Dams, in Engineering Reliability and Risk inWater Resources, (NATO Advanced Study Institute, Tucson, AZ, May 1985), Duckstein, L., and E. Plate (eds.),M. Nijhoff, Dordrecht, the Netherlands, 1987.
Bureau of Reclamation, Guidelines to Decision Analysis, ACER Tech. Mem. No. 7, U.S. Department of theInterior, Denver, CO, March 1986.
Bury, K.V., and H. Kreuzer, The Assessment of Risk for a Gravity Dam, Water Power and Dam Construction,38(12), 36-39, 1986.
Cheng, S., B.C. Yen, W.H. Tang, Overtopping Risk for an Existing Dam, Civil Engineering Studies HydraulicEngineering Series No. 37, University of Illinois, Urbana, IL, December 1982.
Cochrane, H.C., R. Ferrell-Dillard, and D.D. Baumann, Socioeconomic Considerations in Dam Safety RiskAnalysis, IWR Report 87-R-7, Planning and Managment Consultants, Ltd., Carbondale, IL, June 1987.
Coomes, R.T., The PMF Debate, in Proceedings of a Workshop on Current Developments in Dam SafettyManagement, Stanford University, Stanford, CA, 1986.
Cooper, C.L., A Case for Selecting Only Deterministic Spillway Design Floods for High Hazard Dams, WaterPower '87: Proceedings of the International Conference on Hydropwer, 1148-1157, American Society of CivilEngineers, New York, NY, 1987.
Dawdy, D.R., and D.P. Lettenmaier, Initiative for Risk-Based Flood Design, Jour. of Hydraulic Engineering,113(8), 1041-1051, 1987.

Risk Analysis for Dam SafetyEvaluation: Hydrologic Risk References
38
Duckstein, L, and J. Bernier, A System Framework for Engineering Risk Analysis, in Risk-Based DecisionMaking in Water Resources, Haimes, Y.Y., and E.Z. Stakhiv (eds.), (Proceeding of an Engineering FoundationConference, Santa Barbara, CA., November 3-5, 1985.) American Society of Civil Engineers, New York, NY,pp. 90-110, 1986.
Duckstein, L,. E. Plate, and M. Benedini, Water Engineering Reliability and Risk: A System Framework, inEngineering Reliability and Risk in Water Resources, (NATO Advanced Study Institute, Tucson, AZ, May1985), Duckstein, L., and E. Plate (eds.), M. Nijhoff, Dordrecht, the Netherlands, 1987.
Fan, Shou-Shan, Hydrologic Evaluation of Dam Safety, Proceedings of the Conference on Frontiers inHydraulic Engineering, Shen, H.T. (ed.), American Society of Civil Engineers, Massachusetts Institute ofTechnology, Cambridge, MA, August 9-12, 1983.
Feldman, A.D., HEC Models for Water Resouces System Simulation: Theory and Experience, Advances inHydroscience, 12, 297-423, 1981.
Foufoula-Georgiou, E., A probabilistic storm transposition approach for estimating exceedance probabilities ofextreme precipitation depths, Water Resour. Res., 25(5), 700-815, 1989.
Haimes, Y.Y., R. Petrakian, P.-O. Karlsson, and J. Mitsiopoulos, Risk Analysis of Dam Failure and ExtremeFloods: Application of the Partitioned Multiobjective Risk Method, IWR Report 88-R-1, Environmental SystemsManagement, Inc., Charlottesville, VA, January 1988.
Haimes, Y.Y., and E.Z. Stakhiv (eds.), Risk-Based Decision Making in Water Resources, (Proceeding of anEngineering Foundation Conference, Santa Barbara, CA., November 3-5, 1985.) American Society of CivilEngineers, New York, NY, 1986.
Hansen, E.M., L.C. Schreiner, and J.F. Miller, Application of the Probable Maximum Precipitation Estimates -United States East of the 105th Meridian, Hydrometeoroogical Report No. 52, National Weather Service,National Oceanic and Atmospheric Administration, U.S. Department of Commerce, Washington, D.C., 168 pp.,1982.
Heath, D., N. Nagarwalla, and J. Stedinger, Two Simple Safety Evaluation Programs, School of OperationsResearch, Cornell University, September 28, 1987.
Hosking, J.R.M., J.R. Wallis, and E.F. Wood, Estimation of the Generalized extreme-value distribution by themethod of probability weighted moments, Technometrics, 27(3), 251-261, 1985.
Howard, R.A. and Matheson, Influence Diagrams, in The Principles and Applications of Decision Analysis, VolII, Howard, R.A., and J.E. Mathesom (eds.), Strategic Decisions Group, Menlo Park, CA, 1984.
Jansen, R.B., Dam Safety in the United States, Water Power and Dam Construction, pp. 17-20, April 1984.
Risk Analysis for Dam SafetyReferences Evaluation: Hydrologic Risk
39
John, R., R. Keeney, W. Petak, and D.V. Winterfeldt, Evaluation of Risk Assessment Methodologies forPrioritizing Remedial Dam Safety Projects, Final Research Report, Institute of Safety and Systems Management,University of Southern California, February 1985.
Johnson, G.P., and D. Sheer, Some Perspectives and Philosophies on Risk-Based Decision Making in WaterResources, in Risk-Based Decision Making in Water Resources, Haimes, Y.Y., and E.Z. Stakhiv (eds.),(Proceeding of an Engineering Foundation Conference, Santa Barbara, CA, November 3-5, 1985.) AmericanSociety of Civil Engineers, New York,NY, pp. 172-77, 1986.
Karaa, F., and R. Krzysztofowicz, Bayesian Decision Analysis of Dam Safety, Applied Mathematics andComputation, 14, 357-80, 1984.
Karlsson, P-O., and Y.Y. Haimes, Risk-Based Analysis of Extreme Events, Water Resour. Res., 24(1), 9-20,1988a.
Karlsson, P-O., and Y.Y. Haimes, Probability Distributions and Their Partitioning, Water Resour. Res., 24(1),21-29, 1988b.
Karlsson, P.-O., and Y.Y. Haimes, Risk assessment of extreme events: application, J. Water Resources Planningand Management, 115(3), 299-320, 1989.
Kelman, J., S. Costa, and J.M. Damazio, Monte Carlo Approach to Spillway Design Floods, Proceedings of theSymposium on Engineering Hydrology, Hydraulics Division of the American Society of Civil Engineers.Williamsburg, VA, August 3-7, 1987.
Kreuzer, H., and K. Bury, A Probability Based Evaluation of the Safety and Risk of Existing Dams, Proceedingsof the International Conference on Safety of Dams, pp. 61-71, Coimbra, Portugal, 1984.
Krouse, M.R., Workshop Report-Engineering Standard Versus Risk Analyses, in Risk-Based Decision Makingin Water Resources, Haimes, Y.Y., and E.Z. Stakhiv (eds.), American Society of Civil Engineers, New York,NY, 1986.
Langseth, D.E., Spillway Analysis in Dam Safety Evaluation, Sc.D. Thesis, Massachusetts Institute ofTechnology, Cambridge, MA, 1983.
Langseth, D.E. and F.E. Perkins, The Influence of Dam Failure Probabilities on Spillway Analysis, Proceedingsof the Conference on Frontiers in Hydraulic Engineering, 459-464, American Society of Civil Engineers, NewYork, NY, 1983.
McCann, M.W., Jr. (ed.), J.B. Franzini, E. Kavazanjian, and H.C. Shah, Preliminary Safety Evaluation of ExistingDams, Vol 1-2, John A. Blume Earthquake Engineering Center, Stanford University, Report No. 69, November1985.

Risk Analysis for Dam SafetyEvaluation: Hydrologic Risk References
40
McCann, M.W., Jr., Proceedings of a Workshop on Current Developments in Dam Safety Management, (heldat Stanford University July 24-26, 1985.) Stanford, CA, 1986.
Moser, D.A., An Application of Risk Analysis to the Economics of Dam Safety, in Risk-Based Decision Makingin Water Resources, Haimes, Y.Y., and E.Z. Stakhiv (eds.), (Proceeding of an Engineering FoundationConference, Santa Barbara, CA, November 3-5, 1985.) American Society of Civil Engineers, New York, NY,pp. 178-189, 1986.
Moser, D.A., and E.Z. Stakhiv, Risk Analysis Considerations for Dam Safety, in Engineering Reliability andRisk in Water Resources, (NATO Advanced Study Institute, Tucson, AZ, May 1985), Duckstein, L., and E. Plate(eds.), M. Nijhoff, Dordrecht, the Netherlands, 1987.
Myers, V., Meteorological Estimation of Extreme Precipitation for Spillway Design Floods, Tech. Mem.WBTM Hyrdro-5, U.S. Weather Bureau, Office of Hydrology, Washington, D.C., 1967.
National Research Council, Committee on Safety Criteria for Dams, Water Science and Technology Board, Safetyof Dams: Flood and Earthquake Criteria, National Academy Press, Washington, D.C., 1985.
National Research Council, Committee on Techniques for Estimating Probabilities of Extreme Floods,Estimating Probabilities of Extreme Floods, Methods and Recommended Research, National Academy Press,Washington D.C., 1988.
Newton, N.W., Realistic Assessment of Maximum Flood Potentials, Journal of Hydraulic Engineering, 109(6),905-917, 1983.
Ouellette, P., N. El-Jabi, and J. Rousselle, Application of Extreme Value Theory to Flood Damage, Jour. ofWater Resour. Planning and Management, 111(4), 467-77, 1985.
Parrett, N., U.S. Bureau of Reclamation Use of Risk Analyis, in Risk-Based Decision Making in WaterResources, Haimes, Y.Y., and E.Z. Stakhiv (eds.), (Proceeding of an Engineering Foundation Conference, SantaBarbara, CA, November 3-5, 1985.) American Society of Civil Engineers, New York, NY, pp. 154-171, 1986.
Paté -Cornell, M.E., Warning Systems: Application to Reduction of Risk Cost for New Dams, Proceedings ofthe International Conference on Safety of Dams, Coimbra, Portugal, 1984.
Paté -Cornell, M.E., and G. Tagaras, Risk Costs for New Dams: Economic Analysis and Effects of Monitoring,Water Resour. Res., 22(1), 5-14, 1986.
Paté -Cornell, M.E., Warning systems in risk management: the benefits of monitoring, in Risk Analysis andManagement of Natural and Man-made Hazards, pp. 253-67, Haimes, Y.Y., and E. Z. Stakhiv (eds.), AmericanSociety of Civil Engineers, New York, NY, 1989.

Risk Analysis for Dam SafetyReferences Evaluation: Hydrologic Risk
41
Petrakian, R., Y.Y. Haimes, E. Stakhiv, and D. Moser, Risk analysis of dam failure and extreme floods, in RiskAnalysis and Management of Natural and Man-made Hazards, pp. 81-121,Haimes, Y.Y., and E.Z. Stakhiv(eds.), American Society of Civil Engineers, New York, NY, 1989.
Prendergast, J.D., Probabilistic Concept for Gravity Dam Analysis, Special Report M-265, ConstructionEngineering Research Laboratory, U.S. Army Corps of Engineers, Champaign, IL, August 1979.
Reid, S.G., Frequency-Cost Curves and Derivative Risk Profiles, Risk Analysis 7(2), 261-67, 1987.
Resendiz-Carrillo, D., and L.B. Lave, Optimizing Spillway Capacity with an Estimated Distribution of Floods,Water Resour. Res., 23(11), 2043-49, 1987.
Shachter, R.D., Probabilistic Inference and Influence Diagrams, Operations Research, 36(4), 589-604, 1988.
Shachter, R.D., and C.R. Kenley, Gaussian Influence Diagrams, Management Science, 35(5), 527-550, 1989.
Stakhiv, E.Z., Risk and Uncertainty Analysis in Water Resources Planning, U.S. - Japan Workshop on RiskAssessement and Risk Management, Osaka, Japan, October 26-309, 1987.
Stakhiv, E.Z., and D. Moser, Guidelines for Evaluation of Modifications of Existing Dams Related to HydrologicDeficiencies, Office of the Chief Engineer, U.S. Army Corps of Engineers, IWR Report 86-R-7, Fort Belvoir,VA, October 1986.
Stallings, E.A., A.G. Cudworth, E.M. Hansen, and W.A. Styner, Evolution of PMP Cooperative Studies, J. ofWater Resour. Plan. and Management, 112(4), 516-525, 1986.
Stedinger, J.R., Design events with specified flood risk, Water Resour. Res., 19(2), 511-522, 1983.
Stedinger, J.R., and J. Grygier, Risk-Cost Analysis and Spillway Design, In Computer Applications in WaterResources, pp. 1208-17, Torno, H.C. (ed.), American Society of Civil Engineers, New York, NY, 1985.
Task Committee on Spillway Design Flood Selection, Evaluation Procedures for Hydrologic Safety of Dams,Surface Water Hydrology Committee, Hydraulics Division, American Society of Civil Engineers, September1988.
Task Committee on the Reevaluation of the Adequacy of Spillways of Existing Dams of the Committee onHydrometeorology of the Hydraulics Division of American Society of Civil Engineers, Reevaluating SpillwayAdequacy of Existing Dams, Journal of the Hydraulics Division, Proceedings of American Society of CivilEngineers, 99(HY2), 337-372, 1973.
Task Committee on Spillway Design Flood Selection, Surface Water Hydrology Committee, Hydraulics Division,American Society of Civil Engineers, Evaluation Procedures for Hydrologic Safety of Dams, American Societyof Civil Engineers, New York, NY, 1988.
Risk Analysis for Dam SafetyEvaluation: Hydrologic Risk References
42
Von Thun, J.L., Use of Risk-Based Analysis in Making Decisions on Dam Safety, in Engineering Reliabilityand Risk in Water Resources, (NATO Advanced Study Institute, Tucson, AZ, May 1985), Duckstein, L., andE. Plate (eds.), M. Nijhoff, Dordrecht, the Netherlands, 1987.
Wagner, D.P., M.L. Casada, and J.D. Fussell, Flood Risk Analysis Methodology Development Project, FinalReport, Oak Ridge National Laboratory, Oak Ridge TN, NUREG/CR-2678, June 1982.
World Meteorological Organization, Manual for Estimation of Probable Maximum Precipitation, OperationalHydrology Report No.1, WMO 332, Geneva, Switzerland, 269 pp., 1986.
Yankee Atomic Electric Company, Probability of Extreme Rainfalls and the Effects on the Harriman Dam,Report YAEC-1405, Framingham, MA, April 1984.Appendix A
43
APPENDIX A - ANNOTATED BIBLIOGRAPHY
EVALUATING PROBABILITIES OF PRECIPITATION AND FLOODS
National Research Council, Committee on Techniques for Estimating Probabilities of Extreme Floods,Estimating Probabilities of Extreme Floods, Methods and Recommended Research, 136 pp., NationalAcademy Press, Washington D.C., 1988.
Applying risk-analysis techniques to the problem of dam safety requires estimates of rare floodprobabilities. The Committee's report provides a review and critique of the approaches currently used toapproximate these probabilities. The Committee expresses doubts about applying current estimation techniquesin practice. It states, "Decisions based on risk analysis have become more common in science, engineering andpublic decision-making, yet techniques for estimating the probabilities and associated confidence limits of rarefloods need to be improved considerably" [p. 3]. The committee notes that, "a framework which allows a rangeof floods and their probabilities to be estimated is preferred to an approach that focuses on a single, large flood"[p. 3].
The Committee suggests employing three principles to help with statistical analysis for flood probabilityestimation:
1) Substitute space for time. 2) Increase structure in the statistical and simulation models (for example, by making strong
assumptions about the event recurrence model).3) Focus on extremes. Models which describe the distribution of common events well may not
work as well as models which focus on describing extreme events. The processes involvedin producing extreme and common events probably differ.
The Committee also recommends using all available data, including historical and paleo-flood data,and regional analysis. Using meteorological data in conjunction with runoff models may further improveprobability estimates. Probability estimates should include the results of an uncertainty analysis, whichwould incorporate uncertainty resulting from the models employed in the analysis.
Dawdy, D.R., and D.P. Lettenmaier, Initiative for Risk-Based Flood Design. Journal of HydraulicEngineering, 113(8), 1041-1051, 1987. Discussions by O. Pfafstetter and V. Myers appear in Journalof Hydraulic Engineering, 115(3), 416-422, 1989.
The authors criticize the PMF approach because, "...PMF-based methods tend to lead to a false senseof security and to misallocation of resources for dam safety improvements" [p. 1041]. These problems withthe PMF occur because many people view the PMF as a deterministic, upper limit on possible floods.Because engineers do not use a single, standardized method for PMF computation, "...the true failurerisk...varies from site to site. Therefore, there is an implicit discrepancy in the allocation of public resourcesfor dam failure protection" [p. 1042]
They further criticize a recent inter-agency report for concluding that no viable alternatives to thePMF exist; the authors, however, claim that the action agencies do not fund studies which would lead tobetter methods. They suggest that this conclusion is a self-fulfilling prophecy, and that agency promotionof research in the area would improve techniques and viable alternatives.

44
In an attempt to break the no-research no-alternatives cycle, the authors propose that the agenciespromote research to develop methods for using risk information in spillway design. They suggest fourpotential areas of research which could lead to better estimates of the extreme flood magnitudes andprobabilities needed in risk analysis:
1) Estimation of empirical exceedance probabilities for PMFs,2) Use of regional index flood distributions with regional hydrologic information to estimate
extraordinary flood risks,3) Simulation of floods from extreme rainfall events with analysis of regional rainfall
frequencies and their spatial distributions, and4) Use of paleo-flood and historical flood data to extend gauged records in flood-frequency
analyses. They give an outline of the related technical issues.
Pfafstetter cites precipitation-frequency work which suggests the authors’ estimates of theexceedance probability of large flood events are too low and indicates that estimating exceedanceprobabilities of rainfall makes more sense than estimating these large floods.
Myers notes that, as originally conceived, a "PMP magnitude is a jury decision. A team ofprofessionals saturate themselves with knowledge of the climate and storm behavior, and also withknowledge of consequences of dam over-toppings." He recommends going "probabilistic" because it willclear up identification of the goal of the analysis, allow development of a consensus standard for existingdams, and because the data and computing power are now available. In their reply, both Myers and theauthors discuss the need for a trial study.
Foufoula-Georgiou, E., A Probabilistic Storm Transposition Approach for Estimating ExceedanceProbabilities of Extreme Precipitation Depths, Water Resour. Res., 25(5), 700-815, 1989.
This paper develops a probabilistic storm transposition method which systematically uses storm andbasin data to estimate extreme precipitation frequencies. The author views this as a first step to estimatingthe extreme flood probabilities needed to apply many risk-analysis methodologies. The method is appliedto two hypothetical catchments in Iowa. The tail of the resulting depth-exceedance probability curve issmooth and well behaved, suggesting that extrapolating the curve to very rare events may be promising.
Wagner, D.P., M.L. Casada, and J.D. Fussell. Flood Risk Analysis Methodology Development ProjectFinal Report, Oak Ridge National Laboratory, Oak Ridge, TN, 1982.
This report develops a methodology for estimating the effect of floods on nuclear power plant risk,which can be appended to a probabilistic risk assessment. The authors discretize the flood damage functioninto mutually exclusive "damage levels". They propose using the decomposition philosophy intrinsic to faulttree and event tree methods to calculate the probability and frequency of these damage levels. This methodrequires knowledge of the probabilities of the sets of events leading to each damage level. The authors notethat determining the sets of events which cause failure in a complex system may be "impossible orimpractical"; this difficulty limits this method's use in practice.
APPENDIX B - DESCRIPTION OF MODEL USED IN SAMPLE ANALYSIS
45
EVALUATING PROBABILITIES OF FAILURE
Bowles, D.S., Verde River Risk Assessment: an Interim Solution Study, paper presented at the 8thannual USCOLD Meeting, Phoenix, AZ, January 1988.
Pointing to risk assessment's explicit handling of quantitative risk, the author advocates using thisapproach to solve dam safety problems in three cases:
1) to determine the appropriate safety level for low-hazard dams,2) to assess options for reducing risk at dams with insufficient spillway capacity, and3) in cases where decision-makers question the applicability of the usual design standards.
Risk assessment provides probabilistic, economic and safety information which helps to establish usefulalternative solutions. The author outlines other roles of risk assessment in dam safety evaluation, thedevelopment of risk models using event tree analysis, and the estimation of the probabilities and outcomesof pertinent events.
The author uses the example of the Verde River Risk Assessment Project, which was establishedto find interim solutions to an inadequate spillway problem for a dam located on the Verde River. The authorstates that, "Such an approach does not challenge the need for permanent solutions that meet the currentlyaccepted design standards, rather it challenges the wisdom of doing nothing while waiting for the 'ultimatefix'" [p. 5-36].
Prendergast, J.D., Probabilistic Concept for Gravity Dam Analysis, Special Rep. M-265, 68 pp.,Construction Engineering Research Lab., U.S. Army Corps of Engineers, Champaign, IL, 1979.
The author discusses the value of a probabilistic approach in the area of dam safety and presentsmodels to evaluate the safety of concrete gravity dams. Engineers traditionally design dams conservativelybecause they have little quantitative information about the forces a dam faces or the resistances it exerts.Although dams have many possible failure modes (including piping and overtopping) there currently exists"no systematic way of analyzing the degree of uncertainty and its effect on the safety of a design" [p. 9].Moreover, due to a lack of scientific knowledge engineers usually do not know the factors of safety for eachfailure mode. However, the author states that, "lack of statistical data is not a valid reason for rejectingprobabilistic concepts and methods. Indeed, it is only through probabilistic models that the significance ofobjective information, or lack thereof, can be properly assessed and combined with engineering judgment toprovide a quantitative assessment of the safety of a dam" [p. 63].
The author provides load and resistance models to evaluate safety in terms of the uncertainty in asystem's parameters. Uncertain parameters include the height of the water in a reservoir and the earthquakeacceleration coefficient. The models use reliability theory to approximate failure probabilities to the firstorder given probability distributions for all of the system's parameters. Deciding which distributions to usepresents a problem because of the limited data available to describe distributions for the extreme events ofinterest. Furthermore, the distributions chosen may affect results when the failure probability is small.Prendergast applies the models he develops to two simple examples.

46
Cheng, S., B.C. Yen, and W.H. Tang, Overtopping Risk for an Existing Dam, Civil Engin. Studies,Hydraulic Engin. Series No. 37, 195 pp., University of Illinois at Urbana-Champaign, Urbana, IL,1982.
The authors state that the US dam safety inspection program "lacks the systematic and scientificbasis for quantitative assessment of the safety of dams" [p. 4] and suggest that safety studies require aprobabilistic approach. They compare several methods for estimating the risk of overtopping at a dam,including Direct Integration, Monte Carlo, Mean-Value First-Order Second-Moment (MFOSM), andAdvanced First-Order Second-Moment (AFOSM) analyses. The authors examine several geophysical forceswhich may cause overtopping of a dam. They then concentrate on floods and wind and only touch onlandslides and earthquakes. To estimate the probability of overtopping, the authors use fault tree analysisand assume that the extreme events that may cause overtopping arrive with a Poisson process.
The MFOSM approximates the dam's performance function by using a Taylor Series expansionabout the mean value of the performance function; the AFOSM method uses a Taylor Series expansion aboutthe failure point (an extreme area of the performance function). They conclude that while the Monte Carlomethod is superior with respect to accuracy, invariance, and sensitivity, the AFOSM method's lowercomputational costs make it the best overall. The paper includes a demonstration of the AFOSM procedureusing an example earth dam. The authors note difficulty in finding the true risk because most models neglectvariables which may be important. In their study, flooding causes most overtopping; wind has a muchsmaller effect.
Kreuzer, H., and K. Bury, A Probability Based Evaluation of the Safety and Risk of Existing Dams,Proceedings of the International Conference on Safety of Dams, 61-71, Coimbra, Portugal, 1984.
Typically engineers calculate safety factors using single deterministic values for load and resistanceand use the ratio of their means to describe the degree of safety for a project. In reality, a dam's load andresistance are uncertain. The authors develop a probabilistic method for evaluating dam safety. They electto use failure probability as the safety criterion. The five failure modes considered are:
I. AgingII. Persistent OvertoppingIII. Transient OvertoppingIV. EarthquakeV. Foundation Instability
They consider three means for resisting failure: Material Strength, Shear Resistance, and Erosion Resistance.For each failure mode, the probability of dam failure due to that mode is estimated analytically:
First, the authors decide which mechanisms will resist failure and employ a normal probability distributionfunction to describe that resistance. Second, they use a Gumbel distribution to describe each load. Both ofthese steps use experimental data to estimate the parameters of the distribution. Third, they calculate theinterference of these two distributions, the probability that the load exceeds the resistance. At this point,engineers can compare these failure probabilities for the different failure modes to determine which is mostlikely. Finally, the sum of the failure probabilities provides an approximation of the dam's safety. decision-
APPENDIX B - DESCRIPTION OF MODEL USED IN SAMPLE ANALYSIS
47
makers can use this number to compare safety levels of different dams. The authors suggest that modifyingthe distributions or the failure probabilities can account for failure modes which lack analytical descriptions.
GENERAL RISK METHODOLOGIES
Bernier, J.M., Elements of Bayesian Analysis of Uncertainty in Hydrological Reliability and RiskModels, in Engineering Reliability and Risk in Water Resources, Duckstein, L., and E. Plate (eds.), pp.405-422, M. Nijhoff, Dordrecht, the Netherlands, 1987.
The author states that two types of uncertainty exist in water resources problems:
1) Natural uncertainty due to nature's randomness, which includes precipitation and riverdischarge. Probability distribution functions can represent this uncertainty.
2) Technological uncertainty results from measurement error, inadequate modeling, and othersimilar errors.
This paper explores the ways in which classical decision theory and Bayesian statistical methods can dealwith technological uncertainty.
The author sets up a reliability model for a system where failures occur as a Poisson process witha natural failure rate, but where the decision-maker can choose to reduce the failure rate at a cost. Theproblem is then to decide how much to reduce the failure rate. Bernier also discusses including decision rules(especially Bayes' Rules) to map the observed system behavior into decisions, and ranking the decision rulesin terms of value using the "risk function" (the expected loss associated with a decision rule). Bernierconsiders using pre-posterior analysis to determine the value of information and experimentation.Haimes, Y.Y., and W.A. Hall, Sensitivity, Responsivity, Stability and Irreversibility as MultipleObjectives in Civil Systems, Advances in Water Resources, 1(7), 71-81, 1977.
The authors propose that water resources management models should consider sensitivity,responsivity, stability, and irreversibility as objectives in a multi-objective analysis framework where:
Sensitivity relates changes in the system's performance index (or output) to possible variations in thedecision variables, constraint levels and uncontrolled parameters...Responsivity represents the ability of the system to be dynamically responsive to changes...in thedecisions...Stability relates to the degree of variation of the mean system response to fixed decisions...Irreversibility measures the degree of difficulty involved in restoring previous states or conditions oncethe system has been altered by a decision.
They suggest that these characteristics can be given quantitative values, and that decision-makers shouldexplicitly control them. The authors assert that an easily calculated, pertinent, and understandable "index"should represent each of the characteristics in multi-objective analyses.
Errors affect a model's characteristics. The authors identify six sources of error:
1) model structure
48
2) model parameters3) model scope4) data5) optimization techniques6) human subjectivity.
The authors assume that analytical functions relate the errors to the system characteristics.
Hashimoto, T., J.R. Stedinger, and D.P. Loucks, Reliability, Resiliency, and Vulnerability Criteria forWater Resource System Performance Evaluation, Water Resour. Res., 18(1), 14-20, 1982.
The authors argue that the mean and variance of a system's outputs, often used in practice to choosebetween alternative water resource system proposals, may not adequately describe system performance. Themean and variance may not illustrate the severity and frequency of failures in systems and cannot tell whetheran alternative with an improved mean output but higher variance is an overall improvement.
They advocate using risk-related performance criteria to better communicate how a water resourcesystem might operate. Reasonable criteria include:
Reliability - the system failure probabilityResiliency - the speed with which the system returns to a satisfactory state after a failureVulnerability - the likely severity of failures when they occur
Use of these criteria with traditional expected benefits and costs in multi-objective analyses mayallow decision-makers to see the trade-offs between conflicting objectives and attributes of systemperformance. Decision-makers should realize that attempting to increase reliability (for example by raisingthe height of a dam) may also increase vulnerability (the damages and loss-of-life which occur if the damfails). Pointing to the need to recognize low-probability but high-consequence failures, the authors suggestthat vulnerability should be an important criterion in project planning.
Fiering, M.B, A Screening Model to Quantify Resilience, Water Resour. Res. 18(1), 27-32, 1982.
The author defines resilience as a system's ability to accommodate and recover after surprises.Establishing a water resource system by simply minimizing cost may lead to "brittle" (unresilient) systems.
The author studies the problem of locating reservoirs among 8 possible parallel sites. The resultsshowed that the system's resilience increases with the number of design options. Systems with more optionsare also more amenable to political and institutional negotiations. The author concludes that simple costcriteria may not capture the importance of a system's redundancy, which has a significant influence on itsflexibility in unusual situations, and its ability to return to normal after a disaster.
Hashimoto, T., D.P. Loucks, and J.R. Stedinger, Robustness of Water Resources Systems, WaterResour. Res., 18(1), 21-26, 1982.
The authors propose "robustness", a "measure of the likelihood that the actual cost of a proposedproject will not exceed some fraction of the minimum possible cost of a system designed for the actual futureconditions" [p. 21], as a criterion for project planning. A project which engineers can modify in a cost-
APPENDIX B - DESCRIPTION OF MODEL USED IN SAMPLE ANALYSIS
49
effective manner to meet a range of actual conditions may be considered more desirable than one that is costeffective only for the most likely demand condition" [p. 21]. Decisions should account for possible (adverse)effects which may result when future conditions do not match those anticipated during the project's planning.
The authors show that using expected project costs and cost variance to choose between alternativesmay not adequately account for this uncertainty. Their criterion, "robustness", describes the ability of adesign or proposed project to deal with uncertain future conditions. Adapting a robust project to conditionsdifferent from those for which the system was designed should cost less than if a less robust design had beenadopted.
Duckstein, L., E. Plate, and M. Benedini, Water engineering reliability and risk: a system framework,in Engineering Reliability and Risk in Water Resources, Duckstein, L., and E. Plate (eds.), pp. 1-20,M. Nijhoff, Dordrecht, the Netherlands, 1987.
The authors set up a general framework which decision-makers can use to compare the consequencesof alternative decisions and operating rules in a multiple-criteria analysis. A discrete-time, discrete-statemodel approximates the system's behavior. The framework consists of the following components:
1) Inputs, both controllable and uncontrollable2) System state variables3) The state transition function4) Output (performance indices)5) The output function, which may be a "figure of merit" (some combination of performance
indices, calculated from sequences of observances).
An "incident" occurs when the load on the system exceeds the system's resistance. The authorssuggest 10 performance indices and illustrate their calculation with alternative operation rules for a reservoirin the Black Forest in Germany.
Reid, S.G., Frequency-Cost Curves and Derivative Risk Profiles, Risk Analysis, 7(2), 261-67, 1987.
The paper discusses the presentation of the risk and cost information from a risk-analysis study andsuggests that total expected costs and the distribution of expected costs should have great importance todecision-makers. He indicates that the commonly used frequency-cost curves (which actually showcumulative or exceedance frequency versus cost) do not show expected costs and may even conceal rare,catastrophic events which may contribute significantly to total expected costs.
The author suggests the use of total expected costs and several new functions: the "frequency densityfunction", the "expected cost density function", and the "cumulative expected cost function". The authorgives graphical examples of the functions he recommends based on a widely quoted example from a NuclearRegulatory Commission study. The study includes a frequency-cost curve showing that 100 nuclear powerplants and meteorites result in quantitatively similar risk spectrums.

50
The author derives the "frequency density function" which shows the frequency of occurrence ofdifferent events as a function of their magnitude. In constructing a frequency density function for the NRCexample, the author extends the frequency-cost curve into extreme damage levels. The resulting frequencydensity function for this example suggests that meteorites will result in catastrophic losses more often thanthe power plants.
The author derives a third type of function, the "expected cost density function", which shows thedistribution of expected costs as a function of costs. Using the NRC example, the author constructs theappropriate expected cost density function which suggests that the density of expected costs for the powerplants becomes small at fatality levels greater than 10 . By contrast, the expected cost density function for4
meteorites does not reach such small levels until fatalities are greater than 10 .7
Integrating the expected cost density function over cost yields a fourth function, the "cumulativeexpected cost function". For large costs, this function approaches the total expected costs due to all events.For the NRC example, the cumulative expected cost functions suggest that meteorites will cause significantlymore fatalities per year than 100 nuclear power plants, with most of the expected costs due to events causing1000 or fewer fatalities.
ECONOMICS AND PLANNING
Task Committee on the Reevaluation of the Adequacy of Spillways on Existing Dams of theCommittee of Hydrometeorology of the Hydraulics Division, Reevaluating Spillway Adequacy ofExisting Dams, Journal of the Hydraulics Division, Proceedings of the American Society of CivilEngineers, 99, No. HY2, 337-372, 1973.
When evaluating actions to modify dam spillways, the Committee proposes that an economicanalysis of risk costs and modification costs determine the appropriate modification. The best modificationwill minimize the sum of these costs. They also make the controversial suggestion that engineers shouldassign a monetary value to human life in the analysis, stating that "the engineering profession should delayno longer the use of monetary human values in the economics of spillway design" [p. 341].
They extend the proposal to new dams, stating that "standards to judge adequacy of spillways ofexisting dams should not differ from standards for the design of proposed new dams" [p. 339]. TheCommittee criticizes the use of the PMF as a design standard because it "overlooks the difference betweenthe loss of a few lives or many lives and offers no measure of the magnitude of property damage" [p. 341].The authors illustrate use of the procedure with a study of an example dam.
Baecher, G., M.E. Paté , and R. de Neufville, Risk of Dam Failure in Benefit-cost Analysis, WaterResour. Res., 16(3), 449-456, 1980.
The authors propose that benefit-cost analyses for new dams incorporate the economic costs of damfailure by deducting the expected cost of failures from net project benefits. Economic failure costs includeproperty damage, the value of lost future dam benefits, lost economic activity, and emergency costs. Failurecosts change over time in response to economic development. The analysis does not account for possiblechanges in downstream demographics and the location of property after a dam failure. They note that

APPENDIX B - DESCRIPTION OF MODEL USED IN SAMPLE ANALYSIS
51
adoption of a project whose failure would cause loss of human life at least implicitly assigns some value tosuch losses.
The authors conduct an analysis of dam failure data and find that about half of all dam failures occurwithin five years after construction, with the other half distributed fairly uniformly with age. However,pending further studies they suggest that economic analyses use a constant failure rate of 10 /year.-4
Paté -Cornell, M.E., and G. Tagaras, Risk Costs for New Dams: Economic Analysis and Effects ofMonitoring, Water Resour. Res., 22(1), 5-14, 1986.
Paté -Cornell and Tagaras [1986] continue the argument made by Baecher et al. [1980] for includingrisk costs in cost-benefit analyses and expand the methodology for risk cost evaluation to dams in a series.In the case of a project consisting of building a new dam in sequence with an existing dam, they state thatthe cost-benefit analyses should consider the marginal risk cost associated with the new dam, which includesits interaction with other structures.
As illustrated by three real-world examples, (Teton Dam in Idaho, Dickey-Lincoln School Projectin Maine, and Auburn Dam in California) the authors show that risk costs (expected costs) can have animportant effect on a project's benefit-to-cost ratio when the dam has a large or heavily populated floodplainand the project costs and benefits are relatively small. The dam failure probability and the value of life usedin the analysis can be important. Including risk costs in analyses with large failure probabilities (10 /year)-3
and/or a $1 million value per life markedly decreases the benefit-to-cost ratios for Teton Dam and AuburnDam. Accounting for the expected cost of failure allows the decision-maker to more nearly maximizeexpected social utility. The authors argue that managers can implement warning systems which can, whileimperfectly, still decrease risk costs and the expected loss-of-life.
Paté -Cornell, M.E., Warning Systems in Risk Management: the Benefits of Monitoring, in RiskAnalysis and Management of Natural and Man-made Hazards, pp. 253-67, Haimes, Y.Y., and E.Z.Stakhiv (eds.), American Society of Civil Engineers, New York, NY, 1989.
The author presents a methodology for probabilistically evaluating and optimizing warning systems.Models describing a warning system's signal, response, and consequences are combined to formulate warningsystem benefits. A Bayesian framework is used to calculate the value of warning information for ahypothetical earth-filled embankment dam, neglecting the effect of false alerts on people's willingness torespond (the cry-wolf effect).
Focusing on human response to warnings, the author distinguishes between systems with frequentwarning events and those in which warnings occur rarely. In the former case, memories of past warningsystem performance will affect response. To describe this effect, the author discusses 3 models: a non-parametric Markov model, a parametric model, and a normative model. The optimal system sensitivitydepends on the trade-off between early warning and the cry-wolf effect. When warning events occur rarely,the cry-wolf effect will not be important, and the author discusses psychological and sociological responsemodels for such situations.
52
RISK AND COST BASED PLANNING METHODOLOGIES
McCann, M.W., Jr, J.B. Franzini, E. Kavazanjian, and H.C. Shah, Preliminary Safety Evaluation ofExisting Dams, Vol. 1-2, Rep. 69, John A. Blume Earthquake Engineering Center, StanfordUniversity, Stanford, CA, 1985.
This report, prepared for the Federal Emergency Management Agency, proposes a screeningprocedure using risk analysis for allocating funds to upgrade safety across a set of dams. The techniquesused are relatively simple and intended to save money, or at least allocate a budget reasonably. The authorsstress that these techniques only predict relative, not absolute, risk.
Volume I contains the theory behind the screening process which combines Bayesian analysis withclassical decision theory. This process can prioritize dams for allocating funds either to upgrade safety orto do more extensive studies. The prioritizing process constitutes an example of decision-making underuncertainty. The process consists of two steps: 1. assessing safety and 2. creating a rule for ranking thedams. Volume II provides a users manual for the screening process. This method is primarily intended tohelp dam safety managers who must upgrade safety within a budget.
National Research Council, Committee on Safety Criteria for Dams, Water Science and TechnologyBoard, Safety of Dams: Flood and Earthquake Criteria, 276 pp., National Academy Press,Washington, D.C., 1985.
The report provides an overview of dam safety criteria and issues. The Committee discusses threealternative approaches to evaluating dam safety:
1) The Deterministic Approach with its safety criteria based on the PMF2) The Probabilistic Approach with its safety defined as a flood with a specified exceedance
probability3) Risk Analysis which determines the appropriate level of safety from an economic analysis of
risks and prevention costs
While the Committee feels that risk analysis might be useful, they note that actually applying riskanalysis in practice has several problems. Risk-analysis studies may be expensive to conduct and the resultsmay be sensitive to imprecisely known probabilities of extreme hydrologic events.
With regard to the PMF (deterministic) criteria, the Committee notes several problems with thatapproach too. For many regions of the country, estimates of the PMF have increased in recent years due toincreased data and new estimation methods. This has necessitated reevaluation of dam safety and the needfor remedial actions. In addition, designing for the most recent PMF estimate may not provide as muchsafety as the phrase "probable maximum flood" implies. The Committee notes that a dam which could passthe latest estimate of the PMF for the site is not necessarily safe for any possible flood. The inability of themethod to allocate economic resources efficiently is another problem. "Some Committee members felt sucha design basis, in some cases, results in extravagant use of resources...." [p. viii]
The Committee recommends that engineers continue to use the PMF as the Safety Evaluation Flood(SEF) for proposed new high-hazard dams. It stresses the importance of using incremental damages
APPENDIX B - DESCRIPTION OF MODEL USED IN SAMPLE ANALYSIS
53
(damages in excess of those which would occur if the dam did not exist) for safety analyses. Theyrecommend that engineers use an SEF smaller than the PMF in cases where the PMF would not cause more(incremental) damage than the lower SEF.
Engineers may use different standards for existing dams. For existing high-hazard dams whichcannot pass their SEF, the Committee recommends using risk analysis to aid in (retrofit) decisions. TheCommittee notes that risk analysis provides a site-specific and rational method for allocating (retrofit) funds.
Task Committee on Spillway Design Flood Selection, Surface Water Hydrology Committee,Hydraulics Division, Evaluation Procedures for Hydrologic Safety of Dams, American Society of CivilEngineers, New York, NY, 1988.
The Task Committee proposes methods for determining safety design floods for both new andexisting dams based on a quantitative risk assessment, which use the likelihood and consequences of damfailures. The consequences of dam failure and the effort required to select a safety design flood form thebasis for the Committee's proposal to place dams into three categories. For Category 1 dams, failure wouldhave very high consequences, and the Committee recommends using the Probable Maximum Flood (PMF)as the safety design flood. Failure of Category 3 dams would result in modest damages, and the dam ownerwould suffer all or most of that damage. In this case, the safety design flood may be lower than the PMF ifa lower safety design flood would benefit the dam owner economically. Both Category 1 and Category 3dams require only a "reconnaissance level" investigation to determine failure consequences. Category 2 damshave damages somewhere between Category 1 and Category 3 damages, and the Committee recommends adetailed study to select a safety design flood based on failure probability, failure consequences (monetary andother costs), and retrofit and construction costs.
With respect to Category 2 dams, engineers should estimate the PMF and use the economic andsocial consequences of failure in a decision-making process based on a quantitative risk analysis. Theappropriate safety design flood for Category 2 dams is the PMF unless risk analysis justifies a lowerstandard. Although quantifying probabilities for rare events presents a problem for risk analysis in damsafety, "The committee concludes that it is possible to define flood probabilities throughout the full rangeof potential flooding with sufficient accuracy to make the comparisons necessary for the safety design floodselection" [p. 4]. Failure costs should only include incremental costs, that portion of the flood damageattributable to dam failure.
The Committee makes the controversial proposal that Category 2 dam owners should at all timesmaintain the funds necessary to pay the prospective victims of a dam failure for potential financial losses(indemnification). The report also recommends considering social and environmental consequences, but notin the indemnification calculation. Dam owners can achieve indemnification by an insurance policy, selfinsurance, or an escrow account. They state that, "The cost of indemnification, rather than the flood damageitself, is taken as the proper measure of damages sustained by parties other than the dam owner...." [p. 19]The Committee anticipates that if the proposed quantitative risk-analysis process is generally adopted, thetechnical aspects of the analysis will improve with use. [p. 4]

54
Bureau of Reclamation, Guidelines to Decision Analysis, ACER Technical Memorandum No. 7, U.S.Department of the Interior, Bureau of Reclamation, Denver, CO, 1986.
This report summarizes the Bureau of Reclamation's recommended guidelines for dam safety studies.It provides general and simple step-by-step instructions for performing an analysis to evaluate alternativesolutions to engineering problems, and the resolution of dam safety issues in particular. This framework canbe used to evaluate new dams or modifications to existing dams. The evaluation focuses on determining riskcosts: "the expected value of the risk and adverse consequences for a given hazard." The framework consistsof the following steps and associated questions which determine the appropriate analysis for a project:
1) Define the Problem2) Describe the Pertinent Site Conditions3) Identify the Potential Loading Conditions4) Determine the System Response
Will the system fail under the prescribed loading?
5) Perform the Hazard Assessmenti) For failure events, are the downstream consequences worse than the non-failure
consequences?ii) Is a risk cost analysis required?
6) Calculate the Risk Costs7) Develop and Evaluate Alternative Actions
Establish appropriate decision criteria (see below) and repeat analysis in steps 4-6.
8) Prepare Appropriate Documentation
A sensitivity analysis comprises an integral part of the framework. It should show theimportance of uncertain parameters, functions, and models used to calculate risk costs. An example analysisfor an embankment dam illustrates the use of this decision analysis framework. Factors which areappropriate for objective, comprehensive, and informed decisions, in "recognition of costs and benefits"include:
1) potential loss-of-life and any change,2) potential property damage and significant change,3) probability of dam failure and its value relative to historical failure rates and those for an
average dam,4a) relative magnitude of the failure and the owner and region's ability to tolerate such a loss,4b) potential loss of public confidence and potential suits against government officials,5) benefit-cost (and B/C ratio) economic analysis6) relative size of modifications to total project, funding availability, and confidence in
modification, and7) other factors, including site-specific issues and precedents.

APPENDIX B - DESCRIPTION OF MODEL USED IN SAMPLE ANALYSIS
55
The report concludes that such "decision analysis should serve as the primary technical input to thedecision-making process."
Stakhiv, E.Z., and D. Moser, Guidelines for Evaluation of Modifications of Existing Dams Relatedto Hydrologic Deficiencies, IWR Report 86-R-7, Office of the Chief Engineer, U.S. Army Corps ofEngineers, Fort Belvoir, VA, October 1986.
The authors propose a hazard assessment procedure to aid in spillway retrofit decisions. Themethod aids in decisions between alternatives, based on a comparison of the economic consequences andpossible loss-of-life with and without each alternative under both failure and non-failure conditions. PhaseI of the procedure includes a screening process to determine if a dam's spillway needs upgrading to thePMF and a method for evaluating alternative remediation plans for those dams which require remediation.Phase I includes:
Describing the Physical Project CharacteristicsDetermining the Existing Threshold FloodDetermining Total Flows and Downstream Inundation from the Threshold Flood "with andwithout" Dam Failure and from Lesser FloodsDetermining Hypothetical Maximum FloodingPreparing Inundation Maps and Collecting Data on Damageable Property and Populationsfor the Hypothetical Maximum Flooding, the Threshold Flood, and lesser eventsDetermining Economic Losses from the Threshold Flood and Specified Lesser FloodsDetermining Dam Failure Warning TimeDisplaying Existing Condition Results and Proposing Additional ActionIdentifying Alternatives to Reduce the Dam Safety Hazard to People and PropertyEvaluating the Costs of Modification AlternativesEvaluating the Alternatives in Terms of their Effectiveness in Reducing the HazardDetermining the Base Safety ConditionRecommending an Alternative to Meet the Base Safety ConditionDetermining whether Breaching the Dam should be Evaluated as an Alternative
The authors include an illustrative example of the Phase I procedure. Phase II presents risk-cost analysistechniques.
56
SAMPLE RISK STUDIES
Langseth, D.E., and F.E. Perkins, The Influence of Dam Failure Probabilities on Spillway Analysis,Proc. of the Conference on Frontiers in Hydraulic Engineering, 459-464, American Society of CivilEngineers, New York, NY, 1983.
Traditionally, engineers have designed spillways by choosing a spillway design flood based on theflood record. This approach implicitly accounts for the probability of failure. However, the paper showsthat this approach ignores important complexities in the trade-off between spillway size and safety. Theauthors employ a water routing model for a catchment, with runoff emptying into a dam, out into a riverchannel, and by potential damage sites. Their model assumes a known distribution for reservoir inflow,antecedent reservoir conditions, the reservoir state at which overtopping failure occurs, and the state atwhich non-overtopping failure occurs. The simplicity of their model (only three random variables, allindependent of each other) allows the authors to estimate a distribution for damages using directenumeration. This technique discretizes the events into intervals, assigning a "representative" event andprobability to each range. For every possible combination of representative events the model yields adamage level, and for each damage level probability theory yields a probability. To illustrate the model's use, the authors apply it to four earth-filled dams in New England whichhave different levels of safety. Results show that expected damage at a site does vary with spillway size,but not in the way that engineers have traditionally assumed. Engineers have generally thought that saferdams have larger spillways. [p. 464]. However, the interaction between non-failure damage (whichincreases with larger spillways) and overtopping failure damage (which decreases with larger spillways)results in total expected damages which can "increase, decrease, or pass through a minimum as the spillwaysize increases" [p. 464]. The distribution of damage depends on the damage function and the damcharacteristics. The authors conclude that the risk analysis approach may provide valuable insights thattraditional deterministic methods do not.
Stedinger, J.R., and J. Grygier, Risk-Cost Analysis and Spillway Design, in Computer Applicationsin Water Resources, edited by H.C. Torno, pp. 1208-17, American Society of Civil Engineers, NewYork, NY, 1985.
The authors elaborate on their proposal in the National Research Council report [NRC, 1985] touse risk analysis for balancing between economic damages due to floods and dam failure, and the cost ofstructural and other modifications in spillway retrofit decisions. Using a simple example dam (whosecurrent spillway cannot pass the most recent PMF estimate), they examine the sensitivity of risk analysesto several parameters, including the PMF's return period and magnitude. They estimate the frequenciesof rare floods by extrapolating from a known frequency distribution for common floods to a PMF with anassumed return period.
The results of their example show that the return period assigned to the PMF in the analysis andthe distribution function chosen to extrapolate from the known frequency curve to the PMF can influencethe ranking of alternatives primarily because of its impact on the probability assigned to the less rare floodsin the indicated range. Making an error with respect to the damage function seems less important.
APPENDIX B - DESCRIPTION OF MODEL USED IN SAMPLE ANALYSIS
57
Resendiz-Carrillo, D., and L.B. Lave, Optimizing Spillway Capacity with an Estimated Distributionof Floods, Water Resour. Res., 23(11), 2043-2049, 1987.
The authors argue that emergency spillways for large dams should be sized to minimize total socialcost by
1) estimating the distribution of peak flows from historical data,2) estimating the relationship between spillway capacity and cost,3) estimating the losses from dam failure and also lesser floods which would not cause dam
failure, and finally4) minimizing net social cost, which is the sum of construction costs and the present value of
expected damages due to floods and dam failure.
They observe that "preventing dam failure is not an end in itself, but rather a way of controlling flood lossesand preserving an expensive investment."
The authors provide an illustrative example for a hypothetical dam on the Rio Grande River atEmbudo, New Mexico. Based on a naive and sample-specific analysis, they argue that 20 years of annualflood data would be sufficient to provide a "reasonable characterization" of the 500-year flood for the siteusing maximum likelihood estimators for the extreme value type 1 (EV1) distribution [which are known tobe stable estimators, but are only accurate if the data is actually from an EV1 distribution]. The example alsoassumes that flood damages do not vary with spillway and dam size, and that the damages caused by a dam-failure flood would be no worse than those caused by the flood had the dam not failed; thus, the issue is onlyhow big to build the spillway given the replacement cost of the structure should it be destroyed byovertopping.
Their analysis does not consider either the interaction between spillway size and reserved floodcontrol storage capacity or the volume and timing of inflow hydrographs, which together determine if thereis sufficient capacity to store the difference between inflow and outflow in the dam without overtopping. Intheir conclusion, the authors note that sizing dam spillways is an important and difficult decision, and thattheir method offers a "systematic approach that uses available data and can be subjected to scientificevaluation."
Haimes, Y.Y., Petrakian, R., P.-O. Karlsson, and J. Mitsiopoulos, Multi-objective Risk-partitioning:an Application to Dam Safety Risk Analysis, IWR report 88-R-4, 106 pp., U.S. Army Institute forWater Resources, Fort Belvoir, VA, 1988.
The authors suggest that while traditional statistical techniques may be appropriate for assessingrisk, they may not constitute an appropriate method for solving risk-management problems. The traditionalexpected value approach "is inadequate and may lead to fallacious conclusions when applied to risksassociated with extreme and catastrophic events and where public policy issues are involved" [p. ix]. Theynote that expected values commensurate events of low probability and high consequence with those of highprobability and low consequence. This commensuration "... distorts, and almost eliminates, the distinctive
58
features of many viable alternative policy options that could lead to the reduction of the risk of dam failure"[p. xi].
The authors endorse using traditional expected values in conjunction with a conditional expectationthat represents the consequences from low-probability events. Analysts can use the partitioned multi-objective risk method (PMRM) to generate the conditional expectation. Evaluating the applicability of thePMRM to a real "idealized" dam "...showed that the PMRM was indeed superior to the use of theunconditional expected value" [p. x].
Sensitivity analyses of the results show that the PMRM's conditional expectation is sensitive to boththe return period assigned to the PMF and the distribution chosen to extrapolate between the flood frequencycurve and the PMF. The traditional unconditional expectation demonstrates little sensitivity to these factors.The authors state, "Contrary to the conclusions advanced by the traditional unconditional expectation of risk,the proper and representative value of the return period of the PMF used in the analysis of dam safety hasmajor significance" [p. xii].
Karlsson, P., and Y.Y. Haimes, Risk-Based Analysis of Extreme Events, Water Resour. Res., 24(1),9-20, 1988.
Problematic decisions which involve risk have traditionally been based on mathematicalexpectations. The authors state that this approach is "not appropriate for decision-making that affects publicpolicy because it conceals extremes by commensurating events of different magnitudes and probabilities ofoccurrence" [p. 7]. They argue that people have an aversion to catastrophes, and because of this, decisionmethodologies should give catastrophes greater weight than they receive using traditional expected costs.
The partitioned multi-objective risk method (PMRM) provides a set of conditional risk functionswhich represent the loss, given that the exceedance probability for the damage event falls within specificprobability ranges. The authors advocate using such conditional damage functions in the decision-makingprocess. They derive a closed form expression for the conditional damage function when only a singlerandom variable affects damage.
Karlsson, P., and Y.Y. Haimes, Probability Distributions and Their Partitioning, Water Resour. Res.,24(1), 21-29, 1988.
The PMRM (discussed above) partitions a probability distribution function's probability axis intoranges to define conditional risk functions. The authors show that the risk functions depend on the chosenprobability ranges and on the distribution used to fit the available data to the original, unpartitionedprobability distribution function. The authors quantify the sensitivity with respect to the partition ranges andprovide several approximate formulas.

APPENDIX B - DESCRIPTION OF MODEL USED IN SAMPLE ANALYSIS
59
Petrakian, R., Y.Y. Haimes, E. Stakhiv, and D. Moser, Risk Analysis of Dam Failure and ExtremeFloods, in Risk Analysis and Management of Natural and Man-made Hazards, pp. 81-121, Haimes,Y.Y., and E.Z. Stakhiv (eds.), American Society of Civil Engineers, New York, NY, 1989.
The authors apply the PMRM to a dam safety example with the Surrogate Worth Trade-off Method(SWTM). They examine the sensitivity of the method's results to the partitioning of the probability axis, thereturn period assigned to the PMF, and the extreme flood distribution. They conclude that thePMRM/SWTM combination can be implemented easily and that it can improve decision-makers'understanding of problems. Their analysis shows that the results are sensitive to the PMF's return period andthe chosen flood distribution. The conditional expectations for the partitions exhibited what is thought tobe an "undesirable" sensitivity to the choice of partitioning points, and reversals in the ranking of alternativesoccur, especially when failure damages are of the same order as non-failure damages. The authors suggestpartitioning the damage axis as a possible solution.
Karlsson, P.-O., and Y.Y. Haimes, Risk Assessment of Extreme Events: Application, J. WaterResources Planning and Management, 115(3), 299-320, 1989.
Using a revision of Stedinger and Grygier's 1985 example, the paper explores the use of PMRM,and PMRM based upon partitioning of damages by calculating the conditional expected damages given thatan event is in a damage range. With damage partitioning, the conditional expectations of damages in thehigh-risk interval vary little from alternative to alternative and are not much larger than the lower endpointof the most extreme interval. The authors also see the results as being less intuitive. They develop analyticalapproximations for the low-probability partition's conditional expectation, f , which are useful for problems4
with a single random variable (such as flow) and a continuously differentiable and monotone loss function.Calculations of f (partitioning at the PMF so that only larger events are considered) and of the unconditional4
expected damages illustrate trade-offs among six alternatives with five different flood distributions and twoPMF return periods. When f corresponded to floods greater than the PMF, the authors observe that fitting4
a thin-tailed distribution between the 100-year flood and the PMF with a specified return period (the two-point method) yields smaller f values than if a thicker-tailed distribution is used; this is in contrast to Haimes4
et al. [1988] who observe the opposite when considering only floods less than the PMF in the calculation off . The paper also observes that the unconditional expected damage is very sensitive to the chosen flood4
distribution (as it should be).
DISCUSSIONS OF RISK METHODOLOGIES
Fan, S., Hydrologic Evaluation of Dam Safety, Proc. of the Conference on Frontiers in HydraulicEngineering, 451-458, American Society of Civil Engineers, New York, NY, 1983.
The author presents a general overview of the many techniques used to determine inflow designfloods (IDFs) and their history. The discussion focuses primarily upon the hydrometeorological approachused to obtain PMPs and PMFs, with a few comments upon frequency analysis methods. The author

60
emphasizes the importance of hazard evaluations and the information that they provide about damage,fatalities, and lost revenue.
The author concludes that hydrologic evaluations should include economic information and the dam'sdesign and operation. Lack of data can render flood frequency analyses unreliable, while land use andpossible climate changes can undermine the reliability of historical data used by both the hydrometeorologicaland frequency analysis methods. Hazard analyses should include the potentially significant effects ofaccumulated sedimentation on dam-break damages. The author advocates using a "cost effective" approach(like risk analysis) to determine inflow design floods for low- and medium-hazard dams.
Cooper, C.L., A Case for Selecting Only Deterministic Spillway Design Floods for High Hazard Dams,Water Power '87: Proceedings of the International Conference on Hydropower, 1148-1157, AmericanSociety of Civil Engineers, New York, NY, 1987.
In this article, the author expresses his opinion from his perspective as a Federal official. He arguesthat the use of deterministic probable maximum floods for high-hazard dams where failure would be"unacceptable" over flood frequency methods and risk analyses is supported by Federal Energy RegulatoryCommission (FERC) project files, the 1984 Federal Guidelines for Accommodating Inflow design floods,the 1985 National Research Council Report on Safety Criteria for Dams, and the 2-year study conducted bya Inter-agency Advisory Committee which issued its report in 1986 and which concluded that literatureindicates that "extrapolation of the frequency curve does not provide experimentally defensible estimates offlood probabilities much beyond those defined by the length of record." He is concerned with the humanerror rate in flood studies, which he judges would be lower with PMF studies. He concludes that "floodprobability and risk analyses used to select spillway design floods do not provide the necessary confidencethat public safety requires for the design of high-hazard dams...."
Moser, D.A., and E.Z. Stakhiv, Risk Analysis Considerations for Dam Safety, in EngineeringReliability and Risk in Water Resources, Duckstein, L., and E. Plate (eds.), pp. 175-200, M. Nijhoff,Dordrecht, the Netherlands, 1987.
The authors provide an overview of the many problems which arise when applying different decisioncriteria and risk-analysis methodologies to the evaluation of remediation alternatives to improve dam safety.Public decision-making has incorporated risk analysis into dam safety analyses using three distinctphilosophies:
a) regulatory-type decision processes based on fixed safety standards which designs mustsatisfy resulting in least-cost deign and cost-effectiveness analyses,
b) normative decision-making with explicit or implicit decision rules (including benefit-costanalysis, and maximization of net benefits as in WRC's "Principles and Guidelines"), and
c) "eclectic, relativistic decision-making" based on a multiple objective decision processeswhich explicitly derive importance factors reflecting articulated preferences (multi-objectiveoptimization, multi-criteria utility theory).
APPENDIX B - DESCRIPTION OF MODEL USED IN SAMPLE ANALYSIS
61
Many practicing engineers are reluctant to replace traditional, deterministic worst-case analysisfor dam planning with risk analyses. Public decision-makers may favor using conservative, "worst-case"planning because they are responsible for public safety and legally liable for their decisions. Risk-analysismethods often rely on an expected value which "implicitly weights the outcomes in a manner which maynot be relevant to the evaluation of a low-probability, high-consequence event, such as dam failure. Forsuch events a 'min-max' or 'worst-case' approach seems to be more appropriate than an 'expected value'viewpoint" [p. 177].
The authors also discuss the sources of uncertainty in dam safety analysis including the actual sizeof the PMF, the exceedance probability of the PMF, the probability distribution for floods over the relevantrange, the depth of overtopping needed to cause failure, breaching characteristics of any failure, estimatesof the population at risk and loss-of-life, the operation of warning and evacuation systems, the economiclosses of such an extreme and unique event as a dam failure, and its impact on a region's economy. An example using real reservoir data makes the authors’ point that safety proposals often presentan uncomfortable trade-off because "...decision-makers must consider an incommensurable substitutionof more frequently occurring economic damages (widening the spillway) for a more remote possibility ofan even greater magnitude catastrophic dam failure (raising the dam)...." [p. 191] The authors concludethat the appropriate handling of risk depends on the type of risk, especially whether exposure is voluntaryor involuntary. When risk is voluntary, its effect can be included in a cost-benefit analysis "by modelingindividual choices under uncertainty" [p. 198]. Decisions involving involuntary risk should include equityas an objective as well as economic efficiency.

62

APPENDIX B - DESCRIPTION OF MODEL USED IN SAMPLE ANALYSIS
63
IntroductionAn example in the text illustrates the probabilistic dam-safety risk-analysis procedures proposed
in this report. That example employs physical dam characteristics and hydrologic and meteorologicalparameters similar to a dam in the Northeastern U.S. The characteristics of the hypothetical dam and thedistributions used to describe various random meteorological and hydrologic events are described below.These data are a composite of data describing the dam and its drainage basin, general regionalmeteorological and hydrologic parameters, and reasonable values assigned to complete and to create anillustrative example. This study has drawn heavily upon the report by McCann et al. [1985, Volumes 1-2],Preliminary Safety Evaluation of Existing Dams for the flood routing and dam break models.
Physical Characteristics of the DamThe basic dam is an earth-filled structure which rises from a ground elevation of 931 feet to a crest
elevation of 995 feet. The emergency spillway begins operation when the storage level in the dam reachesan elevation of 976.5 feet. When full to the top of the embankment, the storage pool has a volume of265,500 acre-feet. When full to the spillway crest, the storage pool contains 69,600 acre-feet of water.The total length of the dam is 5,600 feet, including the 150 foot spillway.
Basin Characteristics and Storm HydrographThe drainage basin for the dam has an area of 600 square miles with an elevation difference of
1,000 feet (HW). The total length of the watercourse is 40 miles (LW).The storm hydrograph for rainfall impacting upon the basin was constructed using the model
proposed by McCann et al. [1985, Volume 2, p. 3-7 through 3-9]. Using the Kirpich equation that theyrecommend, the time of concentration (TC) is
TC = [11.9(LW) /HW]3 0.385
[McCann et al., 1985, Volume 1, p. 3-12]. For LW =40 miles and HW = 1000 feet, this equation yieldsa time of concentration for the basin of
TC =12.8 hours.
McCann et al. recommend that the duration of the design storm should be a function of the time ofconcentration. In this case, the design storm would have a length (DSTORM) of 24 hours. The overallhydrograph was constructed from 12 individual triangular unit hydrographs each corresponding to rainfallof duration, DUNIT, of 2 hours, which is calculated as DSTORM/12. The time-to-peak for each unithydrograph was DUNIT/2 + 0.6*TC, or 8.72 hours for our basin. The total length of each unit hydrographwas (8/3) times the time-to-peak, or 23.2 hours for our basin. The peak discharge for the unit hydrographwas 484 *AREA/TP in cfs, for a basin area AREA in square miles and a time to peak, TP in hours, or23,300 cfs for our basin.

64
Following McCann et al. [1985], runoff depended upon the excess precipitation in each two-hourperiod which results from the total rainfall R in each period times both a runoff and dropoff coefficient.i
The dropoff coefficient was assigned a nominal value of 0.80. The runoff coefficient had a value of 0.4in the dry season and 0.9 in the wet season. In future work, time-dependent loss rates may be employed,and the relationship between antecedent moisture conditions and loss rates and the distribution of initialreservoir storage volumes could be modeled.
Reservoir Storage CapacityA critical element of the reservoir model is the storage capacity of the reservoir as a function of
elevation h of the storage pool. Storage is given by the simple power function:
Storage-Capacity(h) = 0 h< 940 feet= 0.361(h-940) [acre-feet], h > 940 feet3.37
This yields a storage volume of 69,600 acre-feet for an elevation of 977 feet, just above the top of thespillway. For an elevation of 995, it yields 265,000 acre-feet at crest full. See Figure B-1.
Initial Storage VolumeThe initial volume of water in storage is modeled as a random variable whose distribution depends
upon the season in question. The model considers a wet and dry season. In both cases, the initial heighthas a beta distribution with a = b = 3. In the dry season, the range of the initial elevation is 950-955 feet.In the wet season, the range is 955-960 feet. For such a beta random variable, the mean height would bethe middle of the indicated ranges, while the standard deviation would be 19% of the interval's width.
Functions for Releases from the DamWater can escape from the dam in three ways:
1) through the sluiceway outlet works,2) over the spillway, and3) over the the dam's crest if it is overtopped.
The characteristics of each are described below.
Sluiceways. Discharge from the dam is allowed by two semicircular conduits when the elevation ofthe storage pool is above 948 feet and six sluice gates when the elevation of the storage pool is above 960feet. The potential release as a function of elevation h is:
Sluice-Outflow(h) = 0, h < 948 feet= 12,000(h-948)/(960-948) 948 < h < 960 feet= 12,000+(21,000-12,000)(h-960)/(995-960) h > 960 feet
As noted below, an operating policy was assumed that resulted in smaller releases through the sluicewaysand conduits.
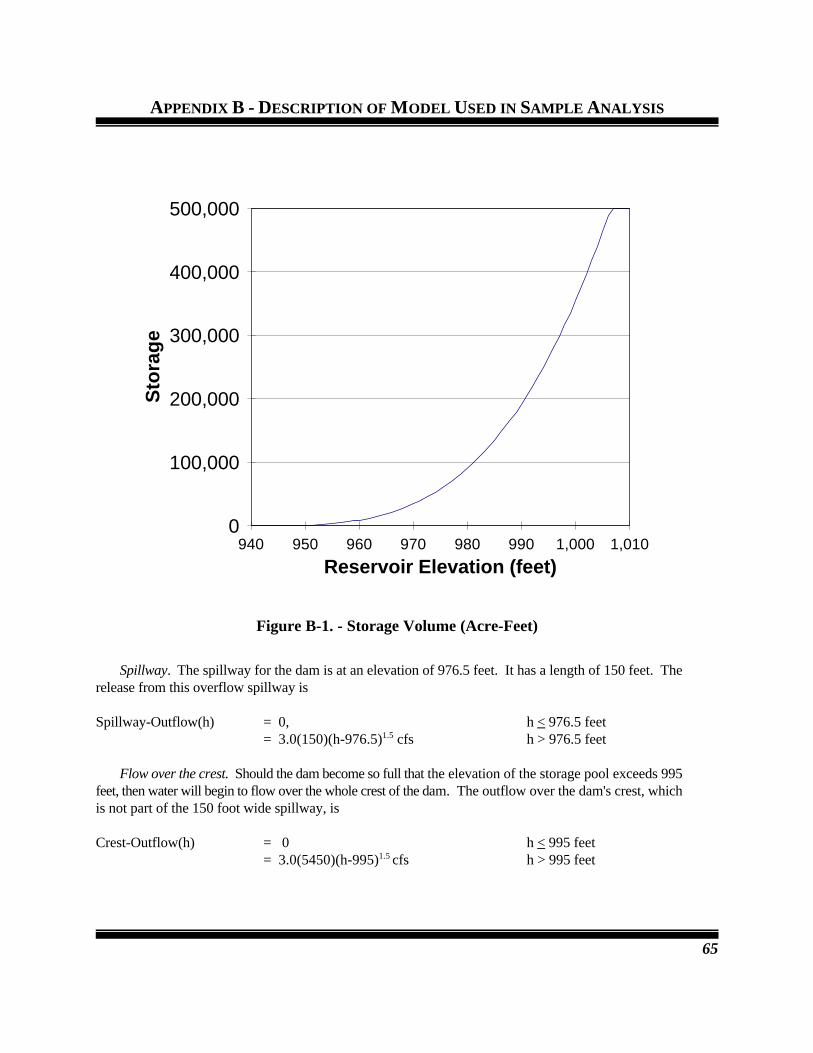
940 950 960 970 980 990 1,000 1,0100
100,000
200,000
300,000
400,000
500,000
Reservoir Elevation (feet)
Sto
rag
e
APPENDIX B - DESCRIPTION OF MODEL USED IN SAMPLE ANALYSIS
65
Figure B-1. - Storage Volume (Acre-Feet)
Spillway. The spillway for the dam is at an elevation of 976.5 feet. It has a length of 150 feet. Therelease from this overflow spillway is
Spillway-Outflow(h) = 0, h < 976.5 feet= 3.0(150)(h-976.5) cfs h > 976.5 feet1.5
Flow over the crest. Should the dam become so full that the elevation of the storage pool exceeds 995feet, then water will begin to flow over the whole crest of the dam. The outflow over the dam's crest, whichis not part of the 150 foot wide spillway, is
Crest-Outflow(h) = 0 h < 995 feet= 3.0(5450)(h-995) cfs h > 995 feet1.5

66
Sluiceway Outlet Works Operating PolicyThe previous section describes the potential release from the dam. The sluiceway outlet works can be
controlled by the operator, and if used to discharge to the maximum rates, can cause significant damagedownstream without any inflow. So as to model a reasonable operating policy, it was assumed that oncethe operators realized a major storm was coming, they would use the semicircular conduits to release 5,000cfs, if possible, throughout the duration of the storm. The sluice gates will then be used to their capacitywhen water reaches that level. Thus, the controlled releases from the sluiceway outlet works as a functionof reservoir elevation were:
Sluice-Outflow(h) = 0, h < 948 feet= 12,000(h-948)/(960-948) 948 < h < 953 feet= 5,000 953 < h < 960 feet= 5,000+(21,000-12,000)(h-960)/(995-960) h > 960 feet
The resulting releases from the reservoir as a function of elevation are shown in Figure B-2 for all thedischarge vehicles. Figure B-3 shows the total release as a function of elevation for a 450-foot widespillway, which is one of the dam modifications considered in the text.
More complex operating policies could be employed that use inflow forecasts to determine appropriatesluiceway releases. The policy adopted is thought to be reasonable. If one always released from thesluiceway outlets at the maximum possible rate, then major downstream damages would result even whenthere was no rainfall.
With this operating policy, when the storage pool reaches 953 feet the release rate reaches 5,000 cfsat which it stays until elevation 960 when water begins to flow through the sluice gates. The total flow willthen increase to 9,200 cfs at elevation 976.5 when the spillway begins to operate. The total rate of flowthrough the sluiceway and the spillway will reach 49,800 cfs when the storage level reaches elevation 995,the top of the embankment. Finally, with two feet of overtopping of the embankment, releases over thespillway and sluice gates, and 5,000 cfs through the conduits, the total release will equal 102,500 cfs.Should the dam fail at that point, the release rate would jump to 276,800 cfs.
Dam FailureThe analysis includes two vehicles for dam failure due to hydrologic events. One is a wash out of the
spillway. The other is the overtopping of the dam and the subsequent washing out of the embankment.The depths of water which can flow over the spillway or over the top of the dam before failure of the
dam will occur are random variables. Both are modeled by Weibull variates. For the spillway, the meandepth at failure is 20 feet, corresponding to the reservoir being crest full plus 1.5 feet with a standarddeviation of 2.0 feet. [These correspond to scale parameter b = 0.0479 per foot and shape parameter k =12.15.] If the dam were raised ten feet to elevation 1,005, it was assumed that modification of the damwould also raise the mean depth at failure for the spillway to 30 feet with a standard deviation of 3.0 feet.[These correspond to scale parameter b = 0.033 per foot and shape parameter k = 12.15.]
For the dam crest, the mean depth at failure is 2.0 feet with a standard deviation of 0.33 feet. [Thesecorrespond to scale parameter b = 0.468 per foot and shape parameter k = 7.06.] This implies that the damis most likely to fail from a spillway failure when the dam is already overtopped, but the embankment hasnot yet washed out. Failure due to an embankment failure due to overtopping is a close second.
Rainfall Distribution
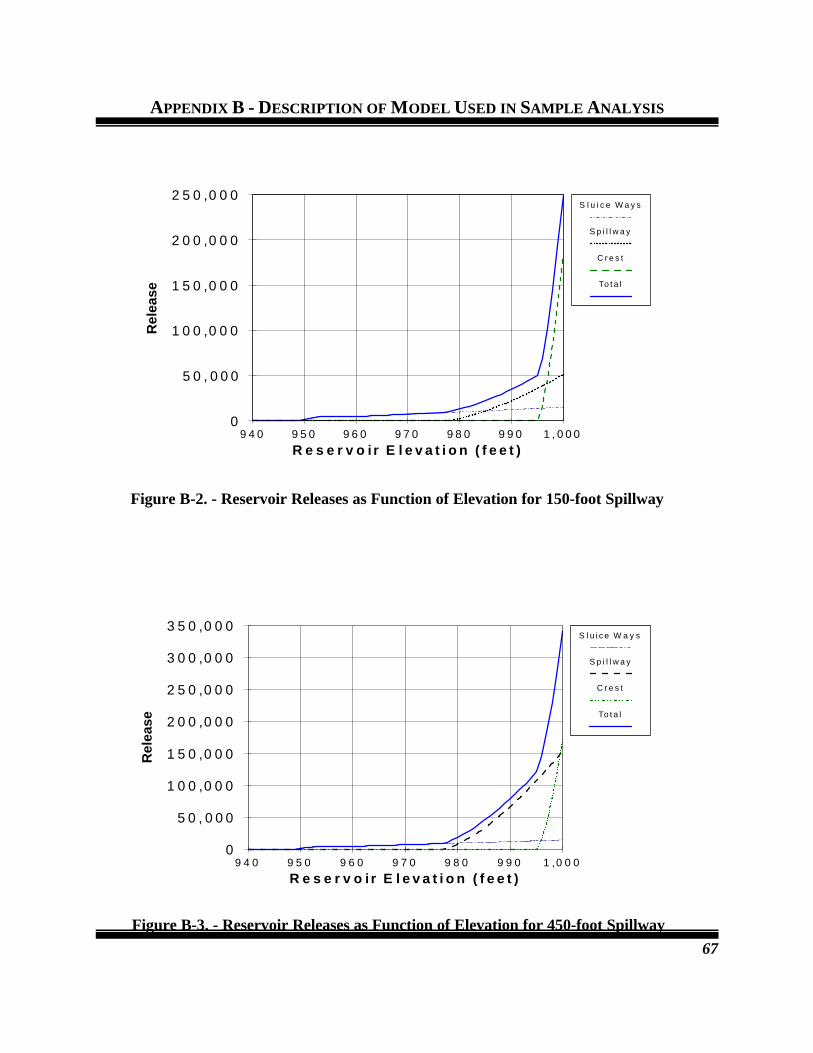
9 4 0 9 5 0 9 6 0 9 7 0 9 8 0 9 9 0 1 , 0 0 00
5 0 , 0 0 0
1 0 0 ,0 0 0
1 5 0 ,0 0 0
2 0 0 ,0 0 0
2 5 0 ,0 0 0
R e s e r v o i r E l e v a t i o n ( f e e t )
Rel
ease
S l u i c e W a y s
S p i l l w a y
C r e s t
To t a l
9 4 0 9 5 0 9 6 0 9 7 0 9 8 0 9 9 0 1 ,0 0 00
5 0 , 0 0 0
1 0 0 ,0 0 0
1 5 0 ,0 0 0
2 0 0 ,0 0 0
2 5 0 ,0 0 0
3 0 0 ,0 0 0
3 5 0 ,0 0 0
R e s e r v o i r E l e v a t i o n ( f e e t )
Rel
ease
S l u i c e W a y s
S p i l l w a y
C r e s t
To t a l
APPENDIX B - DESCRIPTION OF MODEL USED IN SAMPLE ANALYSIS
67
Figure B-2. - Reservoir Releases as Function of Elevation for 150-foot Spillway
Figure B-3. - Reservoir Releases as Function of Elevation for 450-foot Spillway
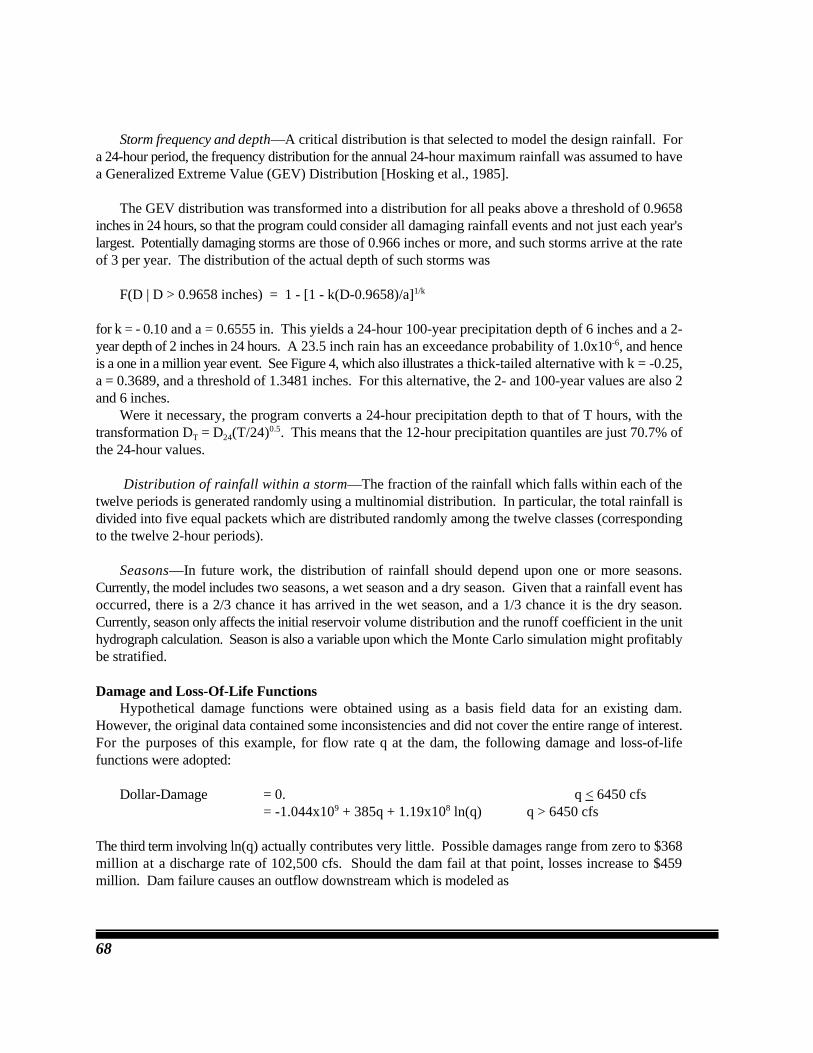
68
Storm frequency and depth—A critical distribution is that selected to model the design rainfall. Fora 24-hour period, the frequency distribution for the annual 24-hour maximum rainfall was assumed to havea Generalized Extreme Value (GEV) Distribution [Hosking et al., 1985].
The GEV distribution was transformed into a distribution for all peaks above a threshold of 0.9658inches in 24 hours, so that the program could consider all damaging rainfall events and not just each year'slargest. Potentially damaging storms are those of 0.966 inches or more, and such storms arrive at the rateof 3 per year. The distribution of the actual depth of such storms was
F(D | D > 0.9658 inches) = 1 - [1 - k(D-0.9658)/a]1/k
for k = - 0.10 and a = 0.6555 in. This yields a 24-hour 100-year precipitation depth of 6 inches and a 2-year depth of 2 inches in 24 hours. A 23.5 inch rain has an exceedance probability of 1.0x10 , and hence-6
is a one in a million year event. See Figure 4, which also illustrates a thick-tailed alternative with k = -0.25,a = 0.3689, and a threshold of 1.3481 inches. For this alternative, the 2- and 100-year values are also 2and 6 inches.
Were it necessary, the program converts a 24-hour precipitation depth to that of T hours, with thetransformation D = D (T/24) . This means that the 12-hour precipitation quantiles are just 70.7% ofT 24
0.5
the 24-hour values.
Distribution of rainfall within a storm—The fraction of the rainfall which falls within each of thetwelve periods is generated randomly using a multinomial distribution. In particular, the total rainfall isdivided into five equal packets which are distributed randomly among the twelve classes (correspondingto the twelve 2-hour periods).
Seasons—In future work, the distribution of rainfall should depend upon one or more seasons.Currently, the model includes two seasons, a wet season and a dry season. Given that a rainfall event hasoccurred, there is a 2/3 chance it has arrived in the wet season, and a 1/3 chance it is the dry season.Currently, season only affects the initial reservoir volume distribution and the runoff coefficient in the unithydrograph calculation. Season is also a variable upon which the Monte Carlo simulation might profitablybe stratified.
Damage and Loss-Of-Life FunctionsHypothetical damage functions were obtained using as a basis field data for an existing dam.
However, the original data contained some inconsistencies and did not cover the entire range of interest.For the purposes of this example, for flow rate q at the dam, the following damage and loss-of-lifefunctions were adopted:
Dollar-Damage = 0. q < 6450 cfs= -1.044x10 + 385q + 1.19x10 ln(q) q > 6450 cfs9 8
The third term involving ln(q) actually contributes very little. Possible damages range from zero to $368million at a discharge rate of 102,500 cfs. Should the dam fail at that point, losses increase to $459million. Dam failure causes an outflow downstream which is modeled as

APPENDIX B - DESCRIPTION OF MODEL USED IN SAMPLE ANALYSIS
69
q = q + 75(h - 931)failure without-failure at-failure 1.85
where q is the discharge rate at the time of failure from the outlet works, spillway, and over thewithout-failure
crest of the dam. For a failure when the embankment is overtopped by two feet, corresponding to anelevation h=997 feet, the release from the outlet works, spillway, and over the crest of the dam would total102,500 cfs; were the dam to fail at that point, the total flow would jump to 277,000 cfs. The value ofq is used to determine the Dollar-Damage value using the equation above. The resultant damages arefailure
used as if they include both downstream damages from the flood and repair cost to fix the breach in thedam, or to rebuild the spillway should it have failed. If, for political or economic reasons, the dam wouldnot be repaired, then the cost of any lost of service should be factored into the analysis at this point.
The loss-of-life model was also based upon that for a real dam, with a reasonable extension beyondthe range for which data were available. The model is
Loss-of-life = 0 q < 6000 cfs= 10 (q-6000)/(16,000) 6000 < q < 22,000 cfs= 0.517 q 22,000 < q0.2964
For a discharge rate of 102,5000 corresponding to 2 feet of overtopping, there would be 15.8 lives lost.If the dam failed at that point and no warning was given, the number of lives lost would increase to 21.If the dam fails and the warning system works, then loss-of-life is assumed to be that which occurred withthe maximum release rate q at the dam before it failed. With the prescribed operating policy, some loss-of-life occurs whenever the storage elevation reaches 964 feet, corresponding to discharges in excess of 6000cfs. Ten lives are lost when the discharge rate reaches 22,000 cfs, at a reservoir elevation a little less than985 feet.
Figures B-4 and B-5 show the dollar damages and loss-of-life which result as a function of the releaserate from the dam. Given the prescribed operating policy and the capacity and performance of the spillwayand dam crest as outlet works, Figures B-6 and B-7 show the dollar damages and loss-of-life which occuras a function of reservoir elevation for the original 150-foot spillway and with a proposed 450-foot widespillway. From Figures B-4 and B-5, one can see that for the damage and loss-of-life functions given forour dam, based on the data that was provided by the Corps, most of the damages and loss-of-life occur withrelative smaller releases, particularly loss-of-life.
Failure of emergency evacuation proceduresIt is assumed that evacuation procedures, if implemented, would eliminate incremental loss-of-life due
to the failure of this dam. However, due to the confusion that is often associated with major storms,emergency evacuation procedures might not be executed in time. The probability the emergencyevacuation-warning procedures fail was 50%.
Other Factors

70
The simulation analysis allows the stochastic modeling of a number of other factors that can affect theperformance of the structure and the safety factor of the dam and the distribution of loss-of-life. Theseinclude the items discussed below.

0 5 0 1 0 0 1 5 0 2 0 0 2 5 0 3 0 00
5
1 0
1 5
2 0
2 5
R e l e a s e ( T h o u s a n d C F S )
Liv
es L
ost
)
0 5 0 1 0 0 1 5 0 2 0 0 2 5 0 3 0 00
1 0 0
2 0 0
3 0 0
4 0 0
5 0 0
6 0 0
R e l e a s e ( T h o u s a n d C F S )
Dam
age
(Mill
ion
$)
APPENDIX B - DESCRIPTION OF MODEL USED IN SAMPLE ANALYSIS
71
Figure B-5. - Lives Lost as Function of Release
Figure B-4. - Damages in Million $
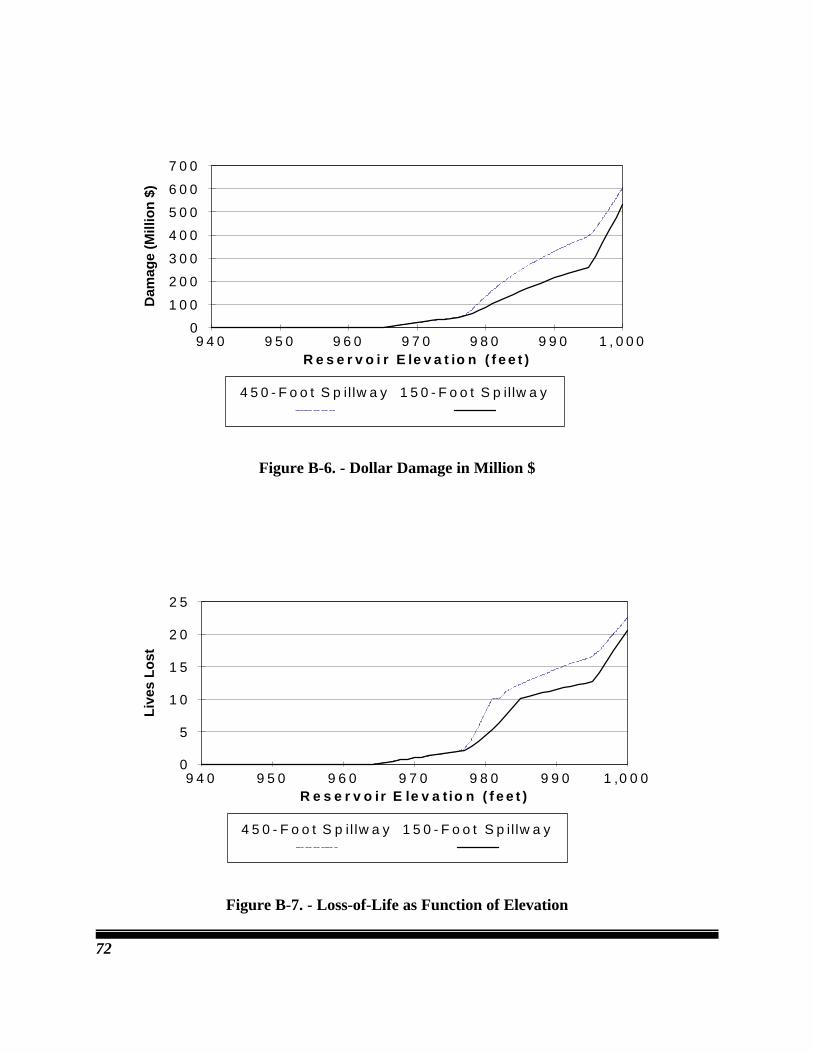
9 4 0 9 5 0 9 6 0 9 7 0 9 8 0 9 9 0 1 , 0 0 00
1 0 0
2 0 0
3 0 0
4 0 0
5 0 0
6 0 0
7 0 0
R e s e r v o i r E le v a t io n ( f e e t )
Dam
age
(Mill
ion
$)
4 5 0 - F o o t S p il lw a y 1 5 0 - F o o t S p il lw a y
9 4 0 9 5 0 9 6 0 9 7 0 9 8 0 9 9 0 1 ,0 0 00
5
1 0
1 5
2 0
2 5
R e s e r v o ir E le v a t io n ( f e e t )
Liv
es L
ost
4 5 0 - F o o t S p i l lw a y 1 5 0 - F o o t S p il lw a y
72
Figure B-6. - Dollar Damage in Million $
Figure B-7. - Loss-of-Life as Function of Elevation

APPENDIX B - DESCRIPTION OF MODEL USED IN SAMPLE ANALYSIS
73
1. Wind Runup—Wind across the lake behind the dam can effectively increase the elevation of thewater at the dam. To model this effect in practice, one would need to consider the wind directionsassociated with the storm being modeled and in what direction the wind could be blowing at the point intime the elevation of the storage pool would be at its maximum elevation. In this simple analysis, the effectof wind on the elevation of the storage pool at the dam was modeled as a normal random variable with amean of 1 foot and a standard deviation of 0.5 feet. In practice, one might also consider wave runup on the dam and the possibility of overtopping of thedam crest due to wind-driven wave action. That phenomenon is ignored in this analysis.
2. Sluice Gate Failure—The number of sluiceway gates actually functioning can vary. It isassumed that from one to six gates can function with various probabilities as given below
Gates Functioning: 6 5 4 3 2 1Probability: 0.80 0.15 0.05 0 0 0
Other probabilities could be adopted. If only m sluice gates are working, then the maximum releasecapacity at h=995 feet is reduced to 12,000 + (21,000-12,000)(m/6) cfs. Below h=960 feet elevation, therelease capacity of the conduits is unaffected. Failure of one or more of the sluice gates would decreasethe maximum flow associated with two feet of overtopping. In that case, instead of a release of 107,000cfs with all six gates functioning, the release rate would drop to 104,000 cfs.
StratificationTo try to make the Monte Carlo analysis program as efficient as possible, the contribution of the rain
distribution is evaluated analytically. Other variables, such as spillway overtopping depth, to cause failureare treated as random variables. Stratified variables are:
1) the number of sluiceway gates working, and2) whether the warning system works.