Embed Size (px)
Citation preview
Page.1 of 12
November 2012
Rise of Algorithm Trading & Its Implications Earlier this month, UBS AG, Switzerland’s biggest bank, disclosed the firing of its head of credit-default swaps index trading. UBS did not specify reasons for its action and no replacement has been named. Market rumours had it that instead of a hire from competitors or promoting someone from within the organization, the position (or more accurately, the function) will be taken up by quantitiave-based computer trading algorithms. With the said announcment, UBS is joining a growing list of rivals in using computer programs to trade financial instruments. In recent weeks, firms including Barclays Plc of U.K., Credit Suisse Group of Switzerland and Goldman Sachs Group of the U.S. have made similar move. For these companies, profits from trading activities have for a long time generating largest share of their income. What caused such a paradigm shift? The popular answer to that question is cost, or specifically the need to cut costs. According to some executive search firms, before the financial tsunami, managing directors on credit-derivative trading desks were being paid an average of US$250,000 in salaries plus they took home $1.75 million in bonuses. In comparison, the costs of building an algorithm may cost a few hundred thousand dollars. So on the one hand, you have a human trader than costs a handy $2 million per year; while on the other hand, there is a computer trading program that costs a fraction of that and it’s non-recurring! The maths are simple enough that a Primary Schooler can make the right choice. Apart from cost considerations, the shift from human to computer trading could be due to other factors. Regulatory changes including the Dodd-Frank financial reform in the U.S., the banking reform in the U.K, and the adoption of Basel III capital requirements are prompting (or forcing) financial institutions to scale back their proprietary trading functions and at the same time making their trading activities more transparent. Already, companies have significantly cut back the amount of capital-at-risk on trading transactions. Smaller trade sizes mean smaller potential trading profits, which further tilt the decision away from employing expensive human traders to conduct such activities. Another reason for the shift to trading by computer algorithm has to do with risk management. In May of this year, JPMorgan Chase surprised the world by disclosing a shocking US$2 billion trading loss by its secretive investment group housed in its London headquarter. It was an embarrassing event to one of Wall Street's most respected banks, and particularly so for its Chief Executive Jamie Dimon, who is widely touted as the most knowledgeble and hands-on manager of the global banking industry. In an interview aired on public television, Dimon acknowledged

Page.2 of 12
"We know we were sloppy. We know we were stupid. We know there was bad judgment.” Within days, Dimon fired the responsible trader and his superiors, and ordered the trade to be unwind. Six months have passed and due to the (huge) sizes and complexity of those positions, residual exposure remains. Meanwhile, realized losses from the trade have ballooned to $5.8 billion and counting. In the below table, we list the largest 15 trading losses ever recorded, sourced from Wikipedia. Despite JP’s sizable losses, its trade hasn’t made it to the Top-3, which may be one thing that Jamie Dimon may find comfort knowing. List of Largest Trading Losses (includes both fraudulent and non-fraudulent trading losses)
# USD Equivalent (at time of loss)
USD Equivalent (real amount loss) Company Source of Loss Year Associated
Person(s)
1 $9 billion $8.67 billion Morgan Stanley Credit Default Swaps 2008 Howie Hubler
2 $7.22 billion $6.95 billion Societe Generale European Index Futures 2008 Jerome Kerviel
3 $6.50 billion $6.69 billion Amaranth Advisors Gas Futures 2006 Brian Hunter
4 $5.80 billion $5.80 billion JP Morgan Credit Default Swaps 2012 Bruno Iksil
5 $4.6 billion $5.85 billion Long Term Capital Management
Interest Rate & Equity Derivatives 1998 John Meriwether
6 $2.62 billion $3.46 billion Sumitomo Corporation Copper Futures 1996 Ysauo Hamanaka
7 $2.52 billion $2.43 billion Aracruz FX options 2008 Isac Zagury / Rafael Sotero
8 $2 billion $1.83 billion UBS Equities ETF &
Delta 1 Derivatives
2011 Kweku Adoboli
9 $1.7 billion $2.38 billion Orange County Leveraged bond investments 1994 Robert Citron
10 $1.59 billion $2.28 billion Metallgesellschaft Oil Futures 1993 Heinz Schimmelbusch
11 $1.49 billion $2.14 billion Show Shell Sekiyu FX Forwards 1993 12 $1.50 billion $2.09 billion Kashima Oil FX Forwards 1994 13 $1.89 billion $1.82 billion CITIC Pacific FX Trading 2008 Frances Yung 14 $1.8 billion $1.74 billion Deutsche Bank Derivatives 2008 Boaz Weinstein 15 $1.31 billion $1.78 billion Barings Bank Nikkei Futures 1995 Nick Leeson Source: Wikipedia.org Note: excludes losses associated with Bernie Madoff's Ponzi scheme which is estimated in the $50 billion range because Madoff did not lose the majority of this money in trading.
A closer examination of the costly trades above reveals that while each one of them may have different circumstantial factors, a few common elements can be found. Firstly, persons involved tend to have super-sized ego, whether they are rogue traders or acclaimed academic achievers. The collapse of Long Term Capital Management is a textbook example of the latter. In its heyday, LTCM was one of the largest hedge fund firms in the world. Among members of its Board of Directors are veteran traders, career investment bankers, plus two Nobel prize laureates. Myron S. Scholes and Robert C. Merton shared the 1997 Nobel Memorial Prize in Economic Sciences for their work on determining the fair value of derivatives. The firm found success early, generating annualized returns of over 40% (after fees) in its first few years of formation. Then in 1998, it lost $4.6 billion in less than four months following the Russian financial crisis and required financial intervention by the Federal Reserve. In the end, the firm was liquidated in early 2000. The second common element is the lack of supervision on trading activities. Time and again, from Barings’ Nick Leeson to SocGen’s Jerome Kerviel, from UBS’s Kweku Adoboli to JP Morgan’s Bruno Iksil, these traders were able to wager ever larger sums of money that well exceeded their allowable trade limits, and yet their supervisors have failed to halt such trades. If such check-and-balances mechanisms aren’t able to safeguard a firm’s trading activities from blowing up, then what good are they.
Page.3 of 12
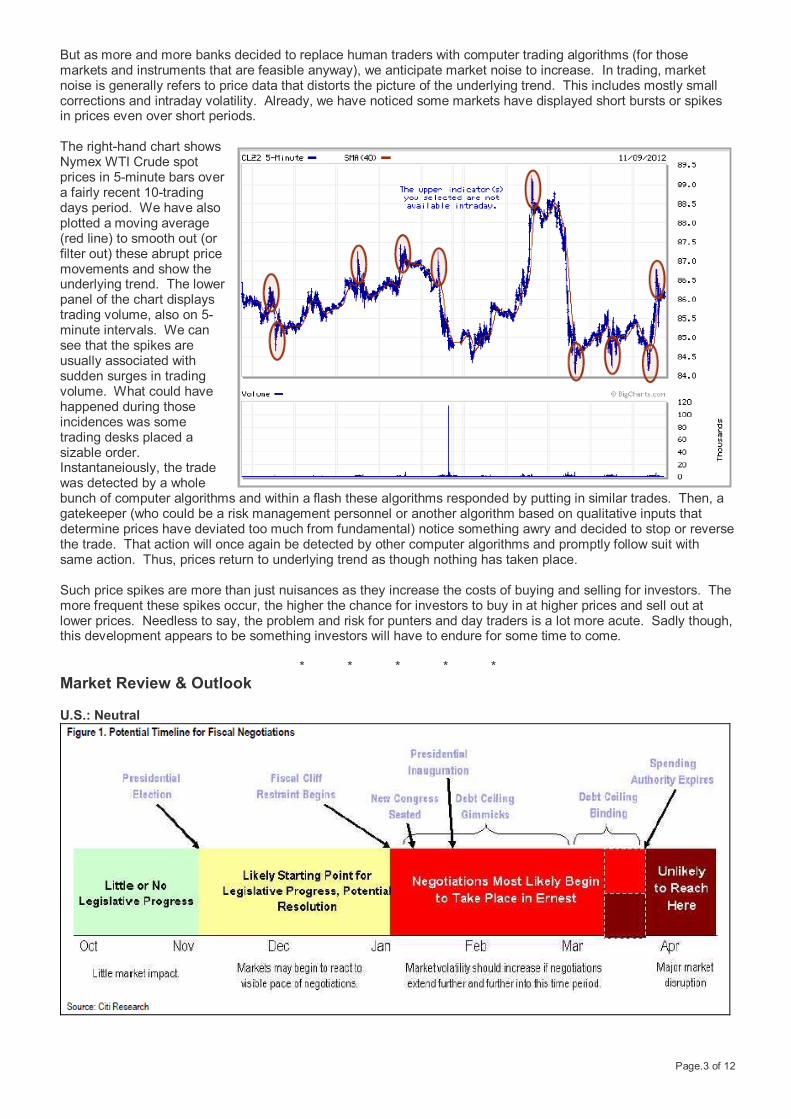
But as more and more banks decided to replace human traders with computer trading algorithms (for those markets and instruments that are feasible anyway), we anticipate market noise to increase. In trading, market noise is generally refers to price data that distorts the picture of the underlying trend. This includes mostly small corrections and intraday volatility. Already, we have noticed some markets have displayed short bursts or spikes in prices even over short periods. The right-hand chart shows Nymex WTI Crude spot prices in 5-minute bars over a fairly recent 10-trading days period. We have also plotted a moving average (red line) to smooth out (or filter out) these abrupt price movements and show the underlying trend. The lower panel of the chart displays trading volume, also on 5-minute intervals. We can see that the spikes are usually associated with sudden surges in trading volume. What could have happened during those incidences was some trading desks placed a sizable order. Instantaneiously, the trade was detected by a whole bunch of computer algorithms and within a flash these algorithms responded by putting in similar trades. Then, a gatekeeper (who could be a risk management personnel or another algorithm based on qualitative inputs that determine prices have deviated too much from fundamental) notice something awry and decided to stop or reverse the trade. That action will once again be detected by other computer algorithms and promptly follow suit with same action. Thus, prices return to underlying trend as though nothing has taken place. Such price spikes are more than just nuisances as they increase the costs of buying and selling for investors. The more frequent these spikes occur, the higher the chance for investors to buy in at higher prices and sell out at lower prices. Needless to say, the problem and risk for punters and day traders is a lot more acute. Sadly though, this development appears to be something investors will have to endure for some time to come.
* * * * * Market Review & Outlook U.S.: Neutral
Page.4 of 12
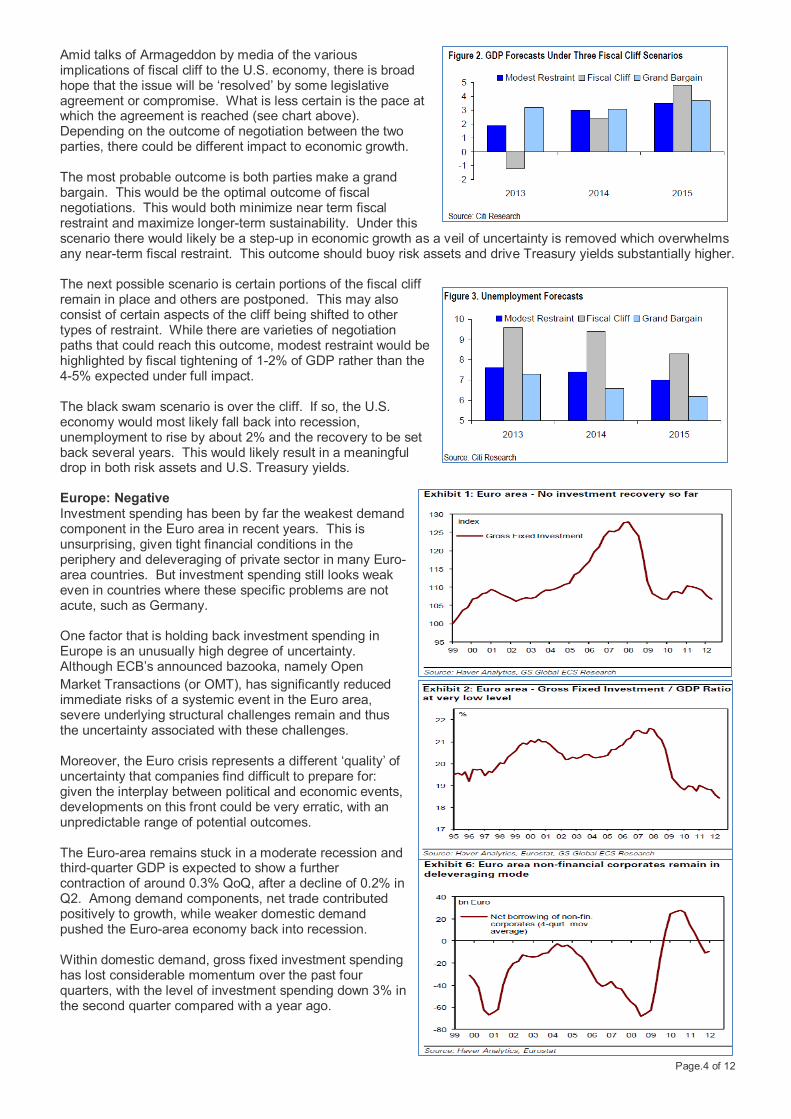
Amid talks of Armageddon by media of the various implications of fiscal cliff to the U.S. economy, there is broad hope that the issue will be ‘resolved’ by some legislative agreement or compromise. What is less certain is the pace at which the agreement is reached (see chart above). Depending on the outcome of negotiation between the two parties, there could be different impact to economic growth. The most probable outcome is both parties make a grand bargain. This would be the optimal outcome of fiscal negotiations. This would both minimize near term fiscal restraint and maximize longer-term sustainability. Under this scenario there would likely be a step-up in economic growth as a veil of uncertainty is removed which overwhelms any near-term fiscal restraint. This outcome should buoy risk assets and drive Treasury yields substantially higher. The next possible scenario is certain portions of the fiscal cliff remain in place and others are postponed. This may also consist of certain aspects of the cliff being shifted to other types of restraint. While there are varieties of negotiation paths that could reach this outcome, modest restraint would be highlighted by fiscal tightening of 1-2% of GDP rather than the 4-5% expected under full impact. The black swam scenario is over the cliff. If so, the U.S. economy would most likely fall back into recession, unemployment to rise by about 2% and the recovery to be set back several years. This would likely result in a meaningful drop in both risk assets and U.S. Treasury yields. Europe: Negative Investment spending has been by far the weakest demand component in the Euro area in recent years. This is unsurprising, given tight financial conditions in the periphery and deleveraging of private sector in many Euro-area countries. But investment spending still looks weak even in countries where these specific problems are not acute, such as Germany. One factor that is holding back investment spending in Europe is an unusually high degree of uncertainty. Although ECB’s announced bazooka, namely Open Market Transactions (or OMT), has significantly reduced immediate risks of a systemic event in the Euro area, severe underlying structural challenges remain and thus the uncertainty associated with these challenges. Moreover, the Euro crisis represents a different ‘quality’ of uncertainty that companies find difficult to prepare for: given the interplay between political and economic events, developments on this front could be very erratic, with an unpredictable range of potential outcomes. The Euro-area remains stuck in a moderate recession and third-quarter GDP is expected to show a further contraction of around 0.3% QoQ, after a decline of 0.2% in Q2. Among demand components, net trade contributed positively to growth, while weaker domestic demand pushed the Euro-area economy back into recession. Within domestic demand, gross fixed investment spending has lost considerable momentum over the past four quarters, with the level of investment spending down 3% in the second quarter compared with a year ago.
Page.5 of 12
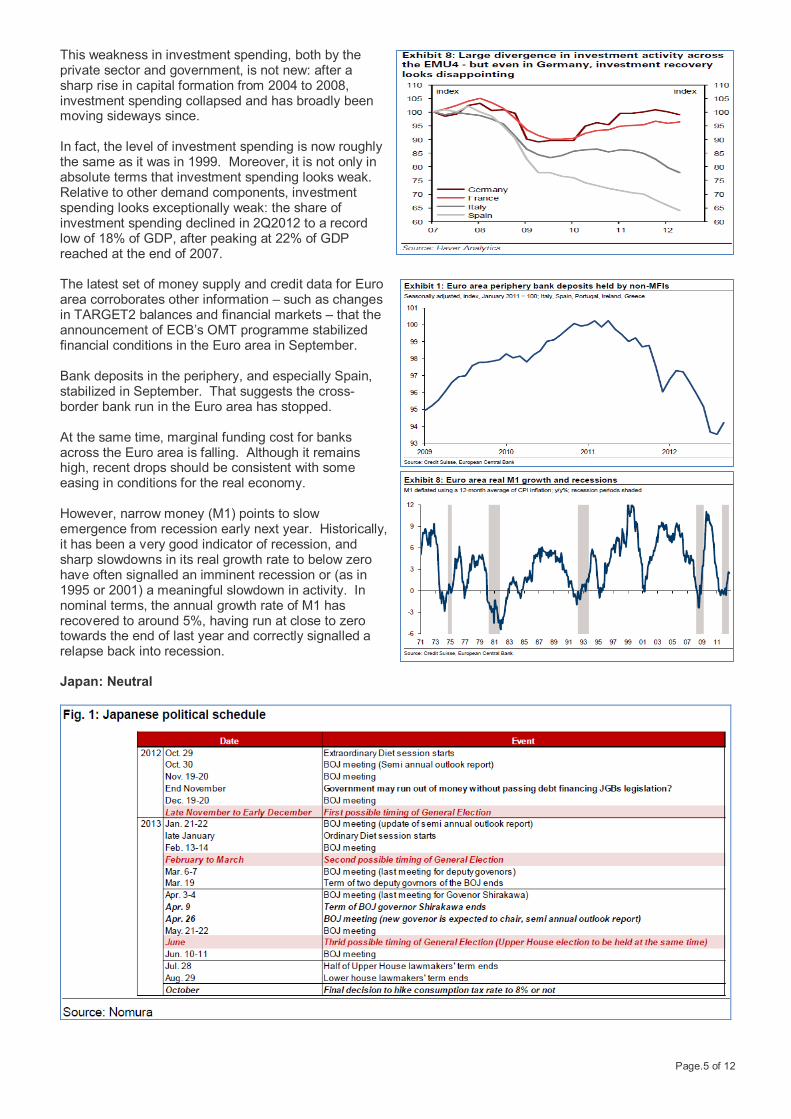
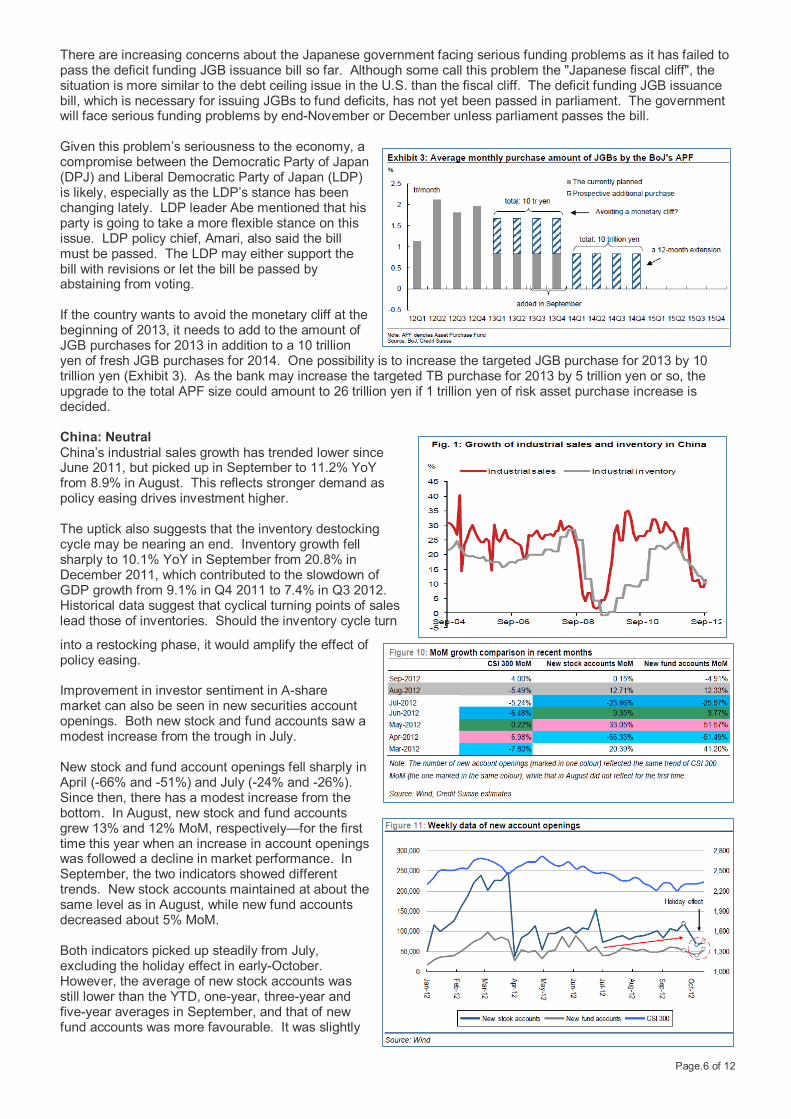
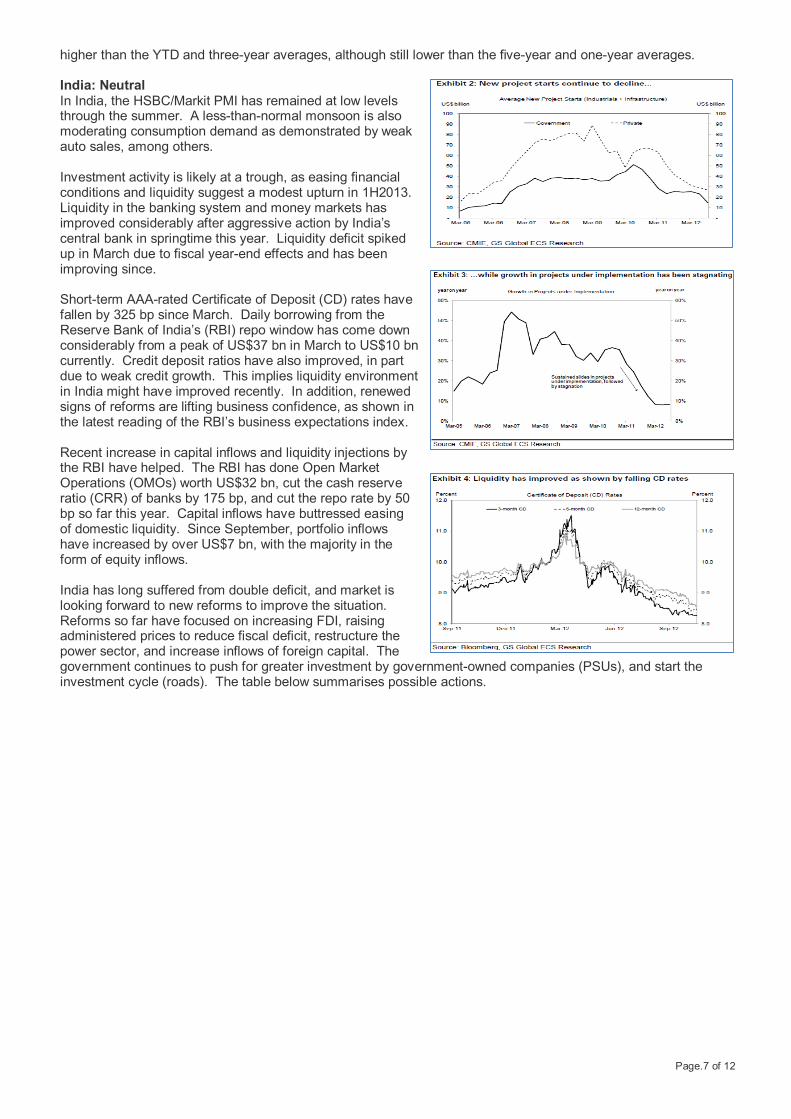
This weakness in investment spending, both by the private sector and government, is not new: after a sharp rise in capital formation from 2004 to 2008, investment spending collapsed and has broadly been moving sideways since. In fact, the level of investment spending is now roughly the same as it was in 1999. Moreover, it is not only in absolute terms that investment spending looks weak. Relative to other demand components, investment spending looks exceptionally weak: the share of investment spending declined in 2Q2012 to a record low of 18% of GDP, after peaking at 22% of GDP reached at the end of 2007. The latest set of money supply and credit data for Euro area corroborates other information – such as changes in TARGET2 balances and financial markets – that the announcement of ECB’s OMT programme stabilized financial conditions in the Euro area in September. Bank deposits in the periphery, and especially Spain, stabilized in September. That suggests the cross-border bank run in the Euro area has stopped. At the same time, marginal funding cost for banks across the Euro area is falling. Although it remains high, recent drops should be consistent with some easing in conditions for the real economy. However, narrow money (M1) points to slow emergence from recession early next year. Historically, it has been a very good indicator of recession, and sharp slowdowns in its real growth rate to below zero have often signalled an imminent recession or (as in 1995 or 2001) a meaningful slowdown in activity. In nominal terms, the annual growth rate of M1 has recovered to around 5%, having run at close to zero towards the end of last year and correctly signalled a relapse back into recession. Japan: Neutral
Page.6 of 12
There are increasing concerns about the Japanese government facing serious funding problems as it has failed to pass the deficit funding JGB issuance bill so far. Although some call this problem the "Japanese fiscal cliff", the situation is more similar to the debt ceiling issue in the U.S. than the fiscal cliff. The deficit funding JGB issuance bill, which is necessary for issuing JGBs to fund deficits, has not yet been passed in parliament. The government will face serious funding problems by end-November or December unless parliament passes the bill. Given this problem’s seriousness to the economy, a compromise between the Democratic Party of Japan (DPJ) and Liberal Democratic Party of Japan (LDP) is likely, especially as the LDP’s stance has been changing lately. LDP leader Abe mentioned that his party is going to take a more flexible stance on this issue. LDP policy chief, Amari, also said the bill must be passed. The LDP may either support the bill with revisions or let the bill be passed by abstaining from voting. If the country wants to avoid the monetary cliff at the beginning of 2013, it needs to add to the amount of JGB purchases for 2013 in addition to a 10 trillion yen of fresh JGB purchases for 2014. One possibility is to increase the targeted JGB purchase for 2013 by 10 trillion yen (Exhibit 3). As the bank may increase the targeted TB purchase for 2013 by 5 trillion yen or so, the upgrade to the total APF size could amount to 26 trillion yen if 1 trillion yen of risk asset purchase increase is decided. China: Neutral China’s industrial sales growth has trended lower since June 2011, but picked up in September to 11.2% YoY from 8.9% in August. This reflects stronger demand as policy easing drives investment higher. The uptick also suggests that the inventory destocking cycle may be nearing an end. Inventory growth fell sharply to 10.1% YoY in September from 20.8% in December 2011, which contributed to the slowdown of GDP growth from 9.1% in Q4 2011 to 7.4% in Q3 2012. Historical data suggest that cyclical turning points of sales lead those of inventories. Should the inventory cycle turn
into a restocking phase, it would amplify the effect of policy easing. Improvement in investor sentiment in A-share market can also be seen in new securities account openings. Both new stock and fund accounts saw a modest increase from the trough in July. New stock and fund account openings fell sharply in April (-66% and -51%) and July (-24% and -26%). Since then, there has a modest increase from the bottom. In August, new stock and fund accounts grew 13% and 12% MoM, respectively—for the first time this year when an increase in account openings was followed a decline in market performance. In September, the two indicators showed different trends. New stock accounts maintained at about the same level as in August, while new fund accounts decreased about 5% MoM. Both indicators picked up steadily from July, excluding the holiday effect in early-October. However, the average of new stock accounts was still lower than the YTD, one-year, three-year and five-year averages in September, and that of new fund accounts was more favourable. It was slightly
Page.7 of 12
higher than the YTD and three-year averages, although still lower than the five-year and one-year averages. India: Neutral In India, the HSBC/Markit PMI has remained at low levels through the summer. A less-than-normal monsoon is also moderating consumption demand as demonstrated by weak auto sales, among others. Investment activity is likely at a trough, as easing financial conditions and liquidity suggest a modest upturn in 1H2013. Liquidity in the banking system and money markets has improved considerably after aggressive action by India’s central bank in springtime this year. Liquidity deficit spiked up in March due to fiscal year-end effects and has been improving since. Short-term AAA-rated Certificate of Deposit (CD) rates have fallen by 325 bp since March. Daily borrowing from the Reserve Bank of India’s (RBI) repo window has come down considerably from a peak of US$37 bn in March to US$10 bn currently. Credit deposit ratios have also improved, in part due to weak credit growth. This implies liquidity environment in India might have improved recently. In addition, renewed signs of reforms are lifting business confidence, as shown in the latest reading of the RBI’s business expectations index. Recent increase in capital inflows and liquidity injections by the RBI have helped. The RBI has done Open Market Operations (OMOs) worth US$32 bn, cut the cash reserve ratio (CRR) of banks by 175 bp, and cut the repo rate by 50 bp so far this year. Capital inflows have buttressed easing of domestic liquidity. Since September, portfolio inflows have increased by over US$7 bn, with the majority in the form of equity inflows. India has long suffered from double deficit, and market is looking forward to new reforms to improve the situation. Reforms so far have focused on increasing FDI, raising administered prices to reduce fiscal deficit, restructure the power sector, and increase inflows of foreign capital. The government continues to push for greater investment by government-owned companies (PSUs), and start the investment cycle (roads). The table below summarises possible actions.

Page.8 of 12
Asia Pacific: Mixed In Australia, is Dutch disease hollowing out other sectors outside mining due to AUD’s strength? The CPI report could be hinting of problems to come. The curse of lower productivity growth may be starting to reveal itself. Inflation is running higher than expected. Domestically produced part of inflation, i.e. non-tradable, was well above RBA's target band (4.0%). This partly reflected introduction of carbon tax - which is an one-off boost that policymakers will abstract from - but the underlying trends still suggest that inflation has probably troughed. Tradable prices - mostly imported manufactured goods - are now rising, as the effect of the strong AUD begins to wear off. This may mean the RBA has less room to move. Indeed, they may have to settle for slower growth to meet their inflation target. The RBA are aware of this. When referring to their inflation outlook in recent official statements they have noted that their forecasts for inflation to be within the target band rely on the assumption that productivity growth rises. The introduction of carbon tax on 1 July substantially boosted Q3 headline inflation. Aside from the anticipated effects on gas and electricity prices and property rates & charges, the carbon tax likely affected other CPI components in the quarter. In particular, new house purchase costs rose sharply (+0.9% QoQ) despite subdued housing construction activity in Australia and follows several quarters of being broadly unchanged. Anecdotal evidence and estimates from industry bodies suggest that that the carbon tax increased building construction costs in the quarter. Given that new house purchase costs are highly correlated with new house construction costs, this points to a noticeable carbon tax effect on this CPI component (particularly in Sydney and Brisbane according to the CPI release). This should be looked through, including in coming quarters.
Page.9 of 12
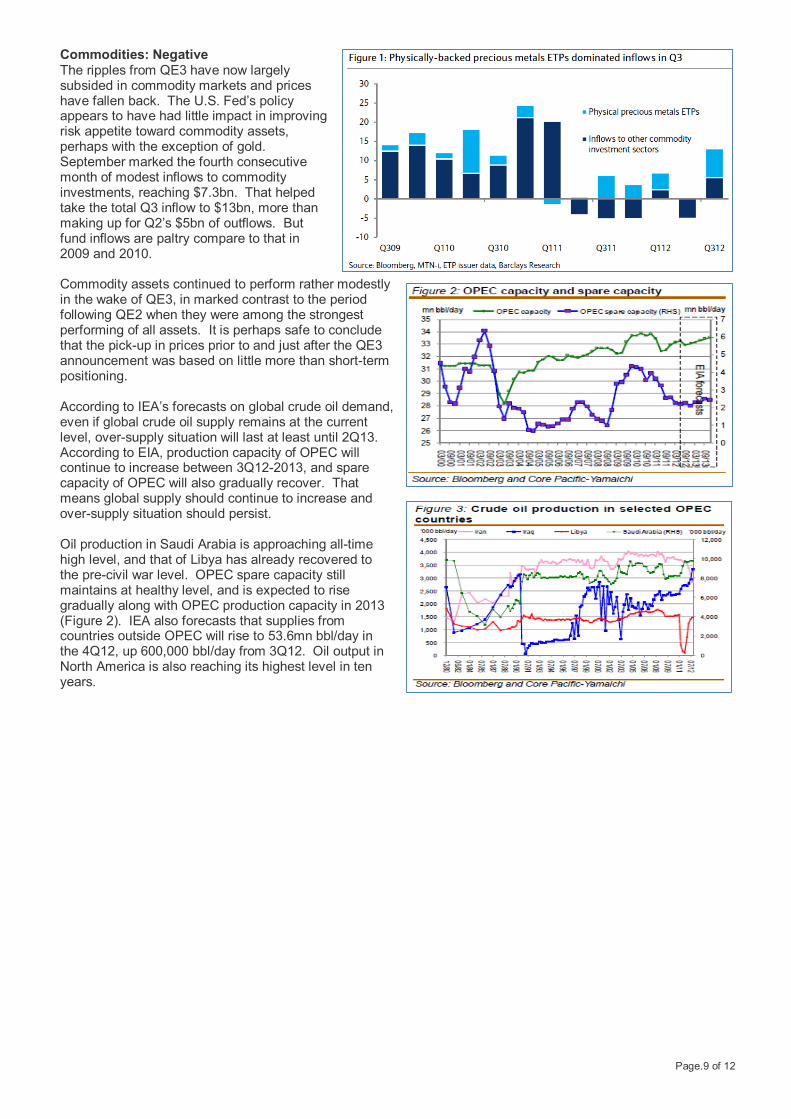
Commodities: Negative The ripples from QE3 have now largely subsided in commodity markets and prices have fallen back. The U.S. Fed’s policy appears to have had little impact in improving risk appetite toward commodity assets, perhaps with the exception of gold. September marked the fourth consecutive month of modest inflows to commodity investments, reaching $7.3bn. That helped take the total Q3 inflow to $13bn, more than making up for Q2’s $5bn of outflows. But fund inflows are paltry compare to that in 2009 and 2010. Commodity assets continued to perform rather modestly in the wake of QE3, in marked contrast to the period following QE2 when they were among the strongest performing of all assets. It is perhaps safe to conclude that the pick-up in prices prior to and just after the QE3 announcement was based on little more than short-term positioning. According to IEA’s forecasts on global crude oil demand, even if global crude oil supply remains at the current level, over-supply situation will last at least until 2Q13. According to EIA, production capacity of OPEC will continue to increase between 3Q12-2013, and spare capacity of OPEC will also gradually recover. That means global supply should continue to increase and over-supply situation should persist. Oil production in Saudi Arabia is approaching all-time high level, and that of Libya has already recovered to the pre-civil war level. OPEC spare capacity still maintains at healthy level, and is expected to rise gradually along with OPEC production capacity in 2013 (Figure 2). IEA also forecasts that supplies from countries outside OPEC will rise to 53.6mn bbl/day in the 4Q12, up 600,000 bbl/day from 3Q12. Oil output in North America is also reaching its highest level in ten years.
Page.10 of 12
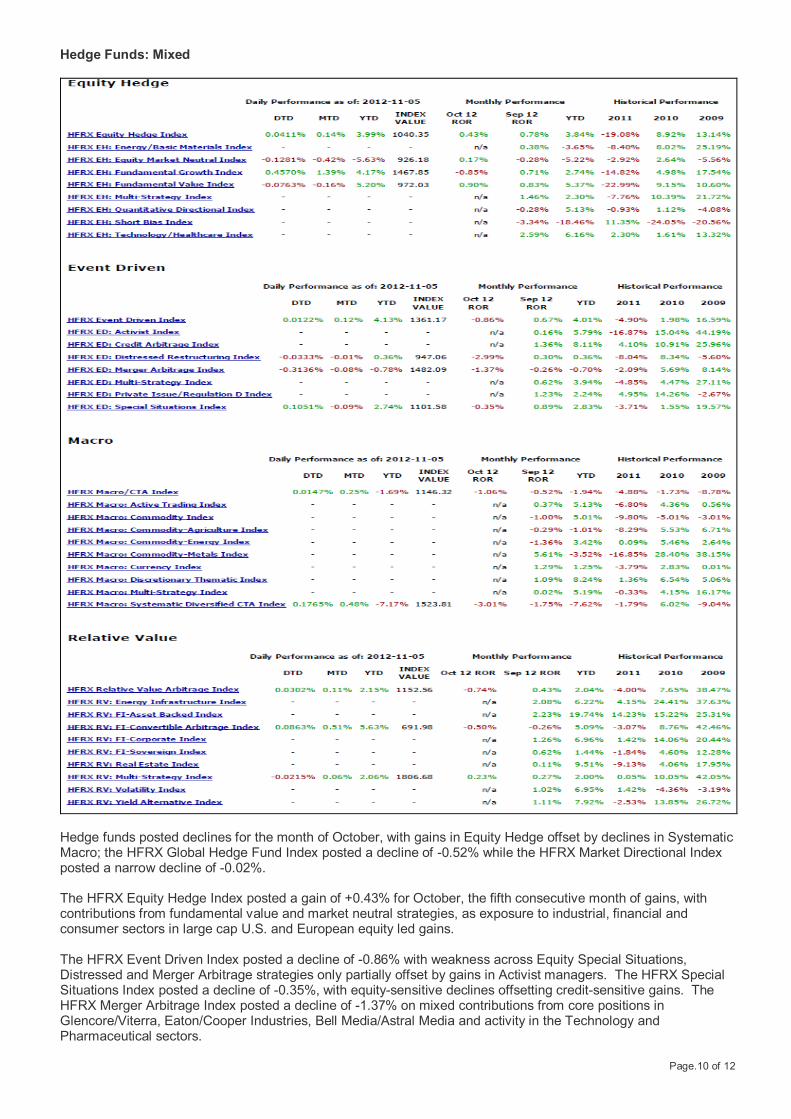
Hedge Funds: Mixed
Hedge funds posted declines for the month of October, with gains in Equity Hedge offset by declines in Systematic Macro; the HFRX Global Hedge Fund Index posted a decline of -0.52% while the HFRX Market Directional Index posted a narrow decline of -0.02%. The HFRX Equity Hedge Index posted a gain of +0.43% for October, the fifth consecutive month of gains, with contributions from fundamental value and market neutral strategies, as exposure to industrial, financial and consumer sectors in large cap U.S. and European equity led gains. The HFRX Event Driven Index posted a decline of -0.86% with weakness across Equity Special Situations, Distressed and Merger Arbitrage strategies only partially offset by gains in Activist managers. The HFRX Special Situations Index posted a decline of -0.35%, with equity-sensitive declines offsetting credit-sensitive gains. The HFRX Merger Arbitrage Index posted a decline of -1.37% on mixed contributions from core positions in Glencore/Viterra, Eaton/Cooper Industries, Bell Media/Astral Media and activity in the Technology and Pharmaceutical sectors.
Page.11 of 12
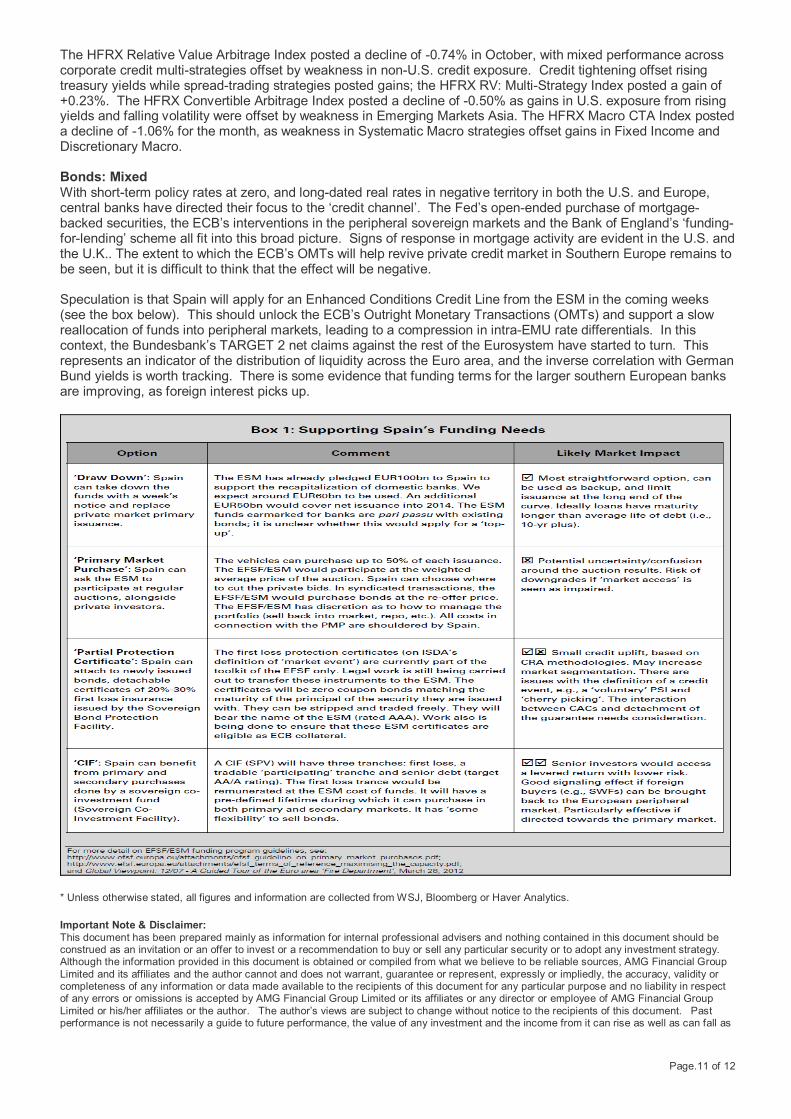
The HFRX Relative Value Arbitrage Index posted a decline of -0.74% in October, with mixed performance across corporate credit multi-strategies offset by weakness in non-U.S. credit exposure. Credit tightening offset rising treasury yields while spread-trading strategies posted gains; the HFRX RV: Multi-Strategy Index posted a gain of +0.23%. The HFRX Convertible Arbitrage Index posted a decline of -0.50% as gains in U.S. exposure from rising yields and falling volatility were offset by weakness in Emerging Markets Asia. The HFRX Macro CTA Index posted a decline of -1.06% for the month, as weakness in Systematic Macro strategies offset gains in Fixed Income and Discretionary Macro. Bonds: Mixed With short-term policy rates at zero, and long-dated real rates in negative territory in both the U.S. and Europe, central banks have directed their focus to the ‘credit channel’. The Fed’s open-ended purchase of mortgage-backed securities, the ECB’s interventions in the peripheral sovereign markets and the Bank of England’s ‘funding-for-lending’ scheme all fit into this broad picture. Signs of response in mortgage activity are evident in the U.S. and the U.K.. The extent to which the ECB’s OMTs will help revive private credit market in Southern Europe remains to be seen, but it is difficult to think that the effect will be negative. Speculation is that Spain will apply for an Enhanced Conditions Credit Line from the ESM in the coming weeks (see the box below). This should unlock the ECB’s Outright Monetary Transactions (OMTs) and support a slow reallocation of funds into peripheral markets, leading to a compression in intra-EMU rate differentials. In this context, the Bundesbank’s TARGET 2 net claims against the rest of the Eurosystem have started to turn. This represents an indicator of the distribution of liquidity across the Euro area, and the inverse correlation with German Bund yields is worth tracking. There is some evidence that funding terms for the larger southern European banks are improving, as foreign interest picks up.
* Unless otherwise stated, all figures and information are collected from WSJ, Bloomberg or Haver Analytics. Important Note & Disclaimer: This document has been prepared mainly as information for internal professional advisers and nothing contained in this document should be construed as an invitation or an offer to invest or a recommendation to buy or sell any particular security or to adopt any investment strategy. Although the information provided in this document is obtained or compiled from what we believe to be reliable sources, AMG Financial Group Limited and its affiliates and the author cannot and does not warrant, guarantee or represent, expressly or impliedly, the accuracy, validity or completeness of any information or data made available to the recipients of this document for any particular purpose and no liability in respect of any errors or omissions is accepted by AMG Financial Group Limited or its affiliates or any director or employee of AMG Financial Group Limited or his/her affiliates or the author. The author’s views are subject to change without notice to the recipients of this document. Past performance is not necessarily a guide to future performance, the value of any investment and the income from it can rise as well as can fall as

Page.12 of 12
a result of currency and market fluctuations. The recipients of this document should seek for professional advice if they are in any doubt about any of the information contained herein. For any comments, please send email to us at [email protected]. AMG Financial Group 5/F, Guangdong Investment Tower, 148 Connaught Road Central, Central, HONG KONG Telephone: (852) 3970 9531 Facsimile: (852) 3426 2650