Embed Size (px)
Citation preview
MAS Staff Paper No. 42
December 2005
China's Rise as a ManufacturingPowerhouse:
Implications for Asia
CHINA’S RISE AS A MANUFACTURING POWERHOUSE: IMPLICATIONS FOR ASIA*
BY
KIT WEI ZHENG ONG JIA WERN
KEVIN KWAN TAI YOU
MACROECONOMIC SURVEILLANCE DEPARTMENT
MONETARY AUTHORITY OF SINGAPORE
DECEMBER 2005 *THE VIEWS EXPRESSED IN THIS PAPER ARE SOLELY THOSE OF THE AUTHORS, AND SHOULD NOT BE ATTRIBUTED TO THE MONETARY AUTHORITY OF SINGAPORE. THE AUTHORS ARE GRATEFUL TO DR. KHOR HOE EE, WONG FOT CHYI AND NG BOK ENG FOR PROVIDING USEFUL COMMENTS AND SUGGESTIONS ON THE PAPER.
THE MONETARY AUTHORITY OF SINGAPORE JEL CLASSIFICATION NUMBER: F10, F14, F23, L60 KEYWORDS: CHINA, MANUFACTURING, PRODUCTION NETWORKS, EAST ASIA, TRADE, INVESTMENTS
MAS Staff Paper No. 42 December 2005
MONETARY AUTHORITY OF SINGAPORE i
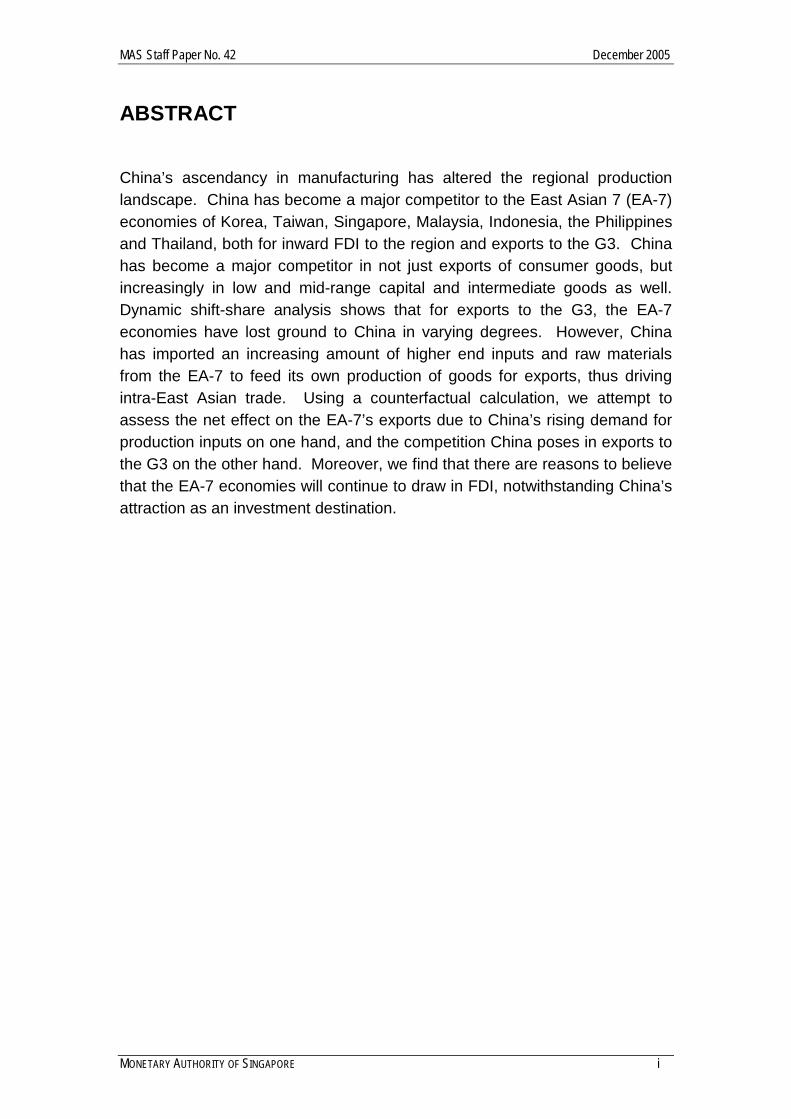
ABSTRACT
China’s ascendancy in manufacturing has altered the regional production landscape. China has become a major competitor to the East Asian 7 (EA-7) economies of Korea, Taiwan, Singapore, Malaysia, Indonesia, the Philippines and Thailand, both for inward FDI to the region and exports to the G3. China has become a major competitor in not just exports of consumer goods, but increasingly in low and mid-range capital and intermediate goods as well. Dynamic shift-share analysis shows that for exports to the G3, the EA-7 economies have lost ground to China in varying degrees. However, China has imported an increasing amount of higher end inputs and raw materials from the EA-7 to feed its own production of goods for exports, thus driving intra-East Asian trade. Using a counterfactual calculation, we attempt to assess the net effect on the EA-7’s exports due to China’s rising demand for production inputs on one hand, and the competition China poses in exports to the G3 on the other hand. Moreover, we find that there are reasons to believe that the EA-7 economies will continue to draw in FDI, notwithstanding China’s attraction as an investment destination.
MAS Staff Paper No. 42 December 2005
MONETARY AUTHORITY OF SINGAPORE ii
EXECUTIVE SUMMARY
The rapid emergence of China as a manufacturing powerhouse has fundamentally changed the regional production landscape. China’s rise in manufacturing has followed the opening-up of its economy, which led to FDI inflows surging over 900 times between 1980 and 2004. The FDI inflows to China had posed considerable competition to the ASEAN economies as there were significant overlaps in manufacturing capabilities. Due to the close cultural ties and proximity, Taiwan also saw significant relocation of its manufacturing activities to China, particularly in electronics. Taiwanese electronics companies now carry out roughly a third of their production in China, and collectively account for around 60% of China’s total information technology exports. Largely as a result of this relocation of electronics production, our back-of-the-envelope estimates suggest that China’s share of East Asian value-added in a typical personal computer (PC) tripled from just 10% in 1997 to 30% in 2003. The influx of manufacturing FDI to China has altered the trade patterns in Asia. China’s rise as a manufacturing hub has intensified competition with the EA-7 economies of Korea, Taiwan, Singapore, Malaysia, Indonesia, the Philippines and Thailand in exports to the G3 markets. To assess the relative impact of competition from China on the regional economies, the technique of dynamic shift-share analysis was employed, which compares the performance of an economy’s exports to a common third market with a group of reference competing economies, after accounting for size differences. A positive net shift means that the country in question has outperformed relative to the reference group. The analysis shows that all the EA-7 economies experienced negative net shifts, with the NIE-3 economies of Singapore, Taiwan and Korea experiencing the largest negative net shifts. This is true not just in labour-intensive consumer goods, where the NIE-3 are disadvantaged because of their higher wage costs, but also in low-end capital and intermediate goods exports. However, with China assuming the role of the key node within the regional production network, it has also become an important market for the EA-7’s exports. In particular, China has been a key catalyst in spurring intra-Asian trade due to its growing demand for capital and intermediate goods, as well as raw materials. As a result of China’s rising dependence on foreign inputs, the share of foreign value-added in China’s processed exports has been rising. China’s exports contain a relatively low proportion of Chinese value-added as
MAS Staff Paper No. 42 December 2005
MONETARY AUTHORITY OF SINGAPORE iii
labour costs comprise only an estimated 10-30% of total manufacturing costs, while 40-50% of components are imported. China’s dependence on the EA-7 economies for production inputs is strongest in the high-end segment, where it does not have a comparative advantage presently. This dependence is expected to persist in the foreseeable future for several reasons. First, China’s current weak intellectual property rights regime is likely to discourage foreign companies from shifting production of high-end goods into China. For example, in just six months after Pfizer’s Viagra was launched in the Chinese market, 90% of the Viagra sold in Shanghai was found to be counterfeit. Second, some foreign governments continue to maintain restrictions on the transfer of certain types of high-end technology to China. Third, China's own booming demand for increasingly sophisticated consumer products will require significantly more high-end inputs, such as semiconductors, LCD screens and auto parts. On balance, our estimates suggest that the EA-7 economies have gained more from trade than they have lost as a result of China's rise as a manufacturing hub. Using a simple counterfactual calculation, we find that the positive effect of China's demand for imported inputs from the EA-7 economies dominated the negative effect from increased competition in 14 of the last 20 years. Furthermore, in the long run, the rise of China’s middle-income consuming market is likely to boost its imports from the EA-7 even more, potentially outweighing the competition that China poses as a low-cost producer and exporter. Notwithstanding China’s attraction as an investment destination, there are reasons to believe that the EA-7 economies will not hollow out. First, foreign companies will still want to maintain operations outside China to diversify their risk. Second, the EA-7 economies have carved out a niche in higher value-added activities, while China’s niche remains largely as a manufacturing and assembly base for lower-end products.. Third, investment in China may not necessarily be more profitable, due to strong competition and hidden non-wage costs. For example, manufacturing a car in China is actually more expensive than in Germany because labour only accounts for a small portion of the overall cost. As a result of all these factors, some foreign companies have left China. In 2004, disinvestment from foreign companies reached US$5.7bn. In conclusion, the influx of manufacturing FDI to China has led to increasing competition with the EA-7 economies in not just consumer goods exports, but
MAS Staff Paper No. 42 December 2005
MONETARY AUTHORITY OF SINGAPORE iv
also low and mid-range capital and intermediate goods exports, especially in electronics. However, China’s imports of high-end capital and intermediate goods and raw materials from the EA-7 economies have also surged. On balance, we find that the positive effect of China’s demand for production inputs from the EA-7 economies has dominated the negative impact of competition from China in exports to developed markets. Finally, notwithstanding China’s attraction as an investment destination, there are reasons to believe that the EA-7 economies will not hollow out. Companies may wish to diversify their risk, which will encourage them to maintain or strengthen operations in the EA-7 economies even as they expand into China.
MAS Staff Paper No. 42 December 2005
MONETARY AUTHORITY OF SINGAPORE v
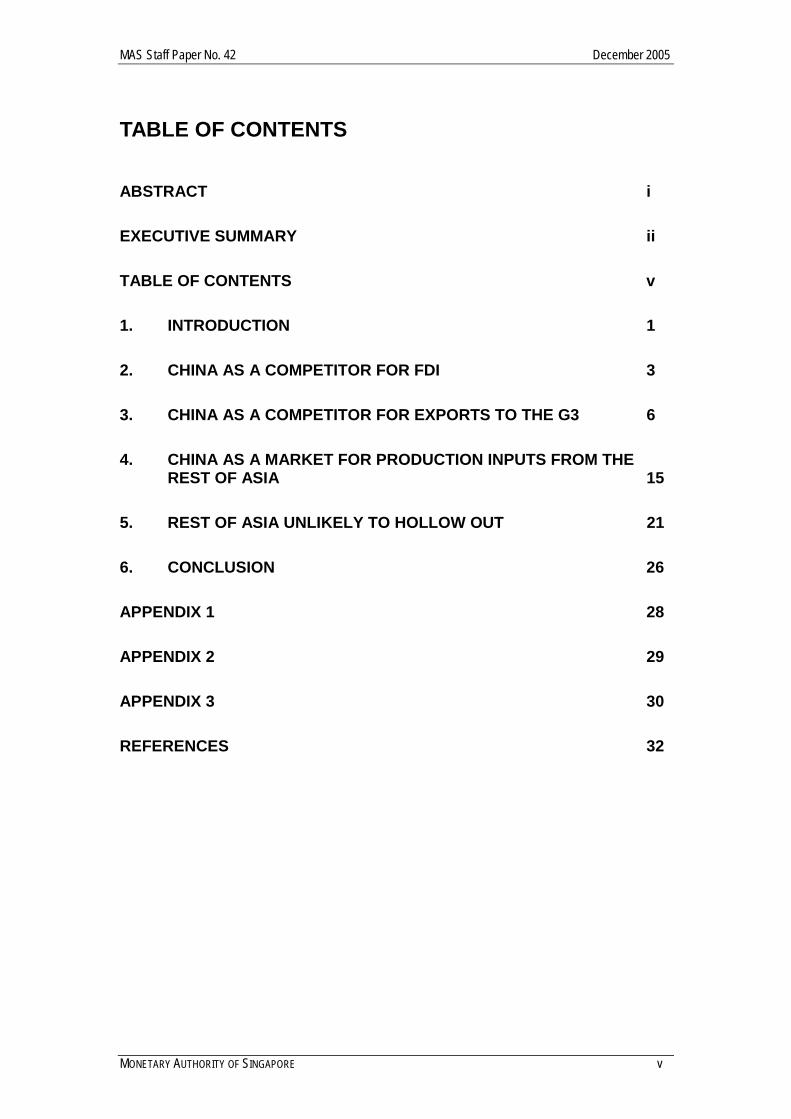
TABLE OF CONTENTS ABSTRACT i EXECUTIVE SUMMARY ii TABLE OF CONTENTS v 1. INTRODUCTION 1 2. CHINA AS A COMPETITOR FOR FDI 3 3. CHINA AS A COMPETITOR FOR EXPORTS TO THE G3 6 4. CHINA AS A MARKET FOR PRODUCTION INPUTS FROM THE
REST OF ASIA 15 5. REST OF ASIA UNLIKELY TO HOLLOW OUT 21 6. CONCLUSION 26 APPENDIX 1 28 APPENDIX 2 29 APPENDIX 3 30 REFERENCES 32
MAS Staff Paper No. 42 December 2005
MONETARY AUTHORITY OF SINGAPORE 1
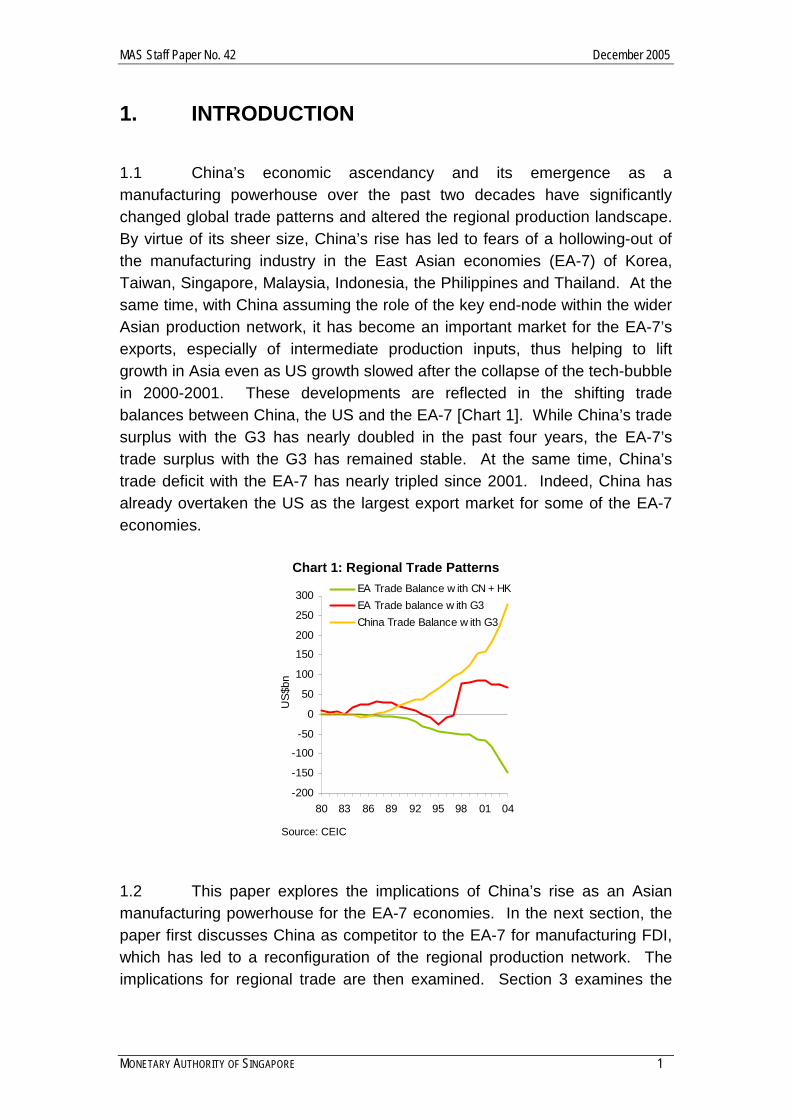
1. INTRODUCTION 1.1 China’s economic ascendancy and its emergence as a manufacturing powerhouse over the past two decades have significantly changed global trade patterns and altered the regional production landscape. By virtue of its sheer size, China’s rise has led to fears of a hollowing-out of the manufacturing industry in the East Asian economies (EA-7) of Korea, Taiwan, Singapore, Malaysia, Indonesia, the Philippines and Thailand. At the same time, with China assuming the role of the key end-node within the wider Asian production network, it has become an important market for the EA-7’s exports, especially of intermediate production inputs, thus helping to lift growth in Asia even as US growth slowed after the collapse of the tech-bubble in 2000-2001. These developments are reflected in the shifting trade balances between China, the US and the EA-7 [Chart 1]. While China’s trade surplus with the G3 has nearly doubled in the past four years, the EA-7’s trade surplus with the G3 has remained stable. At the same time, China’s trade deficit with the EA-7 has nearly tripled since 2001. Indeed, China has already overtaken the US as the largest export market for some of the EA-7 economies.
Chart 1: Regional Trade Patterns
-200
-150
-100
-50
0
50
100
150
200
250
300
80 83 86 89 92 95 98 01 04
US$
bn
EA Trade Balance w ith CN + HKEA Trade balance w ith G3China Trade Balance w ith G3
Source: CEIC
1.2 This paper explores the implications of China’s rise as an Asian manufacturing powerhouse for the EA-7 economies. In the next section, the paper first discusses China as competitor to the EA-7 for manufacturing FDI, which has led to a reconfiguration of the regional production network. The implications for regional trade are then examined. Section 3 examines the

MAS Staff Paper No. 42 December 2005
MONETARY AUTHORITY OF SINGAPORE 2
negative impact of rising Chinese competition in displacing the EA-7’s exports of final goods to the developed markets, while Section 4 evaluates the positive impact of China as a rapidly growing market for the EA-7’s exports of capital and intermediate goods, as well as raw materials. A counterfactual calculation suggests that the net effect for the EA-7 could be a positive one. Lastly, in Section 5, we discuss reasons why the EA-7 economies will not hollow out even as FDI continues to be drawn into China.
MAS Staff Paper No. 42 December 2005
MONETARY AUTHORITY OF SINGAPORE 3
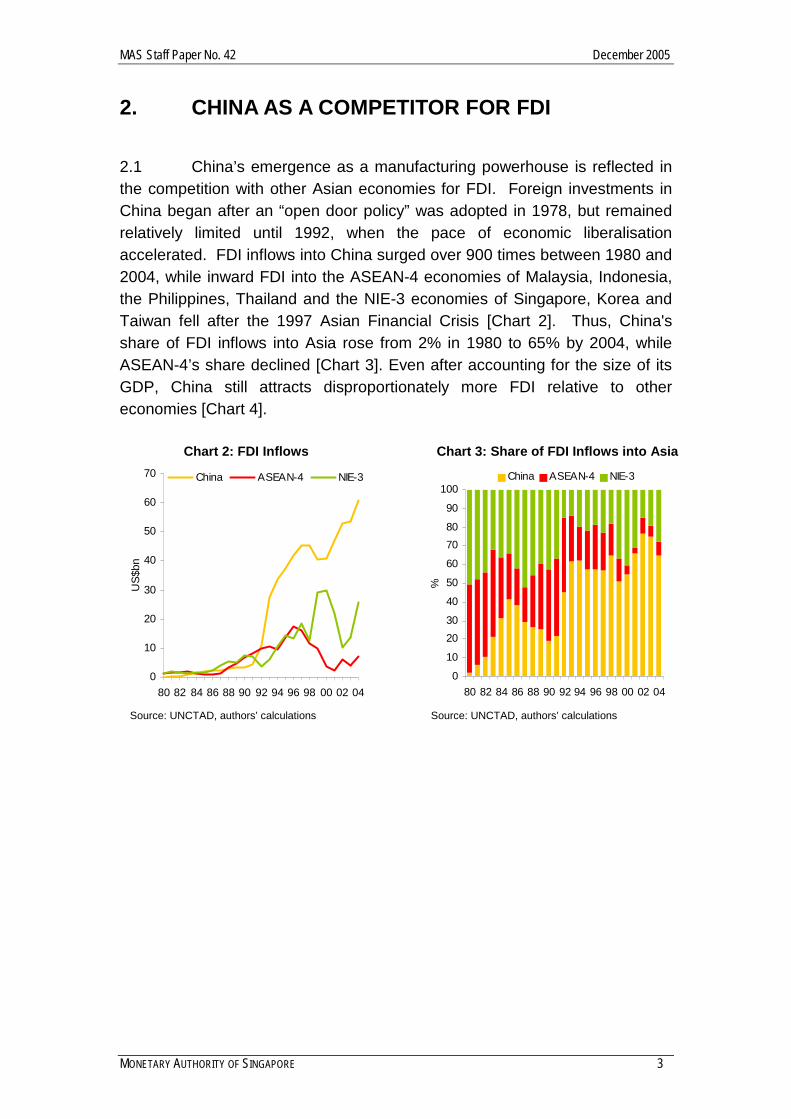
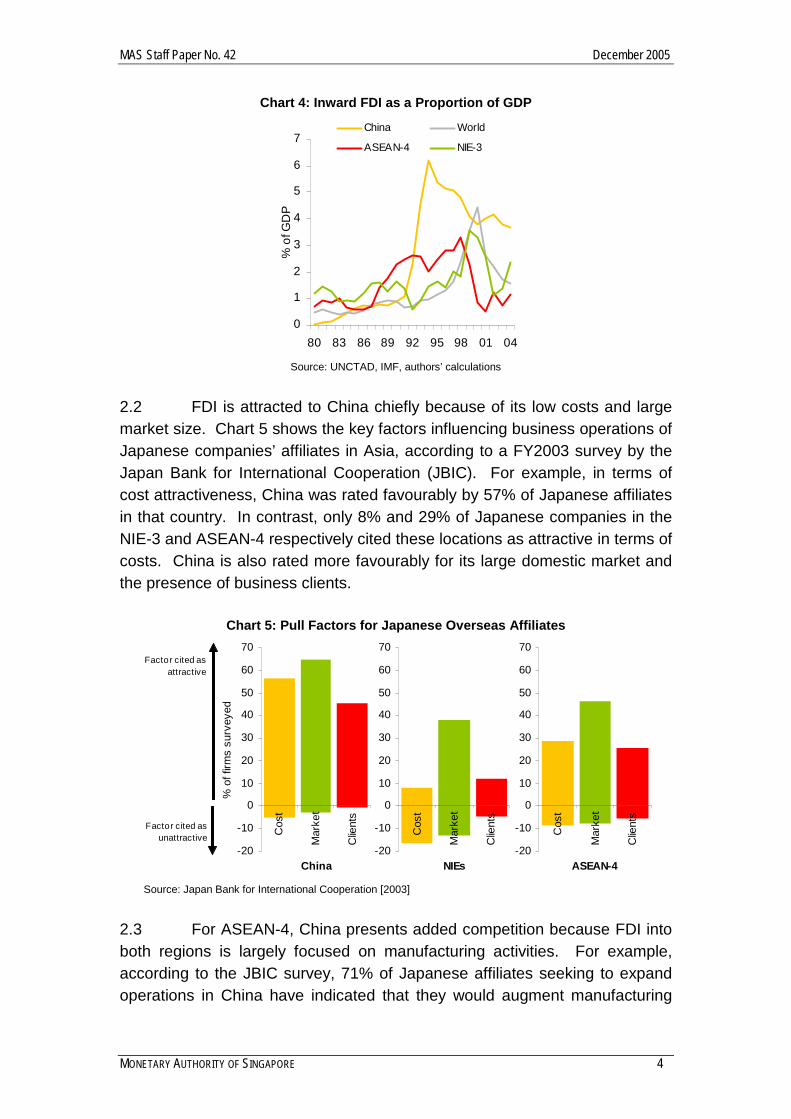
2. CHINA AS A COMPETITOR FOR FDI 2.1 China’s emergence as a manufacturing powerhouse is reflected in the competition with other Asian economies for FDI. Foreign investments in China began after an “open door policy” was adopted in 1978, but remained relatively limited until 1992, when the pace of economic liberalisation accelerated. FDI inflows into China surged over 900 times between 1980 and 2004, while inward FDI into the ASEAN-4 economies of Malaysia, Indonesia, the Philippines, Thailand and the NIE-3 economies of Singapore, Korea and Taiwan fell after the 1997 Asian Financial Crisis [Chart 2]. Thus, China's share of FDI inflows into Asia rose from 2% in 1980 to 65% by 2004, while ASEAN-4’s share declined [Chart 3]. Even after accounting for the size of its GDP, China still attracts disproportionately more FDI relative to other economies [Chart 4].
Chart 2: FDI Inflows
0
10
20
30
40
50
60
70
80 82 84 86 88 90 92 94 96 98 00 02 04
US$
bn
China ASEAN-4 NIE-3
Source: UNCTAD, authors’ calculations
Chart 3: Share of FDI Inflows into Asia
0
10
2030
40
50
60
7080
90
100
80 82 84 86 88 90 92 94 96 98 00 02 04
%
China ASEAN-4 NIE-3
Source: UNCTAD, authors’ calculations
MAS Staff Paper No. 42 December 2005
MONETARY AUTHORITY OF SINGAPORE 4
Chart 4: Inward FDI as a Proportion of GDP
0
1
2
3
4
5
6
7
80 83 86 89 92 95 98 01 04
% o
f GD
P
China World
ASEAN-4 NIE-3
Source: UNCTAD, IMF, authors’ calculations
2.2 FDI is attracted to China chiefly because of its low costs and large market size. Chart 5 shows the key factors influencing business operations of Japanese companies’ affiliates in Asia, according to a FY2003 survey by the Japan Bank for International Cooperation (JBIC). For example, in terms of cost attractiveness, China was rated favourably by 57% of Japanese affiliates in that country. In contrast, only 8% and 29% of Japanese companies in the NIE-3 and ASEAN-4 respectively cited these locations as attractive in terms of costs. China is also rated more favourably for its large domestic market and the presence of business clients.
Chart 5: Pull Factors for Japanese Overseas Affiliates
Factor cited as unattractive
-20
-10
0
10
20
30
40
50
60
70
Cos
t
Mar
ket
Clie
nts
China
% o
f firm
s su
rvey
ed
-20
-10
0
10
20
30
40
50
60
70
Cos
t
Mar
ket
Clie
nts
NIEs-20
-10
0
10
20
30
40
50
60
70
Cos
t
Mar
ket
Clie
nts
ASEAN-4
Factor cited as attractive
Source: Japan Bank for International Cooperation [2003]
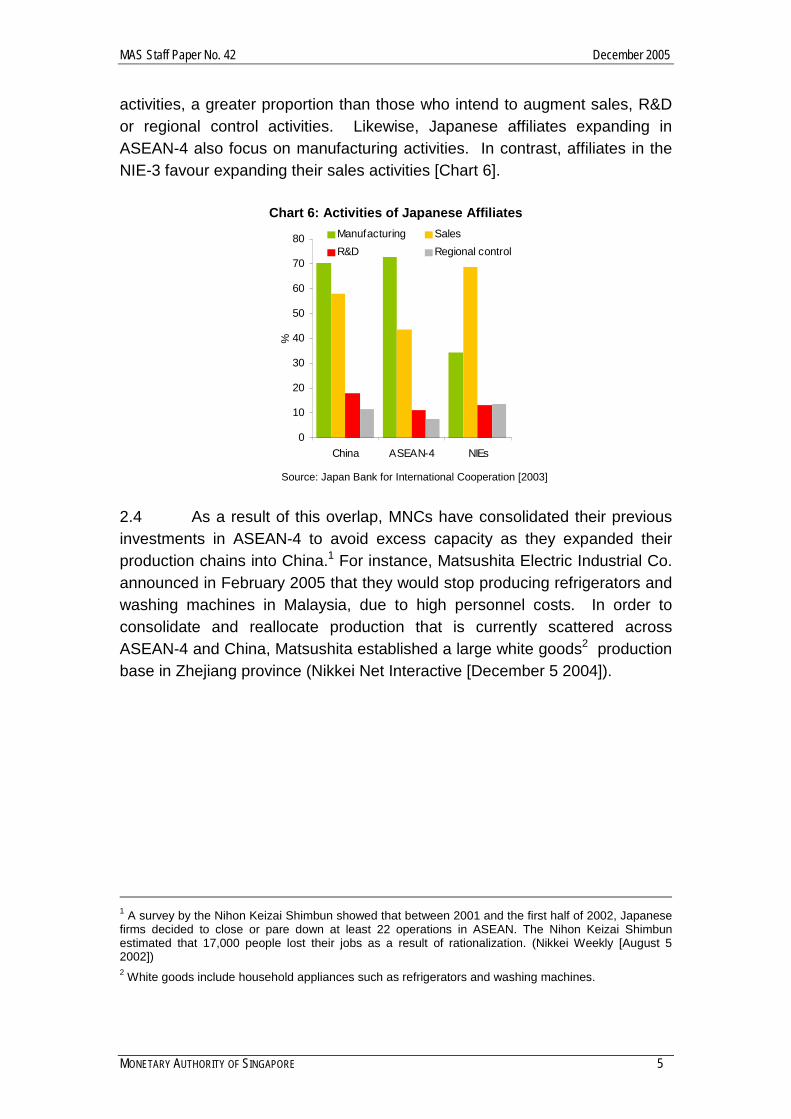
2.3 For ASEAN-4, China presents added competition because FDI into both regions is largely focused on manufacturing activities. For example, according to the JBIC survey, 71% of Japanese affiliates seeking to expand operations in China have indicated that they would augment manufacturing
MAS Staff Paper No. 42 December 2005
MONETARY AUTHORITY OF SINGAPORE 5
activities, a greater proportion than those who intend to augment sales, R&D or regional control activities. Likewise, Japanese affiliates expanding in ASEAN-4 also focus on manufacturing activities. In contrast, affiliates in the NIE-3 favour expanding their sales activities [Chart 6].
Chart 6: Activities of Japanese Affiliates
0
10
20
30
40
50
60
70
80
China ASEAN-4 NIEs
%
Manufacturing Sales R&D Regional control
Source: Japan Bank for International Cooperation [2003]
2.4 As a result of this overlap, MNCs have consolidated their previous investments in ASEAN-4 to avoid excess capacity as they expanded their production chains into China.1 For instance, Matsushita Electric Industrial Co. announced in February 2005 that they would stop producing refrigerators and washing machines in Malaysia, due to high personnel costs. In order to consolidate and reallocate production that is currently scattered across ASEAN-4 and China, Matsushita established a large white goods2 production base in Zhejiang province (Nikkei Net Interactive [December 5 2004]).
1 A survey by the Nihon Keizai Shimbun showed that between 2001 and the first half of 2002, Japanese firms decided to close or pare down at least 22 operations in ASEAN. The Nihon Keizai Shimbun estimated that 17,000 people lost their jobs as a result of rationalization. (Nikkei Weekly [August 5 2002]) 2 White goods include household appliances such as refrigerators and washing machines.
MAS Staff Paper No. 42 December 2005
MONETARY AUTHORITY OF SINGAPORE 6
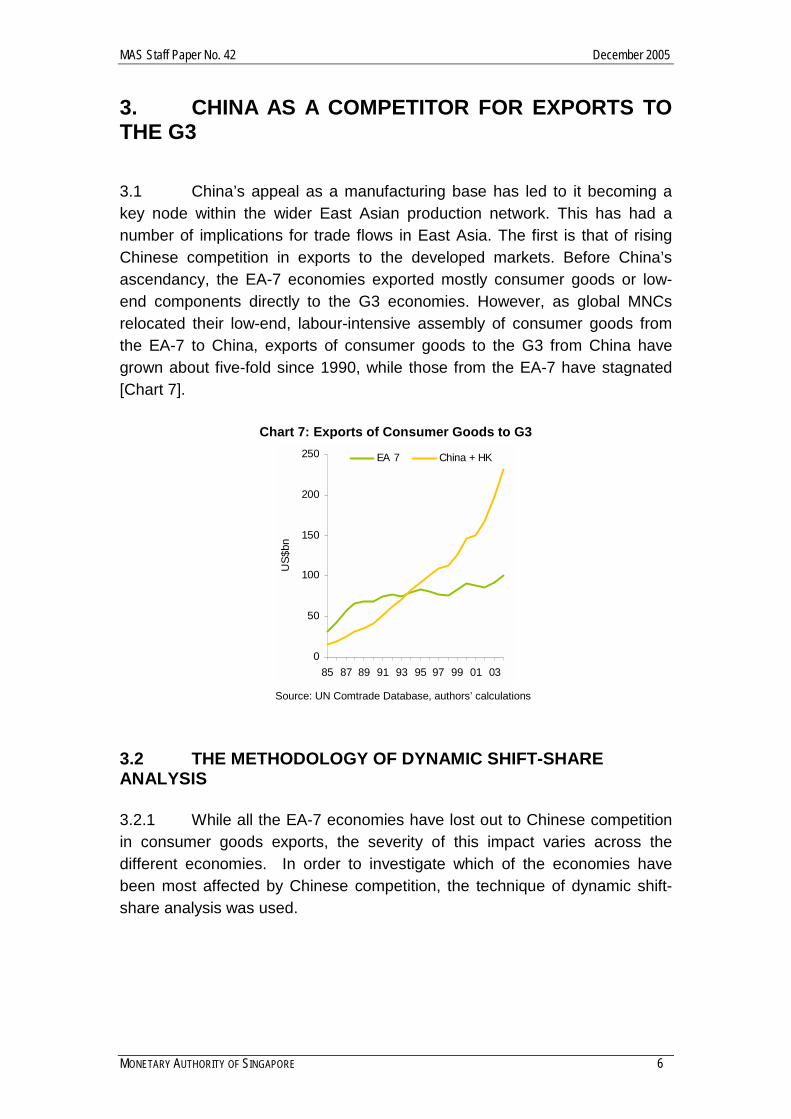
3. CHINA AS A COMPETITOR FOR EXPORTS TO THE G3 3.1 China’s appeal as a manufacturing base has led to it becoming a key node within the wider East Asian production network. This has had a number of implications for trade flows in East Asia. The first is that of rising Chinese competition in exports to the developed markets. Before China’s ascendancy, the EA-7 economies exported mostly consumer goods or low-end components directly to the G3 economies. However, as global MNCs relocated their low-end, labour-intensive assembly of consumer goods from the EA-7 to China, exports of consumer goods to the G3 from China have grown about five-fold since 1990, while those from the EA-7 have stagnated [Chart 7].
Chart 7: Exports of Consumer Goods to G3
0
50
100
150
200
250
85 87 89 91 93 95 97 99 01 03
US$
bn
EA 7 China + HK
Source: UN Comtrade Database, authors’ calculations
3.2 THE METHODOLOGY OF DYNAMIC SHIFT-SHARE ANALYSIS 3.2.1 While all the EA-7 economies have lost out to Chinese competition in consumer goods exports, the severity of this impact varies across the different economies. In order to investigate which of the economies have been most affected by Chinese competition, the technique of dynamic shift-share analysis was used.
MAS Staff Paper No. 42 December 2005
MONETARY AUTHORITY OF SINGAPORE 7
3.2.2 Shift share analysis is a well-established methodology that allows for a more relevant comparison of export competitiveness by taking into account size effects.3 (Robinson et al. [2002]) Specifically, it compares a home country’s exports to third-country markets with like exports from some reference competing economies. A country is said to have experienced a positive net shift in exports to a market if its export growth exceeds its share effect.4 A positive net shift thus represents an improvement in competitiveness for the country relative to the reference group as a whole. To put it simply, as a measure of relative performance, a shift-share analysis assumes a zero-sum competition between all economies in the reference ‘universe’ of economies. A negative net shift need not imply a contraction in that country’s exports to the destination, because shift share measures relative, rather than absolute performance. A country could experience a negative net shift for example, if its exports are growing positively, but at a slower rate than the weighted average growth rate of the reference economies. 3.2.3 The net shift for any individual country can, in turn, be decomposed into three effects: (a) the industry mix effect; (b) the competitive effect; and (c) the interaction effect. 3.2.4 The Industry Mix Effect (IME) measures the portion of net shift arising from the difference between the weight of a commodity in the home country’s exports and that of the reference competitors’ exports. A positive IME results when the weight of a commodity in the home country’s exports is higher than that of the reference countries and there is positive growth in the reference competitors’ exports of that commodity. In such an instance, the home country is said to have a structural advantage in the export of that commodity. 3.2.5 The Competitive Effect (CE) measures the portion of net shift arising from the difference in export growth of the home country and the reference competing economies. The competitive effect is positive when the home country’s export growth is higher than that of the reference competing
3 Shift share analysis is a more relevant comparison than simply observing absolute changes or percentage changes in exports to particular markets. While the former tends to overstate the importance of larger markets, the latter exaggerates the importance of smaller markets. 4 Share effect refers to the amount by which the exports of a particular commodity would have grown if its growth and concentration in total exports had been the same as that of the reference competing economies.
MAS Staff Paper No. 42 December 2005
MONETARY AUTHORITY OF SINGAPORE 8
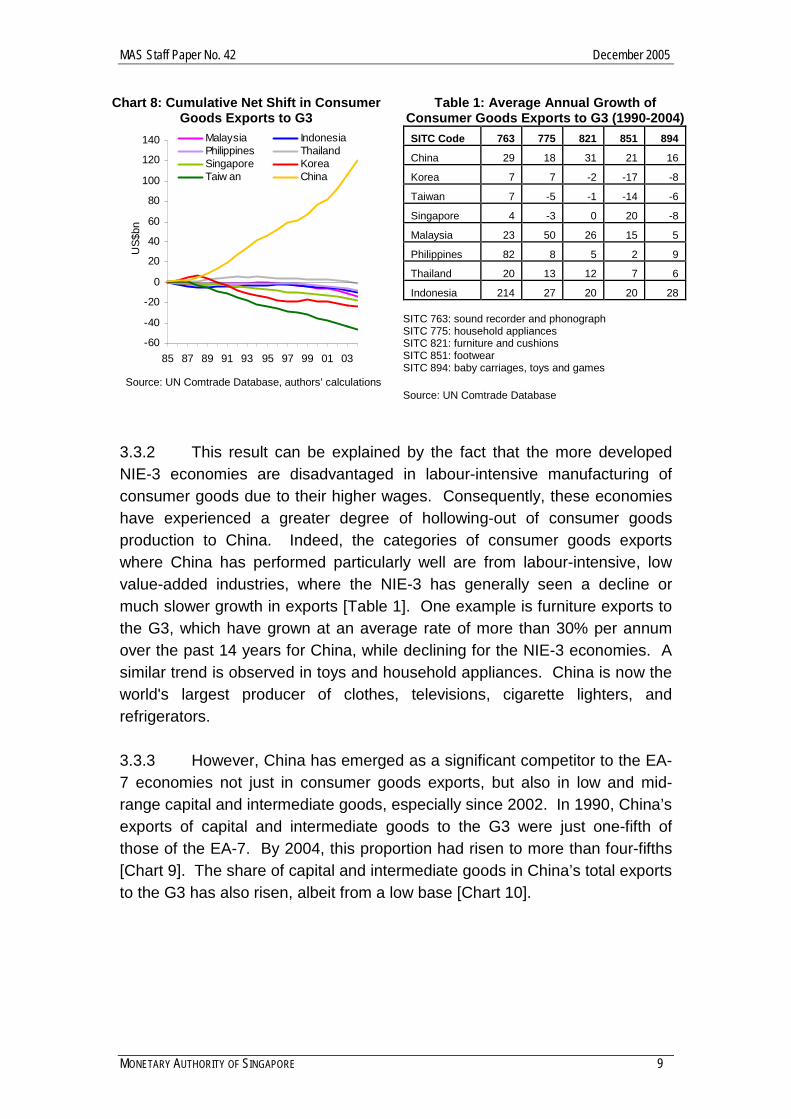
economies. In this case, the home country is said to have a competitive advantage. 3.2.6 The Interaction Effect (IE) measures the portion of the net shift arising from the interaction between the difference in export structures and the difference in export growth rates between the home country and the reference competitors. A positive IE results when the home country possesses an export structure that is more concentrated in those commodities which are growing faster or is less concentrated in those commodities which are growing more slowly. 3.2.7 For the purpose of our analysis, the common export market includes the G3 economies of the US, Japan and the Euro area (EU-15). The reference “competing” East Asian economies are the EA-7 economies and China and Hong Kong (taken as one combined entity).5 3.3 RESULTS OF DYNAMIC SHIFT SHARE ANALYSIS 3.3.1 The results of shift-share analysis show that all the EA-7 economies suffered negative net shifts as a result of Chinese competition, with the NIE-3 economies experiencing the largest negative net shifts [Chart 8]. Looking first at consumer goods exports, on a cumulative basis between 1985 and 2004, China saw an increase of US$120bn in consumer goods exports to the G3 relative to what it would have experienced if its exports to G3 had grown at the same rate and had the same export structure as the reference East Asian group. In this case, China is said to experience a positive net shift of US$120bn in its consumer goods exports to the G3. In contrast, Taiwan experienced a negative net shift of US$46bn.
5 This, and the subsequent shift-share results discussed in this paper, uses 3-digit SITC export data classified into consumer goods, capital goods, intermediate goods and raw materials. The detailed classification may be found in Appendix 2.
MAS Staff Paper No. 42 December 2005
MONETARY AUTHORITY OF SINGAPORE 9
Chart 8: Cumulative Net Shift in Consumer Goods Exports to G3
-60
-40
-20
0
20
40
60
80
100
120
140
85 87 89 91 93 95 97 99 01 03
US$
bnMalaysia IndonesiaPhilippines ThailandSingapore KoreaTaiw an China
Source: UN Comtrade Database, authors’ calculations
Table 1: Average Annual Growth of Consumer Goods Exports to G3 (1990-2004) SITC Code 763 775 821 851 894
China 29 18 31 21 16
Korea 7 7 -2 -17 -8
Taiwan 7 -5 -1 -14 -6
Singapore 4 -3 0 20 -8
Malaysia 23 50 26 15 5
Philippines 82 8 5 2 9
Thailand 20 13 12 7 6
Indonesia 214 27 20 20 28 SITC 763: sound recorder and phonograph SITC 775: household appliances SITC 821: furniture and cushions SITC 851: footwear SITC 894: baby carriages, toys and games Source: UN Comtrade Database
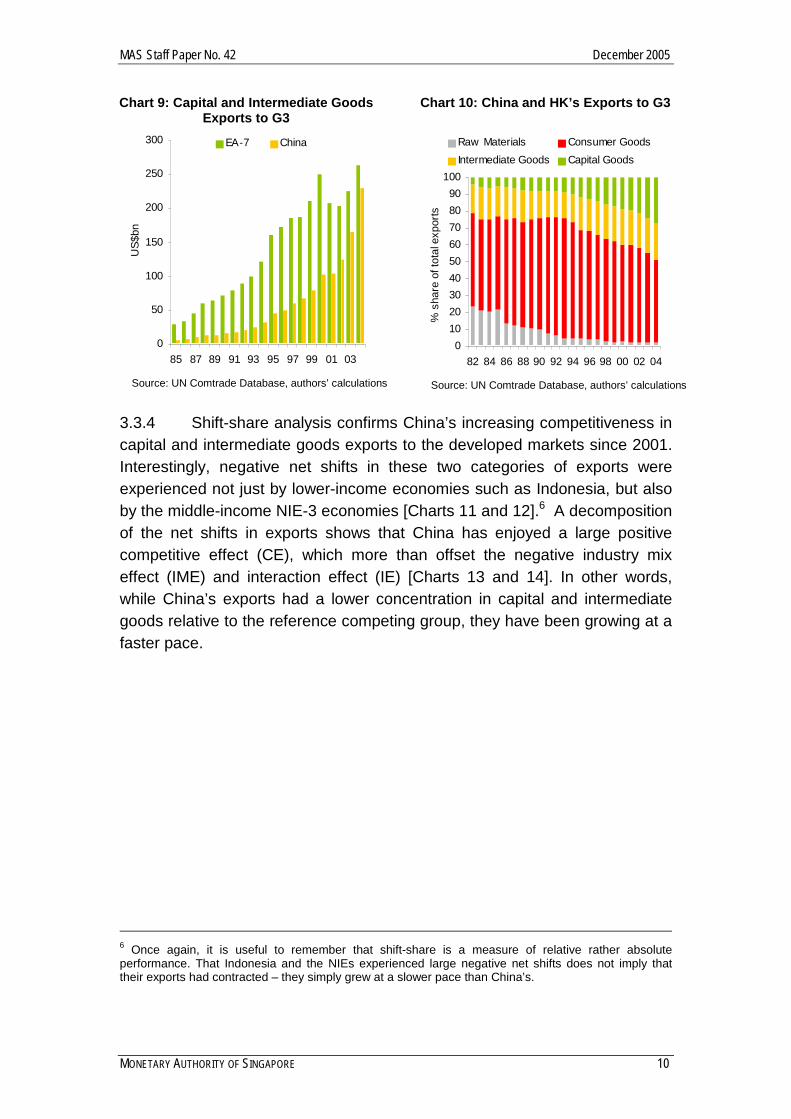
3.3.2 This result can be explained by the fact that the more developed NIE-3 economies are disadvantaged in labour-intensive manufacturing of consumer goods due to their higher wages. Consequently, these economies have experienced a greater degree of hollowing-out of consumer goods production to China. Indeed, the categories of consumer goods exports where China has performed particularly well are from labour-intensive, low value-added industries, where the NIE-3 has generally seen a decline or much slower growth in exports [Table 1]. One example is furniture exports to the G3, which have grown at an average rate of more than 30% per annum over the past 14 years for China, while declining for the NIE-3 economies. A similar trend is observed in toys and household appliances. China is now the world's largest producer of clothes, televisions, cigarette lighters, and refrigerators. 3.3.3 However, China has emerged as a significant competitor to the EA-7 economies not just in consumer goods exports, but also in low and mid-range capital and intermediate goods, especially since 2002. In 1990, China’s exports of capital and intermediate goods to the G3 were just one-fifth of those of the EA-7. By 2004, this proportion had risen to more than four-fifths [Chart 9]. The share of capital and intermediate goods in China’s total exports to the G3 has also risen, albeit from a low base [Chart 10].
MAS Staff Paper No. 42 December 2005
MONETARY AUTHORITY OF SINGAPORE 10
Chart 9: Capital and Intermediate Goods Exports to G3
0
50
100
150
200
250
300
85 87 89 91 93 95 97 99 01 03
US$
bnEA-7 China
Source: UN Comtrade Database, authors’ calculations
Chart 10: China and HK’s Exports to G3
0102030405060708090
100
82 84 86 88 90 92 94 96 98 00 02 04
% s
hare
of t
otal
exp
orts
Raw Materials Consumer GoodsIntermediate Goods Capital Goods
Source: UN Comtrade Database, authors’ calculations
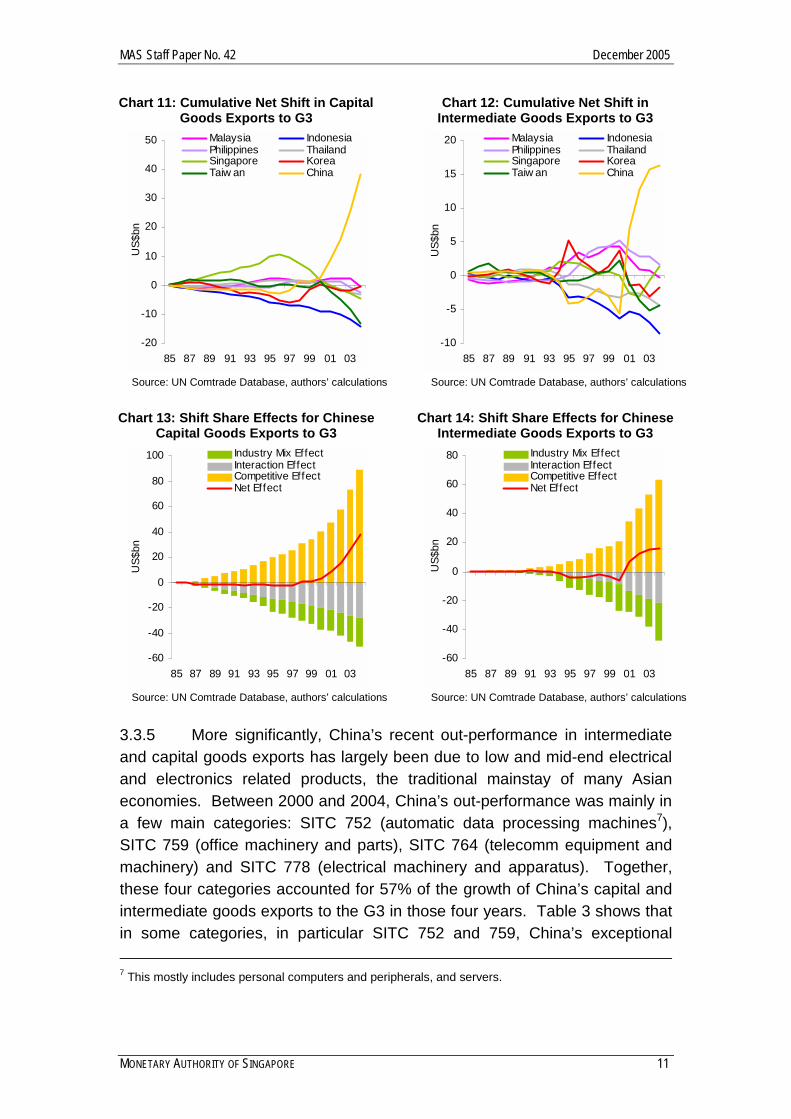
3.3.4 Shift-share analysis confirms China’s increasing competitiveness in capital and intermediate goods exports to the developed markets since 2001. Interestingly, negative net shifts in these two categories of exports were experienced not just by lower-income economies such as Indonesia, but also by the middle-income NIE-3 economies [Charts 11 and 12].6 A decomposition of the net shifts in exports shows that China has enjoyed a large positive competitive effect (CE), which more than offset the negative industry mix effect (IME) and interaction effect (IE) [Charts 13 and 14]. In other words, while China’s exports had a lower concentration in capital and intermediate goods relative to the reference competing group, they have been growing at a faster pace.
6 Once again, it is useful to remember that shift-share is a measure of relative rather absolute performance. That Indonesia and the NIEs experienced large negative net shifts does not imply that their exports had contracted – they simply grew at a slower pace than China’s.
MAS Staff Paper No. 42 December 2005
MONETARY AUTHORITY OF SINGAPORE 11
Chart 11: Cumulative Net Shift in Capital Goods Exports to G3
-20
-10
0
10
20
30
40
50
85 87 89 91 93 95 97 99 01 03
US$
bnMalaysia IndonesiaPhilippines ThailandSingapore KoreaTaiw an China
Source: UN Comtrade Database, authors’ calculations
Chart 12: Cumulative Net Shift in Intermediate Goods Exports to G3
-10
-5
0
5
10
15
20
85 87 89 91 93 95 97 99 01 03
US$
bn
Malaysia IndonesiaPhilippines ThailandSingapore KoreaTaiw an China
Source: UN Comtrade Database, authors’ calculations
Chart 13: Shift Share Effects for Chinese
Capital Goods Exports to G3
-60
-40
-20
0
20
40
60
80
100
85 87 89 91 93 95 97 99 01 03
US$
bn
Industry Mix EffectInteraction EffectCompetitive EffectNet Effect
Source: UN Comtrade Database, authors’ calculations
Chart 14: Shift Share Effects for Chinese Intermediate Goods Exports to G3
-60
-40
-20
0
20
40
60
80
85 87 89 91 93 95 97 99 01 03
US$
bn
Industry Mix EffectInteraction EffectCompetitive EffectNet Effect
Source: UN Comtrade Database, authors’ calculations
3.3.5 More significantly, China’s recent out-performance in intermediate and capital goods exports has largely been due to low and mid-end electrical and electronics related products, the traditional mainstay of many Asian economies. Between 2000 and 2004, China’s out-performance was mainly in a few main categories: SITC 752 (automatic data processing machines7), SITC 759 (office machinery and parts), SITC 764 (telecomm equipment and machinery) and SITC 778 (electrical machinery and apparatus). Together, these four categories accounted for 57% of the growth of China’s capital and intermediate goods exports to the G3 in those four years. Table 3 shows that in some categories, in particular SITC 752 and 759, China’s exceptional 7 This mostly includes personal computers and peripherals, and servers.
MAS Staff Paper No. 42 December 2005
MONETARY AUTHORITY OF SINGAPORE 12
growth has been accompanied by relatively poor performance from the EA-7 economies. Nonetheless, Table 2 also shows that while the EA-7’s exports of SITC 752 and 759 have declined, its exports of SITC 764 and 778 have held up well despite competition from China.
Table 2: Average Annual Growth of Exports to G3 for Major Capital and Intermediate Goods Categories (2000-2004)
SITC Code 752 759 764 778 China 45 26 32 22 Korea -7 19 33 31 Taiwan 0 -6 8 8Singapore -7 2 17 4Malaysia 11 -2 21 10 Philippines 1 -17 11 21 Thailand 3 18 19 4Indonesia 5 -13 7 10
SITC 752: automatic data processing machines SITC 759: office parts and machinery SITC 764: telecomm equipment and machinery SITC 778: electrical machinery and apparatus Source: UN Comtrade Database, authors’ calculations
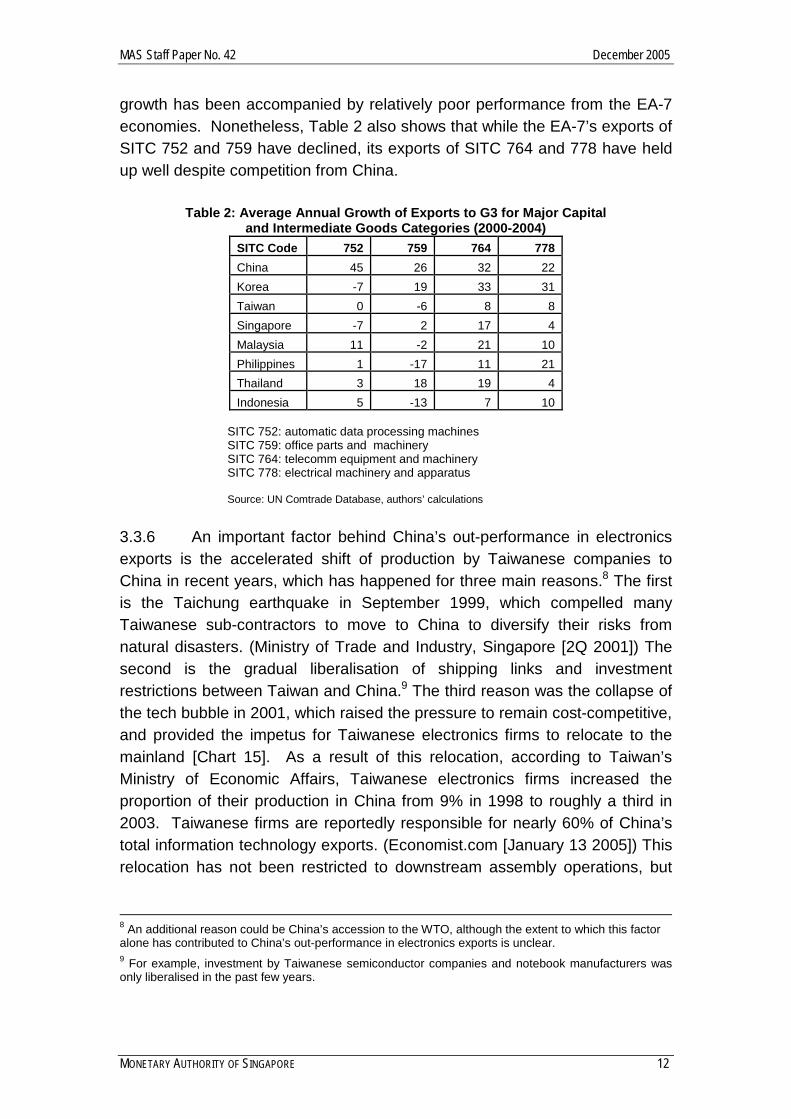
3.3.6 An important factor behind China’s out-performance in electronics exports is the accelerated shift of production by Taiwanese companies to China in recent years, which has happened for three main reasons.8 The first is the Taichung earthquake in September 1999, which compelled many Taiwanese sub-contractors to move to China to diversify their risks from natural disasters. (Ministry of Trade and Industry, Singapore [2Q 2001]) The second is the gradual liberalisation of shipping links and investment restrictions between Taiwan and China.9 The third reason was the collapse of the tech bubble in 2001, which raised the pressure to remain cost-competitive, and provided the impetus for Taiwanese electronics firms to relocate to the mainland [Chart 15]. As a result of this relocation, according to Taiwan’s Ministry of Economic Affairs, Taiwanese electronics firms increased the proportion of their production in China from 9% in 1998 to roughly a third in 2003. Taiwanese firms are reportedly responsible for nearly 60% of China’s total information technology exports. (Economist.com [January 13 2005]) This relocation has not been restricted to downstream assembly operations, but
8 An additional reason could be China’s accession to the WTO, although the extent to which this factor alone has contributed to China’s out-performance in electronics exports is unclear. 9 For example, investment by Taiwanese semiconductor companies and notebook manufacturers was only liberalised in the past few years.
MAS Staff Paper No. 42 December 2005
MONETARY AUTHORITY OF SINGAPORE 13
has extended to some mid and upstream segments, such as components [Chart 16].10 Chart 15: Taiwan’s Investments in China
0
1
2
3
4
5
6
7
8
9
93 94 95 96 97 98 99 00 01 02 03 04
US$
bn
Total investmentsElectronics and Electronics appliances
Source: CEIC
Chart 16: Production Location of Taiwanese Firms
0
5
10
15
20
25
30
35
40
98 03 98 03 98 03 98 03
% o
f tot
al p
rodu
ctio
n
China ASEAN
All M anufacturing
Info . Electronics
Telecom & Components
ElectronicComponents
Source: Ministry of Economic Affairs, Taiwan
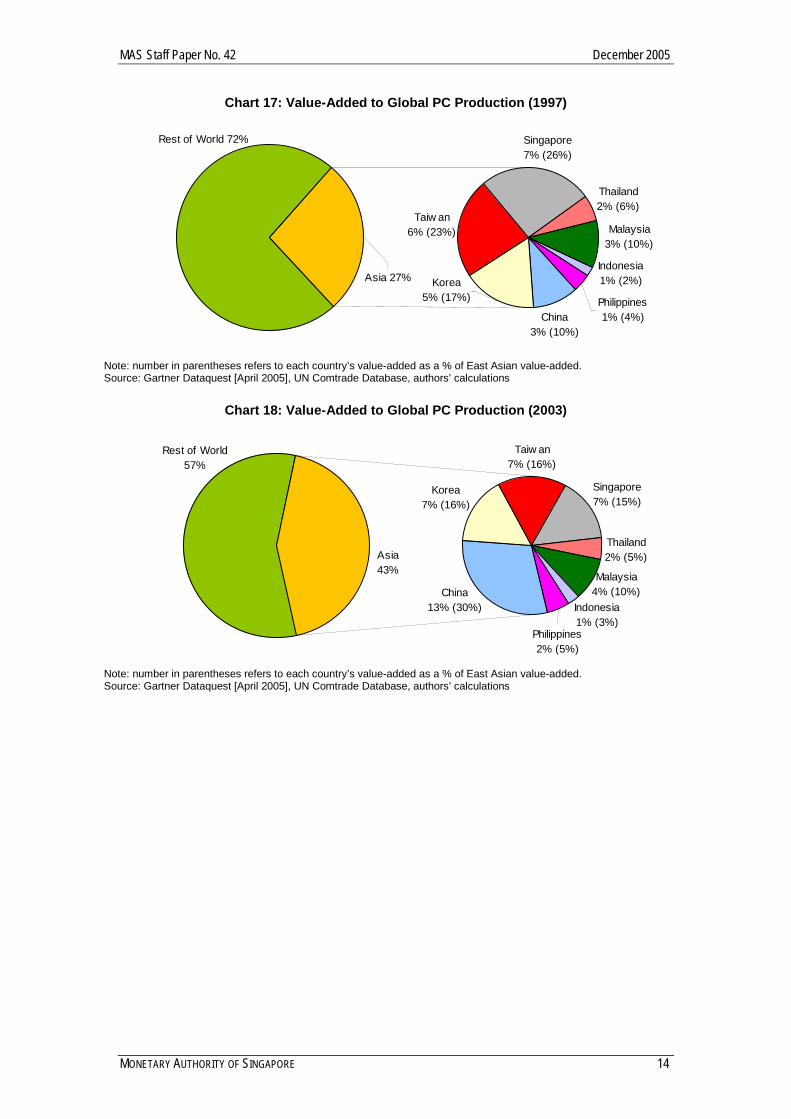
3.3.7 The large-scale relocation of PC assembly and components manufacturing to China has resulted in a reconfiguration of regional production networks for PCs. Typically, although China plays an important role in the assembly of PCs, parts are acquired from other parts of the world, including the US and the rest of Asia. Nonetheless, with an increasing proportion of PC components manufacturing now taking place in China, according to our back-of-the-envelope estimates, China’s share of East Asian value-added in a typical PC has surged from just 10% in 1997 to 30% in 2003, while Taiwan’s share has dwindled from 23% to 16% in the same period.11 The other EA-7 economies have also seen a fall in their share of value-added in East Asian PC manufacturing [Charts 17-18].
10 A 2001 report by Taiwan’s intelligence agency, for example, said that the Chinese authorities have a blueprint to actively develop semiconductor and high-tech industry ‘clusters’ which include the entire spectrum of each industry. (US-China Economic and Security Review Commisssion [2004]) 11 Please refer to Appendix 3 for a more detailed explanation of how these estimates were derived.
MAS Staff Paper No. 42 December 2005
MONETARY AUTHORITY OF SINGAPORE 14
Chart 17: Value-Added to Global PC Production (1997)
Asia 27% Korea5% (17%)
Rest of World 72%
Taiw an6% (23%)
Singapore7% (26%)
Thailand2% (6%)
Philippines 1% (4%)
Malaysia 3% (10%)
Indonesia 1% (2%)
China3% (10%)
Note: number in parentheses refers to each country’s value-added as a % of East Asian value-added. Source: Gartner Dataquest [April 2005], UN Comtrade Database, authors’ calculations
Chart 18: Value-Added to Global PC Production (2003)
Rest of World57%
Korea7% (16%)
Asia43%
Taiw an7% (16%)
Singapore7% (15%)
Thailand2% (5%)
Malaysia4% (10%)
Indonesia1% (3%)
Philippines2% (5%)
China13% (30%)
Note: number in parentheses refers to each country’s value-added as a % of East Asian value-added. Source: Gartner Dataquest [April 2005], UN Comtrade Database, authors’ calculations
MAS Staff Paper No. 42 December 2005
MONETARY AUTHORITY OF SINGAPORE 15
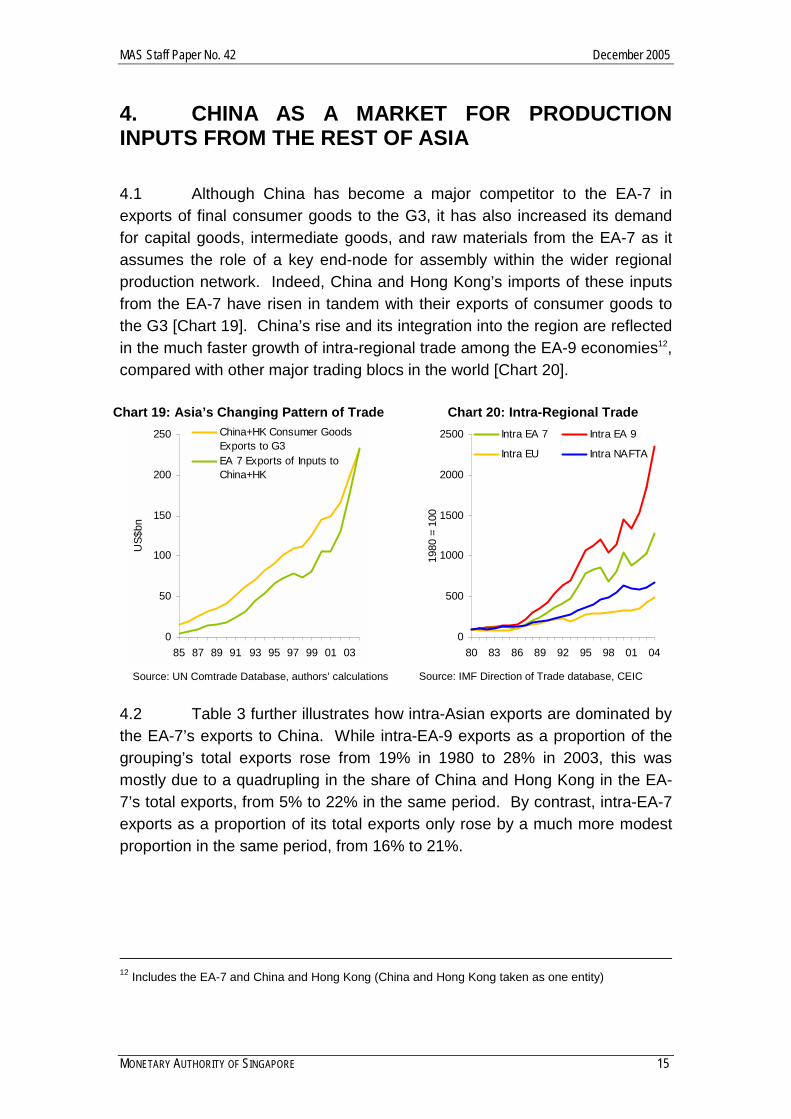
4. CHINA AS A MARKET FOR PRODUCTION INPUTS FROM THE REST OF ASIA 4.1 Although China has become a major competitor to the EA-7 in exports of final consumer goods to the G3, it has also increased its demand for capital goods, intermediate goods, and raw materials from the EA-7 as it assumes the role of a key end-node for assembly within the wider regional production network. Indeed, China and Hong Kong’s imports of these inputs from the EA-7 have risen in tandem with their exports of consumer goods to the G3 [Chart 19]. China’s rise and its integration into the region are reflected in the much faster growth of intra-regional trade among the EA-9 economies12, compared with other major trading blocs in the world [Chart 20].
Chart 19: Asia’s Changing Pattern of Trade
0
50
100
150
200
250
85 87 89 91 93 95 97 99 01 03
US$
bn
China+HK Consumer GoodsExports to G3EA 7 Exports of Inputs toChina+HK
Source: UN Comtrade Database, authors’ calculations
Chart 20: Intra-Regional Trade
0
500
1000
1500
2000
2500
80 83 86 89 92 95 98 01 04
1980
= 1
00Intra EA 7 Intra EA 9
Intra EU Intra NAFTA
Source: IMF Direction of Trade database, CEIC
4.2 Table 3 further illustrates how intra-Asian exports are dominated by the EA-7’s exports to China. While intra-EA-9 exports as a proportion of the grouping’s total exports rose from 19% in 1980 to 28% in 2003, this was mostly due to a quadrupling in the share of China and Hong Kong in the EA-7’s total exports, from 5% to 22% in the same period. By contrast, intra-EA-7 exports as a proportion of its total exports only rose by a much more modest proportion in the same period, from 16% to 21%.
12 Includes the EA-7 and China and Hong Kong (China and Hong Kong taken as one entity)
MAS Staff Paper No. 42 December 2005
MONETARY AUTHORITY OF SINGAPORE 16
Table 3: Share of Total Exports in 1980 and 2004 (%) Destination
Origin NIE-3 ASEAN-4 China+HK EA-7 EA-9 Others 1980 2004 1980 2004 1980 2004 1980 2004 1980 2004 1980 2004
NIE-3 3 7 10 11 7 27 14 18 21 45 79 55 ASEAN-4 15 18 3 9 3 12 18 27 21 39 79 61 EA-7 9 11 7 10 5 22 16 21 21 43 79 57 EA-9 8 10 7 7 4 11 15 17 19 28 81 72 Source: IMF Direction of Trade database, CEIC Note: We exclude trade between China and Hong Kong in EA-9 trade, since we take the two as a single entity.
Chart 21: Foreign Value-Added in Chinese Processed Exports
40
45
50
55
60
65
97 98 99 00 01 02 03 04
US$
bn
65
67
69
71
73
75
77
79
%
FDI into China
Foreign value added inprocessed exports (RHS)
Source: UNCTAD, authors’ estimates
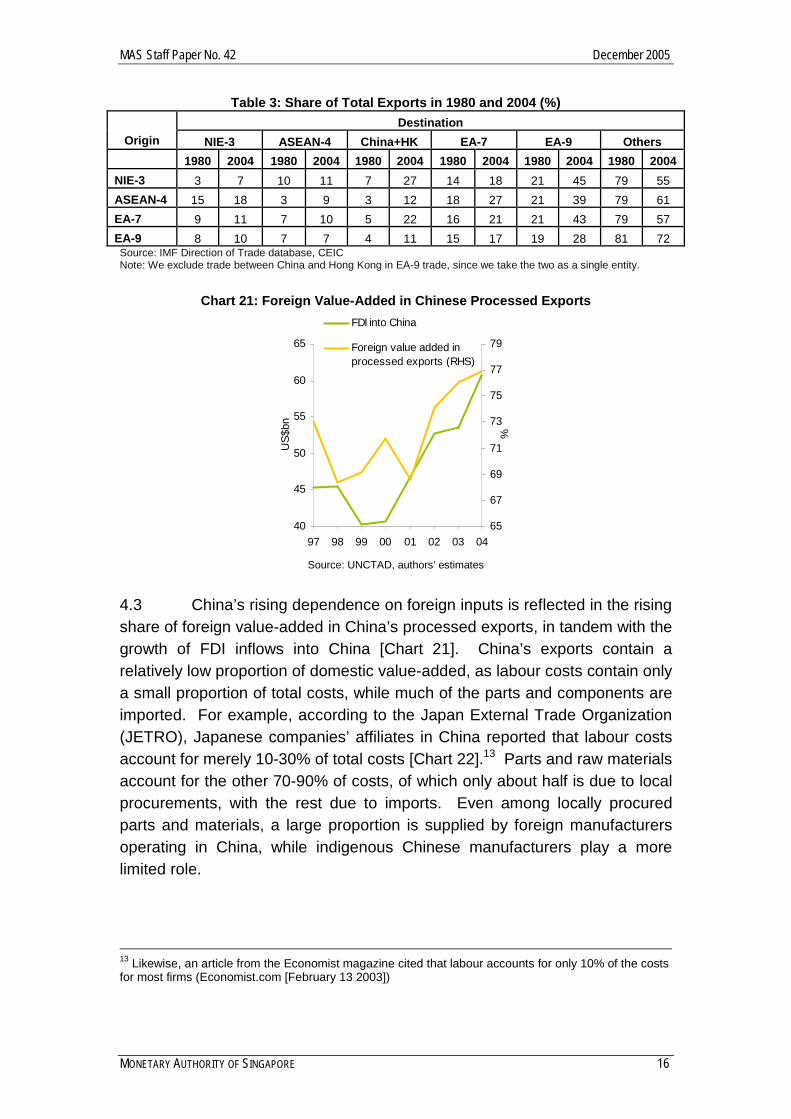
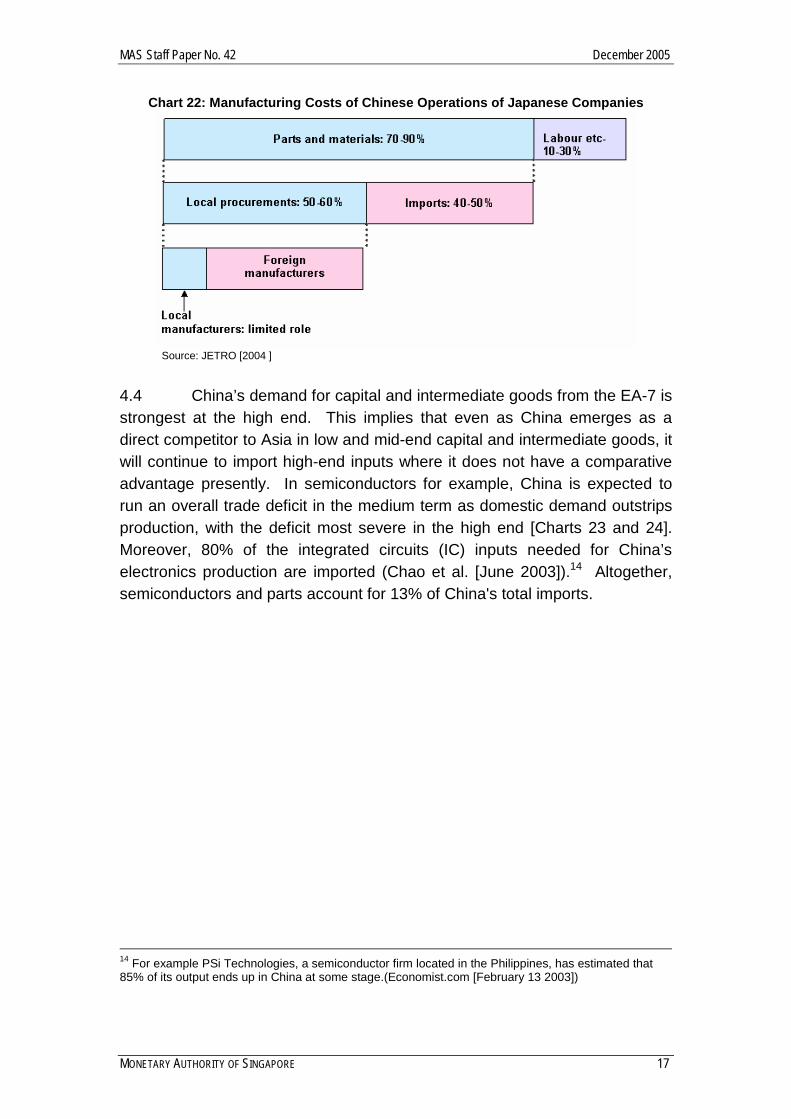
4.3 China’s rising dependence on foreign inputs is reflected in the rising share of foreign value-added in China’s processed exports, in tandem with the growth of FDI inflows into China [Chart 21]. China’s exports contain a relatively low proportion of domestic value-added, as labour costs contain only a small proportion of total costs, while much of the parts and components are imported. For example, according to the Japan External Trade Organization (JETRO), Japanese companies’ affiliates in China reported that labour costs account for merely 10-30% of total costs [Chart 22].13 Parts and raw materials account for the other 70-90% of costs, of which only about half is due to local procurements, with the rest due to imports. Even among locally procured parts and materials, a large proportion is supplied by foreign manufacturers operating in China, while indigenous Chinese manufacturers play a more limited role.
13 Likewise, an article from the Economist magazine cited that labour accounts for only 10% of the costs for most firms (Economist.com [February 13 2003])
MAS Staff Paper No. 42 December 2005
MONETARY AUTHORITY OF SINGAPORE 17
Chart 22: Manufacturing Costs of Chinese Operations of Japanese Companies
Source: JETRO [2004 ]
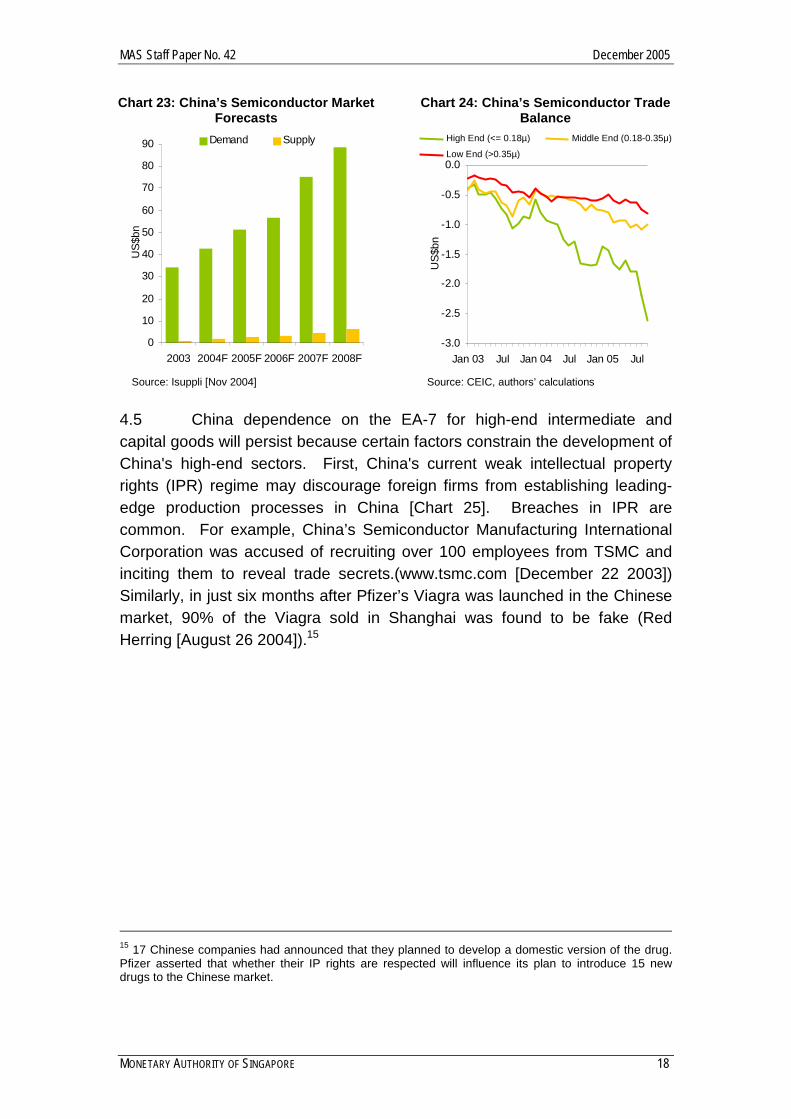
4.4 China’s demand for capital and intermediate goods from the EA-7 is strongest at the high end. This implies that even as China emerges as a direct competitor to Asia in low and mid-end capital and intermediate goods, it will continue to import high-end inputs where it does not have a comparative advantage presently. In semiconductors for example, China is expected to run an overall trade deficit in the medium term as domestic demand outstrips production, with the deficit most severe in the high end [Charts 23 and 24]. Moreover, 80% of the integrated circuits (IC) inputs needed for China’s electronics production are imported (Chao et al. [June 2003]).14 Altogether, semiconductors and parts account for 13% of China's total imports.
14 For example PSi Technologies, a semiconductor firm located in the Philippines, has estimated that 85% of its output ends up in China at some stage.(Economist.com [February 13 2003])
MAS Staff Paper No. 42 December 2005
MONETARY AUTHORITY OF SINGAPORE 18
High End (<= 0.18µ) Middle End (0.18-0.35µ)
Low End (>0.35µ)
Chart 23: China’s Semiconductor Market Forecasts
0
10
20
30
40
50
60
70
80
90
2003 2004F 2005F 2006F 2007F 2008F
US$
bnDemand Supply
Source: Isuppli [Nov 2004]
Chart 24: China’s Semiconductor Trade Balance
-3.0
-2.5
-2.0
-1.5
-1.0
-0.5
0.0
Jan 03 Jul Jan 04 Jul Jan 05 Jul
US$
bn
Source: CEIC, authors’ calculations
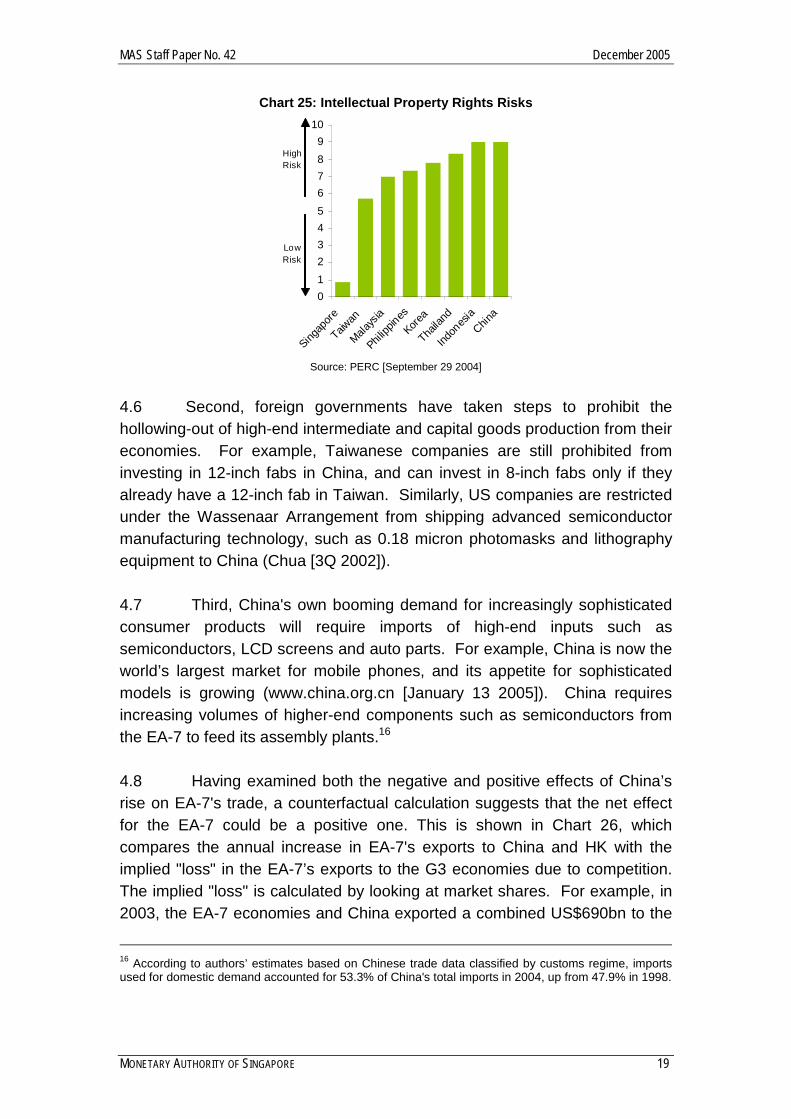
4.5 China dependence on the EA-7 for high-end intermediate and capital goods will persist because certain factors constrain the development of China's high-end sectors. First, China's current weak intellectual property rights (IPR) regime may discourage foreign firms from establishing leading-edge production processes in China [Chart 25]. Breaches in IPR are common. For example, China’s Semiconductor Manufacturing International Corporation was accused of recruiting over 100 employees from TSMC and inciting them to reveal trade secrets.(www.tsmc.com [December 22 2003]) Similarly, in just six months after Pfizer’s Viagra was launched in the Chinese market, 90% of the Viagra sold in Shanghai was found to be fake (Red Herring [August 26 2004]).15
15 17 Chinese companies had announced that they planned to develop a domestic version of the drug. Pfizer asserted that whether their IP rights are respected will influence its plan to introduce 15 new drugs to the Chinese market.
MAS Staff Paper No. 42 December 2005
MONETARY AUTHORITY OF SINGAPORE 19
Chart 25: Intellectual Property Rights Risks
0123456789
10
Singap
ore
Taiwan
Malays
ia
Philipp
ines
Korea
Thaila
nd
Indon
esia
China
High Risk
Low Risk
Source: PERC [September 29 2004]
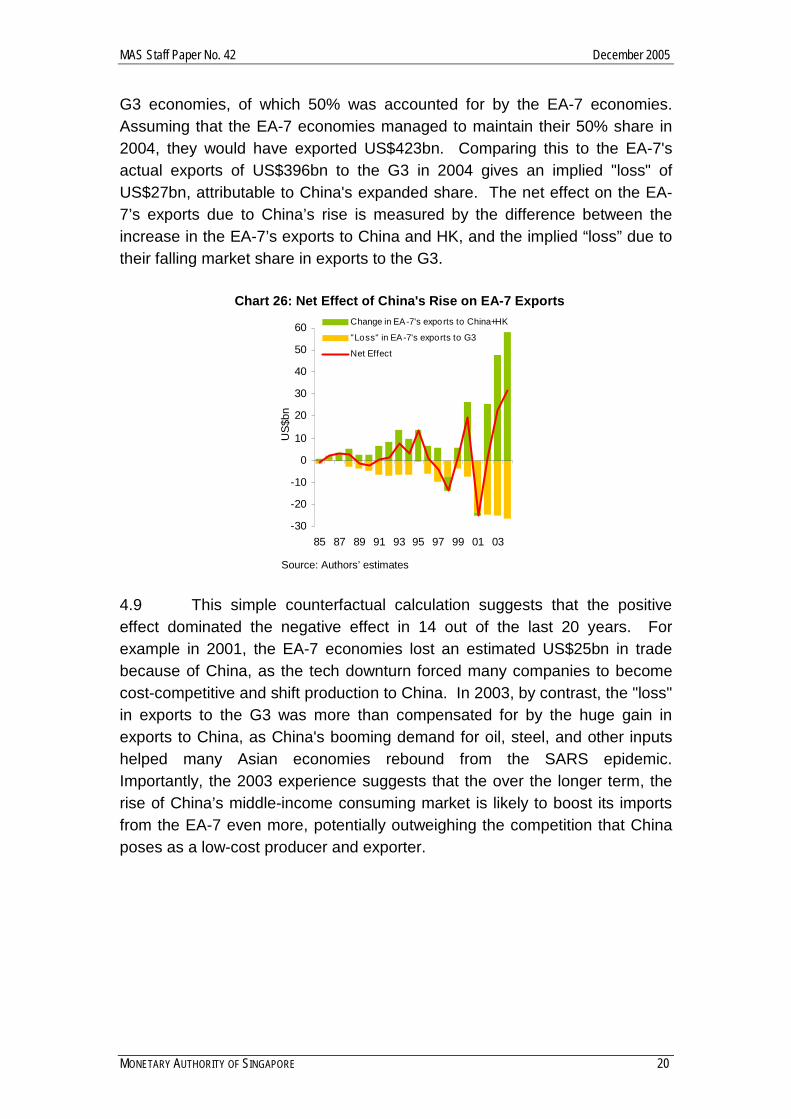
4.6 Second, foreign governments have taken steps to prohibit the hollowing-out of high-end intermediate and capital goods production from their economies. For example, Taiwanese companies are still prohibited from investing in 12-inch fabs in China, and can invest in 8-inch fabs only if they already have a 12-inch fab in Taiwan. Similarly, US companies are restricted under the Wassenaar Arrangement from shipping advanced semiconductor manufacturing technology, such as 0.18 micron photomasks and lithography equipment to China (Chua [3Q 2002]). 4.7 Third, China's own booming demand for increasingly sophisticated consumer products will require imports of high-end inputs such as semiconductors, LCD screens and auto parts. For example, China is now the world’s largest market for mobile phones, and its appetite for sophisticated models is growing (www.china.org.cn [January 13 2005]). China requires increasing volumes of higher-end components such as semiconductors from the EA-7 to feed its assembly plants.16 4.8 Having examined both the negative and positive effects of China’s rise on EA-7's trade, a counterfactual calculation suggests that the net effect for the EA-7 could be a positive one. This is shown in Chart 26, which compares the annual increase in EA-7's exports to China and HK with the implied "loss" in the EA-7’s exports to the G3 economies due to competition. The implied "loss" is calculated by looking at market shares. For example, in 2003, the EA-7 economies and China exported a combined US$690bn to the
16 According to authors’ estimates based on Chinese trade data classified by customs regime, imports used for domestic demand accounted for 53.3% of China's total imports in 2004, up from 47.9% in 1998.
MAS Staff Paper No. 42 December 2005
MONETARY AUTHORITY OF SINGAPORE 20
G3 economies, of which 50% was accounted for by the EA-7 economies. Assuming that the EA-7 economies managed to maintain their 50% share in 2004, they would have exported US$423bn. Comparing this to the EA-7's actual exports of US$396bn to the G3 in 2004 gives an implied "loss" of US$27bn, attributable to China's expanded share. The net effect on the EA-7’s exports due to China’s rise is measured by the difference between the increase in the EA-7’s exports to China and HK, and the implied “loss” due to their falling market share in exports to the G3.
Chart 26: Net Effect of China's Rise on EA-7 Exports
-30
-20
-10
0
10
20
30
40
50
60
85 87 89 91 93 95 97 99 01 03
US$
bn
Change in EA-7's exports to China+HK
"Loss" in EA-7's exports to G3
Net Effect
Source: Authors’ estimates
4.9 This simple counterfactual calculation suggests that the positive effect dominated the negative effect in 14 out of the last 20 years. For example in 2001, the EA-7 economies lost an estimated US$25bn in trade because of China, as the tech downturn forced many companies to become cost-competitive and shift production to China. In 2003, by contrast, the "loss" in exports to the G3 was more than compensated for by the huge gain in exports to China, as China's booming demand for oil, steel, and other inputs helped many Asian economies rebound from the SARS epidemic. Importantly, the 2003 experience suggests that the over the longer term, the rise of China’s middle-income consuming market is likely to boost its imports from the EA-7 even more, potentially outweighing the competition that China poses as a low-cost producer and exporter.
MAS Staff Paper No. 42 December 2005
MONETARY AUTHORITY OF SINGAPORE 21
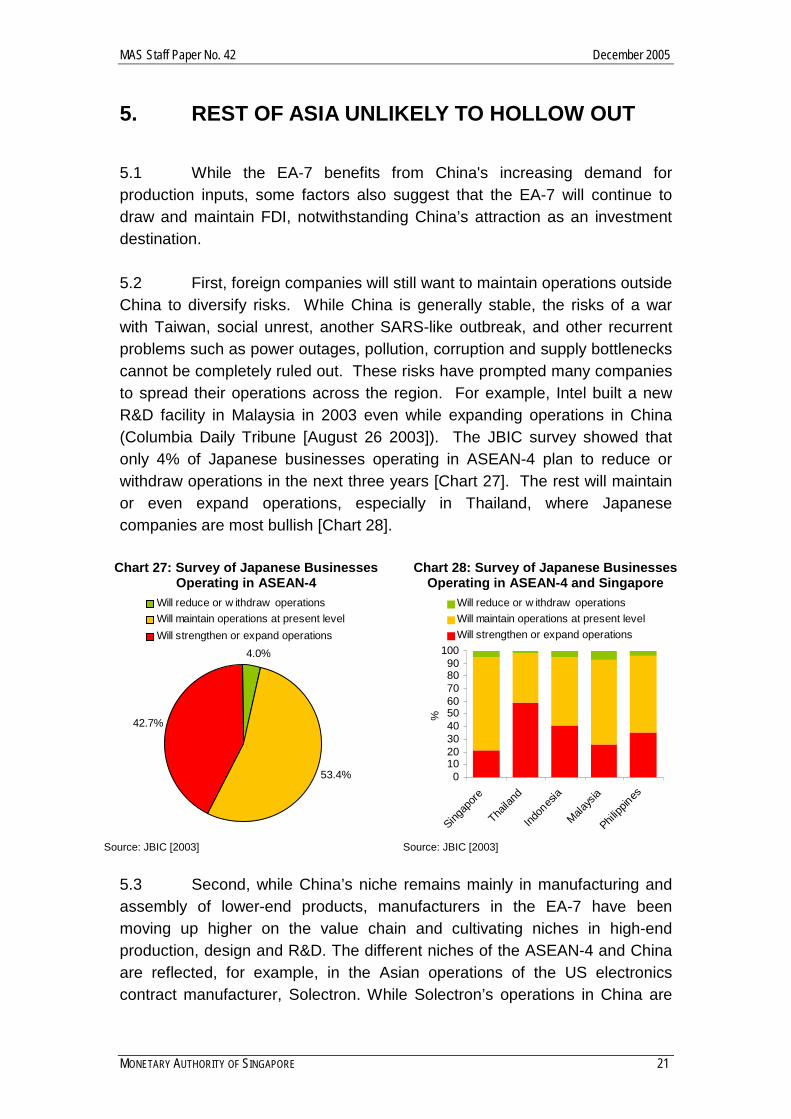
5. REST OF ASIA UNLIKELY TO HOLLOW OUT 5.1 While the EA-7 benefits from China's increasing demand for production inputs, some factors also suggest that the EA-7 will continue to draw and maintain FDI, notwithstanding China’s attraction as an investment destination. 5.2 First, foreign companies will still want to maintain operations outside China to diversify risks. While China is generally stable, the risks of a war with Taiwan, social unrest, another SARS-like outbreak, and other recurrent problems such as power outages, pollution, corruption and supply bottlenecks cannot be completely ruled out. These risks have prompted many companies to spread their operations across the region. For example, Intel built a new R&D facility in Malaysia in 2003 even while expanding operations in China (Columbia Daily Tribune [August 26 2003]). The JBIC survey showed that only 4% of Japanese businesses operating in ASEAN-4 plan to reduce or withdraw operations in the next three years [Chart 27]. The rest will maintain or even expand operations, especially in Thailand, where Japanese companies are most bullish [Chart 28].
Chart 27: Survey of Japanese Businesses Operating in ASEAN-4
4.0%
53.4%
42.7%
Will reduce or w ithdraw operationsWill maintain operations at present levelWill strengthen or expand operations
Source: JBIC [2003]
Chart 28: Survey of Japanese Businesses Operating in ASEAN-4 and Singapore
0102030405060708090
100
Singap
ore
Thaila
nd
Indon
esia
Malays
ia
Philipp
ines
%
Will reduce or w ithdraw operationsWill maintain operations at present levelWill strengthen or expand operations
Source: JBIC [2003]
5.3 Second, while China’s niche remains mainly in manufacturing and assembly of lower-end products, manufacturers in the EA-7 have been moving up higher on the value chain and cultivating niches in high-end production, design and R&D. The different niches of the ASEAN-4 and China are reflected, for example, in the Asian operations of the US electronics contract manufacturer, Solectron. While Solectron’s operations in China are
MAS Staff Paper No. 42 December 2005
MONETARY AUTHORITY OF SINGAPORE 22
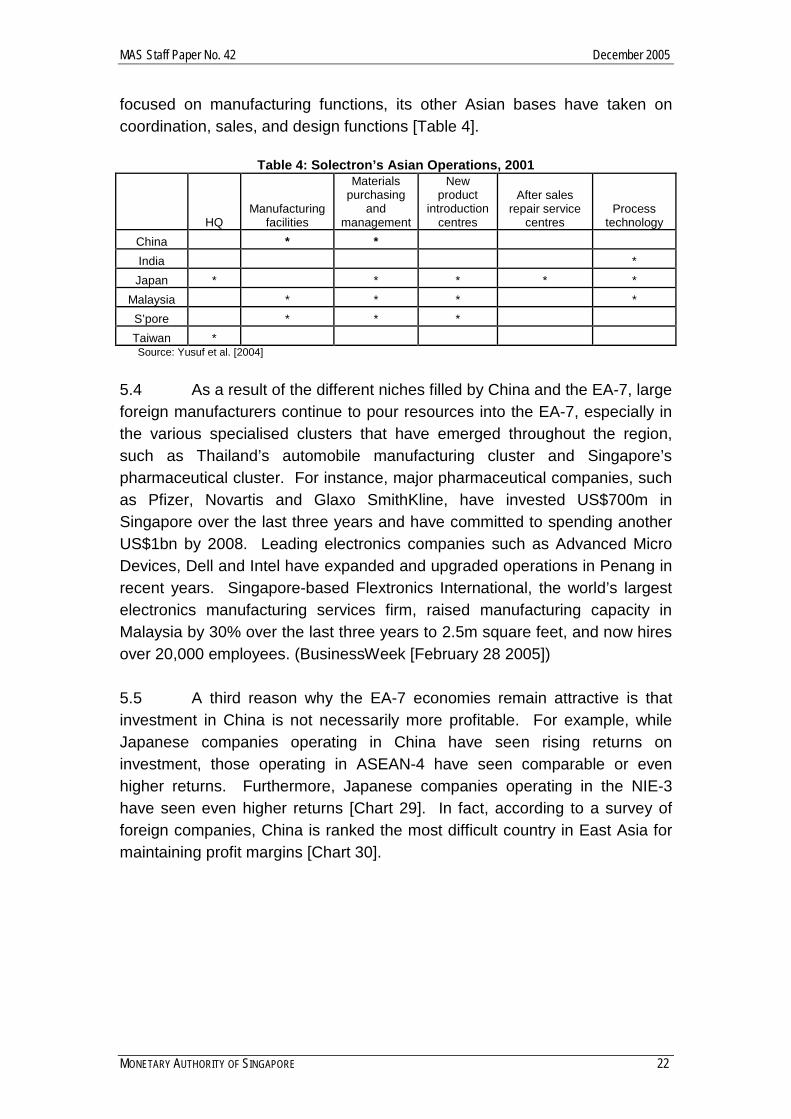
focused on manufacturing functions, its other Asian bases have taken on coordination, sales, and design functions [Table 4].
Table 4: Solectron’s Asian Operations, 2001
HQ Manufacturing
facilities
Materials purchasing
and management
New product
introduction centres
After sales repair service
centres Process
technology China * * India * Japan * * * * *
Malaysia * * * * S’pore * * * Taiwan * Source: Yusuf et al. [2004]
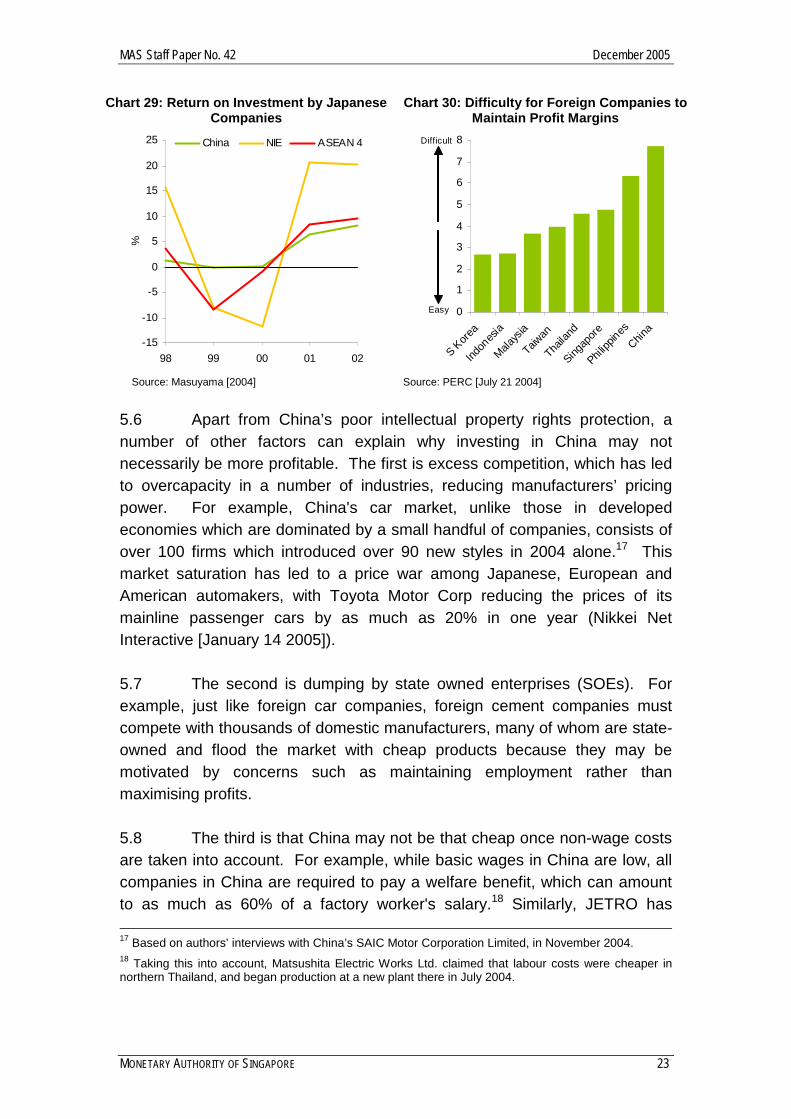
5.4 As a result of the different niches filled by China and the EA-7, large foreign manufacturers continue to pour resources into the EA-7, especially in the various specialised clusters that have emerged throughout the region, such as Thailand’s automobile manufacturing cluster and Singapore’s pharmaceutical cluster. For instance, major pharmaceutical companies, such as Pfizer, Novartis and Glaxo SmithKline, have invested US$700m in Singapore over the last three years and have committed to spending another US$1bn by 2008. Leading electronics companies such as Advanced Micro Devices, Dell and Intel have expanded and upgraded operations in Penang in recent years. Singapore-based Flextronics International, the world’s largest electronics manufacturing services firm, raised manufacturing capacity in Malaysia by 30% over the last three years to 2.5m square feet, and now hires over 20,000 employees. (BusinessWeek [February 28 2005]) 5.5 A third reason why the EA-7 economies remain attractive is that investment in China is not necessarily more profitable. For example, while Japanese companies operating in China have seen rising returns on investment, those operating in ASEAN-4 have seen comparable or even higher returns. Furthermore, Japanese companies operating in the NIE-3 have seen even higher returns [Chart 29]. In fact, according to a survey of foreign companies, China is ranked the most difficult country in East Asia for maintaining profit margins [Chart 30].
MAS Staff Paper No. 42 December 2005
MONETARY AUTHORITY OF SINGAPORE 23
Chart 29: Return on Investment by Japanese Companies
-15
-10
-5
0
5
10
15
20
25
98 99 00 01 02
%China NIE ASEAN 4
Source: Masuyama [2004]
Chart 30: Difficulty for Foreign Companies to Maintain Profit Margins
0
1
2
3
4
5
6
7
8
S Kore
a
Indon
esia
Malays
ia
Taiwan
Thaila
nd
Singap
ore
Philipp
inesChin
a
Difficult
Easy
Source: PERC [July 21 2004]
5.6 Apart from China’s poor intellectual property rights protection, a number of other factors can explain why investing in China may not necessarily be more profitable. The first is excess competition, which has led to overcapacity in a number of industries, reducing manufacturers’ pricing power. For example, China's car market, unlike those in developed economies which are dominated by a small handful of companies, consists of over 100 firms which introduced over 90 new styles in 2004 alone.17 This market saturation has led to a price war among Japanese, European and American automakers, with Toyota Motor Corp reducing the prices of its mainline passenger cars by as much as 20% in one year (Nikkei Net Interactive [January 14 2005]). 5.7 The second is dumping by state owned enterprises (SOEs). For example, just like foreign car companies, foreign cement companies must compete with thousands of domestic manufacturers, many of whom are state-owned and flood the market with cheap products because they may be motivated by concerns such as maintaining employment rather than maximising profits. 5.8 The third is that China may not be that cheap once non-wage costs are taken into account. For example, while basic wages in China are low, all companies in China are required to pay a welfare benefit, which can amount to as much as 60% of a factory worker's salary.18 Similarly, JETRO has 17 Based on authors’ interviews with China’s SAIC Motor Corporation Limited, in November 2004. 18 Taking this into account, Matsushita Electric Works Ltd. claimed that labour costs were cheaper in northern Thailand, and began production at a new plant there in July 2004.
MAS Staff Paper No. 42 December 2005
MONETARY AUTHORITY OF SINGAPORE 24
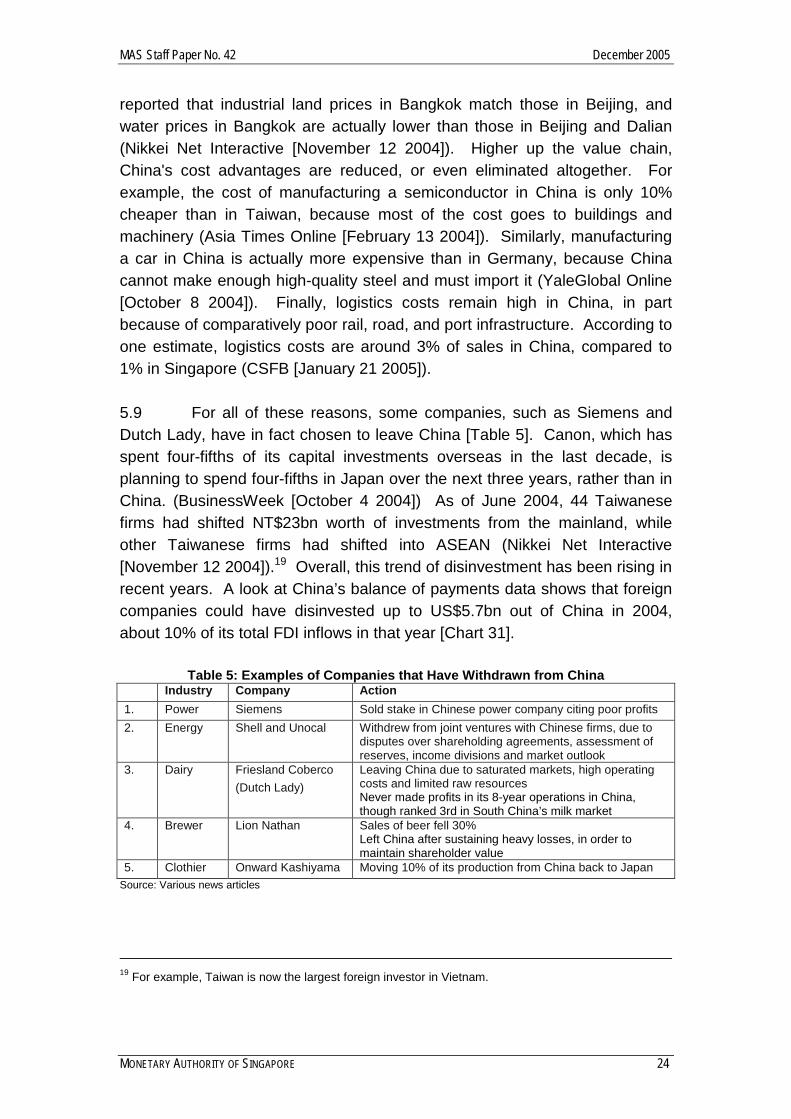
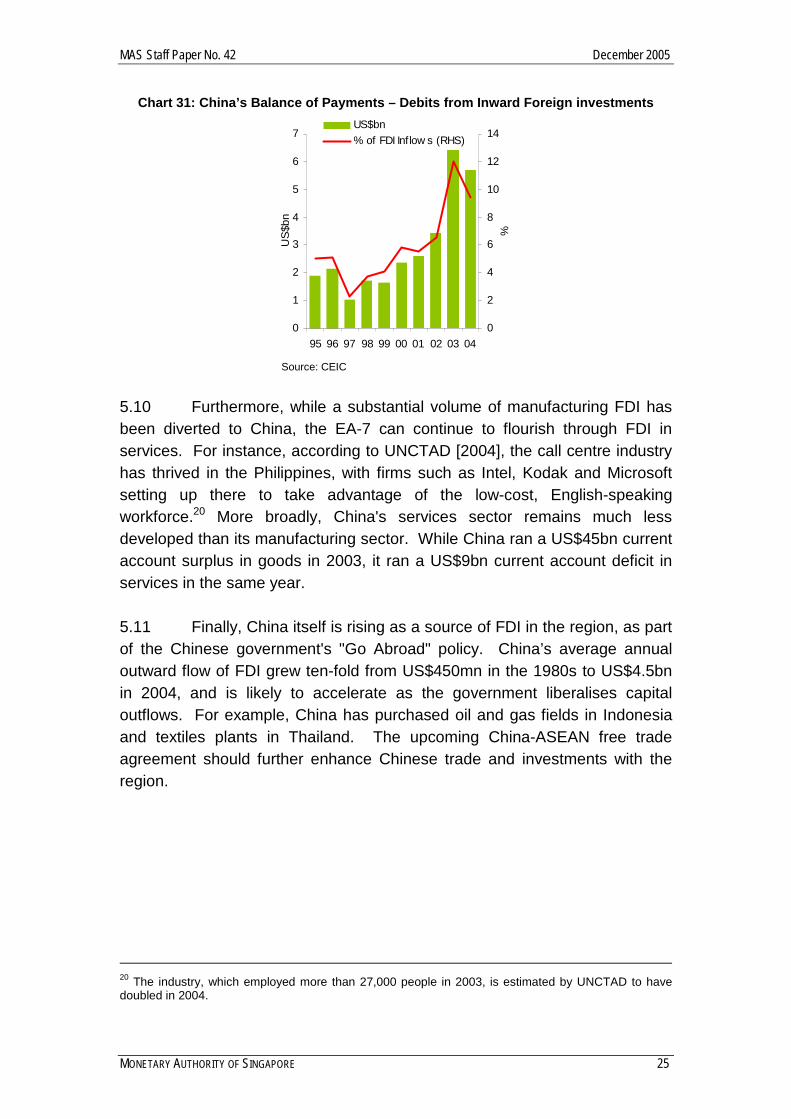
reported that industrial land prices in Bangkok match those in Beijing, and water prices in Bangkok are actually lower than those in Beijing and Dalian (Nikkei Net Interactive [November 12 2004]). Higher up the value chain, China's cost advantages are reduced, or even eliminated altogether. For example, the cost of manufacturing a semiconductor in China is only 10% cheaper than in Taiwan, because most of the cost goes to buildings and machinery (Asia Times Online [February 13 2004]). Similarly, manufacturing a car in China is actually more expensive than in Germany, because China cannot make enough high-quality steel and must import it (YaleGlobal Online [October 8 2004]). Finally, logistics costs remain high in China, in part because of comparatively poor rail, road, and port infrastructure. According to one estimate, logistics costs are around 3% of sales in China, compared to 1% in Singapore (CSFB [January 21 2005]). 5.9 For all of these reasons, some companies, such as Siemens and Dutch Lady, have in fact chosen to leave China [Table 5]. Canon, which has spent four-fifths of its capital investments overseas in the last decade, is planning to spend four-fifths in Japan over the next three years, rather than in China. (BusinessWeek [October 4 2004]) As of June 2004, 44 Taiwanese firms had shifted NT$23bn worth of investments from the mainland, while other Taiwanese firms had shifted into ASEAN (Nikkei Net Interactive [November 12 2004]).19 Overall, this trend of disinvestment has been rising in recent years. A look at China’s balance of payments data shows that foreign companies could have disinvested up to US$5.7bn out of China in 2004, about 10% of its total FDI inflows in that year [Chart 31].
Table 5: Examples of Companies that Have Withdrawn from China Industry Company Action 1. Power Siemens Sold stake in Chinese power company citing poor profits 2. Energy Shell and Unocal Withdrew from joint ventures with Chinese firms, due to
disputes over shareholding agreements, assessment of reserves, income divisions and market outlook
3. Dairy Friesland Coberco (Dutch Lady)
Leaving China due to saturated markets, high operating costs and limited raw resources Never made profits in its 8-year operations in China, though ranked 3rd in South China’s milk market
4. Brewer Lion Nathan Sales of beer fell 30% Left China after sustaining heavy losses, in order to maintain shareholder value
5. Clothier Onward Kashiyama Moving 10% of its production from China back to Japan Source: Various news articles
19 For example, Taiwan is now the largest foreign investor in Vietnam.
MAS Staff Paper No. 42 December 2005
MONETARY AUTHORITY OF SINGAPORE 25
Chart 31: China’s Balance of Payments – Debits from Inward Foreign investments
0
1
2
3
4
5
6
7
95 96 97 98 99 00 01 02 03 04
US$
bn
0
2
4
6
8
10
12
14
%
US$bn% of FDI Inflow s (RHS)
Source: CEIC
5.10 Furthermore, while a substantial volume of manufacturing FDI has been diverted to China, the EA-7 can continue to flourish through FDI in services. For instance, according to UNCTAD [2004], the call centre industry has thrived in the Philippines, with firms such as Intel, Kodak and Microsoft setting up there to take advantage of the low-cost, English-speaking workforce.20 More broadly, China's services sector remains much less developed than its manufacturing sector. While China ran a US$45bn current account surplus in goods in 2003, it ran a US$9bn current account deficit in services in the same year. 5.11 Finally, China itself is rising as a source of FDI in the region, as part of the Chinese government's "Go Abroad" policy. China’s average annual outward flow of FDI grew ten-fold from US$450mn in the 1980s to US$4.5bn in 2004, and is likely to accelerate as the government liberalises capital outflows. For example, China has purchased oil and gas fields in Indonesia and textiles plants in Thailand. The upcoming China-ASEAN free trade agreement should further enhance Chinese trade and investments with the region.
20 The industry, which employed more than 27,000 people in 2003, is estimated by UNCTAD to have doubled in 2004.
MAS Staff Paper No. 42 December 2005
MONETARY AUTHORITY OF SINGAPORE 26
6. CONCLUSION 6.1 China’s ascendancy as a manufacturing powerhouse has changed the regional production landscape. MNCs have rushed to extend their production chains into China, establishing China as a major competitor for inward FDI to the region. Competition for FDI is especially intense with respect to the ASEAN-4, where there is a greater degree of overlap in manufacturing capabilities. Today, China accounts for 65% of all inward FDI into Asia, up from just 2% in 1980. 6.2 As a result of this influx of manufacturing FDI, competition from China with the EA-7 in exports to the G3 has also intensified. While China’s competitiveness in consumer goods exports is well known, it has increasingly gained in low and mid-end capital and intermediate goods exports, especially in electronics, largely as a result of Taiwanese electronics firms relocating to China. While the EA-7 as a whole have suffered from export competition from China, it is the NIE-3 and Indonesia which have lost the most, while the other ASEAN-4 economies have largely held their ground. 6.3 Notwithstanding the formidable competition China poses, it has also increasingly become a driver of growth in the EA-7. As China assumes the role of a key end-node for assembly within the wider regional production network, it has imported an increasing amount of higher-end capital and intermediate goods and raw materials from the EA-7, to feed into its own production of exports. Looking ahead, this demand will be the strongest in the high-end, where China will continue to face a shortage, due to poor intellectual property rights protection, foreign government protectionism, and China’s own rising demand for high-end consumer goods. 6.4 Having examined both effects of China’s rise on the EA-7’s exports, we find that on balance, the positive effect of Chinese demand for production inputs from the EA-7 has dominated the negative impact of Chinese competition in exports to the G3 for most of the period under analysis. Furthermore, over the longer term, as China's middle-income consumer market grows, its demand for imports from the EA-7 is likely to rise even further, potentially outweighing the competition that it poses as a low-cost producer and exporter.
MAS Staff Paper No. 42 December 2005
MONETARY AUTHORITY OF SINGAPORE 27
6.5 Moreover, notwithstanding China’s attraction as an investment destination, there are a number of reasons to believe the EA-7 economies will not hollow out. Foreign companies will be averse to putting all their eggs in the Chinese basket, due to excess competition and the lack of intellectual property rights protection. Even as they expand investments in China, these companies will continue to maintain or strengthen operations in the rest of the region. The EA-7 can continue to develop a niche for itself by moving up the value chain, or by developing their service industries, thereby remaining attractive as a destination for FDI.
MAS Staff Paper No. 42 December 2005
MONETARY AUTHORITY OF SINGAPORE 28
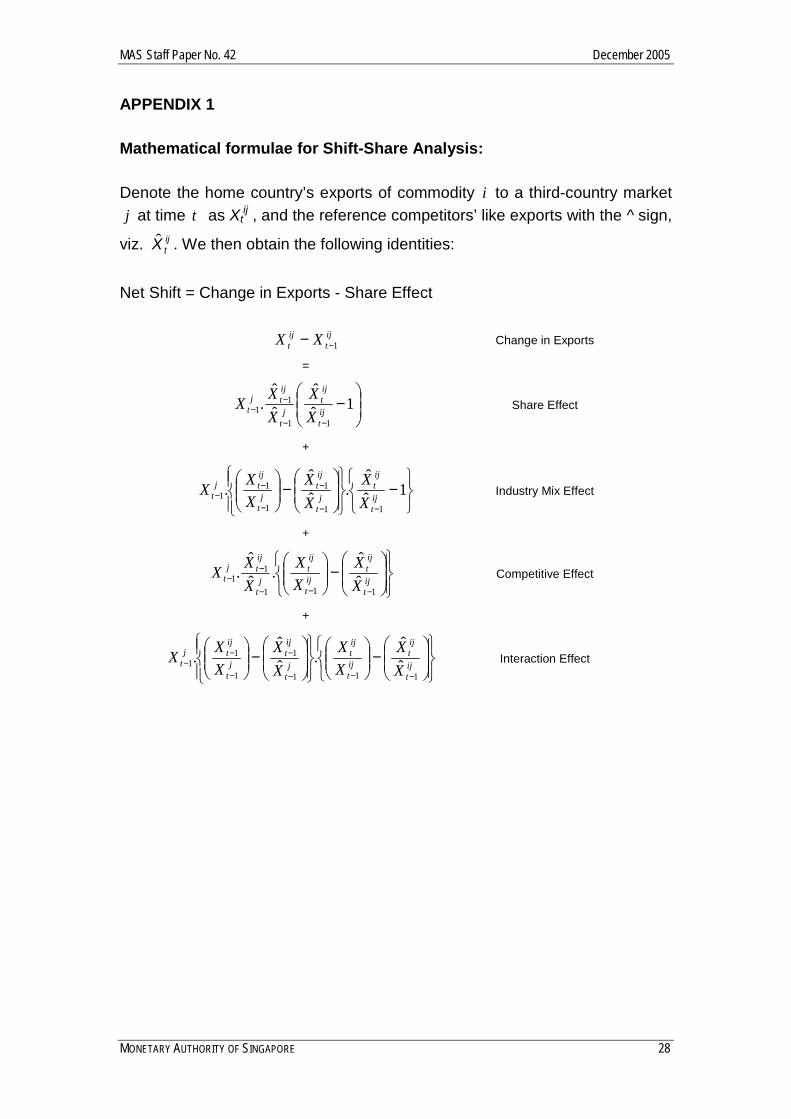
APPENDIX 1 Mathematical formulae for Shift-Share Analysis: Denote the home country’s exports of commodity i to a third-country market j at time t as Xt
ij , and the reference competitors’ like exports with the ^ sign,
viz. ijtX̂ . We then obtain the following identities:
Net Shift = Change in Exports - Share Effect
ijt
ijt XX 1−− Change in Exports
=
1ˆˆ
ˆˆ
.11
11
−
−−
−− ij
t
ijt
jt
ijtj
t XX
XXX Share Effect
+
−
−
−−
−
−
−− 1ˆ
ˆ.ˆ
ˆ.
11
1
1
11 ij
t
ijt
jt
ijt
jt
ijtj
t XX
XX
XXX Industry Mix Effect
+
ˆˆ
.ˆˆ
.111
11
−
−−−
−− ij
t
ijt
ijt
ijt
jt
ijtj
t XX
XX
XXX Competitive Effect
+
ˆˆ
.ˆˆ
.111
1
1
11
−
−
−−−
−
−
−− ij
t
ijt
ijt
ijt
jt
ijt
jt
ijtj
t XX
XX
XX
XXX Interaction Effect
MAS Staff Paper No. 42 December 2005
MONETARY AUTHORITY OF SINGAPORE 29
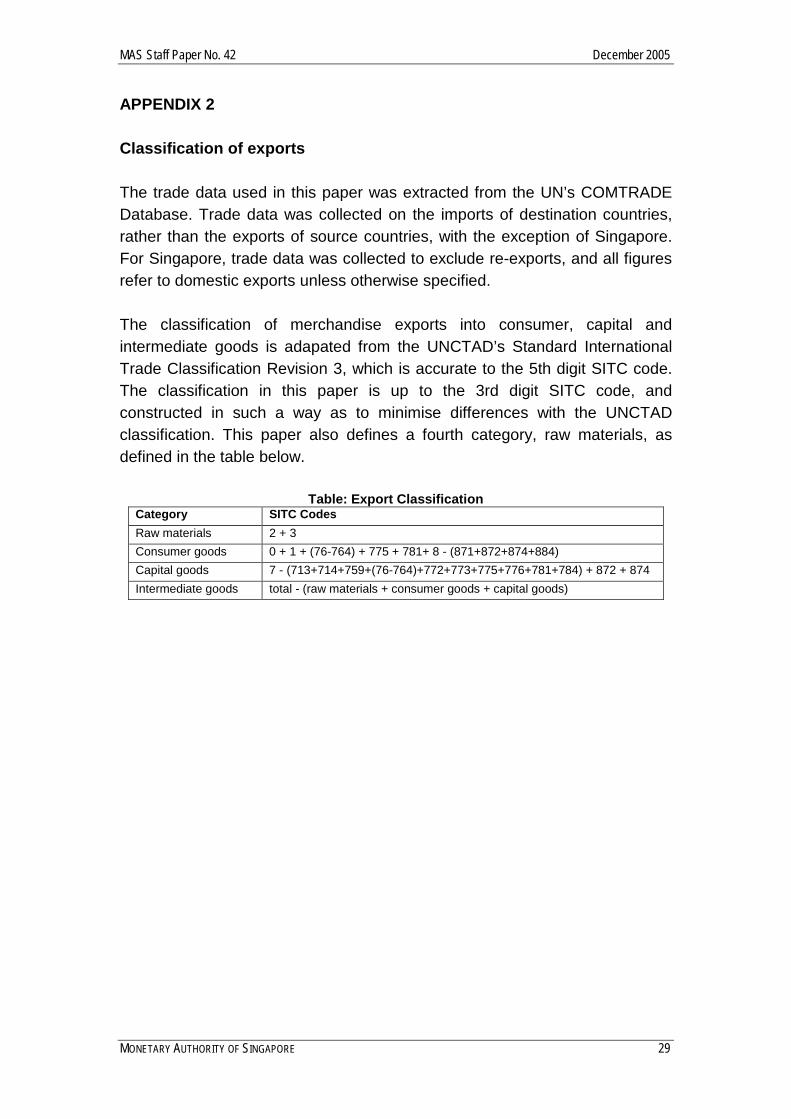
APPENDIX 2 Classification of exports The trade data used in this paper was extracted from the UN’s COMTRADE Database. Trade data was collected on the imports of destination countries, rather than the exports of source countries, with the exception of Singapore. For Singapore, trade data was collected to exclude re-exports, and all figures refer to domestic exports unless otherwise specified. The classification of merchandise exports into consumer, capital and intermediate goods is adapated from the UNCTAD’s Standard International Trade Classification Revision 3, which is accurate to the 5th digit SITC code. The classification in this paper is up to the 3rd digit SITC code, and constructed in such a way as to minimise differences with the UNCTAD classification. This paper also defines a fourth category, raw materials, as defined in the table below.
Table: Export Classification Category SITC Codes Raw materials 2 + 3 Consumer goods 0 + 1 + (76-764) + 775 + 781+ 8 - (871+872+874+884) Capital goods 7 - (713+714+759+(76-764)+772+773+775+776+781+784) + 872 + 874 Intermediate goods total - (raw materials + consumer goods + capital goods)
MAS Staff Paper No. 42 December 2005
MONETARY AUTHORITY OF SINGAPORE 30
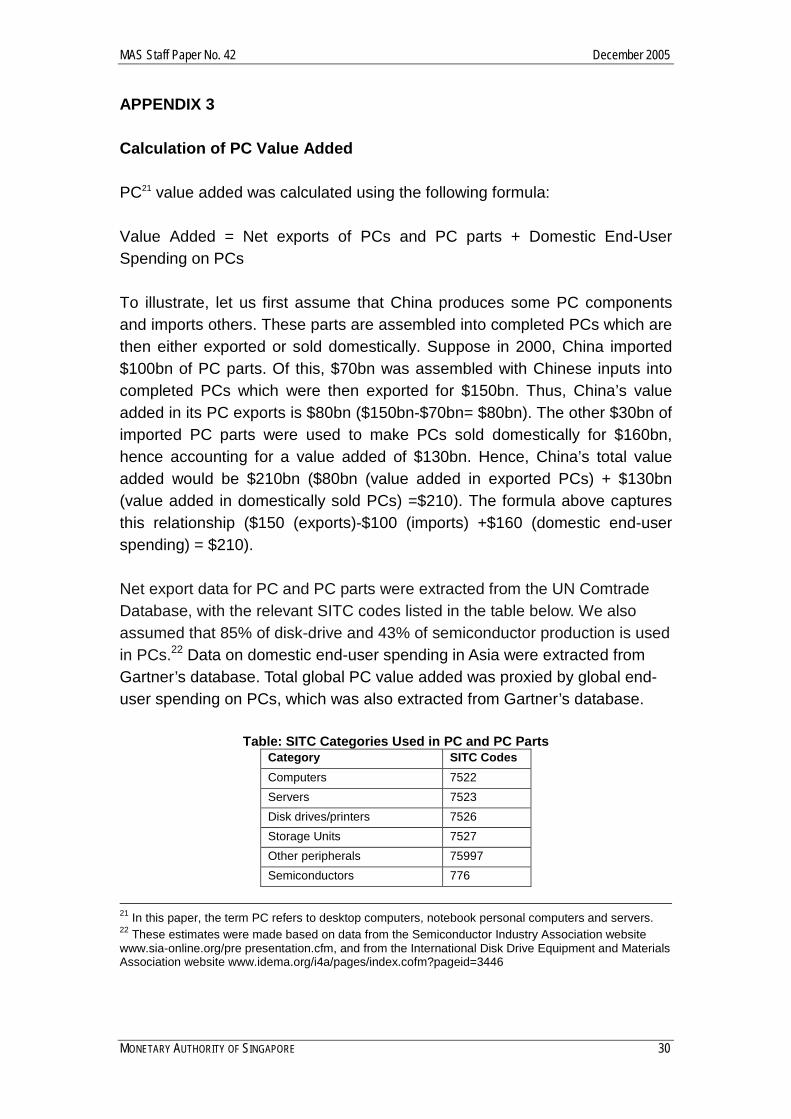
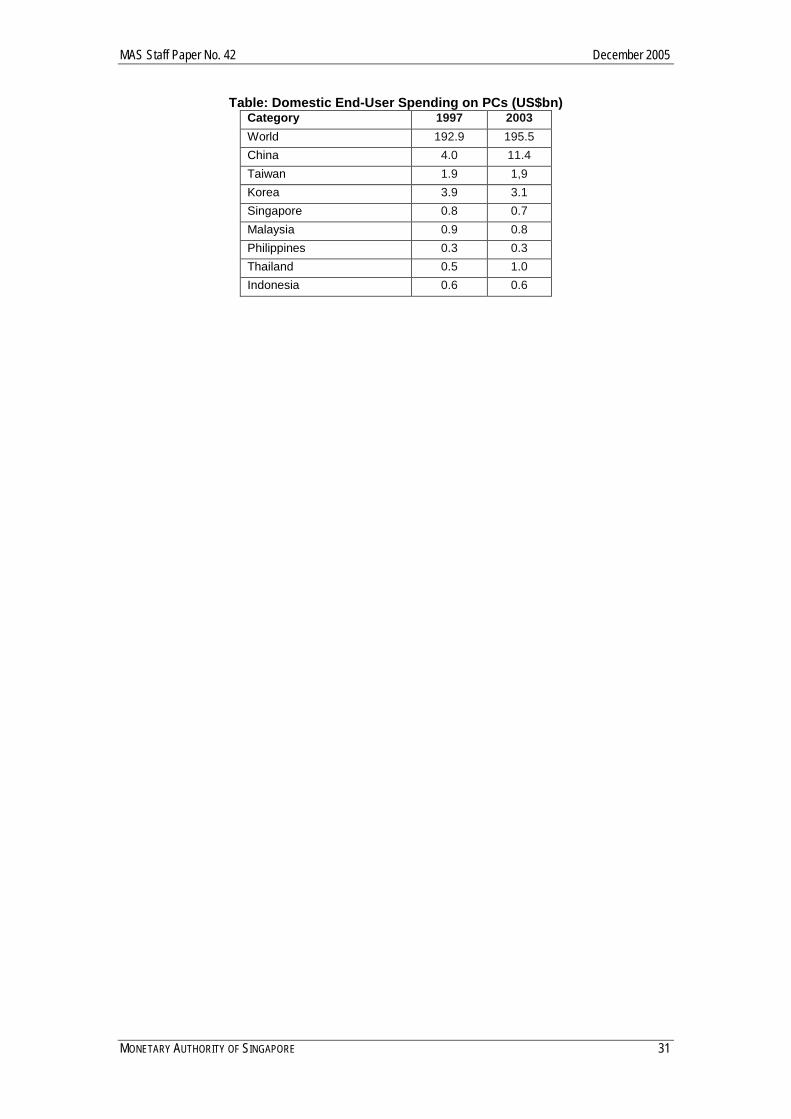
APPENDIX 3 Calculation of PC Value Added PC21 value added was calculated using the following formula: Value Added = Net exports of PCs and PC parts + Domestic End-User Spending on PCs To illustrate, let us first assume that China produces some PC components and imports others. These parts are assembled into completed PCs which are then either exported or sold domestically. Suppose in 2000, China imported $100bn of PC parts. Of this, $70bn was assembled with Chinese inputs into completed PCs which were then exported for $150bn. Thus, China’s value added in its PC exports is $80bn ($150bn-$70bn= $80bn). The other $30bn of imported PC parts were used to make PCs sold domestically for $160bn, hence accounting for a value added of $130bn. Hence, China’s total value added would be $210bn ($80bn (value added in exported PCs) + $130bn (value added in domestically sold PCs) =$210). The formula above captures this relationship ($150 (exports)-$100 (imports) +$160 (domestic end-user spending) = $210). Net export data for PC and PC parts were extracted from the UN Comtrade Database, with the relevant SITC codes listed in the table below. We also assumed that 85% of disk-drive and 43% of semiconductor production is used in PCs.22 Data on domestic end-user spending in Asia were extracted from Gartner’s database. Total global PC value added was proxied by global end-user spending on PCs, which was also extracted from Gartner’s database.
Table: SITC Categories Used in PC and PC Parts Category SITC Codes Computers 7522 Servers 7523 Disk drives/printers 7526 Storage Units 7527 Other peripherals 75997 Semiconductors 776
21 In this paper, the term PC refers to desktop computers, notebook personal computers and servers. 22 These estimates were made based on data from the Semiconductor Industry Association website www.sia-online.org/pre presentation.cfm, and from the International Disk Drive Equipment and Materials Association website www.idema.org/i4a/pages/index.cofm?pageid=3446
MAS Staff Paper No. 42 December 2005
MONETARY AUTHORITY OF SINGAPORE 31
Table: Domestic End-User Spending on PCs (US$bn) Category 1997 2003 World 192.9 195.5 China 4.0 11.4 Taiwan 1.9 1,9 Korea 3.9 3.1 Singapore 0.8 0.7 Malaysia 0.9 0.8 Philippines 0.3 0.3 Thailand 0.5 1.0 Indonesia 0.6 0.6
MAS Staff Paper No. 42 December 2005
MONETARY AUTHORITY OF SINGAPORE 32
REFERENCES
Research papers Ando, M. and Kimura, F. [2004] “The Formation of International Production and Distribution Networks in East Asia”, Keio University Borrus, M. [1996] “Left for Dead: Asian Production Networks and the Revival of US Electronics”, prepared for Berkeley Roundtable on the International Economy, University of California Berkeley Borrus, M.; Ernst, D. and Haggard, S. (editors) [2000] “International production networks in Asia : rivalry or riches?”. First edition. New York: Routledge Chao, H. and Sussman, L. [June 2003] “Semiconductor Investment Heats Up in China: A Legal and Tax Guide”, O’Melveny & Myers LLP Research Report on Topics in Chinese Law Chua, B. L. [3Q 2002] “China’s Emerging Semiconductor Industry: What are the Implications for Singapore?”, Economic Survey of Singapore CSFB [January 21 2005] "Singapore: End of structural malaise -- new beginnings" Cutler, J.; Chow, K.; Chan, C. and Li, U. [4Q 2004] “Intra-regional trade and the role of Mainland China”, Hong Kong Monetary Authority Quarterly Bulletin, Feature Article Eichengreen, B. [2004] “The impact of China on the exports of other Asian countries”, NBER Working Paper Series Ernst, D. [1997] “Partners for the China Circle? The Asian Production Networks of Japanese Electronics Firms”, Danish Research Unit for Industrial Dynamics Ernst, D. [2000] “Inter-Organizational Knowledge Outsourcing: What Permits Small Taiwanese Firms to Compete in the Computer Industry?”, East-West Center Working Paper Economics Series, no. 1 Ernst, D. [2003] “How Sustainable are Benefits from Global Production Networks? Malaysia’s Upgrading Prospects in the Electronics Industry”, East West Center Working Paper Economics Series, no. 57 Ernst, D. [2004] “Searching for a New Role in Asian Regionalization: Japanese Production Networks in the Electronics Industry”, East-West Center Working Paper Economics Series, no. 68
MAS Staff Paper No. 42 December 2005
MONETARY AUTHORITY OF SINGAPORE 33
GPN Working Paper 7 [May 2003] “Global Production Networks in Europe and East Asia: The Automobile Components Industries”, prepared as part of the ESRC research project Making the Connections: Global Production Networks in Europe and East Asia Gualier, G.; Lemoine, F. and Unal-Kesenci, D.; [June 2004, Draft] “China’s Integration in Asian Production Networks and Its Implications”, prepared for the conference Resolving New Global and Regional Imbalances in an Era of Asian Integration Hu, F.; Anderson, J.; Li, D. and Ng, R. [2001] “Will Taiwan Hollow Out? Perhaps – But This is the Wrong Question”, Goldman Sachs Economics Research Note Japan Bank for International Cooperation (JBIC) [2003] “Survey Report on Overseas Business Operations by Japanese Manufacturing Companies- Results of JBIC FY2003 Survey: Outlook for Japanese Foreign Direct Investment (15th Annual Survey)” Japan External Trade Organization [2004] “2004 JETRO White Paper on International Trade and Foreign Direct Investment” Japan External Trade Organization [2003] “Japanese-Affiliated Manufacturers in Asia, Survey 2002” Lian, C.L. [2003] “Taiwan: fear of manufacturing ‘hollowing out’ is overdone”, JP Morgan Economics and Policy Research Note Masuyama, S. [2004] “The Asian Strategy of Japanese Multinationals: Focus on China”, Nomura Research Institute Ministry of Economic Affairs, Taiwan, Statistics Department [1999 and 2004] “Survey of Manufacturing Activities” (in Chinese) Ministry of Trade and Industry, Singapore [2Q 2001] “Convergence of Cross- Straits Economic Interests and Implications for Singapore”, Economic Survey of Singapore Ng, F. and Yeats, A. [2003] “Major Trade Trends in East Asia: What are their Implications for Regional Cooperation and Growth?”, World Bank Policy Research Working Paper 3084 Oxford Analytica Asia Pacific Daily Brief [August 27 2003] “Japan/ China: Relocation investment: New patterns in Japanese inward foreign direct investment into China”
MAS Staff Paper No. 42 December 2005
MONETARY AUTHORITY OF SINGAPORE 34
Political & Economic Risk Consultancy Ltd. [July 21 2004] “Competitiveness in Asia”, Asian Intelligence No. 662 Political & Economic Risk Consultancy Ltd. [September 29 2004] “Intellectual Property Rights Risks”, Asian Intelligence No. 666 Robinson, E.; Ting, S.C. and Tu, S.P. [2002] “Assessing Singapore’s export competitiveness through dynamic shift-share analysis”, Monetary Authority of Singapore Occasional Paper no. 23 UBS Investment Research [2004] “China Exposure Chart Book” United Nations Conference on Trade and Development (UNCTAD) [2004] "World Investment Report 2004: The Shift Towards Services". New York and Geneva US-China Economic and Security Review Commission [2004] Report to Congress, Chapter 7. U.S Government Printing Office. Washington Wu, F,; Pao, T.S.; Yeo, H.S. and Puah, K.K. [3Q 2002] “Foreign Direct Investments to China and Southeast Asia: Has ASEAN been losing out?”, Economic Survey of Singapore Yeo, H.S. and Wu, F. [2001] “China’s Rising Investment in Southeast Asia: How can ASEAN and Singapore Benefit?”, Economic Survey of Singapore Yeung, H.W.; Dicken, P.; Henerson J.; Hess, M. and Coe, N. [2001] “Foreign Direct Investment, Trade, and Global Production Networks in Asia and Europe” Yeung, H.W. [2001] “Organising Regional Production Networks in Southeast Asia: Implications for Production Fragmentation, Trade and Rules of Origin”, Journal of Economic Geography Yusuf, S.; Anjum Altaf, M. and Nabeshima, K. (editors) [2004] Global production networking and technological change in East Asia. First edition. Washington: The World Bank and Oxford University Press News Articles and Wesbites Agence France Presse [January 31 2005] Host of problems in Chinese power industry sees foreign firms pull out Asia Times Online [February 13 2004] China set to flood the world with chips Australian Financial Review [December 15 2004] Lion Nathan’s China Brew Loses its Fizz
MAS Staff Paper No. 42 December 2005
MONETARY AUTHORITY OF SINGAPORE 35
BusinessWeek Online [February 28 2005] Asia’s Tigers Hang Tough BusinessWeek Online [October 11 2004] So Much for Hollowing Out: Japan’s giants are investing in plants at home again. Why the switch? Columbia Daily Tribune [August 26 2003] Intel not predicting recovery in IT yet Economist magainze [February 13 2003] China and the Philippines: When you can’t transplant plant Economist.magazine [January 13 2005] Onshoring Nikkei Net Interactive [November 12 2004] BUSINESS IN CHINA: Foreign Firms Shift Policy To Hedge Risks Nikkei Net Interactive [December 5 2004] Matsushita To Localize Development Of White Goods In China Nikkei Net Interactive [January 14 2005] Toyota Slashes Prices On Locally Made Cars In China Nikkei Weekly [August 5 2002] Firms shift Asia operations to China seeking low wages Red Herring [August 26 2004] Pfizer v. China Taipei Times [February 01 2005] Foreign power firms leaving China The Wall Street Journal [October 1 2004] China Gas is Fuel for Doubts--- Shell, Unocal Withdrawal from Project Highlights Sector Problems www.China.org.cn [September 30 2005] Oil Giants Depart Xihu Trough Gas Project www.China.org.cn [November 25 2004] Dairy Producer Pulls out of Market www.China.org.cn [January 13 2005] China to see 750mn Phone Users in 2005 www.dairyreporter.com [November 17 2004] Friesland Coberco pulls out of China www.idema.org/i4a/pages/index.cofm?pageid=3446 November-December 2003 Insight: Driving Consumer Electronics Storage www.lion-nathan.com.au [September 15 2004] Lion Nathan Sells Chinese Beer Business for A$219mn
MAS Staff Paper No. 42 December 2005
MONETARY AUTHORITY OF SINGAPORE 36
www.sia-online.org/pre presentation.cfm Semiconductor Industry Association Forecast 2003-2006 www.smics.com/website/enVersion/fileCenter/SMIC_General_Presentation.pdf [June 2005] SMIC: An introduction www.tsmc.com [December 22 2003] TSMC Files Law Suit against SMIC for Patent Infringement and Trade Secret Misappropriation YaleGlobal Online [October 8 2004] Buy Now, Profit Later Data Sources Apart from data extracted from the various sources listed above, the following databases were extensively used: CEIC Database Gartner Dataquest IMF Direction of Trade Database Isuppli Database UN COMTRADE Database UNCTAD FDI Database, at http://stats.unctad.org/fdi/eng/ReportFolders/Rfview/Explorerp.asp?CS_referer