Embed Size (px)
Citation preview

DOI: 10.2478/s11532-007-0050-8Research article
CEJC 5(4) 2007 1124–1147
Rigorous modelling and optimization of hybridseparation processes based on pervaporation
Katalin Koczka∗, Peter Mizsey, Zsolt Fonyo
Budapest University of Technology and Economics, Department of Chemical and EnvironmentalProcess Engineering,
Research Group of Technical Chemistry,Hungarian Academy of Sciences Budapest H-1521, Muegyetem rkp 3, Hungary
Received 19 January 2007; accepted 14 June 2007
Abstract: Hybrid separation processes are becoming more and more important in the practice ifmembrane technologies are also involved. In this work, a systematic investigation is completed for threesequence alternatives of distillation and pervaporation. These are the following: pervaporation followedwith distillation (PV+D), distillation followed with pervaporation (D+PV), two distillation columnsand a pervaporation unit between them (D+PV+D). The hybrid separation process alternatives areevaluated with rigorous modelling tools, but first, a rigorous simulation algorithm is determined forthe pervaporation. The three hybrid separation processes are rigorously modelled with CHEMCAD,and optimized with the dynamic programming optimization method for the case of the separation ofethanol-water mixture. The objective function is the total annual cost (TAC).The energy consumptionis also investigated. The selection of the ethanol-water mixture has two motivations: (i) it is quiteoften studied and well known, and (ii) to make biofuel (ethanol) production more economical, membranetechnologies might also be applied. The results are compared with each other and with the classicalseparation completed with heteroazeotropic distillation. The optimized TAC shows that the distillationcolumn followed with pervaporation is the most economical hybrid separation process alternative. ItsTAC is about 66% of that of the classical separation.c© Versita Warsaw and Springer-Verlag Berlin Heidelberg. All rights reserved.
Keywords: hybrid separation processes, CHEMCAD
1 Introduction
Engineers are permanently forced to design or develop production processes that fulfil
product and production requirements in both economic and environmentally-conscious
∗ E-mail: [email protected]

K. Koczka et al. / Central European Journal of Chemistry 5(4) 2007 1124–1147 1125
ways. During these activities the efficient use of natural resources should be realized, on
the one hand, with e.g. the recycling of materials and/or energy (off-site or on-site) [1].
On the other hand, nowadays clean technologies are going to be applied more and more
to complete environmental expectations and also contribute to sustainable development
and consumption.
A relatively new tool of clean technologies is the application of different kinds of
membranes for separation purposes. Membrane separation technologies offer numerous
advantages over other mass transfer processes, such as: high selectivity, low energy con-
sumption, moderate cost to performance ratio, compact and modular design. Pervapo-
ration is one of the newest and most rapidly developing membrane technologies and it
has the advantage that it can be used for special separation tasks. The separation of
liquid mixtures by pervaporation is namely not limited by the vapour-liquid equilibrium
and azeotropic mixtures can be more simply separated with pervaporation than with
classical distillation techniques such as azeotropic distillation. Depending on the type
of membrane applied, the pervaporation can be also a successful separation alternative
for the solution of different complicated separation processes; e.g., dehydration of organic
solvents, the recovery of organic compounds, and the separation of organic mixtures. Cur-
rently, about one hundred pervaporation units are operating world wide; most of them
dehydrate different solvents, such as ethanol, isopropanol, tetrahydrofurane, etc. [2–8].
Pervaporation systems are now commercially available for two major applications [9]. The
first and most important one is the removal of water from concentrated alcohol solution.
GFT, now owned by Sulzer, the leader in this field, installed the first pilot plant in 1982.
The second commercial application of pervaporation is the removal of small amounts of
volatile organic compounds (VOCs) from contaminated water [10, 11]. This technology
was developed by Membrane Technology and Research [12–14]; the first commercial plant
was sold in 1996.
In recent years, pervaporation has established itself as one of the most promising mem-
brane technologies [3]. Generally, in many cases, the pervaporation alone can not supply
products suitable for further processing or waste disposal [11]. That is why pervapora-
tion is usually combined with other separation processes such as distillation, liquid-liquid
extraction, adsorption, and stripping. The advantages of a pervaporation process can be
even increased with special combinations. Such combined separation processes are the so
called hybrid separation processes [2]. These hybrid separation processes are becoming
more and more important in the practice and newer and newer processes are designed due
to the more and more complex separation problems. The advantages of the application of
hybrid separation processes are that the different kinds of unit operations can mutually
strengthen their merits, and more effective separation processes can be constructed than
only with using homogenous separation units [15].
The proper design of hybrid separation processes needs, however, comprehensive engi-
neering knowledge and design tools. One important design tool is the rigorous modelling
of the individual units of the designed hybrid separation process [16–18]. Such rigor-
ous modelling can be completed with professional flowsheeting software packages such

1126 K. Koczka et al. / Central European Journal of Chemistry 5(4) 2007 1124–1147
as ASPEN [19–21] or CHEMCAD. In order to commercially apply any new process, the
influence of different parameters must be well understood. With the help of the pro-
fessional flowsheeting software packages such an investigation can be completed. These
professional software tools contain reliable physical property data banks and also rigorous
models for several chemical engineering units. With the help of the flowsheeting software
packages, the design parameters of the unit operations can be determined with exhaust
and reliable modelling and optimization according to a defined objective function. Since
the pervaporation is a relatively new separation method its rigorous model is not yet
included in the flowsheeting packages.
There have been incentives to enable these software packages for such an investigation
with the addition of a pervaporation module. A module in AspenPlus environment solves
mass and energy balances for pervaporation by using an empirical model for heat and
mass transfer. The empirical model is based on experimental results [10].
In our work three hybrid separation process alternatives (different combinations of
distillation and pervaporation) are investigated with the professional flowsheeting tool
CHEMCAD. The pervaporation mass transport is described with the “solution-diffusion”
model. The different hybrid separation process alternatives are compared on an economic
basis with each other and with a non-hybrid separation alternative considered as base
case. To complete such a comprehensive investigation, first the “solution-diffusion”model
of the pervaporation is transformed into the professional software environment.
2 Modelling of pervaporation
Pervaporation is a method for separation of two or more components in a liquid mixture.
The separation can take place through a non-porous permselective membrane [22–25].
The liquid feed-mixture is circulated in contact with the membrane, and the permeate is
collected in vapour phase on the opposite side of the membrane, that is under vacuum.
The transport of the permeate through the permselective membrane film involves three
successive steps:
• selective sorption
• selective diffusion
• desorption
Behaviour of the pervaporation membrane used to separate a binary A-B liquid mixture
is characterized by two experimental parameters, the selectivity (α) and the permeate
flux (J). The selectivity can be also defined as follows [26]:
α =cAP
cBP
cAF
cBF
=cP · (1 − cF )
cF · (1 − cP )(1)
cF and cP are the concentrations of the permeating component (A) in the feed and in the
permeate, respectively. The permeate flux can be expressed with the following equation:
Ji =1
a
dvi
dt(2)

K. Koczka et al. / Central European Journal of Chemistry 5(4) 2007 1124–1147 1127
where a is the active membrane area, dvi is the volume of permeate for component i
during dt period of time.
Since the permeated material flow is usually not known, the flux should be also defined
in a different way. The ideal sorption and diffusion behaviour shows Fick’s law function:
Ji = −Di∇ci (3)
where Di is the diffusion coefficient and ∇ci is the driving force.
The advantage of Fick’s law is that it is extremely simple in mathematical form but it
has, however, the disadvantage that the diffusion coefficient depends on the concentration
in a very complicated form when dealing with non-ideal systems.
There have been several attempts to model the pervaporation with the proper appli-
cation of diffusion coefficients - e.g., Nagy [27].
Baker [9] has investigated the effect of concentration polarization in liquid separation
processes. He has found that the “concentration polarization modulus” in the case of
pervaporation applied for dehydration is practically equal to 1. That means, that the
concentration polarization has negligible effect in such cases.
To overcome this problem, Rautenbach [22] has recommended a model for pervapo-
ration. The model is the so called “solution diffusion” model which corresponds to the
physical occurrence of pervaporation. The model is capable of describing the behaviour
of pervaporation if a so called “composite” membrane is applied. The composite mem-
branes have two layers: a permselective active layer and a porous support layer. The
model expresses the molecular transport practically with the gradient of chemical po-
tential because in this case the transport coefficient, Di0 can be applied to describe the
pervaporation. The transport coefficient depends on the concentration but in a negligible
way [22].
Ji = −cDi0
fi0
1
γi∇fi (4)
or, in one-dimensional case
Ji = −cDi0
fi0
dfi
dz(5)
where f is fugacity for component i.
The integration of equation (5) results in:
Ji =cDi0
δγi
(fi1−fi3
fi0
)=
Di0
γi
(fiF − fiP
fi0
)(6)
γi =√
γiF · γiP and dfi = fiF − fiP .
The temperature dependency of the thermodynamic diffusion coefficients - Di0 if the
Fick’s law is concerned, or the transport coefficient Di0- follows an Arrhenius type law:
Di0 = Di0• exp
(Ei0
R
(1
T • − 1
T
))(7)

1128 K. Koczka et al. / Central European Journal of Chemistry 5(4) 2007 1124–1147
The support layer of the composite membrane is a porous layer and it should be also
described. The flux through the porous layer can be described with:
J = Q0Δppor (8)
where ppor is the pressure drop on the porous layer.
The description of the flux of the individual components through a composite mem-
brane needs the combination of eq 6 and 8. Considering the low pressure, the fugacity
values can be replaced with the pressure values. The combination results in the following
equation that describes the flux through a composite membrane:
Ji =1
1 + Di0
Q0pi0γi
· Di0
γi
·(
piF − piP
pi0
)(9)
The parameters of the model (Q0, Di0•, Ei0) should be determined with pervaporation
experiments made with liquid mixture on the membrane selected for application. If the
coefficients are determined, the modelling of the pervaporation can be solved.
Since the aim of this work is to model the pervaporation in a professional software
environment and those software tools are not prepared for such a situation, the problem
should be solved in a different way. Instead of solving a differential equation system, a
difference equation system can be applied supposing such an infinitesimally small piece of
membrane area/section (ainf) where constant feed composition and temperature can be
supposed; that is, the volume of the membrane unit assigned to this small membrane area
is considered as a perfectly mixed volume. The pervaporation can be modelled with the
equation (9) for such a small membrane area [28]. The total membrane can be divided
into “n” hypothetical pieces of small membrane section:
n =a
ainf(10)
Fig. 1 Scheme for the modelling of pervaporation supposing sections.
The heat and material balances can be determined (see Figure 1). For the overall
membrane it can be written that:

K. Koczka et al. / Central European Journal of Chemistry 5(4) 2007 1124–1147 1129
F = Ret + Perm (11)
F · xiF = Ret cot xiR + Perm · xiP (12)
For any selected small membrane section, it can be also written that:
Fl−1 = Fl + Pl l = 1...n (13)
F0 = F (14)
Fn = Ret (15)
The permeate flow of any selected small membrane section is:
Pi =
(k∑
i=1
Ji
)· ainf i = 1...k (16)
where k is the number of pervaporating components
Perm =n∑
l=1
Pl (17)
The heat balance for any small membrane section can be also determined. Since the
heat requirement of the pervaporation is covered by the sensible heat of the feed flow, if
no external heating is applied, the temperature drop of the feed flow after every small
membrane section can be determined
ΔTl =
(∑ki=1 λi · Ji
)· ainf
Fl · cP ll = 1...n (18)
The temperature of the permeate flow is supposed to be equal to the temperature
of the liquid flow leaving the hypothetical small membrane section (T1, T2 . . . etc). In
the user added subroutine written in CHEMCAD, internal iterations are applied for each
small membrane area section to obtain more accurate data, with convergence. Isothermal
option of the pervaporation is also an option of the user-added CHEMCAD subroutine.
In those cases the heating requirement is calculated with the help of the heat balance.
An important parameter of this calculation is the area of the small membrane section
where constant composition and temperature can be still supposed. It can be deter-
mined in such a way that always smaller and smaller membrane sections are supposed,
and the whole membrane is modelled with the small membrane sections supposed. If
the calculated data with decreasing membrane section area is not changing, the section
area can be accepted. A test calculation is made with changing membrane section area.
The feed stream is 100◦C, 100 kg/h, 94 wt% ethanol and the membrane area is 50 m2.
Figure 2 shows the retentate stream and its composition changes with growing number

1130 K. Koczka et al. / Central European Journal of Chemistry 5(4) 2007 1124–1147
of membrane sections related to 1 m2 membrane area. In this case the 20 hypothetical
membrane section per m2 gives acceptably good result.
This model based on Rautenbach’s work [22] with our development is quite suitable for
engineering calculations and design. The additional heat balance enables the calculation
both in isothermal and adiabatic way [28]. According to this model, a special user added
subroutine is written in the frame of the CHEMCAD software.
Fig. 2 Changes with number of membrane section.
3 Experiments
The user-added subroutine written according to equations 6–18 needs the parameters of
pervaporation, that is, the transport coefficients for each component at fixed tempera-
ture (D•i0), the activation energy for each component (Ei0), and the permeability (Q0).
These parameters are determined with experiments. Ethanol-water system and compos-
ite membrane (PERVAP 2210 commercial PVA/PAN membrane) are selected since later
the results of the rigorous design are compared with experiments.
The pervaporation experiments are carried out using a CM-CELFA MEMBRAN-
TECHNIK AG P-28 pervaporation apparatus. The effective membrane area is 28 cm2.
The temperature of the system is controlled at a constant value (Figure 3). The permeate
side is under vacuum of 8 mbar. The permeate solution is collected in a trap cooled with
liquid nitrogen and analyzed by gas chromatograph (GC-14B standard model, Shimadzu
Co). During the measurements, this analytical method is always applied. The fluxes
of both components are determined. On the behalf of the measurements at different
conditions, the parameters of the system needed for the model of the pervaporation are
determined and applied for rigorous simulations.

K. Koczka et al. / Central European Journal of Chemistry 5(4) 2007 1124–1147 1131
Fig. 3 Laboratory pervaporation system.
Fig. 4 Experimental and modelled Flux data by ethanol dehydration.
The measured and calculated flux and permeate composition data are compared. The
comparisons are presented in Figures 4, 5 and they show good agreement.

1132 K. Koczka et al. / Central European Journal of Chemistry 5(4) 2007 1124–1147
Fig. 5 Experimental and modelled permeate composition data by ethanol dehydration.
4 Results and discussion
4.1 Systematic investigation of hybrid separation processes
The hybrid separation processes which consist of distillation and pervaporation are very
efficient for the separation of such organic compound and water mixtures, dehydration,
where compounds form azeotrope since the pervaporation is not limited by the azeotrope.
For the dehydration of such organic compound with distillation technique, e.g. azeotropic
distillation is usually a complicated and expensive solution [29].
There can be several alternatives for the coupling of the distillation and pervaporation
and a systematic investigation can be carried out.
The coupling of these two kinds of units can happen in different ways:
(1) Pervaporation followed with distillation of the permeate stream (PV+D);
(2) Distillation followed with pervaporation (D+PV);
(3) Distillation followed with pervaporation and another distillation (D+PV+D).
These three schemes of hybrid separation processes are designed with the help of
rigorous modelling. The alternatives are optimized with dynamic programming. The
objective function of the optimization is the total annual cost.
The results are compared with the classical azeotropic distillation, which is considered
as base case. The mixture to be separated is an industrial problem (Table 1), that is the
separation of ethanol and water. The product purity prescriptions are also taken from
the industry. This mixture is deliberately selected since its behaviour is well studied and
K. Koczka et al. / Central European Journal of Chemistry 5(4) 2007 1124–1147 1133
known, industrial data are available for its pervaporation, and the biofuel incentives all
over the world makes its economics of separation actual again [30].
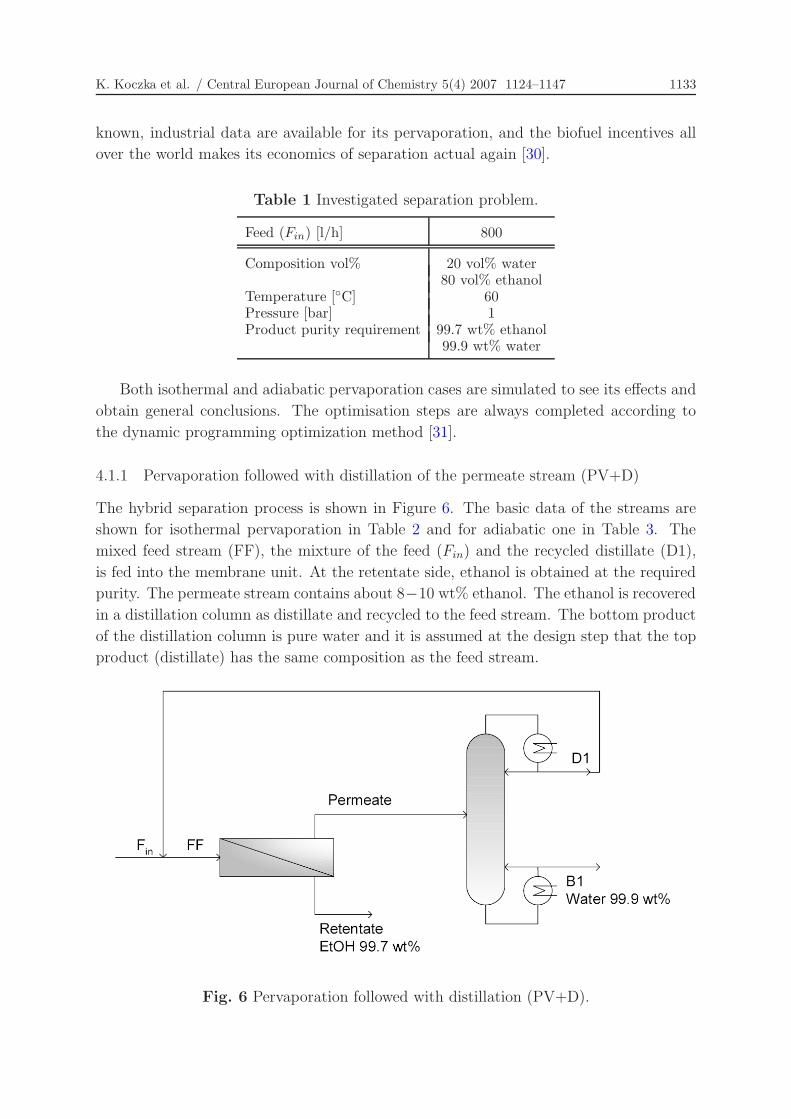
Table 1 Investigated separation problem.
Feed (Fin) [l/h] 800
Composition vol% 20 vol% water80 vol% ethanol
Temperature [◦C] 60Pressure [bar] 1Product purity requirement 99.7 wt% ethanol
99.9 wt% water
Both isothermal and adiabatic pervaporation cases are simulated to see its effects and
obtain general conclusions. The optimisation steps are always completed according to
the dynamic programming optimization method [31].
4.1.1 Pervaporation followed with distillation of the permeate stream (PV+D)
The hybrid separation process is shown in Figure 6. The basic data of the streams are
shown for isothermal pervaporation in Table 2 and for adiabatic one in Table 3. The
mixed feed stream (FF), the mixture of the feed (Fin) and the recycled distillate (D1),
is fed into the membrane unit. At the retentate side, ethanol is obtained at the required
purity. The permeate stream contains about 8−10 wt% ethanol. The ethanol is recovered
in a distillation column as distillate and recycled to the feed stream. The bottom product
of the distillation column is pure water and it is assumed at the design step that the top
product (distillate) has the same composition as the feed stream.
Fig. 6 Pervaporation followed with distillation (PV+D).

1134 K. Koczka et al. / Central European Journal of Chemistry 5(4) 2007 1124–1147
Table 2 Technological streams of isothermal pervaporation, PV+D.
PV+D FF Permeate Retentate D1 B1
Stream [kg/h] 690.60 179.69 510.91 21.1 158.59EtOH wt% 80 vol% 9.2 99.7 80 vol% 0.1Water wt% 20 vol% 90.8 0.3 20 vol% 99.9
Table 3 Technological streams of adiabatic pervaporation, PV+D.
PV+D FF Permeate Retentate D1 B1
Stream [kg/h] 688.92 177.86 511.06 19.39 158.47EtOH wt% 80 vol% 8.3 99.7 80 vol% 0.1Water wt% 20 vol% 91.7 0.3 20 vol% 99.9
During the rigorous simulation and optimization the objective function is the total
annual cost. The manipulated variables are the necessary membrane area, the size of the
distillation column(s) and their operating parameters, and the interconnecting streams
between the units are to be determined.
4.1.2 Distillation followed with pervaporation (D+PV)
The opposite coupling of the two units is also investigated (Figure 7). The basic data of
the streams are shown for isothermal pervaporation in Table 4 and for adiabatic one in
Table 5. In this case the distillation is followed with the pervaporation. The mixed feed
(FF), the mixture of the feed (Fin) and the permeate, is introduced into the distillation
column. The bottom product is pure water. The distillate is fed into the pervaporation
unit. This stream is concentrated there. The retentate stream contains 99.7 wt% ethanol.
The permeate stream is about 8% of the feed (Fin). It is recycled and mixed to the feed.
Control simulations show no significant change in system parameters if the permeate flow
is recycled and fed individually into the distillation column.
Table 4 Technological streams of isothermal pervaporation, D+PV.
PV+D FF Permeate Retentate D1 B1
Stream [kg/h] 726.39 56.86 510.93 567.79 158.60EtOH wt% 72.0 22.8 99.7 92.0 0.1Water wt% 28.0 77.2 0.3 8.0 99.9
The composition of the distillate, the size of the distillation column, and the necessary
membrane area are determined at the optimization step to achieve the minimal total
annual cost.

K. Koczka et al. / Central European Journal of Chemistry 5(4) 2007 1124–1147 1135
Fig. 7 Distillation followed with pervaporation (D+PV).
Table 5 Technological streams of adiabatic pervaporation, D+PV.
PV+D FF Permeate Retentate D1 B1
Stream [kg/h] 721.68 52.15 510.57 562.72 158.96EtOH wt% 72.6 72.7 99.7 93.0 0.1Water wt% 27.4 27.3 0.3 7.0 99.9
4.1.3 Distillation followed with pervaporation and another distillation (D+PV+D)
The third investigated hybrid separation system consists of the following units (Figure 8):
a distillation column, a pervaporation unit, and another distillation column. In the first
column the mixture of the feed stream and the recycled permeate (FF1) is concentrated
close to the azeotropic composition. This is the distillate (D1) which is fed into the perva-
poration unit only for breaking the azeotrope composition; that is, to increase the ethanol
composition in the retentate above the azeotropic point. The retentate is fed into the
second distillation column where pure ethanol (99.7 wt%) is produced as bottom product.
The distillate of the second distillation column (D2) is fed back into the pervaporation
unit. Therefore, the real feed of the pervaporation unit (FF2) is the mixture of D2 and
D1. The compositions of the products of the distillation columns and the connecting flows
are shown for isothermal case in Table 6 and for adiabatic case in Table 7. The size of the
two distillation columns and the membrane area are determined with the optimization.
This hybrid separation system has the advantage over the other two systems in that
this can produce ethanol at any desired purity, even close to 100% which is usually a typi-
cal requirement for gasoline replacement. Namely, at such product purity, the membrane
separation can result in high recycle streams. However, membrane development might
help to overcome this problem.

1136 K. Koczka et al. / Central European Journal of Chemistry 5(4) 2007 1124–1147
Fig. 8 Distillation followed with pervaporation and another distillation (D+PV+D).
Table 6 Technological streams of isothermal pervaporation, D+PV+D.
D+PV+D FF1 D1 B1 FF2 Perm Ret D2 B2
Stream [kg/h] 723.49 564.90 158.59 634.59 53.97 580.62 69.69 510.93EtOH wt% 71.9 92.0 0.1 92.7 19.1 99.5 98.0 99.7Water wt% 28.1 8.0 99.9 7.3 80.9 0.5 2.0 0.3
Table 7 Technological streams of adiabatic pervaporation, D+PV+D.
D+PV+D FF1 D1 B1 FF2 Perm Ret D2 B2
Stream [kg/h] 730.26 571.53 158.73 598.45 60.74 537.71 26.92 510.79EtOH wtWater wt
This advantage enables the D+PV+D system to be seriously considered for the pro-
duction of ethanol as gasoline replacement.
4.1.4 Azeotropic distillation
The results of the hybrid separation processes are compared to the result of the classical
separation method azeotropic distillation, or more specifically, heteroazeotropic distilla-
tion. This separation using cyclohexane as entrainer is also investigated (Figure 9). The
basic flow streams are given in Table 8. The system consists of three distillation columns,
phase separator, and several interconnecting streams. In the first column the bottom
product is pure water (99.9 wt%) and the distillate is ethanol-water mixture of almost
azeotropic composition (95.5 wt%). This mixture is the feed of the second distillation
column where the entrainer is also added to get the ternary azeotrope in the distillate.
The bottom product is the ethanol of 99.7 wt%. The top product is fed into the phase

K. Koczka et al. / Central European Journal of Chemistry 5(4) 2007 1124–1147 1137
separator where the separation is facilitated with little water addition. The organic rich
layer is recycled in the second distillation column. The water rich layer is processed in
the third column and its bottom product is pure water.
Fig. 9 Azeotropic distillation with cyclohexane as entrainer.
Table 8 Technological streams of adiabatic pervaporation, D+PV+D.
Azeotropic d. D1 B1 D2 B2 FF Org.L. D3 B3
Stream [kg/h] 533.42 136.1 1234.85 510.92 1239.85 810.22 402.13 27.50EtOH wt% 95.5 0.1 25.5 99.7 25.4 5.5 67.3 0.1Water wt% 4.5 99.9 3.8 0.3 4.2 0.5 5.1 99.9C6H12 wt% - - 70.7 - 70.4 94.0 27.6 -
This structure and the minimal cyclohexane needed are also optimized to obtain the
minimal total annual cost.
5 Results of the rigorous modelling and optimization
During the design of the hybrid process alternatives, their basic parameters are deter-
mined with exhaustive rigorous simulation completed with professional software tool sup-
plemented with the user added subroutine written for the modelling of pervaporation. The
parameters of the pervaporation subroutine are determined with experiments.
Since the objective function of the hybrid separation process design is the total annual
cost, the capital cost is estimated according to Douglas work and industrial data [32, 33];
the utility costs are also calculated. Table 9 shows the cost data used for the calculations.
Continuous operation is assumed, the project life is 10 years, and one year consists of
8000 operating hours. Capital cost of replacing the membrane is also included in the

1138 K. Koczka et al. / Central European Journal of Chemistry 5(4) 2007 1124–1147
objective function considering that they must be replaced every 2.5 years. Since the
pervaporation unit production industry usually delivers the membrane units with the
necessary heat exchangers, the price of a pervaporation unit (pervaporator) includes also
the heat exchangers needed at pervaporation [33].
Table 9 Technological streams of adiabatic pervaporation, D+PV+D.
M&S (Marshall Swift) 1117
Low-pressure steam 18.1 USD/tCooling water 0.042 USD/tElectric power 43 USD/MWhCyclohexane 11.4 USD/tMembrane replacement cost 500 USD/m2
With the application of the principles of the dynamic programming optimization
method, the design parameters of the different hybrid separation process alternatives
are determined so that the total annual cost should be minimal. These design parame-
ters are the membrane surface, distillation column parameters (number of trays, feed tray
location, reflux ratio, product purity) and operating conditions of the equipment items,
flow rates, compositions of the flows, and energy requirement.
The step of optimization is presented for the D+PV scheme. An important design
parameter is the composition of the distillate. If the distillate has low ethanol composi-
tion, a higher pervaporation unit is needed and vice versa. For that reason, an optimal
distillate composition exists. The operation at the optimal distillate composition means
also that the necessary parameters of the system are the optimal ones.
Fig. 10 Cost of distillation column.

K. Koczka et al. / Central European Journal of Chemistry 5(4) 2007 1124–1147 1139
Figure 10 shows the change of the cost of the distillation column of the D+PV hybrid
separation system at different product purities (0.91 − 0.95 wt% ethanol) and different
number of theoretical plates. The data represent the optimal parameters of the distillation
column, that is, the optimal feed tray is located and the necessary reflux ratio is also
determined.
It clearly shows that lower ethanol concentration in the distillate requires a smaller
and cheaper distillation unit. This result is in agreement with the expectations. Accord-
ing to the dynamic programming, the pervaporation unit is involved in the subsequent
step. The cost of the pervaporation unit consists of the capital cost and the operation
costs considering heating and cooling, pumping, and vacuum cost [34]. The cost of the
pervaporation related to annual basis should be summed up with the cost of distilla-
tion shown in Figure 10 but there can be two basic alternatives for consideration of the
pervaporation: isothermal and adiabatic ones.
According to the experiences described also in the model applied, in the case of
pervaporation the flux through the membrane is higher if the temperature is higher. Since
during pervaporation the permeate is vaporized and the heat of evaporation is taken from
the sensible heat of the feed, the temperature drops down if no extra heat is added to the
system. If the temperature drops, the flux becomes lower and a pervaporator of higher
membrane area is needed for the same performance. Since the price of the pervaporator
is increasing with the area of the membrane, the heating has a paramount importance in
the pervaporator. The pervaporator usually consists of several units of certain area and
between these units the feed flow is reheated.
On the other hand, the pervaporator producers are motivated for better heat transfer
in the pervaporator. Ad absurdum two extremes can be imagined: isothermal pervapo-
ration and adiabatic pervaporation.
At the modelling of the pervaporation these two alternatives are considered in the
user added subroutine developed in the frame of this work: (a) isothermal pervaporation,
(b) adiabatic pervaporation. If the isothermal pervaporation is selected it results in the
minimum membrane area. This alternative calculates also the heat requirement needed
to guarantee the isothermal operation.
If adiabatic pervaporation is selected that gives a higher membrane area, the area
of the individual units in the pervaporator should be also determined and the reheating
between them should be also designed.
5.1 Isothermal pervaporation
In this first alternative isothermal operation of the pervaporator is assumed. The param-
eters of the pervaporator are determined and also its cost values.
1140 K. Koczka et al. / Central European Journal of Chemistry 5(4) 2007 1124–1147
Fig. 11 Total annual cost of D+PV system.
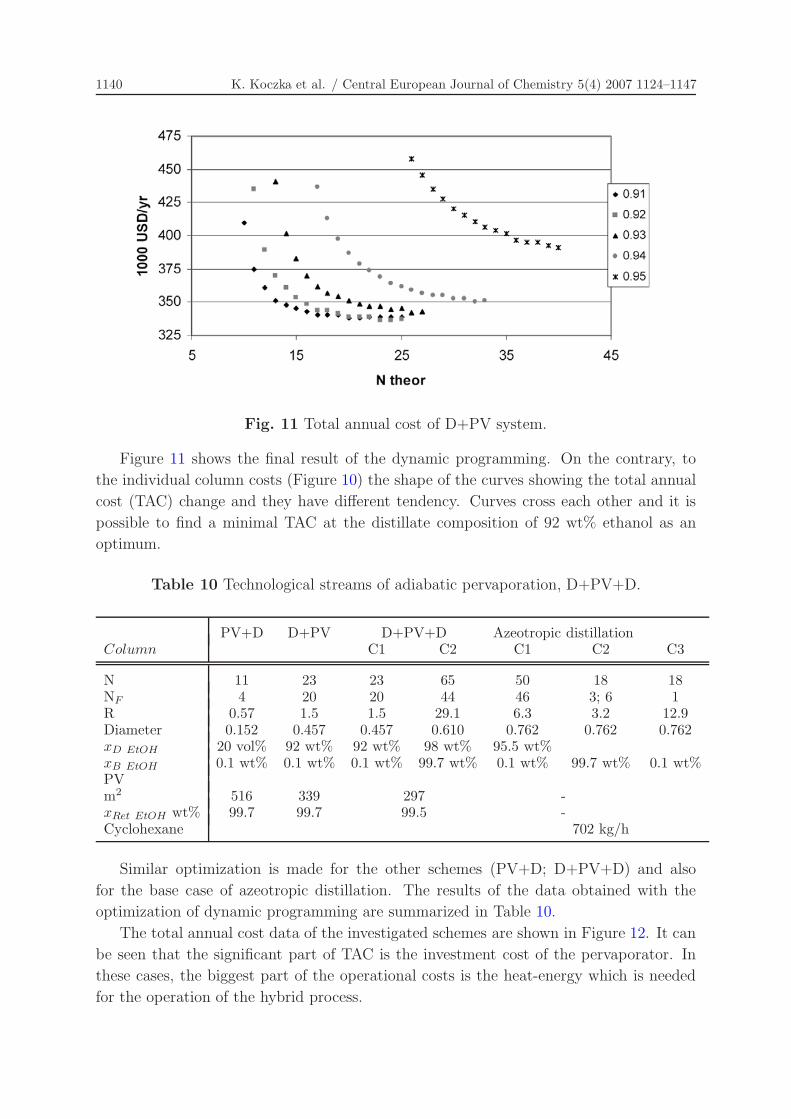
Figure 11 shows the final result of the dynamic programming. On the contrary, to
the individual column costs (Figure 10) the shape of the curves showing the total annual
cost (TAC) change and they have different tendency. Curves cross each other and it is
possible to find a minimal TAC at the distillate composition of 92 wt% ethanol as an
optimum.
Table 10 Technological streams of adiabatic pervaporation, D+PV+D.
PV+D D+PV D+PV+D Azeotropic distillationColumn C1 C2 C1 C2 C3
N 11 23 23 65 50 18 18NF 4 20 20 44 46 3; 6 1R 0.57 1.5 1.5 29.1 6.3 3.2 12.9Diameter 0.152 0.457 0.457 0.610 0.762 0.762 0.762xD EtOH 20 vol% 92 wt% 92 wt% 98 wt% 95.5 wt%xB EtOH 0.1 wt% 0.1 wt% 0.1 wt% 99.7 wt% 0.1 wt% 99.7 wt% 0.1 wt%PVm2 516 339 297 -xRet EtOH wt% 99.7 99.7 99.5 -Cyclohexane 702 kg/h
Similar optimization is made for the other schemes (PV+D; D+PV+D) and also
for the base case of azeotropic distillation. The results of the data obtained with the
optimization of dynamic programming are summarized in Table 10.
The total annual cost data of the investigated schemes are shown in Figure 12. It can
be seen that the significant part of TAC is the investment cost of the pervaporator. In
these cases, the biggest part of the operational costs is the heat-energy which is needed
for the operation of the hybrid process.

K. Koczka et al. / Central European Journal of Chemistry 5(4) 2007 1124–1147 1141
Fig. 12 Total annual cost with isothermal pervaporation.
In traditional azeotropic distillation, the steam demand is the biggest part of the cost
items. It can be also seen that all of the three pervaporation based hybrid separation
processes are more economical than the base case, the azeotropic distillation.
The most economical one is the distillation followed with pervaporation (D+PV)
where the least material flow goes to the pervaporator.
5.1.1 Adiabatic pervaporation
The adiabatic operation represents such conditions where the heat transfer in the perva-
porator takes place between its membrane units. According to real industrial examples
and industrial case studies standard 27 m2 membrane units are supposed and accepted.
The similar optimization procedures of dynamic programming are carried out also for
these cases. Table 11 shows the optimal design parameters of the investigated schemes.
In this case the optimal parameters change. It is important to remark that the necessary
membrane areas are higher than in the corresponding isothermal case. This phenomenon
results that in the case of D+PV in which the optimal distillate composition should
be higher (93 wt%) than that of the isothermal one so that a pervaporator of smaller
area than the isothermal one should be satisfactory for the requirement of the prescribed
product composition.
Figure 13 shows the total annual costs of the investigated schemes in adiabatic mode
compared with the base case, the azeotropic distillation. Since membrane areas of the
pervaporators are higher than that of the isothermal ones, their investment costs are also
higher. Due to this phenomenon the most expensive system is the pervaporation followed
with distillation but the most economical one is the D+PV again.

1142 K. Koczka et al. / Central European Journal of Chemistry 5(4) 2007 1124–1147
Table 11 Optimal parameters of adiabatic pervaporation.
PV+D D+PV D+PV+D Azeotropic distillationColumn C1 C2 C1 C2 C3
N 11 26 20 66 50 18 18NF 4 23 16 54 46 3; 6 1R 0.57 2 1.2 47.8 6.3 3.2 12.9Diameter 0.152 0.610 0.457 0.457 0.762 0.762 0.762xD EtOH 20 vol% 93 wt% 91 wt% 97.5 wt% 95.5 wt%xB EtOH 0.1 wt% 0.1 wt% 0.1 wt% 99.7 wt% 0.1 wt% 99.7 wt% 0.1 wt%PVm2 648 405 378 -xRet EtOH wt% 99.7 99.7 99.5 -Cyclohexane 702 kg/h
Fig. 13 Total annual cost with adiabatic pervaporation.
6 Comparison of energy consumptions
It is interesting to compare the energy requirement of the three hybrid separation pro-
cesses and the base case, that is the azeotropic distillation. The energy consumption does
not depend on the fact if adiabatic or isothermal pervaporations are considered, it is the
same if the separation problem is the same.
Figures 12 and 13 show the results of the comparison where the energy costs are
indicated, which are practically proportional with the energy consumption. The following
conclusions can be determined:
• the azeotropic distillation has the highest energy cost and consumption by far,

K. Koczka et al. / Central European Journal of Chemistry 5(4) 2007 1124–1147 1143
• the D+PV+D alternative is more attractive than the azeotropic distillation if almost
100% pure ethanol should be produced e.g. as biofuel replacement. Its energy
consumption is 33% of that of the classical separation solution,
• the PV+D alternative has the smallest energy cost and consumption It is 16
• the electric energy consumption becomes significant only in the case of the PV+D
alternative.
The energetic investigation gives important information about the hybrid separation
alternatives. The D+PV+D alternative helps to reduce both the costs and the energy
consumption of biofuel production. It is worth mentioning that with membrane improve-
ments it might become possible to produce practically 100% pure ethanol with reasonable
recycle flow. Although the PV+D alternative is not the cheapest alternative, it has the
smallest energy consumption.
7 Conclusions
The developed user added subroutine for rigorous modelling of pervaporation in profes-
sional software environment proves to be a useful and powerful tool for the design of
hybrid separation processes also containing pervaporation. The systematic investigation
of such hybrid separation processes that consist of distillation and pervaporation units is
carried out and the optimal scheme of lowest total annual cost or energy consumption is
determined with dynamic programming optimization method. The results show that a
more efficient heat transfer in the pervaporation unit can decrease its area requirement
and as a consequence its cost. According to the simulation of both isothermal and adia-
batic pervaporation, it is found that the membrane area difference is about 10% between
the two options. This cost reduction alternative is an important one since the capital
cost of the pervaporation unit is the highest part of the total annual cost by far. It is
also proved that the more economical scheme is that one if the distillation is followed
with the pervaporation (D+PV) that is the possible least material flow is processed in
the membrane unit. In the case of this scheme it is not a proper policy to design a dis-
tillation column producing a distillate of almost azeotropic composition since there is an
optimum value for the distillate composition that is smaller with several percents than
the azeotropic composition and depends on the cost of the pervaporation.
The D+PV+D scheme offers a more economical and also more energy efficient al-
ternative for biofuel production compared to conventional azeotropic distillation, since
this separation alternative is able to produce high purity ethanol without huge recycle
streams. If only the energy consumption is considered, the PV+D scheme has the least
energy requirement.
Acknowledgement
This work was supported by OTKA, Hungarian Sciences Research Fund; Grants T
042600, T 046218, TS 049849.

1144 K. Koczka et al. / Central European Journal of Chemistry 5(4) 2007 1124–1147
Nomenclature
a active membrane area, m2
ainf area of infinitesimally small membrane section, m2
A component
B component
c concentration
cP coefficient of molar specific heat, Jmol·K
D diffusion coefficient, molm2s
D average transport coefficient, molm2s
D• average transport coefficient at fixed temperature, molm2s
E activation energy, Jmol
f fugacity, bar
F feed flow, mols
Fin industrial initial feed flow, mols
FF mixed feed flow, mols
J flux, molm2s
k number of pervaporating components
p pressure, bar
Δppor pressure drop on porous layer, bar
Perm permeate flow, mols
Q0 permeability coefficient of porous support, molm2s·bar
R ideal gas constant, Jmol·K
Ret retentate flow, mols
t time, s
T temperature, K
T • fixed temperature, K
ΔT temperature drop on feed side, K
v volume of permeate, mol
x mole fraction
z dimension
Greek letters
α selectivity factor
δ thickness of the active layer, m
λ heat evaporation, Jmol
γ activity coefficient
γ average activity coefficient

K. Koczka et al. / Central European Journal of Chemistry 5(4) 2007 1124–1147 1145
Subscripts
i general component index
F feed side
l index of the infinitesimally small membrane section
n number of the infinitesimally small membrane section
P permeate side
R retentate side
0 pure component
References
[1] P. Mizsey: “Waste reduction in the chemical industry: a two level problem”, J.
Hazard Mater., Vol. 37, (1994), pp. 1–13.
[2] V.V. Hoof, L.V. den Abeele, A. Buekenhoudt, C. Dotremont and R. Leysen: “Eco-
nomic comparison between azeotropic distillation and different hybrid systems com-
bining distillation with pervaporation for the dehydration of isopropanol”, Sep. Purif.
Technol., Vol. 37, (2004), pp. 33–49.
[3] F. Lipnizki, R.W. Field and Po-Kiong Ten: “Pervaporation-based hybrid process: a
review of process design, application and economics”, J. Membrane Sci., Vol. 153,
(1999), pp. 183–210.
[4] N. Wynn: “Pervaporation Comes of Age”, Chem. Eng. Prog., Vol. 97, (2001), pp.
66–72.
[5] U. Sander and P. Soukup: “Design and operation of a pervaporation plant for ethanol
dehydration”, J. Membrane Sci., Vol. 36, (1988), pp. 463–475.
[6] C.L. Hsueh, J.F. Kuo, Y.H. Huang, C.C. Wang and C.Y. Chen: “Separation of
ethanol-water solution by poly(acrylonitrile-co-acrilyc acid) membranes”, Sep. Purif.
Technol., Vol. 41, (2005), pp. 39–47.
[7] D. Van Baelen, B. Van der Bruggen, K. Van den Dungen, J. Degreve and C. Vande-
casteele: “Pervaporation of water-alcohol mixtures and acetic acid-water mixtures”,
Chem. Eng. Sci., Vol. 60, (2005), pp. 1583–1590.
[8] K. Koczka, J. Manczinger, P. Mizsey and Z. Fonyo: “Novel hybrid separation pro-
cesses based on pervaporation for THF recovery”, Chem. Eng. Process, Vol 46,
(2007), pp. 239–246.
[9] R.W. Baker: Membrane Technology and Applications, Membrane Technology and
Research, 2nd ed.,Wiley, England, 2004.
[10] O. Trifunovic, F. Lipnizki and G. Tragardh: “The influence of process parameters on
aroma recovery by hydrophobic pervaporation”, Desalination, Vol. 189, (2006), pp.
1–12.
[11] M.-C. Belis-Bergouignan, V. Oltra and M.S. Jean: “Trajektories towards clean tech-
nology: example of volatile organic compound emission reductions”, Ecol. Econ.,
Vol. 48, (2004), pp. 201–220.

1146 K. Koczka et al. / Central European Journal of Chemistry 5(4) 2007 1124–1147
[12] I. Blume, J. G. Wijmans and R. W. Baker: “The Separation of Dissolved Organics
from Water by Pervaporation”, J. Membrane. Sci., Vol. 49, (1990), pp. 253–286.
[13] A. L. Athayde, R. W. Baker, R. Daniels, M.H. Le and J.H. Ly: “Pervaporation for
Wastewater Treatment”, Chemtech, Vol. 1, (1997), pp. 34–39.
[14] G. Cox and R.W. Baker: “Pervaporation for the Treatment of Small Volume VOC
contaminated Waste Water Streams”, Industial Wastewater, Vol. 6, (1998), pp. 35–
38.
[15] B.V. der Bruggen, E. Curcio and E. Drioli: “Process intensification in the textile
industry: the role of membrane technology”, J. Environ. Manage, Vol. 73, (2004),
pp. 267–274.
[16] J. Marriott and E. Sorensen: “The optimal design of membrane systems”, Chem.
Eng. Sci., Vol. 58, (2003), pp. 4991–5004.
[17] J. Marriott and E. Sorensen: “A general approach to modeling membrane modules”,
Chem. Eng. Sci., Vol. 58, (2003), pp. 4975–4990.
[18] A.M. Eliceche, M.C. Daviou, P.M. Hoch and I.O. Uribe: “Optimization of azeotropic
distillation columns combined with pervaporation membranes”, Comput. Chem.
Eng., Vol. 26, (2002), pp. 563–573.
[19] P. D. Chapman, X. Tan, A.G. Livingston, K. Li and T. Oliveira: “Dehydration of
tetrahydrofuran by pervaporation using composite membrane”, J. Membrane Sci.,
Vol. 268, (2006), pp. 13–19.
[20] A. Fahmy, D. Mewes and K. Ohlrogge: “Absorption-assisted pervaporation for sol-
vent dehydration”, Desalination, Vol. 149, (2002), pp. 9–14.
[21] M. R. Shah, R.D. Noble and D.E. Clough: “Pervaporation-air stripping hybrid pro-
cess for removal of VOCs from groundwater”, J. Membrane Sci., Vol. 241, (2004),
pp. 257–263.
[22] R. Rautenbach, C. Herion and U. Meyer-Blumenroth: “Engineering aspects of perva-
poration: calculation of transport resistances, module optimization and plant design
in Pervaporation membrane separation processes”, edited by R.Y.M. Huang, Mem-
brane Science and Technology Series, 1st ed, Elsevier, New York, 1991, pp. 181–224.
[23] P. Schaetzel, C. Vauclair, G. Luo and Q.T. Nguyen: “The solution-diffusion model
order of magnitude calculation of coupling between the flux in pervaporation”, J.
Membrane Sci., Vol 191, (2001), pp. 103–108.
[24] J.M. Neto and M.N. Pinho: “Mass transfer modeling for solvent dehydration by
pervaporation”, Sep. Purif. Technol., Vol. 18, (2000), pp. 151–161.
[25] A. Lovasz, P. Mizsey and Z. Fonyo: “Methodology for parameter estimation of mod-
elling of pervaporation in flowsheeting environment”, Chem. Eng. J., Vol. 133, (2007),
pp. 219–227.
[26] J. Neel: “Introduction to pervaporation in Pervaporation membrane separation pro-
cesses”, edited by R.Y.M. Huang, Membrane Science and Technology Series, 1 Else-
vier, New York, 1991, pp. 23–31.
[27] E. Nagy: “Binary, coupled mass transfer with variable diffusivity through cylindrical
dense membrane”, J. Membrane Sci., Vol. 274, (2006), pp. 159–168.
K. Koczka et al. / Central European Journal of Chemistry 5(4) 2007 1124–1147 1147
[28] P. Mizsey, K. Koczka, A. Deak and Z. Fonyo: “Simulation of pervaporation with
the “solution-diffusion” model”, Hungarian Chemical Journal, Vol. 60, (2005), pp.
239–242 (in Hungarian).
[29] R.D. Noble: Membrane Separation Technology, Principles and Applications, Mem-
brane Science and Technology Series, 2nd ed., Elsevier, New York, 1995.
[30] A. Jonquieres, R. Clement, P. Lochon, J. Neel, M. Dresch and B. Chretien: “Indus-
trial state-of-the-art of pervaporation and vapour permeation in the western coun-
tries”, J. Membrane Sci., Vol 206, (2002), pp. 87–117.
[31] T.F. Edgar, D.M. Himmelblau and L.S. Lasdon: Optimization of Chemical Process,
New York, McGraw-Hill, 2002.
[32] J.M. Douglas: Conceptual Design of Chemical Process, McGraw Hill Chemical En-
gineering Series, New York 1988.
[33] Personal communications, Sulzer Chemtech 2004
[34] E. Marki,. B. Lenti, Gy. Vatai and E. Bekassy-Molnar: “Clean technology for acetone
absorption and recovery”, Sep. Purif. Technol., Vol 22-23, (2001), pp. 377–382.