Embed Size (px)
Citation preview

Research Collection
Conference Paper
Methodology for Shape Optimization of Ultrasonic Amplifierusing Genetic Algorithms and Simplex Method
Author(s): Deibel, Karl-Robert; Wegener, Konrad
Publication Date: 2013
Permanent Link: https://doi.org/10.3929/ethz-a-009903337
Rights / License: In Copyright - Non-Commercial Use Permitted
This page was generated automatically upon download from the ETH Zurich Research Collection. For moreinformation please consult the Terms of use.
ETH Library

Proceedings of NAMRI/SME, Vol. 41. 2013
METHODOLOGY FOR SHAPE OPTIMIZATION OF ULTRASONIC AMPLIFIER USINGGENETIC ALGORITHMS AND SIMPLEX METHOD
Karl-Robert Deibel, Konrad WegenerInstitute of Machine Tools and Manufacturing
Department of Mechanical and Process EngineeringETH Zurich
8092 Zurich, Switzerland
ABSTRACTDesigning devices for ultrasonic vibration applications is mostly done by intuitively adjusting the geometry to obtain the desired mode ofvibration at a specific operating frequency. Recent studies have shown that with optimization methods, new devices with improved per-formance can be easily found. In this investigation, a new methodology for designing an ultrasonic amplifier through shape optimizationusing Genetic Algorithms and Simplex Method with specific fitness functions is presented. Displacements at specific functional areas,main functionality, and mode frequency are considered to determine the properties of an individual shape to meet the stated criteria.Length, diameter, position of mountings, and further specific geometric parameters are set up for the algorithm search for an optimizedshape. Beginning with genetic algorithms, the basic shape fitting the stated requirements is found. After that the simplex method furtherimproves the found shape to most appropriately minimize the fitness function. At the end, the fittest individual is selected as the finalsolution. Finally, resulting shapes are experimentally tested to show the effectiveness of the methodology.
KEYWORDSoptimization, genetic algorithm, simplex, ultrasonic, devices, amplifier
INTRODUCTIONRecent developments in ultrasonic vibration assisted ma-
chining call for new designs of tools, horns, boosters, and othercomponents. While a wider application range of the hybrid tech-nology of ultrasonic vibration assistance for many manufactur-ing technologies is of great interest, one key challenge is thedesign of the system in order to achieve the desired resonancevibration. The most common mode used in ultrasonic-vibration-assisted machining is the longitudinal mode of an axisymmetri-cal horn, which can be easily obtained when solving the WebsterHorn Equation [1].
∂ 2u∂ z2 +
1A(z)
dA(z)dz
∂u∂ z
=1c2
∂ 2u∂ t2 (1)
where t is time, u is displacement, A(z) is the cross sectionalarea as function of position z, and c is the acoustic velocity. The
acoustic velocity c can be obtained with
c =
√EY
ρ(2)
where EY is the material’s Young’s modulus, and ρ the mate-rial density. In case of a harmonic motion, equation (1) can berewritten as
∂ 2u∂ z2 +
1A(z)
dA(z)dz
∂u∂ z
=ω2
c2 u (3)
where ω is the angular frequency. Using equation (3) the lengthof axisymmetric horns can easily be calculated given a specificresonance frequency. The design of tool holders and horns can beobtained by solving the above equations [2–4] for various A(z).

Based on these findings, a great variety of axisymmetric hornshas been found and are used in the industry today. In medi-cal engineering, a novel ultrasonic vibration tool for surgery hasbeen designed and tuned to the appropriate frequency for theoptimal configuration [5]. A percussive drill system was de-signed for rock coring on planetary robotic missions using ul-trasonic vibration assistance to reduce power and torque require-ments [6]. More challenging are new designs for ultrasonic vi-bration assisted machining by combining two modes for opera-tional purposes [7]. The longitudinal-torsional composite modeallows advanced applications for machining like drilling. Tsu-jino et al. designed a one-dimensional longitudinal-torsional vi-bration converter using diagonal slits within the resonating struc-ture [8]. Designing transducers for ultrasonic assisted wire bond-ing with finite element method has been discussed in [9] withthe goal of matching simulation results with experimental re-sults. Enhancing vibration performance and matching simula-tion with experimental results has also been discussed in [10] forultrasonic block horns. Properly designing a rotary ultrasonicmilling tool with finite element method is introduced in [11]. Formany of the mentioned designs of horns and ultrasonic vibrationcomponents, intuitive design strategies were used by evaluatingthe nodal displacements of modes simulated with an FEM soft-ware. A common non-automated design procedure can be foundin [12], which outlines the step-by-step procedure to manuallydesign an ultrasonic device. Automating the intuitive/manual de-sign process can be done by structural optimization.
Many optimization methods have been applied for findingshapes that provide good results for ultrasonic vibration applica-tions. Combining multi-objective decision making such as theNIMBUS method with the finite element method can providevery good designs as shown in [13]. Another very good opti-mization was introduced in [14] to find advanced transducer de-signs while satisfying conflicting optimal values in the designspace. In [15], design of experiments is used to find the cor-rect parameters for an ultrasonic linear motor and perform a sen-sitivity analysis for each parameter and their interactions witheach other. Based on equation (1), a ultrasonic horn optimizationmethod is done in [16]. Porto et al. developed a genetic algo-rithm to optimize the amplitude of a surgical ultrasonic trans-ducer by changing the length of specific geometric parts at agiven frequency [17].
Designing the components for ultrasonic vibration assistedmachining is generally challenging, because the high frequencyvibrations need to precisely occur at the tool edge or a preferredlocation. While the maximum amplitude is desired at the tool,minimal vibration should occur at the clamping or mountingof the ultrasonic vibration device. In this investigation, a newmethodology for a shape optimization [18] of ultrasonic vibra-tion amplifiers and reducers using generic algorithm (GA) andsimplex method [19, 20] is introduced. Since the GA is capa-ble of searching for the optimum of the entire design space for
non convex problems, it serves as a global search method. Thesubsequent simplex method, as a local search method, is usedto further refine the found optimum. The optimized shapes areexperimentally tested by conducting an FFT Analysis and mea-suring displacements using a laser vibrometer.
1 OPTIMIZATION METHODOLOGY AND PARAME-TERIZATION
1.1 MethodologyTo optimize the shape of a structure via shape optimization,
specific parameters need to be altered while the optimization al-gorithm tries to satisfy the defined criteria. Such criteria canbe stress levels, compliance, volume and others that are to bemaximized or minimized. As mentioned earlier, most of the ul-trasonic vibration assisted machining use the longitudinal reso-nance mode to impose oscillations to the tool. For this optimiza-tion, the longitudinal resonance mode in z-direction is describedby the displacements of specific structural parts when excitingthe structure with the operating frequency of ω = 35kHz withan amplitude of x0 = 10µm. This frequency is set by the genera-tor (see section 2) used later in the experiments. The GA uses afitness function that is to be minimized in order to find the opti-mal solution to the defined problem. For designing the structure,the finite element method (FEM) results of a modal analysis [21]and harmonic response analysis [22] are evaluated based on thedisplacements of the mesh nodes at the specific structure partslike cutting edge and mountings. The nodal displacement for de-scribing the modal shape is used, because vibration modes areusually graphically evaluated (e.g. [12]) through the nodal dis-placements. Therefore, the global fitness function is made upfrom the following set of dimensionless functions. At the func-tional area or tool edge, the sum of displacements in z-directionis to be maximized while the sum of displacements in y-directionand the sum of displacements in x-direction are to be minimized,as stated by
f1 =
n
∑i=0|uxi|+
n
∑i=0
∣∣uyi∣∣
n
∑i=0|uzi|
!= min (4)
where ux is the nodal displacement in x-direction, uy is the nodaldisplacement in y-direction, and uz is the nodal displacement inz-direction as shown in Figure 1. With this function, bending ortorsional modes will have a higher fitness value than the longi-tudinal mode. To ensure an even displacement across all meshnodes at the functional area, the sum of difference between thedisplacement of a single node and the average displacement in

z-direction needs to be minimized, which is stated by
f2 =
n
∑i=0
(|uzi|− |uz|)
|uz|!= min (5)
with
uz =1n
n
∑i=0
uzi (6)
being the average displacement in z-direction. Considering theoverall longitudinal mode and the placement of the mountingsneeded for fixing the device, it is necessary to position the mount-ings at the vibration nodes of the device, because minimal vibra-tion should occur at the mountings. This is done with
f3 =|xm1− xn1||xn1|
+|xm2− xn2||xn2|
!= min (7)
where xm1, xm2 are the positions of the mountings 1 and 2, andxn1, xn2 are the locations of the vibration nodes 1 and 2. The val-ues for the location of the vibration nodes are selected by findingtwo minima of the displacement values in z-direction along theaxis of rotation. Since the input amplitude is 10µm and a boosteror amplifier aims to increase the amplitude while an amplitudereducer aims to decrease the amplitude of an ultrasonic vibrationsystem, the fitness function
f4 =
∣∣∣∣AR−|uzo||uze|
∣∣∣∣ != min (8)
is formulated with AR being the amplitude ratio between inputand output, uzo is the average amplitude in z-direction at the out-put, and uze is the average amplitude in z-direction at the input.While a harmonic response analysis is used to obtain the resultsfor the so far described fitness functions, a modal analysis is ad-ditionally performed to obtain the resonance frequency. Ideally,the ultrasonic device resonant frequency or mode should be equalto the operating frequency of the transducer (Section 2). Thiscondition is stated by
f5 =|ωs−ωt |
ωt
!= min (9)
where ωs is the frequency of the vibration mode and ωt is thetargeted frequency, which is 35kHz for this ultrasonic device.
Parameter Value Range Unit
Z13 [20 ; 100] [mm]
Z15 [20 ; 200] [mm]
RR [0 ; 40] [mm]
Zz1 [0 ; Z13] [mm]
Zz2 [(Z13+RR ) ; Z15] [mm]
R1 [5 ; 16] [mm]
R2 [5 ; 16] [mm]
Table 1: Parameters defining the shape of the geometry and theirvalue range. Mounting width and relative height are 3mm.
Here, equations eqs. (5), (7) and (9) are normalized to removeany dimensions.
The global fitness function for the GA optimization resultsin
f =6
∑i=1
Ri fi!= min (10)
where R is a penalty factor which can be specified for each in-dividual fitness functions. For the following optimization, thepenalty factors are set to R1 = 10, R2 = 10, R3 = 10, R4 = 100,and R5 = 10. These factors are chosen based on relevance ofeach function. For the present optimization, ensuring the cor-rect amplification ( f4) is most important, whereas f1, f2, f3 andf5 are valid for many different amplification factors. It shouldbe pointed out that using the same penalty factor for all func-tions also leads to valid results. But regarding this optimizing,the minimization of the global fitness function was found to takelonger if the functions are not weighted.
1.2 ParameterizationThe presented optimization methodology divides the struc-
ture into fixed and variable parts that make up the entity of thecomponent. While the fixed geometric specifications may not bealtered, the variable components are parameterized according tothe design space available for the optimization. Figure 1 showsthe ultrasonic vibration component to be optimized to meet theoptimization criteria. Shown are the variable geometric parame-ters that are altered during the optimization process.
From Table 1 and Figure 1, it can be seen that Z15 mustalways be greater than Z13 +RR. Therefore, an inequality con-

Z15
Zz2
Z13
Zz1
RRfront
back (connected to transducer)
M8 regular thread
R2
R1
M8 fine thread
mounting 1
mounting 2
Z
X
Y
uz
ux
uy
Figure 1: Cross sectional view of the geometry for optimization and the corresponding parameters. At the shown configuration, thegeometry amplifies the amplitude applied to the back on the right end of the drawing. The displacements ux, uy, and uz for a mesh nodeat the front are shown.
straint needs to be defined as
Z13−Z15 +RR ≤ 0 (11)
which the GA needs to satisfy for all solutions. Depending onhow volumes are created in the FEM software, a different valuecan be used here instead of 0 to help with the proper geometrybuilding. Another inequality constraint is
R2−R1−RR ≤ 0 (12)
to avoid invalid statements in the geometry. However, this canbe replaced by simply substituting the connecting radius with astraight line for solutions with RR being smaller than R2−R1.While the above listed constraints should not allow invalid orunrealistic geometric shapes, any results that cause an error orinvalid FEM calculation will be punished with a fitness value ofinfinity.
1.3 Genetic Algorithm Settings and Simplex MethodFigure 2 shows the essential optimization methodology. Pro-
grams used are MATLAB for the GA and ANSYS for the FEM.The GA is initialized to perform the optimization with the fol-lowing settings:
• Initial Population is picked randomly within the value range(Table 1) of each parameter.
• Maximum Generation Size is 30.
• Population Size is 500 to allow great variety among children.• Four Elite Children will be copied from one generation to
the next generation. With this, the four best solutions willbe kept from one generation to the other.
• Parents are chosen using stochastic universal sampling, withmore fit parents having a better chance of being picked.
• 40% of the children are obtained through mutation and theremaining 60% from crossover (reproduction).
• Mutation is done using uniform mutations at multiple pointsat the genotype. Mutated genes are uniformly distributedover the range defined in Table 1. If a mutant does not meetthe inequality constraints, it is discarded and the mutation isrepeated.
• The crossover fraction is 0.3 and reproduced children arecreated as the weighted arithmetic mean of two parents.
• Terminating Conditions: If the cumulative change in the fit-ness value does not change at least 1.0 ·10−6, or the maxi-mum of generations is reached, or no change in the fitnessvalue (stall) is observed for 10 successive generations.
Regarding the settings of the genetic algorithm, it becomesclear that it is used with high a mutation rate to allow largerstochastic search. This is necessary, because the fitness func-tion might have many local minima with both radii, R1 and R2,being within the same parameter range. Since the GA is usedwith high mutation, the optimization can take a longer time tofind an optimum, because more individuals are used for explor-ing new solutions and not exploiting a known good solution. Ofcourse, the no free lunch theorem [23] still applies for the GA.Other optimization algorithms can also be capable of solving the

Create InitialPopulation
GA Operations:SelectionMating
CrossoverMutationCreation
No
Yes
FEM Analysis
Fitness Evaluation
Satisfied?
Create BestIndividual
Create InitialSimplex
New Population
FEM Analysis
Fitness Evaluation
Satisfied?
Adjust Simplex:Create New
Copy or MirrorShrink or Expand
Final Solution
No
Yes
→ new Vertex
Figure 2: Optimization Methodology including GA and simplexsearch with described settings. FEM includes the modal andharmonic analysis. The Simplex Method picks up the best cre-ated individual of the GA and further optimizes the parametersto meet the stated criteria.
optimization problem (e.g. simulated annealing), but GA wasfound to be superior and faster for this specific application. Thesimplex method is used as a direct search method to faster op-timize and refine the best individual found by the GA. This isrealized by taking the optimal values found by the GA and applythe same basic methodology shown in Figure 2 and global fitnessfunction (10) (GA operations replaced by simplex operations),except that the stopping conditions are only based on a maxi-mum number of iterations and a relative fitness value change of1.0 ·10−4. To better reach the found minimum, the initial sim-plex is build with points of 5% increments found by the GAoptimization, which serves as the initial vertex. Increments areslightly increased or decreased for each iteration.
2 EXPERIMENTAL PROCEDURE AND MATERIALSTo test the vibration amplitude and frequency of the manu-
factured results from the optimization, a laser vibrometer is uti-
x
z
z y y
x
front mounting 1ultrasonic
device
piezoeletrictransducer
Figure 3: Measurement setup for laser vibrometer tests. Redarrows indicate the laser measurement positions.
lized. Vibrations are measured at the front and mounting 1 inx-,y-, and z-direction. The measurement setup is shown in Fig-ure 3. For the measurements, mounting 2 is clamped in the holderand mounting 1 is kept free. The input amplitude is measured atthe transducer output and is kept constant throughout the entireexperiments. Operating power for the transducer is provided by agenerator with a maximum output of 900W. The generator reg-ulates the power output based on the selected amplitude settingand is designed for 35kHz with ±500Hz range. To check thefrequency of the longitudinal mode of each result, a FFT analy-sis with 10V random chirp input is done. The material used formanufacturing the ultrasonic devices is 51CrV4 with a Young’smodulus of EY = 210GPa, density ρ = 7850kgm−3, Poisson ra-tio of 0.3, and damping ratio of 1%. Material properties used inthe FEM analysis are set accordingly.
3 RESULTS AND DISCUSSIONTo test the optimization methodology, amplifiers with am-
plification factors of 2 and 1, and amplitude reducers with ampli-fication factors of 0.5 are designed. The so far described prob-lem and optimization procedure have multiple results that satisfythe optimization criteria. For simplification, the solutions withlargest R2 for the amplifier design and smallest R2 for the reducerdesign are used for the experimental testing. Table 2 shows thevalues of the optimized shapes satisfying the stated criteria andminimizing the fitness function. The values of the fitness func-tion after the GA and simplex method are also listed. It becomesvery clear, that the simplex method is essential to finding an ap-propriate geometric shape to better minimize the stated fitnessfunction and meet the stated criteria. Figure 4 shows the opti-mized shapes of the devices with amplification factors of 0.5, 1and 2, with the mountings located at the vibration nodes of thelongitudinal vibration.

Device AR Z13 Z15 RR Zz1 Zz2 R1 R2 Input Output fGA fS
[mm] [µm]
Amplifier2 83.11 156.66 40.74 32.12 118.54 8.88 15 10 17.3 10.03 7.0
1 62.41 146.69 39.55 33.75 105.75 14.8 15 10 9.7 15.5 2.99
Reducer 0.5 95.81 145.81 16.86 32.87 104.95 12.69 10.79 10 7.1 51 21.6
Table 2: Solutions found using the presented optimization methodology. Presented parameter values define the geometric shapes of thesolutions for the tested amplification factors. Output is the average displacement at the front resulting from the FEM analysis of the finalshape.
AR front mounting 1 AMR ωo
ux uy uz ux uy uz
2 0.02 0.02 2.39 0.22 0.25 0.14 1.9 35.3
1 0.02 0.02 1.25 0.23 0.24 0.06 1.0 35.1
0.5 0.02 0.02 0.72 0.19 0.19 0.1 0.6 35.2
Table 3: Measured amplitudes at front and mounting 1 in [µm].AR indicates the simulated amplification factor and AMR states themeasured amplification factor, which is calculated by dividingthe measured amplitude in z-direction at the front by the inputamplitude. ωo is the effective operating frequency [kHz] for thisdevice.
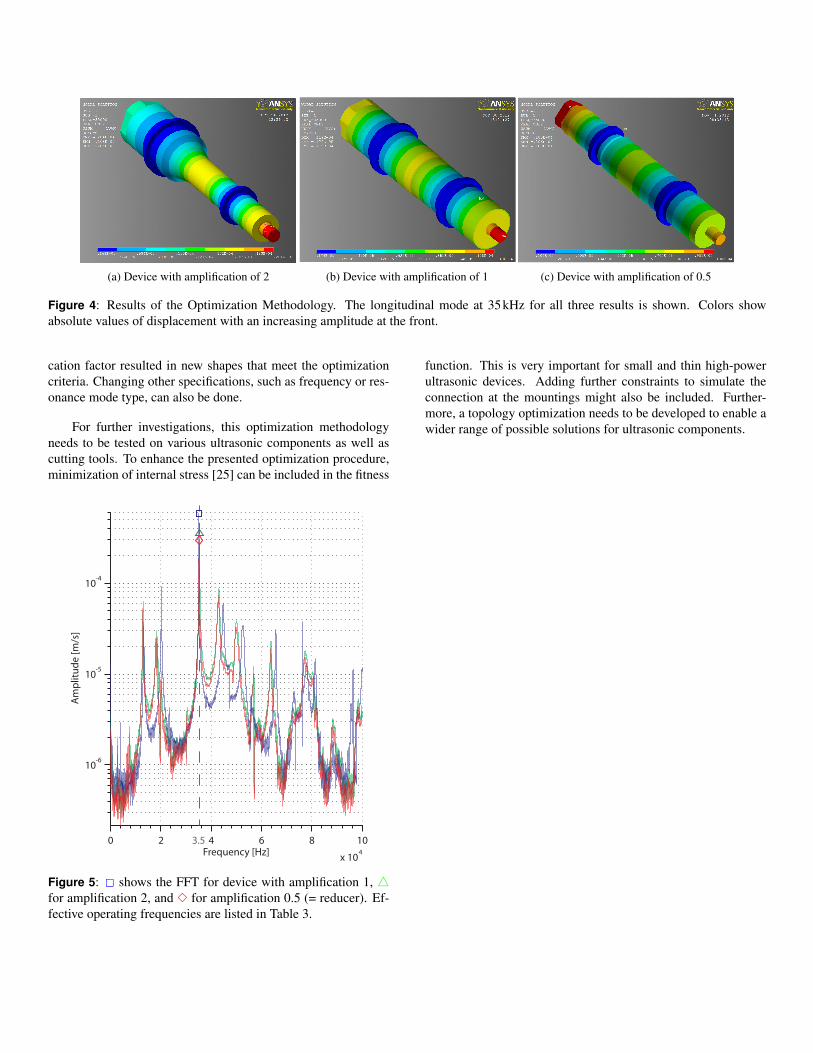
Figure 5 shows the FFT analysis for all three devices. Theoperating mode at 35kHz can clearly be seen. Table 3 con-tains the measured amplitudes at the front and mounting 1 forall tested device shapes. The input amplitude for these experi-ments is 1.2µm at approximately 35kHz. It can be seen that theactual amplification ratios are very near the previously stated am-plification factors of the optimization. The actual output ampli-tudes change accordingly for each device. Vibrations measuredat mounting 1 are very low indicating that it is correctly placedat the vibration node of the longitudinal mode of the device.
Regarding the solution of amplification of AR = 1, the valueof Z15 nearly matches the length of a cylindrical horn determinedby solving equation (1). In case of a cylindrical horn, equa-tion (1) can be solved to
l =nπ
ωc (13)
with l being the total length of the cylindrical horn, n is the nth
half wavelength or here the n number of vibration nodes, ω isthe angular excitation frequency, and c is the acoustic veloc-ity [24]. Solving equation (13) with the appropriate values, thetotal length equals l = 147.8mm. It shows that the optimiza-tion procedure works for simple geometries as well. When con-sidering function f5, a very small change of 0.2mm in lengthwould result in a change of 100Hz, assuming a cylindrical hornand equation (13). Here, the simplex method is very suitable forfinding the most appropriate values.
Discrepancies between simulation results and experimen-tal results are most likely caused by inexact material properties,and numerical errors of the FEM. A change in material proper-ties (see Section 2) affects the frequency of the vibration modeand thereby the results for the shape optimization. For exam-ple, if the Young’s modulus is set as EY = 200GPa instead ofEY = 210GPa, the frequency goes up about 850Hz. It is there-fore important to set the material parameters in the FEM as goodas possible to the physical properties of the material used. Re-garding the measured operating frequency in Table 3, the usedmaterial and geometric parameters allow a very precise FEMcalculation of the solution. The element size of the mesh hasan impact on the optimization as well, since with different meshdensity, the results can differ.
4 CONCLUSIONIn conclusion, it has been shown that the presented optimiza-
tion methodology for ultrasonic devices is capable of deliveringusable results that are in accordance with the specifications ofthe application. The presented fitness functions allow the op-timizer to appropriately find geometric shapes of ultrasonic de-vices. They consist of the displacements at essential areas ofthe ultrasonic device and position of functional parts of the de-vice. For finding the optimal design, a GA and simplex methodis used. A longitudinal mode with the appropriate amplificationat the functional area and two fix points with minimal vibrationwas tested for the amplitude modifiers. Changing the amplifi-
(a) Device with amplification of 2 (b) Device with amplification of 1 (c) Device with amplification of 0.5
Figure 4: Results of the Optimization Methodology. The longitudinal mode at 35kHz for all three results is shown. Colors showabsolute values of displacement with an increasing amplitude at the front.
cation factor resulted in new shapes that meet the optimizationcriteria. Changing other specifications, such as frequency or res-onance mode type, can also be done.
For further investigations, this optimization methodologyneeds to be tested on various ultrasonic components as well ascutting tools. To enhance the presented optimization procedure,minimization of internal stress [25] can be included in the fitness
function. This is very important for small and thin high-powerultrasonic devices. Adding further constraints to simulate theconnection at the mountings might also be included. Further-more, a topology optimization needs to be developed to enable awider range of possible solutions for ultrasonic components.
0 2 4 6 8 10
x 104
10-6
10-5
10-4
Frequency [Hz]
Am
plitu
de [m
/s]
3.5
Figure 5: 2 shows the FFT for device with amplification 1, 4for amplification 2, and 3 for amplification 0.5 (= reducer). Ef-fective operating frequencies are listed in Table 3.
5 ACKNOWLEDGEMENTSSpecial thanks go to Gerald Kress of the Institute of Me-
chanical Systems for the practical introduction to structural opti-mization, and the Institute for mechanical Systems for providingthe laser vibrometer.
REFERENCES[1] Eisner, E., 1967. “Complete Solutions of the ”Webster”
Horn Equation”. Acoustical Society of America Journal,41, p. 1126.
[2] Seah, K., Wong, Y., and Lee, L., 1993. “Design of toolholders for ultrasonic machining using fem”. Journal ofMaterials Processing Technology, 37(1-4), pp. 801 – 816.
[3] Amin, S., Ahmed, M., and Youssef, H., 1995. “Computer-aided design of acoustic horns for ultrasonic machining us-ing finite-element analysis”. Journal of Materials Process-ing Technology, 55(3-4), pp. 254 – 260.
[4] Sherrit, S., Askins, S. A., Gradziol, M., Dolgin, B. P., Bao,X., Chang, Z., and Bar-Cohen, Y., 2002. “Novel horndesigns for ultrasonic/sonic cleaning, welding, soldering,cutting, and drilling”. L. P. Davis, ed., Vol. 4701, SPIE,pp. 353–360.
[5] Qiu, Y., Huang, Z., Slade, A., and Thomson, G., 2009. “Op-timization of ultrasonic tool performance in surgery”. In4th European Conference of the International Federationfor Medical and Biological Engineering, Vol. 22 of IFMBEProceedings. Springer Berlin Heidelberg, pp. 899–902.
[6] Badescu, M., Stroescu, S., Sherrit, S., Aldrich, J., Bao, X.,Bar-Cohen, Y., Chang, Z., Hernandez, W., and Ibrahim, A.,2008. “Rotary hammer ultrasonic/sonic drill system”. InRobotics and Automation, 2008. ICRA 2008. IEEE Inter-national Conference on, pp. 602 –607.
[7] Shuyu, and Lin, 1996. “Study on the longitudinal-torsionalcomposite mode exponential ultrasonic horns”. Ultrason-ics, 34(7), pp. 757 – 762.
[8] Tsujino, J., 1998. “Ultrasonic motor using a one-dimensional longitudinal-torsional vibration converter withdiagonal slits”. Smart Materials and Structures, 7(3),p. 345.
[9] Parrini, L., 2003. “New techniques for the design of ad-vanced ultrasonic transducers for wire bonding”. Elec-tronics Packaging Manufacturing, IEEE Transactions on,26(1), jan., pp. 37 – 45.
[10] Cardoni, A., and Lucas, M., 2002. “Enhanced vibrationperformance of ultrasonic block horns”. Ultrasonics, 40(1-8), pp. 365–369.
[11] Kei-Lin, and Kuo, 2008. “Design of rotary ultrasonicmilling tool using fem simulation”. Journal of MaterialsProcessing Technology, 201, pp. 48 – 52.
[12] McCulloch, E., 2008. “Experimental and finite element
modelling of ultrasonic cutting of food”. PhD thesis, Uni-versity of Glasgow.
[13] Heikkola, E., Miettinen, K., and Nieminen, P., 2006. “Mul-tiobjective optimization of an ultrasonic transducer usingnimbus”. Ultrasonics, 44(4), pp. 368 – 380.
[14] Fu, B., Hemsel, T., and Wallaschek, J., 2006. “Piezoelectrictransducer design via multiobjective optimization”. Ultra-sonics, 44, Supplement(0), pp. e747 – e752.
[15] Fernandez, J. M., and Perriard, Y., 2006. “SensitivityAnalysis and Optimization of a Standing Wave UltrasonicLinear Motor”. IEEE Transaction on Ultrasonics, Ferro-electrics amd Frequency Control, 53(7), pp. 1352–1361.
[16] Rosca, I. C., Chiriacescu, S. T., and Cretu, N. C., 2010.“Ultrasonic horns optimization”. Physics Procedia, 3(1),pp. 1033 – 1040.
[17] Porto, D., Bourquard, A., and Perriard, Y., 2008. “Ge-netic algorithm optimization for a surgical ultrasonic trans-ducer”. In Ultrasonics Symposium, 2008. IUS 2008. IEEE,pp. 1457 –1460.
[18] Haslinger, J., and Makinen, R. A. E., 2003. Introductionto Shape Optimization: Theory, Approximation, and Com-putation. Society for Industrial and Applied Matematics,Philadelphia.
[19] Venkataraman, P., 2002. Applied Optimization with MAT-LAB Programming. John Wiley & Sons, Inc., New York.
[20] Kress, G., and Keller, D., 2007. Structural optimization.Lecture Notes, June.
[21] He, J., and Fu, Z.-F., 2001. Modal Analysis. Butterworth-Heinemann, Oxford.
[22] Petyt, M., 2010. Introduction to Finite Element VibrationAnalysis, 2nd ed. Cambridge University Press, New York.
[23] Wolpert, D., and Macready, W., 1997. “No free lunch the-orems for optimization”. Evolutionary Computation, IEEETransactions on, 1(1), apr, pp. 67 –82.
[24] Thomson, W. T., and Dahleh, M. D., 1998. Theory of Vibra-tion with Applications, 5th ed. Prentice Hall, New Jersey.
[25] Cardoni, A., and Lucas, M., 2005. “Strategies for reducingstress in ultrasonic cutting systems”. Strain, 41(1), pp. 11–18.