Embed Size (px)
Citation preview
Ridgefield Public Schools
BOARD OF EDUCATION
FY 2016-17
OPERATING BUDGET
Approved May 10, 2016
RIDGEFIELD PUBLIC SCHOOLS
2
TABLE OF CONTENTS
FACTORS INFLUENCING BUDGET
BOARD OF EDUCATION FY 2016-17 OPERATING BUDGET
DESCRIPTION OF EXPENDITURE CATEGORIES OF THE BUDGET
Certified Salaries
Leadership Organization
Employee Benefits/General Services
Technology
Curriculum & Instruction
Professional Learning
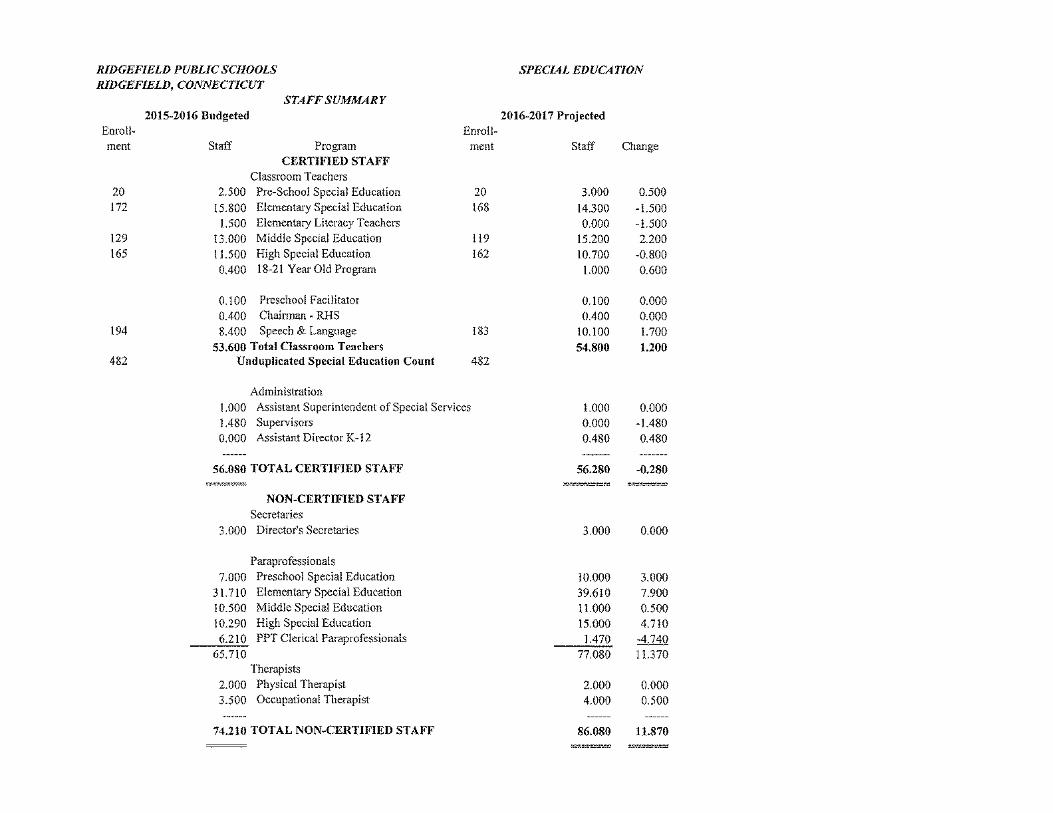
Special Education
Plant Operations and Capital Improvements
APPENDIX
RPS Budget
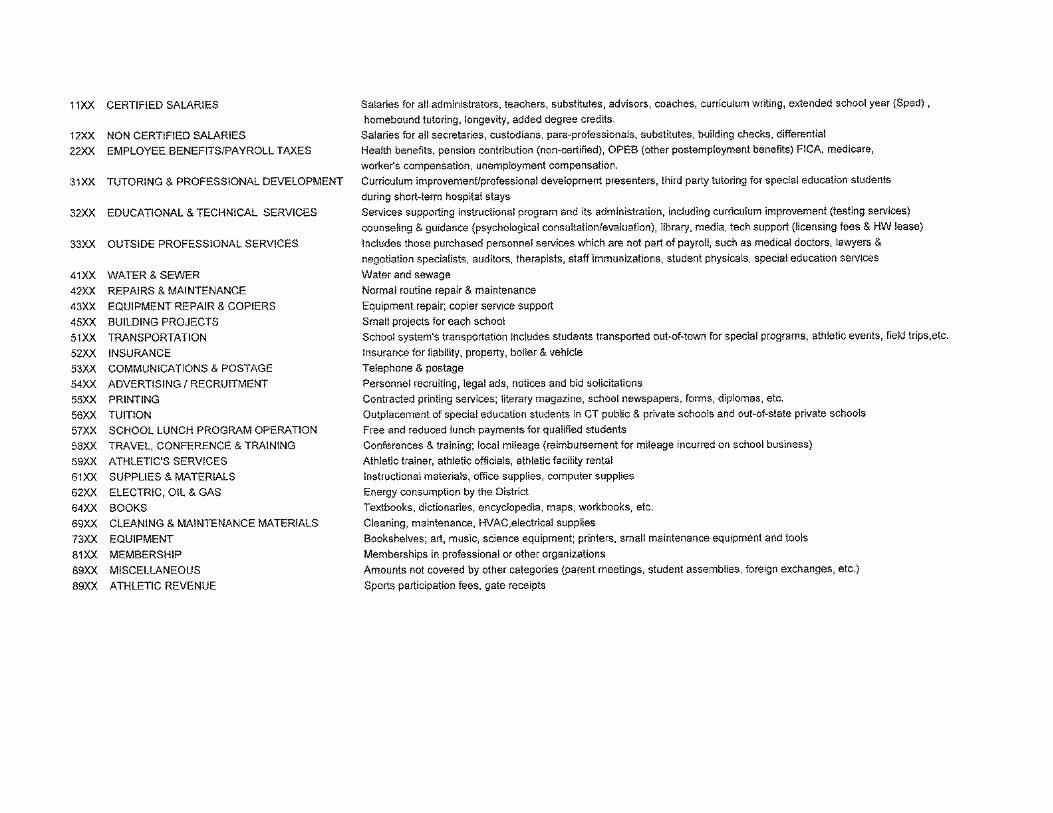
Description: How to Read Account Codes
Account Code Descriptions
RIDGEFIELD PUBLIC SCHOOLS
3
ACKNOWLEDGEMENTS
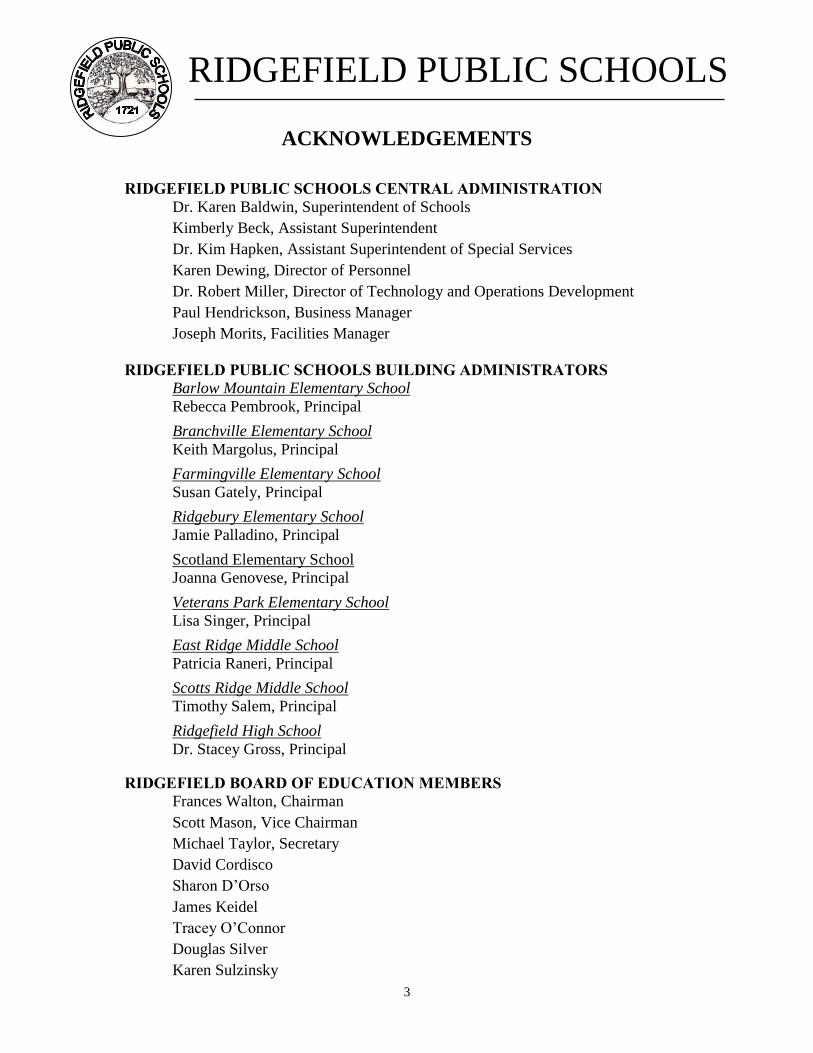
RIDGEFIELD PUBLIC SCHOOLS CENTRAL ADMINISTRATION
Dr. Karen Baldwin, Superintendent of Schools Kimberly Beck, Assistant Superintendent Dr. Kim Hapken, Assistant Superintendent of Special Services Karen Dewing, Director of Personnel Dr. Robert Miller, Director of Technology and Operations Development Paul Hendrickson, Business Manager Joseph Morits, Facilities Manager
RIDGEFIELD PUBLIC SCHOOLS BUILDING ADMINISTRATORS
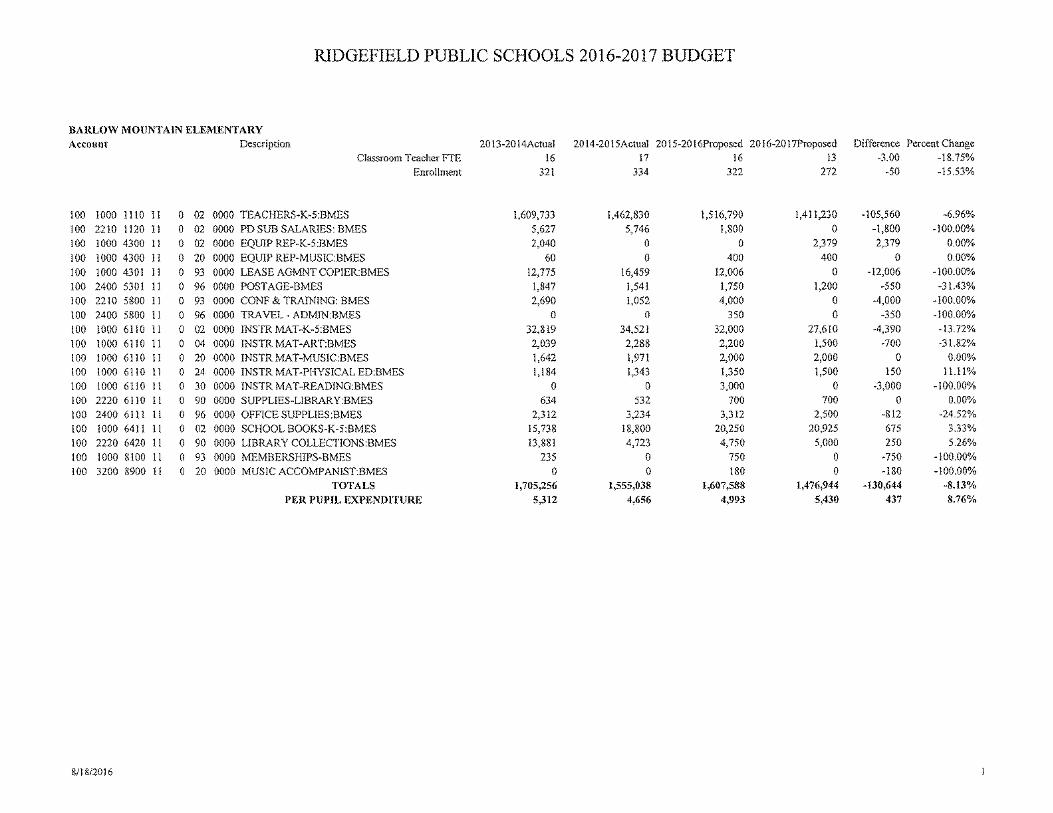
Barlow Mountain Elementary School Rebecca Pembrook, Principal
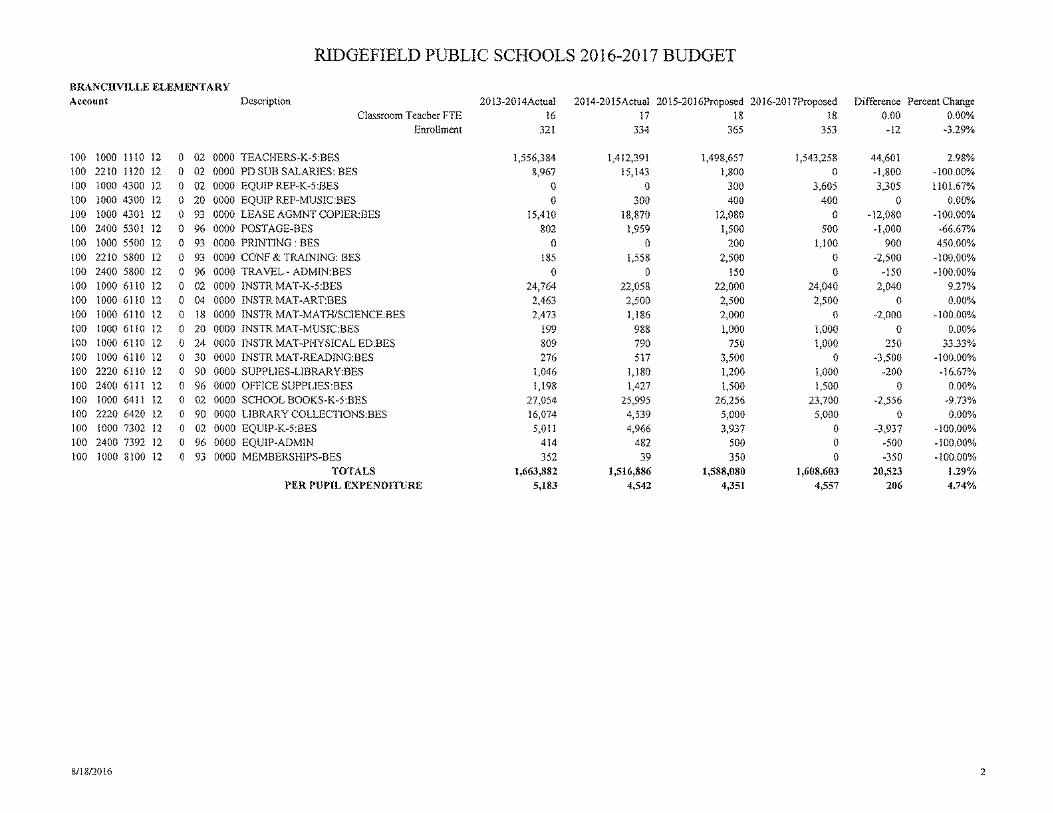
Branchville Elementary School Keith Margolus, Principal
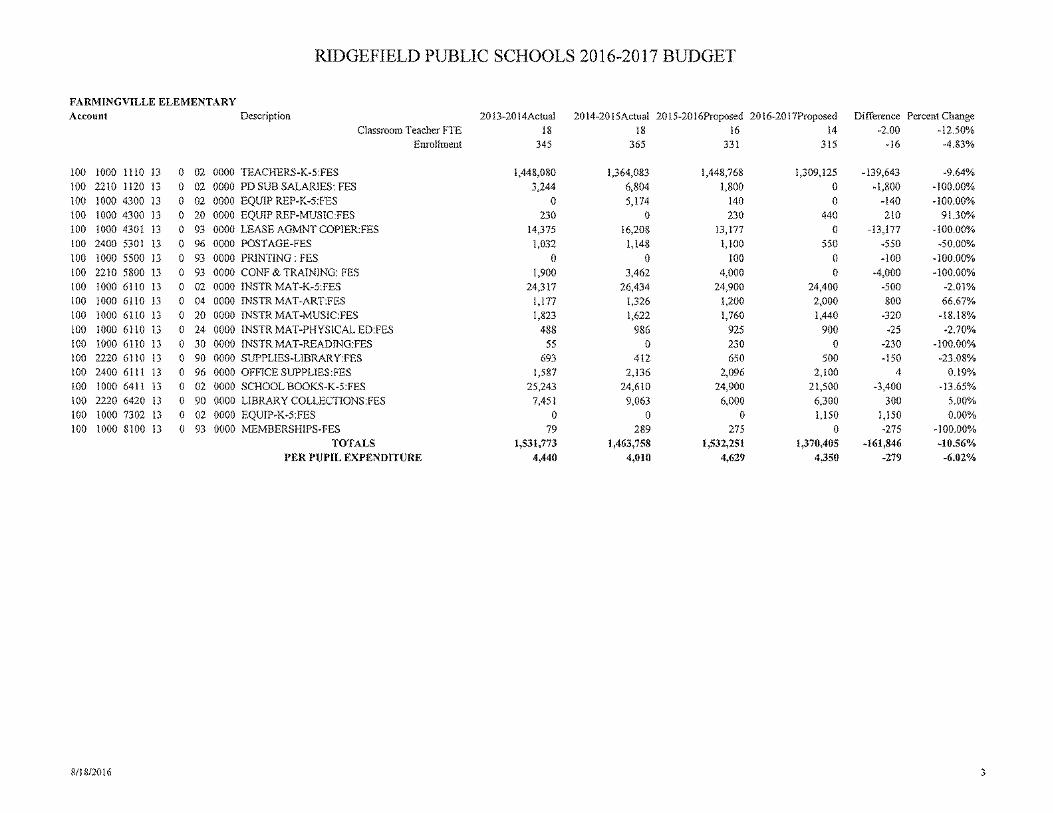
Farmingville Elementary School Susan Gately, Principal
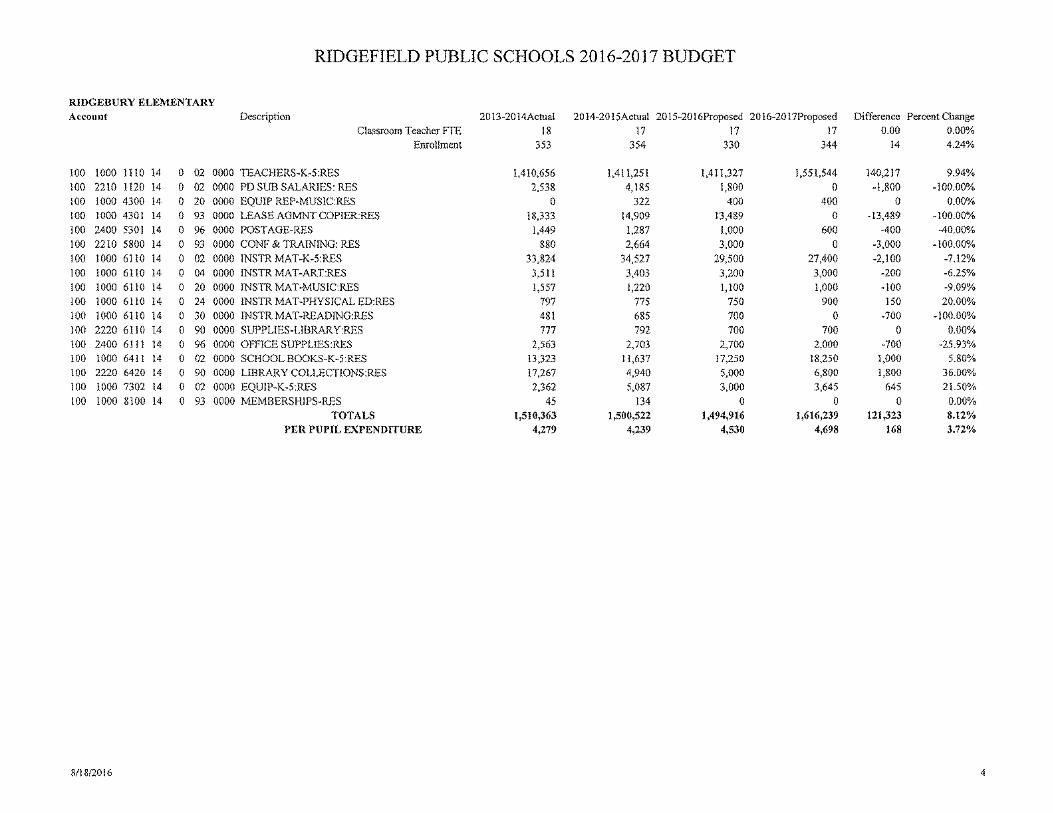
Ridgebury Elementary School Jamie Palladino, Principal
Scotland Elementary School Joanna Genovese, Principal
Veterans Park Elementary School Lisa Singer, Principal
East Ridge Middle School Patricia Raneri, Principal
Scotts Ridge Middle School Timothy Salem, Principal
Ridgefield High School Dr. Stacey Gross, Principal
RIDGEFIELD BOARD OF EDUCATION MEMBERS
Frances Walton, Chairman Scott Mason, Vice Chairman Michael Taylor, Secretary David Cordisco Sharon D’Orso James Keidel Tracey O’Connor Douglas Silver Karen Sulzinsky
RIDGEFIELD PUBLIC SCHOOLS
4
FACTORS INFLUENCING BUDGET REQUEST
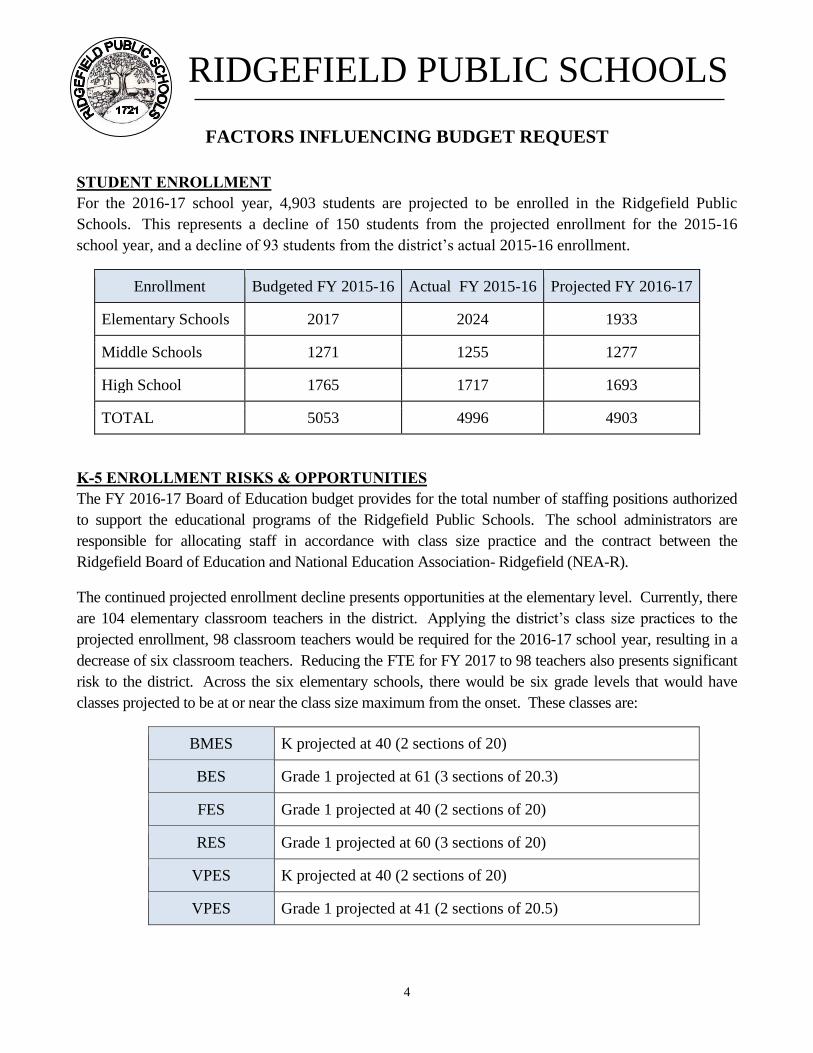
STUDENT ENROLLMENT
For the 2016-17 school year, 4,903 students are projected to be enrolled in the Ridgefield Public Schools. This represents a decline of 150 students from the projected enrollment for the 2015-16 school year, and a decline of 93 students from the district’s actual 2015-16 enrollment.
Enrollment Budgeted FY 2015-16 Actual FY 2015-16 Projected FY 2016-17
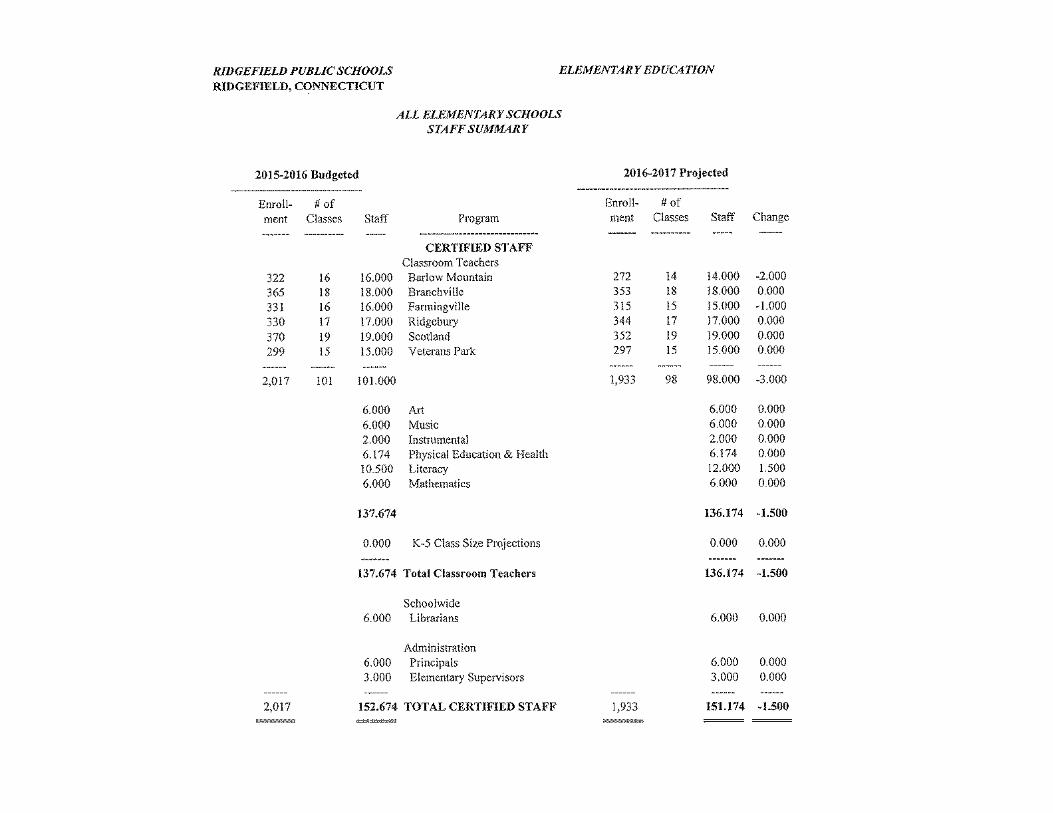
Elementary Schools 2017 2024 1933
Middle Schools 1271 1255 1277
High School 1765 1717 1693
TOTAL 5053 4996 4903
K-5 ENROLLMENT RISKS & OPPORTUNITIES
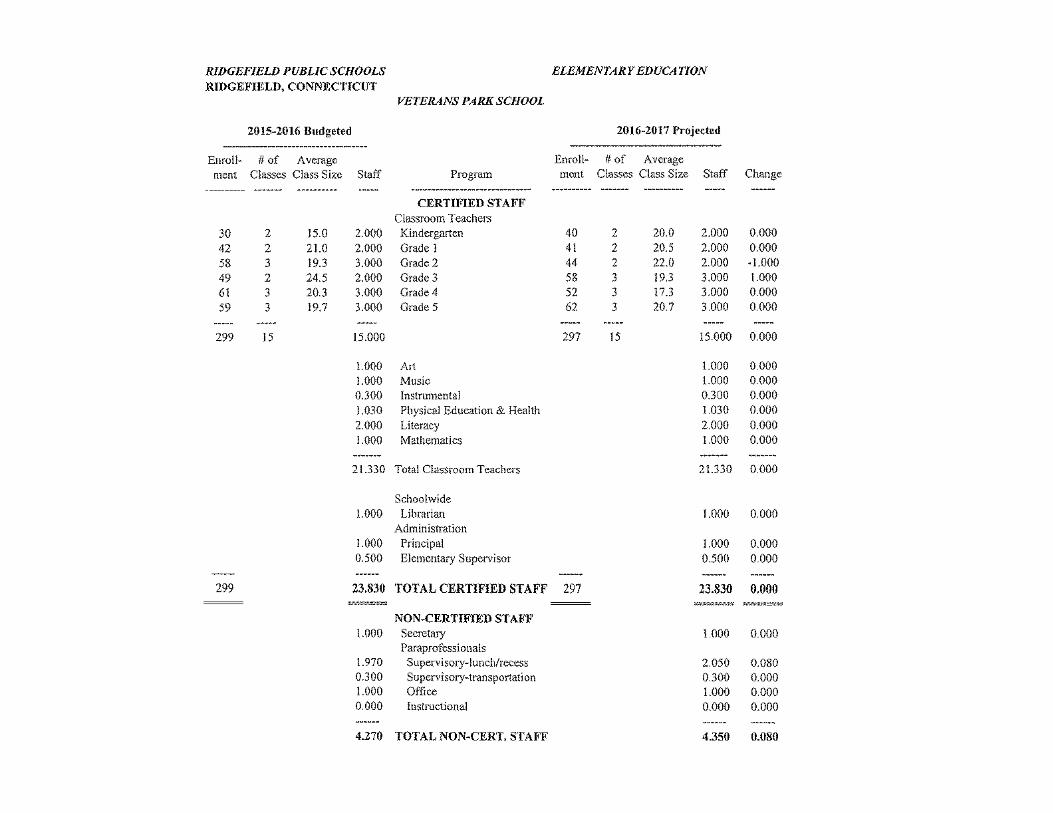
The FY 2016-17 Board of Education budget provides for the total number of staffing positions authorized to support the educational programs of the Ridgefield Public Schools. The school administrators are responsible for allocating staff in accordance with class size practice and the contract between the Ridgefield Board of Education and National Education Association- Ridgefield (NEA-R).
The continued projected enrollment decline presents opportunities at the elementary level. Currently, there are 104 elementary classroom teachers in the district. Applying the district’s class size practices to the
projected enrollment, 98 classroom teachers would be required for the 2016-17 school year, resulting in a decrease of six classroom teachers. Reducing the FTE for FY 2017 to 98 teachers also presents significant risk to the district. Across the six elementary schools, there would be six grade levels that would have classes projected to be at or near the class size maximum from the onset. These classes are:
BMES K projected at 40 (2 sections of 20)
BES Grade 1 projected at 61 (3 sections of 20.3)
FES Grade 1 projected at 40 (2 sections of 20)
RES Grade 1 projected at 60 (3 sections of 20)
VPES K projected at 40 (2 sections of 20)
VPES Grade 1 projected at 41 (2 sections of 20.5)
RIDGEFIELD PUBLIC SCHOOLS
5
FACTORS INFLUENCING BUDGET
The district experienced this risk in the 2015-16 school year when it had to create three additional classrooms for which it had not budgeted for the teachers.
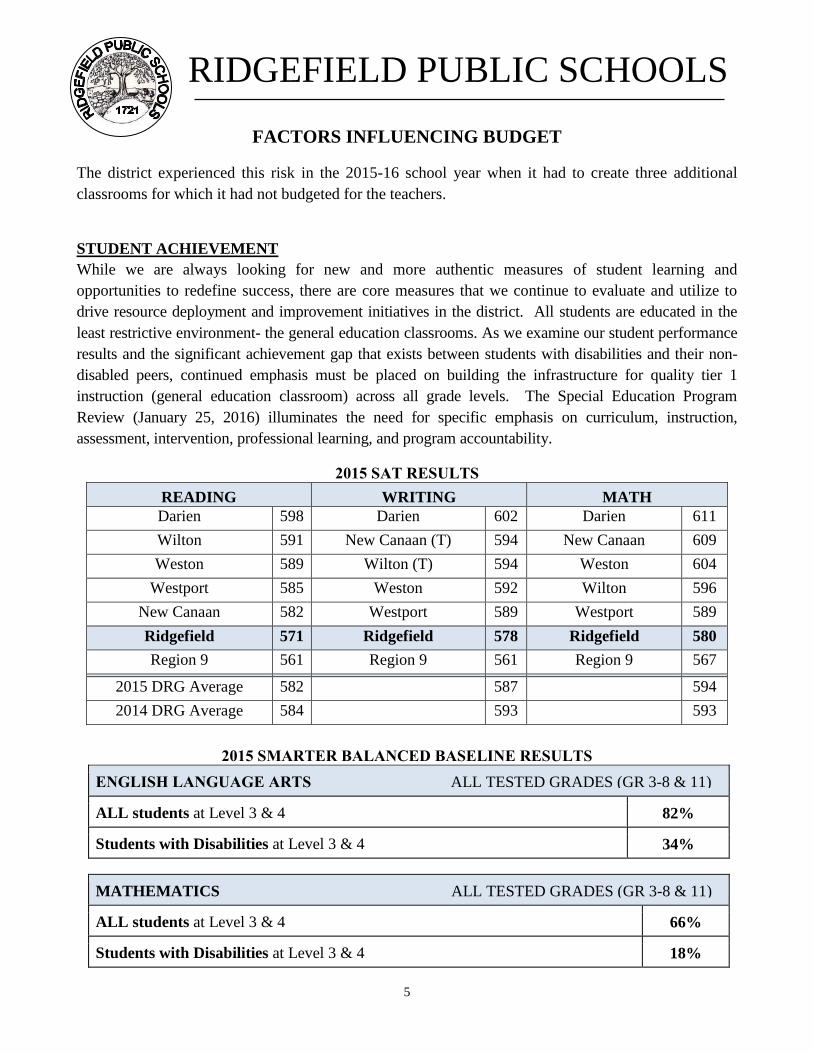
STUDENT ACHIEVEMENT While we are always looking for new and more authentic measures of student learning and opportunities to redefine success, there are core measures that we continue to evaluate and utilize to drive resource deployment and improvement initiatives in the district. All students are educated in the least restrictive environment- the general education classrooms. As we examine our student performance results and the significant achievement gap that exists between students with disabilities and their non-disabled peers, continued emphasis must be placed on building the infrastructure for quality tier 1 instruction (general education classroom) across all grade levels. The Special Education Program Review (January 25, 2016) illuminates the need for specific emphasis on curriculum, instruction, assessment, intervention, professional learning, and program accountability.
2015 SAT RESULTS
READING WRITING MATH Darien 598 Darien 602 Darien 611
Wilton 591 New Canaan (T) 594 New Canaan 609
Weston 589 Wilton (T) 594 Weston 604
Westport 585 Weston 592 Wilton 596
New Canaan 582 Westport 589 Westport 589
Ridgefield 571 Ridgefield 578 Ridgefield 580
Region 9 561 Region 9 561 Region 9 567
2015 DRG Average 582
587
594
2014 DRG Average 584
593
593
2015 SMARTER BALANCED BASELINE RESULTS
ENGLISH LANGUAGE ARTS ALL TESTED GRADES (GR 3-8 & 11) ALL students at Level 3 & 4 82%
Students with Disabilities at Level 3 & 4 34%
MATHEMATICS ALL TESTED GRADES (GR 3-8 & 11)
ALL students at Level 3 & 4 66%
Students with Disabilities at Level 3 & 4 18%
RIDGEFIELD PUBLIC SCHOOLS
6
FACTORS INFLUENCING BUDGET
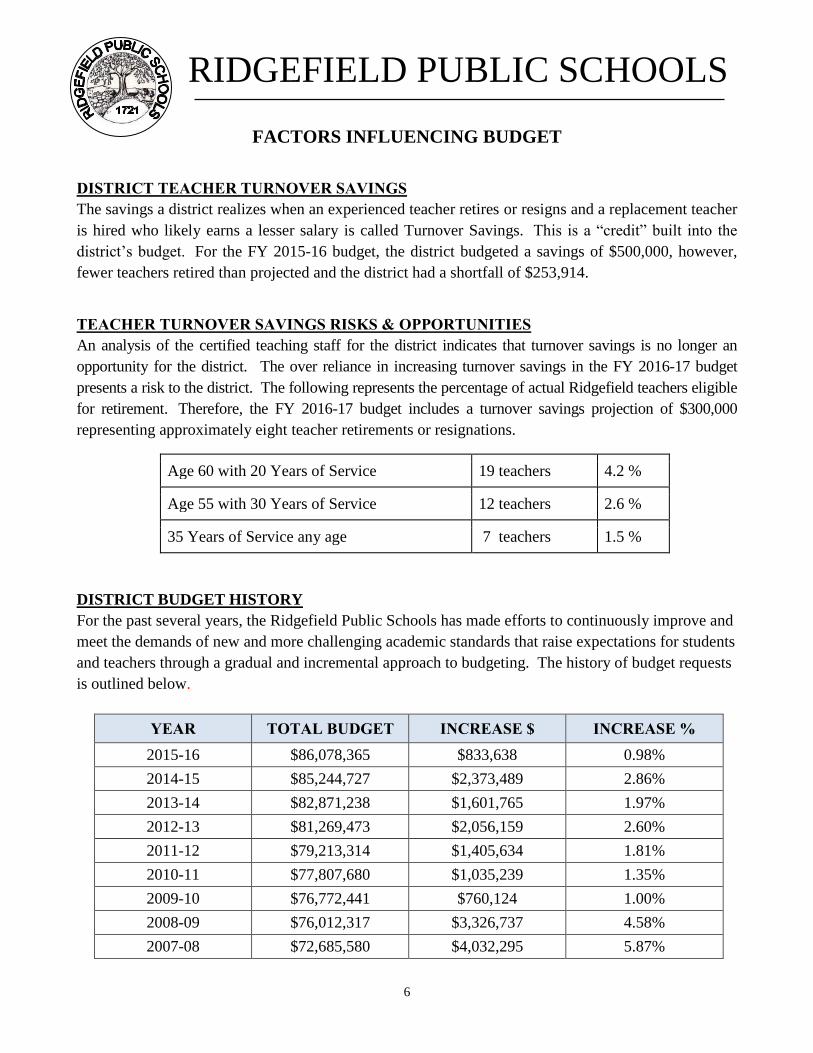
DISTRICT TEACHER TURNOVER SAVINGS
The savings a district realizes when an experienced teacher retires or resigns and a replacement teacher is hired who likely earns a lesser salary is called Turnover Savings. This is a “credit” built into the
district’s budget. For the FY 2015-16 budget, the district budgeted a savings of $500,000, however, fewer teachers retired than projected and the district had a shortfall of $253,914. TEACHER TURNOVER SAVINGS RISKS & OPPORTUNITIES
An analysis of the certified teaching staff for the district indicates that turnover savings is no longer an opportunity for the district. The over reliance in increasing turnover savings in the FY 2016-17 budget presents a risk to the district. The following represents the percentage of actual Ridgefield teachers eligible for retirement. Therefore, the FY 2016-17 budget includes a turnover savings projection of $300,000 representing approximately eight teacher retirements or resignations.
Age 60 with 20 Years of Service 19 teachers 4.2 %
Age 55 with 30 Years of Service 12 teachers 2.6 %
35 Years of Service any age 7 teachers 1.5 %
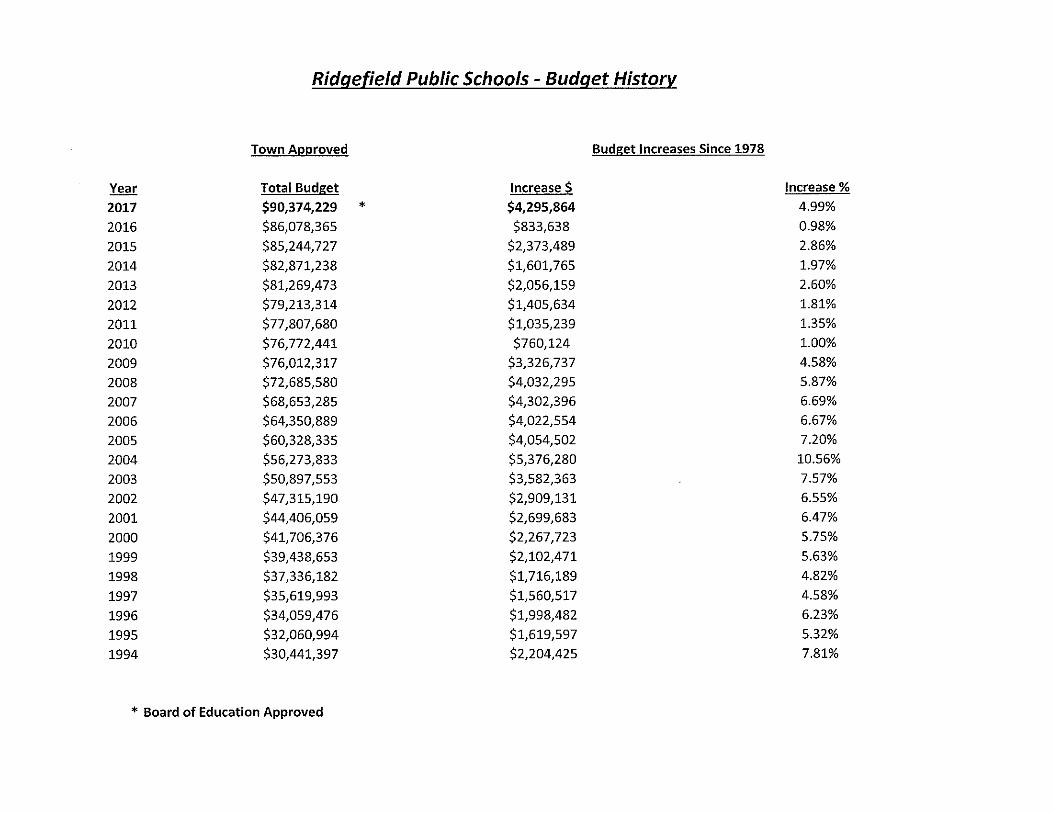
DISTRICT BUDGET HISTORY For the past several years, the Ridgefield Public Schools has made efforts to continuously improve and meet the demands of new and more challenging academic standards that raise expectations for students and teachers through a gradual and incremental approach to budgeting. The history of budget requests is outlined below.
YEAR TOTAL BUDGET INCREASE $ INCREASE %
2015-16 $86,078,365 $833,638 0.98%
2014-15 $85,244,727 $2,373,489 2.86%
2013-14 $82,871,238 $1,601,765 1.97%
2012-13 $81,269,473 $2,056,159 2.60%
2011-12 $79,213,314 $1,405,634 1.81%
2010-11 $77,807,680 $1,035,239 1.35%
2009-10 $76,772,441 $760,124 1.00%
2008-09 $76,012,317 $3,326,737 4.58%
2007-08 $72,685,580 $4,032,295 5.87%
RIDGEFIELD PUBLIC SCHOOLS
7
FACTORS INFLUENCING BUDGET
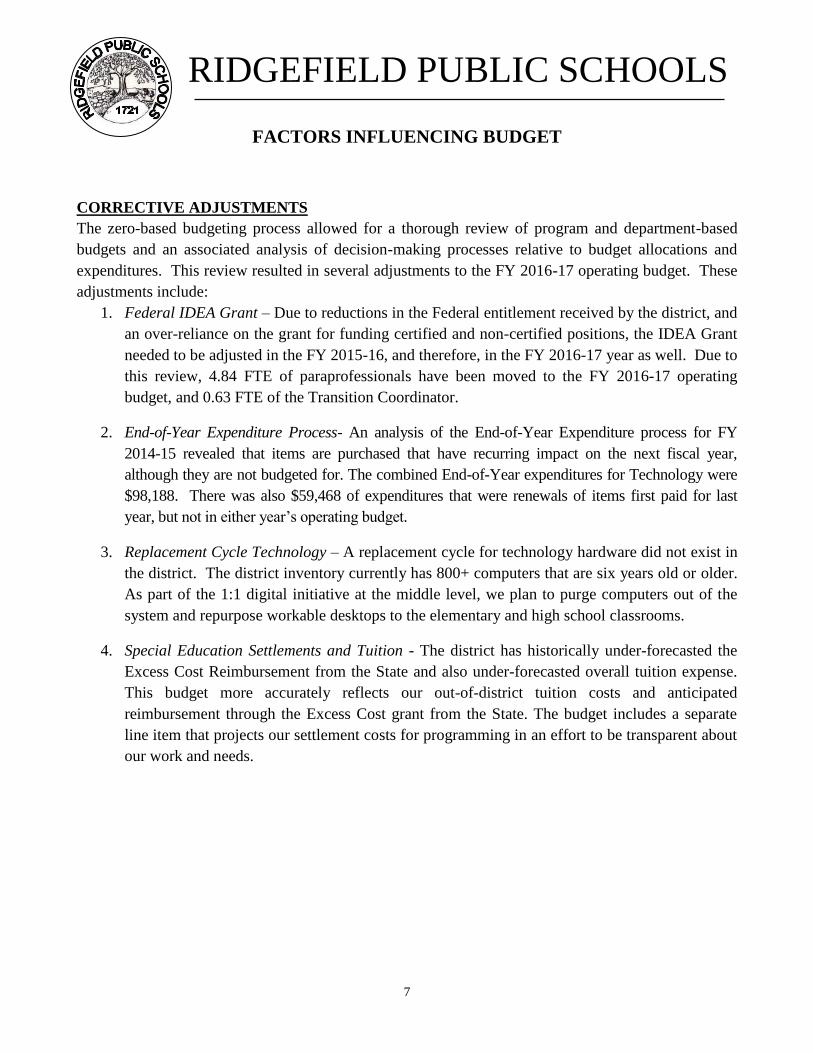
CORRECTIVE ADJUSTMENTS The zero-based budgeting process allowed for a thorough review of program and department-based budgets and an associated analysis of decision-making processes relative to budget allocations and expenditures. This review resulted in several adjustments to the FY 2016-17 operating budget. These adjustments include:
1. Federal IDEA Grant – Due to reductions in the Federal entitlement received by the district, and an over-reliance on the grant for funding certified and non-certified positions, the IDEA Grant needed to be adjusted in the FY 2015-16, and therefore, in the FY 2016-17 year as well. Due to this review, 4.84 FTE of paraprofessionals have been moved to the FY 2016-17 operating budget, and 0.63 FTE of the Transition Coordinator.
2. End-of-Year Expenditure Process- An analysis of the End-of-Year Expenditure process for FY 2014-15 revealed that items are purchased that have recurring impact on the next fiscal year, although they are not budgeted for. The combined End-of-Year expenditures for Technology were $98,188. There was also $59,468 of expenditures that were renewals of items first paid for last year, but not in either year’s operating budget.
3. Replacement Cycle Technology – A replacement cycle for technology hardware did not exist in the district. The district inventory currently has 800+ computers that are six years old or older. As part of the 1:1 digital initiative at the middle level, we plan to purge computers out of the system and repurpose workable desktops to the elementary and high school classrooms.
4. Special Education Settlements and Tuition - The district has historically under-forecasted the Excess Cost Reimbursement from the State and also under-forecasted overall tuition expense. This budget more accurately reflects our out-of-district tuition costs and anticipated reimbursement through the Excess Cost grant from the State. The budget includes a separate line item that projects our settlement costs for programming in an effort to be transparent about our work and needs.
RIDGEFIELD PUBLIC SCHOOLS
8
RIDGEFIELD PUBLIC SCHOOLS BUDGET FY 2016-17
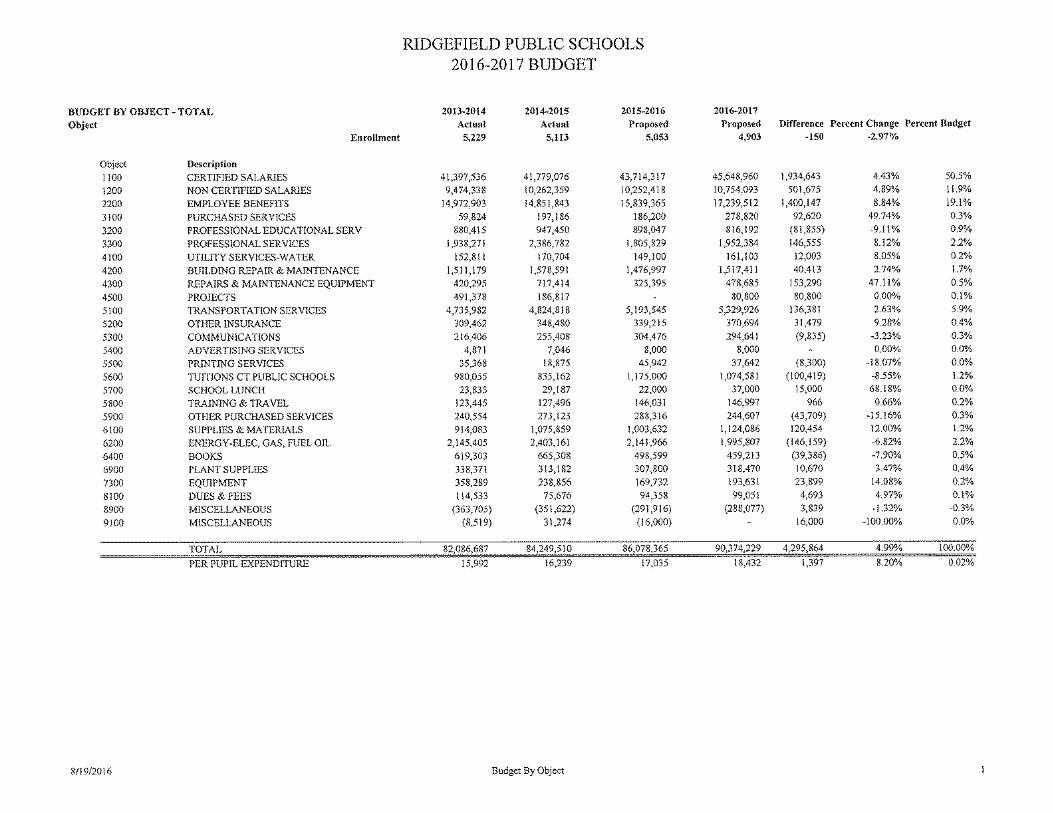
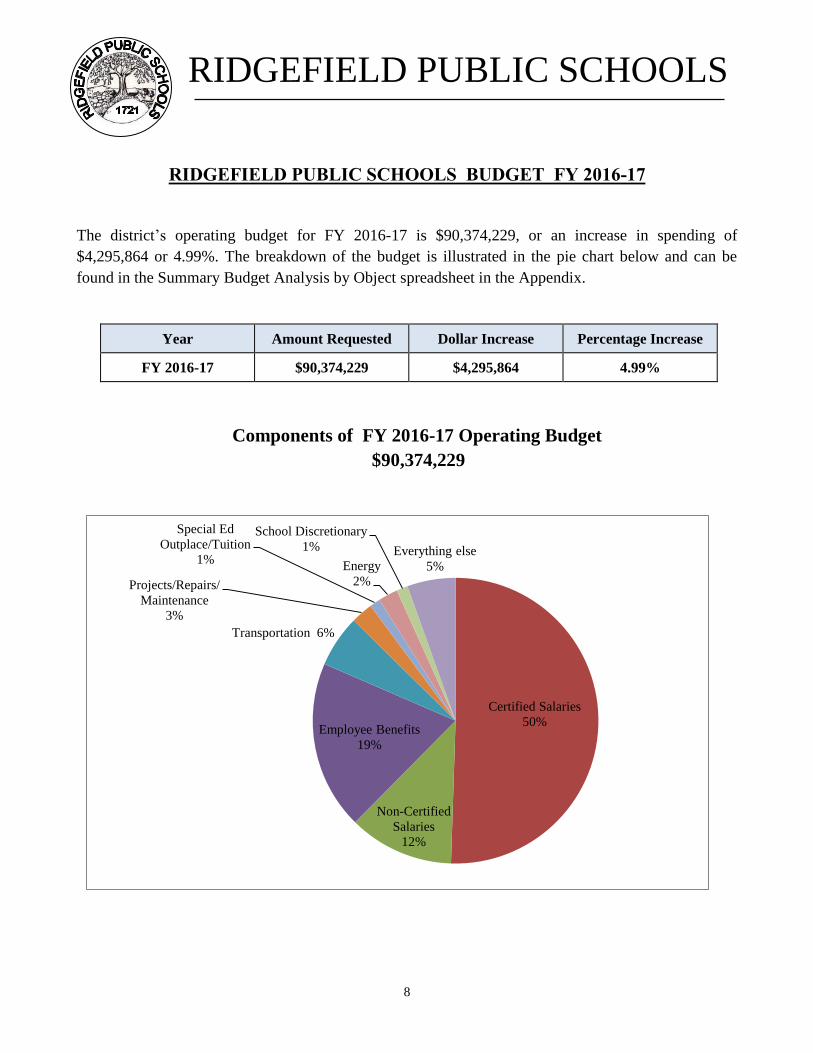
The district’s operating budget for FY 2016-17 is $90,374,229, or an increase in spending of $4,295,864 or 4.99%. The breakdown of the budget is illustrated in the pie chart below and can be found in the Summary Budget Analysis by Object spreadsheet in the Appendix.
Year Amount Requested Dollar Increase Percentage Increase
FY 2016-17 $90,374,229 $4,295,864 4.99%
Components of FY 2016-17 Operating Budget $90,374,229
Certified Salaries 50%
Non-Certified Salaries
12%
Employee Benefits 19%
Transportation 6%
Projects/Repairs/ Maintenance
3%
Special Ed Outplace/Tuition
1% Energy 2%
School Discretionary 1% Everything else
5%
RIDGEFIELD PUBLIC SCHOOLS
9
DESCRIPTION OF BUDGET EXPENDITURES
CERTIFIED SALARIES
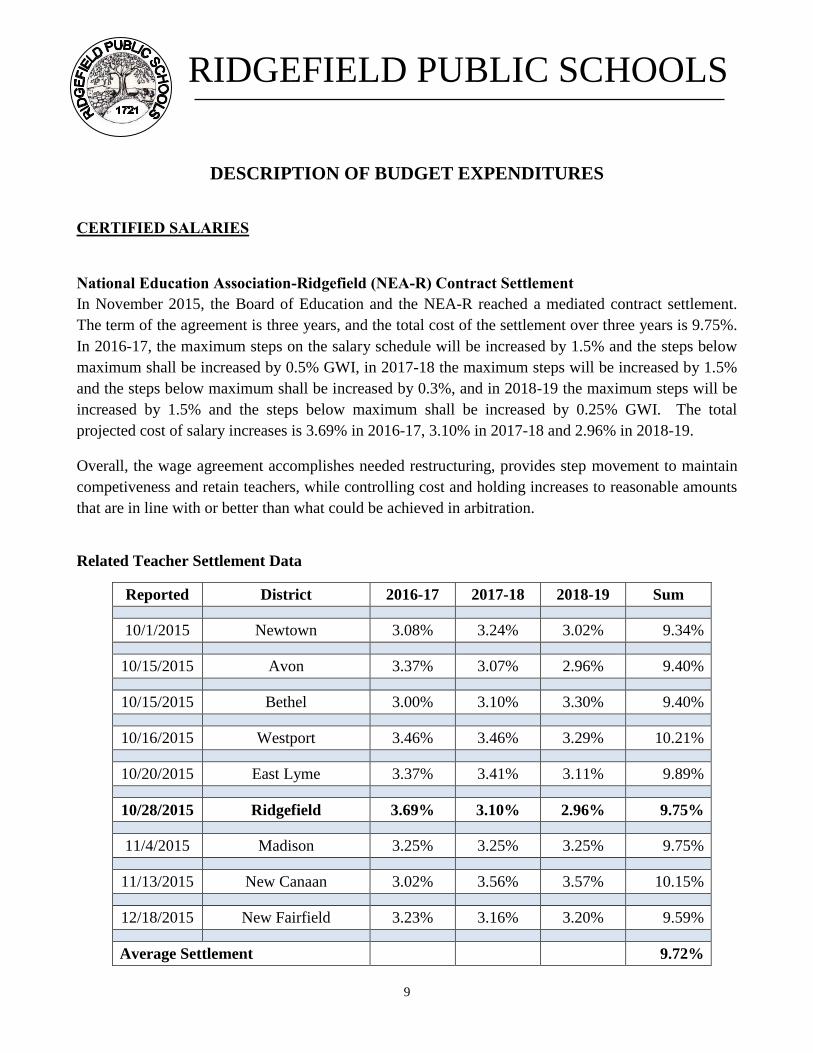
National Education Association-Ridgefield (NEA-R) Contract Settlement
In November 2015, the Board of Education and the NEA-R reached a mediated contract settlement. The term of the agreement is three years, and the total cost of the settlement over three years is 9.75%. In 2016-17, the maximum steps on the salary schedule will be increased by 1.5% and the steps below maximum shall be increased by 0.5% GWI, in 2017-18 the maximum steps will be increased by 1.5% and the steps below maximum shall be increased by 0.3%, and in 2018-19 the maximum steps will be increased by 1.5% and the steps below maximum shall be increased by 0.25% GWI. The total projected cost of salary increases is 3.69% in 2016-17, 3.10% in 2017-18 and 2.96% in 2018-19.
Overall, the wage agreement accomplishes needed restructuring, provides step movement to maintain competiveness and retain teachers, while controlling cost and holding increases to reasonable amounts that are in line with or better than what could be achieved in arbitration.
Related Teacher Settlement Data
Reported District 2016-17 2017-18 2018-19 Sum
10/1/2015 Newtown 3.08% 3.24% 3.02% 9.34%
10/15/2015 Avon 3.37% 3.07% 2.96% 9.40%
10/15/2015 Bethel 3.00% 3.10% 3.30% 9.40%
10/16/2015 Westport 3.46% 3.46% 3.29% 10.21%
10/20/2015 East Lyme 3.37% 3.41% 3.11% 9.89%
10/28/2015 Ridgefield 3.69% 3.10% 2.96% 9.75%
11/4/2015 Madison 3.25% 3.25% 3.25% 9.75%
11/13/2015 New Canaan 3.02% 3.56% 3.57% 10.15%
12/18/2015 New Fairfield 3.23% 3.16% 3.20% 9.59%
Average Settlement
9.72%
RIDGEFIELD PUBLIC SCHOOLS
10
DESCRIPTION OF BUDGET EXPENDITURES
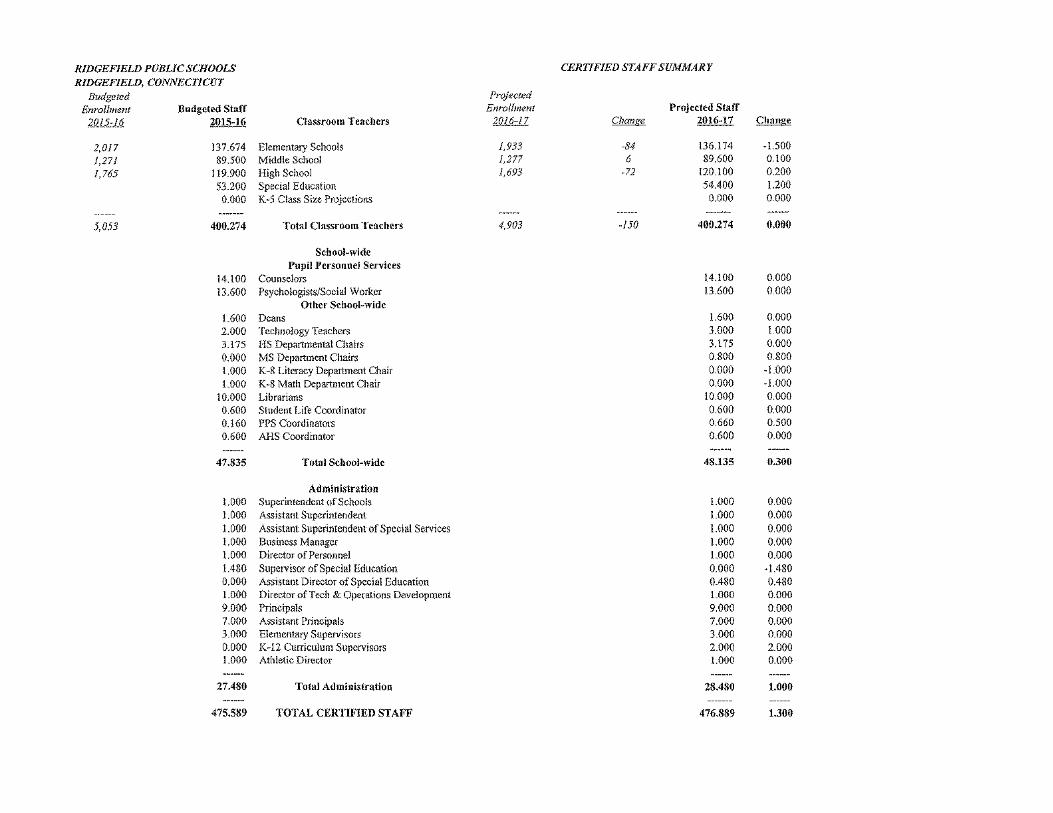
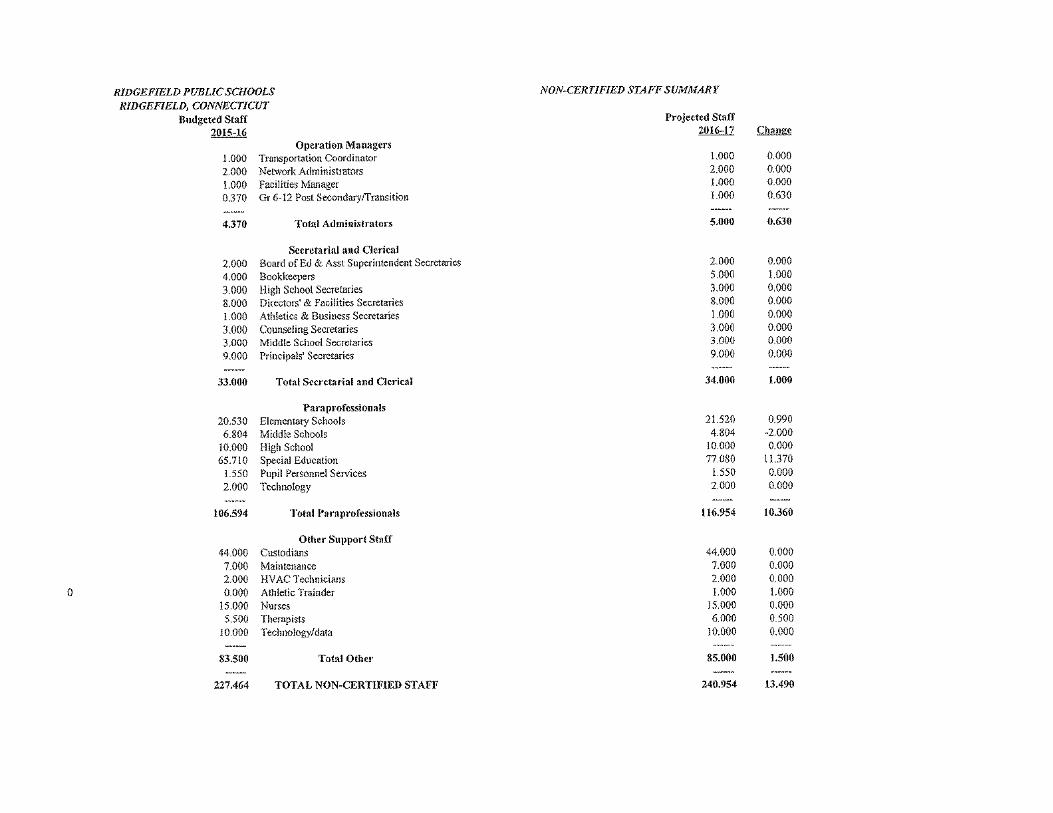
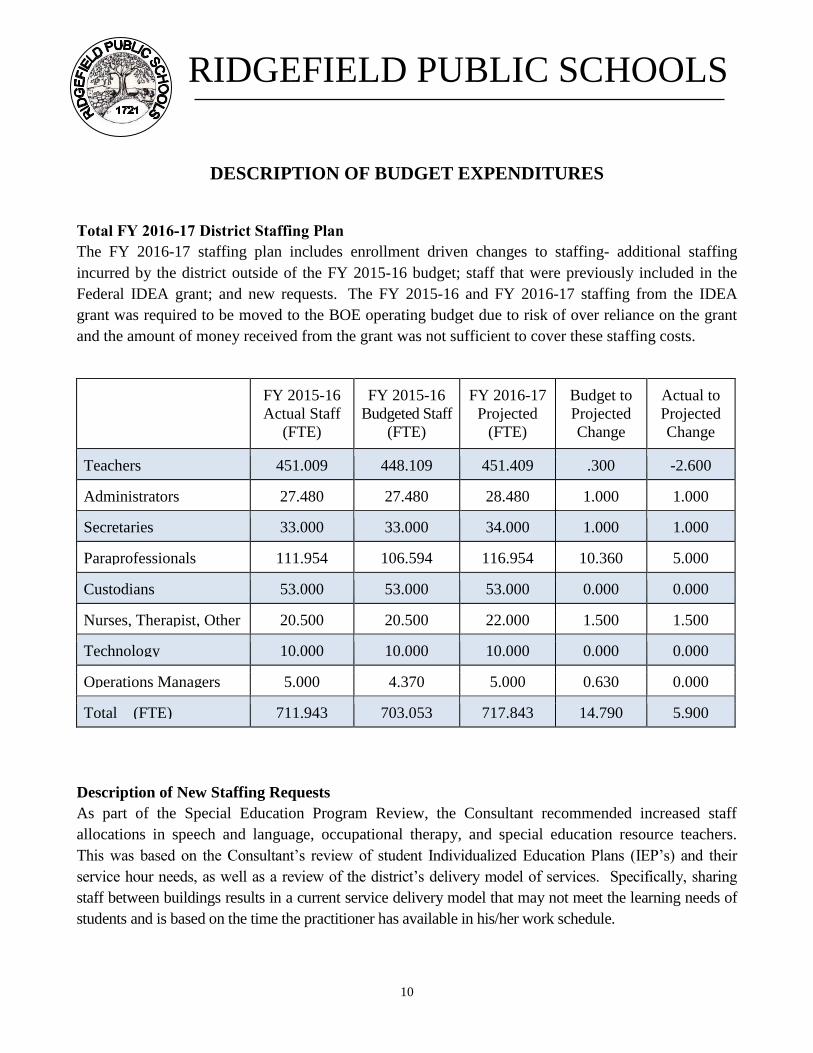
Total FY 2016-17 District Staffing Plan
The FY 2016-17 staffing plan includes enrollment driven changes to staffing- additional staffing incurred by the district outside of the FY 2015-16 budget; staff that were previously included in the Federal IDEA grant; and new requests. The FY 2015-16 and FY 2016-17 staffing from the IDEA grant was required to be moved to the BOE operating budget due to risk of over reliance on the grant and the amount of money received from the grant was not sufficient to cover these staffing costs.
FY 2015-16 Actual Staff
(FTE)
FY 2015-16 Budgeted Staff
(FTE)
FY 2016-17 Projected
(FTE)
Budget to Projected Change (FTE)
Actual to Projected Change
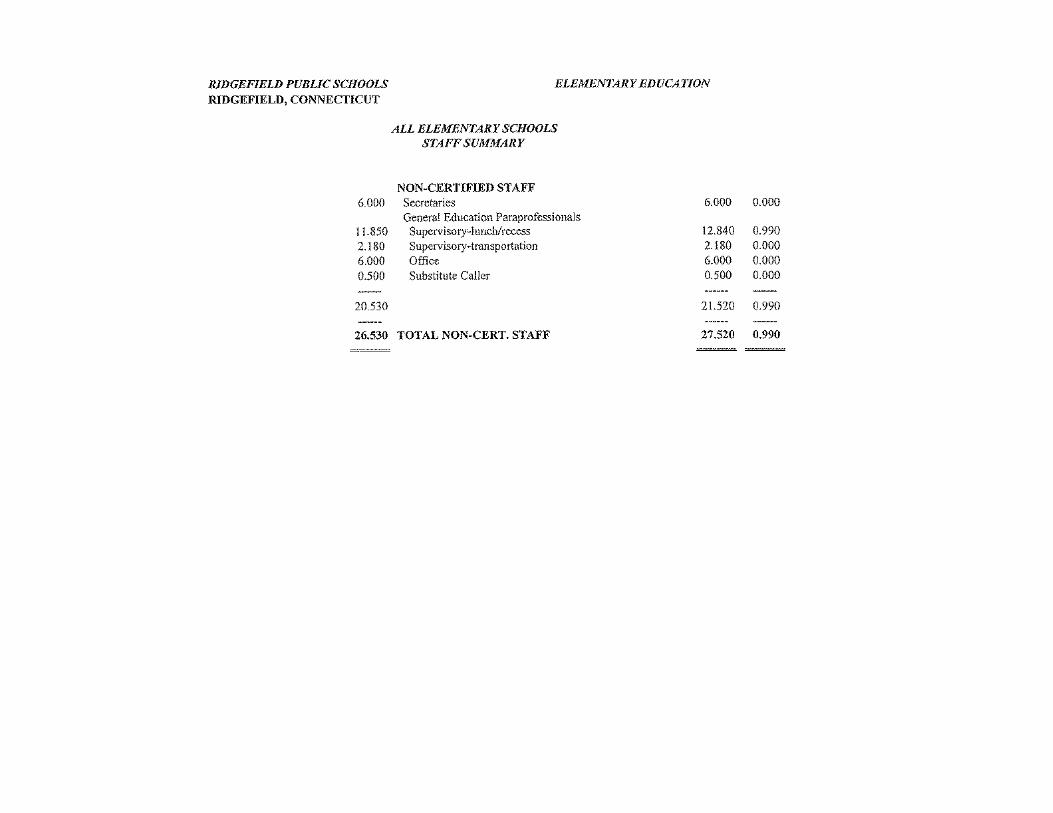
Teachers 451.009 448.109 451.409 .300 -2.600
Administrators 27.480 27.480 28.480 1.000 1.000
Secretaries 33.000 33.000 34.000 1.000 1.000
Paraprofessionals 111.954 106.594 116.954 10.360 5.000
Custodians 53.000 53.000 53.000 0.000 0.000
Nurses, Therapist, Other 20.500 20.500 22.000 1.500 1.500
Technology 10.000 10.000 10.000 0.000 0.000
Operations Managers 5.000 4.370 5.000 0.630 0.000
Total (FTE) 711.943 703.053 717.843 14.790 5.900
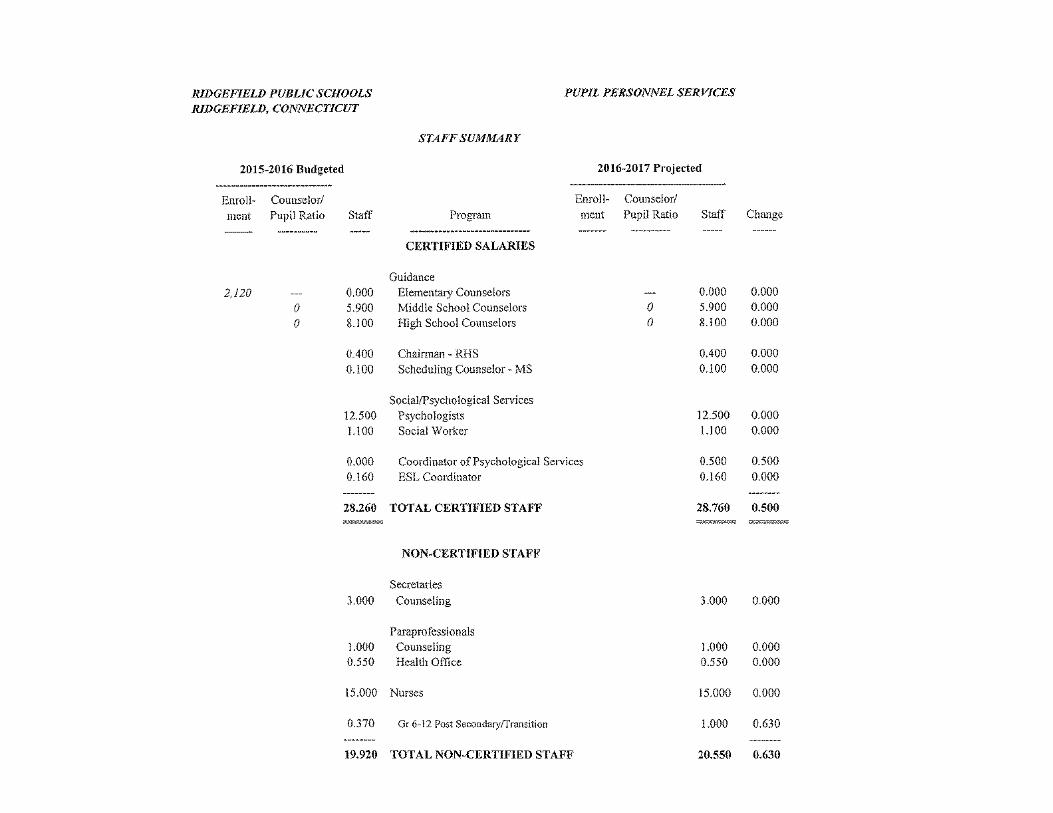
Description of New Staffing Requests As part of the Special Education Program Review, the Consultant recommended increased staff allocations in speech and language, occupational therapy, and special education resource teachers. This was based on the Consultant’s review of student Individualized Education Plans (IEP’s) and their
service hour needs, as well as a review of the district’s delivery model of services. Specifically, sharing
staff between buildings results in a current service delivery model that may not meet the learning needs of students and is based on the time the practitioner has available in his/her work schedule.
RIDGEFIELD PUBLIC SCHOOLS
11
DESCRIPTION OF BUDGET EXPENDITURES
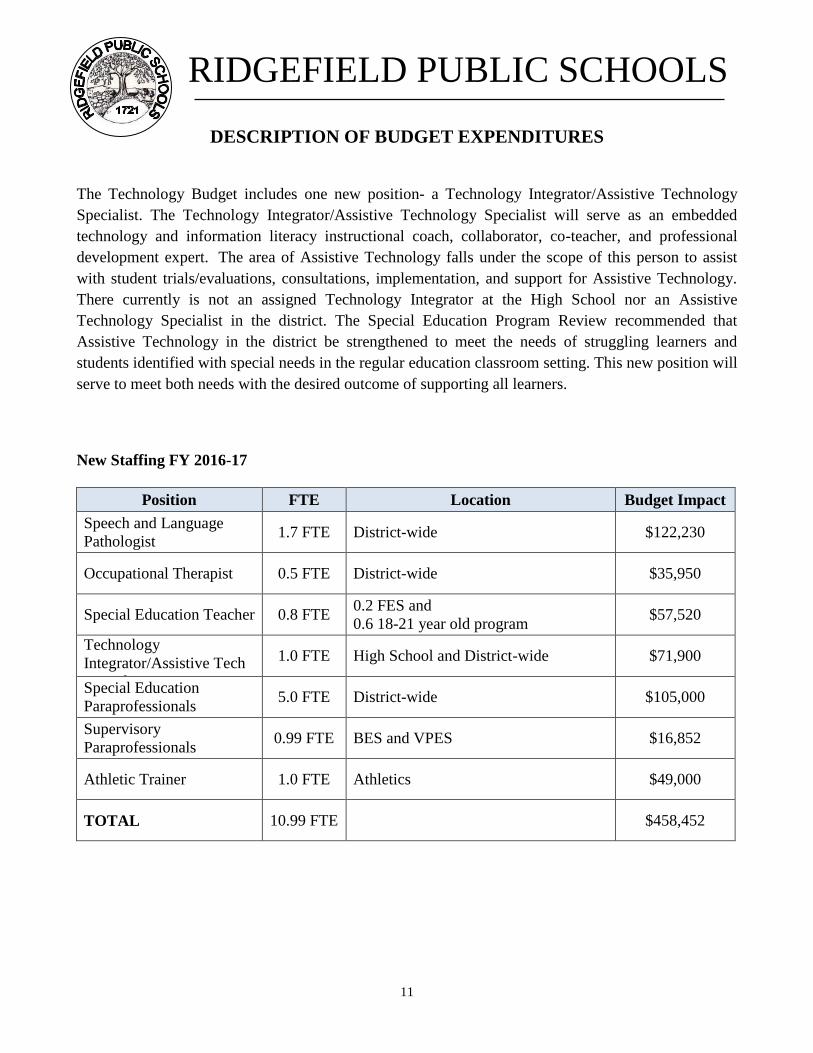
The Technology Budget includes one new position- a Technology Integrator/Assistive Technology Specialist. The Technology Integrator/Assistive Technology Specialist will serve as an embedded technology and information literacy instructional coach, collaborator, co-teacher, and professional development expert. The area of Assistive Technology falls under the scope of this person to assist with student trials/evaluations, consultations, implementation, and support for Assistive Technology. There currently is not an assigned Technology Integrator at the High School nor an Assistive Technology Specialist in the district. The Special Education Program Review recommended that Assistive Technology in the district be strengthened to meet the needs of struggling learners and students identified with special needs in the regular education classroom setting. This new position will serve to meet both needs with the desired outcome of supporting all learners. New Staffing FY 2016-17
Position FTE Location Budget Impact
Speech and Language Pathologist
1.7 FTE District-wide $122,230
Occupational Therapist 0.5 FTE District-wide $35,950
Special Education Teacher 0.8 FTE 0.2 FES and 0.6 18-21 year old program
$57,520
Technology Integrator/Assistive Tech specialist
1.0 FTE High School and District-wide $71,900
Special Education Paraprofessionals
5.0 FTE District-wide $105,000
Supervisory Paraprofessionals
0.99 FTE BES and VPES $16,852
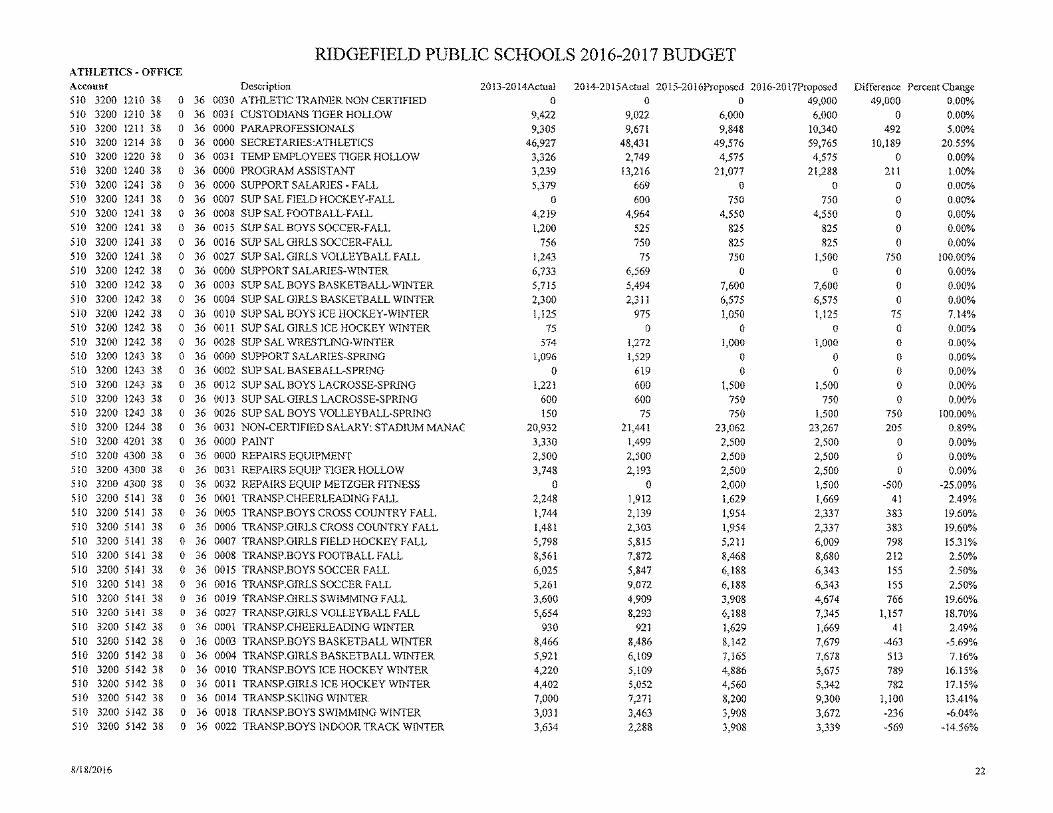
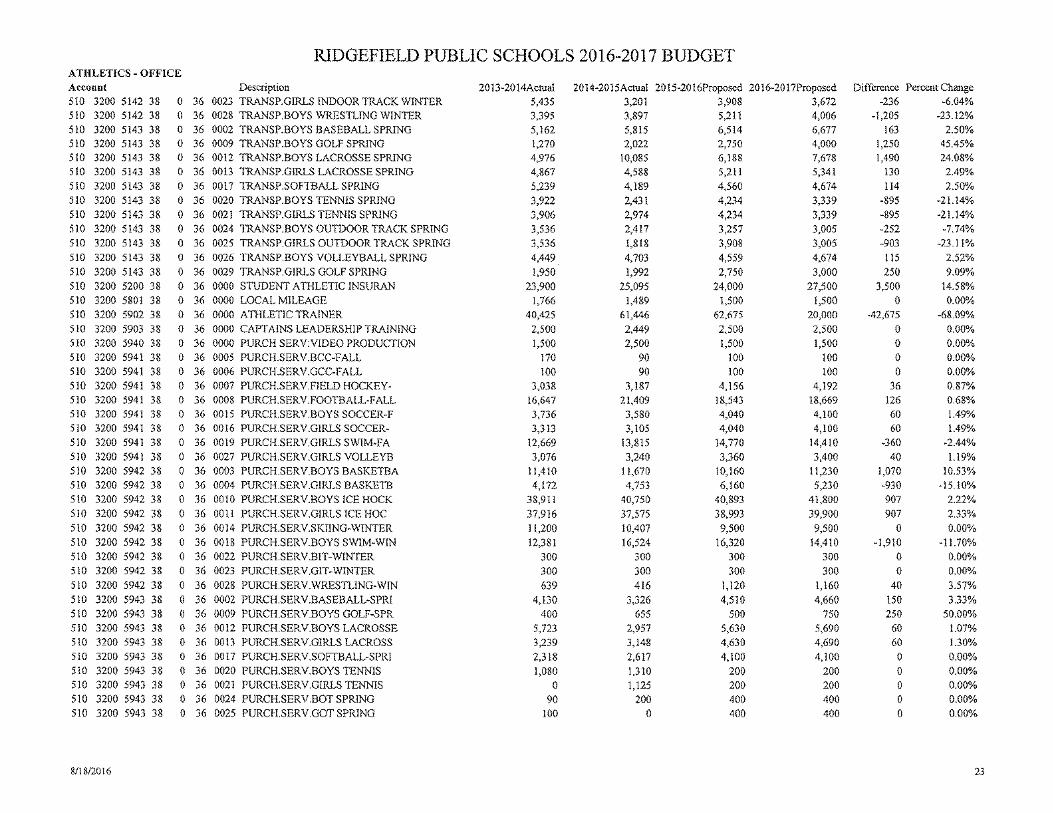
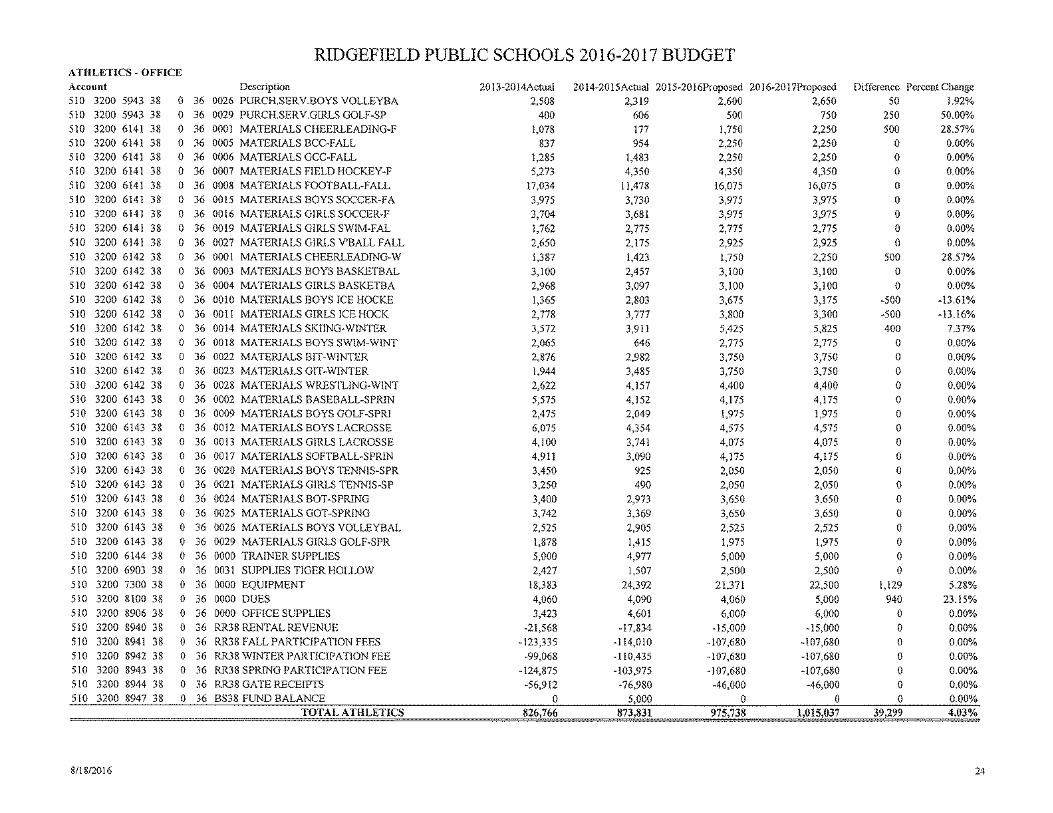
Athletic Trainer 1.0 FTE Athletics $49,000
TOTAL 10.99 FTE $458,452
RIDGEFIELD PUBLIC SCHOOLS
12
DESCRIPTION OF BUDGET EXPENDITURES
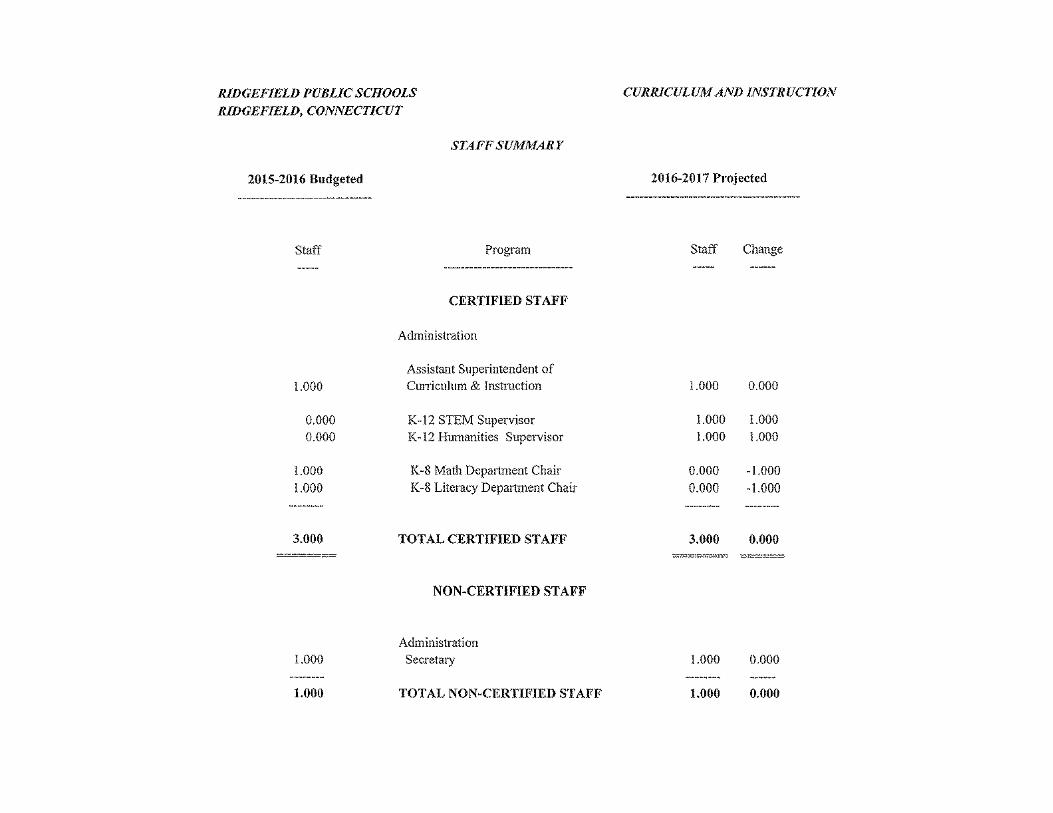
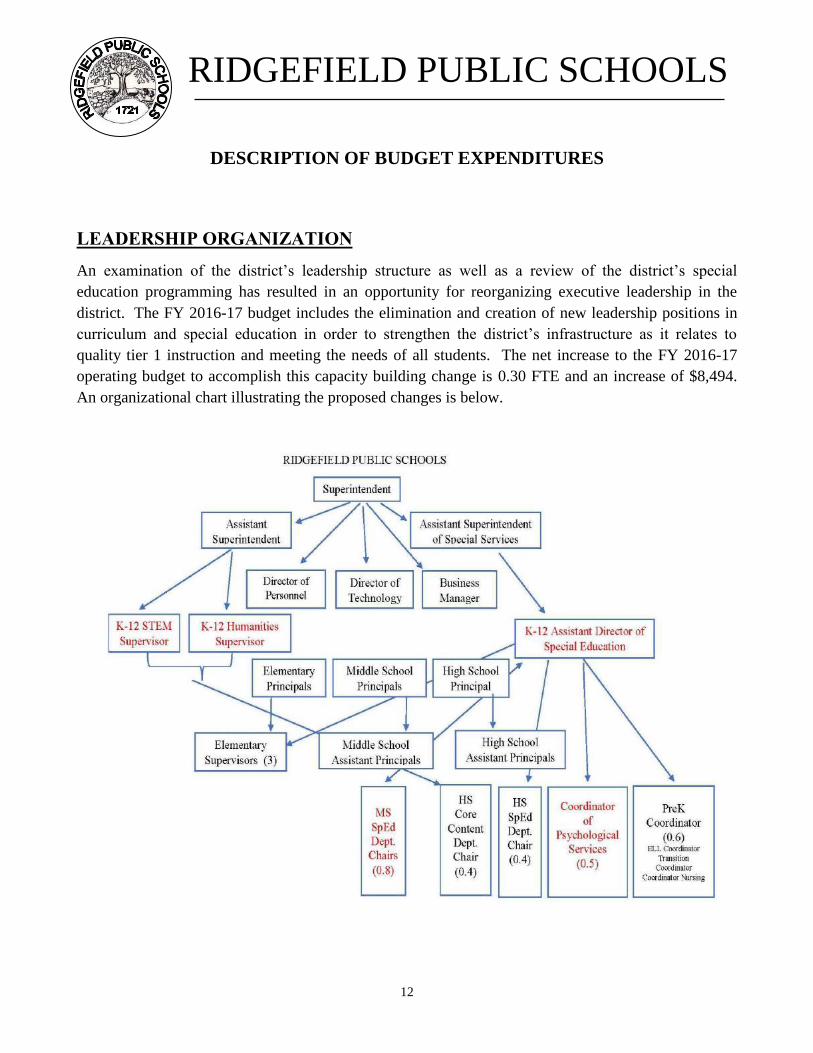
LEADERSHIP ORGANIZATION
An examination of the district’s leadership structure as well as a review of the district’s special
education programming has resulted in an opportunity for reorganizing executive leadership in the district. The FY 2016-17 budget includes the elimination and creation of new leadership positions in curriculum and special education in order to strengthen the district’s infrastructure as it relates to quality tier 1 instruction and meeting the needs of all students. The net increase to the FY 2016-17 operating budget to accomplish this capacity building change is 0.30 FTE and an increase of $8,494. An organizational chart illustrating the proposed changes is below.

RIDGEFIELD PUBLIC SCHOOLS
13
DESCRIPTION OF BUDGET EXPENDITURES
PROPOSED MODEL STAFFING REQUESTS
Position FTE Location Budget Impact
K-12 STEM Supervisor 1.0 FTE Curriculum and District-wide $135,469
K-12 Humanities Supervisor 1.0 FTE Curriculum and District-wide $135,469
Assistant Superintendent of Special Services
1.0 FTE District-wide and SpEd $190,000
K-12 Assistant Director of Special Education
1.0 FTE District-wide and SpEd $153,137
Middle School Special Education Department Chairs
0.8 FTE SRMS and ERMS $108,060
Coordinator of Psychological Services
0.5 FTE District-wide and SpEd $54,031
SUBTOTAL 5.3 FTE
$776,166
PROPOSED MODEL OFFSETS - REDUCTIONS
Position FTE Location Budget Impact
Assistant Superintendent of Special Services
-1.0 FTE District-wide and SpEd ($178,938)
Supervisor of Special Education -1.0 FTE District-wide and SpEd ($153,137)
Supervisor of Special Education -1.0 FTE District-wide/SpEd ($153,137)
K-8 Literacy Department Chair -1.0 FTE District-wide ($130,424)
K-8 Math Department Chair -1.0 FTE District-wide ($130,424)
MS SPED Department Leaders Stipends
SRMS and ERMS ($21,612)
SUBTOTAL -5.0 FTE ($767,672)
NET INCREASE TO BUDGET
0.30 FTE $8,494
RIDGEFIELD PUBLIC SCHOOLS
14
DESCRIPTION OF BUDGET EXPENDITURES
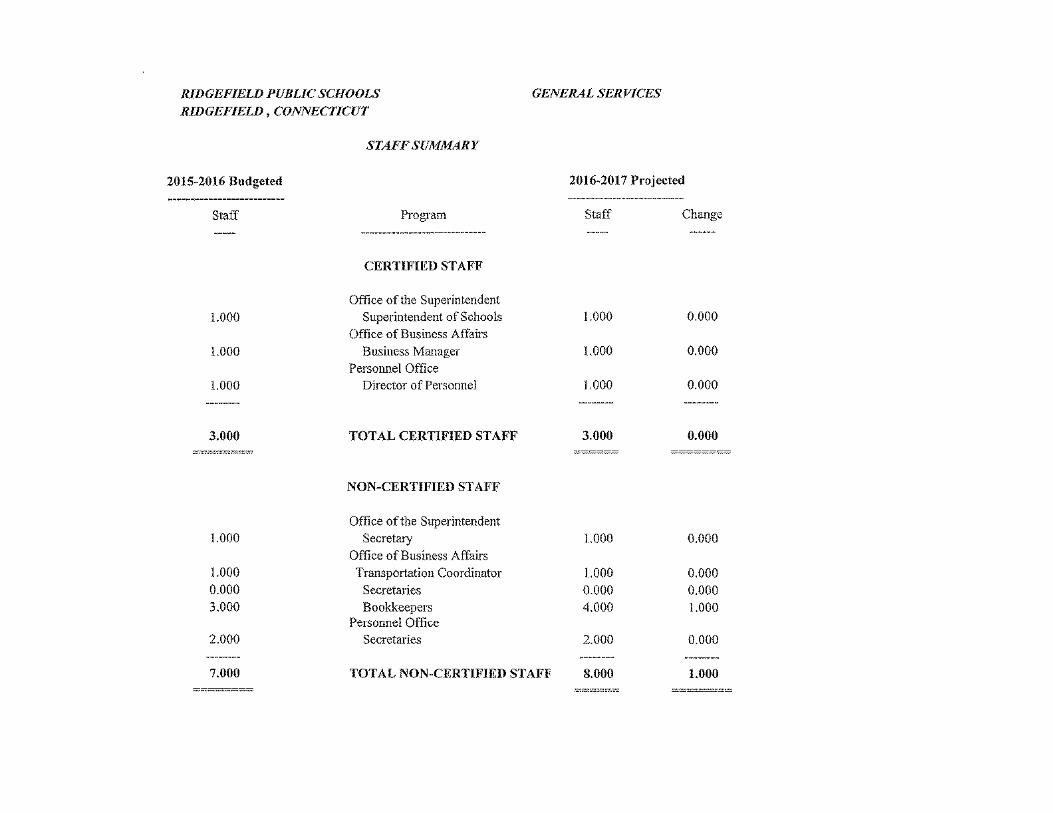
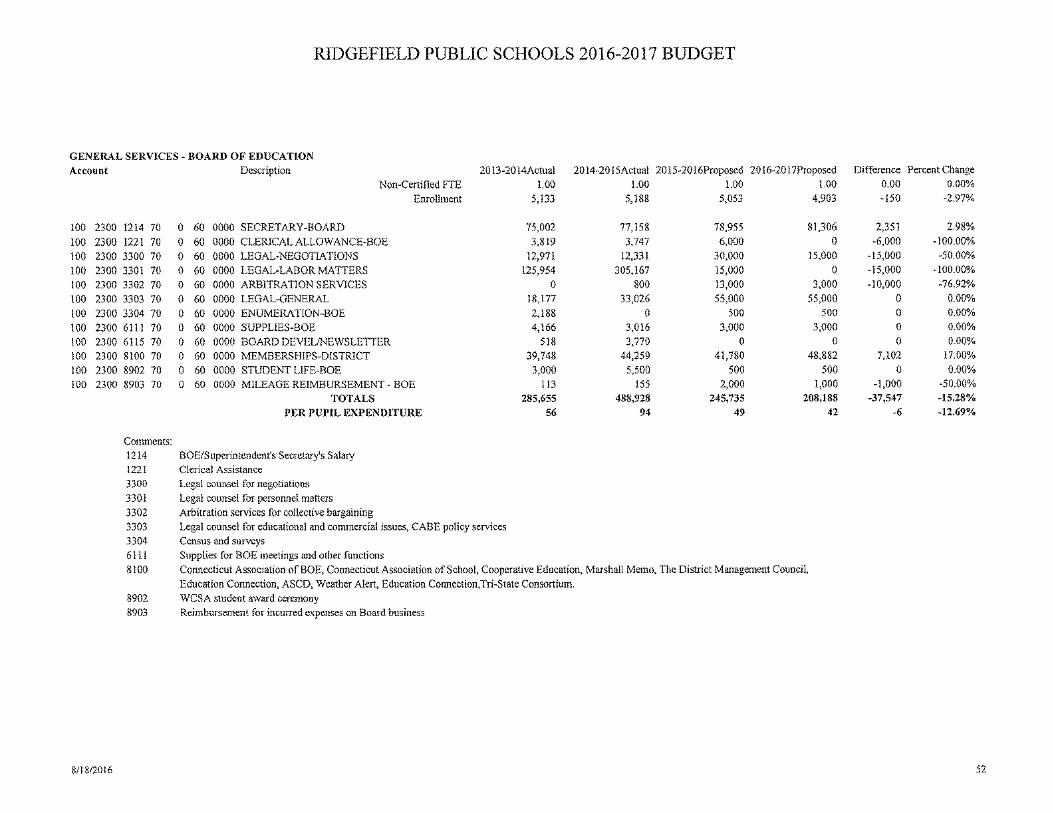
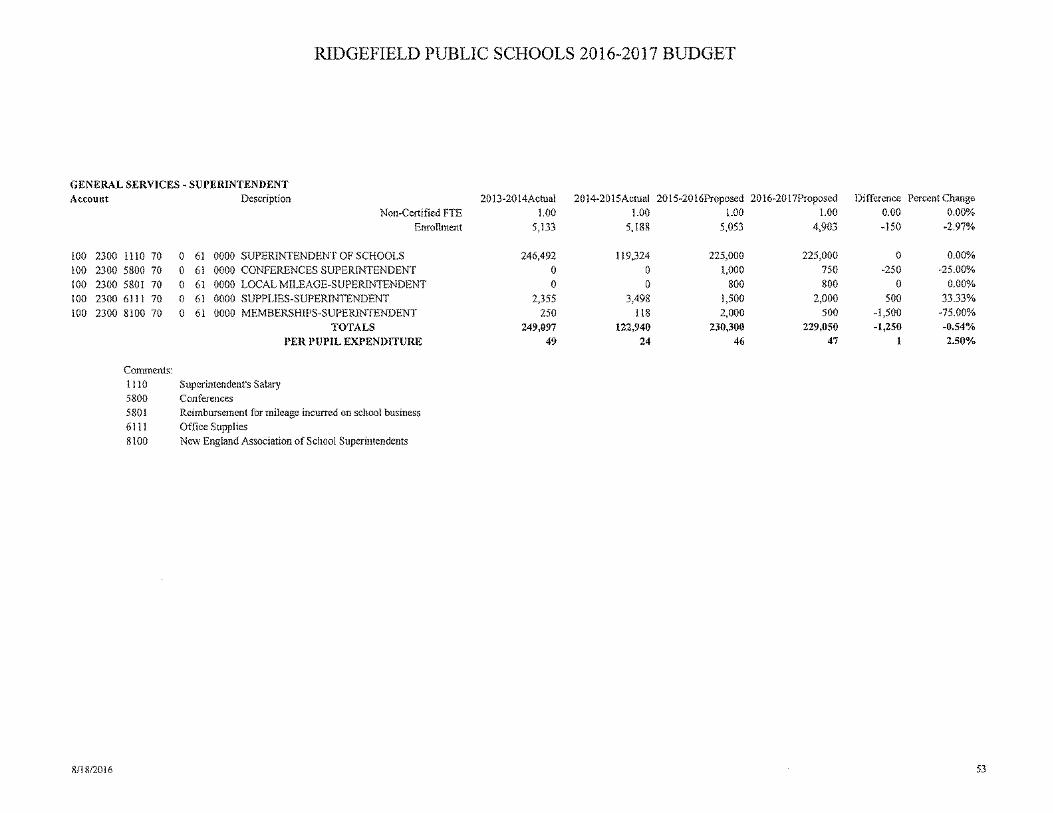
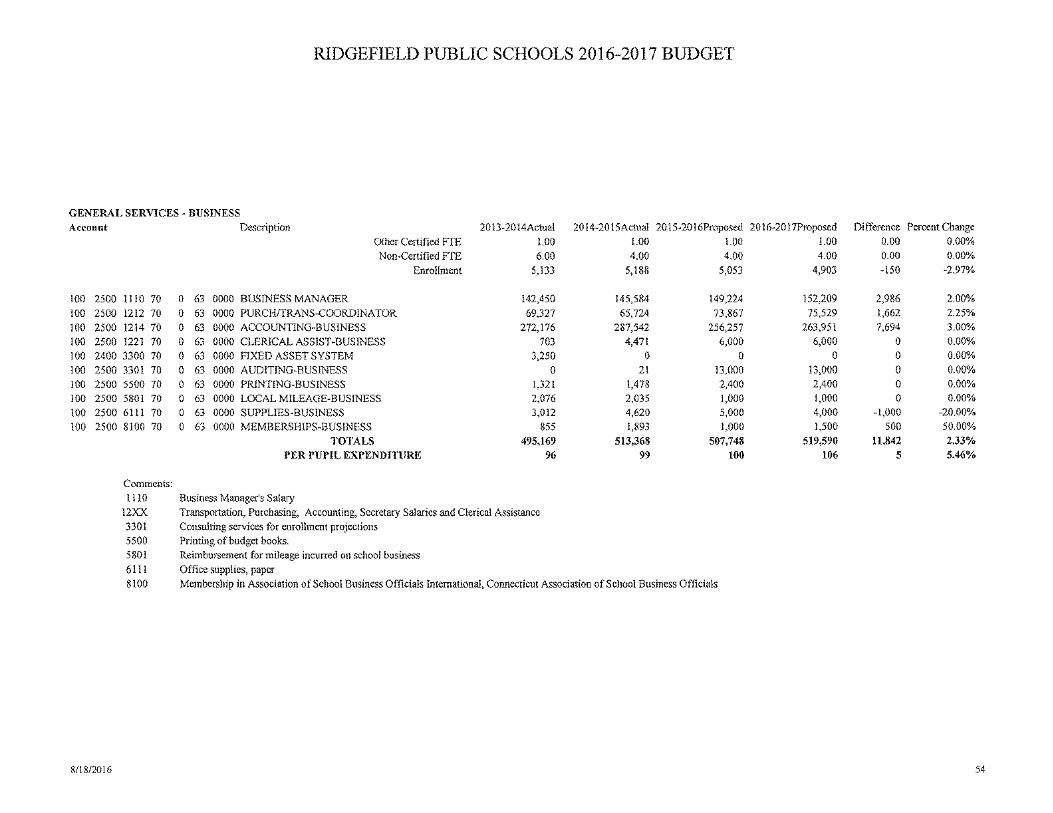
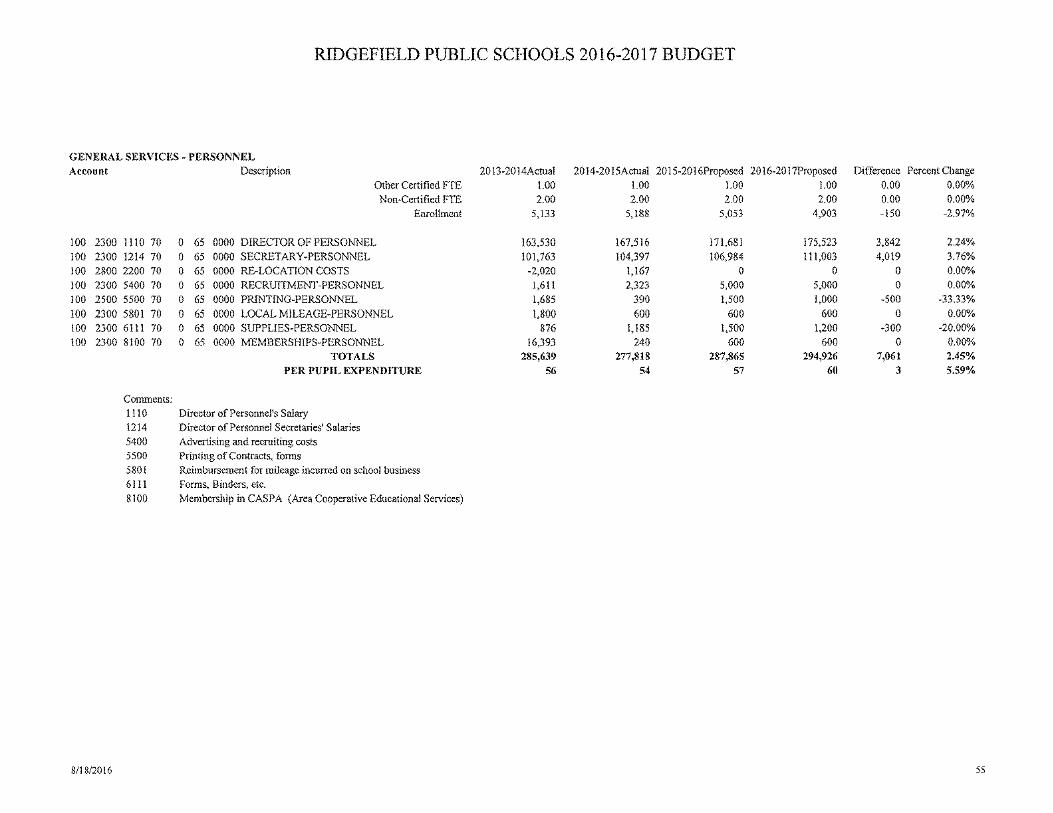
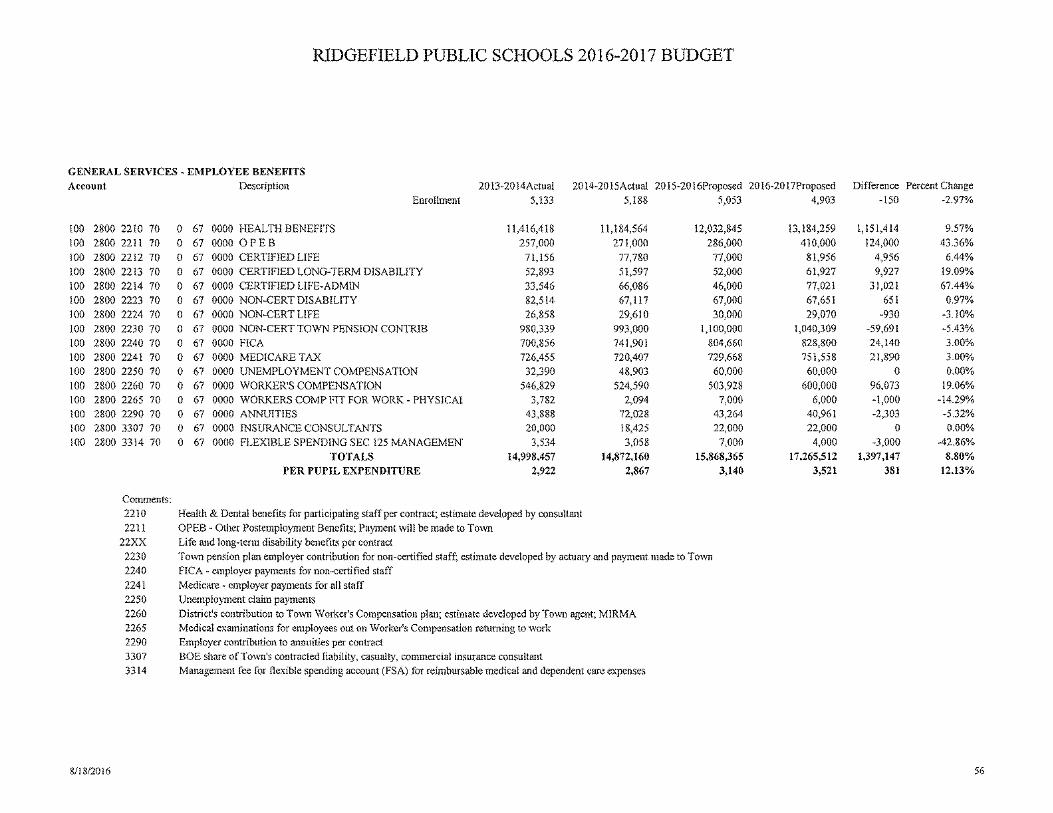
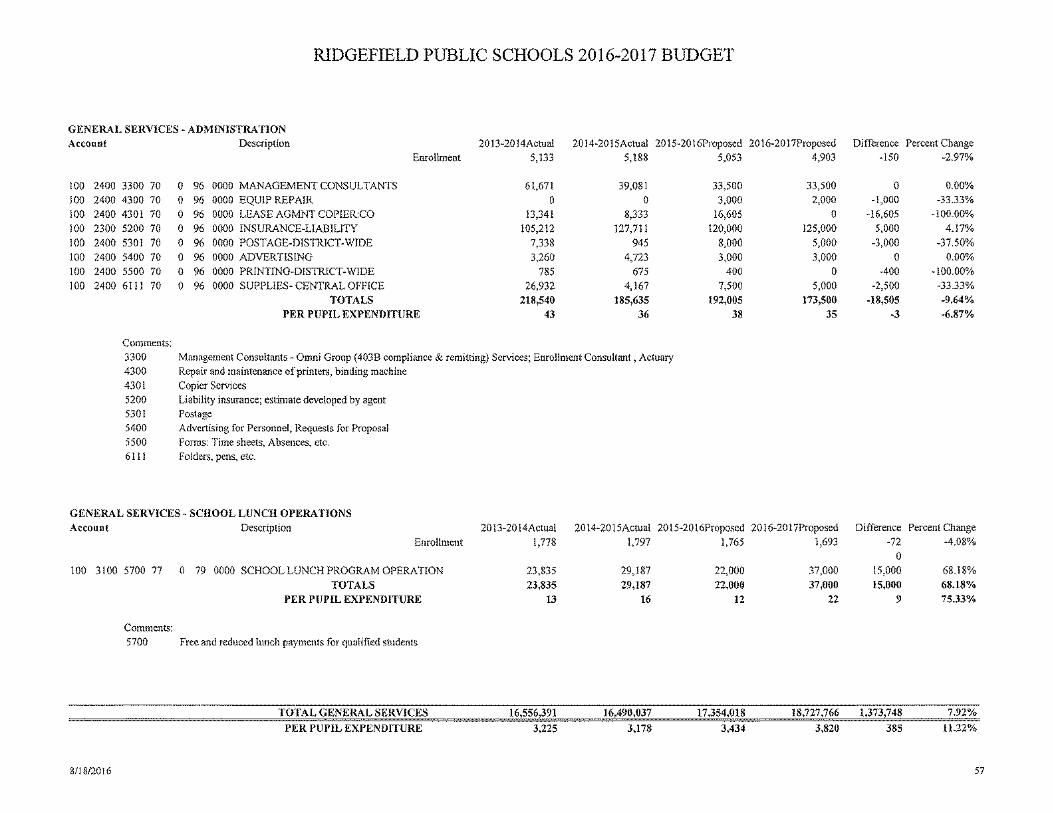
EMPLOYEE BENEFITS/GENERAL SERVICES General Services consists of the majority of Central Office staff as well as benefits for Ridgefield Public School employees. The largest component of the cost center is health benefits. The district has been very proactive over the past several years in addressing this volatile area by moving nearly 90% of employees to the High Deductible Health Plan (HDHP) with a companion Health Savings Account (HSA) through collective bargaining. In 2015-16 the health benefits budget was $12,032,845, which is lower than the 2011-12 budget of $12,182,284. The 2016-17 health benefits budget of $13,184,259, an increase of 9.57%, is due largely to an uptick in employee claims’ experience and poor claims experience over the past 12- months. The district continues to negotiate with its carrier CIGNA and monitor the monthly claim experience in an attempt to receive a better rate. The Town’s actuary has calculated that the FY 2016-17 Board of Education contribution to the non-certified pension will decrease from $1,100,000 to $1,040,039 or a decrease of $59,691 (5.43%). The Board makes an annual contribution to the pension plan for all non-certified employees. The plan is maintained by the Town, and is annually review by its actuary. The district maintains a workmen’s compensation insurance policy covering employees should they be injured while on the job. Annually the district’s Business Manager and Facilities Manager meet with
Travelers Insurance and Fairfield County Insurance (the district’s broker) to review and claims. They try to determine if there are any trends, or if there are precautionary measures, including employee education that might improve employee safety and consequently reduce claims. The premium for this coverage is estimated to increase from $503,928 to $600,000. This $96,073 (or 19.06%) increase is based on employee experience.
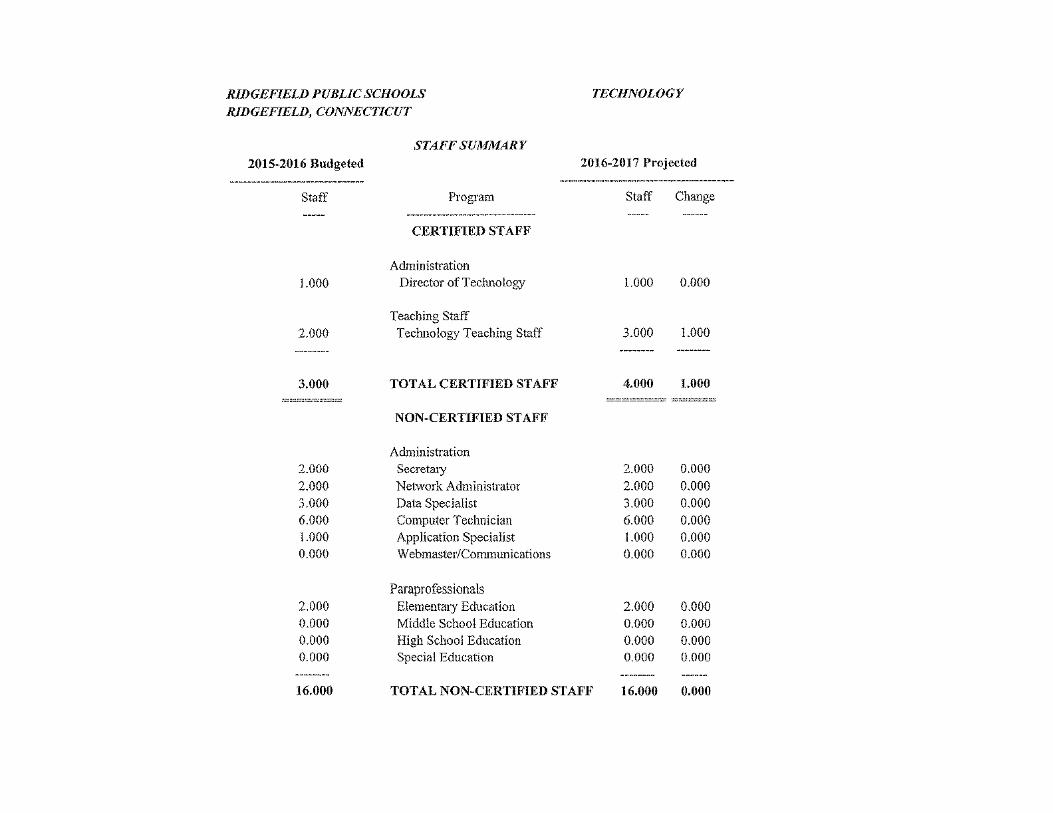
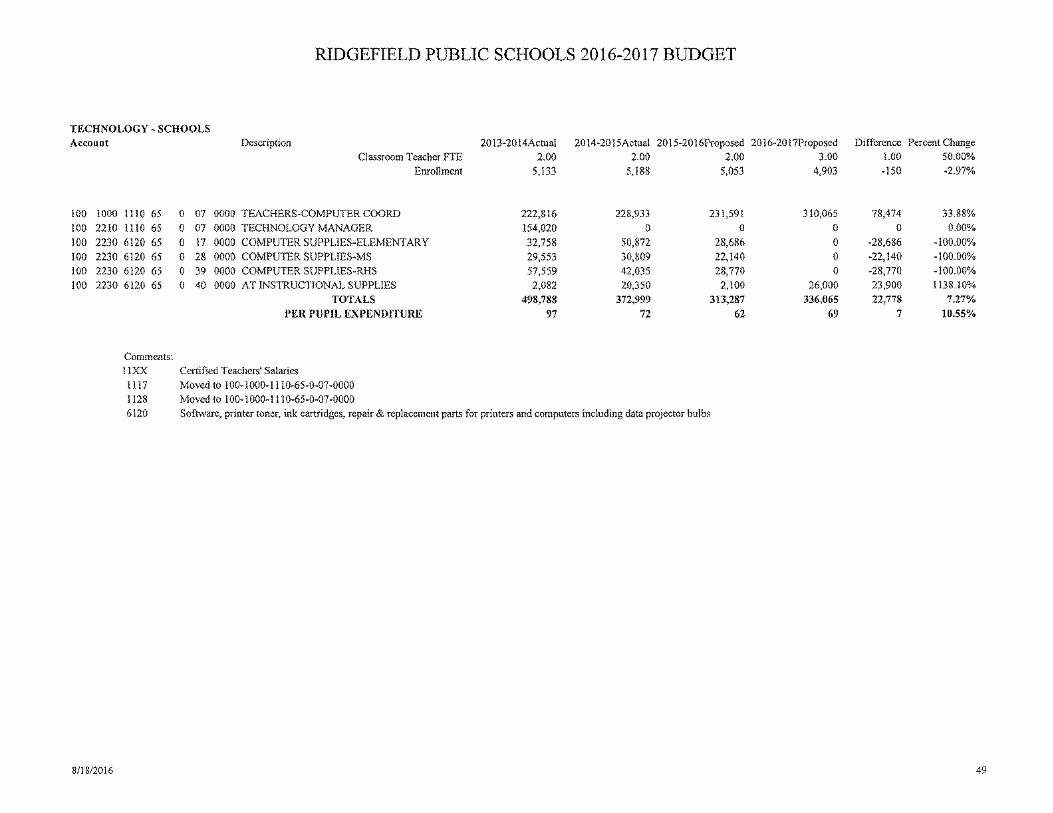
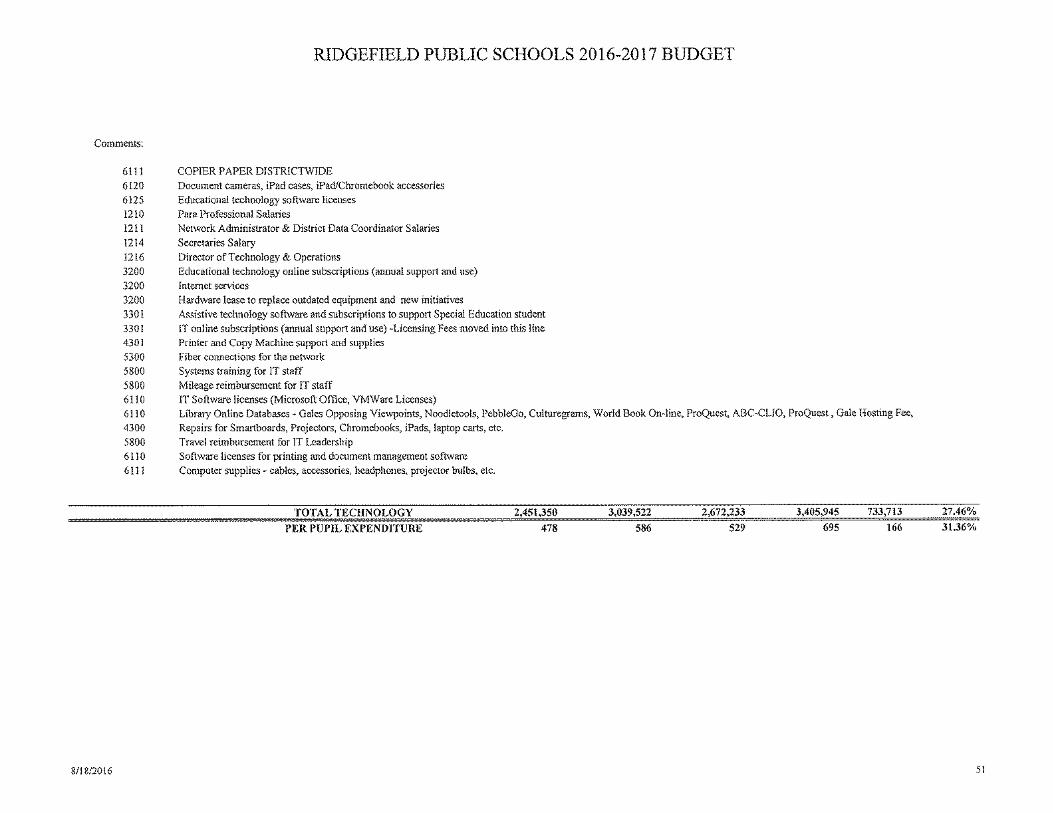
TECHNOLOGY
The FY 2016-17 Technology Budget includes the infrastructure, hardware, instructional supplies, services, and support to deliver a high quality educational program for all students. Students are engaged in collaboration, communication, research and inquiry, adaptive learning, and personalized learning through the use of technology resources. Teachers use technology resources to engage students cognitively with the goal of transforming instructional practice to create a learning
RIDGEFIELD PUBLIC SCHOOLS
15
DESCRIPTION OF BUDGET EXPENDITURES
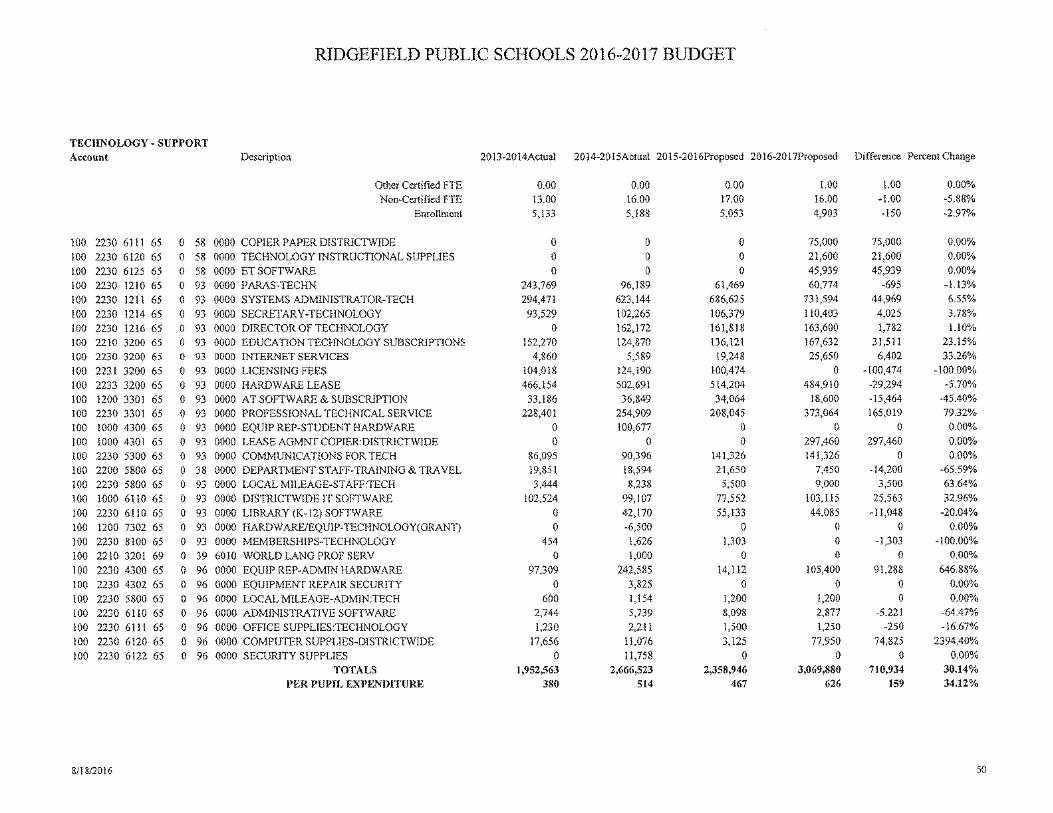
environment that would not have been possible without technology. The district is implementing a 1:1 Digital Learning Initiative in the 2016-17 school year. All students in grades 6-8 will receive a district provided Chromebook to deepen learning opportunities and continue development of these 21st century skills and personalize learning. The Chromebooks will be partially acquired through a recently awarded Connecticut Department of Education Technology Grant and the FY 2016-17 Hardware Lease. The lease will cost of $87,889 per year for three years, which lowers the total Hardware Lease costs, this year plus the following two years, by $29,294 per year. The Educational Technology budget contains items that previously were found in other budgets accounts in the district. This includes Instructional Technology Accessories and Assistive Technology. The Instructional Technology Accessories ($21,600) includes Document Cameras for K-5 classrooms, iPads and accessories, Chromebook accessories, and other technology instructional supplies that support classroom instruction. Assistive Technology Instructional Supplies ($26,000) includes a wide array of individualized tools such as pencil grips, swivel seats, digital calendar organizers, to Text to Speech, Speech to Text, and Augmentative Communication Devices. The Assistive Technology Software and Subscription budget ($18,600) also includes software and subscriptions for Assistive Technology and Special Education needs. Assistive Technology tools and resources are paired with a student’s IEP learning goals and are legally obligated to be provided. In the development of this budget, all resources were examined and several online subscriptions were eliminated or reduced in scope to net a total savings of $45,000 from prior years. The Technology Budget is the infrastructure, hardware, and support for technology in the district. This includes the wireless network, wired network to computers and printers, and the servers. Professional Services in the Technology Budget supports annual maintenance contracts and subscriptions to the databases that are used to manage and the school district. Vendors require the subscription to obtain support, upgrades, and licensing to run their system. This includes the finance system, substitute and attendance system, online hiring application system, IEP management system, and lunch services system. Some items, such as the Virtual Desktop Implementation (VDI) are required in order to use prior hardware investments. This budget includes the implementation costs ($45,000) to transition the district to a new web hosting platform to support communication. Core network devices and servers are supported using service contracts to minimize downtime if hardware failure were to occur. The budget also contains the hardware lease, which includes the 1:1 Chromebook initiative. This 1:1 Chromebook initiative keeps the hardware lease flat with no increased costs and resets the inventory refresh cycle moving into future years. Technology devices currently at the two middle schools will be repurposed to the elementary schools and high school.
RIDGEFIELD PUBLIC SCHOOLS
16
DESCRIPTION OF BUDGET EXPENDITURES
CURRICULUM & INSTRUCTIONAL IMPROVEMENT The Ridgefield Public School’s mission of excellence insists upon an educational program designed to
prepare each student for success in a diverse and complex world. Simply put, upon leaving our schools, students must be future ready. The philosophy underpinning this budget is that we must comprehensively and systematically prepare our students for global citizenship and long-term career demands. Two factors—curriculum and instruction—are fundamental to this mission and student success. To help them become global citizens, we seek to not only prepare, but also inspire our students to be responsive to the needs of others, innovate, and act as positive change forces in our world.
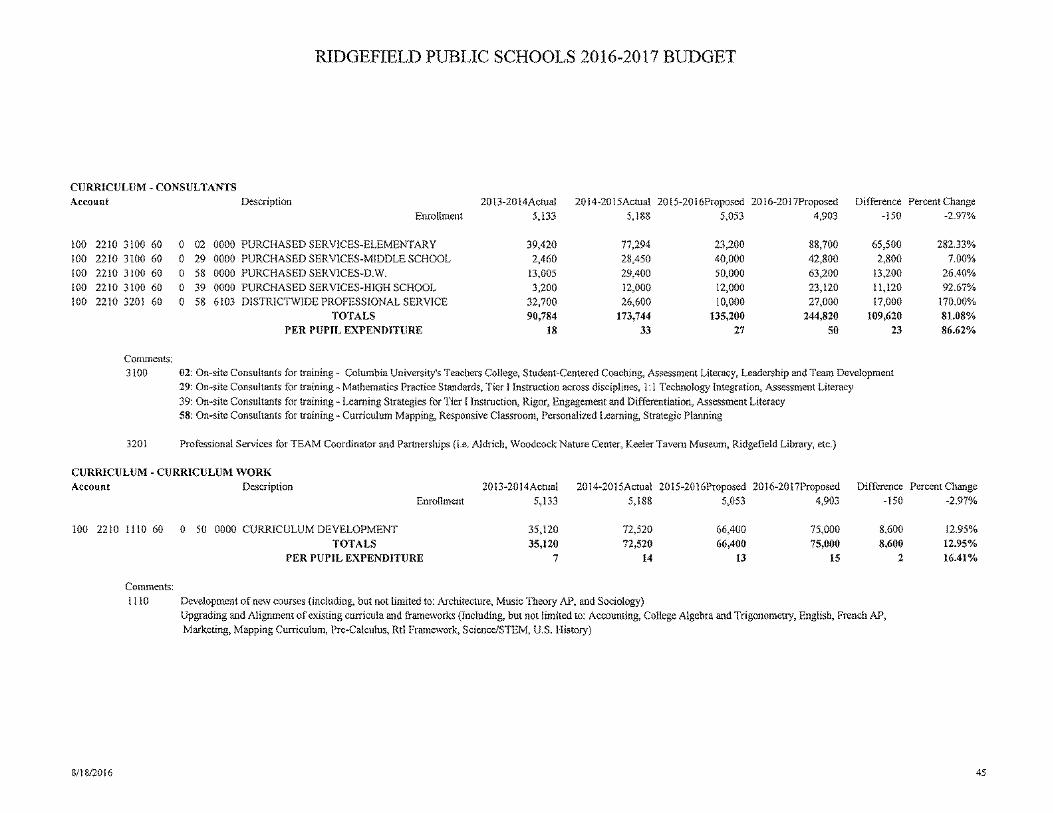
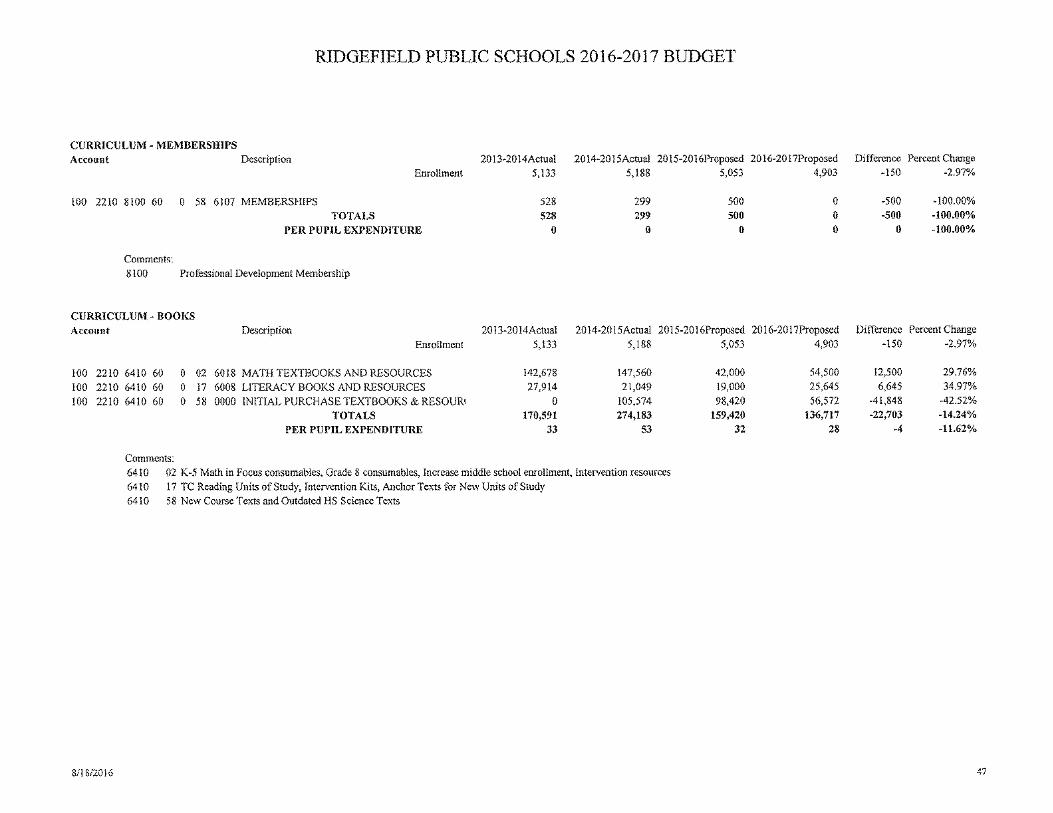
Curriculum & Instruction Student preparedness begins with a core curriculum that includes English/language arts, world languages, the arts, mathematics, science, social studies, physical education, health, and the applied arts. The core curriculum provides the foundation for learning. It must be rigorous, relevant, and accessible to all students. The curriculum projects included for funding ($75,000) in the 2016-17 budget have been thoughtfully selected to ensure readiness of all students. These projects include, but are not limited to:
a. K-12 curriculum digital mapping initiative to provide all RPS teachers with an analytical tool to assist in the improvement of curricula, teaching and learning;
b. Continued revisions of K-12 English and math curricula and programming to further embed Connecticut Core State Standards and the essential competencies and dispositions for students to be future ready;
c. Continued expansion and refinement of K-12 capacity to establish and maintain positive school climates that promote students’ social-emotional development;
d. Prepare for implementation of integrated learning (STEAM) K- 8 through curricula alignment with the Next Generation Science Standards and program development that includes design thinking and innovation across disciplines;
e. Increase access to and enhance the use of data for instructional decision-making to assist in the differentiation and personalization of learning;
f. Enhancements to the library media/technology curriculum to provide greater support for collaboration, information fluency, digital literacy, research and innovation;
g. Expanded use of Columbia University’s Teachers College literacy units of study to continuously advance teacher’s practice and individual student success.

RIDGEFIELD PUBLIC SCHOOLS
17
DESCRIPTION OF BUDGET EXPENDITURES
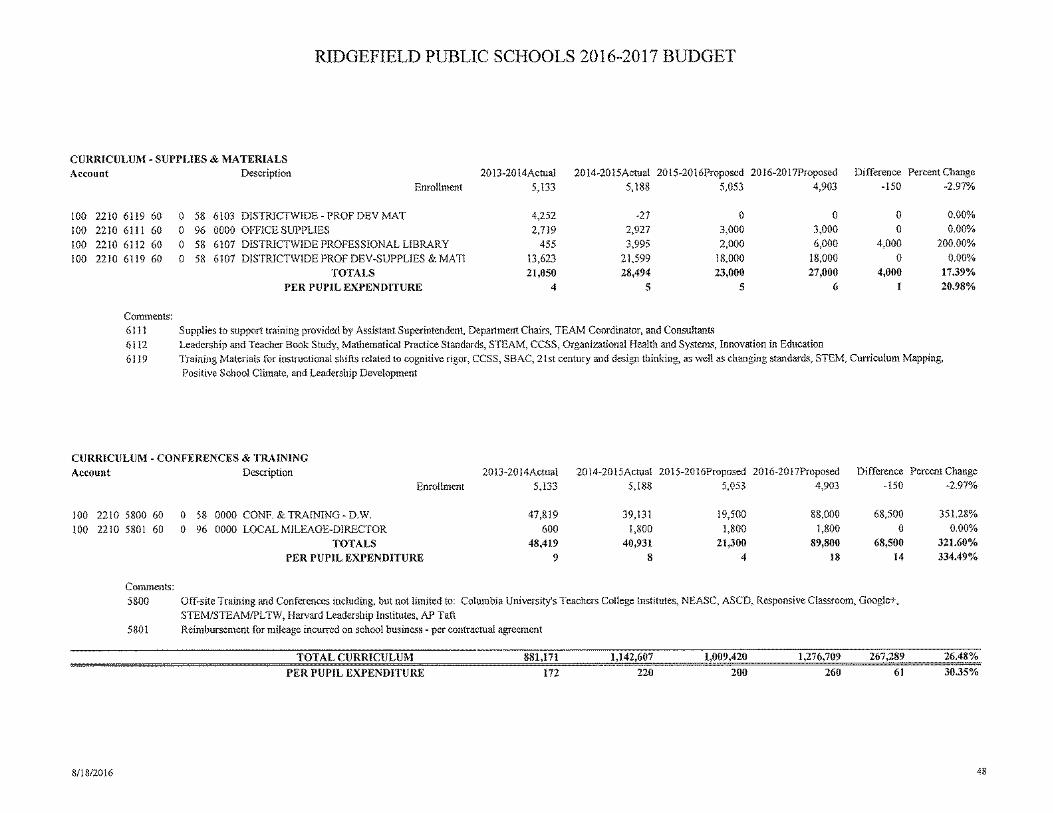
Curriculum Work Expenditures
New RHS Courses: $6,400
Architecture, AP Music Theory, Sociology, Fashion (funded by grant)
Updated RHS Courses, including but not limited to: $24,640
Accounting I & II, Business Concepts, College Algebra & Trig., French AP, Global I & II, Marketing I & II, Percussion, Pre-Calculus, U.S. History Middle School, including but not limited to: $13,680
English, Math, STEAM/Integrated studies, Science, Band & Music
Elementary, including but not limited to: $5,600
Content Area Instruction and Integrated Studies
K – 12 $22,800
Response to Intervention Framework and Curriculum Mapping
TOTAL $73,120
PROFESSIONAL LEARNING To ensure that students accomplish the goals and objectives of a rigorous curriculum, the district professional learning budget supports the corresponding goal of ensuring that Ridgefield employs effective, knowledgeable teachers and leaders that provide an engaging, relevant, challenging, and inspiring learning environment. In addition and pursuant to subsection (b) of Sec. 10-220a of the 2012 Supplement (C.G.S.), the district must provide learning opportunities for professional staff. The term professional learning as outlined within the statute requires a comprehensive, data-based, and intensive approach to improving teachers’ and principals’ effectiveness in raising student achievement.
“Professional development can no longer just be about exposing teachers to a concept or providing basic
knowledge about a teaching methodology. Instead, professional development in an era of accountability requires a change in a teacher’s practice that leads to increases in student learning.”
Teaching the Teachers: Effective Professional Development in an Era of High Stakes Accountability, (hyperlink) September 2013 report from Center for Public Education &National School Boards of Education.
RIDGEFIELD PUBLIC SCHOOLS
18
DESCRIPTION OF BUDGET EXPENDITURES
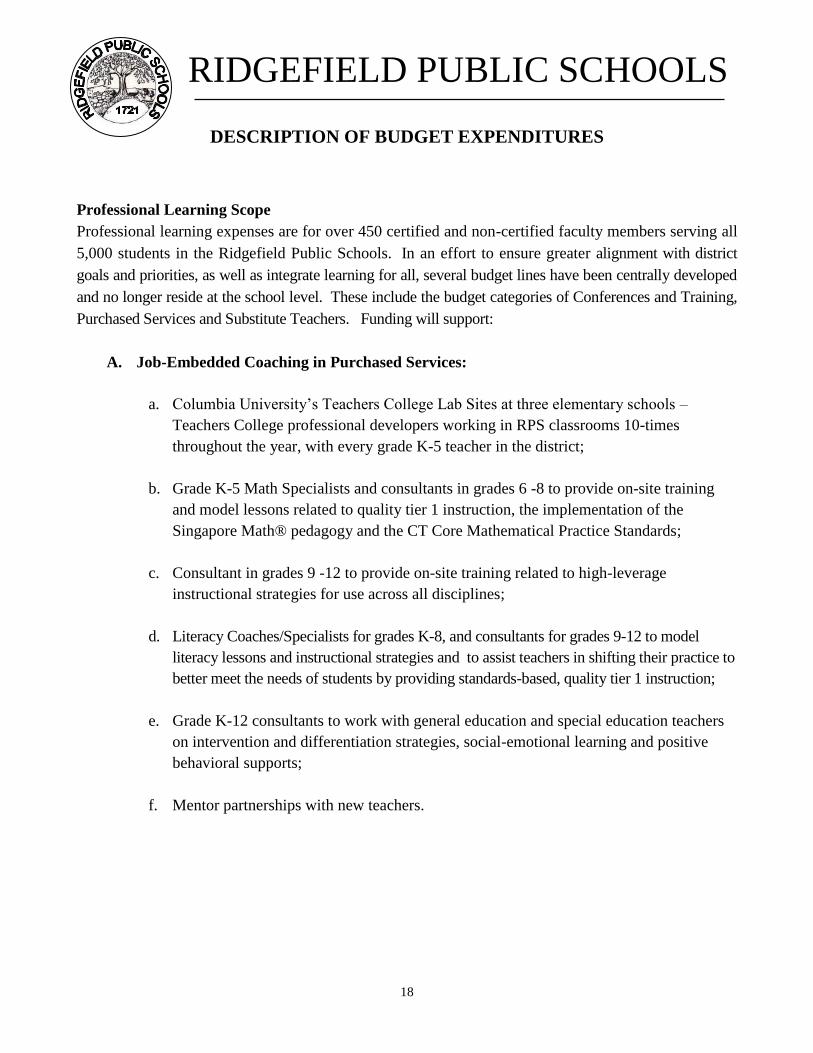
Professional Learning Scope Professional learning expenses are for over 450 certified and non-certified faculty members serving all 5,000 students in the Ridgefield Public Schools. In an effort to ensure greater alignment with district goals and priorities, as well as integrate learning for all, several budget lines have been centrally developed and no longer reside at the school level. These include the budget categories of Conferences and Training, Purchased Services and Substitute Teachers. Funding will support:
A. Job-Embedded Coaching in Purchased Services:
a. Columbia University’s Teachers College Lab Sites at three elementary schools – Teachers College professional developers working in RPS classrooms 10-times throughout the year, with every grade K-5 teacher in the district;
b. Grade K-5 Math Specialists and consultants in grades 6 -8 to provide on-site training
and model lessons related to quality tier 1 instruction, the implementation of the Singapore Math® pedagogy and the CT Core Mathematical Practice Standards;
c. Consultant in grades 9 -12 to provide on-site training related to high-leverage
instructional strategies for use across all disciplines;
d. Literacy Coaches/Specialists for grades K-8, and consultants for grades 9-12 to model literacy lessons and instructional strategies and to assist teachers in shifting their practice to better meet the needs of students by providing standards-based, quality tier 1 instruction;
e. Grade K-12 consultants to work with general education and special education teachers
on intervention and differentiation strategies, social-emotional learning and positive behavioral supports;
f. Mentor partnerships with new teachers.
RIDGEFIELD PUBLIC SCHOOLS
19
DESCRIPTION OF BUDGET EXPENDITURES
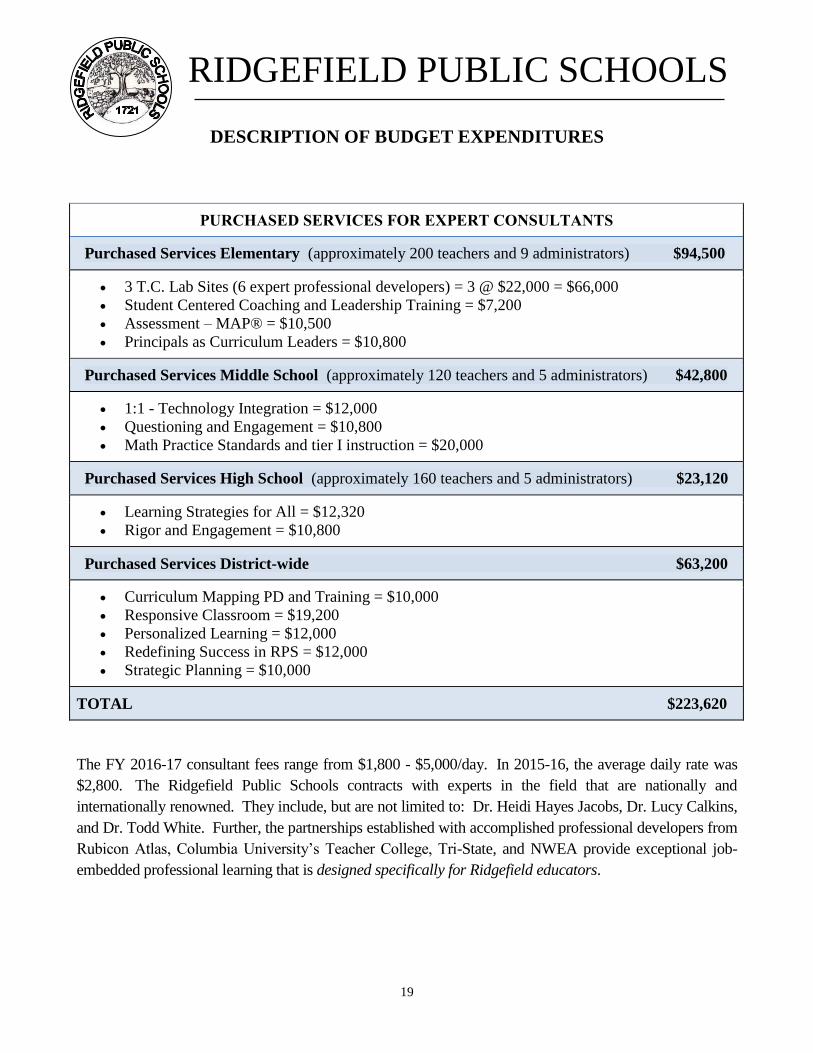
PURCHASED SERVICES FOR EXPERT CONSULTANTS
Purchased Services Elementary (approximately 200 teachers and 9 administrators) $94,500
3 T.C. Lab Sites (6 expert professional developers) = 3 @ $22,000 = $66,000 Student Centered Coaching and Leadership Training = $7,200 Assessment – MAP® = $10,500 Principals as Curriculum Leaders = $10,800
Purchased Services Middle School (approximately 120 teachers and 5 administrators) $42,800
1:1 - Technology Integration = $12,000 Questioning and Engagement = $10,800 Math Practice Standards and tier I instruction = $20,000
Purchased Services High School (approximately 160 teachers and 5 administrators) $23,120
Learning Strategies for All = $12,320 Rigor and Engagement = $10,800
Purchased Services District-wide $63,200
Curriculum Mapping PD and Training = $10,000 Responsive Classroom = $19,200 Personalized Learning = $12,000 Redefining Success in RPS = $12,000 Strategic Planning = $10,000
TOTAL $223,620
The FY 2016-17 consultant fees range from $1,800 - $5,000/day. In 2015-16, the average daily rate was $2,800. The Ridgefield Public Schools contracts with experts in the field that are nationally and internationally renowned. They include, but are not limited to: Dr. Heidi Hayes Jacobs, Dr. Lucy Calkins, and Dr. Todd White. Further, the partnerships established with accomplished professional developers from Rubicon Atlas, Columbia University’s Teacher College, Tri-State, and NWEA provide exceptional job-embedded professional learning that is designed specifically for Ridgefield educators.
RIDGEFIELD PUBLIC SCHOOLS
20
DESCRIPTION OF BUDGET EXPENDITURES
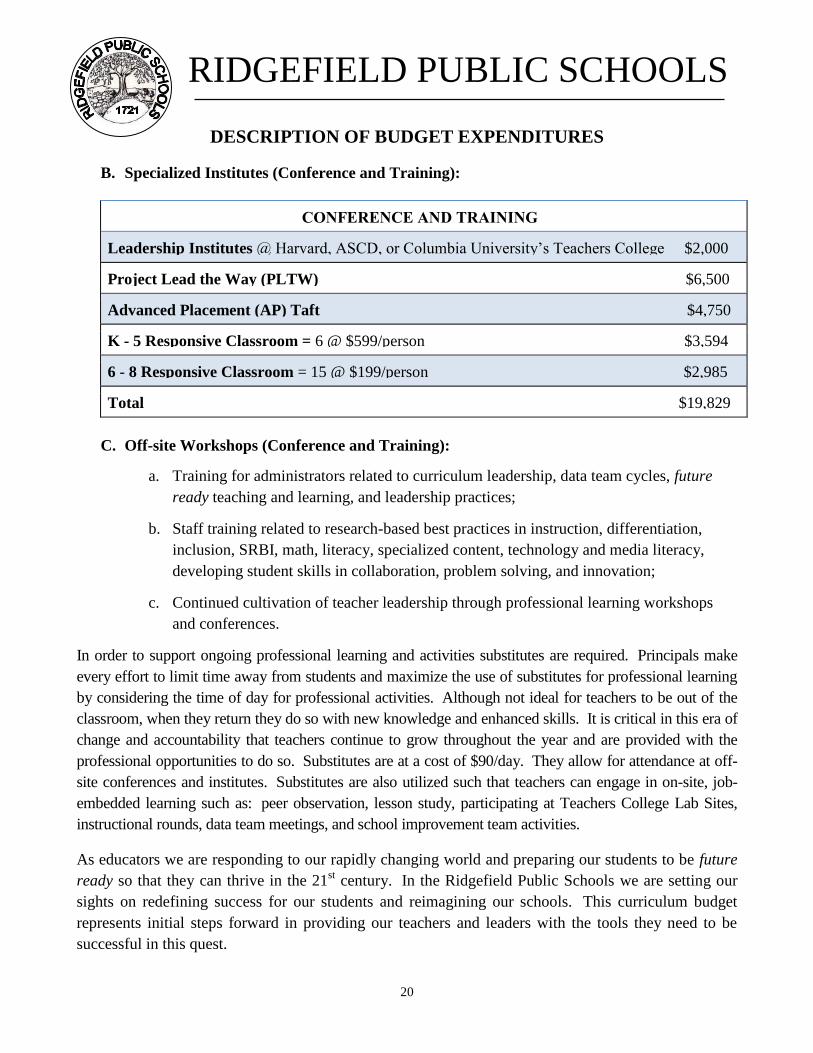
B. Specialized Institutes (Conference and Training):
CONFERENCE AND TRAINING
Leadership Institutes @ Harvard, ASCD, or Columbia University’s Teachers College $2,000
Project Lead the Way (PLTW) $6,500
Advanced Placement (AP) Taft $4,750
K - 5 Responsive Classroom = 6 @ $599/person $3,594
6 - 8 Responsive Classroom = 15 @ $199/person $2,985
Total $19,829
C. Off-site Workshops (Conference and Training):
a. Training for administrators related to curriculum leadership, data team cycles, future ready teaching and learning, and leadership practices;
b. Staff training related to research-based best practices in instruction, differentiation, inclusion, SRBI, math, literacy, specialized content, technology and media literacy, developing student skills in collaboration, problem solving, and innovation;
c. Continued cultivation of teacher leadership through professional learning workshops and conferences.
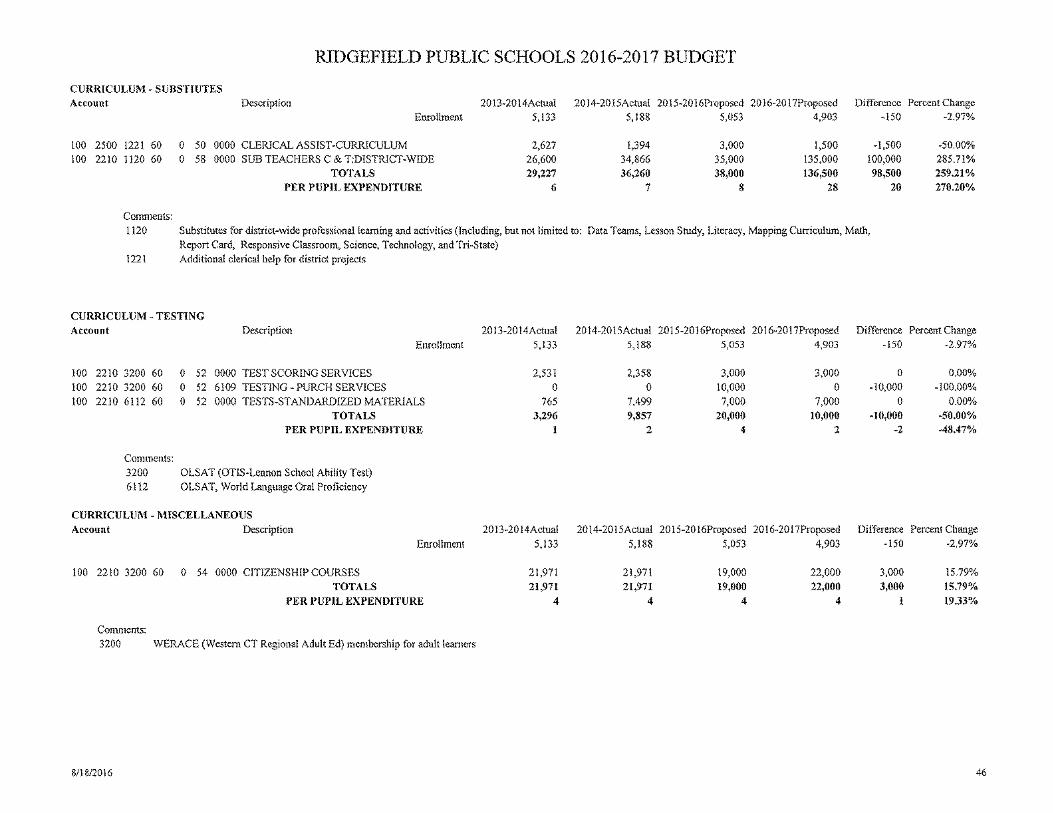
In order to support ongoing professional learning and activities substitutes are required. Principals make every effort to limit time away from students and maximize the use of substitutes for professional learning by considering the time of day for professional activities. Although not ideal for teachers to be out of the classroom, when they return they do so with new knowledge and enhanced skills. It is critical in this era of change and accountability that teachers continue to grow throughout the year and are provided with the professional opportunities to do so. Substitutes are at a cost of $90/day. They allow for attendance at off-site conferences and institutes. Substitutes are also utilized such that teachers can engage in on-site, job-embedded learning such as: peer observation, lesson study, participating at Teachers College Lab Sites, instructional rounds, data team meetings, and school improvement team activities.
As educators we are responding to our rapidly changing world and preparing our students to be future ready so that they can thrive in the 21st century. In the Ridgefield Public Schools we are setting our sights on redefining success for our students and reimagining our schools. This curriculum budget represents initial steps forward in providing our teachers and leaders with the tools they need to be successful in this quest.
RIDGEFIELD PUBLIC SCHOOLS
21
DESCRIPTION OF BUDGET EXPENDITURES
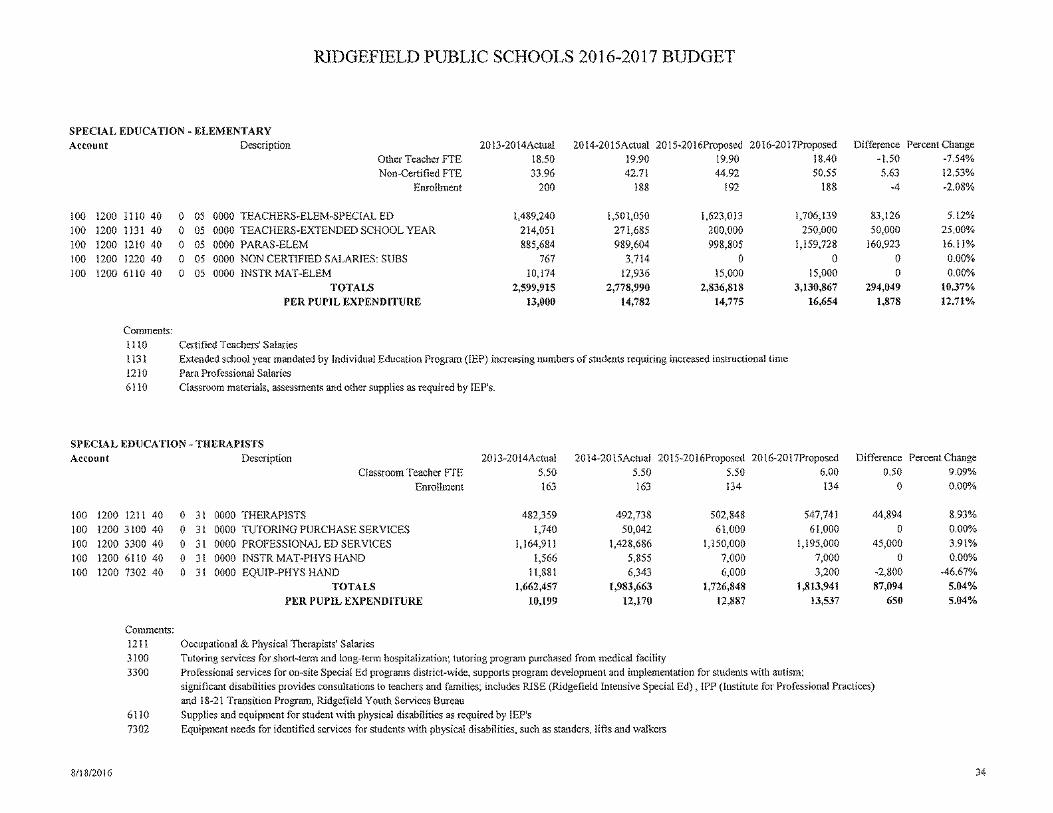
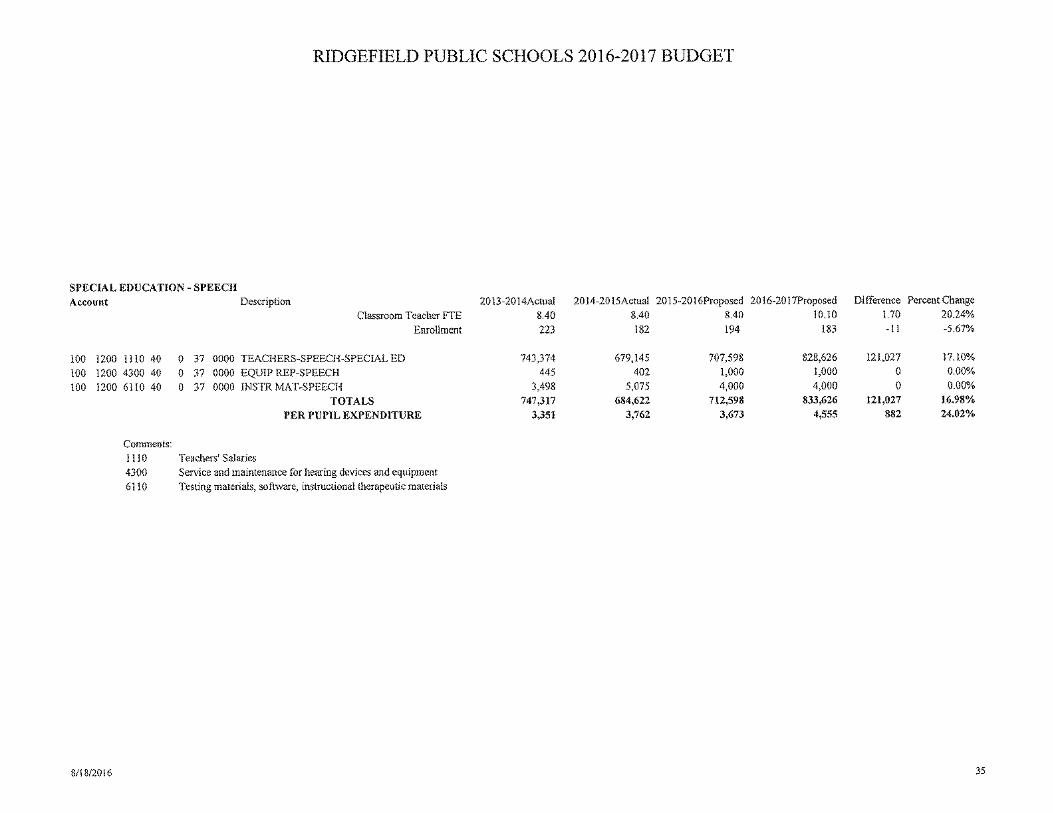
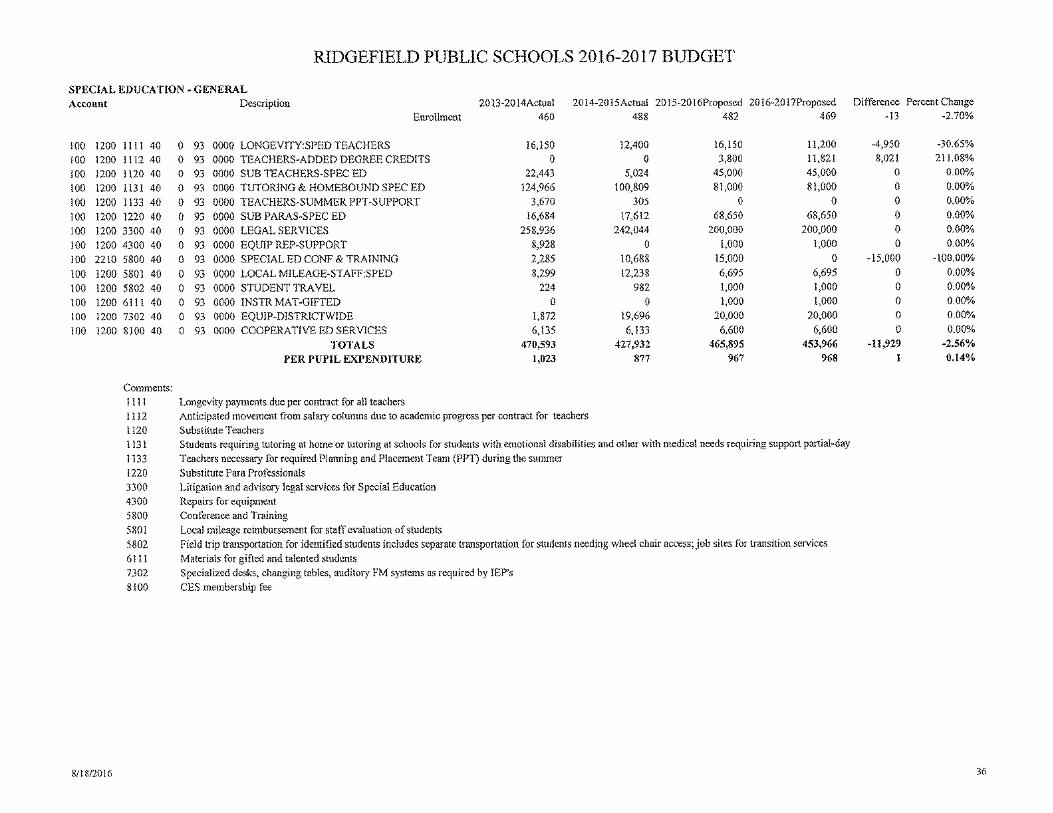
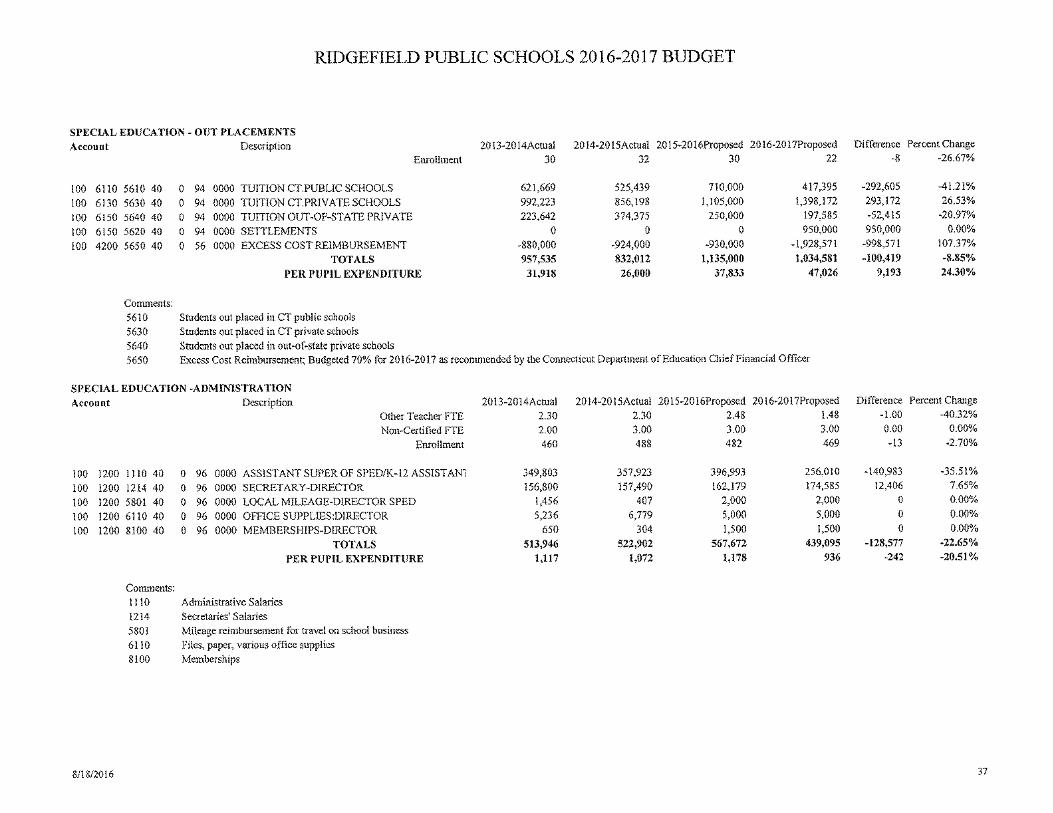
SPECIAL EDUCATION Tuition Services
The money allocated to these budget codes are used to fund out-of-district tuitions for students with special needs who require that their programs and services be provided in a setting other than the Ridgefield Public Schools. These tuitions encompass public approved programs within the state i.e. the Regional Education Service Centers (RESC) and private approved programs both in state and out of state. For the 2016-17 school year, the majority of these services will be provided at approved private schools resulting in an increase of 26.53% in this line item. Seventeen students are projected to receive their programs and services at these schools.
At the same time, this shift in program placement from public to private will result in a decrease of 41.21% in the CT Public Schools line items and a decrease of 20.97% in the out-of-state program line item. For the 2016-17 school year, we are projecting that seven students will be enrolled in CT Public schools and two students will be enrolled in out-of-state programs. Using current information, these requests accurately reflect the program placements and costs for students who require these services.
Excess Cost Reimbursement
The state of Connecticut provides for school districts to request and receive funding for students whose educational costs exceed 4.5 times the per pupil district cost. Excess costs are determined by including all aspects of a student’s program including time with teaching staff, consultants, tuitions, transportation, extended school year services, therapies etc. where applicable. While the state should pay 100% of the costs requested it has only done so once since ECRs inception. Ridgefield’s 2015-16 per pupil cost of $16,523.13 required that it spend $74,354 before it was eligible for excess cost monies.
For the 2016-17 school year, we are projecting that we will receive 75% of our excess costs resulting in a $1,928,571 offset to the special education budget. This projection is based upon current knowledge of our students, programs and the costs associated and includes students whose programs and services meet the threshold. It is expected that 71 students both in and out of district will meet the threshold amount.
Settlements
For the 2016-17 school year, we added a line item for costs associated with settlement agreements. Previously, these costs were included in the tuition line items. IDEA mandates that parents have the right to file for a due process hearing or mediation. Settlements are the result of the parents’
disagreement with student placement, progress or services. In Connecticut, the Burden of Proof in these cases falls on the public schools. Connecticut is just one of four states in the country that have the Burden of Proof placed on the school district. We are projecting that there will be twenty settlement agreements for the 2016-17 school year which includes those that were two-year agreements.

RIDGEFIELD PUBLIC SCHOOLS
22
DESCRIPTION OF BUDGET EXPENDITURES
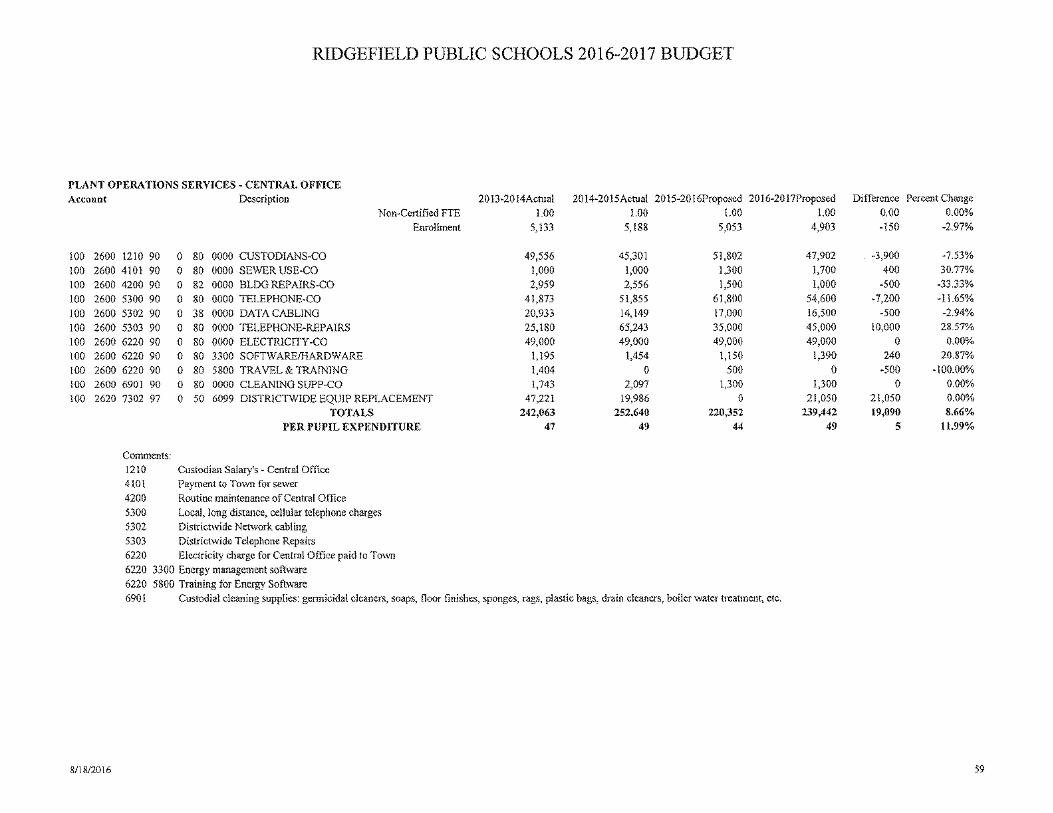
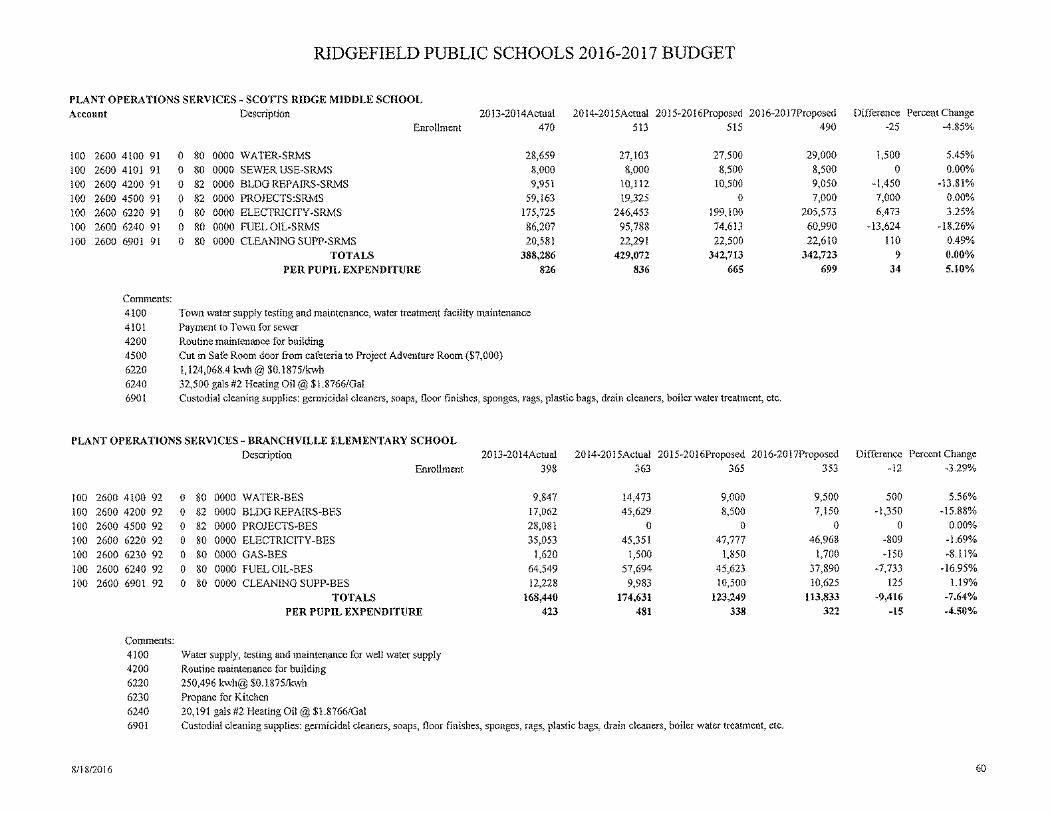
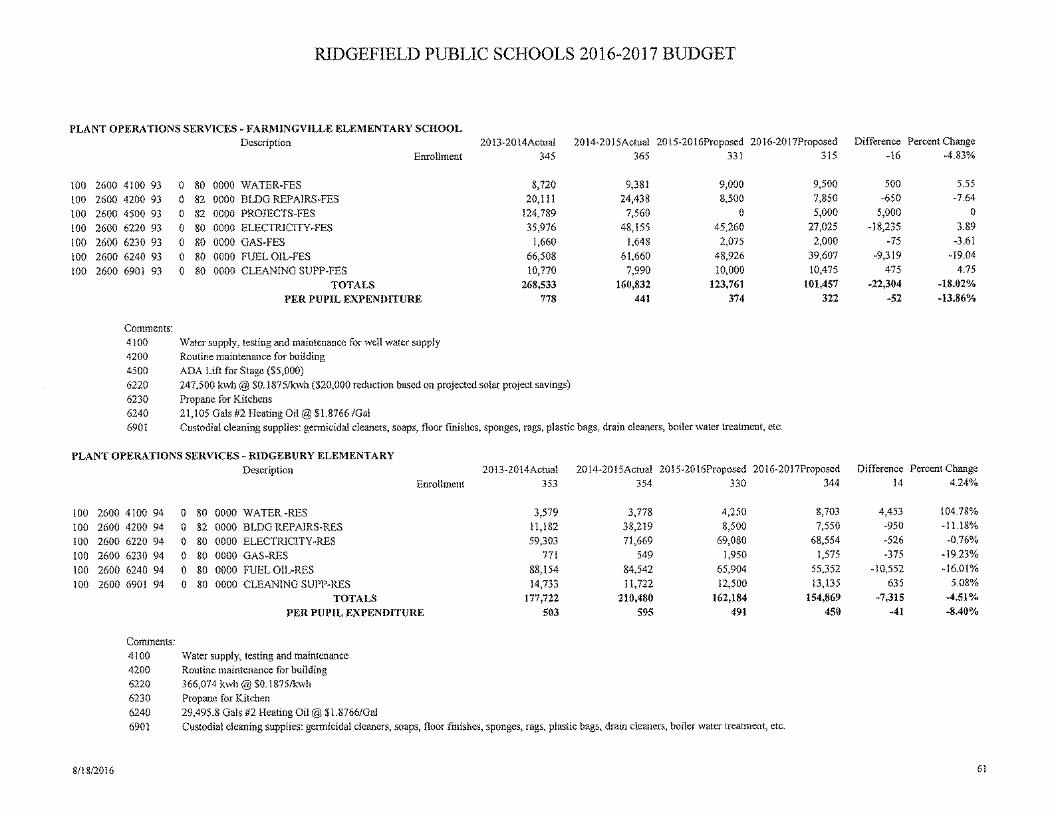
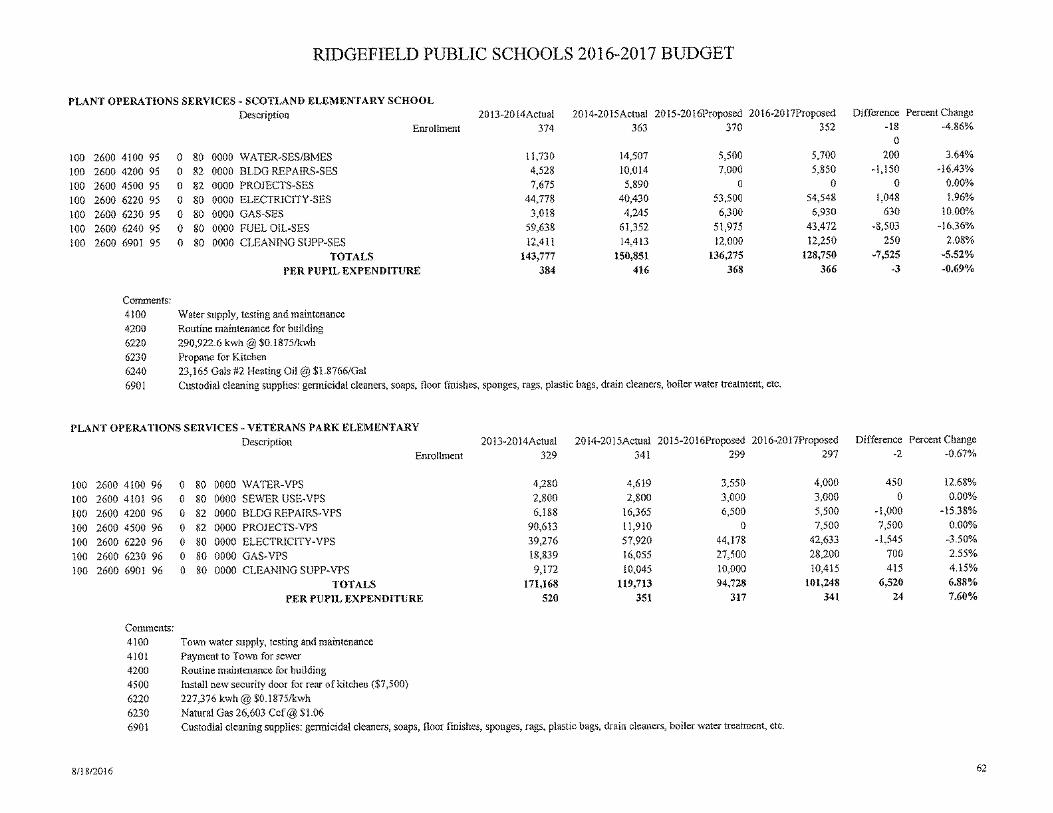
PLANT OPERATIONS & CAPITAL IMPROVEMENTS The Plant Operations group for the Ridgefield Public Schools is responsible for the daily operational management of approximately 1.1 million square feet of physical property encompassing nine (9) schools; the Alternative High School; the Tiger Hollow Sports Pavilion; RHS and SRMS water treatment facility; and a number of critical building infrastructure systems.
The Plant Operations group operates under a strong blended service-delivery model of in-house services, contracted services, and external resources. Within the framework of our in-house service model, there are 44 custodians, 1 groundskeeper, 5 building-based general maintenance mechanics, and 3 licensed trade specialists (2 HVAC, 1 Electrician/Foreman).
Each year, approximately 1,800 work orders of varying scope are processed through our balanced maintenance approach of utilizing in-house maintenance and contracted services. In total, approximately 75% of the work orders are completed in-house and the remaining 25% are assigned to various external resources. In addition, the facilities maintenance group provides an ongoing proactive preventative and demand-maintenance program that is aimed at enhancing operational efficiencies and effectiveness throughout the district.
The hard work and dedication of our custodial staff is evident throughout the district as our facilities continue to offer a clean, healthy, and safe learning and teaching environment for all students and staff, along with all the outside groups and functions that utilize our buildings throughout the school year.
The FY 2016-17 Plant Operations budget of $7,892,987 reflects a responsive balance between managing cost-effective operating needs and activity-driven maintenance issues without compromising our overall approach to the district’s emergent and routine maintenance needs. The centerpiece of the FY 2016-17 budget is grounded in the recalibration of a number of maintenance spending accounts. This centralized oversight is aimed at achieving a more centralized accounting and management of those accounts; affording us greater manageability, as well as opportunities for additional cost savings. The entire budget was realigned to better direct our resources to the appropriate accounts and activities.
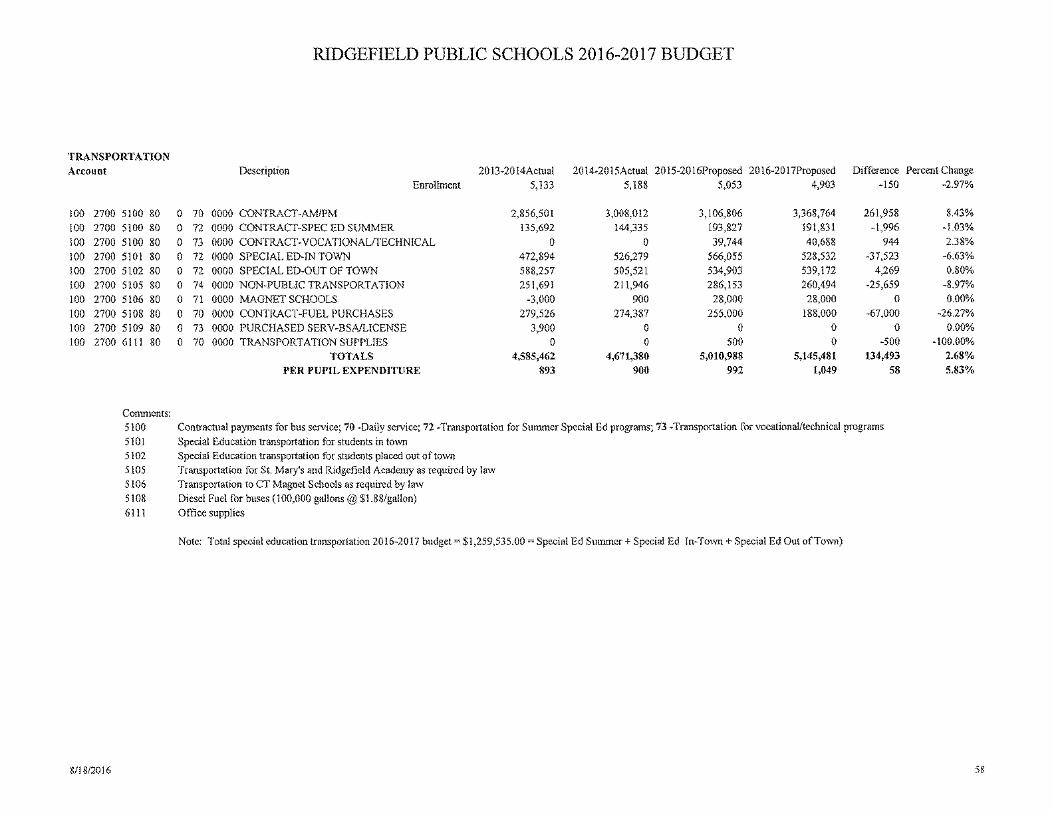
As in years past, the main drivers continue to be energy costs, school security, school-specific projects, and personnel costs. Heating Oil
Despite the volatility of fuel prices experienced in previous years, the district took advantage of an early oil bid and downward trending of oil pricing to capture a significant savings of $85,012 over the FY 2015-16 budget. We have contracted and budgeted our gallons for the entire FY 2016-17 heating season.
RIDGEFIELD PUBLIC SCHOOLS
23
DESCRIPTION OF BUDGET EXPENDITURES
Electricity After withstanding the momentary spike in electricity generation rates that we experienced at the end the district’s 3-year contract with Constellation Energy in December 2014, we took advantage of a dip in the generation market in early 2015 to capture savings in our generation rates through the remainder of the 2014-15 school year. That momentum has carried through to the FY 2015-16 budget with an even more favorable outlook for the FY 2016-17 budget cycle.
At present, we are tracking generation rates that should bring us back to pre-2014 rates. For the FY 2016-17 budget, the total electricity rate (generation and distribution) is calculated out at $0.19/kilowatt hour. Combined with some corrective measures applied to a few school accounts and the addition of the Tiger Hollow II lighting, the FY 2016-17 electricity budget is $1,286,451; reflecting an overall decrease of $64,450 (5.01%).
The estimated savings numbers associated with the RHS energy capital project completed in October 2015 are slowly coming in. The warmer than usual December and January temperatures have skewed those numbers against what was originally forecasted for the usage data from previous years. We will continue to monitor those numbers as well as the electricity generation market to capture as much savings as possible.
Security The safety and security of the school community is the priority of the district leadership and the Board. The school security accounts encompass the contracted services provided by Securitas, the two (2) Ridgefield Police Department School Resource Officers, and a security supplies account. As part of the budget realignment – the security supplies account was taken out of the Building Security object to gain better accountability and tracking of expenditures.
For the FY 2016-17 budget – the Securitas contract, which includes the security guard staffing at each school’s entrance, as well as the additional night guard at RHS, resides solely in the Contract.
Services – Building Security object. The account was reduced by $15,000 to reflect the realignment of the security supplies expenditures. The School Resource Officers object, which was moved over to Plant Operations in the 2014-15 budget cycle, will remain flat against the 2015-16 budget at $328,620.
School Projects The FY 2016-17 budget shows an increase of $80,800 against the FY 2015-16 budget cycle’s $0.00.
The projects that were originally scheduled for the 2015-16 school year were removed from the FY 2015-16 budget and completed over the summer of 2015 with year-end funding. For the FY 2016-17 budget cycle there are eight (8) projects scheduled for five (5) schools totaling $80,800. These can be found in the following table.

RIDGEFIELD PUBLIC SCHOOLS
24
DESCRIPTION OF BUDGET EXPENDITURES
SCHOOL-SPECIFIC PROJECTS
RHS Repair membrane roof on Water Treatment plant $5,000
Repair water damaged gym floor $7,800
Final phase of window AC installations $25,000
ERMS Ceiling fans for gymnasium $15,000
Replace security gates for cafeteria server line $8,500
VPES Install new security door for kitchen rear delivery door $7,500
FES ADA stage lift (portable) $5,000
SRMS Cut door in back wall of cafeteria to create egress into Project Adventure room $7,000
Projects (Total) $80,800
FIVE-YEAR CAPITAL IMPROVEMENT PLAN (2016-21 CIP) FY 2016-17 Projects ($2,040,099) – approved by Board of Education 12/14/2015
The Ridgefield Public Schools’ Capital Improvement Plan (CIP) remains a dynamic five-year planning schedule of projects that identifies, evaluates, and advocates the immediate and long-term needs associated with the improvement, replacement, renewal, and/or upgrade of district capital assets. The Capital Improvement Plan (CIP) is intended to serve as decision information structured to present a meaningful, long-range planning perspective to ensure the efficient operations of the Ridgefield Public Schools’ facilities and infrastructure.
As a planning document, the Capital Improvement Plan (CIP) offers a systemic approach to respond to critical operating infrastructure replacements/upgrades, as well as meet the demands of aging equipment and designated facilities improvements. The CIP continues to be an effective tool that benefits our stakeholders by identifying those projects essential to preserving and supporting the district’s safety
mandates, aging facilities and technology infrastructures, and continuity of school operations.
The district’s five-year CIP is reviewed and updated annually to reflect changes in priorities and to extend the plan an additional year. A critical element of the CIP is to provide a five-year road map that typically contains long-term assets and project values in excess of $50,000 each. Capital assets associated with the District’s operating infrastructure typically carry an anticipated useful life-cycle of
RIDGEFIELD PUBLIC SCHOOLS
25
DESCRIPTION OF BUDGET EXPENDITURES
five to ten years. As in past years, the goal of the CIP is to properly balance expenditures over the full five-years by maintaining an expenditure range of approximately $1.5M to $2M per year districtwide. The planning horizon for this CIP spans the fiscal school years 2016 through 2021. It encompasses a total of thirty seven projects with an estimated total expenditure forecast of $10,128,282 over the next five years, with $2,040,099 of capital projects scheduled for the 2016/17 school year. This year’s CIP process has generated twelve projects for the 2016-17 school year that will address:
the continuation of a three-year comprehensive energy project $355,282*
the district-wide radio communication project $453,886*
the replacement of the high school’s auditorium/stage lighting controls $91,406
the relining of the high school’s main building waste line $125,000
the District’s wireless network reliability project $85,000
the initial phase of the IT infrastructure replacement program $285,000
the fit-out of current library spaces to media center-learning commons models $90,000
additional surveillance cameras for the interiors of elementary schools $65,000
intrusion resistant window film for the entranceways of all schools $90,000
additional access control proximity readers and peripherals at all schools $65,000
asbestos abatement project for Scotland Elementary School $115,000
universal-access playground at Barlow & Ridgebury Elementary Schools $219,525
The first two items on this list totaling $809,168 were forwarded by the Board of Selectmen and the Board of Finance for subsequent voter approval.
Ridgefield Public Schools
Board of Education FY 2016-17 Operating Budget
May 2, 2016
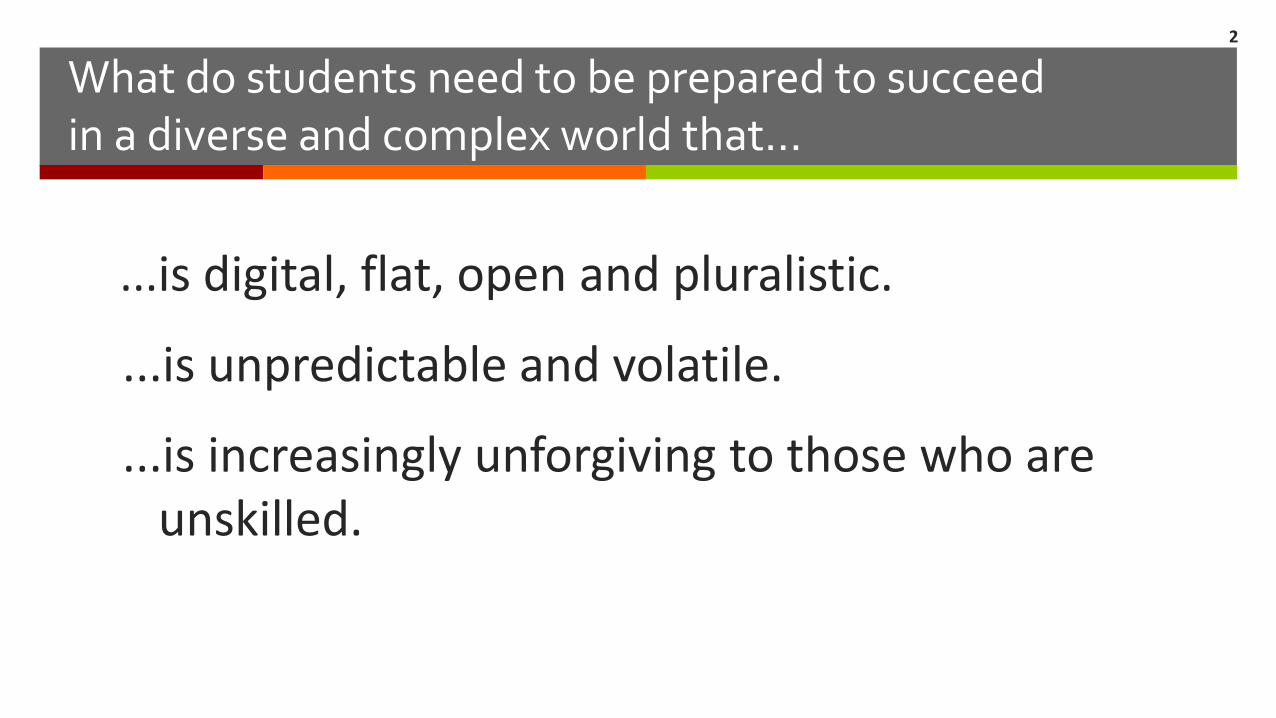
What do students need to be prepared to succeed in a diverse and complex world that…
...is digital, flat, open and pluralistic.
...is unpredictable and volatile.
...is increasingly unforgiving to those who are unskilled.
2
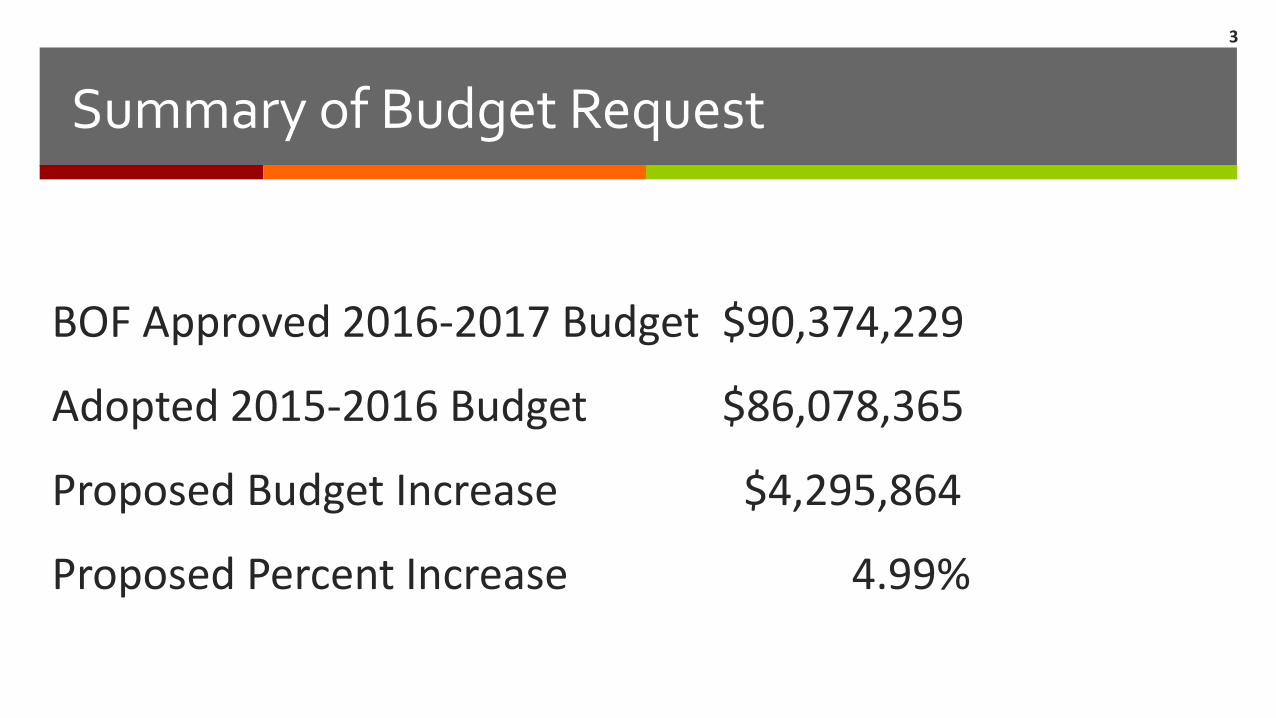
Summary of Budget Request
BOF Approved 2016-2017 Budget $90,374,229
Adopted 2015-2016 Budget $86,078,365
Proposed Budget Increase $4,295,864
Proposed Percent Increase 4.99%
3

Updated Budget Request 5/1/2016
BOE Adopted 2016-2017 Budget $90,999,229
BOF reductions (3/6/16) $ 625,000
3/7/2016 BOE 2016-2017 Budget $90,374,229
Proposed Budget Increase $ 4,295,864
Proposed Percent Increase 4.99%
4
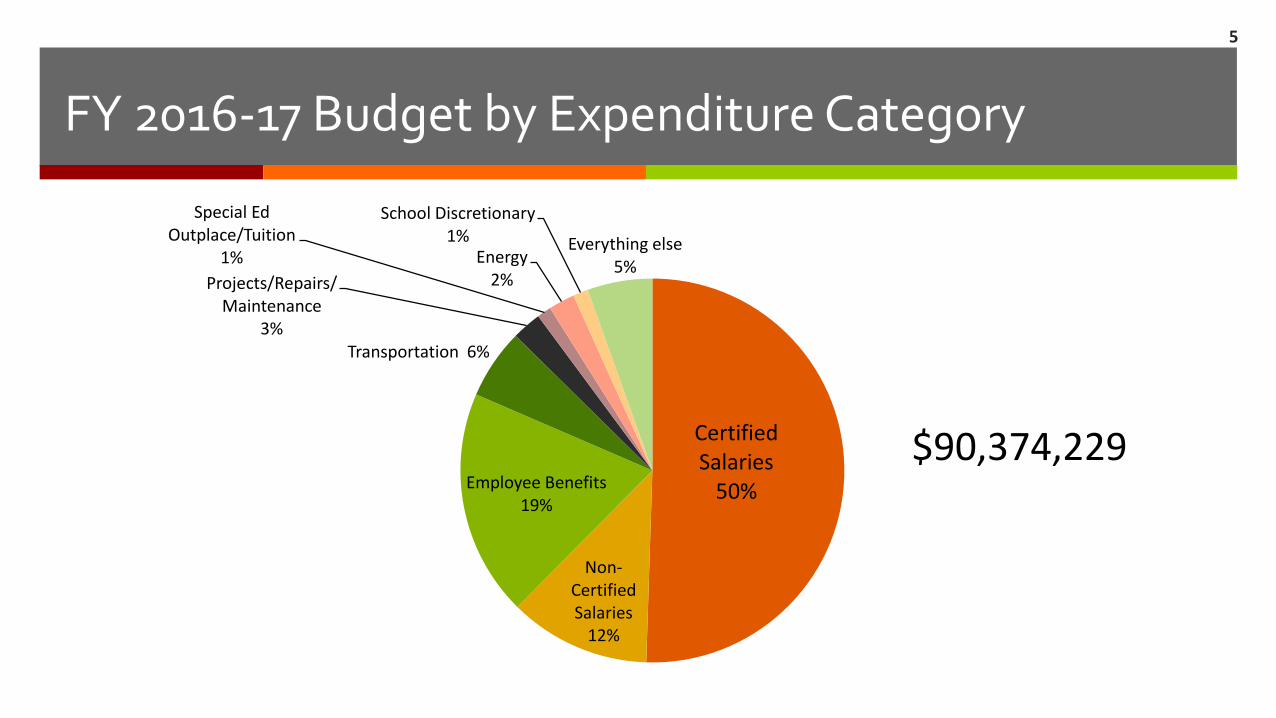
FY 2016-17 Budget by Expenditure Category
Certified Salaries
50%
Non-Certified Salaries
12%
Employee Benefits 19%
Transportation 6%
Projects/Repairs/ Maintenance
3%
Special Ed Outplace/Tuition
1% Energy 2%
School Discretionary 1% Everything else
5%
5
$90,374,229
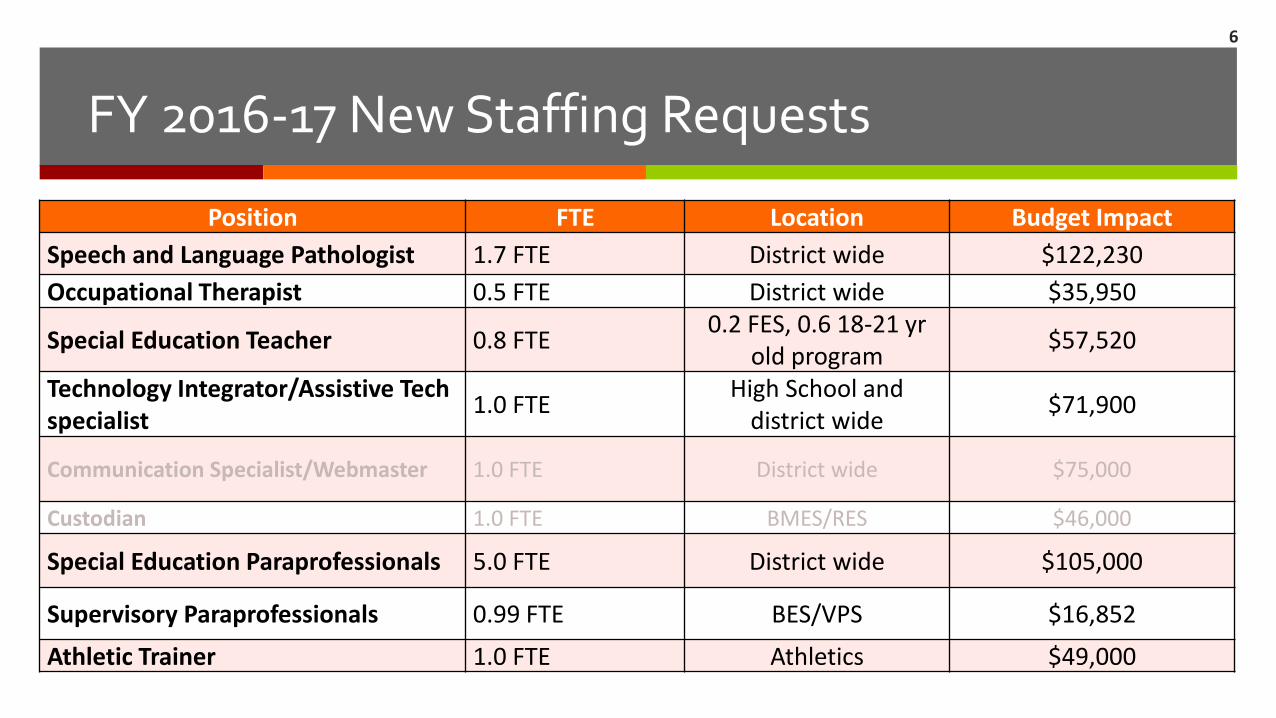
FY 2016-17 New Staffing Requests
Position FTE Location Budget Impact Speech and Language Pathologist 1.7 FTE District wide $122,230 Occupational Therapist 0.5 FTE District wide $35,950
Special Education Teacher 0.8 FTE 0.2 FES, 0.6 18-21 yr
old program $57,520
Technology Integrator/Assistive Tech specialist
1.0 FTE High School and
district wide $71,900
Communication Specialist/Webmaster 1.0 FTE District wide $75,000
Custodian 1.0 FTE BMES/RES $46,000
Special Education Paraprofessionals 5.0 FTE District wide $105,000
Supervisory Paraprofessionals 0.99 FTE BES/VPS $16,852
Athletic Trainer 1.0 FTE Athletics $49,000
6
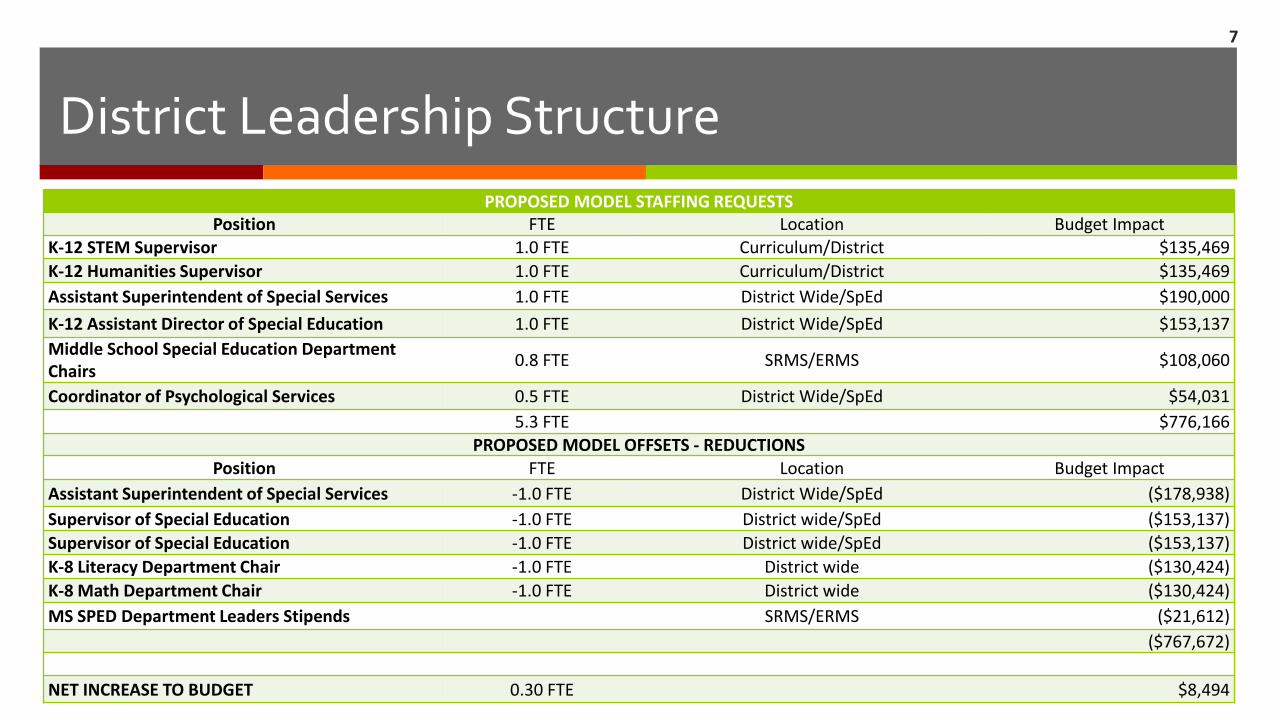
District Leadership Structure
PROPOSED MODEL STAFFING REQUESTS Position FTE Location Budget Impact
K-12 STEM Supervisor 1.0 FTE Curriculum/District $135,469
K-12 Humanities Supervisor 1.0 FTE Curriculum/District $135,469
Assistant Superintendent of Special Services 1.0 FTE District Wide/SpEd $190,000
K-12 Assistant Director of Special Education 1.0 FTE District Wide/SpEd $153,137
Middle School Special Education Department Chairs
0.8 FTE SRMS/ERMS $108,060
Coordinator of Psychological Services 0.5 FTE District Wide/SpEd $54,031
5.3 FTE $776,166 PROPOSED MODEL OFFSETS - REDUCTIONS
Position FTE Location Budget Impact
Assistant Superintendent of Special Services -1.0 FTE District Wide/SpEd ($178,938)
Supervisor of Special Education -1.0 FTE District wide/SpEd ($153,137)
Supervisor of Special Education -1.0 FTE District wide/SpEd ($153,137)
K-8 Literacy Department Chair -1.0 FTE District wide ($130,424)
K-8 Math Department Chair -1.0 FTE District wide ($130,424)
MS SPED Department Leaders Stipends SRMS/ERMS ($21,612)
($767,672)
NET INCREASE TO BUDGET 0.30 FTE $8,494
7
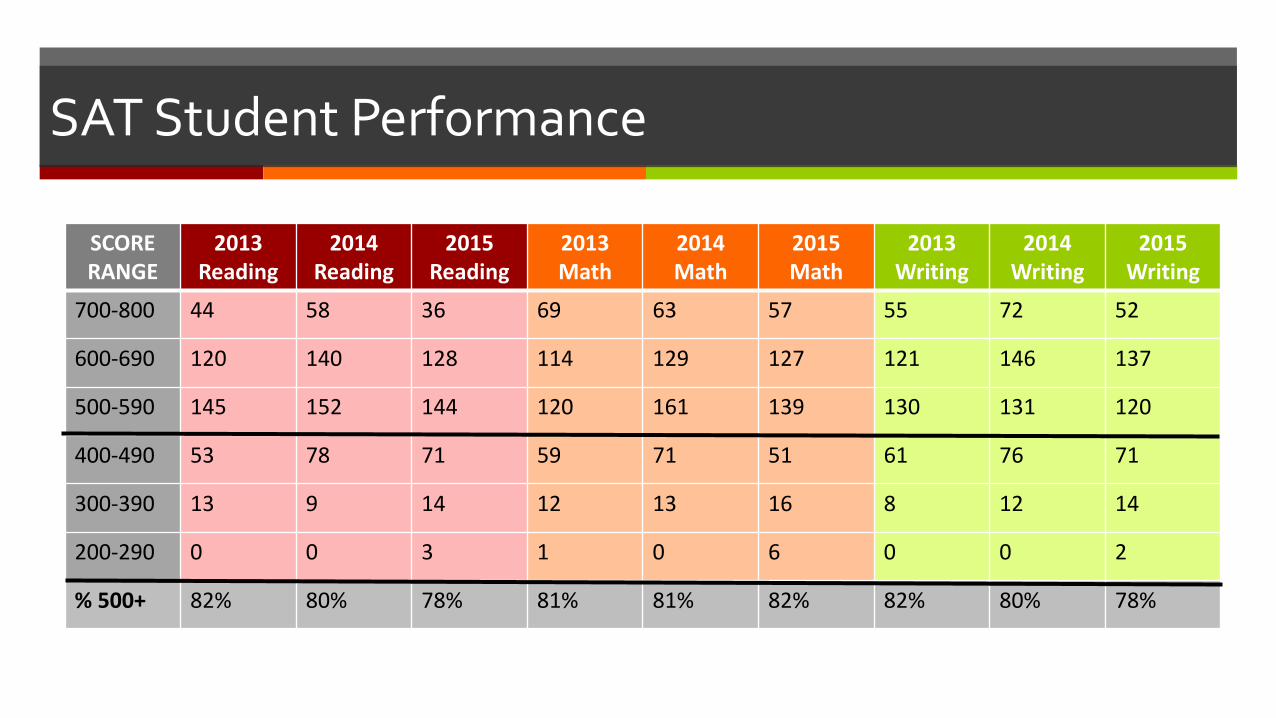
SAT Student Performance
SCORE RANGE
2013 Reading
2014 Reading
2015 Reading
2013 Math
2014 Math
2015 Math
2013 Writing
2014 Writing
2015 Writing
700-800 44 58 36 69 63 57 55 72 52
600-690 120 140 128 114 129 127 121 146 137
500-590 145 152 144 120 161 139 130 131 120
400-490 53 78 71 59 71 51 61 76 71
300-390 13 9 14 12 13 16 8 12 14
200-290 0 0 3 1 0 6 0 0 2
% 500+ 82% 80% 78% 81% 81% 82% 82% 80% 78%

2015 SAT RESULTS – DRG A Comparison
Reading Writing Math
598- Darien 602- Darien 611- Darien
591- Wilton 594- New Canaan 609- New Canaan
589- Weston 594- Wilton 604- Weston
585- Westport 592- Weston 596- Wilton
582- New Canaan 589- Westport 589- Westport
571- RIDGEFIELD 578- RIDGEFIELD 580- RIDGEFIELD
561- Region 9 561- Region 9 567- Region 9
2015 DRG Average 582 587 594
2014 DRG Average 584 593 593
9
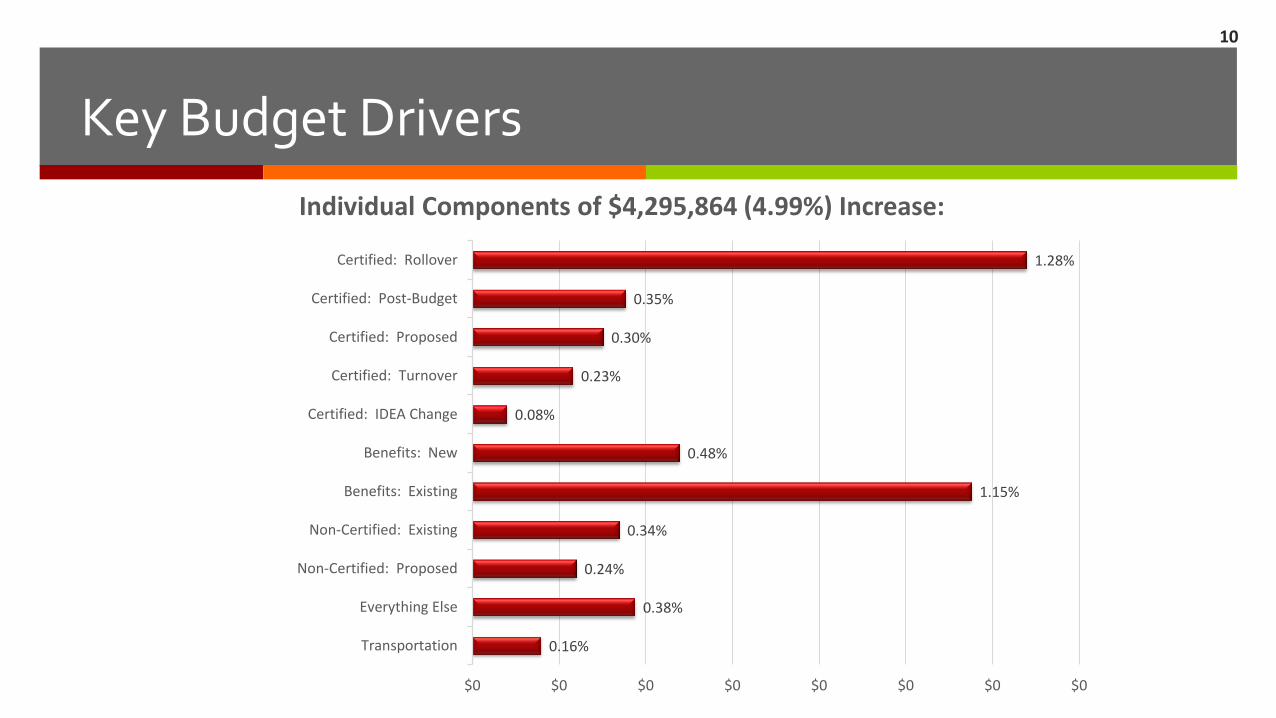
Key Budget Drivers
0.16%
0.38%
0.24%
0.34%
1.15%
0.48%
0.08%
0.23%
0.30%
0.35%
1.28%
$0 $0 $0 $0 $0 $0 $0 $0
Transportation
Everything Else
Non-Certified: Proposed
Non-Certified: Existing
Benefits: Existing
Benefits: New
Certified: IDEA Change
Certified: Turnover
Certified: Proposed
Certified: Post-Budget
Certified: Rollover
Individual Components of $4,295,864 (4.99%) Increase:
10
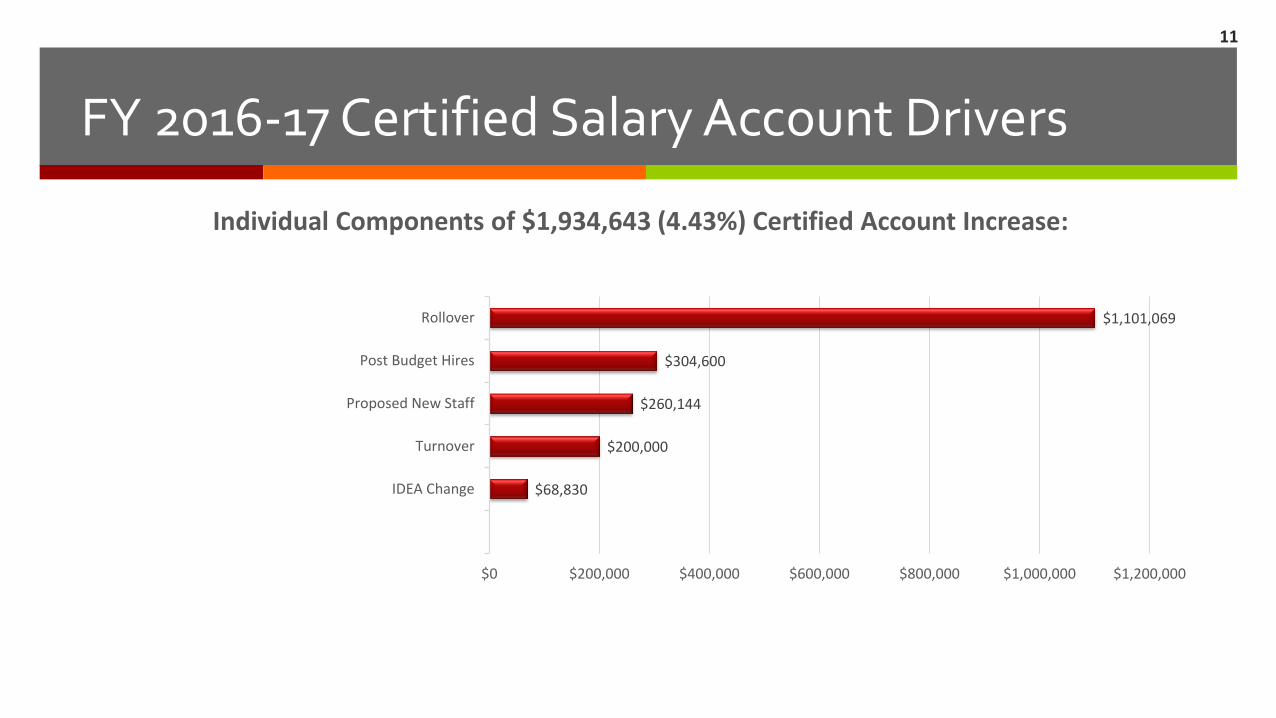
FY 2016-17 Certified Salary Account Drivers
$68,830
$200,000
$260,144
$304,600
$1,101,069
$0 $200,000 $400,000 $600,000 $800,000 $1,000,000 $1,200,000
IDEA Change
Turnover
Proposed New Staff
Post Budget Hires
Rollover
Individual Components of $1,934,643 (4.43%) Certified Account Increase:
11

Achieving Operational Efficiencies
Technology Subscriptions: $ 46,295
Energy Capital Projects RHS $ 44,461
Staffing (K-5) 6.0 FTE Reduction $427,740
Total “Savings” $518,496 = 0.57% of Budget Request
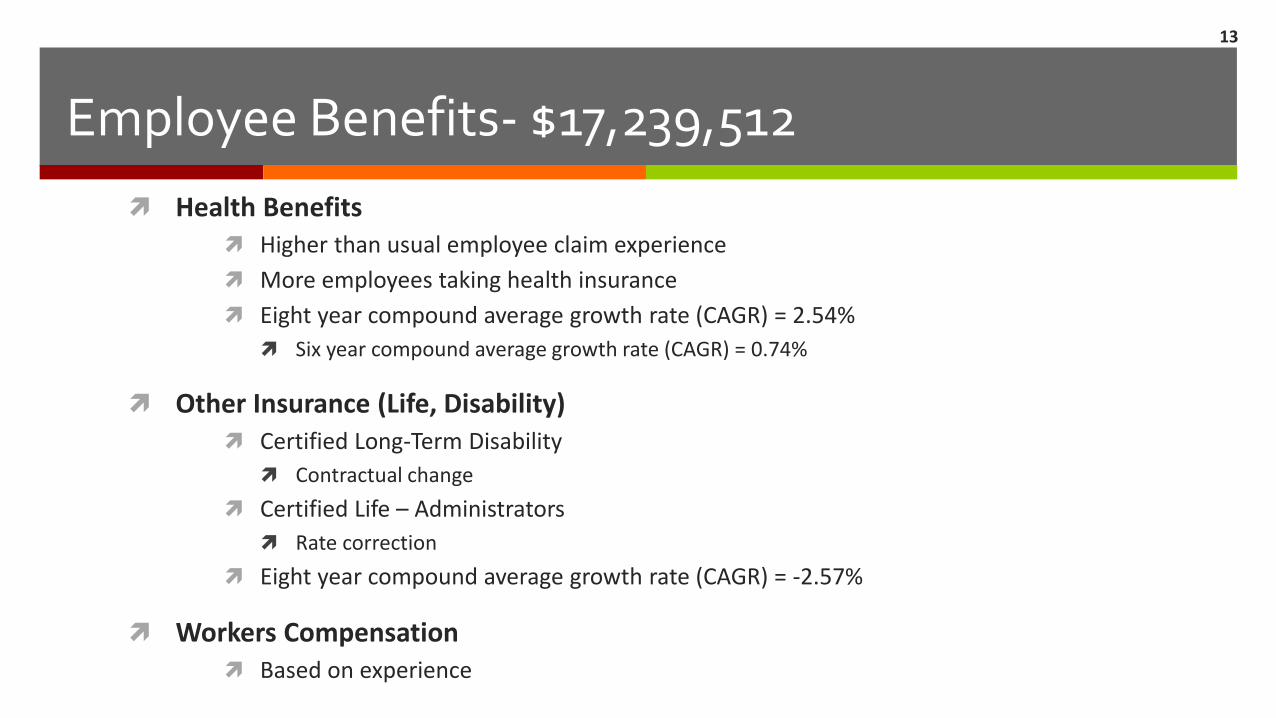
Health Benefits Higher than usual employee claim experience
More employees taking health insurance
Eight year compound average growth rate (CAGR) = 2.54%
Six year compound average growth rate (CAGR) = 0.74%
Other Insurance (Life, Disability) Certified Long-Term Disability
Contractual change
Certified Life – Administrators
Rate correction
Eight year compound average growth rate (CAGR) = -2.57%
Workers Compensation Based on experience
Employee Benefits- $17,239,512
13
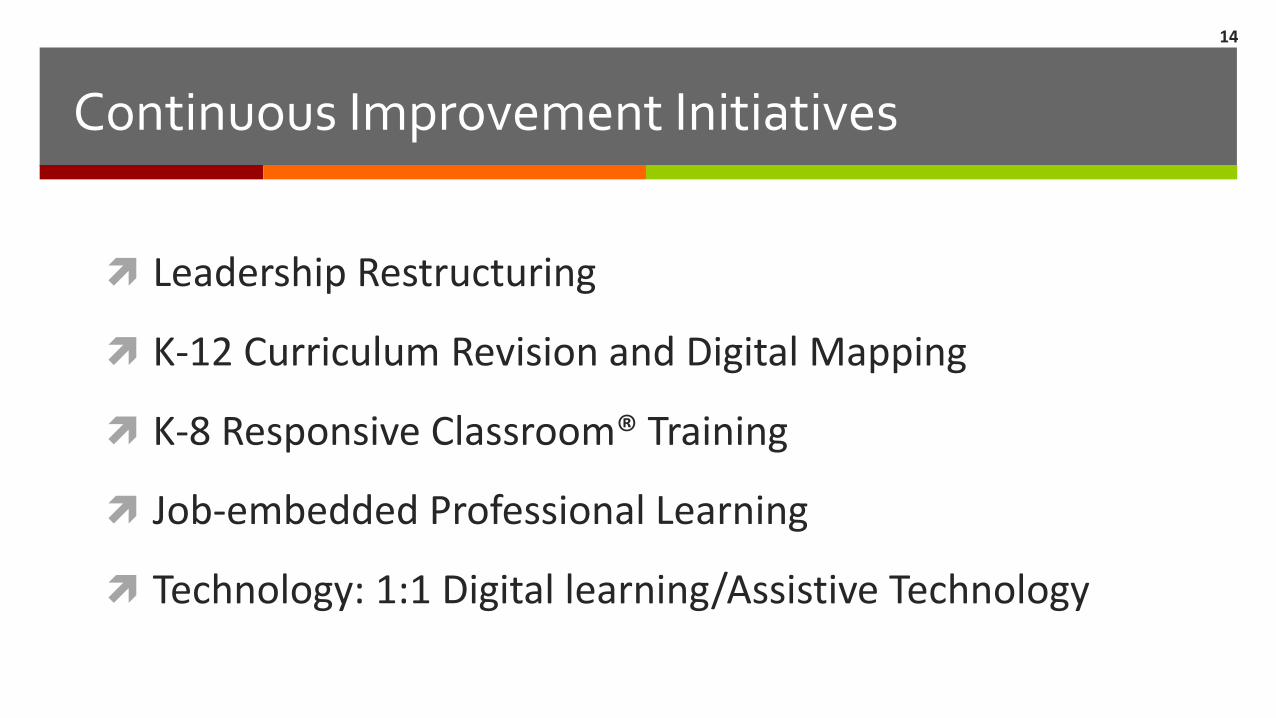
Continuous Improvement Initiatives
Leadership Restructuring
K-12 Curriculum Revision and Digital Mapping
K-8 Responsive Classroom® Training
Job-embedded Professional Learning
Technology: 1:1 Digital learning/Assistive Technology
14
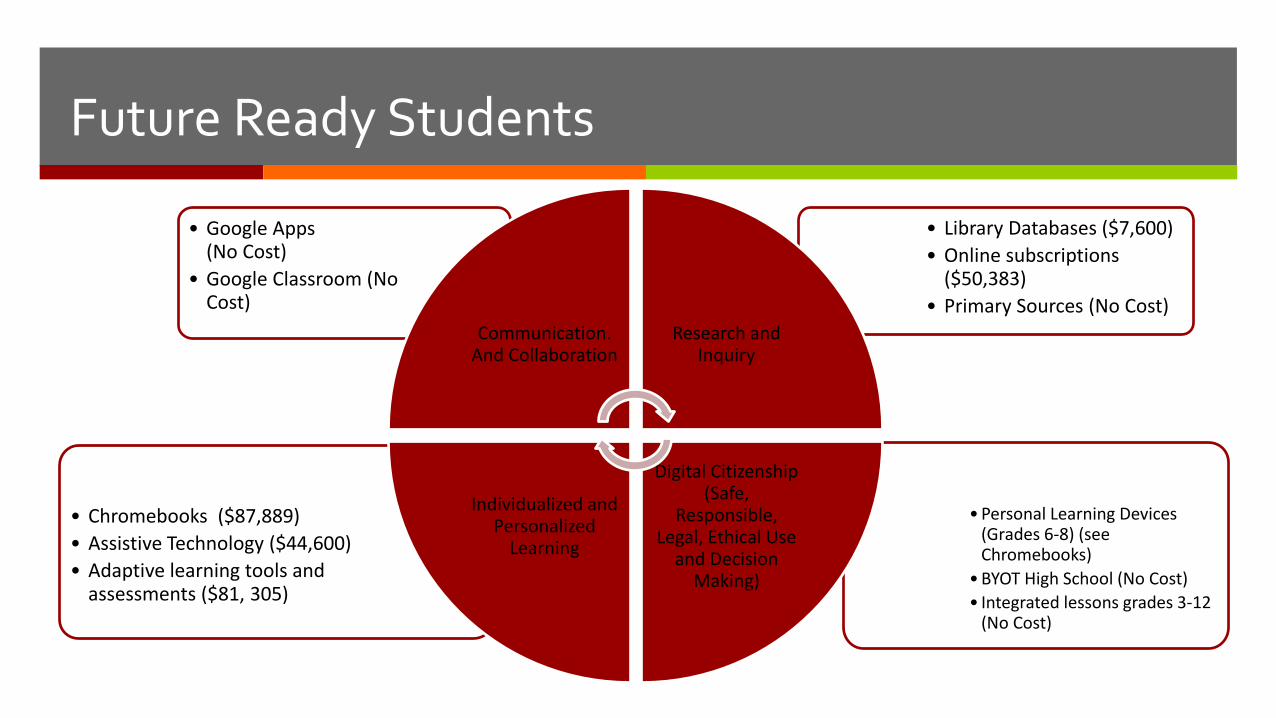
Future Ready Students
• Personal Learning Devices (Grades 6-8) (see Chromebooks)
• BYOT High School (No Cost)
• Integrated lessons grades 3-12 (No Cost)
• Chromebooks ($87,889)
• Assistive Technology ($44,600)
• Adaptive learning tools and assessments ($81, 305)
• Library Databases ($7,600)
• Online subscriptions ($50,383)
• Primary Sources (No Cost)
• Google Apps (No Cost)
• Google Classroom (No Cost)
Communication. And Collaboration
Research and Inquiry
Digital Citizenship (Safe,
Responsible, Legal, Ethical Use
and Decision Making)
Individualized and Personalized
Learning
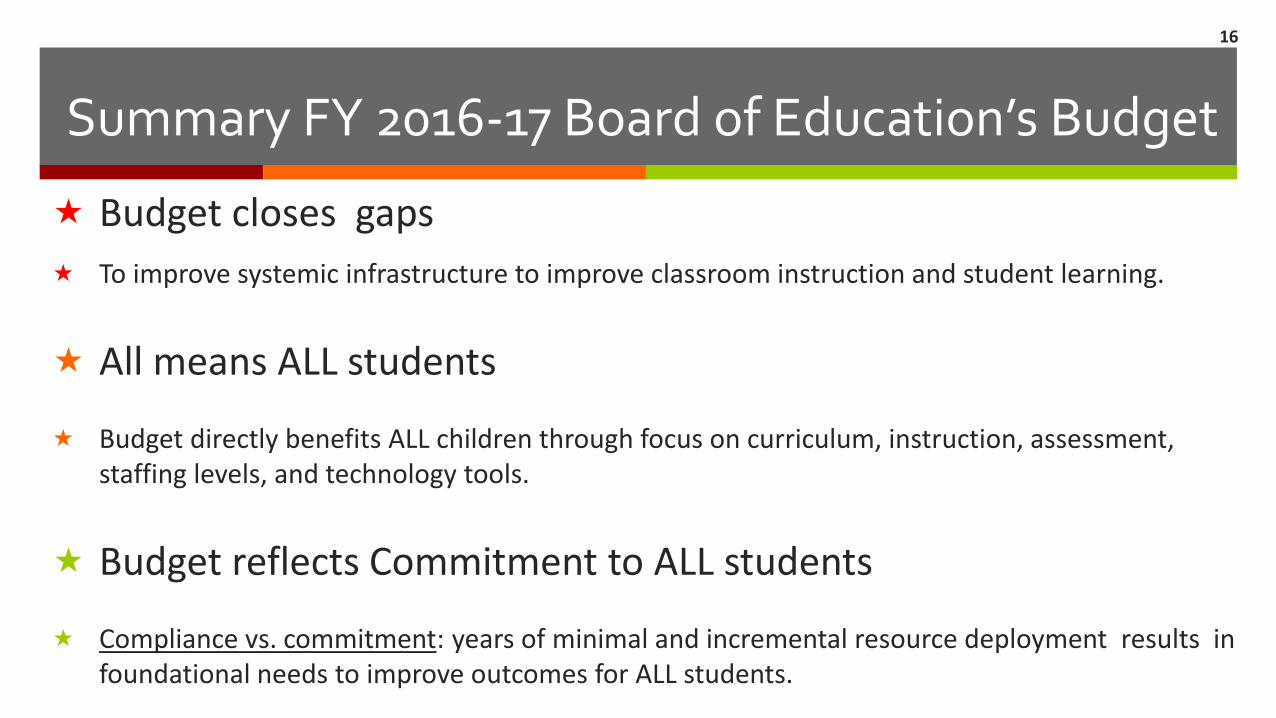
Summary FY 2016-17 Board of Education’s Budget
Budget closes gaps
To improve systemic infrastructure to improve classroom instruction and student learning.
All means ALL students
Budget directly benefits ALL children through focus on curriculum, instruction, assessment, staffing levels, and technology tools.
Budget reflects Commitment to ALL students
Compliance vs. commitment: years of minimal and incremental resource deployment results in foundational needs to improve outcomes for ALL students.
16