Embed Size (px)
Citation preview
Ridgefield COVID Summary
Ridgefield COVID-19 Task Force
Data downloaded from https://data.ct.gov/browse?category=Health+and+Human+Services
https://covid.cdc.gov/covid-data-tracker/#vaccinations
Tuesday, 11/09/2021
Slide 2Ridgefield COVID-19 Task Force
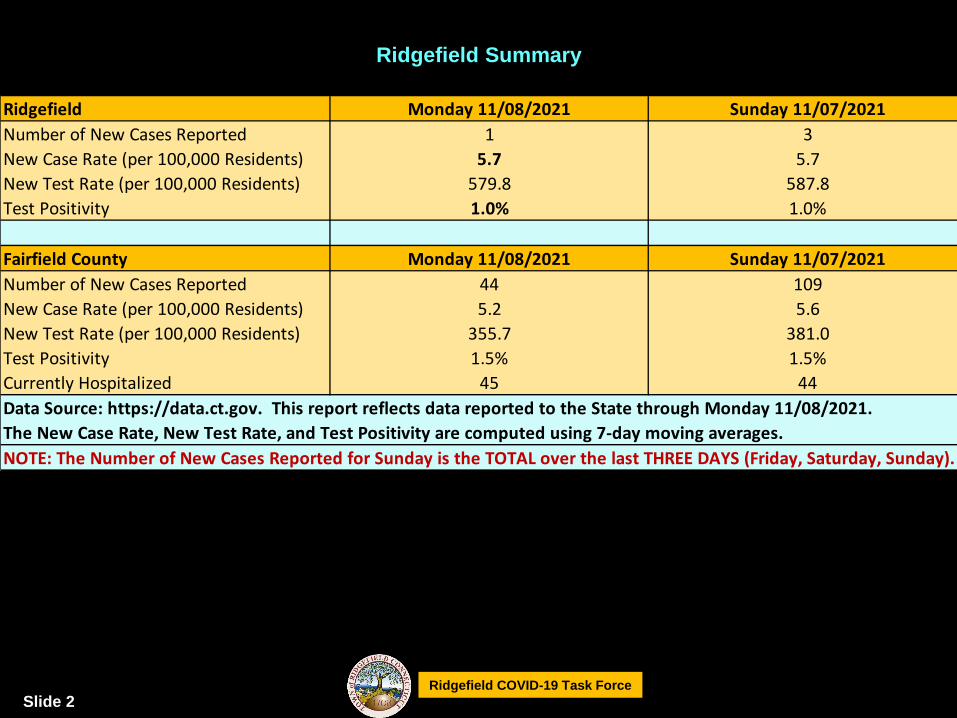
Ridgefield Summary
Ridgefield Monday 11/08/2021 Sunday 11/07/2021
Number of New Cases Reported 1 3
New Case Rate (per 100,000 Residents) 5.7 5.7
New Test Rate (per 100,000 Residents) 579.8 587.8
Test Positivity 1.0% 1.0%
Fairfield County Monday 11/08/2021 Sunday 11/07/2021
Number of New Cases Reported 44 109
New Case Rate (per 100,000 Residents) 5.2 5.6
New Test Rate (per 100,000 Residents) 355.7 381.0
Test Positivity 1.5% 1.5%
Currently Hospitalized 45 44
Data Source: https://data.ct.gov. This report reflects data reported to the State through Monday 11/08/2021.
The New Case Rate, New Test Rate, and Test Positivity are computed using 7-day moving averages.
NOTE: The Number of New Cases Reported for Sunday is the TOTAL over the last THREE DAYS (Friday, Saturday, Sunday).
Slide 3Ridgefield COVID-19 Task Force
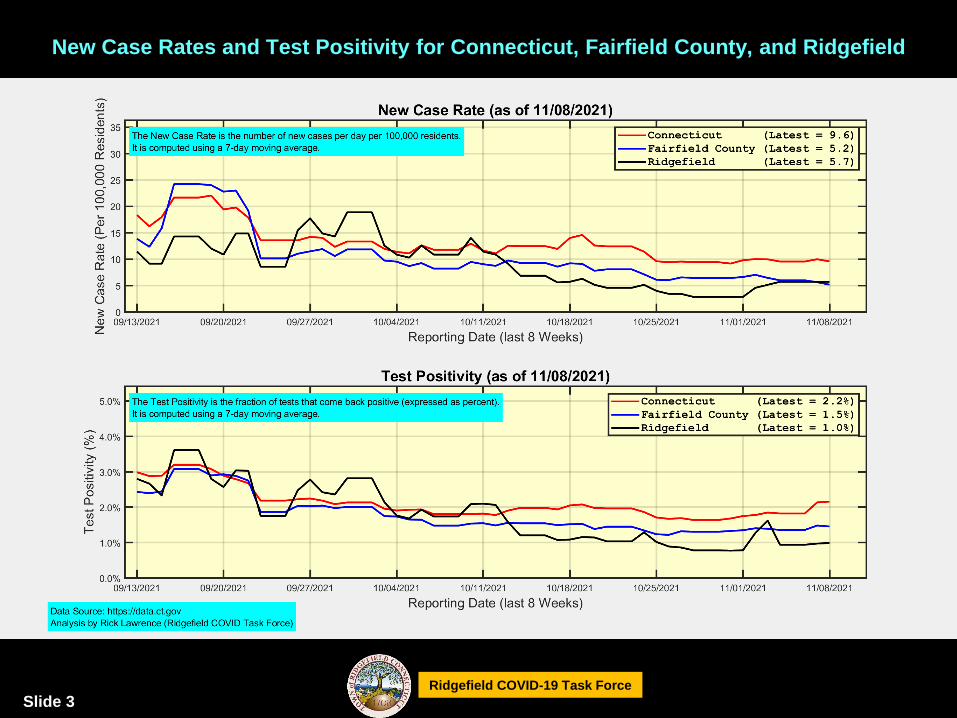
New Case Rates and Test Positivity for Connecticut, Fairfield County, and Ridgefield

Slide 4Ridgefield COVID-19 Task Force
New Cases, New Tests, and Test Positivity for Ridgefield
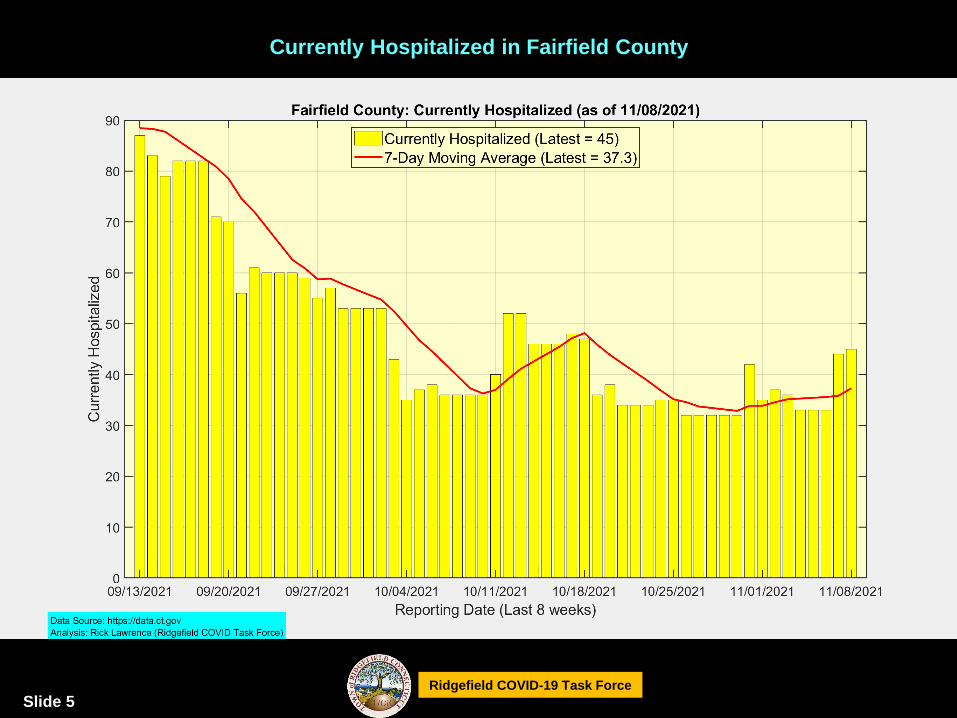
Slide 5Ridgefield COVID-19 Task Force
Currently Hospitalized in Fairfield County
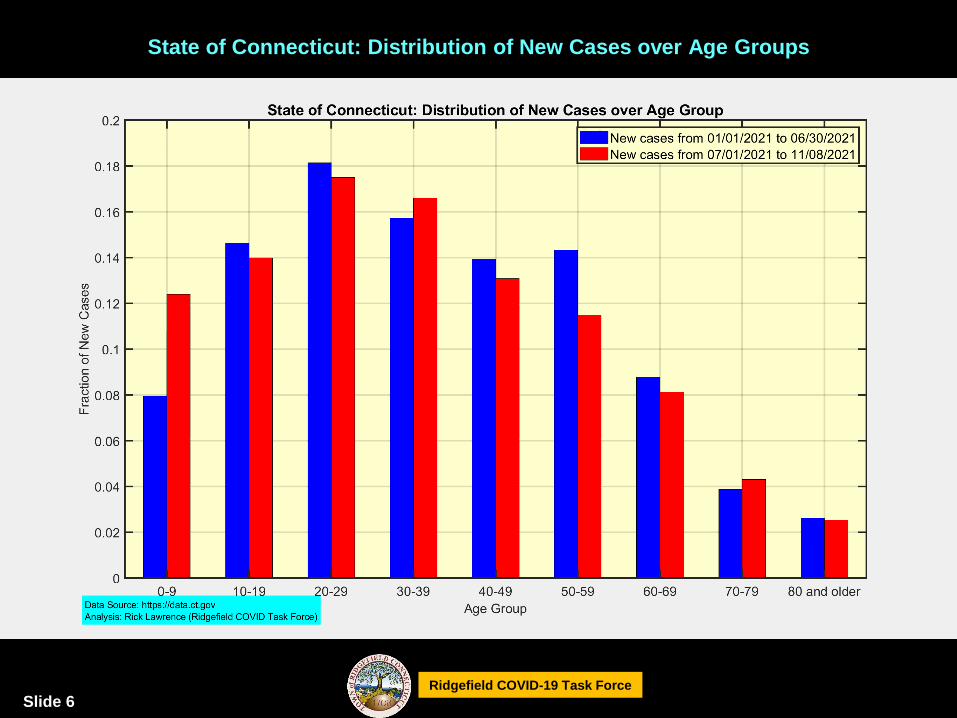
Slide 6Ridgefield COVID-19 Task Force
State of Connecticut: Distribution of New Cases over Age Groups
Slide 7Ridgefield COVID-19 Task Force
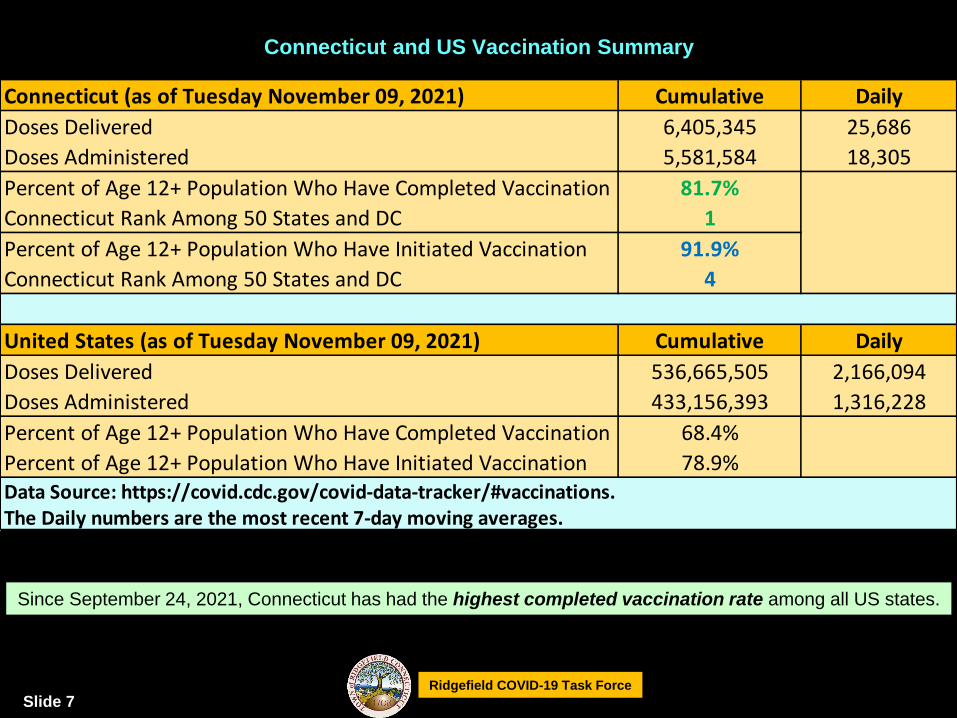
Connecticut and US Vaccination Summary
Since September 24, 2021, Connecticut has had the highest completed vaccination rate among all US states.
Connecticut (as of Tuesday November 09, 2021) Cumulative Daily
Doses Delivered 6,405,345 25,686
Doses Administered 5,581,584 18,305
Percent of Age 12+ Population Who Have Completed Vaccination 81.7%
Connecticut Rank Among 50 States and DC 1
Percent of Age 12+ Population Who Have Initiated Vaccination 91.9%
Connecticut Rank Among 50 States and DC 4
United States (as of Tuesday November 09, 2021) Cumulative Daily
Doses Delivered 536,665,505 2,166,094
Doses Administered 433,156,393 1,316,228
Percent of Age 12+ Population Who Have Completed Vaccination 68.4%
Percent of Age 12+ Population Who Have Initiated Vaccination 78.9%Data Source: https://covid.cdc.gov/covid-data-tracker/#vaccinations.The Daily numbers are the most recent 7-day moving averages.
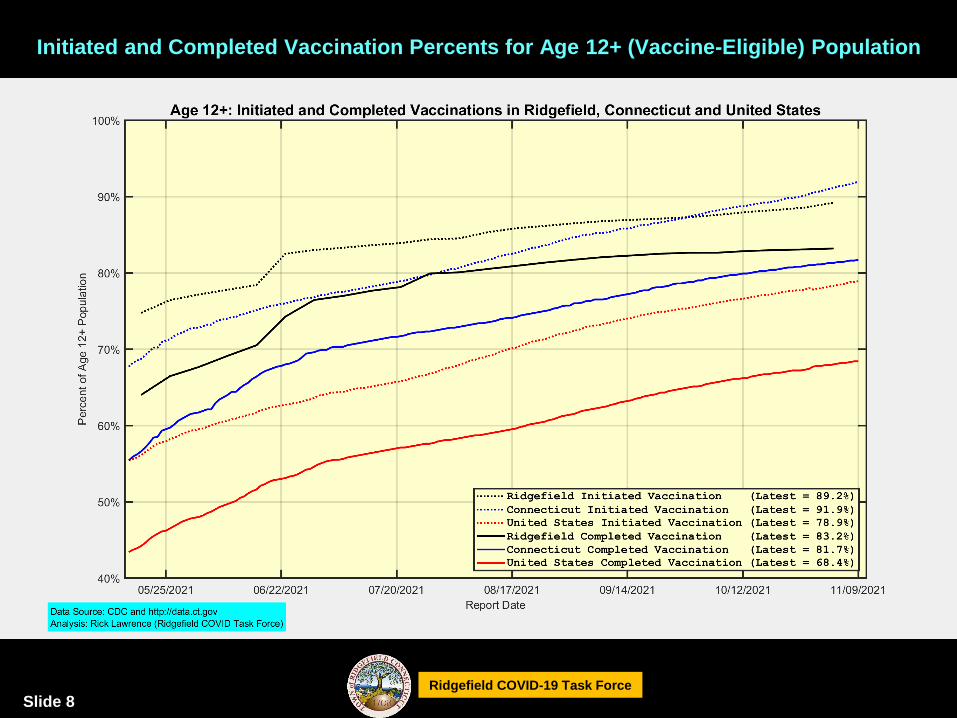
Slide 8Ridgefield COVID-19 Task Force
Initiated and Completed Vaccination Percents for Age 12+ (Vaccine-Eligible) Population
Slide 9Ridgefield COVID-19 Task Force
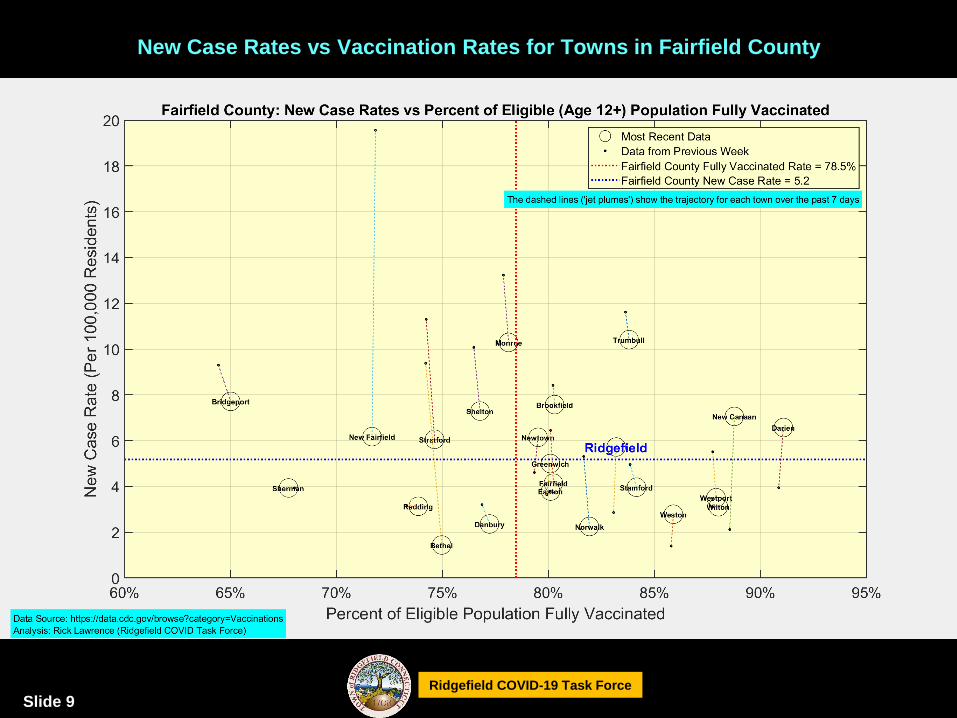
New Case Rates vs Vaccination Rates for Towns in Fairfield County
Slide 10Ridgefield COVID-19 Task Force
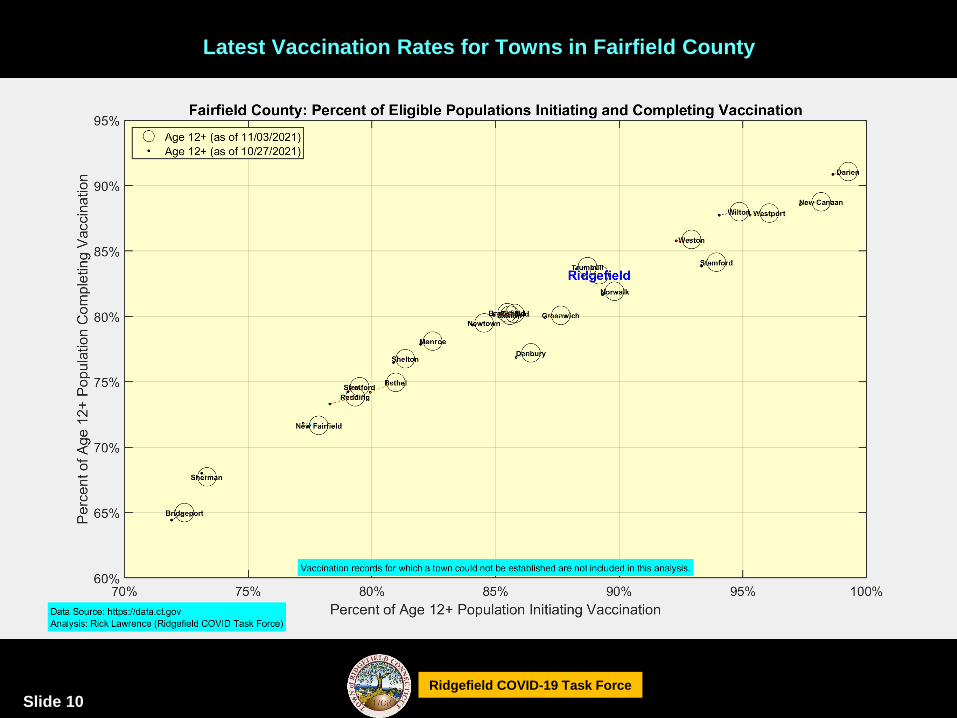
Latest Vaccination Rates for Towns in Fairfield County
Slide 11Ridgefield COVID-19 Task Force
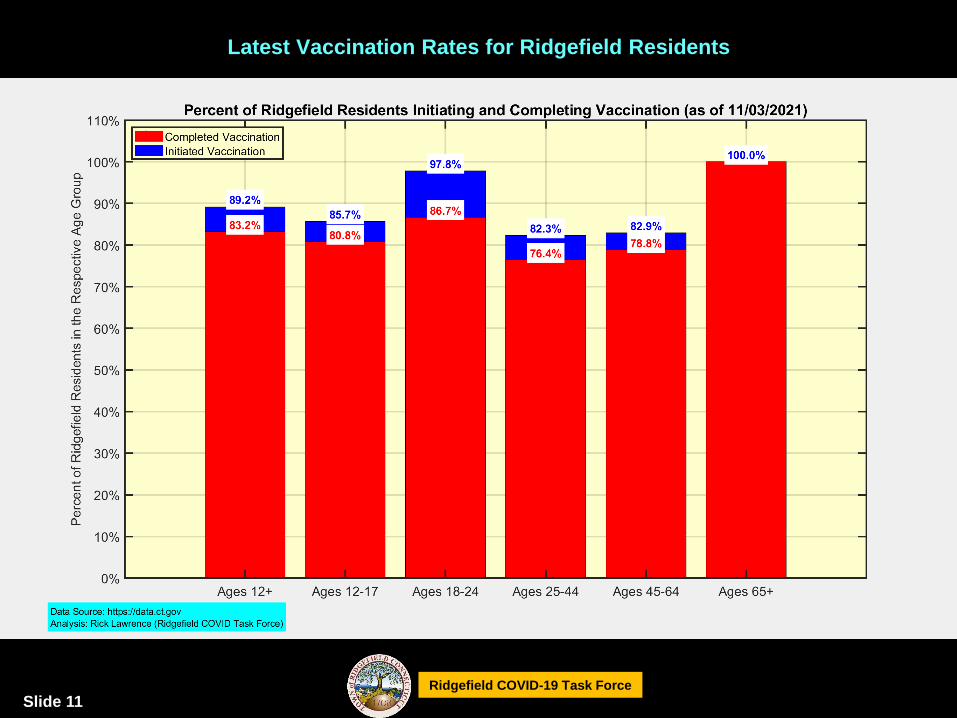
Latest Vaccination Rates for Ridgefield Residents

Slide 12Ridgefield COVID-19 Task Force
Vaccination Numbers for Ridgefield Residents