Embed Size (px)
Citation preview
1
Danielle R. Taber
From: Jerry Worsham <[email protected]>
Sent: Wednesday, January 14, 2015 1:28 PM
To: Danielle R. Taber
Cc: Laura L. Malone; Ana I. Vargas; Wendy Flood; Anthony E. Young
([email protected]); Scott R. Green
Subject: Meritor, Inc. and Cooper Industries LLC's Supplemental Public Comments and Exhibits
on RID's Feasibility Study Report/West Van Buren Water Quality Revolving Fund
(WQARF) Site
Attachments: Cover Ltr w Supp Comments and Exhibits del. 1-13-15.pdf
Danielle et al:
Attached is the electronic version of the written comments I submitted to ADEQ yesterday on the Roosevelt Irrigation
District’s Feasibility Study Report. Please include these comments for consideration in the formal record. I have
highlighted six major issues of concern in choosing the appropriate Feasibility Study. Enjoy the light reading and I
appreciate the difficulty and issues in adopting a Feasibility Study in this matter. Please call me at (602) 744-5763 with
any questions.
Jerry
______________
Jerry D. Worsham II
Member
Ridenour Hienton, P.L.L.C.
Chase Tower
201 North Central Avenue, Suite 3300
Phoenix, Arizona 85004
E. [email protected] | O (602) 254-9900 | F (602) 254-8670 | W. www.rhlfirm.com This electronic mail transmission contains information from the law firm of Ridenour Hienton , P.L.L.C. that may be confidential or privileged. Such information is solely for
the intended recipient, and use by any other party is not authorized. If you are not the intended recipient, be aware that any disclosure, copying, distribution or use of this
message, its contents or any attachments is prohibited. Any wrongful interception of this message is punishable as a Federal Crime. If you have received this message in
error, please notify the sender immediately by telephone at (602) 254-9900 or by electronic mail at [email protected]
Ridenour HientonPLLC
RESPECT HONESTY LEGACY Chase Tower
20 I North Central Avenue, Suite 3300 Phoenix, Arizona 85004
Shaine T. Alleman Taylor R. Bell Michael W. Brewer Tiffany F. Broberg Robert Erven Brown Ernest Calderon Jeannette B. Cross++ Michael D. Curry++ David G. Derickson Adam D. Driggs Robert J. Hackett April M. Hamilton James R. Hienton Martin T. Jones Sr. Martin T. Jones ll John P. Kaites
Telephone: 602.254.9900 I FAX: 602.254.8670
www.rhlfirm.com Lawrence S. Koplow*
*Of Counsel
January 13, 2015
Arizona Depaiiment of Environmental Quality ATTN: Dai1ielle Taber Waste Programs Division 1110 W Washington Street Phoenix, Arizona 85054
Meaghan K. Kramer Michael S. Love++ Matthew H. Mason Damien R. Meyer Howard C. Meyers Michael J. Minnaugh Brian D. Myers Kurt A. Peterson William G. Ridenour David R. Smith*+ Kathy Ann Terry*++ Scott S. Wakefield Blake E. Whiteman Jerry D. Worsham II++
+Licensed in New York Only ++Licensed in Texas
Our File No.: 23787-0001
Re: Supplemental Comments on West Van Buren Water Quality Assurance Revolving Fund (WQARF) Site - Feasibility Study (FS) Rep01is (Due January 14, 2015)
Dear Danielle:
Enclosed are the written comments supplied on the captioned Feasibility Study Reports on behalf of Meritor, Inc. and Cooper Industries LLC. These parties are not located in the West Van Buren WQARF Site, are not potentially liable parties in the West Van Buren WQARF Site, but supply these comments for the Arizona Department of Environmental Quality to assist in the selection of the Feasibility Study that:
1. Assures the protection of public health and welfare and the environment. 2. To the extent practicable, provides for the control, management or cleanup of the
hazardous substances in order to allow the maximum beneficial use of the waters
of,the state. 3. Is reasonable, necessary, cost-effective and technically feasible.
25~f&'{R~'}l3'}g!jl_~ {\ustria, Belgium, Bolivia, Brazil, Bulgaria, Canada, Cayman Islands, Columbia, Cyprus, Denmark, England, Estonia, France, Germany, Greece, India, LAvmRSASSOCIATED lreland,1srael, Italy, japan, Malaysia, Maurrtius, Mexico, Netherlands, New Zealand, Peru, Portugal, Romania, Singapore, Spain, Sweden, Switzerland.Thailand, UAE, USA
llOOlJ:HIDE
Danielle Taber January 13, 2015
Please include these supplemental comments with the ones filed for the record with ADEQ by Meritor, Inc. submitted on December 2, 2014.
Please call me at (602) 744-5763 with any questions.
JDW/pjb
cc: Laura Malone - ADEQ Tina LePage - ADEQ Scott R. Green - ADEQ Wendy Flood-ADEQ
Sincerely,
~)).oJ~_.&7 VJ erry D. Worsham II
For the Firm
Anthony Young, Esq. - Arizona Office of the Attorney General
2
440299 vljdw;23787-0001
Shaine T. Alleman Taylor R. Bell Michael W. Brewer Tiffany F. Broberg Robert Erven Brown Ernest Calder6n Jeannette B. Cross++ Michael D. Curry++ David G. Derickson Adam D. Driggs Robert J. Hackett April M. Hamilton James R. Hienton Martin T. Jones Sr. Martin T. Jones II John P. Kaites Lawrence S. Koplow*
'Of Counsel
Ridenour HientonPLLC
RESPECT HONESTY LEGACY Chase Tower
20 I North Central Avenue, Suite 3300 Phoenix, Arizona 85004
Telephone: 602.254.9900 I FAX: 602.254.8670
www.rhlfirm.com
Meaghan K. Kramer Michael S. Love++ Matthew H. Mason Damien R. Meyer Howard C. Meyers Michael J. Minnaugh Brian D. Myers Kurt A. Peterson William G. Ridenour David R. Smith*+ Kathy Ann Terry'++ Scott S. Wakefield Blake E. Whiteman Jerry D. Worsham Ir
+Licensed in New York Only ++Licensed in Texas
January 13, 2015 Our File No.: 23787-0001
Arizona Department of Environmental Quality ATTN: Danielle Taber Waste Programs Division 1110 W Washington Street Phoenix, Arizona 85054
Re: Supplemental Comments on the Roosevelt Irrigation District's "Draft Feasibility Study Report West Van Buren Area WQARF Site" Prepared by Synergy Environmental, LLC and Montgomery & Associates (July 2014)
Dear Danielle:
On behalf of Meritor, Inc. and Cooper Industries LLC, I provide these additional comments on the Roosevelt Irrigation District's (RID) Draft Feasibility Study (FS) Report concerning the West Van Buren Area Water Quality Assurance Revolving Fund ("WQARF") Registry Site.
ISSUE No.1.RISK
RID's Public Health Exposure Assessment
The RID's document titled "Early Response Action -Public Health Exposure Assessment and Mitigation Work Plan" (June 16, 2011) indicates that,
"The Final Report will provide Summary and Conclusions that will quantify and compare the mass of [volatile organic compounds] voes that are released into the environment from current RID well operations in the WVBA and that which would
Argentina,Australia,Austria, Belgium, Bolivia, Brazil, Bulgaria, Canada, Cayman Islands, Columbia, Cyprus, Denmark England, Estonia, France, Germany, Greece, India, LAWYEASASSOCL'JEIJ Ireland, Israel, Italy, Japan, Malaysia, Mauritius, Mexico, Netherlands, New Zealand, Peru, Portugal, Romania, Singapore, Spain, Sweden, Switzerland, Thailand, UAE, USA
\\QRl.OWDE
Danielle Taber January 13, 2015
occur upon implementation of the [Early Response Action] ERA to demonstrate how the planned ERA will reduce V OC releases to the environment to mitigate the associated public health exposure." (pg. 29)
The RID's document titled "Early Response Action -Public Health Exposure Assessment and Mitigation Summary Report" (September 16, 2011) states the following Summary and Conclusions,
"Review of these data, and consideration of the reasonable likelihood for potential public exposure, result in the conclusion that there is not an imminent (acute) risk to the public from the contamination being released from the RID water systems. While air sampling results show that many points in the RID water systems exceed air inhalation screening-level guidelines for shortterm exposure (acute MRLs and one-hour AAAQGs) these points are not likely to provide a reasonable public exposure pathway due to their physical nature and locations. Similarly, water sampling results show that many points in the RID water systems exceed screening-level guidelines for ingestion (EPA RSL - tap water and SWQs - drinking water), however, the contaminated water is not expected to lead to an unacceptable public exposure based on the limited and transient potential use of this water as a source of drinking water. Water from the RID system in the WVBA Site is not currently used for municipal drinking water supply." (pgs. 27-28)
Therefore, the RID's own documentation and report confirm that, " ... there is not an imminent risk to the public from the contamination being released from the RID water systems." There is no imminent or substantial endangerment to the public health or environment.
1992 ADHS Health Risk Assessment
Despite RID's own risk report of summary and conclusions, the RID's Draft FS Report repeatedly references an outdated Arizona Department of Health Services (ADHS) Report titled, "1992 Health Risk Assessment Task Assignment 11-18," Contract No 2217-000000-3-3-AB-2001(0ctober 30, 1992). The RID Draft FS Report relies upon or cites this historical 1992 ADHS Report no less than seven (7) times (pgs. 14, 16, 56, 86, 92, 125 and 203) to allege or infer current risks to public health and the environment. However, RID's repeated reference to the 1992 ADHS Report, which is based on limited sampling data that is outdated, does not support RID's claim that there are current risks to public health and the environment.
2
440299 vl;jdw;23787-000I
Danielle Taber January 13, 2015
Close review of the 1992 ADHS Report confirms that it relied upon a basic premise that, "Although public wells are not currently contaminated, pollutants similar to those in groundwater ... are slowly migrating to the west. The City of Tolleson ("COT") public wells are likely to be impacted in the near future." (pg. 1)
In reality, RID has acknowledged that the COT public wells are not at risk and that groundwater pumping of the RID well field in the WVBA Site hydraulically contains the regional comingled groundwater contaminant plume and constrains the impact of this plume on peripheral wells of other water providers [including the COT public wells]. (See RID Draft FS Report pgs. 86 and 127) Therefore, the West Van Buren WQARF Area Plume has been and continues to be stable. Clearly, the basic premise in the 1992 ADHS Report concerning the impact to the COT public wells is not valid and has not occurred in 22 years. In addition, the 1992 ADHS Report is based upon limited groundwater sampling data. For example, the limited groundwater data in the 1992 ADHS Report relies upon RID-84 well and was analyzed on only two occasions (June 19, 1990 and May 5, 1991). As stated in the 1992 ADHS Report, "The quantity of data collected and reported is quite limited ... Therefore the quantity of data is therefore of concern when interpreting the results of this Risk Assessment." (p. 4) Groundwater data collected by RID between 1992-2014 show a considerable declining trend in TCE/PCE concentration in RID-84 through 2014. (See RID Draft FS Report Table 2)
2015 ADHS Health Consultation
"In 2015, the Arizona Department of Health Services (ADHS) revisited the outdated 1992 ADHS Health Risk Assessment Report and have completed a new health consultation report titled, "Health Consultation: Evaluation of Water Sampling Results in the Roosevelt Irrigation District (RID)," ADHS Bureau of Public Health and Emergency Services, Environmental Toxicology Program (January 8 , 2015). (See Exhibit "1") The 2015 ADHS Health Consultation Report finds that there is "No Apparent Public Health Hazard" based upon a review of historical and current groundwater data collected by the ADEQ and RID through 2014 and the identified exposure scenarios. ADHS reports that the current cancer risk has a calculated value which is well below the EPA's target risk range of 1 x 10 -6 for total carcinogenic risk. The 2015 ADHS Health Consultation Report is based upon the available information provided by current groundwater sampling data and exposure to the chemicals of concern (i.e. TCE/PCE/1, 1-DCE). Therefore, based upon the 2015 ADHS Report, there is not an acute or long term risk to the public from the irrigation water pumped into the RID water systems for distribution.
West Van Buren WQARF Site Working Group's Risk Assessment
In addition to the RID's conclusion that "no risk to the public" exists from the RID water system and ADHS's determination of No Apparent Public Health Hazard, a recent report by the West Van Buren WQARF Site Working Group titled "Human Health Risk Assessment [HHRA] West Van Buren WQARF Site, Phoenix, Arizona," (July 2014) asserts,
3
440299 vl;jdw;23787-000I
Danielle Taber January 13, 2015
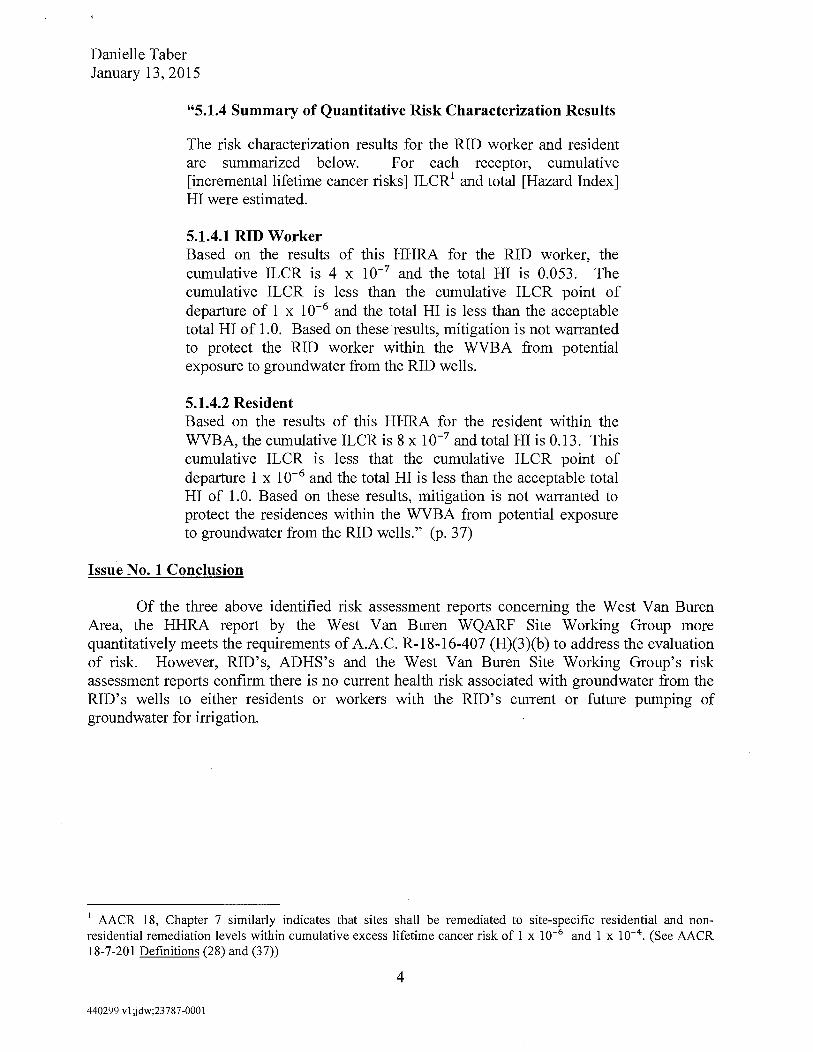
"5.1.4 Summary of Quantitative Risk Characterization Results
The risk characterization results for the RID worker and resident are summarized below. For each receptor, cumulative [incremental lifetime cancer risks] ILCR 1 and total [Hazard Index] HI were estimated.
5.1.4.1 RID Worker Based on the results of this HHRA for the RID worker, the cumulative ILCR is 4 x 10⁻⁷ and the total HI is 0.053. The cumulative ILCR is less than the cumulative ILCR point of departure of 1 x 1 o-6 and the total HI is less than the acceptable total HI of 1.0. Based on these results, mitigation is not warranted to protect the RID worker within the WVBA from potential exposure to groundwater from the RID wells.
5.1.4.2 Resident Based on the results of this HHRA for the resident within the WVBA, the cumulative ILCR is 8 x 10⁻⁷ and total HI is 0.13. This cumulative ILCR is less that the cumulative ILCR point of departure 1 x 1 o- 6 and the total HI is less than the acceptable total HI of 1.0. Based on these results, mitigation is not warranted to protect the residences within the WVBA from potential exposure to groundwater from the RID wells." (p. 37)
Issue No. 1 Conclusion
Of the three above identified risk assessment reports concerning the West Van Buren Area, the HHRA report by the West Van Buren WQARF Site Working Group more quantitatively meets the requirements of A.A.C. R-18-16-407 (H)(3)(b) to address the evaluation of risk. However, RID's, ADHS's and the West Van Buren Site Working Group's risk assessment reports confirm there is no current health risk associated with groundwater from the RID's wells to either residents or workers with the RID's current or future pumping of groundwater for irrigation.
1 AACR 18, Chapter 7 similarly indicates that sites shall be remediated to site-specific residential and nonresidential remediation levels within cumulative excess lifetime cancer risk of 1 x 10⁻⁶ and 1 x 10⁻⁴
. (See AACR 18-7-20 l Definitions (28) and (3 7))
4
440299 vl;jdw;23787-0001
Danielle Taber January 13, 2015
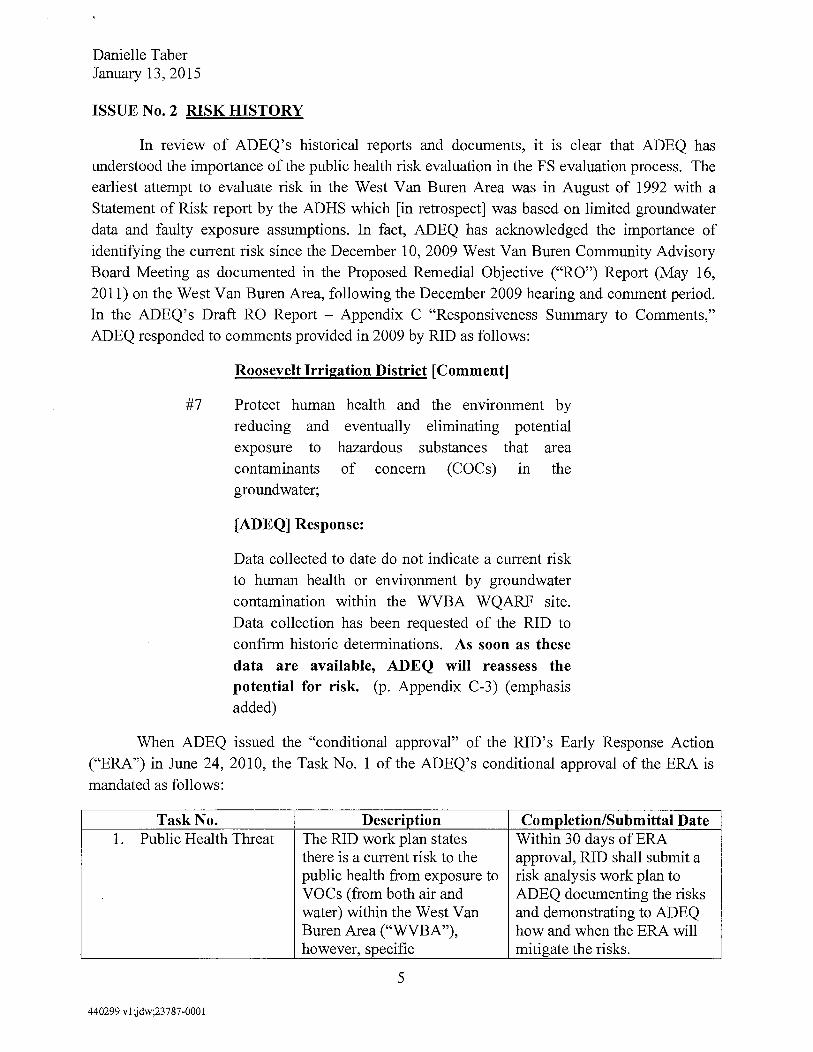
ISSUE No. 2 RISK HISTORY
In review of ADEQ's historical reports and documents, it is clear that ADEQ has understood the importance of the public health risk evaluation in the FS evaluation process. The earliest attempt to evaluate risk in the West Van Buren Area was in August of 1992 with a Statement of Risk report by the ADHS which [in retrospect] was based on limited groundwater data and faulty exposure assumptions. In fact, ADEQ has acknowledged the importance of identifying the current risk since the December 10, 2009 West Van Buren Community Advisory Board Meeting as documented in the Proposed Remedial Objective ("RO") Report (May 16, 2011) on the West Van Buren Area, following the December 2009 hearing and comment period. In the ADEQ's Draft RO Report - Appendix C "Responsiveness Summary to Comments," ADEQ responded to comments provided in 2009 by RID as follows:
Roosevelt Irrigation District [Comment]
#7 Protect human health and the environment by reducing and eventually eliminating potential exposure to hazardous substances that area contaminants of concern (COCs) in the groundwater;
[ADEQ] Response:
Data collected to date do not indicate a current risk to human health or environment by groundwater contamination within the WVBA WQARF site. Data collection has been requested of the RID to confirm historic determinations. As soon as these data are available, ADEQ will reassess the potential for risk. (p. Appendix C-3) (emphasis added)
When ADEQ issued the "conditional approval" of the RID's Early Response Action ("ERA") in June 24, 2010, the Task No. 1 of the ADEQ's conditional approval of the ERA is mandated as follows:
Task No. Description Completion/Submittal Date 1. Public Health Threat The RID work plan states Within 30 days of ERA
there is a current risk to the approval, RID shall submit a public health from exposure to risk analysis work plan to voes (from both air and ADEQ documenting the risks water) within the West Van and demonstrating to ADEQ Buren Area ("WVBA"), how and when the ERA will however, specific mitigate the risks.
5
440299 v I jdw;23 7 87-000 I
Danielle Taber January 13, 2015
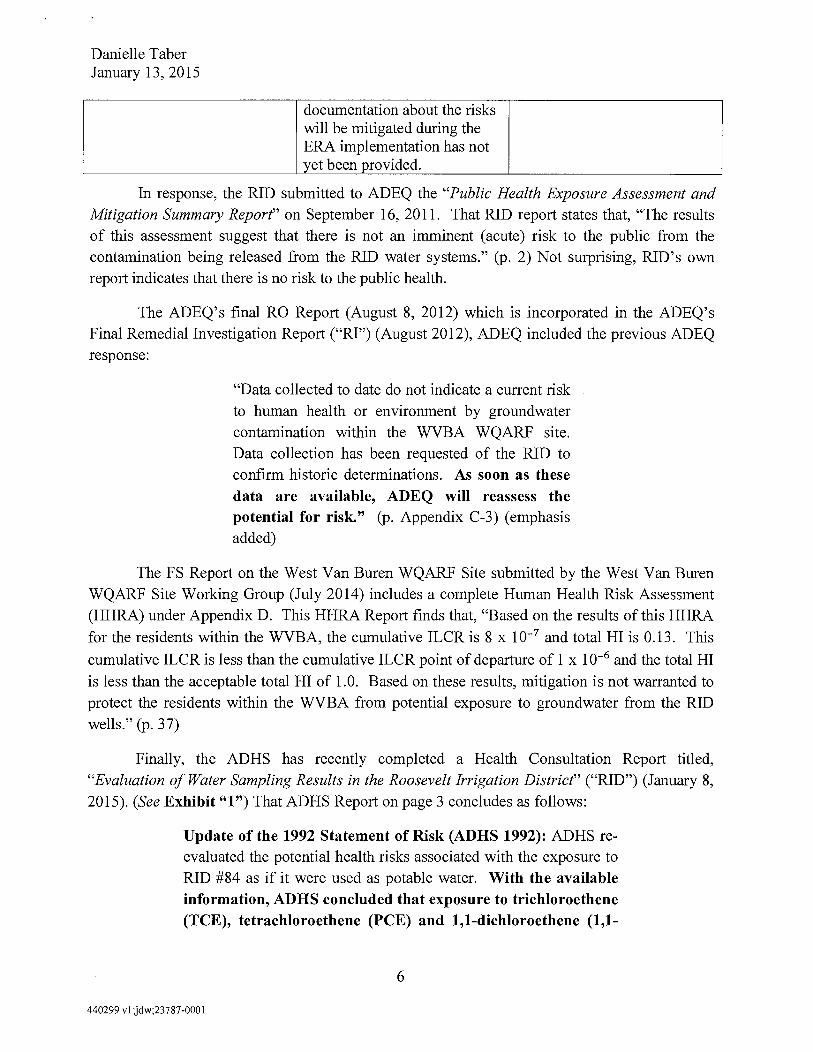
documentation about the risks will be mitigated during the ERA implementation has not yet been provided.
In response, the RID submitted to ADEQ the "Public Health Exposure Assessment and Mitigation Summary Report" on September 16, 2011. That RID report states that, "The results of this assessment suggest that there is not an imminent (acute) risk to the public from the
contamination being released from the RID water systems." (p. 2) Not surprising, RID's own report indicates that there is no risk to the public health.
The ADEQ's final RO Report (August 8, 2012) which is incorporated in the ADEQ's Final Remedial Investigation Report ("RI") (August 2012), ADEQ included the previous ADEQ
response:
"Data collected to date do not indicate a current risk
to human health or environment by groundwater contamination within the WVBA WQARF site. Data collection has been requested of the RID to
confirm historic determinations. As soon as these data are available, ADEQ will reassess the potential for risk." (p. Appendix C-3) (emphasis added)
The FS Report on the West Van Buren WQARF Site submitted by the West Van Buren WQARF Site Working Group (July 2014) includes a complete Human Health Risk Assessment
(HHRA) under Appendix D. This HHRA Report finds that, "Based on the results of this HHRA
for the residents within the WVBA, the cumulative ILCR is 8 x 10⁻⁷ and total HI is 0.13. This
cumulative ILCR is less than the cumulative ILCR point of departure of 1 x 1 o-6 and the total HI
is less than the acceptable total HI of 1.0. Based on these results, mitigation is not warranted to protect the residents within the WVBA from potential exposure to groundwater from the RID
wells." (p. 37)
Finally, the ADHS has recently completed a Health Consultation Report titled,
"Evaluation of Water Sampling Results in the Roosevelt Irrigation District" ("RID") (January 8,
2015). (See Exhibit "1") That ADHS Report on page 3 concludes as follows:
Update of the 1992 Statement of Risk (ADHS 1992): ADHS reevaluated the potential health risks associated with the exposure to RID #84 as if it were used as potable water. With the available information, ADHS concluded that exposure to trichloroethene (TCE), tetrachloroethene (PCE) and 1,1-dichloroethene (1,1-
6
440299 vi jdw;23787-000I
Danielle Taber January 13, 2015
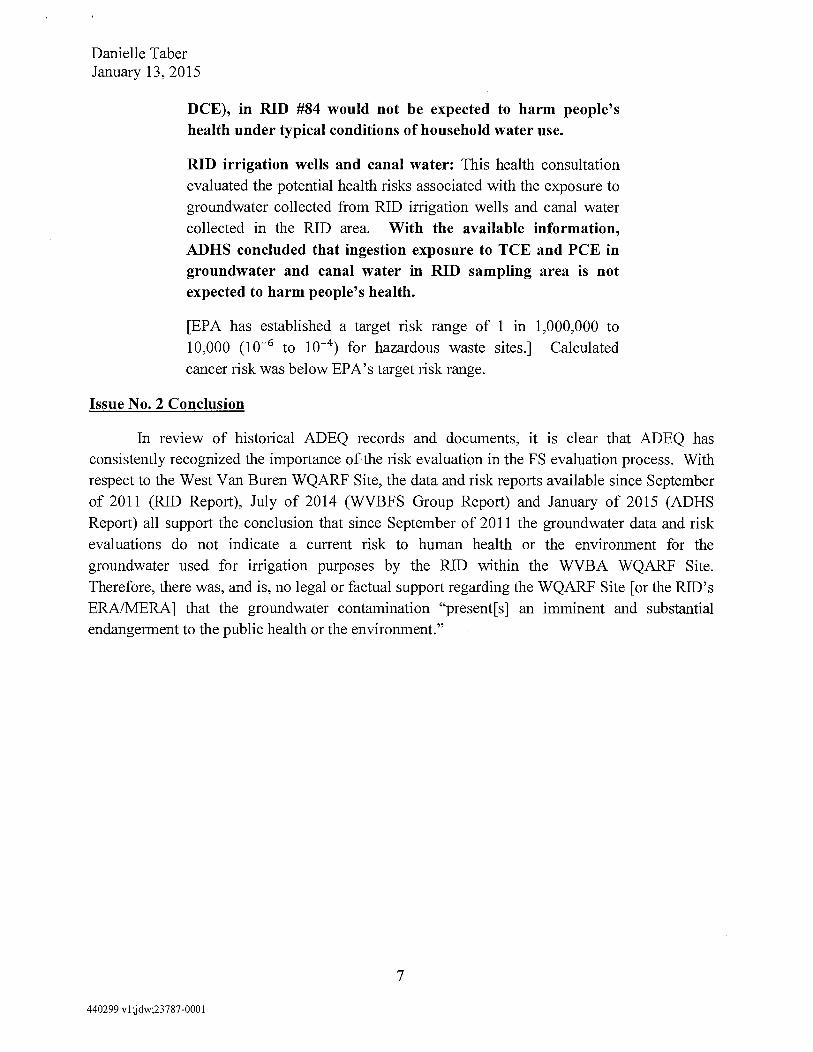
DCE), in RID #84 would not be expected to harm people's health under typical conditions of household water use.
RID irrigation wells and canal water: This health consultation evaluated the potential health risks associated with the exposure to groundwater collected from RID irrigation wells and canal water collected in the RID area. With the available information, ADHS concluded that ingestion exposure to TCE and PCE in groundwater and canal water in RID sampling area is not expected to harm people's health.
[EPA has established a target risk range of 1 in 1,000,000 to 10,000 (10-6 to 10-4
) for hazardous waste sites.] Calculated cancer risk was below EPA's target risk range.
Issue No. 2 Conclusion
In review of historical ADEQ records and documents, it is clear that ADEQ has consistently recognized the importance of the risk evaluation in the FS evaluation process. With respect to the West Van Buren WQARF Site, the data and risk reports available since September of 2011 (RID Report), July of 2014 (WVBFS Group Report) and January of 2015 (ADHS Report) all support the conclusion that since September of 2011 the groundwater data and risk evaluations do not indicate a current risk to human health or the environment for the groundwater used for irrigation purposes by the RID within the WVBA WQARF Site. Therefore, there was, and is, no legal or factual support regarding the WQARF Site [or the RID's ERA/MERA] that the groundwater contamination "present[s] an imminent and substantial endangerment to the public health or the environment."
7
440299 vi ;jdw;23787-000I
Danielle Taber January 13, 2015
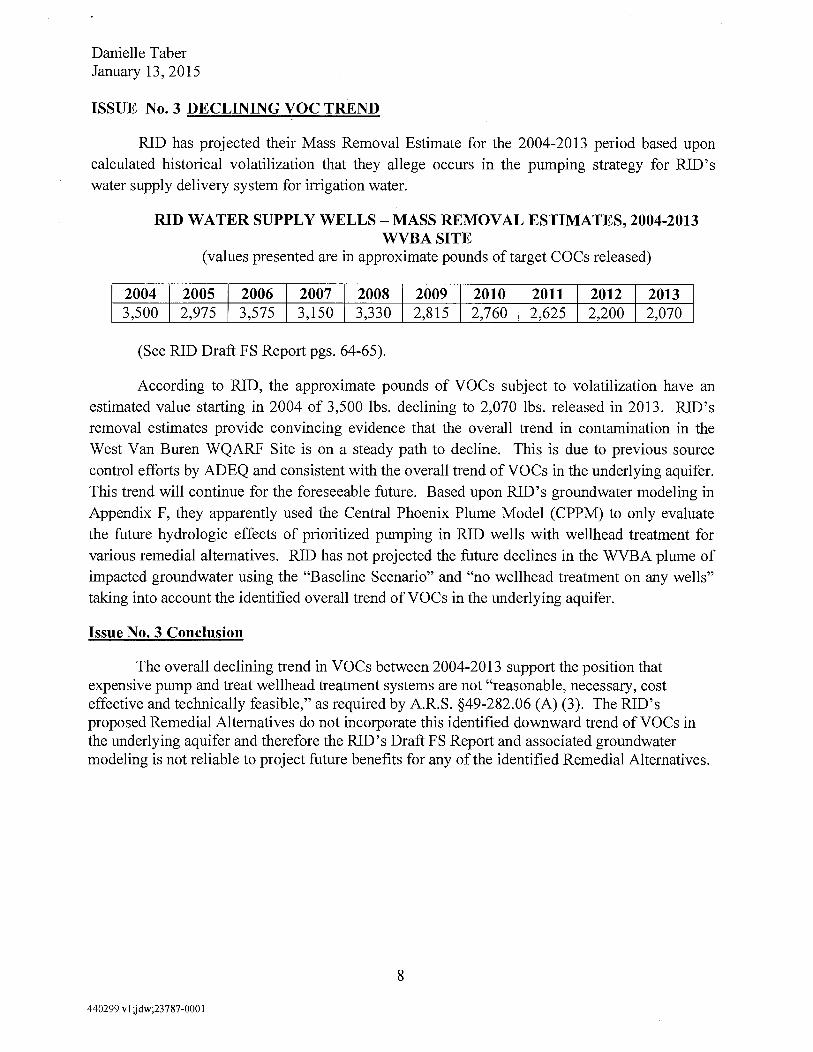
ISSUE No. 3 DECLINING voe TREND
RID has projected their Mass Removal Estimate for the 2004-2013 period based upon calculated historical volatilization that they allege occurs in the pumping strategy for RID's water supply delivery system for irrigation water.
RID WATER SUPPLY WELLS - MASS REMOVAL ESTIMATES, 2004-2013 WVBASITE
(values presented are in approximate pounds of target COCs released)
2004 2005 2006 2007 2008 2009 2010 2011 I 2012 I 2013 I 3,500 2,975 3,575 3,150 3,330 2,815 2,760 2,625 I 2,200 I 2,010 I
(See RID Draft FS Report pgs. 64-65).
According to RID, the approximate pounds of VOCs subject to volatilization have an estimated value starting in 2004 of 3,500 lbs. declining to 2,070 lbs. released in 2013. RID's removal estimates provide convincing evidence that the overall trend in contamination in the West Van Buren WQARF Site is on a steady path to decline. This is due to previous source control efforts by ADEQ and consistent with the overall trend ofVOCs in the underlying aquifer. This trend will continue for the foreseeable future. Based upon RID's groundwater modeling in Appendix F, they apparently used the Central Phoenix Plume Model (CPPM) to only evaluate the future hydrologic effects of prioritized pumping in RID wells with wellhead treatment for various remedial alternatives. RID has not projected the future declines in the WVBA plume of impacted groundwater using the "Baseline Scenario" and "no wellhead treatment on any wells" taking into account the identified overall trend ofVOCs in the underlying aquifer.
Issue No. 3 Conclusion
The overall declining trend in VOCs between 2004-2013 support the position that expensive pump and treat wellhead treatment systems are not "reasonable, necessary, cost effective and technically feasible," as required by A.R.S. §49-282.06 (A) (3). The RID's proposed Remedial Alternatives do not incorporate this identified downward trend ofVOCs in the underlying aquifer and therefore the RID's Draft FS Report and associated groundwater modeling is not reliable to project future benefits for any of the identified Remedial Alternatives.
8
440299 vl;jdw;23787-000I
Danielle Taber January 13, 2015
ISSUE No. 4 RID's OPERATIONAL HISTORY
In order to evaluate the RID's proposed Draft FS Study Report, ADEQ should review the RID's past performance and documentation submitted to ADEQ under the ADEQ's "conditional
approval" of the Early Response Action (ERA) dated June 24, 2010 and the Modified Early Response Action (MERA) dated February 1, 2013. These documents provide a significant data base and negative operational history from RID's MERA wells including RID-89, RID-92, RID-95 and RID-114. For comparison pµrposes, the RID's figures are used.
MERA Phase 1 and Phase 2
The MERA Work Plan originally outlined the RID' s previous intent to install wellhead treatment systems at eight of RID's groundwater irrigation production well locations in two
phases (Phase 1 and Phase 2). Currently, the RID has installed wellhead treatment systems at only four locations (Phase 1), including irrigation wells identified RID-89, RID-92, RID-95 and RID-114. The Phase 2 of the MERA consists of installing wellhead treatment at the remaining four locations: RID-100, RID-106, RID-112 and RID-113. According to the RID's proposed
Draft FS Report, the concept of implementing the Phase 2 wellhead treatment systems has been
abandoned in the MERA and will instead be evaluated as part of the ADEQ's review of the merits of the RID's Draft FS Study Report. (See RID's Draft FS Report, pgs. 131 and 138)
RID's Less Aggressive Remedial Alternative
Close review of RID's "Less Aggressive Remedial Alternative" discussed in Section 7.4
of the RID's Draft FS Report (pgs. 136-143) and the associated Table 7 - "Costs of Remedial Alternatives" and Table 10 - "Groundwater Remedial Actions - Comparative Analysis" provide
a way to compare RID's calculations and predictions in the Draft FS Report based upon RID's
MERA operational history. (See Exhibit "2") The RID's Less Aggressive Groundwater Alternative Remedy includes the four Phase 1 MERA wells RID-89, RID-92, RID-95 and RID-
114 plus the addition of wells identified as RID-106 and RID-109. Subtraction of the cost
elements in Table 7 and Table 10 of RID's Draft FS Report associated with RID-106 and RID-109 provides a valuable tool to evaluate RID's representative costs presented in the RID's Draft FS Report. It is problematic that RID's operational history for the Phase 1 MERA wells indicate that the RID has operated in by-pass/shutdown mode for a majority of the time since October
2012 (See Exhibit "3"). Meritor, Inc. has contracted with an environmental consultant, Arcadis
U.S., Inc. to assist in the evaluation of the cost elements presented by RID for their accuracy.
Issue No. 4 Conclusion
Based upon a review of RID's past performance in implementing the MERA well head treatment systems, RID's predictions or calculations in the Draft FS Report are generally suspect, inaccurate and/or probably overstated. Meritor Inc. does not adopt or accept RID's figures or projections for any purpose other than comparison. The RID's Draft FS Report should
9
440299 vi jdw;23787-000I
Danielle Taber January 13, 2015
be rejected by ADEQ and other FS Reports adopted due to RID's inability to operate existing wellhead treatment systems. As stated by RID, they assert that they are not required to conduct any work unless adequate funds are available from other third parties or from cost recovery actions. These sources of funds have not been available to RID, nor will they be available, any time in the near future (if ever).
10
440299 vl;jdw;23787-000I
Danielle Taber January 13, 2015
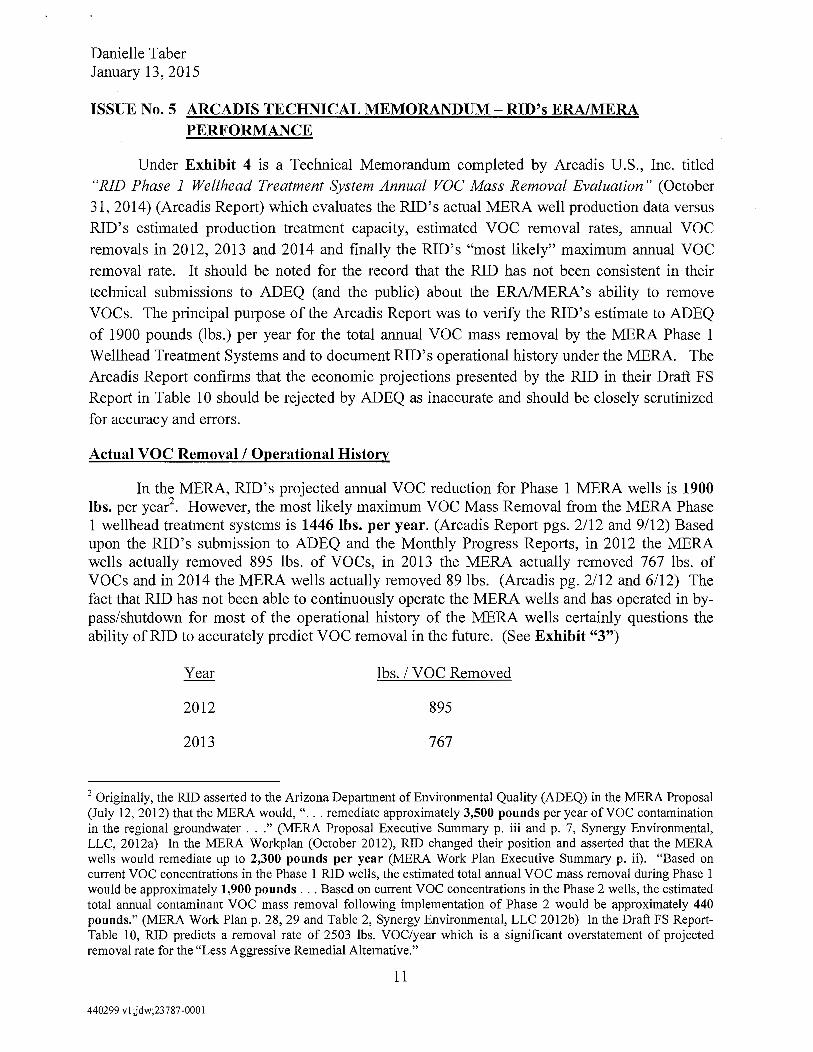
ISSUE No. 5 ARCADIS TECHNICAL MEMORANDUM - RID's ERA/MERA PERFORMANCE
Under Exhibit 4 is a Technical Memorandum completed by Arcadis U.S., Inc. titled "RID Phase 1 Wellhead Treatment System Annual VOC Mass Removal Evaluation" (October 31, 2014) (Arcadis Report) which evaluates the RID's actual MERA well production data versus RID's estimated production treatment capacity, estimated voe removal rates, annual VOe removals in 2012, 2013 and 2014 and finally the RID's "most likely" maximum annual voe removal rate. It should be noted for the record that the RID has not been consistent in their technical submissions to ADEQ (and the public) about the ERA/MERA's ability to remove VOes. The principal purpose of the Arcadis Report was to verify the RID's estimate to ADEQ of 1900 pounds (lbs.) per year for the total annual VOe mass removal by the MERA Phase 1 Wellhead Treatment Systems and to document RID's operational history under the MERA. The Arcadis Report confirms that the economic projections presented by the RID in their Draft FS Report in Table 10 should be rejected by ADEQ as inaccurate and should be closely scrutinized for accuracy and errors.
Actual VOC Removal I Operational History
In the MERA, RID's projected annual VOe reduction for Phase 1 MERA wells is 1900 lbs. per year2
. However, the most likely maximum VOe Mass Removal from the MERA Phase 1 wellhead treatment systems is 1446 lbs. per year. (Arcadis Report pgs. 2/12 and 9/12) Based upon the RID's submission to ADEQ and the Monthly Progress Reports, in 2012 the MERA wells actually removed 895 lbs. of voes, in 2013 the MERA actually removed 767 lbs. of voes and in 2014 the MERA wells actually removed 89 lbs. (Arcadis pg. 2/12 and 6/12) The fact that RID has not been able to continuously operate the MERA wells and has operated in bypass/shutdown for most of the operational history of the MERA wells certainly questions the ability of RID to accurately predict voe removal in the future. (See Exhibit "3")
Year lbs. I voe Removed
2012 895
2013 767
2 Originally, the RJD asserted to the Arizona Department of Environmental Quality (ADEQ) in the MERA Proposal (July 12, 2012) that the MERA would," ... remediate approximately 3,500 pounds per year ofVOe contamination in the regional groundwater ... " (MERA Proposal Executive Summary p. iii and p. 7, Synergy Environmental, LLe, 2012a) In the MERA Workplan (October 2012), RlD changed their position and asserted that the MERA wells would remediate up to 2,300 pounds per year (MERA Work Plan Executive Summary p. ii). "Based on current voe concentrations in the Phase 1 RJD wells, the estimated total annual VOe mass removal during Phase 1 would be approximately 1,900 pounds ... Based on current VOe concentrations in the Phase 2 wells, the estimated total annual contaminant voe mass removal following implementation of Phase 2 would be approximately 440 pounds." (MERA Work Plan p. 28, 29 and Table 2, Synergy Environmental, LLe 2012b) In the Draft FS ReportTable 10, RJD predicts a removal rate of 2503 lbs. voe/year which is a significant overstatement of projected removal rate for the "Less Aggressive Remedial Alternative."
11
440299 vi ;jdw;23787-000I
Danielle Taber January 13, 2015
2014
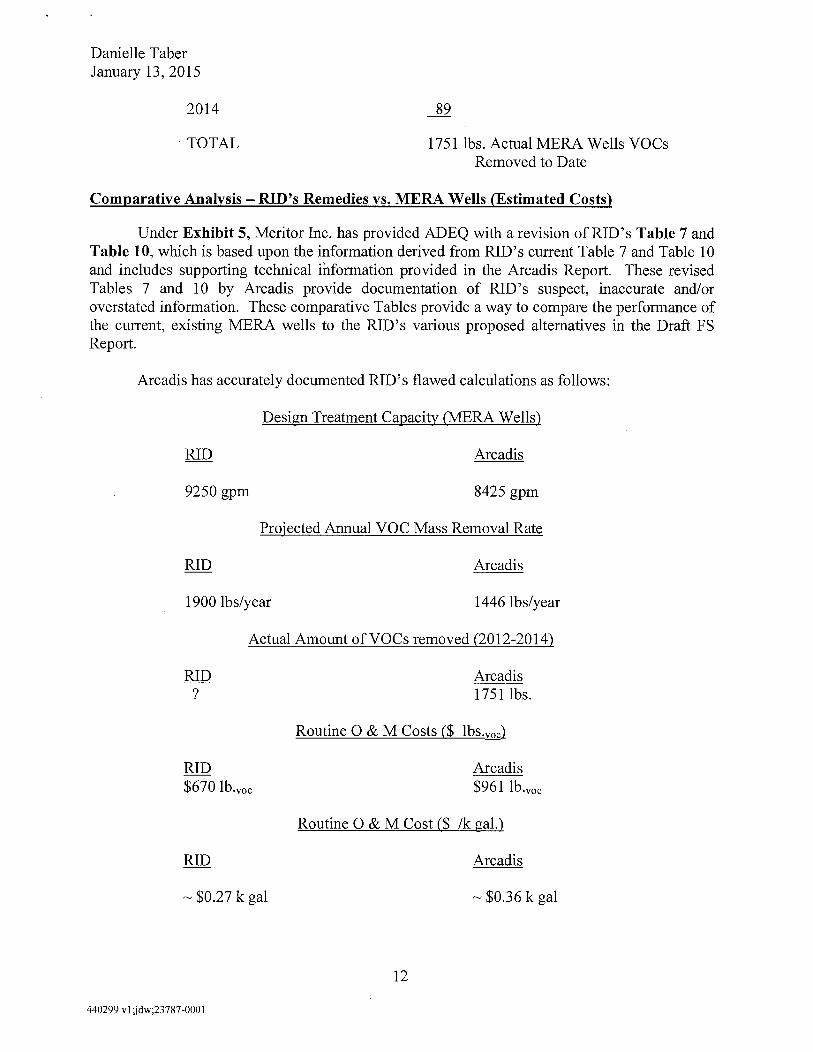
TOTAL 1751 lbs. Actual MERA Wells VOCs Removed to Date
Comparative Analysis -RID's Remedies vs. MERA Wells (Estimated Costs)
Under Exhibit 5, Meritor Inc. has provided ADEQ with a revision of RID's Table 7 and Table 10, which is based upon the information derived from RID's current Table 7 and Table 10 and includes supporting technical information provided in the Arcadis Report. These revised Tables 7 and 10 by Arcadis provide documentation of RID's suspect, inaccurate and/or overstated information. These comparative Tables provide a way to compare the performance of the current, existing MERA wells to the RID's various proposed alternatives in the Draft FS Report.
Arcadis has accurately documented RID's flawed calculations as follows:
Design Treatment Capacity (MERA Wells)
Arcadis
9250 gpm 8425 gpm
Projected Annual VOC Mass Removal Rate
Arcadis
1900 lbs/year 1446 lbs/year
Actual Amount ofVOCs removed (2012-2014)
RID ?
RID $670 lb.voe
RID
~ $0.27 k gal
440299 vljdw;23787-000I
Arcadis 1751 lbs.
Routine 0 & M Costs ($ lbs.voe}
Arcadis $961 lb.voe
Routine 0 & M Cost ($ /k gal.)
Arcadis
~ $0.36 k gal
12
Danielle Taber January 13, 2015
Issue No. 5 Conclusion
Based upon facts and calculations in the Arcadis Technical Memorandum, RID has overstated 1) the treatment capacity of the MERA wells (9250 gpm vs. actual 8425 gpm), 2) the Annual Maximum VOC Mass Removal Rate (1900 lbs./year vs. 1446 lbs./year), and understated 3) the routine Operation and Maintenance (0 & M) costs ($670 lb.voe vs. $961 lb.voe). It is clear that the calculations and costs predicted by RID in the Draft FS Report are suspect. It is obvious that all the RID's proposed costs/estimates identified in the RID's Alternative Remedies are significantly flawed. The Arcadis Report confirms that the economic projections presented by the RID in Table 10 of their Draft Feasibility Study Report and the subsequent Net Present Value Calculations in Table 8 should be rejected by ADEQ as inaccurate and should be closely scrutinized for accuracy and errors. The Draft Feasibility Study Report by RID should be rejected by ADEQ due to clear errors in the projected calculations and costs.
13
440299 vl ;jdw;23787-0001
Danielle Taber January 13, 2015
ISSUE No. 6 REMEDY COSTS
ADEQ is evaluating the merits of two competing FS Reports3. Both competing FS
Reports attempt to calculate the Net Present Value (30 year/NPV) of their proposals although there are some differences in how they reach those numbers (not surprising) but in reality the RID's preferred "Less Aggressive Alternative Remedy" is roughly $51 million and the WVBFS Group's "Reference Remedy is roughly $8.7 million. (See Exhibit "6") No matter how you calculate NPV what do you get for that significant difference in cost?
RID stated that, "Treated water that is conveyed via the Salt Canal will be used for
either agricultural purpose, by discharge into the Main Canal, or [municipal and industrial] M & I use. . . . RID anticipates a pipeline will be installed and available to deliver M & I water supplies within the next five (5) years .... For the near term, treated water to be conveyed through the Main Canal (and feeder laterals) to RID lands will continue for its current use as an agricultural water supply. However, RID anticipates that all RID water supply wells will be developed as future M & I drinking water supply sources in the reasonably foreseeable future." (See RID Draft FS Report p. 140)
The reality is that no municipality has contracted to receive RID's treated irrigation water which is currently blended with treated sewage effluent in the Main Canal before delivery to its irrigation customers. In addition, the Salt River Project has historically/currently asserted a legal right to the RID's irrigation water after 2026 based on historical contracts and water rights.
Issue No. 6 Conclusion
VOC mass removal just for the sake of mass removal makes no sense. The additional expenditure of $42.3 million is not reasonable, necessary or cost effective for the same use of the water. Arizona law under WQARF does not require mass removal under this scenario and EPA has generally endorsed the WVBFS Site Working Group's enhanced monitoring and natural attenuation approach to the FS in recent policy decisions. The Feasibility Study Report by the West Van Buren WQARF Site Working Group and the Reference Remedy proposed in that document is more cost effective than the one proposed by RID.
The water will continue to be used for irrigation purposes by RID, there is no calculated risk to the public or RID workers (in fact they shut down their system). RID has significantly overstated their VOC removal statistics to ADEQ and in reality they had 895 lbs. (2012), 767 lbs. (2013) and 89 lbs. (2014).
3 The West Van Buren WQARF Site Working Group's "Feasibility Study Report West Van Buren WQARF Site
Phoenix, Arizona" by Haley & Aldrich, Inc. (July 2014) and the Roosevelt Irrigation District's "Draft Feasibility Study Report West Van Buren Area WQARF Site" Prepared by Synergy Environmental, LLC and Montgomery & Associates (July 2014)
14
440299 vljdw;23787-0001
Danielle Taber January 13, 2015
COMMENT SUMMARY
Based on the conclusions found in the six identified issues, Meritor Inc. and Cooper Industries LLC request that ADEQ critically review and reject the RID's Draft Feasibility Study Report and the "Less Aggressive Alternative Remedy" that they propose. The RID's own documentation and report confirm that, " ... there is not an imminent risk to the public from the contamination being released from the RID water systems." Based upon the West Van Buren WQARF Site Working Group's HHRA and the ADHS's Health Consultation Report, there is no imminent or substantial endangerment to the public health or environment based upon three evaluations of human health risk. Based upon a review of RID's past performance in implementing the MERA, RID's predictions or calculations in their Draft Feasibility Study Report are generally suspect, inaccurate and/or probably overstated. The fact that RID has not been able to continuously operate the MERA wells and has operated in by-pass/shutdown for most of the operational history of the MERA wells certainly questions the ability of RID to accurately predict or implement VOC removal in the future. It is obvious that all the RID's proposed costs/estimates identified in the RID's Alternative Remedies are significantly understated. The Feasibility Study Report by the West Van Buren WQARF Site Working Group and the Reference Remedy proposed by them is more cost effective than the one proposed by RID. As required by A.R.S. 49-282.06, the WVBFS Group's Reference Remedy generally satisfies the required criteria.
ADEQ should adopt the Reference Remedy in the West Van Buren WQARF Site that is the least expensive alternative to control, manage and cleanup the West Van Buren Area WQARF Site.
Please call me at (602) 744-5763 with any questions.
JDW/pjb
440299 vl ;jdw;23787-0001
Sincerely,
~2>-~~ Grry. D. Worsham II
For the Firm
15


EXHIBIT "1"
Health Consultation
Evaluation of Water Sampling Results in the Roosevelt Irrigation District (RID)
PHOENIX, MARICOPA COUNTY, ARIZONA
Prepared by the
Arizona Department of Health Services
January 8, 2015
1
HEALTH CONSULTATION
Evaluation of Water Sampling Results in the Roosevelt Irrigation District {RID}
PHOENIX, MARICOPA COUNTY, ARIZONA
Prepared By:
Arizona Department of Health Services
Office of Environmental Health
Environmental Health Consultation Services
2
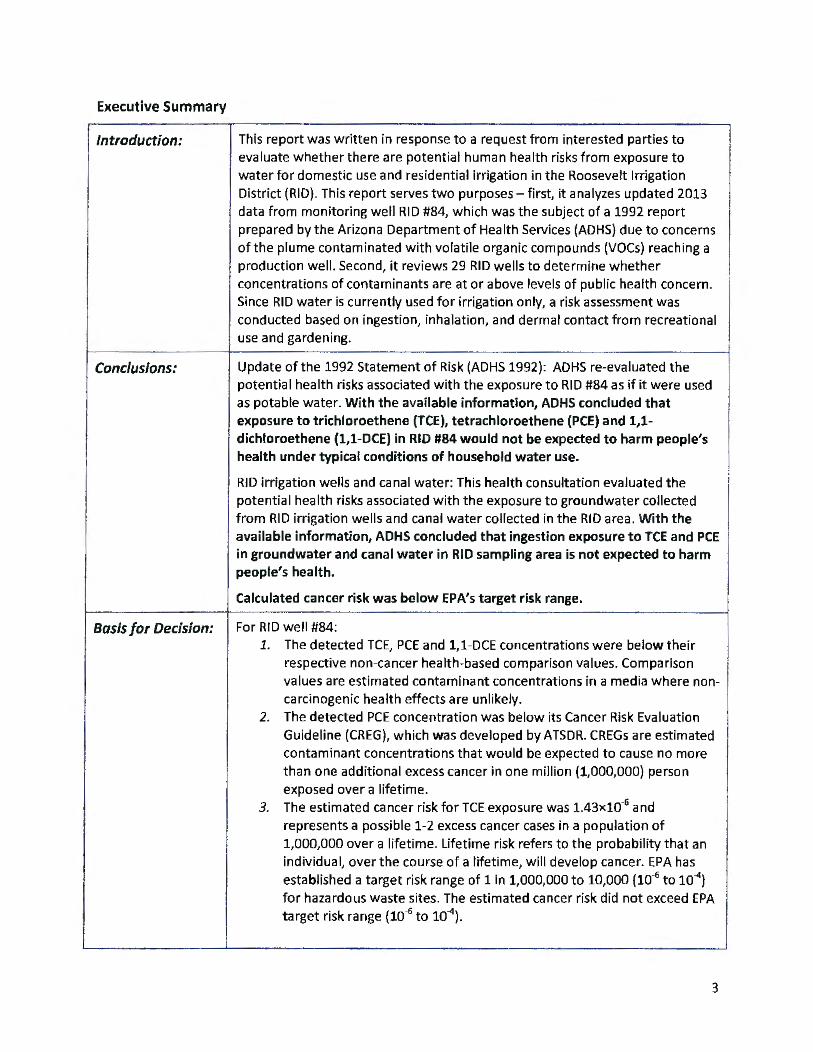
Executive Summary
Introduction:
Conclusions:
This report was written in response to a request from interested parties to evaluate w hether there are potential human health risks from exposure to water for domestic use and residential irrigation in the Roosevelt Irrigation District (RID). This report serves two purposes- first, it analyzes updated 2013 data from monitoring well RID #84, which was the subject of a 1992 report prepared by the Arizona Department of Health Services (ADHS) due to concerns of the plume contaminated with volatile organic compounds (VOCs) reaching a production well. Second, it reviews 29 RID wells to determine whether concentrations of contaminants are at or above levels of public health concern. Since RID water is currently used for irrigation only, a risk assessment was conducted based on ingestion, inhalation, and dermal contact from recreational use and gardening.
Update of the 1992 Statement of Risk (ADHS 1992): ADHS re-evaluated the potential health risks associated with the exposure to RID #84 as if it were used as potable water. With the available information, ADHS concluded that exposure to trichloroethene (TCE}, tetrachloroethene (PCE) and 1,1-dichtoroethene (1,1-DCE) in RID #84 would not be expected to harm people's health under typical conditions of household water use.
RID irrigation wells and canal water: This health consultation evaluated the potential health risks associated with the exposure to groundwater collected from RID irrigation wells and canal water collected in the RID area. With the available information, ADHS concluded that ingestion exposure to TCE and PCE
in groundwater and canal water in RID sampling area is not expected to harm people's health.
Calculated cancer risk was below EPA's target risk range.
Basis/or Decision: For RID well #84: 1. The detected TCE, PCE and 1,1-DCE concentrations were below their
respective non-cancer health-based comparison values. Comparison values are estimated contaminant concentrations in a media where noncarcinogenic health effects are unlikely.
2. The detected PCE concentration was below its Cancer Risk Evaluation Guideline (CREG), which was developed by ATSDR. CREGs are estimated contaminant concentrations that would be expected to cause no more than one additional excess cancer in one million {1,000,000} person exposed over a lifetime.
3. The estimated cancer risk for TCE exposure was 1.43xlff6 and represents a possible 1-2 excess cancer cases in a population of 1,000,000 over a lifetime. Lifetime risk refers to the probability that an individual, over the course of a lifetime, will develop cancer. EPA has established a target risk range of 1 in 1,000,000 to 10,000 {10"6 to 10"4
)
for hazardous waste sites. The estimated cancer risk did not exceed EPA target risk range (10-6 to 10-4 ).
3
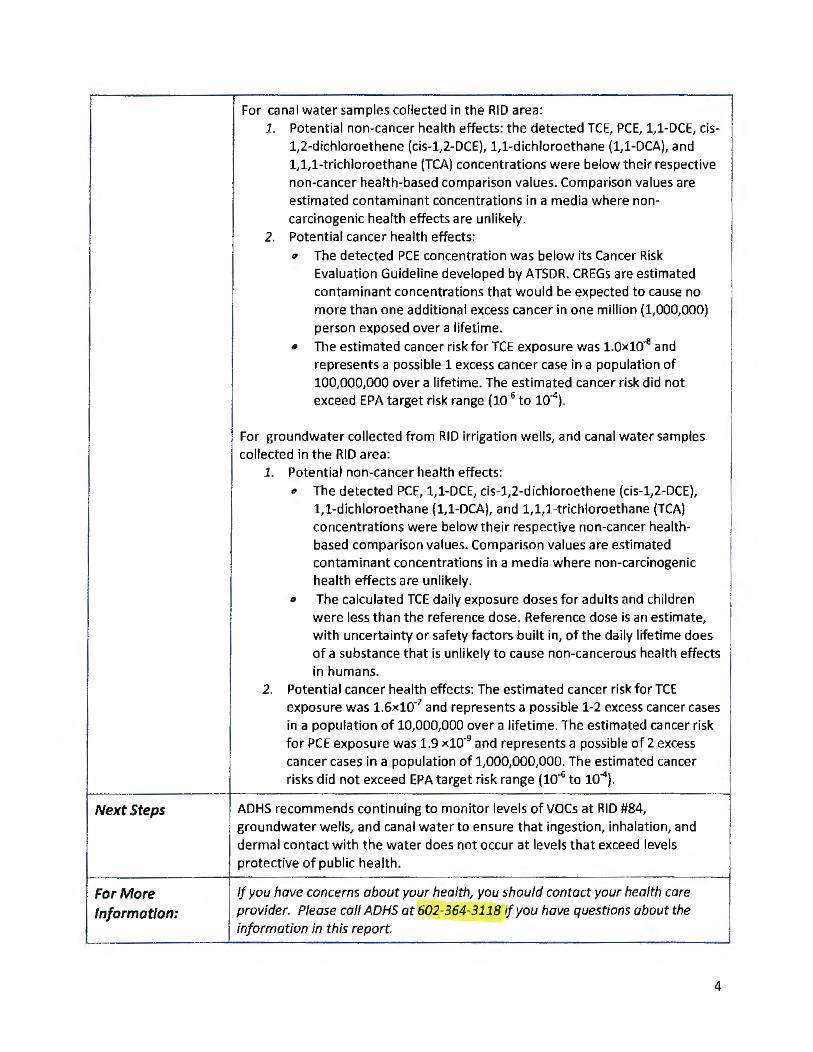
For canal water samples collected in the RID area: I 1. Potential non-cancer health effects: the detected TCE, PCE, 1,1-DCE, cis-1,2-dichloroethene (cis-1,2-DCE), 1,1-dichloroethane (l,1-DCA), and 1,1,1-trichloroethane (TCA) concentrations were below their respective non-cancer health-based comparison values. Comparison values are I estimated contaminant concentrations in a media where non-carcinogenic health effects are unlikely.
2. Potential cancer health effects:
" The detected PCE concentration was below its Cancer Risk Evaluation Guideline developed by ATSDR. CREGs are estimated contaminant concentrations that would be expected to cause no more than one additional excess cancer in one million {1,000,000) person exposed over a lifetime.
• The estimated cancer risk for TCE exposure was 1.0xlO-s and represents a possible 1 excess cancer case in a populat ion of
!
100,000,000 over a lifetime. The estimated cancer risk did not exceed EPA target risk range (10-6 to 10-4).
For groundwater collected from RID irrigation welts, and canal water samples collected in the RID area:
l. Potential non-cancer health effects:
" The detected PCE, 1,1-DCE, cis-1,2-dichloroethene (cis-1,2-DCE), 1,1-dichloroethane (1,1-DCA), and 1,1,1-trichloroethane (TCA) concentrations were below their respective non-cancer health-based comparison values. Comparison values are estimated contaminant concentrations in a media where non-carcinogenic health effects are unlikely.
• The calcu lated TCE daily exposure doses for adults and children I I
were less than the reference dose. Reference dose is an estimate, with uncertainty or safety factors built in, of the daily lifetime does of a substance that is unlikely to cause non-cancerous health effects in humans.
2. Potential cancer health effects: The estimated cancer risk for TCE exposure was 1.6xlff7 and represents a possible 1-2 excess cancer cases in a population of 10,000,000 over a lifetime. The estimated cancer risk for PCE exposure was 1.9 x10·9 and represents a possible of 2 excess cancer cases in a population of 1,000,000,000. The estimated cancer risks did not exceed EPA target risk range (10-6 to 10-4).
Next Steps ADHS recommends continuing to monitor levels of voes at RID #84, groundwater wells, and canal water to ensure that ingestion, inhalation, and dermal contact with the water does not occur at leve ls that exceed levels protective of public health.
For More If you have concerns about your health, you should contact your health care
Information: provider. Please call ADHS at 602-364-3118 if you have questions about the information in this report.
4
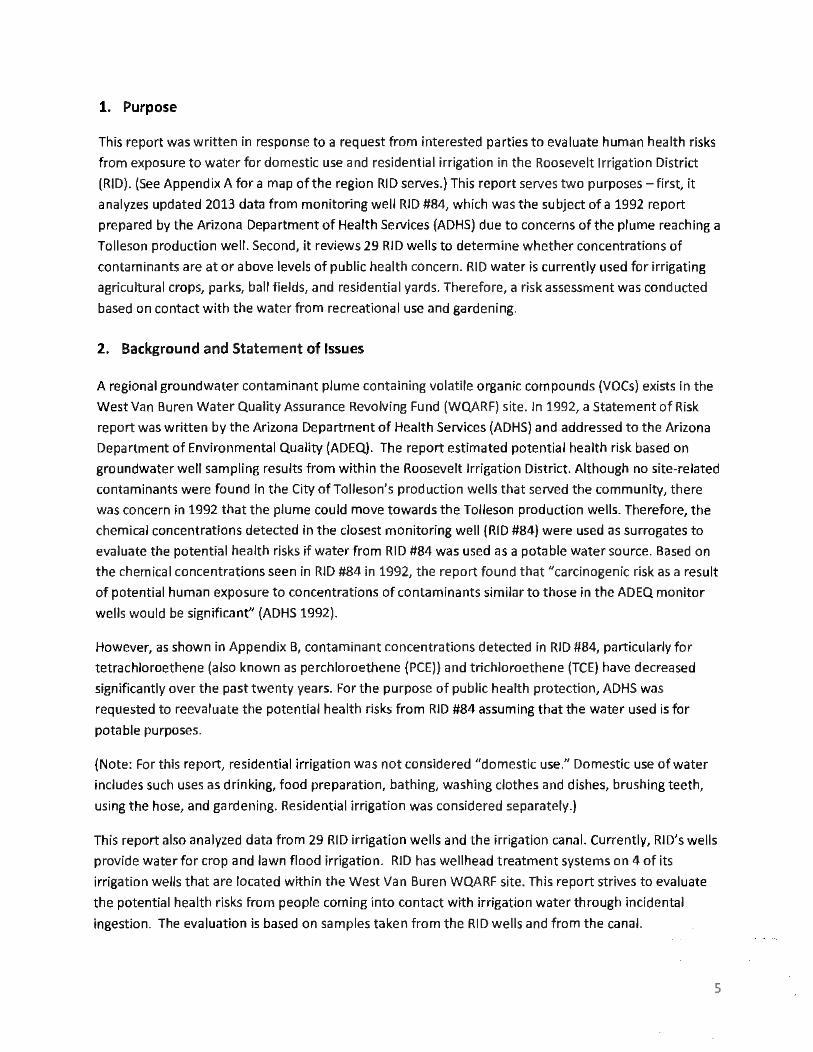
1. Purpose
This report was written in response to a request from interested parties to evaluate human health risks
from exposure to water for domestic use and residential irrigation in the Roosevelt Irrigation District
(RID). (See Append ix A for a map of the region RID serves.) This report serves two purposes -first, it
analyzes updated 2013 data from monitoring well RID #84, which was the subject of a 1992 report
prepared by the Arizona Department of Health Services (ADHS) due to concerns of the plume reaching a
Tolleson production well. Second, it reviews 29 RID wells to determine whether concentrations of
contaminants are at or above levels of public heal th concern. RID water is currently used for irrigating
agricultural crops, parks, ball fields, and residential yards. Therefore, a risk assessment was conducted
based on contact with the water from recreational use and gardening.
2. Background and Statement of Issues
A regional groundwater contaminant plume containing volatile organic compounds (VOCs) exists in the
West Van Buren Water Quality Assurance Revolving Fund (WQARF) site. In 1992, a Statement of Risk
report was written by the Arizona Department of Health Services (ADHS) and addressed to the Arizona
Department of Environmental Quality (ADEQ). The report estimated potential health risk based on
groundwater well sampling results from within the Roosevelt Irrigation District. Although no site-related
contaminants were found in the City of Tolleson's production wells that served the community, there
was concern in 1992 that the plume could move towards the Tolleson production wells. Therefore, the
chemical concentrations detected in the closest monitoring well {RID #84) were used as surrogates to
evaluate the potential health risks if water from RID #84 was used as a potable water source. Based on
the chemical concentrations seen in RID #84 in 1992, the report found that "carcinogenic risk as a result
of potential human exposure to concentrations of contaminants similar to those in the ADEQ monitor
wells would be significant" (ADHS 1992).
However, as shown in Appendix B, contaminant concentrations detected in RID #84, particularly for
tetrachloroethene (also known as perchloroethene (PCE)) and trichloroethene (TCE) have decreased
significantly over the past twenty years. For the purpose of public health protection, ADHS was
requested to reevaluate the potential health risks from RID #84 assuming that the water used is for
potable purposes.
(Note: For this report, residential irrigation was not considered "domestic use." Domestic use of water
includes such uses as drinking, food preparation, bathing, washing clothes and dishes, brushing teeth,
using the hose, and gardening. Residential irrigation was considered separately.)
This report also analyzed data from 29 RID irrigation wells and the irrigation canal. Currently, RI D's wells
provide water for crop and lawn flood irrigation. RID has wellhead treatment systems on 4 of its
irrigation wells that are located within the West Van Buren WQARF site. This report strives to evaluate
the potential health risks from people coming into contact with irrigation water through incidental
ingestion. The evaluation is based on samples taken from the RID wells and from the canal.
s
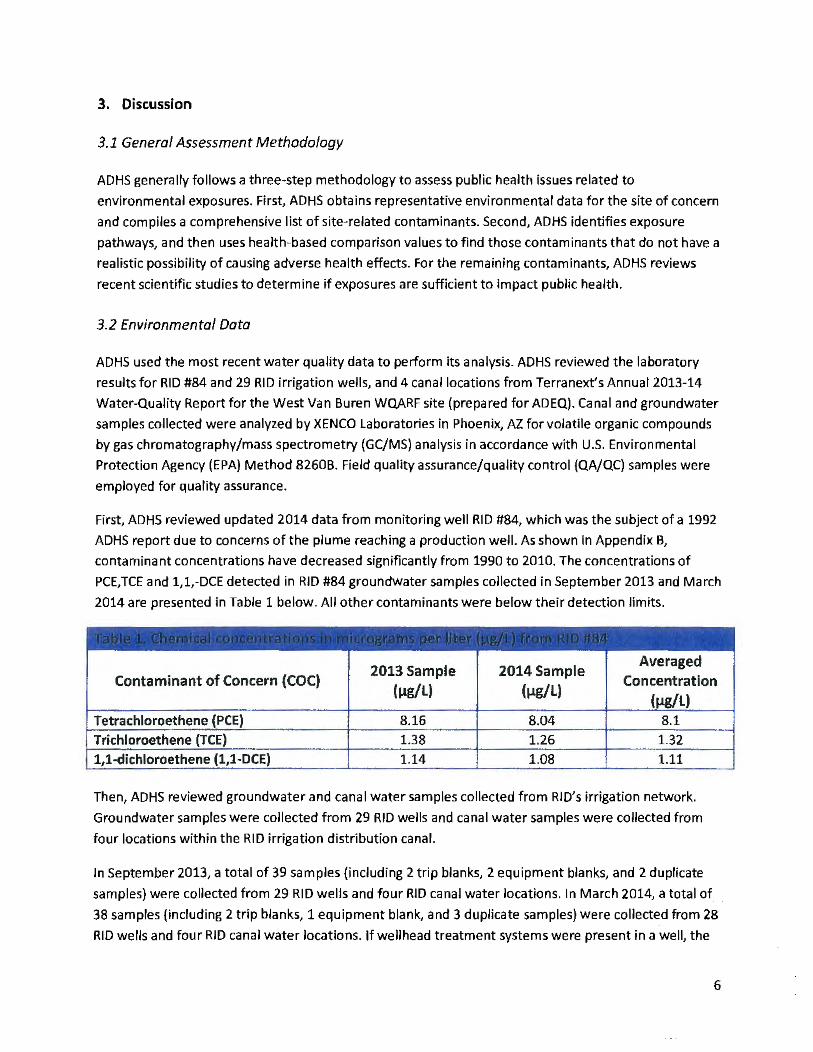
3. Discussion
3.1 General Assessment Methodology
ADHS generally follows a three-step methodology to assess public health issues related to
environmental exposures. First, ADHS obtains representative environmental data for the site of concern
and compiles a comprehensive list of site-related contaminants. Second, ADHS identifies exposure
pathways, and then uses health-based comparison values to find those contaminants that do not have a
realistic possibility of causing adverse health effects. For the remaining contaminants, ADHS reviews
recent scientific studies to determine if exposures are sufficient to impact public health.
3.2 Environmental Data
ADHS used the most recent water quality data to perform its analysis. ADHS reviewed the laboratory
results for RID #84 and 29 RID irrigation wells, and 4 canal locations from Terranext's Annual 2013-14
Water-Quality Report for the West Van Buren WQARF site (prepared for ADEQ). Canal and groundwater
samples collected were analyzed by XENCO Laboratories in Phoenix, AZ for volatile organic compounds
by gas chromatography/mass spectrometry {GC/MS) analysis in accordance with U.S. Environmental
Protection Agency (EPA) Method 8260B. Field quality assurance/quality control (QA/QC) samples were
employed for quality assurance.
First, ADHS reviewed updated 2014 data from monitoring well RID #84, which was the subject of a 1992
ADHS report due to concerns of the plume reaching a production well. As shown in Appendix B,
contaminant concentrations have decreased significantly from 1990 to 2010. The concentrations of
PCE,TCE and 1,1,-DCE detected in RID #84 groundwater samples collected in September 2013 and March
2014 are presented in Table 1 below. All other contaminants were below their detection limits.
Averaged 2013Sample 2014 Sample
Contaminant of Concern (COC) (µg/L) (µg/l)
Concentration (µg/L)
Tetrachloroethene (PCE) 8.16 8.04 8.1
Trichloroethene (TCE) 1.38 1.26 1.32 1,1-dichloroethene (1,1-DCE) 1.14 1.08 1.11
Then, ADHS reviewed groundwater and canal water samples collected from RJO's irrigation network.
Groundwater samples were collected from 29 RID wells and canal water samples were collected from
four locations within the RID irrigation distribution canal.
In September 2013, a total of 39 samples (including 2 trip blanks, 2 equipment blanks, and 2 duplicate
samples} were collected from 29 RID wells and four RID canal water locations. In March 2014, a total of
38 samples (including 2 trip blanks, 1 equipment blank, and 3 duplicate samples) were collected from 28
RID wells and four RID canal water locations. If wellhead treatment systems were present in a well, the
6
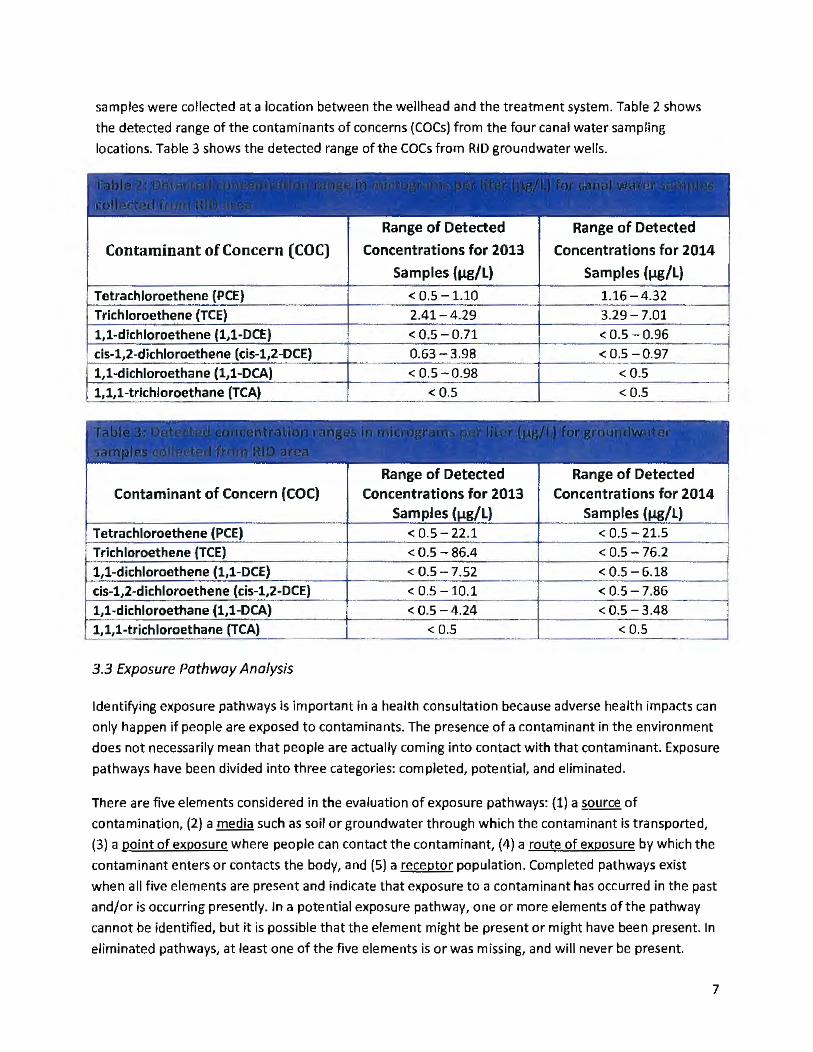
samples were collected at a location between the wellhead and the treatment system. Table 2 shows
the detected range of the contaminants of concerns (COCs) from the four canal water sampling
locations. Table 3 shows the detected range of the COCs from RID groundwater wells.
Contaminant of Concern (COC)
Tetrachloroethene (PCE)
Trichloroethene (TCE)
1,1-dichloroethene {1,1-DCE)
cis-1,2-dich loroethene ( cis-1,2-DCE)
1,1-dichloroethane (1,1-0CA)
1,1, 1-trichloroethane (TCA)
Contaminant of Concern (COC)
Tetrachloroethene {PCE)
Trichloroethene (TCE)
1,1-dichloroethene {1,1-0CE)
cis-1,2-dichloroethe ne (cis-1,2-DCE)
1,1-dichloroethane (1,1-DCA)
1, 1, 1-trich loroethane (TCA)
3.3 Exposure Pathway Analysis
Range of Detected
Concentrations for 2013
Samples (µg/L)
< 0.5 -1.10 2.41 - 4.29
< 0.5-0.71 0.63-3.98 < 0.5 - 0.98
< 0.5
Range of Detected
Concentrations for 2013 Samples (µg/L)
< 0.5-22.1 < 0.5-86.4
< 0.5 - 7.52
< 0.5 -10.1 < 0.5-4.24
< 0.5
Range of Detected
Concentrations for 2014
Samples (µg/l)
1.16-4.32 3.29- 7.01
< 0.5-0.96 < 0.5-0.97
< 0.5
< 0.5
Range of Detected
Concentrations for 2014 Samples (µg/l)
< 0.5 -21.5
< 0.5- 76.2 < 0.5-6.18 < 0.5- 7.86 < 0.5-3.48
< 0.5
Identifying exposure pathways is important in a health consultation because adverse health impacts can
only happen if people are exposed to contaminants. The presence of a contaminant in the environment
does not necessarily mean that people are actually coming into contact with that contaminant. Exposure
pathways have been divided into three categories: completed, potential, and eliminated.
There are five elements considered in the evaluation of exposure pathways: (1) a source of
contamination, (2) a media such as soil or groundwater through which the contaminant is transported,
(3) a point of exposure where people can contact the contaminant, (4) a route of exposure by which the
contaminant enters or contacts the body, and (5) a receptor population. Completed pathways exist
when all five elements are present and indicate that exposure to a contaminant has occurred in the past
and/or is occurring presently. In a potential exposure pathway, one or more elements of the pathway
cannot be identified, but it is possible that the element might be present or might have been present. In
eliminated pathways, at least one of the five elements is or was missing, and will never be present.
7
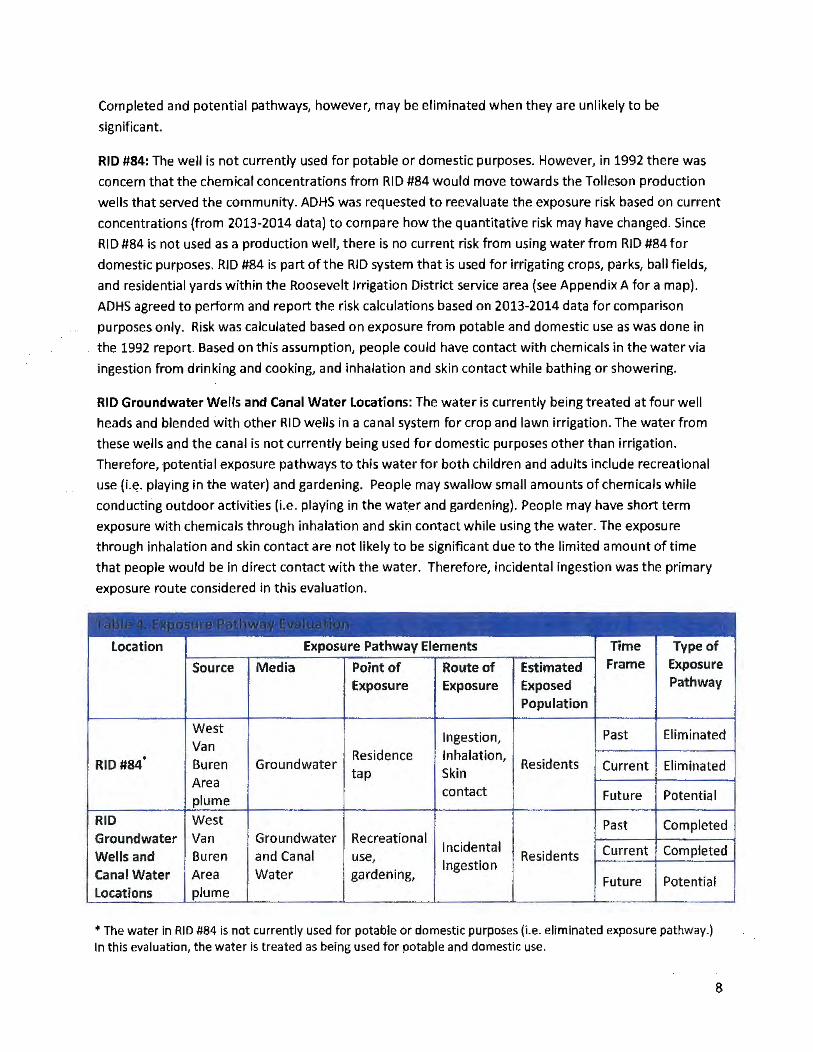
Completed and potential pathways, however, may be eliminated when they are unlikely to be
significant.
RID #84: The well is not currently used for potable or domestic purposes. However, in 1992 there was
concern that the chemical concentrations from RID #84 would move towards the Tolleson production
wells that served the community. ADHS was requested to reevaluate the exposure risk based on current
concentrations (from 2013-2014 data) to compare how the quantitative risk may have changed. Since
RID #84 is not used as a production well, there is no current risk from using water from RID #84 for
domestic purposes. RID #84 is part of the RID system that is used for irrigating crops, parks, ball fields,
and residential yards within the Roosevelt Irrigation District service area (see Appendix A for a map).
AOHS agreed to perform and report the risk calculations based on 2013-2014 data for comparison
purposes only. Risk was calculated based on exposure from potable and domestic use as was done in
the 1992 report. Based on this assumption, people could have contact with chemicals in the water via
ingestion from drinking and cooking, and inhalation and skin contact while bathing or showering.
RID Groundwater Wells and Canal Water Locations: The water is currently being treated at four well
heads and blended with other RID wells in a canal system for crop and lawn irrigation. The water from
these wells and the canal is not currently being used for domestic purposes other than irrigation.
Therefore, potentia I exposure pathways to this water for both children and adults include recreational
use (Le. playing in the water) and gardening. People may swallow small amounts of chemicals while
conducting outdoor activities (i.e. playing in the water and gardening). People may have short term
exposure with chemicals through inhalation and skin contact while using the water. The exposure
through inhalation and skin contact are not likely to be significant due to the limited amount of time
that people would be in direct contact with the water. Therefore, incidental ingestion was the primary
exposure route considered in this evaluation.
Location Exposure Pathway Elements Time Type of
Source Media Point of Route of Estimated Frame Exposure
Exposure Exposure Exposed Pathway
Population
West Ingestion, Past Eliminated
Van Residence Inhalation,
RID #84° Buren Groundwater Residents Eliminated tap Skin Current
Area plume
contact Future Potential
RID West Past Completed Groundwater Van Groundwater Re creati o na I Wells and Buren and Canal
Incidental Residents Current Completed use,
Canal Water Area Water gardening, Ingestion
Future Potential Locations plume
•The water in RID #84 is not currently used for potable or domestic purposes (i.e. eliminated exposure pathway.) In this evaluation, the water is treated as being used for potable and domestic use.
8
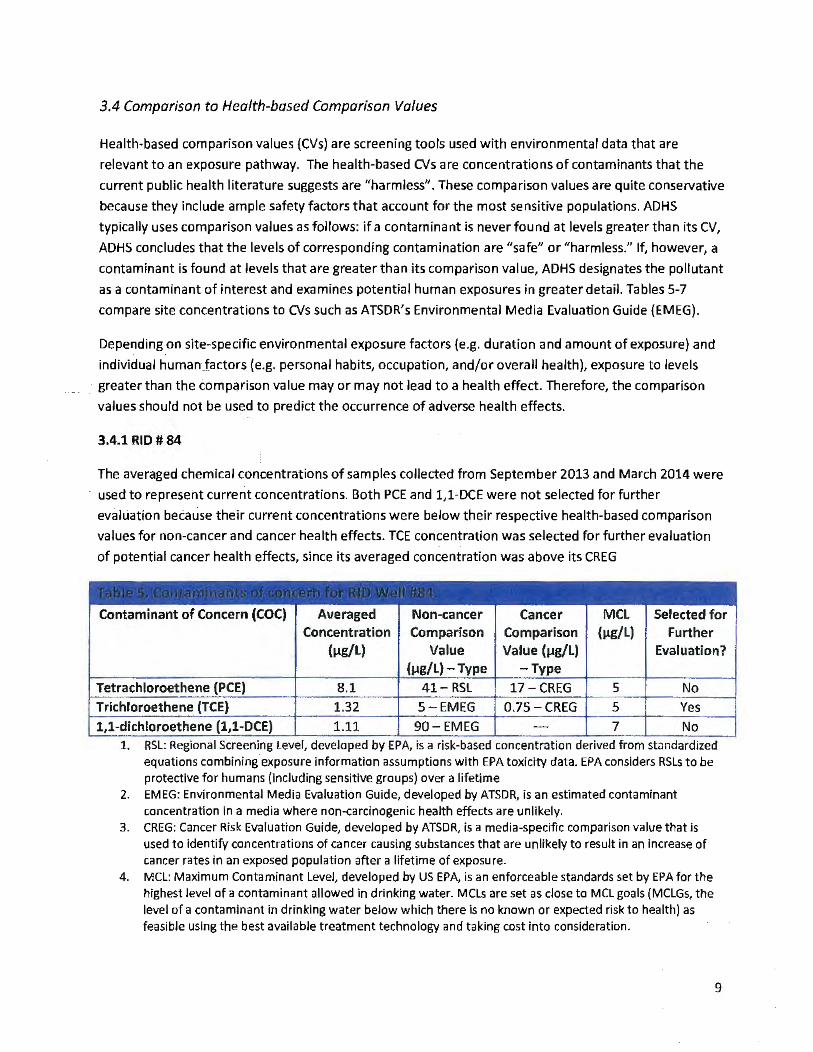
3.4 Comparison to Health-based Comparison Values
Health-based comparison values {CVs) are screening tools used with environmental data that are
relevant to an exposure pathway. The health-based CVs are concentrations of contaminants that the
current public health literature suggests are "harmless". These comparison values are quite conservative
because they include ample safety factors that account for the most sensitive populations. ADHS
typically uses comparison values as follows: if a contaminant is never found at levels greater than its CV,
ADHS concludes that the levels of corresponding contamination are "safe" or "harmless." If, however, a
contaminant is found at levels that are greater than its comparison value, ADHS designates the pollutant
as a contaminant of interest and examines potential human exposures in greater detail. Tables 5-7
compare site concentrations to CVs such as ATSDR's Environmental Media Evaluation Guide {EMEG).
Depending on site-specific environmental exposure factors {e.g. duration and amount of exposure} and
individual human factors (e.g. personal habits, occupation, and/or overall health), exposure to levels
greater than the comparison value may or may not lead to a health effect. Therefore, the comparison
values should not be used to predict the occurrence of adverse health effects.
3.4.1RID#84
The averaged chemical concentrations of samples collected from September 2013 and March 2014 were
used to represent current concentrations. Both PCE and 1,1-DCE were not selected for further
evaluation because their current concentrations were below their respective health-based comparison
values for non-cancer and cancer health effects. TCE concentration was selected for further evaluation
of potential cancer health effects, since its averaged concentration was above its CREG
Contaminant of Concern (COC) Averaged Non-cancer Cancer MCL Selected for Concentration Comparison Comparison (µg/L) Further
(µg/L) Value Value (µg/L) Evaluation? (µg/L} - Type -Type
Tetrachloroethene {PCE) 8.1 41- RSL 17-CREG s No
Trichloroethene (TCE} 1.32 5 -EMEG 0.75-CREG 5 Yes
1,1-dichloroethene (1,1-DCE) 1.11 90-EMEG 7 No 1. RSL: Regional Screening level, developed by EPA, is a risk-based concentration derived from standardized
equations combining exposure information assumptions with EPA toxicity data. EPA considers RSLs to be protective for humans (including sensitive groups) over a lifetime
2. EMEG: Environmental Media Evaluation Guide, developed by ATSDR, is an estimated contaminant concentration in a media where non-carcinogenic health effects are unlikely.
3. CREG: Cancer Risk Evaluation Guide, developed by ATSDR, is a media-specific comparison value that ls used to identify concentrations of cancer causing substances that are unlikely to result in an increase of cancer rates in an exposed population after a lifetime of exposure.
4. MCL: Maximum Contaminant level, developed by US EPA, is an enforceable standards set by EPA for the highest level of a contaminant allowed in drinking water. MCLs are set as close to MCL goals (MCLGs, the level of a contaminant in drinking water below which there is no known or expected risk to health) as feasible using the best available treatment technology and taking cost into consideration.
9
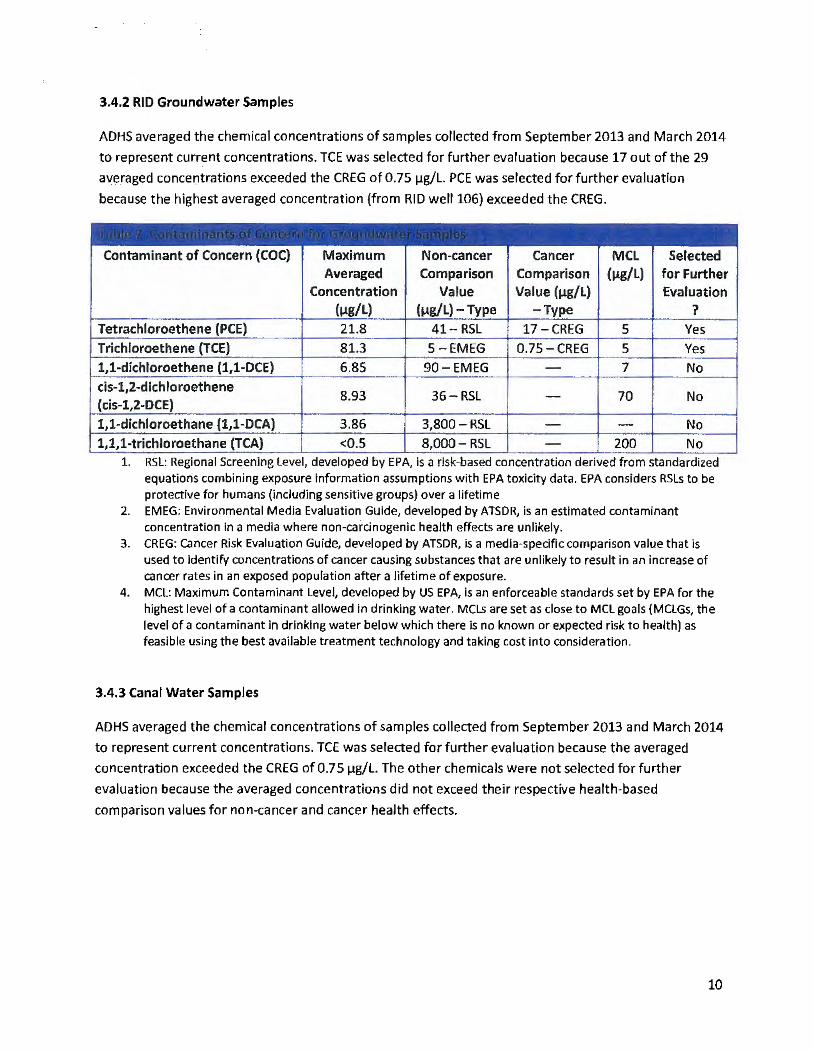
3.4.2 RID Groundwater Samples
ADHS averaged the chemical concentrations of samples collected from September 2013 and March 2014
to represent current concentrations. TCE was selected for further evaluation because 17 out of the 29
averaged concentrations exceeded the CREG of 0.75 µg/L. PCE was selected for further evaluation
because the highest averaged concentration (from RID well 106) exceeded the CREG.
Contaminant of Concern (COC}
Tetrachloroethene (PCE)
Trichloroethene (TCE)
1,1-dichloroethene (1,1-DCE)
cis-1,2-d ich loroethene (cis-1,2-DCE)
1,1-dichloroethane (1,1-DCA)
1,1,1-trichloroethane (TCA}
Maximum Averaged
Concentration (µg/L)
21.8
81.3
6.85
8.93
3.86
<0.5
Non-cancer
Comparison Value
(µg/L) - Type
41- RSL
5-EMEG 90-EMEG
36-RSL
3,800- RSL
8,000- RSL
Cancer
Comparison Value (µg/L)
-Type
17-CREG
0.75-CREG
MCL Selected (µg/L) for Further
Evaluation
? s Yes
5 Yes 7 No
70 No
No 200 No
1. RSL: Regional Screening level, developed by EPA, is a risk-based concentration derived from standardized equations combining exposure information assumptions with EPA toxicity data. EPA considers RSLs to be protective for humans (including sensitive groups) over a lifetime
2. EMEG: Environmental Media Evaluation Guide, developed by ATS DR, is an estimated contaminant concentration in a media where non-carcinogenic health effects are unlikely.
3. CREG: cancer Risk Evaluation Guide, developed by ATSDR, is a media-specific comparison value that is used to identify concentrations of cancer causing substances that are unlikely to result in an increase of cancer rates in an exposed population after a lifetime of exposure.
4. MCL: Maximum Contaminant Level, developed by US EPA, is an enforceable standards set by EPA for the highest level of a contaminant allowed in drinking water. MCLs are set as close to MCL goals {MCLGs, the level of a contaminant in drinking water below which there is no known or expected risk to health) as feasible using the best available treatment technology and taking cost into consideration.
3.4.3 Canal Water Samples
ADHS averaged the chemical concentrations of samples collected from September 2013 and March 2014
to represent current concentrations. TCE was selected for further evaluation because the averaged
concentration exceeded the CREG of 0.75 µg/l. The other chemicals were not selected for further
evaluation because the averaged concentrations did not exceed their respective health-based
comparison values for non-cancer and cancer health effects.
10
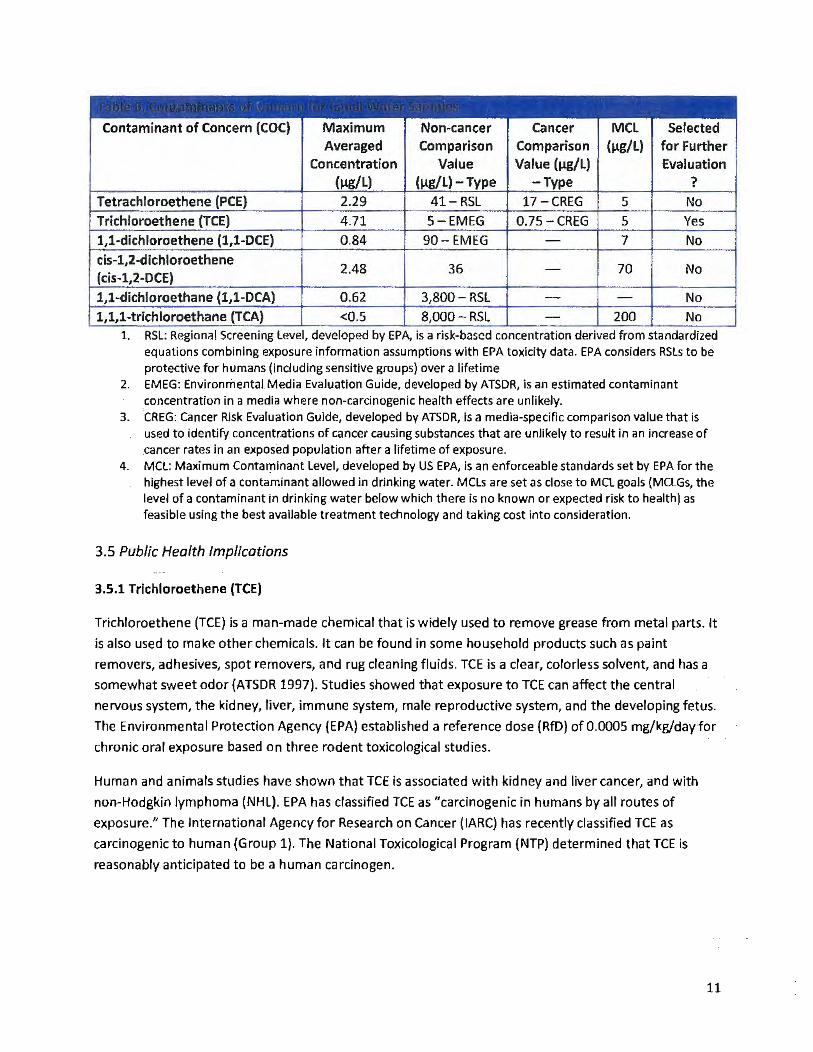
Contaminant of Concern (COC) Maximum Non-cancer Cancer MCL Selected Averaged Comparison
Concentration Value Comparison Value (µg/L)
(µg/l) for Further Evaluation
Tetrachloroethene (PCE} Trichloroethene (TCE)
1,1-dichloroethene (1,1-DCE)
cls-1,2-dichloroethene (cis-1,2-0CE) 1,1-dichloroethane (1,1-DCA)
1,1,l-trichloroethane (TCA)
(µg/L)
2.29
4.71
0.84
2.48
0.62 <0.5
(µg/L)-Type
41- RSL
5-EMEG
90-EMEG
36
3,800-RSL
8,000- RSL
-Type ? 17-CREG 5 No
0.75-CREG 5 Yes
7 No
70 No
No
200 No 1. RSL: Regional Screening level, developed by EPA, is a risk-based concentration derived from standardized
equations combining exposure information assumptions with EPA toxicity data. EPA considers RSls to be protective for humans (including sensitive groups} over a lifetime
2. EMEG: Environmental Media Evaluation Guide, developed by ATSDR, is an estimated contaminant concentration in a media where non-carcinogenic health effects are unlikely.
3. CREG: Cancer Risk Evaluation Guide, developed by ATSDR, is a media-specific comparison value that is used to identify concentrations of cancer causing substances that are unlikely to result in an increase of cancer rates in an exposed population after a lifetime of exposure.
4. MCL: Maximum Contaminant Level, developed by US EPA, is an enforceable standards set by EPA for the highest level of a contaminant allowed in drinking water. MCLs are set as close to MCL goals (MCLGs, the level of a contaminant in drinking water below which there is no known or expected risk to health) as feasible using the best available treatment technology and taking cost Into consideration.
3.5 Public Health Implications
3.5.1 Trichloroethene (TCE)
Trichloroethene (TCE) is a man-made chemical that is widely used to remove grease from metal parts. It
is also used to make other chemicals. It can be found in some household products such as paint
removers, adhesives, spot removers, and rug cleaning fluids . TCE is a clear, colorless solvent, and has a
somewhat sweet odor (ATSDR 1997). Studies showed that exposure to TCE can affect the central
nervous system, the kidney, liver, immune system, male reproductive system, and the developing fetus.
The Environmental Protection Agency (EPA} established a reference dose {RfD) of 0.0005 mg/kg/day for
chronic oral exposure based on three rodent toxicological studies.
Human and animals studies have shown that TCE is associated with kidney and liver cancer, and with
non-Hodgkin lymphoma (NHL). EPA has classified TCE as "carcinogenic in humans by all routes of
exposure." The International Agency for Research on Cancer (IARC) has recently classified TCE as
carcinogenic to human (Group 1). The National Toxicological Program (NTP) determined that TCE is
reasonably anticipated to be a human carcinogen.
11
••
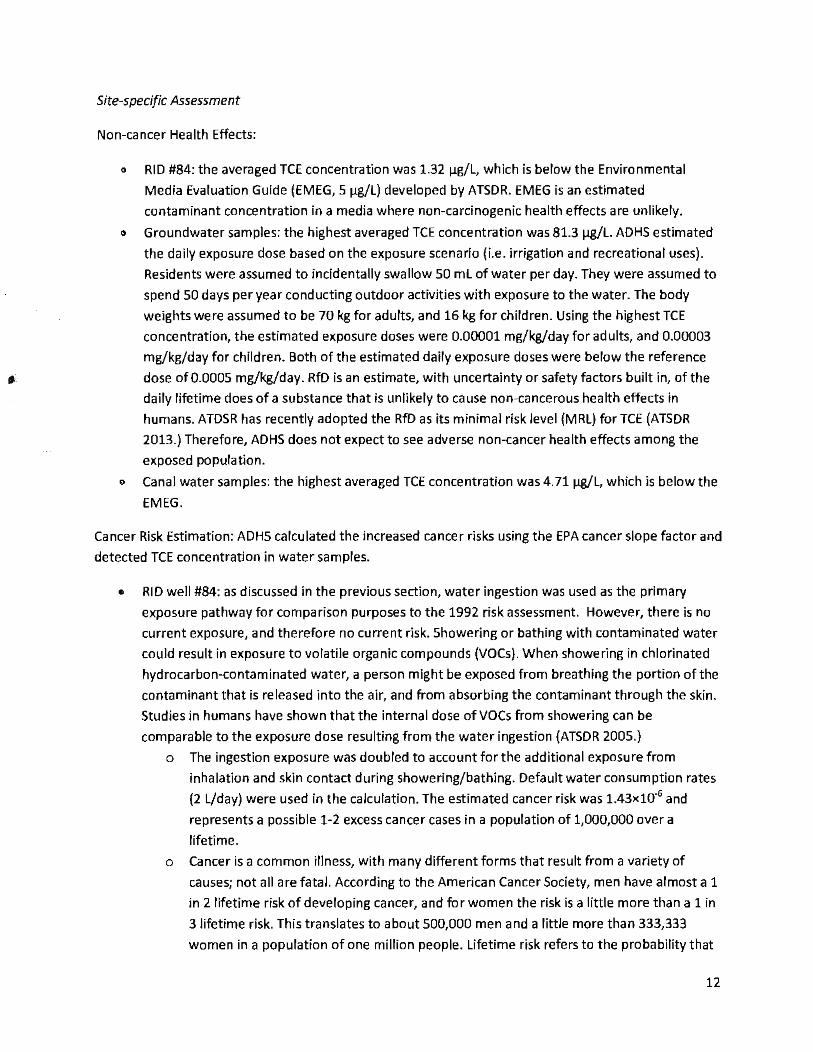
Site-specific Assessment
Non-cancer Health Effects:
o RID #84: the averaged TCE concentration was 1.32 µg/L, which is below the Environmental
Media Evaluation Guide (EMEG, 5 µg/l) developed by ATSDR. EMEG is an estimated
contaminant concentration in a media where non-carcinogenic health effects are unlikely.
" Groundwater samples: the highest averaged TCE concentration was 81.3 µg/l. AOHS estimated
the daily exposure dose based on the exposure scenario {i.e. irrigation and recreational uses).
Residents were assumed to incidentally swallow 50 ml of water per day. They were assumed to
spend 50 days per year conducting outdoor activities with exposure to the water. The body
weights were assumed to be 70 kg for adults, and 16 kg for children. Using the highest TCE
concentration, the estimated exposure doses were 0.00001 mg/kg/day for adults, and 0.00003
mg/kg/day for children. Both of the estimated daily exposure doses were below the reference
dose of 0.0005 mg/kg/day. RfD is an estimate, with uncertainty or safety factors built in, of the
daily lifetime does of a substance that is unlikely to cause non-cancerous health effects in
humans. ATDSR has recently adopted the RfD as its minimal risk level {MRL) for TCE (ATSOR
2013.) Therefore, AOHS does not expect to see adverse non-cancer health effects among the
exposed population.
o Canal water samples: the highest averaged TCE concentration was 4.71 µg/l, which is below the
EMEG.
Cancer Risk Estimation: ADHS calculated the increased cancer risks using the EPA cancer slope factor and
detected TCE concentration in water samples.
• RID well #84: as discussed in the previous section, water ingestion was used as the primary
exposure pathway for comparison purposes to the 1992 risk assessment. However, there is no
current exposure, and therefore no current risk. Showering or bathing with contaminated water
could result in exposure to volatile organic compounds (VOCs). When showering in chlorinated
hydrocarbon-contaminated water, a person might be exposed from breathing the portion of the
contaminant that is released into the air, and from absorbing the contaminant through the skin.
Studies in humans have shown that the internal dose of VOCs from showering can be
comparable to the exposure dose resulting from the water ingestion {ATSOR 2005.}
o The ingestion exposure was doubled to account for the additional exposure from
inhalation and skin contact during showering/bathing. Default water consumption rates
(2 L/day} were used in the calculation. The estimated cancer risk was 1.43x10"6 and
represents a possible 1-2 excess cancer cases in a population of 1,000,000 over a
lifetime.
o Cancer is a common illness, with many different forms that result from a variety of
causes; not all are fatal. According to the American Cancer Society, men have almost a 1
in 2 lifetime risk of developing cancer, and for women the risk is a little more than a 1 in
3 lifetime risk. This translates to about 500,000 men and a little more than 333,333
women in a population of one million people. Lifetime risk refers to the probability that
12
an individual, over the course of a lifetime, will develop cancer. EPA has established a
target risk range of 1 in 1,000,000 to 10,000 {10-6 to 1ff4) for hazardous waste sites. The
estimated cancer risk did not exceed EPA target risk range.
e Groundwater samples: as discussed in the previous section, water ingestion is the primary
exposure pathway. ADHS used the highest averaged TCE concentration 81.3 µg/L to estimate
the cancer risk. The result showed: 1.67x1ff7 and represents a possible of 1-2 excess cancer
cases in a population of ten million (10,000,000). The estimated cancer risk did not exceed EPA
target risk range .
• Canal water samples: as discussed in the previous section, water ingestion is the primary
exposure pathway. Exposure through inhalation and skin contact are not likely to be significant
due to the limited amount of time that people would be in contact with the water. The highest
averaged TCE concentration 4.71 µg/l was used to estimate the cancer risk. Residents were
assumed to incidentally swallow 50 ml of water per day. They were assumed to spend 50 days
per year to conduct site-related outdoor activities. The estimated cancer risk was 1.0x1ff8 and
represents a possible of 1 excess cancer case in a population of a hundred million (100,000,000).
The estimated cancer risk did not exceed EPA target risk range.
3.5.2 Tetrachloroethene (PCE)
Tetrachforoethene (PCE) is a man-made chemical that is widely used for the drying of fabrics, including
clothes. It is also used for degreasing metal parts, and making other chemicals. PCE is found in a variety
of consumer products such as break and wood cleaners, glues, laundry aids, paint removers, and suede
protectors. PCE is a nonflammable, colorless liquid at room temperature. It evaporates easily into the air
and has a sharp, sweet-smelling odor. Most people can smell PCE in air at levels in excess of 7,000 µg/m3
(ATSDR 1997).
PCE can affect the central nervous system (sensitive endpoint), the liver, kidney, immune system, and
perhaps the reproductive system. Both animal and human studies showed that PCE exposure results in
visual changes, increased reaction time, and reduction in mental abilities in learning and
com pre he nsio n.
The US Department of Health and Human Services (DHHS) has determined that PCE may reasonably be
anticipated to be a human carcinogen {NTP 2011). The International Agency for Research on Cancer
(IARC) has classified PCE as a Group 2A carcinogen: probably carcinogenic to humans due to limited
evidence in humans and sufficient evidence in animals {IARC 1995). EPA classified PCE as "likely to be carcinogenic to humans" by all routes of exposure based on increases tumor incidences in animal
studies, and suggestive association between PCE exposure and cancer from epidemiologic studies (EPA
2012).
13
Site-specific Assessment
Non-cancer Health Effects:
None of the averaged concentration exceeded the EPA Regional Screen Level ( RSL} for PCE (41 µg/l.)
RSL is a risk-based concentrations derived from standardized equations combining exposure information
assumptions with EPA toxicity data. EPA considers RSLs to be protective for humans (including sensitive
groups) over a lifetime. Therefore, AOHS does not expect to see non-cancer adverse effects among the
exposed population.
Cancer Risk Estimation:
The maximum concentration of RID #84 (8.16 µg/l) and canal water samples (2.29 µg/L} did not exceed
the ATSDR Cancer Risk Evaluation Guideline (CREG) of 17 µg/l. CREGs are estimated contaminant
concentrations that would be expected to cause no more than one additional excess cancer in one
million (1,000,000) person exposed over a lifetime. They are calculated from EPA cancer slope factors.
The maximum concentration (22.1 µg/L} of groundwater samples was used to calculate the cancer risk.
The estimated cancer risk was 1.9x10⁻⁹ and represents a possible of 2 excess cancer cases in a
population of a billion {1,000,000,000). The estimated cancer risk did not exceed EPA's target risk range.
5. Child Health Considerations
ADHS considers children in its eva luations of all exposures, and we use health guidelines that are
protective of children. No data describe the effects of exposure to COCs on children or immature
animals. In general, AOHS assumes that children are more susceptible to chemical exposures than are
adults. Children six years old or younger may be more sensitive to the effects of pollutants than adults. If
toxic exposure levels are high enough during critical growth stages, the developing body systems of
children can sustain permanent damage. The comparison values (CVs} used in this health consultation
were developed to be protective of susceptible populations such as children.
6. Conclusions
This health consultation provided an update of the 1992 Statement of Risk (ADHS 1992). ADHS re
evaluated the potential health risks associated with the exposure to RID #84 if used as potable water.
With the available information, ADHS concluded that exposure to trichloroethene (TCE),
tetrachloroethene {PCE) and 1,1-dichloroethene (1,1-DCE) in RID #84 is not expected to harm people's
health under typical conditions of household water use because:
The detected TCE, PCE and 1,1-DCE concentrations were below their respective non-cancer health
based comparison values. Comparison values are estimated contaminant concentrations in a media
where non-carcinogenic health effects are unlikely.
The detected PCE concentration was below its Cancer Risk Evaluation Guideline (CREG), which was
developed by ATSDR. CREGs are estimated contaminant concentrations that would be expected to
14
cause no more than one additional excess cancer in one million (1,000,000) person exposed over a
lifetime. They are calculated from EPA's cancer slope factors.
The estimated cancer risk for TCE exposure was 1.43xl0"6 and represents a possible 1-2 excess
cancer cases in a population of 1,000,000 over a lifetime. Lifetime risk refers to the probability that
an individual, over the course of a lifetime, will develop cancer. EPA has established a target risk
range of 1in1,000,000 to 10,000 {lff6 to 10-4 ) for hazardous waste sites. The estimated cancer risk
did not exceed EPA target risk range.
Exposure to multiple chemicals; Additively is the default assumption for evaluating health effects of
simultaneous exposure to multiple chemicals. The estimated accumulated cancer risk due to
exposure to TCE and PCE did not exceed EPA target risk range.
This hea Ith consultation evaluated the potentia I health risks associated with exposure to groundwater
collected from RID irrigation wells, and canal water samples collected in the RID area. With the available
information, ADHS concluded that exposure to chemicals in groundwater and canal water in RID
sampling area is not expected to harm people's health.
Groundwater samples:
Potential non-cancer health effects: the detected PCE, 1,1-0CE, cis-1,2-dichloroethene (cis-1,2-DCE),
1,1-dichloroethane {1,1-DCA}, and 1,1,1-trichloroethane (TCA} concentrations were below their
respective non-cancer health-based comparison values. Comparison values are estimated
contaminant concentrations in a media where non-carcinogenic health effects are unlikely.
Daily exposure dose was calculated for TCE exposures based on the assumed exposure scenario. The
calculated daily exposure doses for adults (0.00001 mg/kg/day) and children (0.00003 mg/kg/day)
were less than the reference dose (0.0005 mg/kg/day}. Reference dose is an estimate, with
uncertainty or safety factors built in, of the daily lifetime does of a substance that is unlikely to
cause non-cancerous health effects in humans.
Potential cancer health effects: The estimated cancer risk for TCE exposure was 1.6xlff7 and
represents a possible 1-2 excess cancer cases in a population of 10,000,000 over a lifetime. The
estimated cancer risk for PCE exposure was 1.9 xlff9 and represents a possible of 2 excess cancer
cases in a population of 1,000,000,000. The estimated cancer risks did not exceed EPA target risk
range {10"6 to lff4}.
Exposure to multiple chemicals: dditively is the default assumption for evaluating health effects of
simultaneous exposure to multiple chemicals. The estimated cancer risk due to exposure to PCE and
TCE did not exceed EPA target risk range .
Canal water samples:
Potential non-cancer health effects: the detected TCE, PCE, 1,1-DCE, cis-1,2-dichloroethene (cis-1,2-
DCE), 1,1-dichloroethane {1,1-DCA), and 1,1,1-trichloroethane (TCA) concentrations were below
15
their respective non-cancer health-based comparison values. Comparison values are estimated
contaminant concentrations in a media where non-carcinogenic health effects are unlikely.
Potential cancer health effects: the detected PCE concentration was below its Cancer Risk Evaluation
Guideline developed by ATSDR. CREGs are estimated contaminant concentrations that would be
expected to cause no more than one additional excess cancer in one million (1,000,000) person
exposed over a lifetime. They are calculated from EPA cancer slope factors.
The estimated cancer risk for TCE exposure was 0.9x10-s and represents a possible 1 excess cancer
case in a population of 100,000,000 over a lifetime. The estimated cancer risk did not exceed EPA
target risk range (10"6 to 10-4).
Exposure to multiple chemicals: Additively is the default assumption for evaluating health effects of
simultaneous exposure to multiple chemicals. The estimated cancer risk due to exposure to PCE and
TCE did not exceed EPA target risk range.
7. Recommendations
ADHS recommends the continuation of monitoring of VOCs at RID #84, groundwater wells, and canal
water to ensure that ingestion, inhalation, and dermal contact with the water does not occur at levels
that exceed levels protective of public health ..
16
References
ATSDR (1997). Toxicological Profile forTetrachloroethylene. Sept. 1997. 18 Nov. 2014.
<http://www.atsdr.cdc.gov/toxprofiles/tp18.pdf>.
ATSDR (2005}. Appendix F: Derivation of Comparison Values. Public Health Assessment Guidance
Manual (January 2005 Update).
ATSDR (2005). Appendix G: Calculating Exposure Doses. Public Health Assessment Guidance Manual
(January 2005 Update).
"Cis-1,2-Dichloroethylene (CASRN 156-59-2)." EPA. Environmental Protection Agency, 31 Oct. 2014.
Web. 18 Nov. 2014. <httP://www.epa.gov/iris/subst/0418.htm>.
"Ethylidene Dich loride (1,1-Dichloroethane) ." EPA. Environmental Protection Agency, Jan. 2000. Web. 18
Nov. 2014. <http://www. e pa. gov /ttn atwOl/h lthef I dich loro. htm f >.
Petersen, Norman J. Statement of Risk: Estimating the Potential Health Effects from Domestic Use of
Water from the ADEQ Monitor Wells in the Estrella Business Park, RID #84, and the Rhoen Plane Well.
Arizona Department of Health Services: Division of Disease Prevention. Oct. 30, 1992.
Terranext (2012). Remedial Investigation Report: West Van Buren Area WQARF Registry Site. Terranext.
August 10, 2012.
Terra next (2013). First Quarter 2013 Water-Quality Report: West Van Buren Area (WVBA}. July 29, 2013.
Terranext (2014). Annual 2013-14 Water-Quality Report: West Van Buren Area (WVBA). Oct.
2014."Tetrachloroethylene (Perchloroethylene) 1." EPA. Environmental Protection Agency, Dec. 2012.
Web. 18 Nov. 2014. <http://www.epa.gov/ttnatwOl/hlthef/tet-ethy.html>.
"Trichforoethyfene2." EPA. Environmental Protection Agency, Jan. 2000. Web. 18 Nov. 2014.
<http://www. e pa .gov /ttn atwO 1/h It hef /t ri-ethy. htm I>.
"Vinylidene Chloride (1,1-Dichloroethylene)." EPA. Environmental Protection Agency, Jan. 2000. Web. 18
Nov. 2014. <http://www.epa.gov/ttnatwOl/h lthef /di-ethyl.htm I>.
1 Tetrachloroethylene is equivalent to tetrachloroethene. 2 Trichloroethylene is equivalent to trichloroethene.
17
Preparers of Report
Arizona Department of Health Services, Office of Environmental Health
Kaleb Tsang, Public Health Risk Assessor
Hsini Un, ScD, MSPH, Toxicologist
Internal Reviewers of Report
Jennifer Botsford, Program Manager, ADHS
Brigitte Dufour, Office Chief, ADHS
18
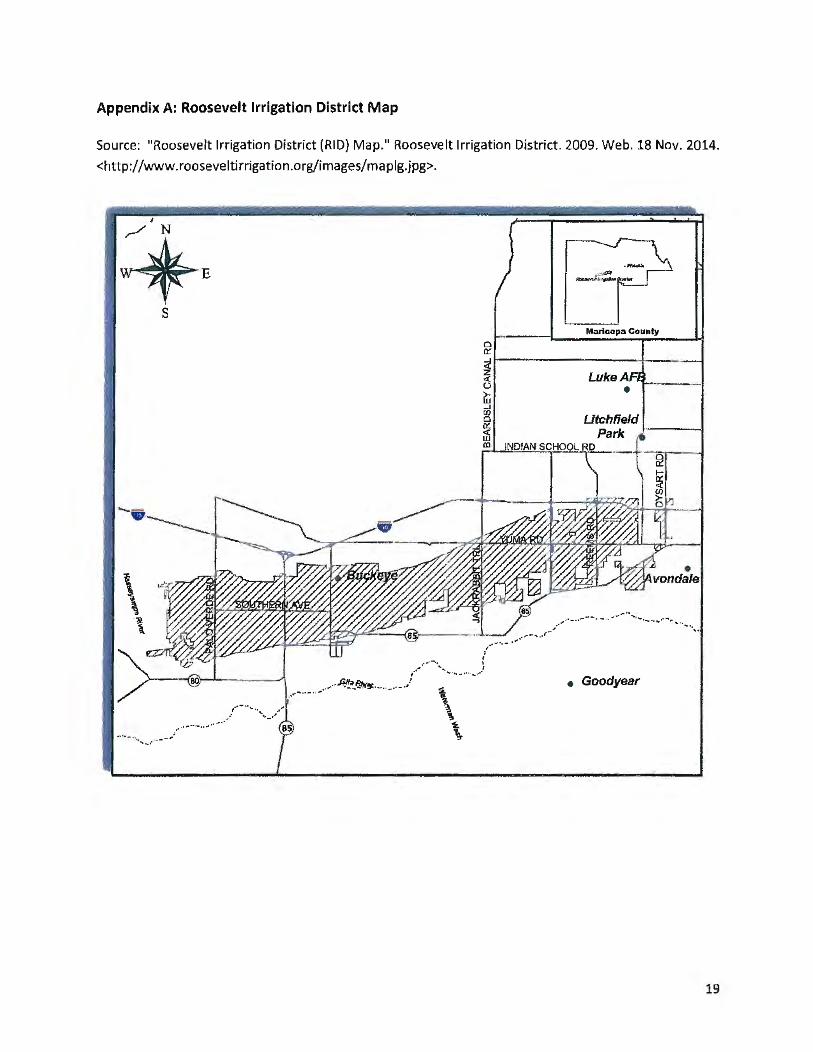
Appendix A: Roosevelt Irrigation District Map
Source: "Roosevelt Irrigation District (RID) Map." Roosevelt Irrigation District. 2009. Web. 18 Nov. 2014.
<http://www.rooseveltirrigation.org/images/ maplg.jpg>.
\ '
..... ... ··-·· .. _ _,..~<;/I.!,,~.- -_ .. _/
,,,./ ... -..... ··, .. _,,' , .... ··-......... .
-··-···., .. , .. -··".:
0 a::
Maricopa County
~t--~~~~-+~~
() ~ ~ 0
~ m INDIAN SCHOOL RD
......... ,,.,.'·· , ............... .
-··· ..... _ ....... -~ -·. ' ""' """"""· ........... ~ ..
/ ......... . /"' ........... _ .... .., .. .'
• Goodyear
... '
19
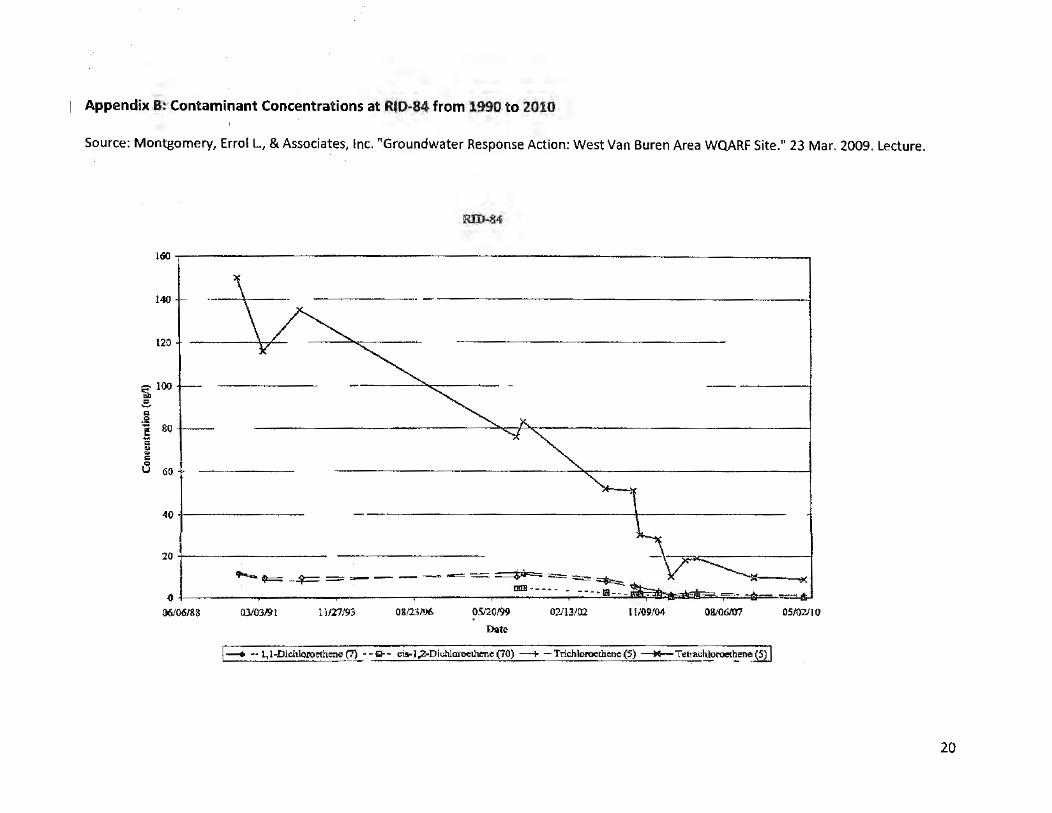
Appendix B: Contaminant Concentrations at RI0-84 from 1990 to 2010
Source: Montgomery, Erro l L., & Associates, Inc. "Groundwater Response Action: West Van Buren Area WQARF Site." 23 Mar. 2009. Lecture.
RID-84
160.--~-~~---~~~~~~~~~-~-~~~~~~~~~-~~---~--~~~~---.
140
120
~ 100 .:!,.
.~ i 80 ; .. .. I: Q
u 60
40-1-~~~~-~~-
20 ;------------
- -
........ ~ - :$:== = ,._ -- -- - -= = ===-t4 - = = ~ I ml!lt·--- - - -- ... ~~ .,.. s.J =·-- .. .. ~~~~~= () I I I C I I
06/06/88 OJl<rJ/9l 11127193 08/23/lJ6 ~5120/99
Date
02/13/02 l 1109/04 O&/OtiiW
J--+ - l, 1-DichloroetheneJ?>_=- -i;;:-:-cis~i ;l-Dichlozoethene-(70) -+ -TrichlorocthCne(S) ~Tutra~hlor~hen'::illJ
OS/02110
20
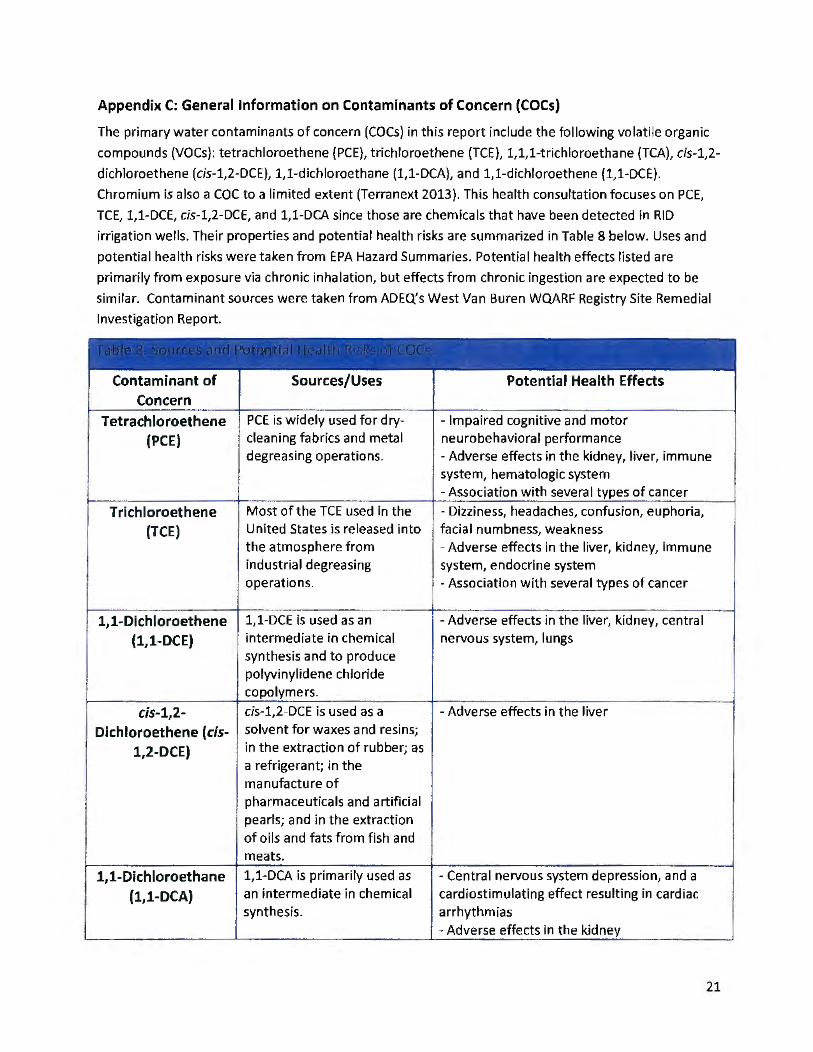
Appendix C: General Information on Contaminants of Concern (COCs)
The primary water contaminants of concern (COCs) in this report include the following volatile organic
compounds (VOCs): tetrachloroethene (PCE}, trichloroethene (TCE), 1,1,1-trichloroethane (TCA), cis-1,2-
dichloroethene (cis-1,2-DCE), 1,1-dichloroethane (1,1-DCA}, and 1,1-dichloroethene (1,1-DCE).
Chromium is also a COC to a limited extent (Terranext 2013). This health consultation focuses on PCE,
TCE, 1,1-DCE, cis-1,2-DCE, and 1,1-DCA since those are chemicals that have been detected in RID
irrigation wells. Their properties and potential health risks are summarized in Table 8 below. Uses and
potential health risks were taken from EPA Hazard Summaries. Potential health effects listed are
primarily from exposure via chronic inhalation, but effects from chronic ingestion are expected to be
similar. Contaminant sources were taken from ADEQ's West Van Buren WQARF Registry Site Remedial
Investigation Report.
Contaminant of Concern
Tetra ch loroethene (PCE)
Trichloroethene (TCE)
1, 1-Dichl oroethene (1,1-DCE)
cis-1,2-Dichloroethene (cis-
1,2-DCE)
1,1-Dichloroethane (1,1-DCA)
Sources/Uses
PCE is widely used for drycleaning fabrics and metal degreasing operations.
Most of the TCE used in the United States is released into the atmosphere from industrial degreasing operations.
1,1-DCE is used as an
intermediate in chemical synthesis and to produce polyvinylidene chloride copo lymers.
cis-1,2-DCE is used as a
solvent for waxes and resins; in the extraction of rubber; as a refrigerant; in the manufacture of
pharmaceuticals and artificial pearls; and in the extraction
of oils and fats from fish and meats.
1,1-DCA is primarily used as
an intermediate in chemica l synthesis.
Potential Health Effects
- Impaired cognitive and motor neurobehavioral performance
- Adverse effects in the kidney, liver, immune system, hematologic system -Association with several types of cancer
- Dizziness, headaches, confusion, euphoria, facial numbness, weakness - Adverse effects in the liver, kidney, immune system, endocrine system - Association with several types of cancer
-Adverse effects in the liver, kidney, central nervous system, lungs
- Adverse effects in the l iver
- Central nervous system depression, and a cardiostimulating effect resulting in cardiac arrhythmias
-Adverse effects in the kidney
21
... ."G)
e-'':> '51 v (I -s .,o" /., . • . '
ARIZONA DEPARTMENT OF HEALTH SERVICES Division of Disease Prevention
FIFB SYMINGTON, OOVBRNOR ALBTHBA 0 . CALDWBLL, DIR.BCTOR
October 30, 1992
Mr. Tom Curry Remedial Projects Unit Arizona Department of Environmental Quality 3033 N. Central Avenue Phoenix, Arizona 85012
RE: Task Assignment 11-18, Contract #2217-000000-3-3-AB-2001.
Dear Mr. Curry:
The following document is being provided in response to ADEQ Remedial Projects Coordination Unit request for performance of a Statement of Risk for the potentially affected Tolleson water wells and populace. The Statement of Risk estimates the potential health effects from domestic use of water from the ADEQ moni1or wells in the Estrella Business Park, RID #84, and the Rboen Plane well.
In accordance with TA 11-18 (Contract #2217-000000-3-3-AB-2001), a Statement of Risk was prepared by the Arizona DepartmeJit of Health Services, Division of Disease Prevention. 'l\vo copies of the work product are attached.
If you have questions, or need additional information, please call Will Humble at 230-5860.
Sincerely,
Norman J. etersen, Chief Office of Risk Assessment and
Investigation
NJP:wh Enclosure cc: Larry Sands, D.O., M.P .H.
Jim McDonald Win Chromec, Ph.D. Will Humble
The Department of Health Seruic .. is an Equal Opportunity Afflrmatiu1 Action Employer.
3008 North Third Street Phoenix, Arizona 85012
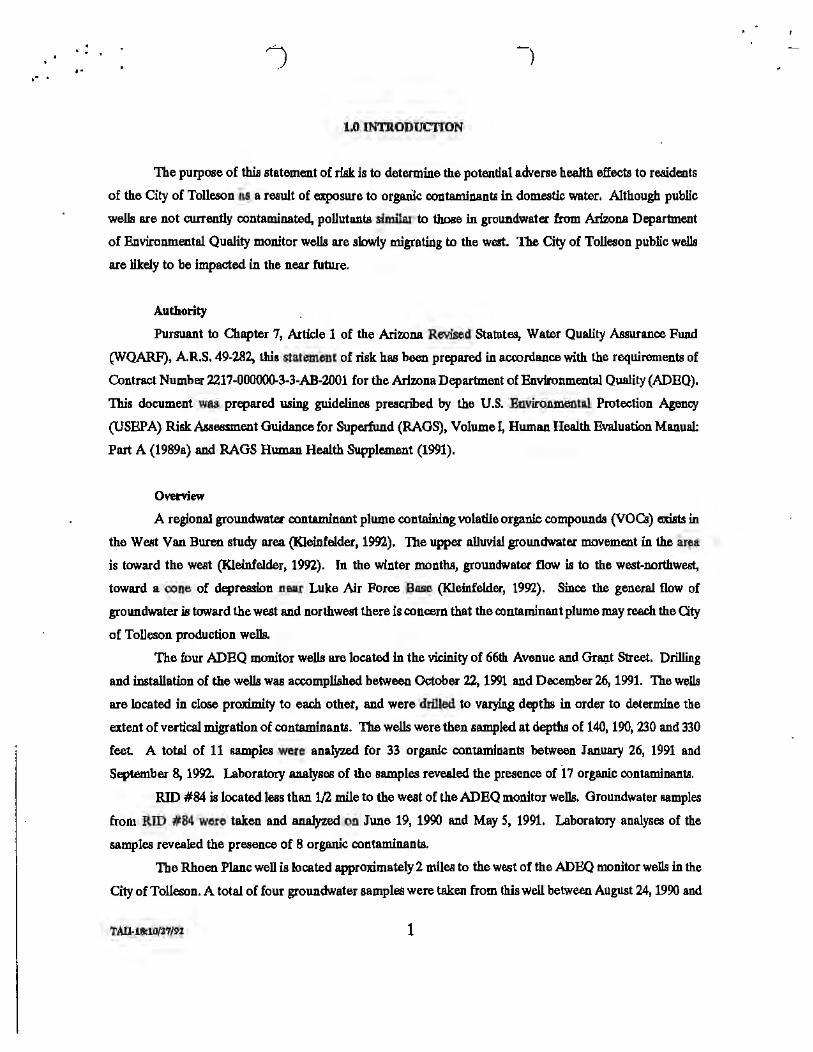
. . . . , . . · .
1.0 INTRODUCTION
The purpose of this statement of risk is to determine the potential adverse health effects to residents
of the City of Tolleson as a result of exposure to orgatiic contaminants in domestic water. Although public
wells are not currently oontaminated, pollutants similar to those in groundwatei from Arizona Department
of Environmental Quality monitor wells are slowly migrating to the west. The City of Tolleson public wells
are likely to be impacted in the near future.
Authority
Pursuant to Chapter 7, Article 1 of the Arizona Revised Statut~, Water Quality Assurance Fund
(WQARF), A.R.S. 49-282, this statement of risk has been prepared in acrordance with the requirements of
Contract Number 2217-000000.3-3-.AB-2001 for the Arizona Department of Environmental Quality (ADBQ).
This document was prepared using guidelines prescnbed by the U.S. Environmental Protection Agency
(USBP A) Risk Assessment Guidance for Superfund (RAGS), Volume I, Human Health Evaluation Manual:
Part A (1989a) and RAGS Human Health Supplement (1991).
Oveniew
A regional groundwater contaminant plume containing volatile organic compounds (VOCs) exists in
the West Van Buren study area {Kleinfelder, 1992).· The upper alluvial groundwater movement in the area
is toward the west (Kleinfelder, 1992). In the winter months, groundwater flow is to the west·northwest,
toward a oone of depression near Luke Air Force Base (Kleinfelder, 1992). Since the general flow of
groundwater is toward the west and northwest there is concern that the contaminant plume may reach the Qty
of Tolleson production wells.
The four ADBQ monitor wells are located in the vicinity of 66th Avenue and GraJJ.t Street. Drilling
and installation of the wells was accomplished between October 22, 1991 and December 26, 1991. The wells
are located in close proximity to each other. and were drilled to varying dq>ths in order to determine the
extent of vertical migration of contaminants. The wells were then sampled at depths of 140, 190, 230 and 330
feet A total of 11 samples were analyzed for 33 organic contaminants between January 26, 1991 and
September 8, 1992. Laboratory analyses of the samples revealed the presence of i 7 organic oontamioanta.
RID #84 is located less than 1/2 mile to the west of the ADBQ monitor wells. Groundwater samples
from RID #84 were taken and analyzed on June 19, 1990 and May S, 1991. Laboratory analyses of the
samples revealed the presence of 8 organic contaminants.
The Rhoen Plane well is located approximately 2 miles to the west of the ADBQ monitor wells in the
City of Tolleson. A total of four groundwater samples were taken from this well between August 24, 1990 and
TAD-18:10/2719.2 1
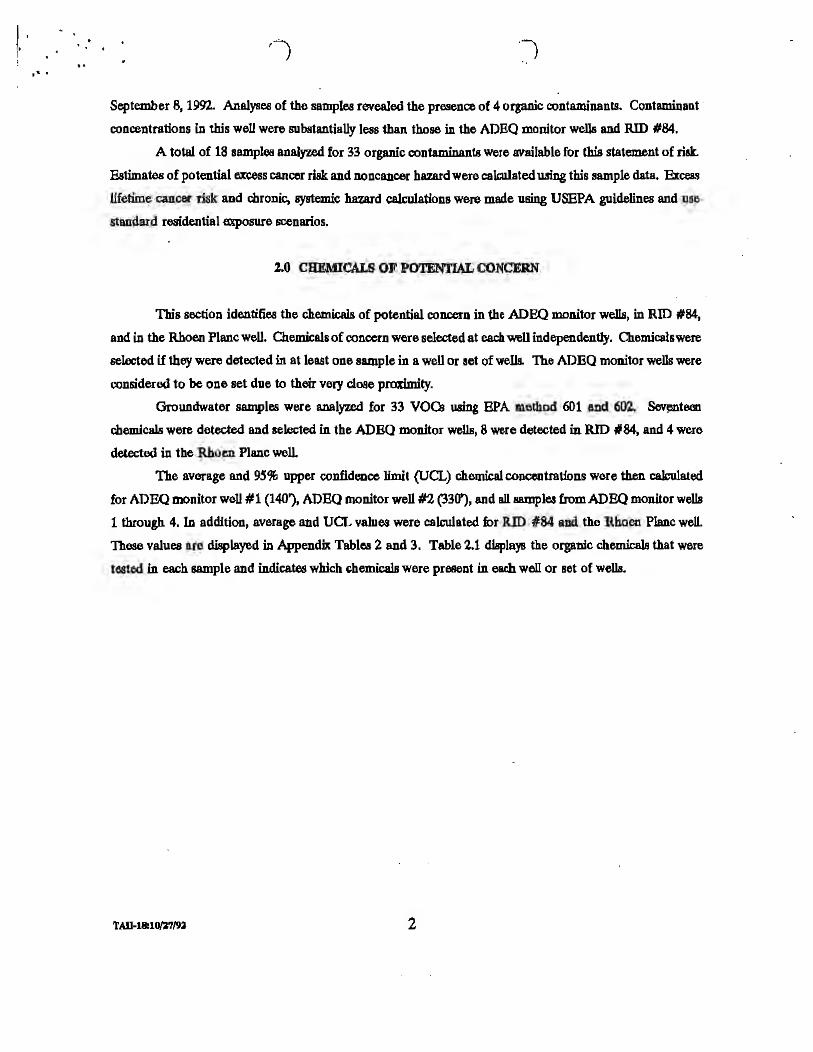
September 8, 1992. Analyses of the samples revealed the presence of 4 organic contaminants. Contaminant
concentrations in this well were substantially less than those in the ADBQ monitor wells and RID #84.
A total of 18 samples analyzed for 33 organic contaminants were available for this statement of risk.
Estimates of potential excess cancer rJsk and noncaneer hazard were calclllated wing this sample data. Excess
lifetime cancer risk and cluonic, systemic hazard calculations were made using USEPA guidelines and use
standard residential exposure scenarios.
2.0 CHEMICALS OJI' POTENTIAL CONCERN
This section identifies the chemicals of potential concern in the ADEQ monitor we~, in RID #84,
and in the Rhoen Plane well. Chemicals of concern were selected at each vrell independently. Chemicals were
selected if they were detected in at least one sample in a well or set of wells. The ADEQ monitor wells were
considered to be one set due to their very close proximity.
Groundwater samples were analyzed for 33 VOCs .using EPA method 601 and 602. Sev~teen
chemieab were detected and selected in the ADBQ monitor wells, 8 were detected in RID #84, and 4 were
detected in the Rboen Plane well.
The average and 9S% upper confidence limit {UCL) chemical concentrations were then calculated
for ADEQ monitor well #1 (140'), ADBQ monitor well #2 (330), and all samples from ADBQ monitor wells
1 through 4. In addition, average and UCT.. values were calculated for RID #84 and the Rhoen Plane well.
These values are displayed in Appendix Tablea 2 and 3. Table 2.1 displajS the organic chemicals that were
tested in each sample and indicates which chemicals were present in each well or set of wells.
2
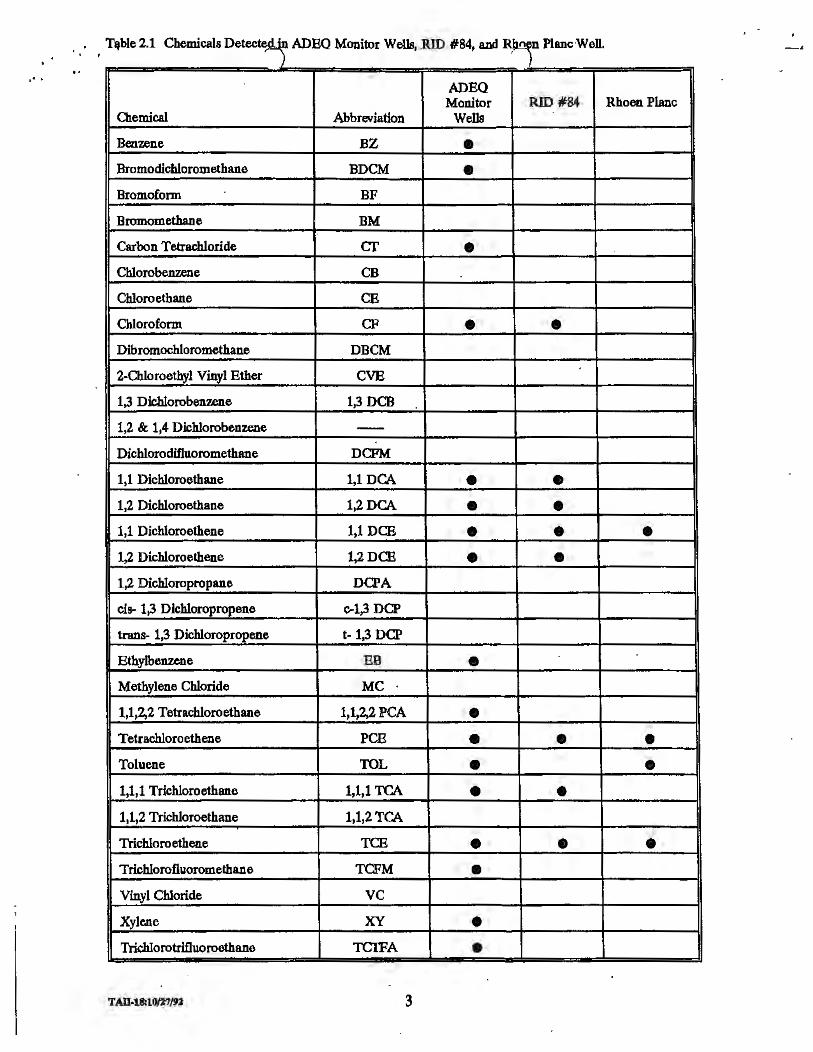
. ' Titble 2.1 Chemicals Detec . ADEQ Monitor Wells, RID #84, and RP)n Plane-Well.
,• . ADEQ Monitor RID #84 RhoenPlanc
Chemical Abbreviation Wells
Benzene BZ • Bromodichloromethane BDCM • Bromoform BF
Bromomethane BM
Carbon Tetrachloride er • Chlorobenz.ene CB
Cbloroetbane CB
Chloroform CF • • Dibromochloromethane DBCM
2-Cbloroethyl Vinyl Ether CVE
1,3 Dichlorobenzene 1,3 DCB
1,2 & 1,4 Dichlorobenzene --Dicblorodifluoromethane DCFM
1,1 Dichloroethane 1,1 DCA • • 1,2 Dichloroethane 1,2DCA • • 1,1 Dichloroethene 1,1 DCE • • • 1,2 Dichloroethene 1,2DCE • • 1,2 Dichloropropane DCPA
els- 1,3 Dlchloropropene c.1,3 DCP
trans- 1,3 Dichloropropene t-1,3 DCP
Bthylbenzene BB • Methylene Chloride MC
1,1,2,.2 Tetracbloroethane 1,1,2,2 PCA • Tetrach.loroethene PCB • • • Toluene TOL • • 1,1,1 Trichloroethane 1,1,1 TCA • • 1,1,2 Trichloroethane 1,1,2TCA
Trichloroethene TCE • • • Tri.chlorofiuoromethane TCFM • Vinyl Chloride vc Xylene XY • Tricltlorotrifluoroethane TCIFA •
TAD-11t10/i'7/92 3
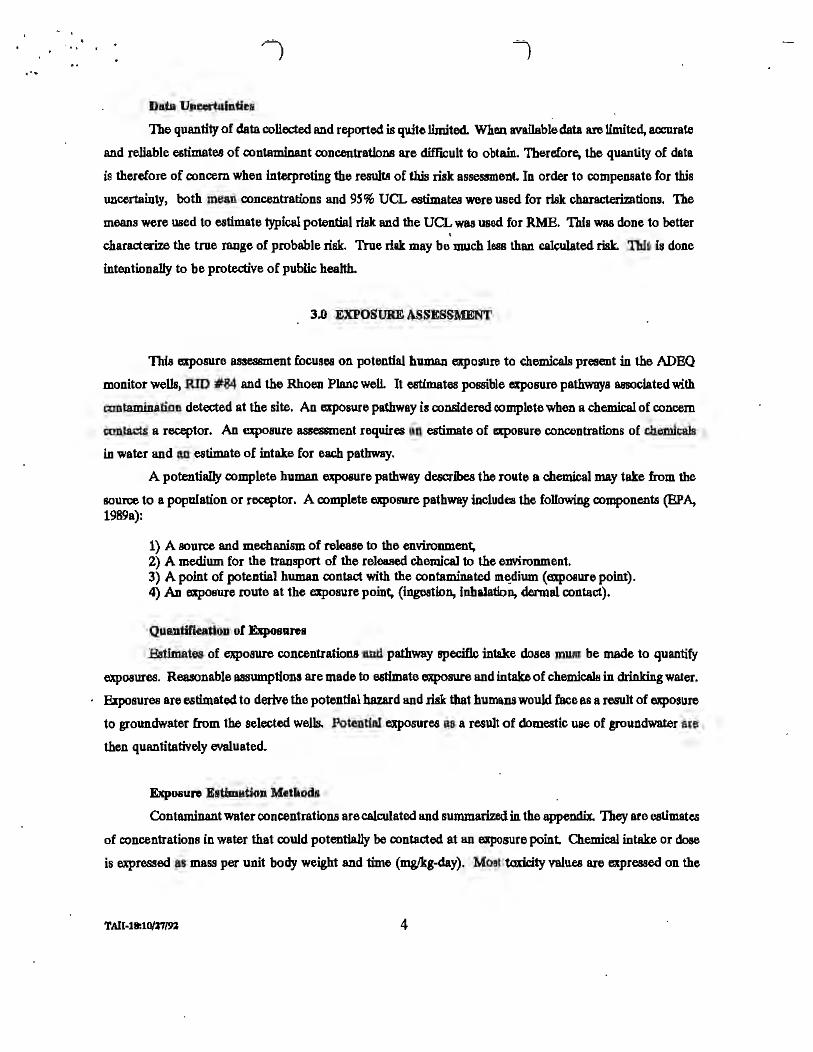
Data Uncertainties
The quantity of data collected and reported is quite limited. When available data are limited, accurate
and reliable estimates of contaminant concentrations are difficult to obtain. Therefore, the quantity of data
is therefore of concem when interpreting the results of this risk assessment. la order to compensate for this
uncertainty, both mean concentrations and 95% UCL estimates were used for risk charactemation.s. The
means were used to estimate typical potential risk and the UCL was used for RMB. This was done to better ' characterize the true range of probable risk. True rilk may be much less than calculated risk. 'Ibls Is done
intentionally to be protective of public health.
3.0 EXPOSURE ASSESSMENT
This exposure assessment focuses on potential human exposure to chemicals present in the ADBQ
monitor wells, RID #84 and the Rhoen Plane well. It estjmates possible exposure pathways usociated with
contamination detected at the site. An exposure pathway is considered complete when a chemical of concern
contacts a receptor. An exposure assessment requites an estimate of eicposure concentrations of chemicals
in water and an estimate of intake for each pathway.
A potentially complete human exposure pathway describes the route a chemical may take from the
source to a population or receptor. A complete exposure pathway includes the following components (BP A, 1989a):
1) A source and mechanism of release to the environment, 2) A medium for the transport of the released chemical to the environment. 3) A point of potential human contact with the contaminated m~dium (expoaure point) . 4) An axposure route at the ~osure point. (ingestion, inhalation, dermal contact).
Quantificatioa of Expo8Rres
Estimates of exposure concentrations and pathway specific intake doses must be made to quantify
exposures. Reasonable aasumptions are made to eatimate exposure and intake of chemicals in drinking water.
&posures are estimated to derive the potential hazard and risk that humans would face as a result of exposure
to groundwater from the selected wells. Potential exposures as a result of domestic use of groundwater are
then quantitatively evaluated.
Exposure Estimation Methods
Contaminant water concentrations are calculated and summarized in the appendix. They are estimates
of concentrations in water that could potentially be contacted at an exposure point Chemical intake or dose
is expressed as mass per unit body weight and time (mg/ltg-day). Most toxicity values are expressed on the
TAII-11:1WJ7/92 4
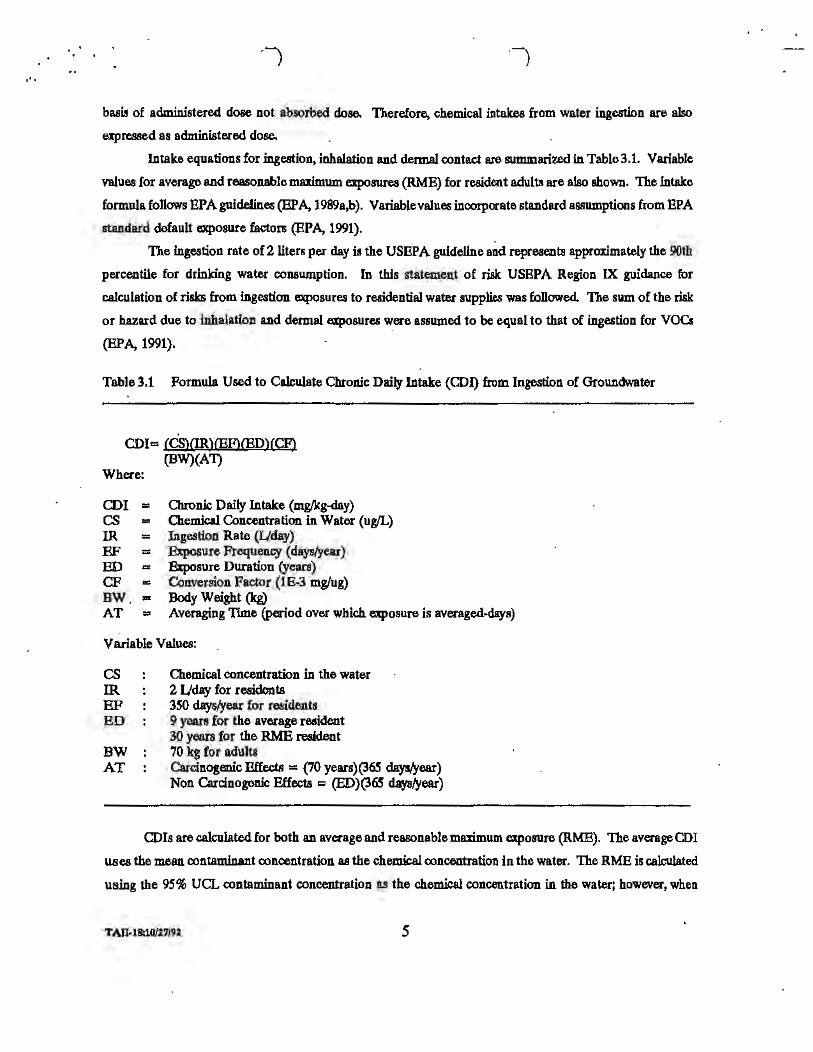
... basis of administered dose not absorbed dose. Therefore. chemical intake& from water ingestion are also
expressed as administered dose.
Intake equations for ingestion, inhalation and dermal contact are summaril.ed in Table3.1. Variable
values for average and reasonable maximum exposures (RME) for resident adults are a1so shown. The intake
formula follows EPA guidelines (EPA, 1989a,b). Variable values incorporate standard a~umptions from EPA
standard default exposure factors (EPA, 1991).
The ingestion rate of 2 liters per day is the USBPA guideline and represents approximately the 90th
percentile for drinking water consumption. In this statement of risk USBPA Region IX guidance for
calculation of risks from ingestion exposures to residential water supplies was followed. The sum of the risk
or hazard due to inhalation and dermal exposures were assumed to be equal to that of ingestion for VOCs
(EPA, 1991).
Table 3.1 Formula Used to Calculate Chronic Daily Intake (CDI) from Ingestion of Groundwater
CDI = (CS)(JR)CEf)@D)(CF) (BW)(A1)
Where:
CDI = cs = IR =
Chronic Daily Intake (mg/kg-day) Chemical CQncentration in Water (ugfL) Ingestion Rate (Uday) Exposure Frequency (days/year) '&posure Duration (years) C.Onvcrsion Factor (1&3 mg/ug) Body weight (kg)
BF = ED = CF = BW . • AT = Averaging Time (period over which exposure is averaged-days)
Variable Values:
CS Chemical concentration in the water IR 2 Uday for residents EF 350 days/year for residents BD 9 years for the average resident
30 years for the RMB resident BW 70 kg for adults AT Carcinogenic Effects = (70 years)(365 daystyear)
Non Carcinogenic Effects = (ED)(365 days/year)
CDls are calculated for both an average and reasonable maximum mposure (RMB). The average CD!
uses the mean contaminant concentration as the chemical concentration in the water. The RMB is calculated
using the 95% UCL contaminant concentration as the chemical concentration in the water; however, when
TAll·llk10/l7/92 5
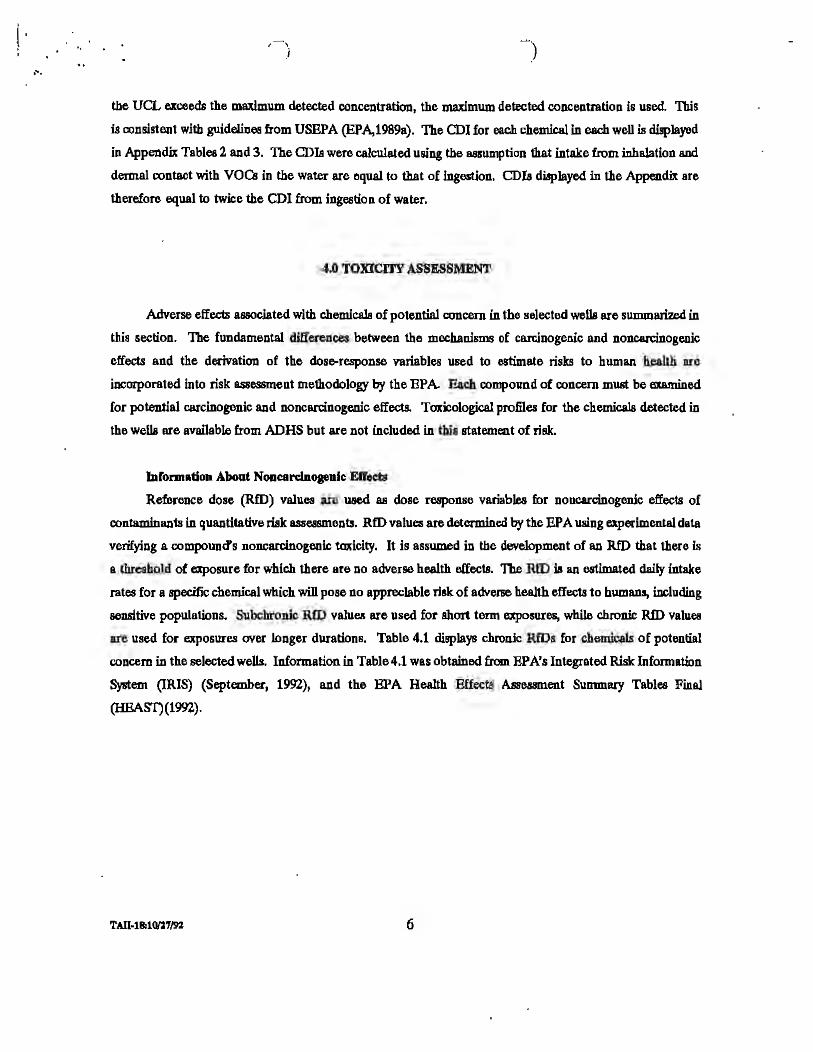
,-, I )
the UCT. exceeds the maximum detected concentration, the maximum detected concentration is used. This
is consistent with guidelines from USEPA (EPA,1989a). The CDI for each chemical in each well is displayed
in Appendix Tables 2 and 3. The COis were calculate<t using the assumption that intake from inhalation and
derm81 contact with VOC. in the water are equal to that of Jngemon. CDis diaplayed in the Appendix ue
therefore equal to twice the CDI from ingestion of water.
4.0 TOXICITY ASSESSMENT
Adverse effects associated with chemicals of potential concern in the selected wells are summarized in
this section. The fundamental differences between the mechanisms of carcinogenic and noncarcinogenic
effects and the derivation of the dose-response variables used to estimate risks to human health are
incorporated into risk assessment methodology by the EPA. Each compound of concern muat be examined
for potential carcinogenic and noncarcinogenic effects. Toxicological profiles for the chemicals detected in
the wells are available from ADHS but are not included in this statement of risk.
lnfonn•tioa About Noacarc:btogenlc Effects
Reference dose (RfD) values are used as dose response variables for noncarcinogenic effects of
contaminants in quantitative risk assessments. RfD values are determined by the EPA using experimental data
verifying a compound's noncarcinogenic toxicity. It is assumed in the development of an RfD that there is
a threshold of exposure for which there are no adverse health effects. The RID ia an estimated daily intake
rates for a specific chemical which will pose no appreciable risk of adverwe health eff ecta to humans, including
sensitive populations. Subchronic RID values are used for short term exposures, while chronic RID values
are used for exposures over longer durations. Table 4.1 displays chronic RfDs for chemicals of potential
concern in the selected wells. Information in Table 4.1 was obtained from EPA's Integrated Risk Information
System (IRIS) (Septemb«, 199'2), and the EPA Health Effects Ass6S8ID.en~ Summary Tables Final
(HEAST)(1992).
TAll-18:10/2'7/92 6
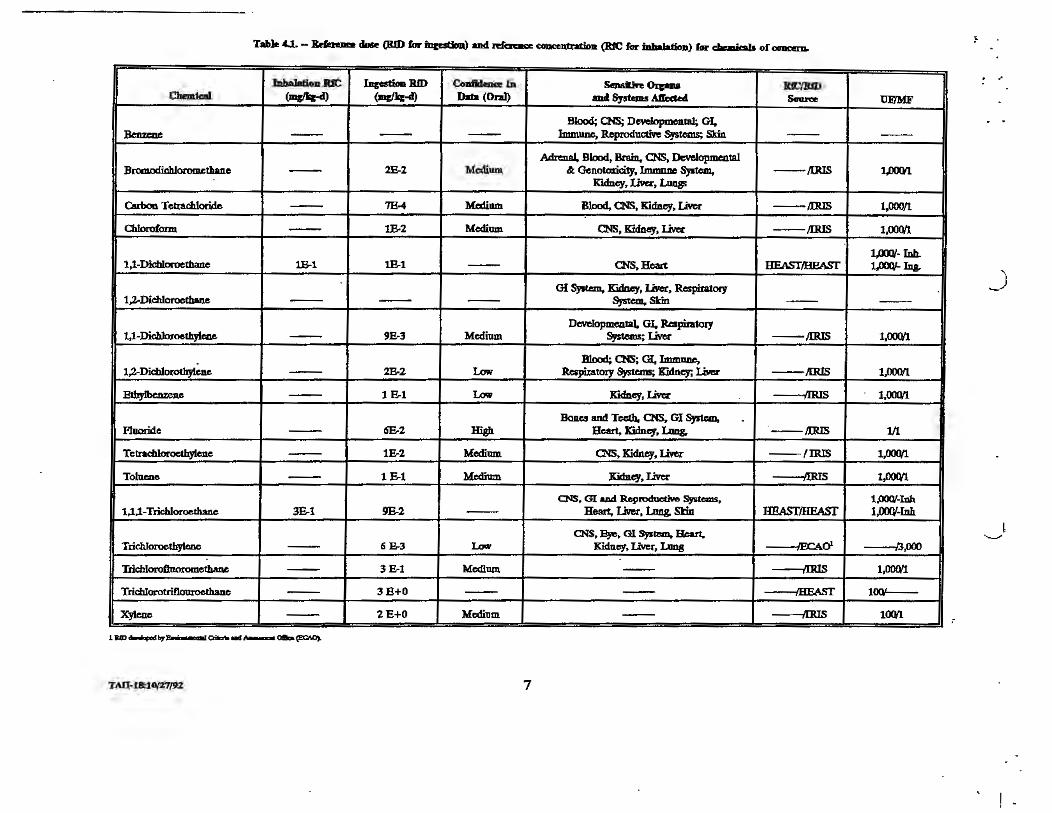
Table 4.1. - Rdtrew dose (RID for~ Uld ftf°Cftlll:I: ~ (RfC for inllalatioll) f• ..._.._., of cocem. ~
.,_.._lldienRIC h&ation llfD Codil-..e IJl Sadift()ipu lUCIJUD o-dcal ~) (~-d) Dmfa(Onl)
- Systc.s Alreded 8-roe UIYMF
Blood; CNS; D~ GI, Bcmcne -- - -- lmmwie, R.eproductiYe ~ Skin -- --
Adrenai. Blood, Brain. CNS, Developmt.nUl.I Bromodichlorom.ethall.c -- 2E-2 Medium &; Genotalicity, Immnnc System. --/DUS 1,()00'1
Kidney, 1.M:r, I.wig;
Caiboil Tetrachloride -- 7E-4 Medium Blood. CNS. Kidney, LM:r --/.OUS 1,QOO/l.
Oiloroform. - lE-2 Medium CNS, Kidney, liver --/IRIS 1.<m'l
1,00:V- Inh. 1,1-Dldlloroedlanc iS-1 lB-1 -- CNS.Heart HEASr.IHEAST 1,(m/- Ina.
G{ System. Kidney, llw:r, Respiratory _) 1.Z.Dic:hkirootlullle -- -- -- System. Skin -- --
D~ GI. Rl:spiratory l,1-Dichloroethylme -- 9&3 Medium s,stems;Livcr --IIRJS 1,()0()'1
Blood; CNS; GI, lmmllllC, 1,Z.~ -- :2E-2 tow Resphatory Systems; IDdttey; ~ --JIRJS 1,0000
Blhy1bcmcae - - 1 E-1 Low Kldlley, u.cc --IIRIS 1.()00/1
Boaes and Tcelh, CNS, GI System, . Fluoride -- 6E-2 ltigh Heart. Xidney, Lang. --/IRIS 111
Tetradlloroethyle -- 1E-2 Medium CNS, Kidney, LiYer --!IRIS 1,()00'1
Toluene -- 1 E-1 Medium Kidney, Liver ---IIRIS 1,DOWJ.
CNS, GI .u.d R.eproductlve S,Stems, 1.QOO/-Inh 1,1,1-Trichloroethane 3£.1 m.2 - - Heart, Liwr, Lnng, Skin HE.AST/BEAST 1,lmtlah
CNS, ~. GI System, Heart. I ........... Tricllloroetbylcmc: -- 6E-3 ~ Kidney, liYef, Lang --lf!C.AcY ---/3f/OO
.. Tric:hloro11uorotlwle - - 3&1 Medium -- ---{IRIS 1,00<V.1
Tricblototrlflouro -- 3B+O -- - --/BEAST 100!----
x~ -- 2E+O Medium -- ----/IRIS 1()(\11
1U>-..-..,-~ ... -Olla(l!ICllO).
TAII-18:10/27/n 7
I .
...
___..)
Information About Cardnogenic Risk
Potential health effects are evaluated differently for chemicals clas!ified by the EPA as posSI'ble
carcinogeM than noncarcinogens. The upper-bound exoess cancer ri111k is calculated by multiplying an
estimated dose from an exposure route by a slope factor (SF). The SF (mg/kg-day)-1 is usually determined
using the uppec 95% confidence limit of the slope of the linearized multi-stage model. Excess cancer risk is
expressed as a function of exposure. The modd assumes that there is no threshold for the initiation of cancer.
For most applications, e:mapolations must be made from high experimental doses to low doses resulting from
environmental exposures. The application of the no threshold assumption and the 95% confidence limit for
estimation 'of slope factors provides a conservative upper bound estimate of potential carcinogenic rim.
Human response to a dose is probably less than the predicted response.
The likelihood that a chemical agent is a carcinogen in humans is given by the weight of evidence
(WoE) classifications developed by the BPA's Carcinogen Advisory Group. "N' means the chemical is
considered a proven human carcinogen. Probable human carcinogens are designated either ''Bl", indicating
that studiea in humans are highly suggestive, but not conclusive, or "B2", if the chemical bas been found to
be conclusively carcinogenic in repeated animal studies, but no conclusive human studies exist. A chemical
may be considered a possible human carcinogen ("C') if a single high.quality animal study or several low
quality animal studies indicate carcinogenicity. U there is insufficient human and animal evidence to
determine the carcinogenicity of the chemica~ it is rated ''D"- A chemical conclusively demonstrated to be
noncarcinogeoic in humans is rated •E". This designation I., rare due to the difficulty in producing the
n~sary negative data.
Slope Factors (SF) were obtained from the EPA's Integrated Risk Information system (lRlS)
(September, 1992) database, and the EPA Health Effects As,,essmcmt Summary Tables Final, (1992). Slope
factors and weight of evidence ratings for the potential carcinogens are listed in Table 4.2.
TAU-Uh10/i7/Jl 8
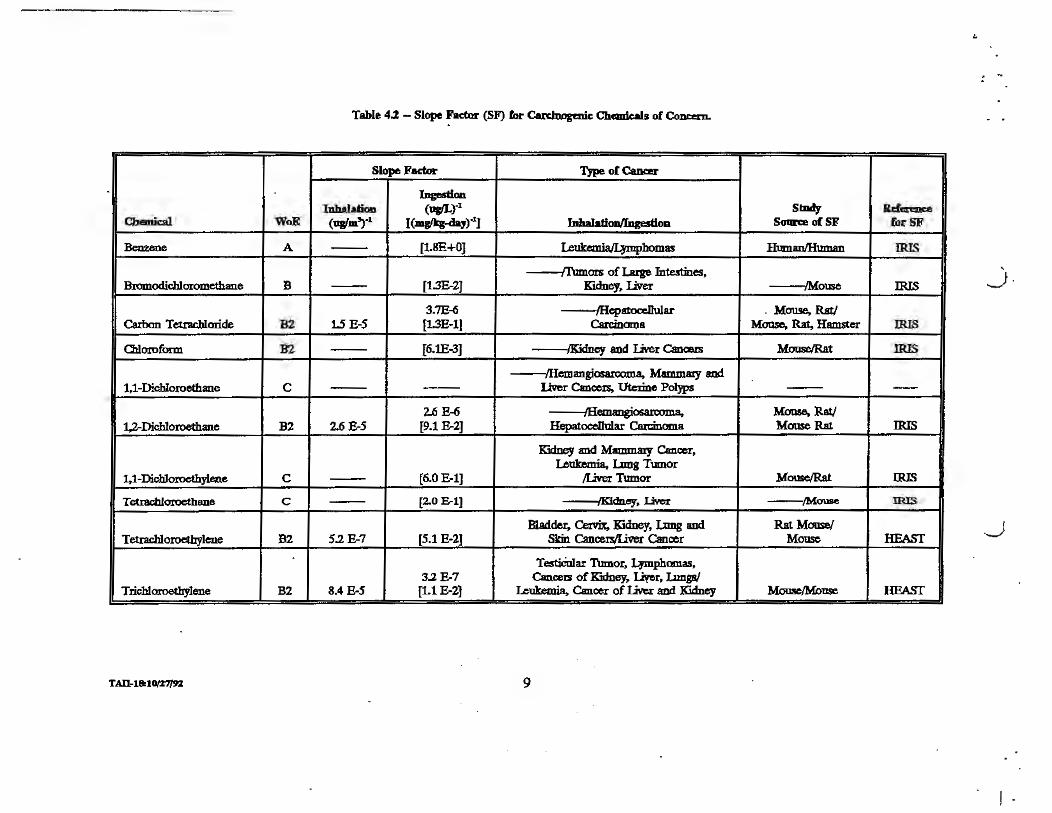
..
Table 4.l - Slope Factor (SF) for Cudnogenic Chemicals of Concern.
Slope Fact.or Type of Cancer
Ingestion Inhalation (uw'J..}"1 Stadf Reference
Chemical WoE (Uf/m3)·1 {(.ms'lg-day)4J Jnhalafi<Jll/lageltlon Soara of SF for SF
Benzene A -- [1.8E+OJ I..eukemiaJI;ymbomas Human/Hum.an IRIS
---{l'umOIS of Laige Intemnes, Bromodic.bloromcthane B -- (1.3E-2J Kidney, liver -!Mouse IRIS
_).
3.7E-6 -1Hcpatocc1lular . Mouse. Ra.ti Carl>on Tetrachloride B2 1..5 E-5 [1.3E-1] Carcinoma Moose, Rat, Hamster IRIS
Ollorofunn B2 -- [6.lE~J ----/Kidney and Liver Qmceis ~t IRIS
--1Hemang:iosarooma. Mammmy and 1,1-Dichloroethane c -- - - Liver Cance:cs, Uterine Polyps -- -
2.6 E-6 -/Hemangiosarcoma. Mouse, Rat/ t_1rDicbloroeth.ane B2 2.6 B-5 [9.1 E-2J Hepatocellular Carcinoma Mouse Rat IR.IS
Kidney and Mammaiy Cancer, Leukemia. Lung Tumor
I.1-D.icbloroethylene c -- [6.0 E-1] /Liver Tumor Mouse/Rat IRIS
Tetradlloroetbane c -- [2.0 E-1] ------IKldne.y. liver --/Mouse IRIS
madder, Cetvix, Kidney, l.mlg and Rat Mousel Tetr.icllloroelhylene B2 5.2 '&7 [S.1 E-2] Skin Canoe~ Cancer Mouse HFAST
._)
TestiCnlar 1Umor, l.Jmpbamas, 3.2 E-7 Canceu of Kidney, liyer, 'Umgs/
Trichloroethylene B2 8.4E-S [1.1 E-2] Leukemia, Cancer of Liver and Kidney Mouse/Mouse BEAST
TAil-18:10/27/9% 9
I .
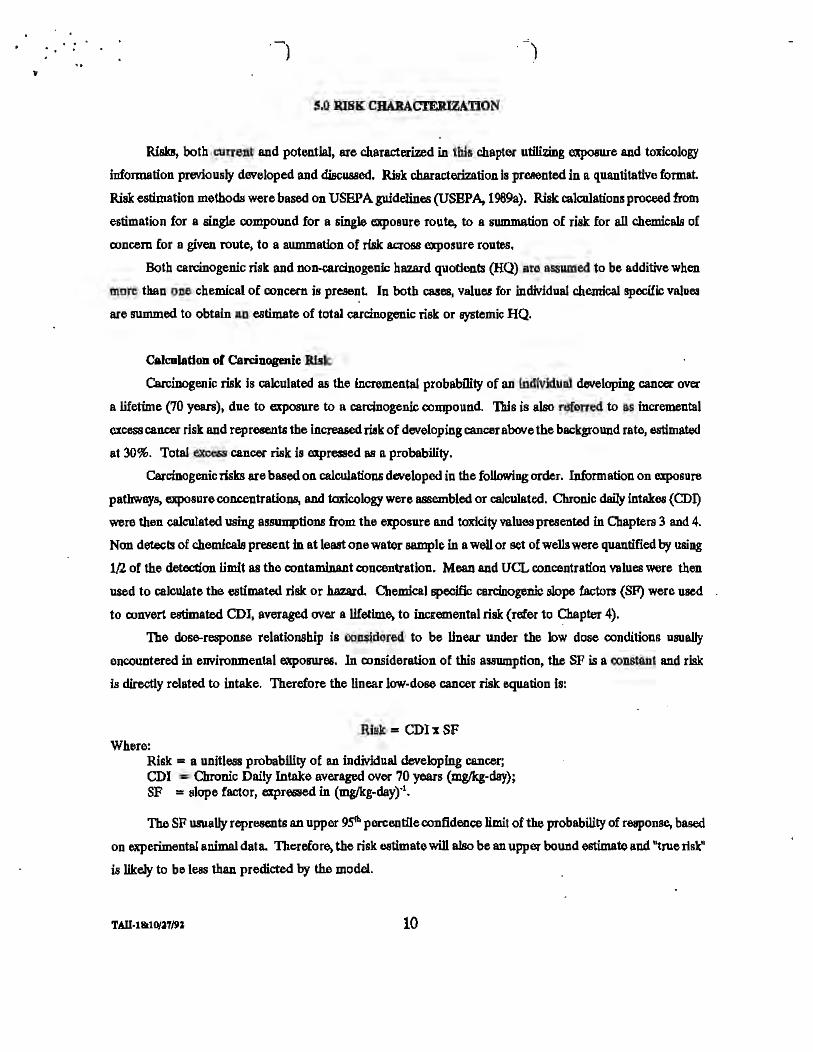
)
5.0 RISK CBABACTEIUZATION
Risks, both current and potential, are characteriud in this chapter utilizing exposure and toxicology
information previously developed and discussed. Risk characterization Is presented in a quantitative format.
Risk estimation methods were based on USEP A guidelines (USBP A.1989a). Risk allculations proceed from
estimation for a single compound for a single e'IJ>OSUre route, to a summation of risk for all chemicals of
concern for a given route, to a summation of risk acroBB exposure routes.
Both carcinogenic risk and non.carcinogenic huard quotients (HQ) are assumed to be additive when
more than one chemical of concern is present In both cases, values for individual chemical specific values
are summed to obtain an estimate of total carcinogenic risk or systemic HQ.
Calculation of Cardnopaic Risk
Carcinogenic risk is calculated as the incremental probability of an individual developing canocr over
a lifetime (70 years), due to exposure to a carcinogenic compound. This is also referred to as incremental
excess cancer risk and represents the increased risk of developing cancer above the background rate, estimated
at 30%. Total excess cancer risk is expressed as a probability.
Carcinogenic risks are based on calculations d~eloped in the following order. Information on exposure
pathways, exposure concentrations, and toxicology were assembled or calculated. Chronic daily intakes (CDI)
were then calculated using assumptions from.the exposure and toxicity values presented in Chapters 3 and 4.
Non detects of chemicaJs present in at least one water sample in a well or set of wells were quantified by using
112 of the detection limit as the contaminant concentration. Mean and UCL concentration values were then
used to caJculate the estimated risk or hazard. Chemical specific carcinogemc slope factors (SF) were used
to convert estimated CDI. averaged over a lifetime, to incremental risk (refer to Chapter 4).
The doso-response relationship is considered to be linear under the low dose conditions usually
encountered in environmental expoBUJ'es. In consideration of this assumption, the SF is a constant and risk
is directly related to intake. Therefore the linear low-dose cancer risk equation is:
Risk= CDix SF Where:
Risk = a unitless probability of an individual developing cancer; CDI = Chronic Daily Intake averaged over 70 years (mg/kg-day); SF = slope factor, expre68ed in (mg/kg-day)·1•
The SF usually represents an upper 951~ percentile confidence limit of the probability of response, based
on experimental animal data. Therefore, the risk estimate will also be an upper bound estimate and "true risk"
is likely to be less than predicted by the model.
10
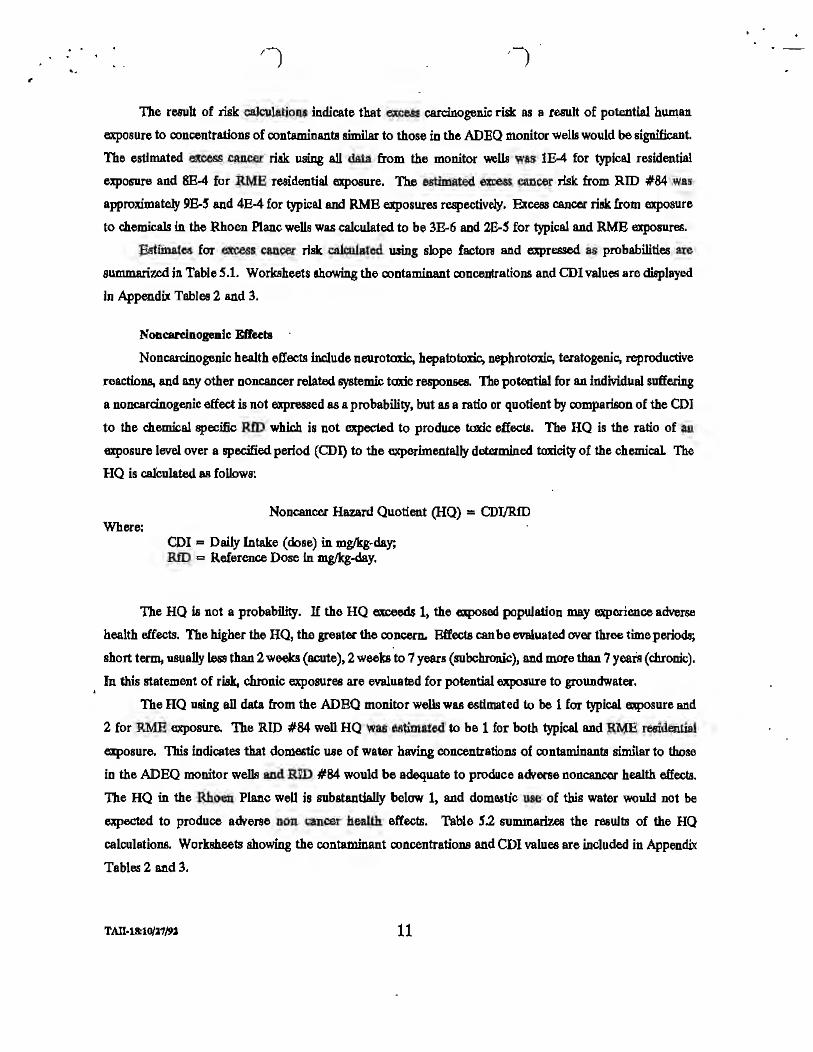
.. ,
The result of risk calculations indicate that excess carcinogenic risk as a result of potential human
exposure to concentrations of contaminants shnilar to those in the ADEQ monitor wells would be significant.
The esdmated ~ cancer risk usillg all data from the monitor wells was 1.E-4 for typical residential
exposure and 8E-4 for RMB residential exposure. The estimated excess cancer risk from RID #84 was
approximately 9B-S and 4B-4 for typical and RMB exposures respectively. Excess cancer risk from exposure
to chemicals in the Rhoen Plane wells was calculated to be 3&-6 and 2B-.S for typical and RMB exposures.
Estimates for excess cancer risk calculated using slope factors and expressed as probabiliti~ are
summarized in Table 5.1. Worksheets showing the contaminant ooncentrations and CDI valu~ are displayed
in Appendix Tables 2 and 3.
Noncarcinogenfc Effects
Noncarcinogenic health effects include neurotoxic, hepatotoxic; nephrotoxic, teratogenic, reproductive
reactioDB, and any other noncancer related systemic toxic responses. The potential for an individual suffering
a noncarclnogenic effect is not expressed as a probability, but as a ratio or quotient by comparison of the CDI
to the chemical specific RfD which is not expected to produce toxic effects. The HQ is the ratio of an
exposure level over a specmed period (CDI) to the experimentally determined toxicity of the chemical. The
HQ is cafoulated as follows:
Where: Noncancer Hazard Quotient (HQ) = CDTJRID
CDI = Daily Intake (dose) in mg/kg-day; RID = Reference Dose in mg/kg-day.
The HQ is not a probability. If the HQ exceeds 1, the exposed population may e.xperience adverse
health effects. The higher the HQ, the greater the concern. Effects can be evaluated over three time periods;
short term, usually less than 2 weeks (acute), 2 weeb to 7 years (subchronic), and more than 7 yeais (chronic).
In this statement of risk, chronic exposures are evaluated for potential exposure to groundwater.
The HQ using all data from the ADBQ monitor wells was esdmated to be 1 for typical exposure and
2 for RMB exposure. The RID #84 well HQ was estimated to be 1 for both typical and RMB residential
ezposure. This indicates that domestic u.se of water having concentrations of contaminant& similar to those
in the ADEQ monitor wells and RID #84 would be adequate to produce adverse noncancer health effecta.
The HQ in the Rhoen Plane well is substantially below 1, and dome.atic use of this water would not be
expected to produce adverse non cancer health effects. Table S.2 summari7.es the results of the HQ
calculations. Worksheets showing the contaminant concentrations and CDI values are included in Appendix
Tabl~ 2 and 3.
TAil·Utl0/27/9.1 11
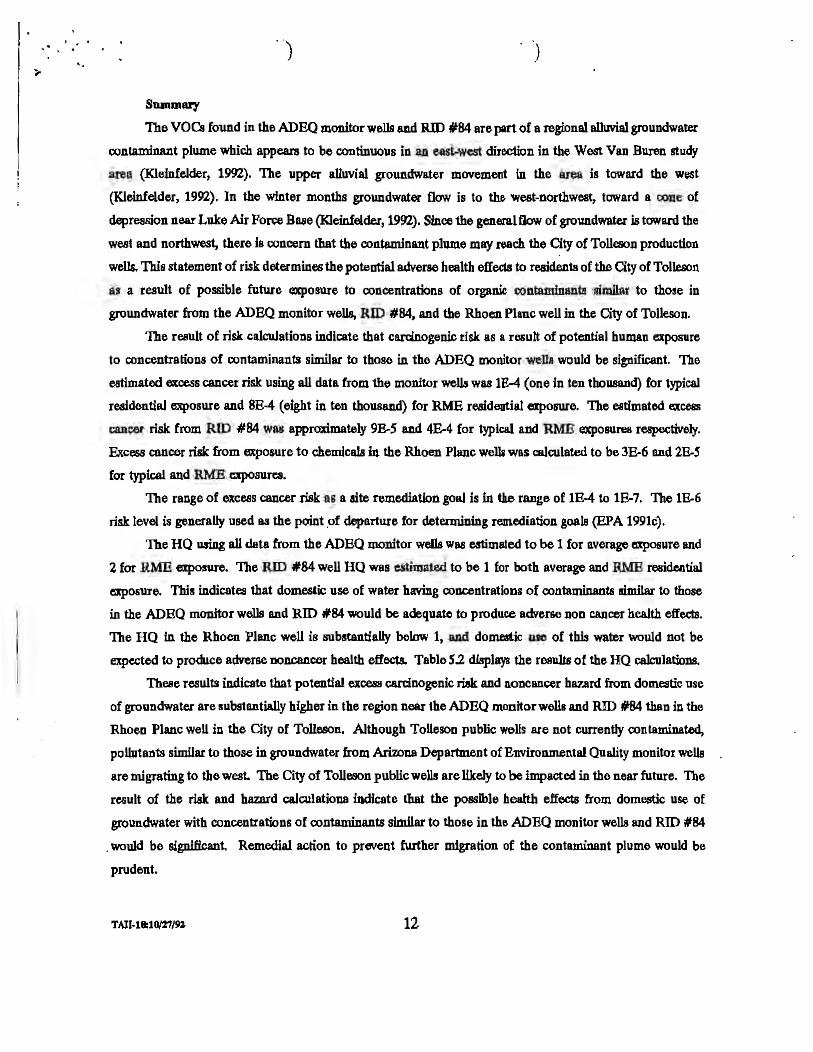
SU111mary
The VOC.s found in the ADEQ monitor wells and RID #84 are part of a regional alluvial groundwater
contaminant plume which appears to be continuous.in an east..west direction in the West Van Buren study
area (Kleinfelder, 1992). The upper alluvial groundwater movement In the area is toward the west
(Kleinfelder, 1992). In the winter months groundwater flow is to tho west-northweat, toward a oone of
depre8sion near Luke Air FoNe Base (Kleinfelder, 1992). Since the general flow of groundwater is ta.vard the
west and northwest, there is concern that the contaminant plume may reach the City of Tolleson production
wells. This statement of risk determines the potential adverse health effeds to re&dents of the City of Tolleson
as a result of possible future exposure to concentrations of organic contaminants similar to those in
groundwater from the ADEQ monitor wells, RID #84, and the Rhoen Plane well in the City of Tolleson.
The result of risk calculations indicate that carcinogenic risk as a result of potential human exposure
to concentrations of oontaminants similar to those in the ADEQ monitor wells would be significant. The
estimated excess cancer risk using all data from the monitor wells was lE-4 (one in ten thousand) for typical
residential exposure and 8B-4 .(eight in ten thousand) for RME residential exposure. The estimated excess
cancer risk from RID #84 was approximately 9&.S and 4E-4 for typical and RME exposures respectively.
Excess cancer risk from exposure to chemicals in the Rhoen Plane welJa was calculated to be 3:&6 and 2E-S
for typical and RME c:xposures.
The range of excess cancer risk as a site remediation goal is in the range of lE-4 to lB-7. The lE-6
risk level is generally used as the point .of departure for determining remediation goals (EPA 1991c).
The HQ u.sing all data from the ADBQ monitor wells was estimated to be 1 for average exposure and
2 for RME exposure. The RID #84 well HQ was estimated to be 1 for both average and RMB residential
exposure. This indicates that domestic use of water having ooucentrations of contaminants similar to those
in the ADEQ monitor wells and RID #84 'WOuld be adequate to produce adverse non cancer health effects.
The HQ in the Rboen Plane well is substantially below 1, and domeatic use of this water would not be
expected to produce adverse noncancer health effects. Table S.2 displays the results of the HQ calculations.
These results indicate that potential excess carcinogenic risk and noncancer hazard from domestic use
of groundwa~ are substantially higher in the region near the ADEQ monitor wells and RID #84 than in the
Rhoen Plane well in the City of Tolleson. Although Tolleson public wells are not currently contaminated,
pollutants similar to those in groundwater from Ari7.ona Department of Environmental Quality monitor wells
are migrating to the west. The City of Tolleson public wells are likely to be impacted in the near future. Tho
result of the risk and hazard calculations indicate that the possible heahb effects from domestic use of
groundwater with concentrations of contaminants shnllar to those in the ADBQ monitor wells and RID #84
. would be significant. Remedial action to prevent further migration of the contaminant plume would be
prudent.
TAIJ-18:10/%7/n 12
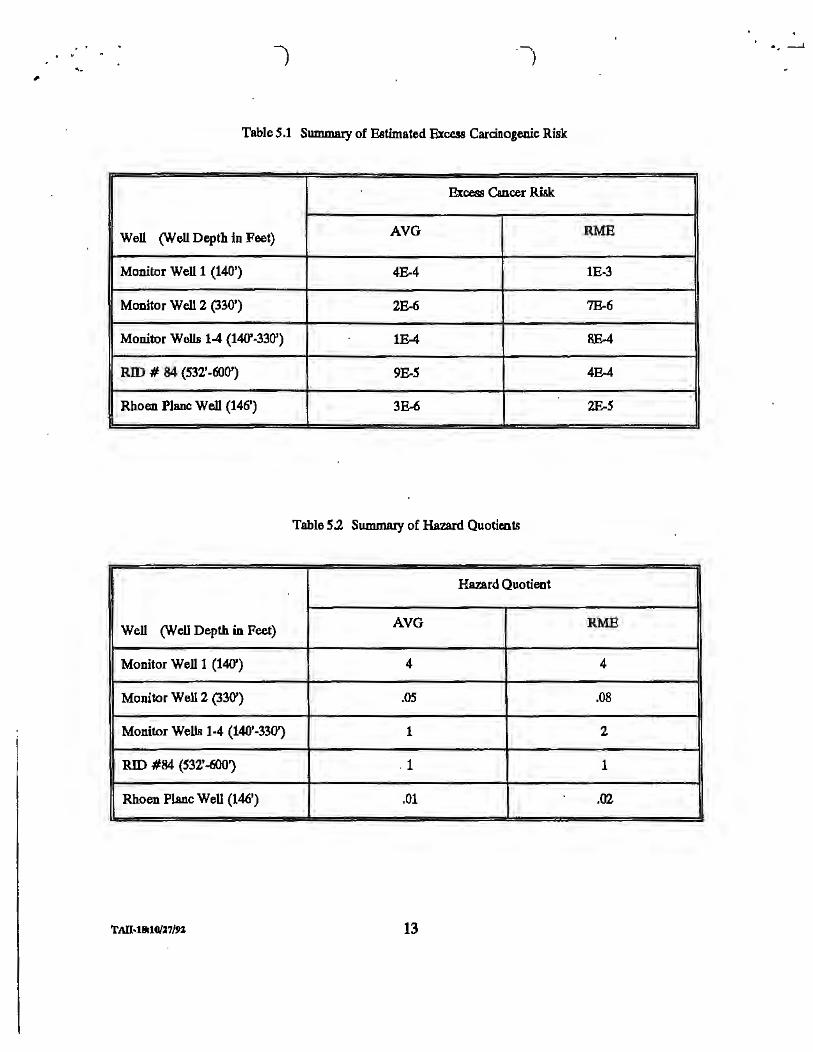
. . .. ---1 . . ,
Table.S.1 Summary of Estimated Excess Carcinogenic Risk
Excess Cancer Risk
Well (Well Depth in Feet) AVG RME
Monitor Well 1 (140') 4E-4 1E-3
Monitor Well 2 (330') 2E-6 7E-6
Monitor Wells 1-4 (140'-330') 1B-4 8E4
RID # 84 (532' -600') 9E-S 4B-4
Rhoen Plane Well (146') 3&-6 2E-S
Table S.2 Summacy of Hazard Quotients
Ha7.ard Quotient
Well (Well Depth in Feet) AVG RMB
Monitor Well l (140') 4 4
Monitor Well 2 (330') .05 .08
Monitor Wells 1·4 (140'-330') 1 2
RID #84 (532' -600') . 1 1
Rhoen Plane Well (146') .01 .02
TAl1·18t10/J7/n 13
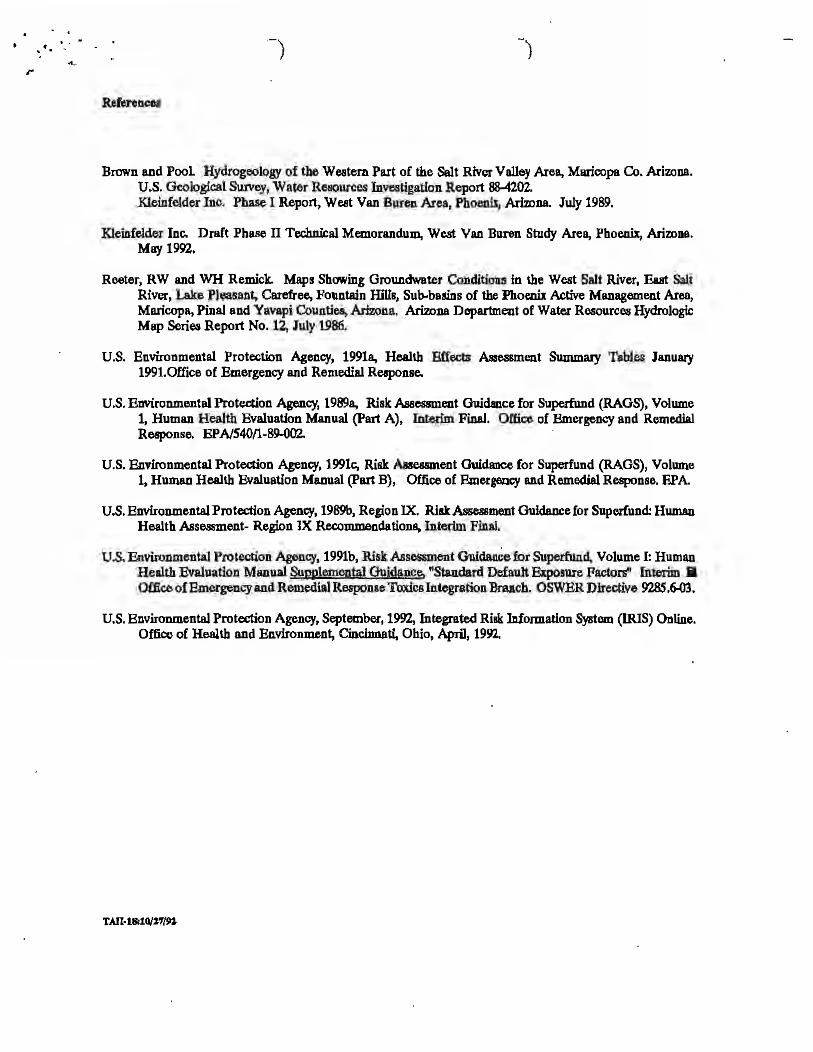
• . . . . . r
References
Brown and Poot Hydrogeology of the Western Part of the Salt River Valley Area, Maricopa Co. Arizona. U.S. Geological Suivey, Water Resources Investigation Report 88-4202. Kleinfelder Inc. Phase I Report, West Van Buren Area, Phoenix, Arizona. July 1989.
Kleinfelder Inc. Draft Phase II Technical Memorandum, West Van Bnren Study Area, Phoenix, Arizona. May 1992.
Reeter, RW and WH Remick. Maps Showing Groundwater Conditions in the West Salt River, East Salt River, Lake Pleasant, Carefree, Fountain Hins, Sub-basins of the Phoenix Active Management Area, Maricopa, Pinal and Yavapi Counties, .Arimna. Arizona Department of Water Resources Hydrologic Map Series Report No. 12, July 1986.
U.S. Environmental Protection Agency, 1991a, Health Effects Aaaessment Summary Tables January 1991.0ffice of Emergency and Remedial Response.
U.S. Environmental Protection Agency, 1989a, Risk Assessment Guidance for Superfund (RAOS), Volume 1, Human Health Evaluation Manual (Part A), Interim Final. Office of Emergency and Remedial Response. EP A/540/1-89-002. ·
U.S. Environmental Protection Agency, 1991c, Risk Assessment Guidance for Superfund (RAGS), Volume 1, Human Health Evaluation Manual (Part B), Office of Emergency and Remedial Response. EPA.
U.S. Environmental Protection Agency, 1989b, Region IX. Risk Assessment Guidance for Superfund: Human Health Assessment- Region JX Recommendations, Interim Final.
U.S. Environmental Protection Af,ency, 1991b, Risk .AssCISDlent Guidance for Superfund. Volume I: Human Health Evaluation Manual SuJ!plemental Guidance. "Standard Defauh Exposure Factors" Interim a Office of Emergency and Remedial Response Toxics Integration Branch. OSWER Directive 9285 .6-03.
U.S. Environmental Protection Agency, September, 1992, Integrated Risk Information System (IRIS) Online. Office of Health and Environment, Cincinnati, Ohio, April, 1992.
TAII· lfH0/2.'T{l>l
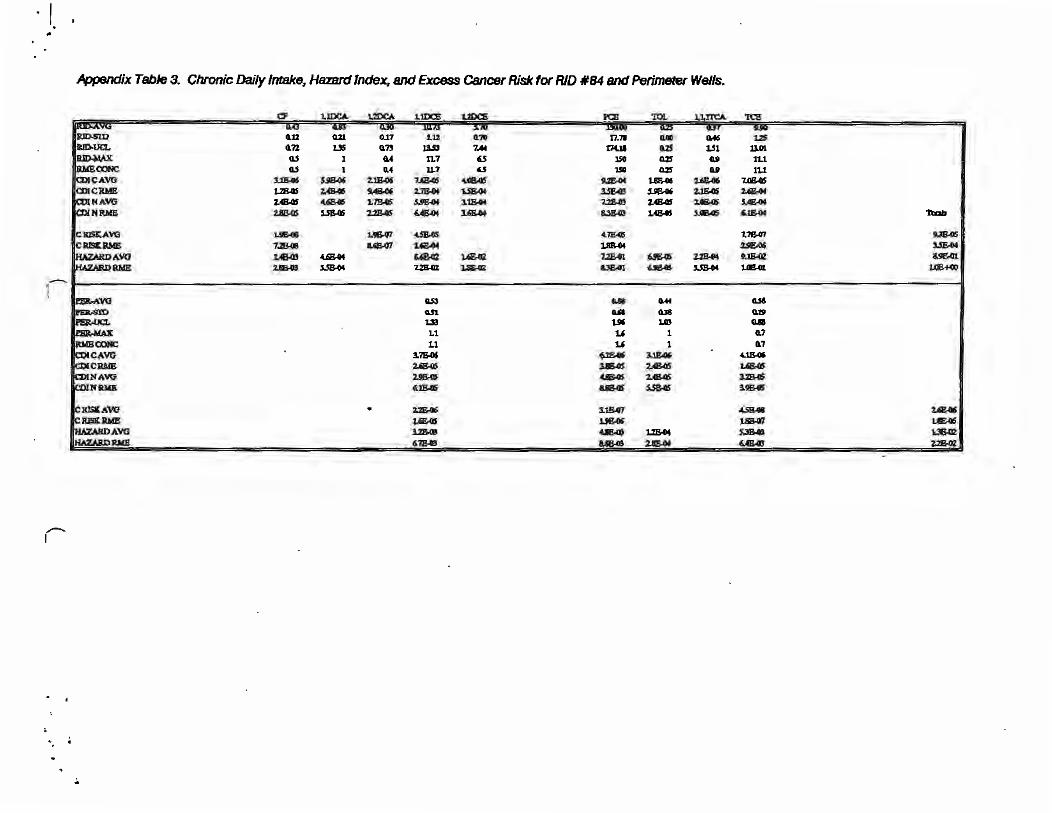
. 1.
Appendix Table 3. Chronic Daily Intake, HBZ8Td Index, and Excess Cancer Risk for RID #84 and Perimeter Wells.
G.12 o.21 Q.17 1.12 Cl'llll 11.11 CUii OM us .. n us a:n tUJ 7.44 t14.ll o.zs U l 11'1 a.s 1 M 1L7 4'5 ue Q.%5 ... 1L1 e.5 1 Cl4 U.7 "5 u. Q.2S Clt 11.t
SJS-06 ~ 2.~ UB45 4.-..S 9.28.ot U&G6 2.Q!..e6 '1.111.45 L2S«S Z.6411 ~ 2.~ Ull4' l.J&GS "646 2.l&Gf ~ :z.eos ~ 11SOS ~ 3.m.4 'llJ!...43 l.484 2.GllM SAB-Ot 2.ll&QS s.sg.es 2.2.&4S ~ 1Ql..M &3&03 U8-IS 5.41&G5 '-JB.04 TCllU
lS&Gt 1.9647 <Ul!AS 4.7!!4' 1..1Sm 9.38.o.S 7.2SG8 &e.o7 J.Q!.04 ].88..04 ~ 15&04 2.4B4J 4$44 ~ lA&Cll 7.2£01 6.!l&OS ~ t.JB« U&Cll 2.mG ~ us.c J.8.«l &ll!« f.JIM5 ~ UB« UEffO
I
f--· ---QS3 ... Mt G.54 G.51 UI &JI 0.1' 1-» 1M lJD a.a L1 u 1 G.7 L1 u 1 0.7
3.~ 628-9' lJE-Of 4.US.. 2.A&GJ 3.8M5 2AB4S ~ 2.tl!4 4.IBoQS 2AB45 3.2IMl5 6.l&GS us.as s.5&45 S.96415
.. ~ 1$417 45&41 ~ 1.&45 1'6-Df l.8IW1 1.E.oS llBe <UE«J u&M s.JSe 1..36.m 6.7MB 8.18-Q) 2.81!-0f &AB.GS 2.2B4Z
I
.,
'
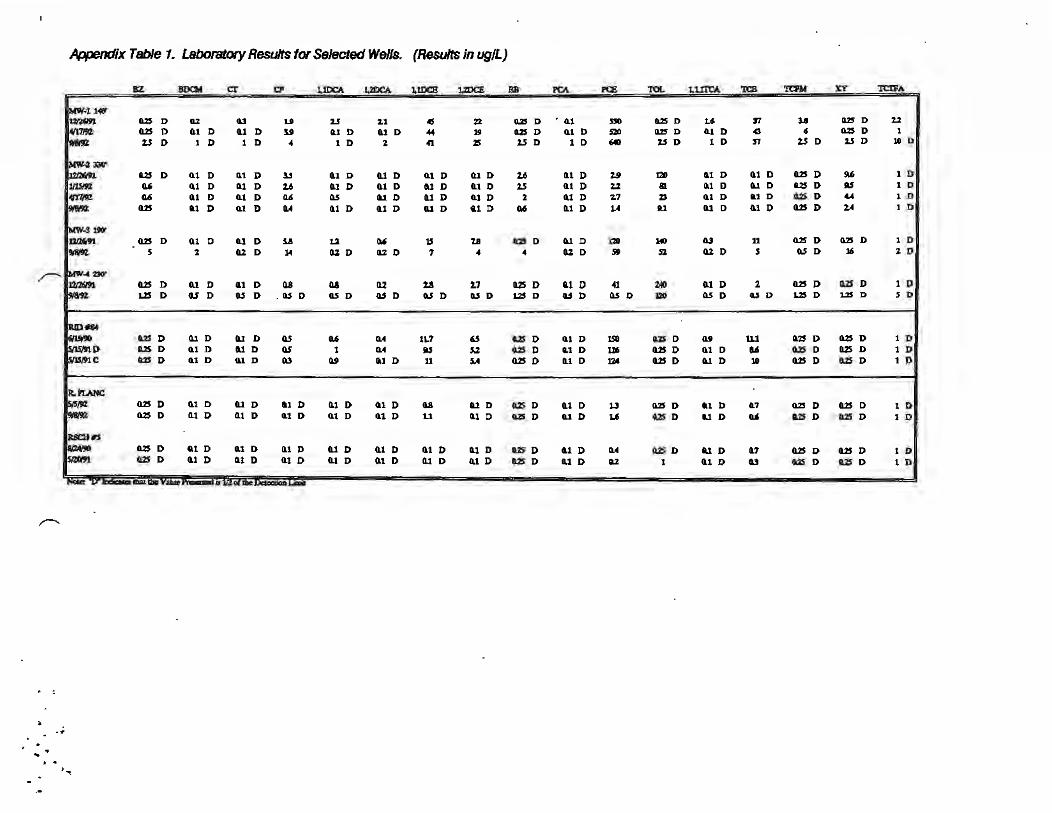
Appendix Table 1. LaboratOry Results for Selected Wells. (Results in ug/L)
BZ BDCM er QI l.lDCA l,2DCA ztDCB UDC! BB PCA res TOL 1.1.lTCA TCB Ta'M XY 'J'CIFA
o.2S D 11.2 ~ u 15 :u cs 22 US D • G.1 "° Cl2S D u ~ u o.2S D u Q2S D 6.1 I) U D u IUD O.t D <44 1f US D IU !> S'30 US D t.1 D 4 ' US D 1.S 0 1 D 1 D .. t D 2 41 25 2.S D 1 D 640 z.s D 1 D ,.., :U D 25 D 111 D
Cl2S D o.t D 0.1 D " 0.1 D Q.1 D 0.1 D CUD 2.6 ll.l D 'la 120 UD 0.1 D Q2S D 9.6 l D M Q.l D Q.l D 2' 0.1 D Q.1 D Ill D o.t D 25 O.t D z.z 81. IU D Al D US D !IS 1 D u 0.1 D iU D " (IS a.t 0 t.1 0 Cl.1 D 2 t.1 D 2.1 :D o.1 D U D US D « 1 D
Cl2S ai 0 O.t D llA G.1 0 0.1 D CU D UD o.6 1.1 0 1A u CU D 0.1 0 Cl2S D 2A 1 D
CU5 D Q.1 0 0.1 D u t.2 ~ ts 'Z.8 US D 6.1 D no 1'40 QJ u Cl2S D IUS I> l D s 2 UD l4 0.ZD IUD 1 .. .. 11.2 D 51' n Q.l 0 s Q.S D 1' 2 D
US D 0.1 D a.1 0 Ila ca Q2 2.& 2.7 ll2S D tl I) 41 2AO 0.1 D 1 025 D Q.2S D l I> US D UD O.S D • O.S D O.S D UD O.S D IU D 1.2$ D O.S D O.S D UD t.S D GS D L2S D 1.2S D s o!
Q2S D Q.J D 11.l D o.s o.6 QA 1L7 &5 US D Cl.ID 150 Q.25 D .., Ul 6.2$ D IUS D 1 D US D G.1 D t.1 D o.s 1 CL4 as $,% Cl2S D 8.1 D U6 Cl2S p 0.1 D u Cl2S D ll2S D 1 D Cl2S 0 0.1 D 0.1 D Q3 Q.f IUD u i.4 CUS D UD tu Q.2S D o.l D lA> Cl2S D Cl2S D t I>
6.25 D 0.1 D cu 0 ai D 11.1 D UD u lll1 D CUS D Q.1 D 13 !US D t.1 D t.7 D.2S D Cl.2S D 1 D Cl2S D Ill D 01 D 0.1 D G.t D CLt D u CU D US D Cl.1 D 1.6 IUS D al D °" a1S D CU5 D 1 D
Q2S D Q.l D Q.l D IU D 0.1 0 Q.1 D Q.1 D IU 0 Cl2S D t.1 D u G.25 D t.1 D G.7 Q.25 D IUS D 1 D US D 6.1 D CUD 0.1 D CUD a.1 D UD 1.1 D tlS D t.1 D az 1 0.1 D cu Q2S D o.25 D t D
r-
.... .. . ... .•
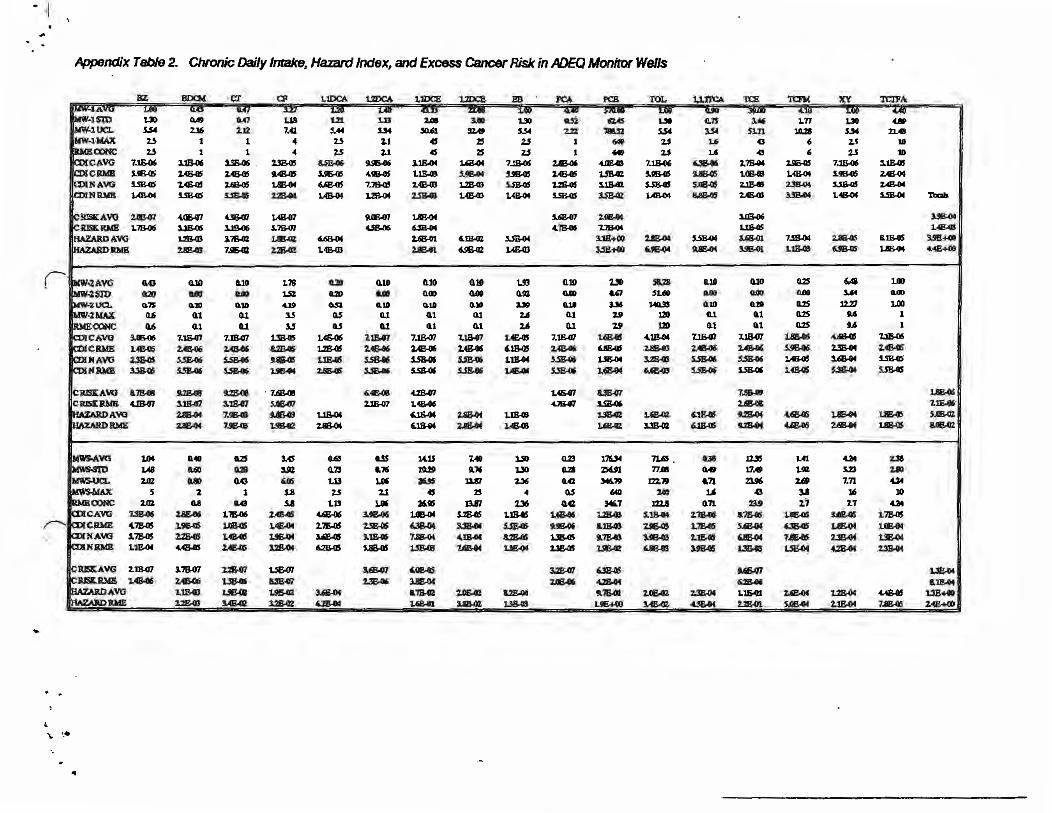
• ·I .,.
Appendix Table 2. Cluonic Daily Intake, Hazard Index, and Excess Cane«' Risk in llJEQ Monitor Wells
M1 ua 121 1.U 2All SAO uo .n CAS UI G.75 lM 1.77 uo l.12 7.41 S.M U4 $0.'1 :.. "" U2 78&32 s.54 1S4 SLll lo.28 "" 1 4 2.S :u 4S 2S 2.S I - 2S 1.6 0 ' 2.$ IO
7.S 1 1 4 u 2.1 4S 2S ZJ l 640 2.$ u .0 ' :2J UI
7.JE4 1lM6 131>4' . 231!.0S ~ 9.96-06 ).llt-0( ~ 7.m.tll 2JB.4' ~ 7.UM)6 ~ :Z.16-94 ~ 7.lE-06 3.lJt.OS $.!ISOS ~ 1.4845 ~ .S.9fi.45 4.964S 1.lB-e .S.tB-04 us.es us.el 1.$Mlt S..9&05 18845 um.«J 1.e-04 .S.9845 2.48-04 1.Sl!-GS us.as U84S l..llUf ~ 7.1&05 z.e.e 1.l'&Ot s.s&4l5 ~ S.tBC s.5E.aJ ~ 2.l&e 2.SB-04 $..S8-4S ~
lAB-04 SSE-Cl5 ~ 2.2£04 1.e.4 1.$44 2JB.e t.GOJ lAB-04 UMll 3.SB42 LE-04 &.8SOS USG) 3.3SOC '1A844 S.lB-04 TOCU
2.GB41 <l.Cl647 .us..I ~ 9.11841 ~ 1Al!A7 Z.G&e4 1QS06 1llEOt
lJS4 3.1846 S.1&01 ~ ~ 4.7846 l.1644 ~ L4&4J IS4t 1711« ua.oi "8-04 UB-01 6.ISC .s.m.. l.IB+OO 2.llB.e4 5.sB-04 US01 7.5S04 2..88-os 8.U!-OS S.9B-Ml0
UB49 7SC 2.2SC L4&GS ~ f.tMZ 1.4!-CB s.m+CIQ 6.9&04 MB-04 ~ LlB-CB USQ5 ~ "'4B+CIO
rlw~AVG w o.JI U• L18 Glll O.IO o.t• G.1' L!t CllO 2.30 SlUI 11.10 CllO o.2S '4 LOO ~ uo Ult i.n UD ... O.tO ... ui ut .... SUI> ... .... .... 3.64 -Q.'JS 1.10 11.:111 4.~ o.si G.ll 11.10 0.1' 1lt G.19 1l6 ~ II.JD .. ,,. us 1121 l.00 u G.t G.1 3.5 GS Ill e.1 o.i 2.6 O.l u 120 Cl.l O.t t.25 M l
" tJ a.t 1.S o.s 0.t u 0.1 u QJ. u 120 0.1 0.1 DZ M l
3.1646 7.JB.01 7.m.7 1.JB.IS L44' 7.1M7 7.1847 7.1847 1.e4$ 7.1&47 1A&4l5 4.lS-04 1.lS.41 XJ8.4J7 1.E-06 ..... UMli LeGS ~ ~ &m.G5 1.2S.QS 2..46-06 ~ 1.eG5 6.1JMS ~ ua.o.s 7.8S4D U6Gf ~ $.tB-06 ~ 2A84 2.l&05 S.5M6 ~ lS45 t.18.QI SS. "8-06 ~ 1.ll-04 .us. Ul5.64 3..2S4' ~ ~ lAB45 ~ J.SB.e5 3.lB4 5.$06 SS. Ul644 :z.s8.G5 SJB.G6 ua.4' .s.JE.G6 1ASOC ~ 1.et4 6.'84'J ~ J.SB4 US.OS S.3644 S.s&4S
8.7!!M !U£G8 9.28-QI . 7Al!.GI 44MI UB.o7 1.A647 &3B47 7.llli-OP 1.8MIS 1~ 3.~ S/&07 ~ 1.41-0f .C.m..7 3.51!416 2.AMS 7.lE4
~ 7 ... f.8B.4J lJB-04 ~ 2.88-04 l.IS-GJ 13&42 1.fiB.Gi 6.lMIS 9.28.04 ~ 1.614 1JB.OS s.aa.-02 2.E44 7JIB4 us.a2 US-04 6.~ 2.88-0I 1.48-0S J.Ql.4Z 3.38-GZ '-1IMIS !.lSOf ~ U!B-Ot ~ &OSCl2
MWS.AVG to4 0.40 "' MS "' ~ IA.1$ 7AO !JO o..23 1'1U4 716.'i . bl 12.JS 1Al u. 2.38 MWS8J1) 1M uo Q.28 ui t.73 t.1' 1*2t !1.1' uo d 2SU1 77M ... 17M uz llJ 2.81
IM'PJS.UCL 2.aZ UD o.G &.oS LU ,... 3'f5 ll.S1 2-3' GAZ """" m.'9 t.71 %19' 2M 7.71 4.24 5 2 1 SJI 15 2.1 4S 2S .. o.s 640 240 1.4 .cs u 16 JO
2.112 Cl.8 &a SJI 1.JS 1M 26."5 W7 lJ6 o.42 ~7 122.1 0.71 :zig 'l.'I 7.7 U4 ~ Ul&Oi L~ 2AIM5 '4t-4' 1-.. 1.1644 $.2US 1.lMIS ~ use .S.l&-04 'l.111-116 &1&GS LE4S JAB.OJ L'IMIS 4.184S 1Jl6.m 1.11845 ~ .2.7fA 2JE4S '38-04 ~ $.SB4 ,,!llM)i 1.-m.tJ U6.(IS L'7&05 s.AEOt 6.3&415 U&04 UE-04
' ·-··~·-.S.7J!.OS us.as 1A8"4IL! Ul!A4 Ml>-05 l.'IB4 1~ 41&0C &2S4S l.J8.0S l.1MS UB-CB .2.11545 &8644 7.IJE.05 2.lB-04 ~ 1.2844 4.-csas us. J.28.04 ~ ·UB415 use 7A&Of 1JB..Of 2J8.4S tJIMl2 ue..es "845 UB.e UB.e4 4.26-4" us..4
.2.fB.07 1~ l.2S07 u&01 !.QMl7 ue.«5 J.28..01 '3B4S Ml>07 US04 1.4&06 1.JB.41' a,m.cJ7 ~ ~ 2.ll6M 4.2&e4 ~ l.11Wt LJB.4D USG USG2 3.Qi..OC &'Jll.Gl 2-C&G'l 8.2J!..oe t.'JS.01 2.$02 %.311.0C i.m.os ~ 1.2Se4 4..48-65 us...-
'rnt"R 12&4U s.eai l.2&Q2 '-JB.-04 1..eot J.1842 U8-03 LllE+OJ 3185 .(3&0C ~ SJl&04 'l.1&44 7JIB.«5 2.48+00
,.
'\ ~
..

EXHIBIT "2''
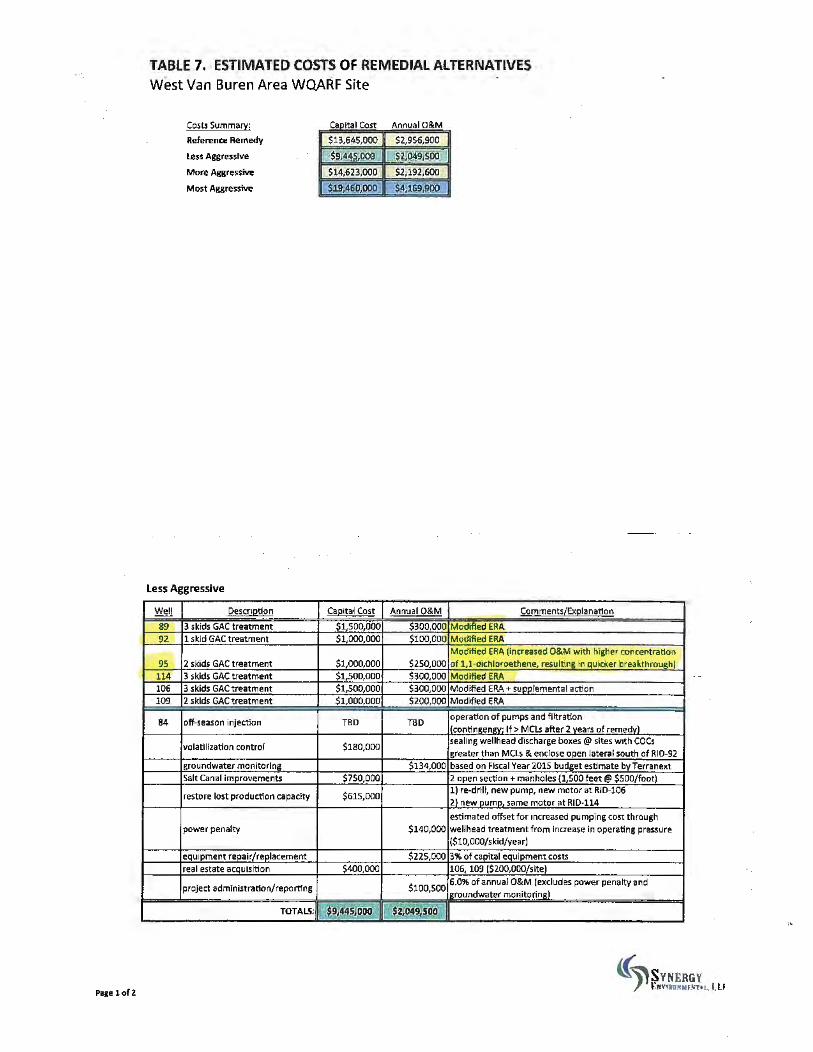
Page 1 o(2
TABLE 7. ESTIMATED COSTS OF REMEDIAL ALTERNATIVES West Van Buren Area WOARF Site
Costs Summaff
Reference Remedy
Less Aggre$slve
More Aggressive
M o:st Aggressive
l ess Aggressive
~ Descri2tion
89 3 skids GAC treatment 92 1 skid GAC treatment
95 2 skids GAC treatment 114 3 skids GAC treatment 106 3 skids GAC treatment 109 2 skids GAC treatment
84 off-season injection
volatilization control
groundwater monitoring Salt Canal improvements
restore lost produc.tion capacity
power penalty
equipment repair/replacement real estate acquisition
project administration/reporting
TOTAlS:
Ca ICo lPila st
$13,645,000
$9,4~000
S14,623,000
$19,4.60,000
Ca2itai Cost
$1,500,000 $1,000,000
$1,000,000 $1,500,000 $1,S00,000 $1,000,000
TBO
$180,000
$750,000
$615,000
$400,000
. ~. ij,~lfll!!! ~
I & Annua O M
$2,956,900
' W 0.t91SOO
$2,192,600
$4,l.69,900
AnnualO&M i;;omments[Ex11lanat1on
S300,000 Modified ERA $100,000 Modified ERA
Modified ERA (increased O&M with higher concentration $250,000 of l,l ·d1chloroethene, resultm.R 10 quicker breakthroughl $300,000 Modified ERA $300,000 Modified ERA+ supplemental action $200,000 Modified ERA
TBD operation of pumps and filtration kontinir:enl!V: If > MCLs after 2 vears of remedvl naling wellhead discharge boxes @sites with COCs greater than MCLs & enclose open lateral south of RID-92
$134,000 based on Fiscal Vear 2015 budget estimate by Terra next 2 open section +manholes (1,500 feet@ $500/foot) 1) re-d rill, new pump, new motor at RID-106 2) new pump, same motor at RID-114
estimated offset for increased pumping cost through $140,000 wellhead treatment from inaease in operating pressure
($10,000/skid/year)
$225,000 3% of ca.Pltal equipment costs 106 109 1$200,000/site)
$100,SOO 6.0% of annual O&M lexdudes power penalty and groundwater monitoring)
~ _,~""' $1'91~5-0JJ
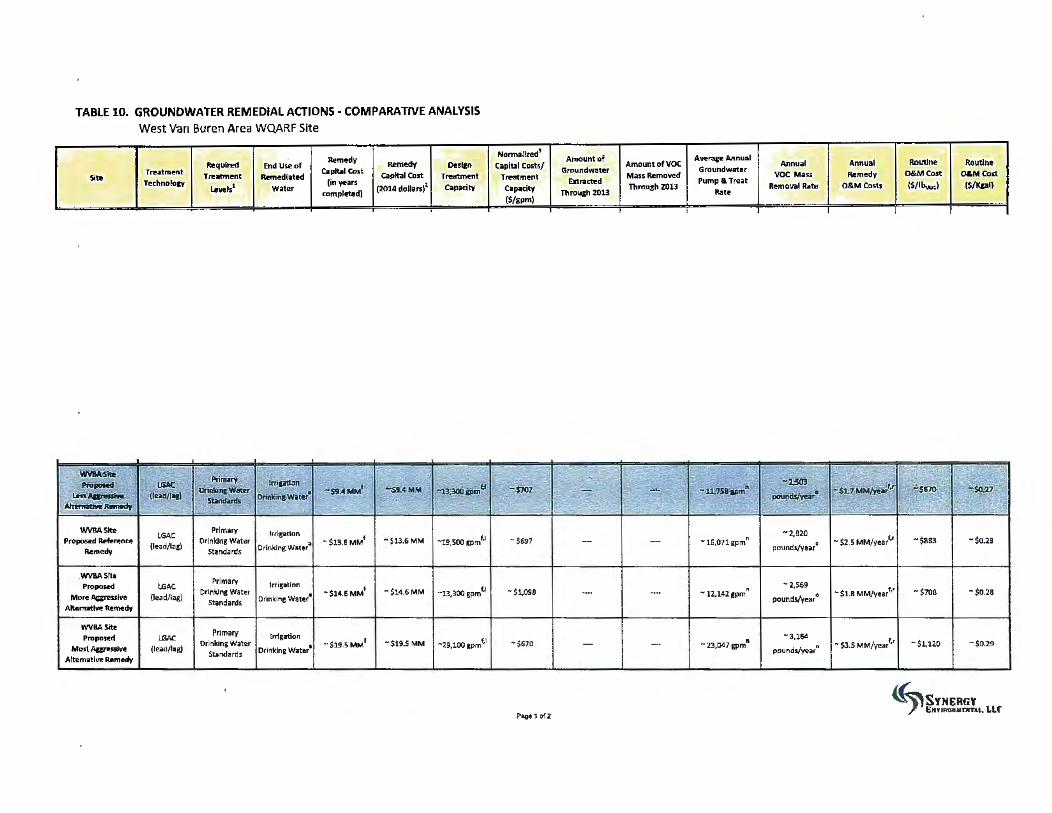
TABLE 10. GROUNDWATER REMEDIAL ACTIONS· COMPARATIVE ANALYSIS West 'Ian Buren Area WQARF Site
Remedy Required End Use of Remedy Deslfn
TrNtment Ca pltal Cc>Jt Site T1eatment Rernedlated capital Cost Treatment
Technolo&Y l.eveb1 Water
(in years (2014 doDars)1 CapHity
mmplmd)
.. -'YN8.t;'61ta
i ~~~K Prim•i:v , :<11'.'fptlon . lGAt I DlinMfn11W'~ 1 '"-$9.4MM1 .-ia~,¢.1;1 , "'$c4-MM Li'ii"~ <!!~as1 biin~tWate}•
-"lt;; ... ~R~ •Slandar:ds
WVBAS!te LGAC
Prltnaty lnigalion -$13.5MM
1 -19.500 fpmfJ ,ro_d Refe,.,nte {le..d/lag)
Ortnklng Water Orinkin.c Watera
-S!3.6MM Remedy Sllndards
.WVBASlto Primary Proposed lGAC Orlnklng Water
lnig~tlon
-$14,6 MM1 "$14.6MM -13,300 gpm ti
Mo"' Agressive (lead/lag) Orinkinc Water' Altematlve lle""'dy
Standards
WVBASite Prlmarv
Proposed lGAC ln1J1tion -$J95MM1 -ig,100 gpm1'1
Most Aureuive (lead/lag) Orlnklng Water
Drlnkln1 Watu• -$19.SMM
Alternative Remedy Standards
Normallred1
Amount of Averare Annual Capital Costs/ AmountofVOC Annual Annual Routine Routine
Groundwater Groundwater Tl'fttmenl Mass Removed VOC Mass Remedy o&MCOSt O&MCost
Exlr'acted Thtcugh Z013
Pump & Treat R""'oval Rate O&M Costs ($/lb,,oc) ($/Kpl) C•p.11city Th ro111h 2013 Rate
(S/gpm)
~ - - -- .. f- -
I .. I '"'·l:SIB 1-'$1.7!'1MM""11~ I I
~ ~ I ->$670' -t§p" '"'.·$"101 1 ! .;;,,:;.."; -u\'7Ss'8Pml' - I ! PoU!'d!(Yd~' . ~ ,.
~ ----- -- ~.
-$697 - - n • 16,071 gprn
-2,.820 - $2.S MM/year'•' -$883 -$0.29 .
pound$/yeat
-$1,0!IS " - 2,569
-s1.a MM/yea/" -$708 - $0.28 - - - 12.142gpm pounds/'{ ear•
-$&70 - -- • - n,047gpm -!.164
- $3.S MM/yea/-' pound•/vear
0 -suw -$0.29
Pagel of2 (("'SYNER~1.LLr
,f 'E"""°"'"
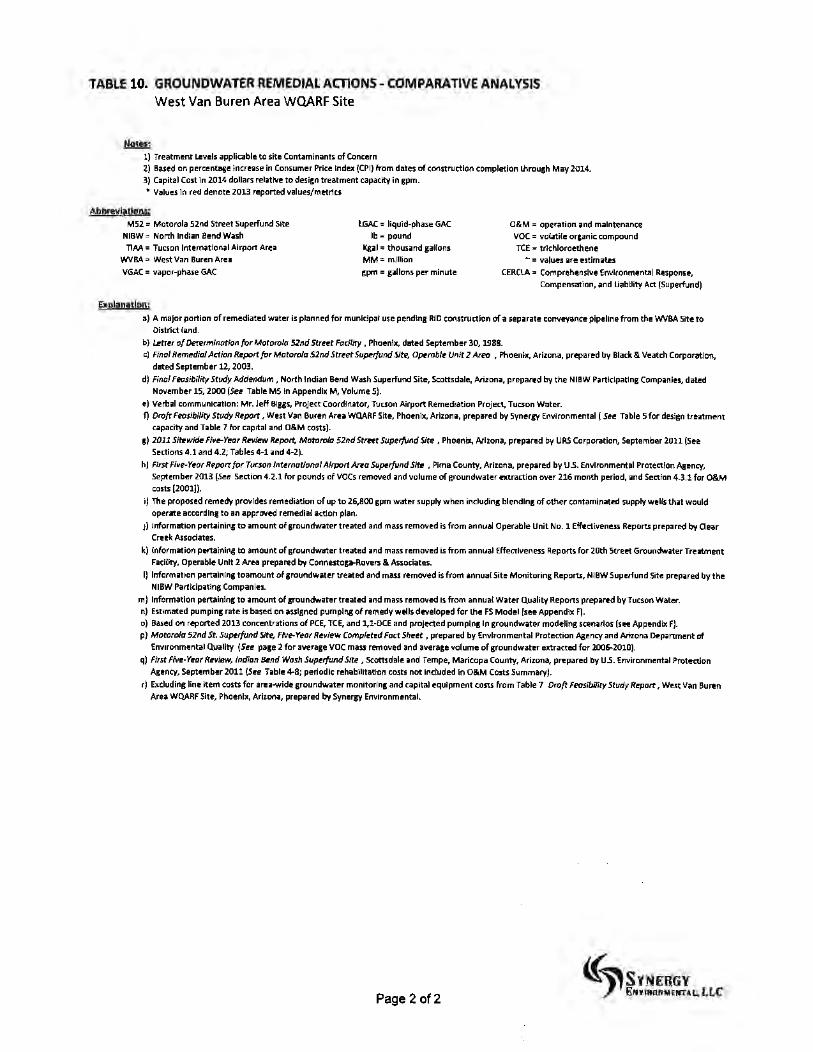
TABLE 10. GROUNDWATER REMED•AL ACTIONS~ COMPARATIVE ANALYSIS West Van Buren Area WQARF Site
Notes:
1) Treatment Levels applicable to site Contaminants of Concern i) Based on percentage increase in Coosumer Price Index (CPI) from dates of CO<lstructlon completion through May 2014. 3) Capital Cost ln 2014 dollars relative to design treatment capacity in gpm. • Values lo red denote 2013 reported values/metrics
Abbreviations; M52 = Motorola 52nd St~et Superfund Site
NIBW = North Indian Bend Wash TIAA = Tucson lntemn1onal Airport Area
WVBA ~ West Van Buren Area VGAC = vapor·phase GAC
Explanatlon:
lGAC = liquid-phase GAC lb= pound
Kgal" thouund gallons MM= million gpm = gallons per minute
O&M = operation and maintenance VOC = volatife organic compound rce = ttlchloroethene
- = values are estimates CERCl.A s Comprehensive environmental Response,
Compensation, and Liabllity Act (Superfund)
a) A major portion of remediated water is planned for municipal use pendlns RID COl'IStructlon of a separate conveyance pipeline from the WVBA Site to Oistrict land.
b) Letter of Determln11tion for Motorol" S2nd Street Facility , Phoenix, dated September 30, 1988.
cJ Final Remedial Action Report for Motorola S2nd Street Superjund Site, Operable Unit 2 Ateo , Phoenix, Arizona, prepared by Black & Veatch Corporation, dated September 12, 2003.
dl Final Feasibility Study Addendum , North Indian Bend Wash Superfund Site, Scottsdale, Arizona, prepared by the NIBW Participating Companies, dated November 15, 2000 (See Table M5 In Appendix M, Volume SJ.
el Verbal communication: Mr. Jeff 81ggs, Project Coordinator, Tvcson Airport Remediation Project, Tucson Water. f) Dt0/t Feoslbilit:y Study Report, West Van Suren Area WQARF Site, Phoenix, Arizona, prepared by Synergy Environmental ( See Table 5 for design treatment
capacity and Table 7 for capital and O&M costs). g) 2011 Sitewide fi•e-Year Review Report, Motorola 52nd Stre<it Superfund Site , Phoenix, Arizona, prepared by URS Corporation, September 2011 (See
Sections 4.1and4.2; Tables 4·1and4·2).
hl First Fl•e·Yeot Repott for Tucson lnternationol Airport Area Superfund Site , Pima County, Arizona, prepared by U.S. Environment al Protection Asency, September 2013 (See Section 4.i.1 for pounds of voes removed and volume of groundwater extraction over 216 month period, and Section 4.3.1 for O&M costs (2001!).
i) The proposed remedy provides remediation of up to 26,800 gpm water supply wnen including bl ending of other contaminated supply wells that would operate according to an approved remedial action plan.
ii Information pertaining to amount of groundwater treated and mass removed is from annual Operable Unit No. 1 Effectiveness Reports prepared by Oear Creek Associates.
kl Cnformation pertaining to amount of groundwater treated and mass removed is from annual Effectiveness Reports for Wth Street Groundwater Treatment Facility, Operable Unit 2 Area prepared by Connestog~Rovers & Associates.
I) Information pertaining toamount of sroundwater treated and mass removed is from annual Site Monitoring Reports, N18W Superlund Site prepared by tne NIBW Participating Companies.
ml Information pertaining to amount of groundwater treated and mass removed is from annual Water Quality Reports prepared by Tucson Water. n) Estimated pumping rate is based on assigned pumping of remedy wells developed for the FS Model fsee Appendix F). o) Based on reported 2013 concentrations of PCE, TCE, and l,l·OCE and projected pumping In groundwater modeling scenarios (see Appendix f}. p) Motorola 51nd St. Superfund Site, Ffve-Yeat Review Comp/etrd Fact Sheet , prepared by Environmental Protection Agency and Anzona Department of
Environmental Quality (See page 2 for average VOC mass removed and average volume of groundwater extracted for 2006-2010). q) fir5t five·Yeot Review, Indian Bend Wosh Superfund Site , Scottsdale and Tempe, Maricopa County, Arizona, prepared by U.S. Environmental Protection
Agency, September 2011 (See Table 4-8; periodic rehabilitation costs not included In O&M Costs Summary). t) Excluding line item costs for area-wide groundwater monitoring and capital equipment costs from Table 7 Draft feasibility Study Report, West Van Buren
Area WQARf Site, Phoenix, Arizooa, prepared by Synergy Environmental.
Page 2of2

EXHIBIT "3"
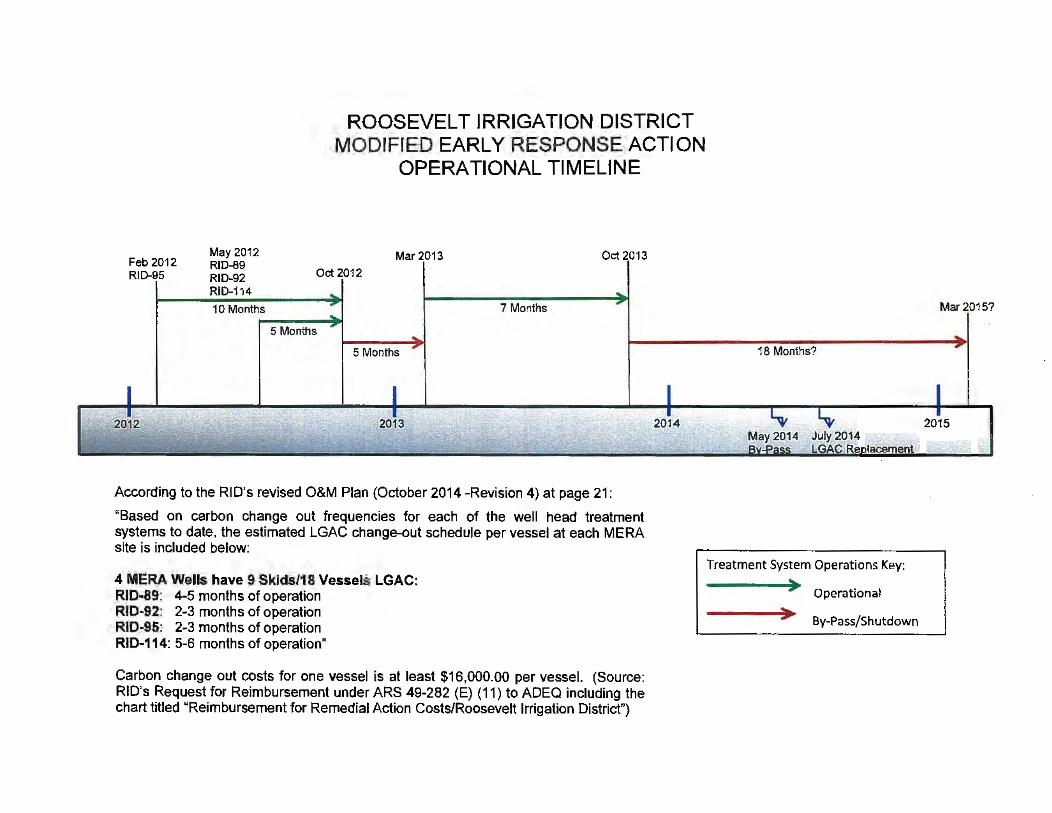
ROOSEVELT IRRIGATION DISTRICT MODIFIED EARLY RESPONSE ACTION
OPERATIONAL TIMELINE
Feb 2012 RID-95
2012
May 2012 RID-89 RID-92 RI0-114
10 Months
Mar 2013 Oct 2013
Oct2012
7 Months
5 Months
5 Months
2013
According to the RI D's revised O&M Plan (October 2014 -Revision 4) at page 21 :
"Based on carbon change out frequencies for each of the well head treatment systems to date, the estimated LGAC change-out schedule per vessel at each MERA site is included below:
4 MERA Wells have 9 Skids/18 Vessels LGAC: RID-89: 4-5 months of operation RID-92: 2-3 months of operation RID-95: 2-3 months of operation RID-114: 5-6 months of operation"
Carbon change out costs for one vessel is at least $16,000.00 per vessel. (Source: RID's Request for Reimbursement under ARS 49-282 (E) (11) to ADEQ including the chart titled "Reimbursement for Remedial Action Costs/Roosevelt Irrigation District")
2014
Mar 2015?
18 Months?
2015 May2014
Treat ment System Operations Key: ~
,,,,. Operational !II.. ~ By-Pass/Shutdown
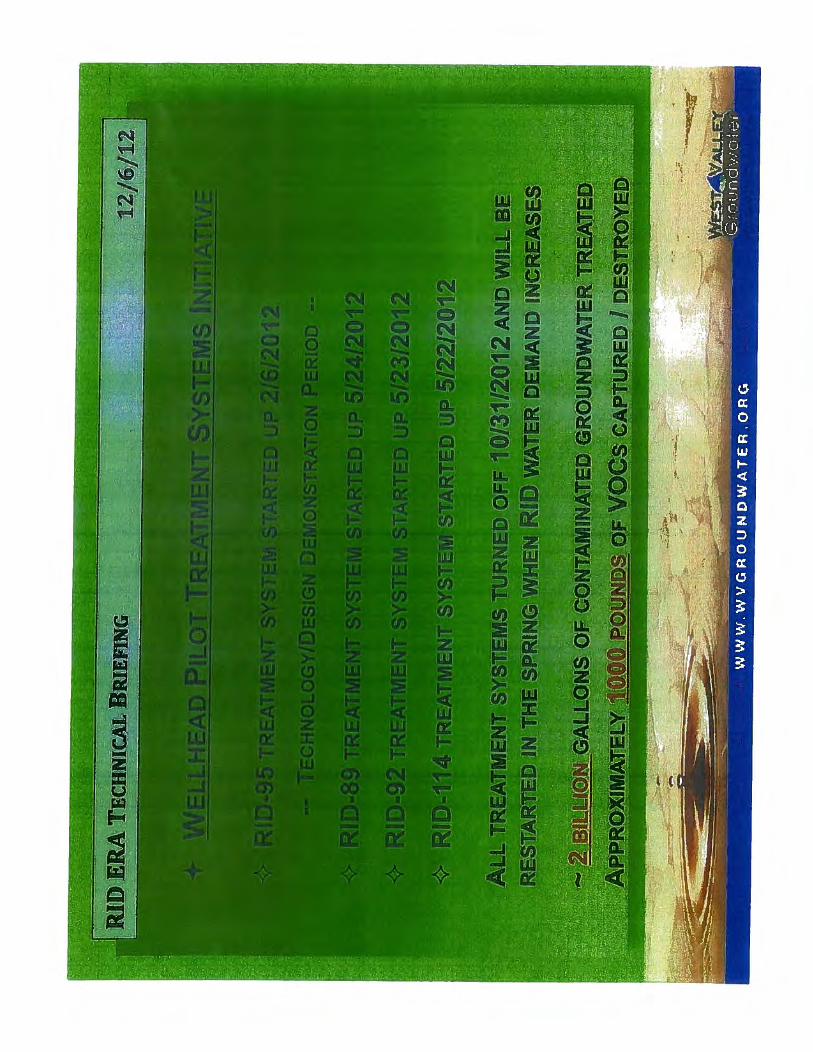
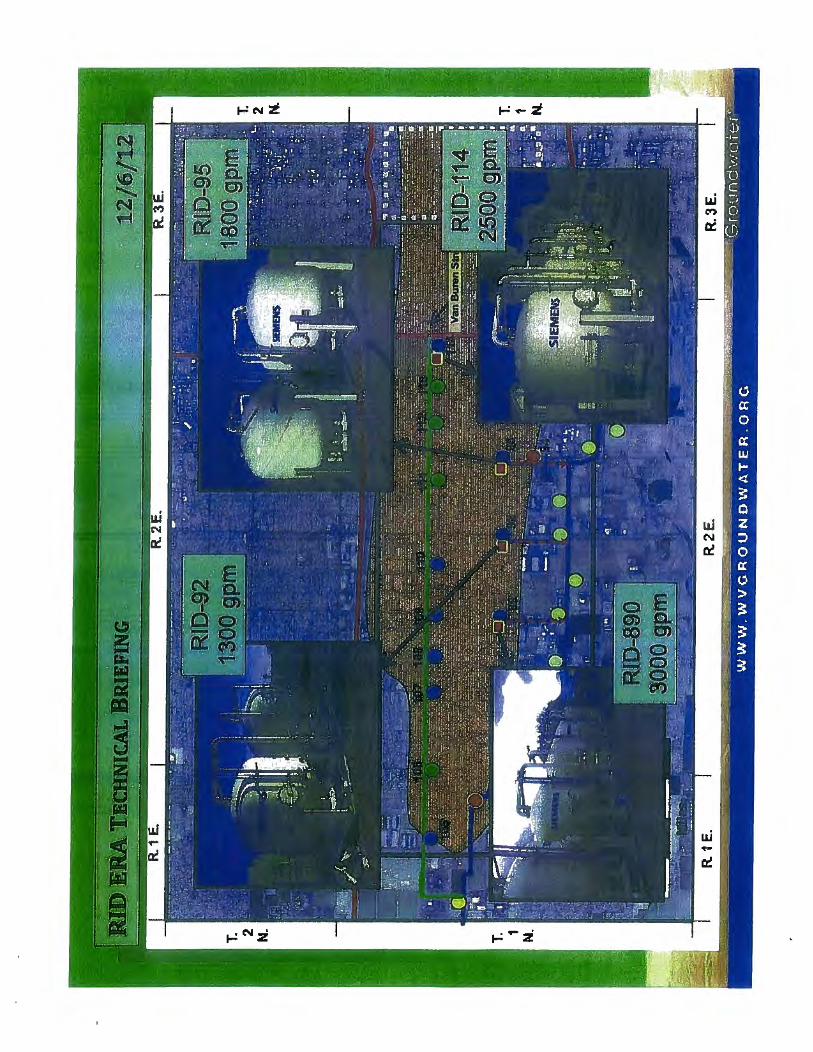
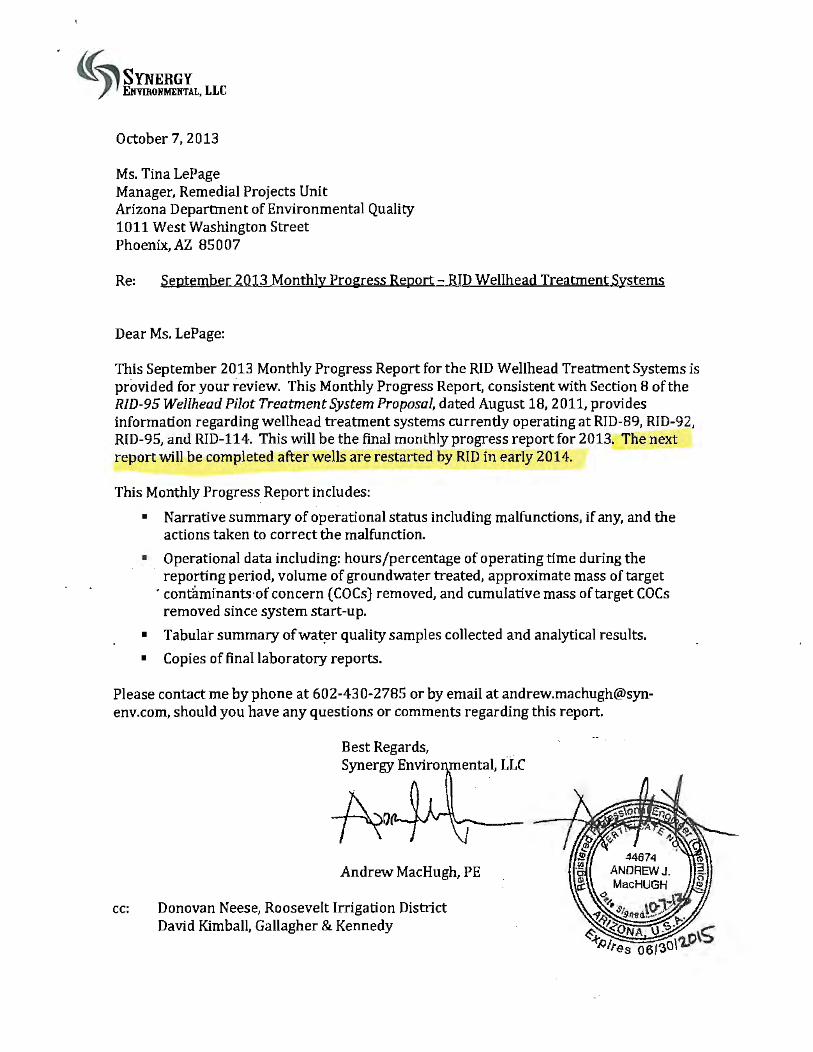
October 7, 2013
Ms. Tina LePage Manager, Remedial Projects Unit Arizona Department of Environmental Quality 1011 West Washington Street Phoenix, AZ 85007
Re: September 2013 Monthly Progress Report - RID Wellhead Treatment Systems
Dear Ms. LePage:
This September 2013 Monthly Progress Report for the RID Wellhead Treatment Systems is provided for your review. This Monthly Progress Report, consistent with Section 8 of the RID-95 Wellhead Pilot Treatment System Proposal, dated August 18, 2011, provides information regarding wellhead treatment systems currently operating at RJD-89, RID-92, RID-95, and RJD-114. This will be the final monthly progress report for 2013. The next report will be completed after wells are restarted by RID in early 2014.
This Monthly Progress Report includes:
• Narrative summary of operational status including malfunctions, if any, and the actions taken to correct the malfunction.
• Operational data including: hours/percentage of operating time during the reporting period, volume of groundwater treated, approximate mass of target
·contaminants· of concern (COCs) removed, and cumulative mass of target COCs removed since system start-up.
• Tabular summary ofwat~r quality samples collected and analytical results.
• Copies of final laboratory reports.
Please contact me by phone at 602-430-2 785 or by email at andrew.machugh@synenv.com, should you have any questions or comments regarding this report.
Best Regards, Synergy Enviro mental, LLC
Andrew MacHugh, PE
cc: Donovan Neese, Roosevelt Irrigation District David Kimball, Gallagher & Kennedy
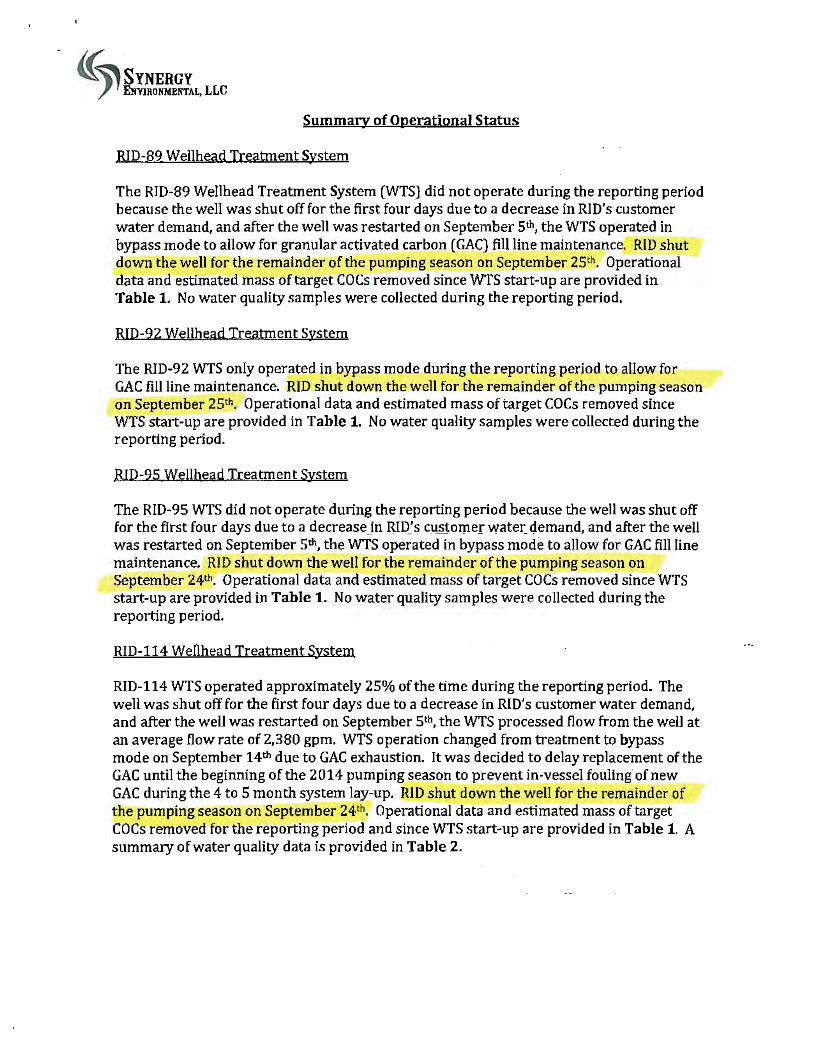
((~SYNERGY ,J 1 ENmoNMENTAL, LLC
Summary of Operational Status
RID-89 Wellhead Treatment System
The RID-89 Wellhead Treatment System (WIS) did not operate during the reporting period because the well was shut off for the first four days due to a decrease in RID's customer water demand, and after the well was restarted on September 5th, the WTS operated in bypass mode to allow for granular activated carbon (GAC) fill line maintenance. RID shut down the well for the remainder of the pumping season on September 25th. Operational data and estimated mass of target COCs removed since wrs start-up are provided in Table 1. No water quality samples were collected during the reporting period.
RID-92 Wellhead Treatment System
The RID-92 WIS only operated in bypass mode during the reporting period to allow for GAC fill line maintenance. RID shut down the well for the remainder of the pumping season on September 25th, Operational data and estimated mass of target COCs removed since WTS start-up are provided in Table 1. No water quality samples were collected during the reporting period.
RID-95 Wellhead Treatment System
The RID-95 WIS did not operate during the reporting period because the well was shut off for the first four days due to a decrease in RID's customer water demand, and after the well was restarted on September Sth, the WTS operated in bypass mode to allow for GAC fill line maintenance. RID shut down the well for the remainder of the pumping season on September 24th. Operational data and estimated mass of target CO Cs removed since WIS start-up are provided in Table 1. No water quality samples were collected during the reporting period.
RID-114.Wefihead Treatment System
RID-114 WIS operated approximately 25% of the time during the reporting period. The well was shut off for the first four days due to a decrease in RID's customer water demand, and after the well was restarted on September 5th, the WTS processed flow from the well at an average flow rate of 2,380 gpm. WTS operation changed from treatment to bypass mode on September 14th due to GAC exhaustion. ·Jt was decided to delay replacement of the GAC until the beginning of the 2014 pumping season to prevent in-vessel fouling of new GAC during the 4 to 5 month system lay-up. RID shut down the well for the remainder of the pumping season on September 24th, Operational data and estimated mass of target COCs removed for the reporting period and since WTS start-up are provided in Table 1. A summary of water quality data is provided in Table 2.
((~SYNERGY ,1 1 ElmRolfMElfTAL. LLC
Attachments:
1) Table 1. RID Wellhead Treatment Systems Metrics 2) Table 2. RID-114 Wellhead Treatment System Data Summary 3) Copy of Final Analytical Report
. ,
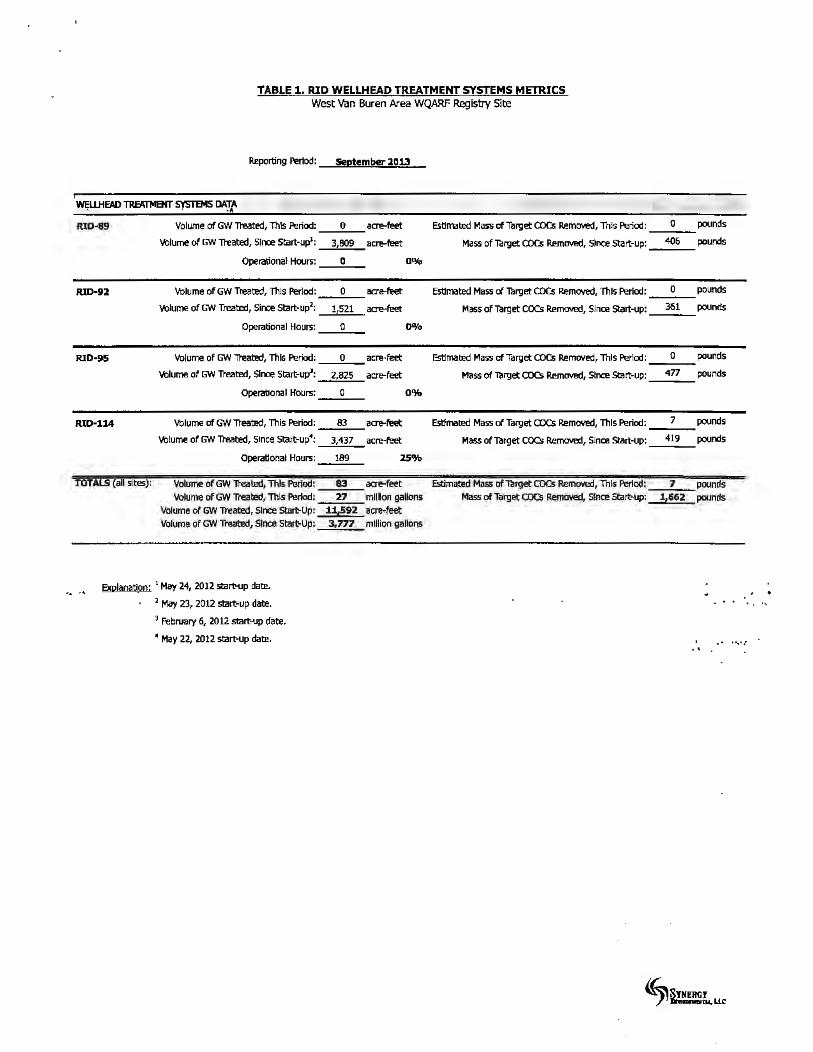
TABLE 1. RIO WELLHEAD TREATMENT SYSTEMS METRICS West van Buren Area WQARF Registly Site
Reporting Per1od:
.~lJ.HEAD~ S'fSIB4S PA!f RlD-89 Volume of QI/ Treated, This Period:
VOiume of GW Treated, Since start-up1:
Operational Hours:
RlD·92 Volume of c;-N Treated, ThJs Period:
Volume of c;-N Treated, Since Start-up2:
Operational Hours:
RJD·95 Volume of GW "!teated, This Period:
VOiume of CNI Treated, Since Start-up3:
Operational Hours:
RlD·114 Volume ofGWlteated, This Period:
Volume of GN Treated, Since Start-up•:
Operational Hours:
TOTALS (all sites): Volume ofGW lteated, This Period: Volume of GW ll'eated, This Period:
Volume of GW Treated, Since start-Up: Volume of GW Treated, Since Start-Up:
.. . · '4 Exolanatlon: 1 May 24, 2012 starklp date •
i May 23, 2012 start-up date. 3 f'ebruary 6, 2012 sta~p date.
• May 22, 2012 start-up date.
5el!tember 2013
0 aae-feet Estimated Mass of Target COCs Removed, This Period:
3,809 acre-feet Mass of Target COCs Removed, Since Start-up:
0 0%
0 acre-feet Estimated Mass of Target COCs Removed, This Period:
1,521 acre-feet Mass of Thrget COCs Removed, Since Start-up:
0 00/o
0 acre-feet Estimated Mass of Target COCs Removed, This Period:
2,825 acre-feet Mass of Target COCS Removed, Since start-up:
0 0%
83 aCTe-feet Estimated Mass of Target ax:s Removed, This Period:
3,437 acre-feet Mass ofThrget COCs Removed, Since Start-up:
189 2S'Yo
83 acre-feet Estimated Mass of ll!rget COCS Removed, Thls Period: 27 mlllon gallons Mass of Target cocs Removed, Slnce start-up:
1~592 acre-feet 3,777 million gallons
'~
0 pound.s
'406 pounds
0 pounds
361 pounds
0 pounds
477 pounds
7 pounds
419 pounds
7 pounds !te62 pounds
.. ····:.
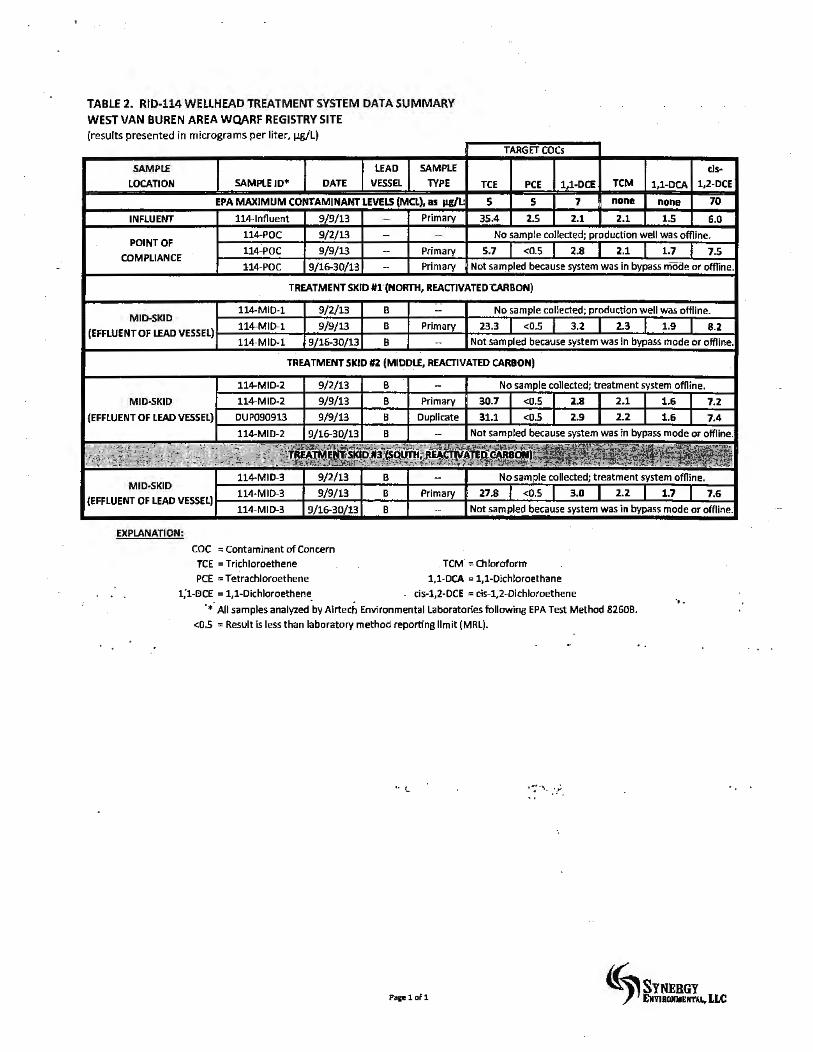
TABLE 2. RID·114 WELLHEAD TREATMENT SYSTEM DATA SUMMARY WEST VAN BUREN AREA WQARF REGISTRY SITE {results presented in micrograms per liter, µg/L}
SAMPlE LEAD SAMPLE
LOCATION SAMPlEID" DATE VESSEL TYPE
EPA MAXIMUM CONTAMINANT LEVELS (Ma), as p.g/l:
INFLUENT 114-lnfluent 9/9/13 - Primary
114-POC 9/2/13 - ·-POINT OF
9/9/13 COMPLIANCE
114.POC -· Primary
114-POC 9/16-30/13 -- Primary
TARGETCOCs
cl~
TCE PCE 1,1·DCE TCM 1,1-DCA 1,2-DCE
s s 7 none none 70
35.4 2.5 2.1 2.1 1.5 6.0
No sample collected; production well was offiine.
5.7 <0.5 2.8 2.1 1.7 7.5 Not sampled because system was in bypass mode or offline.
TREATMENT SKID #1 (NORTH, REACTIVATED CARBON)
114-MID·l 9/2/13 B -· No sample collected; production well was off1ine. MID-SKID
9/9/13 23.3 2.3 (EFFLUENT OF LEAD VESSEL)
114-MID-l B Primary <0.5 3.2 1.9 8.2
114-MID-1 9/16-30/13 B .. Not sampled because system was in bypass mode or offiine.
TREATMENT SKID #2 (MIDDLE, REACTIVATED CARBON)
114-MID-2 9/2/13 B - No sample collected; treatment system offl ine.
MIO.SKID 114-MID-2 9/9/13 B Primary 30.7 <0.5 2.8 2.1 1.6 7.2
(EFFLUENT OF LEAD VESSEL) DUP090913 9/9/13 B Duplicate 31.l <0.5 2.9 2.2 1.6 7,4
114-MID-2 9/16-30/13 B -· Not sampled because system was in bypass mode or offiine.
·.;y:,_;~ :.:!~i·~l,''~~- .. -~~~ilio13 rs'h_lirH, ~"!~·~• ~{;fo "'" ~·
,, '!,.. .• ·~ • ,.., ··~
.,;.t'li "'.\I!',
MID·SKID 114-MID·3 9/2/13 B - No sample collected; treatment system offline.
114·MID-3 9/9/13 27.8 <0.5 2.2 1.7 (EFFLUENT OF LEAD VESSEL)
B Primary 3.0 7.6
114·MID-3 9/16-30/13 B Not sam pied because system was in bypass mode or offiine.
EXPLANATION:
COC =Contaminant of Concern TCE = Trichloroethene PCE = Tetrachloroethene
..
TCM =Chloroform
1,1-DCA = 1,1-Dichloroethane 1;1.ecE = 1,1-Dichloroethene cis-1,2-DCE = cis-1,2-Dlchloroethene ...
·•All samples analyzed .by Alrtech Environmental Laboratories following EPA Test Method 82608.
<0.5 = Result is less than laboratory method reporting limit (MRL).
.. ,_ ··;·--. ,·;r·
Paplof1 {~SYNERGY f 1 EliYJBOHMENTAL,. LLC
. ((~SYNERGY ,! I E.NVOlONMENTAL, LLC
Copies of Final Analytical Reports
. .... ·. & • ••
. . ...... . . . . .., .... \ " - .,
. . ~· .. ::·.
Airtech Environmental Laboratories (AEL) 4820 E.Elwood St., Suite 13, Phoenix , AZ. 85040 480-968-5888 Fax 480-966-1888
Date: September 13, 2013
Client: Andrew MacHugh Work Order#: 131007 Company:
Address:
Synergy Environmental, LLC
10645 N. Tatum Blvd, #200-437 Phoenix AZ. 85028
Project Name: Project Number:
RID Pilot Treatment Systems
802.40 Received Date: 9/9/2013
Dear Client:
Airtech Environmental Laboratories received seven (7) samples for analysis.
All analyses met laboratory QA/QC with any exceptions addressed in the Case Narrative.
If you have any questions or concerns regarding your samples analysis, please contact the laboratory at 480-968-5888
Sincerely,
Yu Min Shi Technical Director Airtech Environmental Labs
Arizona ADHS License No. AZ.0740 .· . .
....... .... .
<Page 1 of 13>
. .
Client: Company: Address:
LABID 131007..01
13!007..()2
131007-03
131007-04
131007..()5
13!007-06
131007-07
Airtech Environmental Laboratories (AEL) 4620 E.Elwood St., Suite 13, Phoenix, AZ. 85040 480-968-5888 Fax 480-966-18S8
Andrew MacHugh Synergy Environmental, LLC 10645 N. Tatum Blvd, #200~437 Phoenix AZ 85028
Date: September 13, 2013
Work Order #: 131007 Project Name: RID Pilot Treatment Systems
Project Number: 802.40 Received Date: 9/9/2013
SAMPLE SUMMARY
CLIENT ID METHOD SAMPLE DATE SAMPLE TIME
Trip Blank 82608 8/512013
114-lnfluent 82608 9/9/2013 1158
114-POC 82608 9/9/2013 1200
114-MID-1 82606 919/2013 1202
114-MID-2 82608 919/2013 1204
114-MID-3 82608 9/9/2013 1206
OUP090913 82608 919/2013
. ~ ....
.. . .. ·-~· ·.·.,
; . . ;• ...
<Page 2 of 13>
ROOSEVELT IRRIGATION DISTRICT DIRECTORS
W. BRUCE HEIDEN, PRESIDENT DWIGHT 8 . LEfSTER
K.C.GINGG
October 20; 2014
Ms. nna lePage, Manager
103 WEST BASELINE ROAD BUCKEYE, ARIZONA 85326 TELEPHONE (623) 388-2046·
FAX (623) 380-4360
Remedial Projects Unit, Waste Programs Division Arizona Department of Environmental Quality 1110 West Washington Str.eet Phoenix, AZ 85007
SUPERINTENDENT DONOVAN L. NEESE
Re: RESPONSE TO COMMENTS: REVIEW OF OPERATION AND MAINTENANCE PLAN -ROOSEVE.LT IRRIGATION DISTRICT WELLHEAD TREATMENT SYSTEMS West Van Buren WOARF Registry Site Phoenix, Arizona
Dear Ms. lePage:
The Roosevelt Irrigation District (RID) has reviewed comments by the Arizona Department of Environmental Quality {ADEQ} and three (3) individuals/entities (David Iwanski, a WVBA Site CAB member; Ridenour Hienton, PLLC, counsel for Meritor, Inc., and Fennemore Craig~ PC, counsel for Nucor Corporation and BNSF Railway Company) on the Operation & Maint~nance Plan, RID Wellhead Treatment Systems (O&M Plan), dated October 2013 (Revision 3}, received on September 5th, 2014. As requested, the following responses to ADEQ comments and the stakeholder comment letters are being submitted within 45 calendar days of the date of ADEQ's letter. Also, with this letter, RID is submitting a revised O&M Plan for ADEQ's review, and if appropriate, approval pursuant to Arizona Administrative Code (A.A.C.) R18-16-411(E)(l} and "certification by the Department that the elements of the operations and maintenance plan adequately protect public health against treatment system failure" in accordance with A.A.C. R18· 16·411{E)(1).
RESPONSES TO AOEQ REQUIRED INFORMATION
Comment #1: "In accordance with A.A.C. R18-16-4ll(E){4), the O&M Plan shall include 'a process for the treatment system operator to promptly notify potentially affected water providers of a failure of a key treatment system component that could affect the quality of a discharge of treated water.'
While RID has provided a brief notification procedure description in Section 4.1, which includes notification to ADEO; RID has not included potentially affected water providers such as the City
1
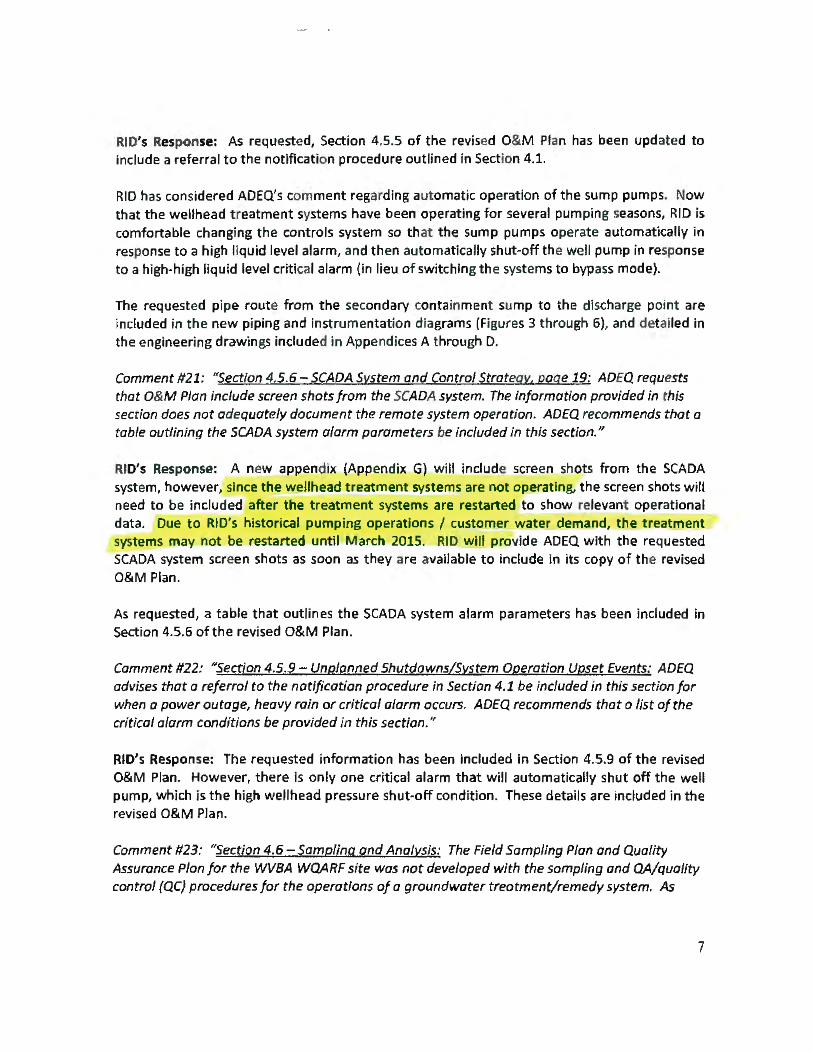
RID's Response: As requested, Section 4,5.5 of the revised O&M Plan has been updated to include a referral to the notification procedure outlined in Section 4.1.
RID has considered ADEQ's comment rega rding automatic: operation of the sump pumps. Now that the wellhead t reatment systems have been operating for several pumping se.asons, RID is comfortable changing t he controls system so that the sump pumps operat e automatically in response to a high liquid level alarm, and then automatically shut~off the well pump in response to a high*high liquid level critical alarm (in lieu of switching the systems to bypass mode).
The requested pipe route from the secondary conta inment sump to the discharge point are included in the new piping and instrumentation diagrams (Figures 3 through 6), and det ailed in the engineering drawings included in Appendices A through D.
Comment #21; "Section 4.5.6 - SCADA System qnd Control Strategy, page 19; ADEQ requests that O&M Plan include screen shots from the SCADA system. The information provided in this section does not adequately document the remote system operation. ADEQ recommends that a table outlining the SCADA system alarm parameters be included in this section."
RID's Response: A new appendix (Appendix G) will include screen shots from the SCADA system, however, since the wellhead treatment systems are not operating, the screen shots wilt need to be included after the treatment systems are restarted to show relevant operational data. Due to RID's historical pumping operations / customer water demand, the treatment systems may not be restarted until March 2015. RID will provide ADEQ with the requested SCADA system screen shots as soon as they are available to include in its copy of the revised O&M Plan.
As requested, a table that outlines the SCADA system alarm parameters has been included in Section 4.5.6 of the revi sed O&M Plan.
Comment #22: nsection 4.5.9 - Unplanned Shutdowns/System Operation Upset Events: ADEQ advises that a referral to the notification procedure in Section 4.1 be included in this section for when a power outage, heavy rain or critical alarm occurs. ADEQ recommends that a list of the critical alarm conditions be provided in this section.''
RIO's Response: The requested information has been included in Section 4.5.9 of the revised O&M Plan. However, there is only one critical alarm that will automatically shut off the well pump, which is the high wellhead pressure shut-off condition. These details are included in the revised O&M Plan.
Comment #23: "Section 4.6 -Sampfinq and Analysis: The Field Sampling Plan and Quality Assurance Plan for the WVBA WQARF site was not developed with the sampling and QA/quality control {QC} procedures for the operations of a groundwater treatment/remedy system. As
7
changes were already included in· the revised O&M Plan. For new comments that were favorably c;onsidered, the revised O&M Plan was modified to address those comments.
In response to General Comment #3', there are no permits required to operate the wellhead treatment systems.
In response to Specific Comment #3, spare parts are iQentified in the engineering drawings now included as Appendices A through D, and the Siemens O&M Manual included as Appendix E of the revised O&M PJan.
Other comments that were considered but not addressed in the revised O&M Plan were not regarded as "technical problems", and therefore, not necessary elements to adequately protect public health against treatment system failure.
Letter #3 - Fennemore Craig, P.C., counsel for Nucor Corporation and BNSF Railway Company, Comments on the Roosevelt Irrigation District's ("RID") NOperotion and Maintenance P/an-n, dated July 21, 2014.
Comment: "It is more logical to consider these four wellhead treatments as four separate treatment facilities requiring four separate O&M Plans."
RID's' Response: All wellhead treatment systems pump and treat groundwater from a commingled plume, are operated from one central fleld office, and are comprised of identical equipment sets, control valves, RTUs, instrumentation, etc. The primary differences include the capacity of the wells feeding the treatment systems and the routing of the treatment system pipi'ng~ which is not a significant aspect for O&M considerations. RID does not believe these differences merit generating four (4) separate plans, and therefore, only one, (1) O&M Plan ·will be used for the wellhead treatment systems. Similarly, these wellhead treatment syst~ms are part of a single effort to address regional contamination pursuant to the ADEQ-approved Modlff ed ERA, dated February 1, 2013.
We appreciate your prompt review of the attached revised O&M Plan, RID Wellhead Treatment Systems (Revision 4), and are available to meet at your convenience regarding any qu.estions you may have.
Best Regards, Roosevelt Irrigation District
Donovan L Neese
14

EXHIBIT ''4''
AR CAD IS MEMO
To:
Jerry D. Worsham II, Esq. Ridenour Hienton, P.L.L.C. Chase Tower 201 North Central Ave, Suite 3300, Phoenix, Arizona 85004
From:
Quentin R. Moore, P.E. (ARCADIS)
Oate:
October 31, 2014
Subject:
Copies:
Robert A. Mongrain, RG (ARCADIS) ARCADIS Project File
ARCADIS Project No.:
AZOO 1042 .0005
RID Phase 1 Wellhead Treatment System Annual VOC Mass Removal Evaluation
ARCADIS U.S., Inc.
41 o North 44 th Street
Suite 1000
Phoenix
Arizona 85008
Tel 602 438 0883
Fax 602 438 0102
ARCADIS has prepared this technical memorandum in response to your request to evaluate the validity of
the Roosevelt Irrigation District (RID) anticipated total annual volatile organic compound (VOC) mass
removal of up to 1,900 pounds through the operation of the Modified Early Response Action (MERA)
Phase 1 wellhead treatment systems. The locations and general construction of the MERA Phase 1
wellhead treatment systems are detailed in the Modified Early Response Action Work Plan (MERA Work
Plan} for the West Van Buren Area ~VBA) Water Quality Assurance Revolving Fund ~QARF) Site,
prepared by Synergy Environmental, LLC on behalf of the RID (Synergy Environmental, LLC, 2012}. The
locations of the wells are shown on Figure 1. The Phase 1 wellhead treatment systems consist of
groundwater extraction and wellhead treatment using liquid-phase granulated activated carbon (LGAC) at
four RID production wells, including RID-89, RID-92, RID-95 and RID-1 14. (Figures 2-1 through 2-4
identifies RID's Process Flow Diagram and treatment system for each Phase 1 well.) Groundwater
extraction and treatment operations were initiated at RID production well RID-95 in February 2012, and at
all other production wells in May 2012. The plan to utilize four additional groundwater extraction wells in
Phase 2 of the MERA apparently has been abandoned.
Originally, the RID asserted to the Arizona Department of Environmental Quality (ADEQ) in the MERA
Proposal (July 12, 2012) that the MERA would , " ... remediate approximately 3,500 pounds per year of
VOC contamination in the regional groundwater ... " (MERA Proposal Executive Summary p. iii and p.7,
Synergy Environmental, LLC, 2012a} In the MERA Workplan (October 2012), RID changed their position
and asserted that the MERA wells would remediate up to 2,300 pounds per year (MERA Work Plan
g:~~oj\1000\1042ar.iill!Di~andconlldlll1Galffdoorrqi!ai~&riddocoolenbUtyr8$1)onseacli:>n'lneramascremoval "8rilication'i1d wals co!Urjr1311l 111100Val vdcalon tach merro 20141031.dOc:J
Page:
1/12
ARCA DIS
Executive Summary p. ii). •sased on current voe concentrations in the Phase 1 RID wells, the estimated
total annual voe mass removal during Phase 1 would be up to approximately 1,900 pounds .... Based
on current voe concentrations in the Phase 2 wells, the estimated total annual contaminant voe mass
removal following implementation of Phase 2 would be approximately 440 pounds: (MERA Work Plan
p. 28, 29 and Table 2, Synergy Environmental, LLC 2012b) (Attachment 1).
The purpose of this technical memorandum Is to verify the RID's estimate to ADEQ of 1,900 pounds per year for the total annual VOC mass removal by the MERA Phase 1 wellhead treatment systems. In support of this estimate, AReADIS reviewed ADEQ's website 1 and available operational
data documented in Monthly Progress Reports obtained from the West Valley Groundwater Cleanup
eoalition2 website, and estimated individual production well pumping rates and total voe concentrations
(Montgomery & Associates, 2009; HOR Engineering, Inc. 2010).
Report Summary
According to the Phase 1 wellhead treatment system Monthly Progress Reports, in 2012, 2013 and 2014,
the Phase 1 wellhead treatment systems actually removed only 895 pounds, 767 pounds and 89 pounds
of VOCs, respectively. This is well below the RID's annual projections of 1,900 pounds. If all Phase 1
wellhead treatment systems operated continuously, without downtime, at sustained maximum observed
voe concentrations and at a removal efficiency of 100 percent, the Phase 1 wellhead treatment systems
could remove up to 2, 182 pounds per year of target VOCs annually. However, given that the RID
historically decreases production during the late fall and winter months [November - March} when the
irrigation demand is low and the mass removal efficiency is not likely to exceed 95 percent, the most-likely
maximum annual voe removal rate is 1,446 pounds per year. Therefore, it is apparent that the RID's
projected total annual target voe mass removal of 1 ,900 pounds per year is a significant over estimate.
The most-likely maximum annual voe removal rate Is approximately 25 percent less than the RID's
anticipated removal rate (1,446/1,900 lbs/year x100%). Additionally, it should be noted that during late
2013 and for nearly all of 2014 (where RID reports are available to describe operations), the RID Phase 1
MERA wells have been operated in bypass mode, such that groundwater bypassed the treatment systems
and was delivered to their canal/conveyance system untreated.
1 http://www.azdeq.gov/environlwaste/sps/wub. html
2 http://www.wvgroundwater.org/project--Oocuments
g:'erlw!~\000\1042 l!Mrmerib'1>rMeved and oonlldenllllf lid complalnl'.adtq & rid docune.U'ealylllSllOf*l llOlon'roera massnlll'OV3 ~\tld wels corUnlnantnlmOl'll \lll1bllon tedl ll'El1» 201.41031.dooll
Page:
2/12
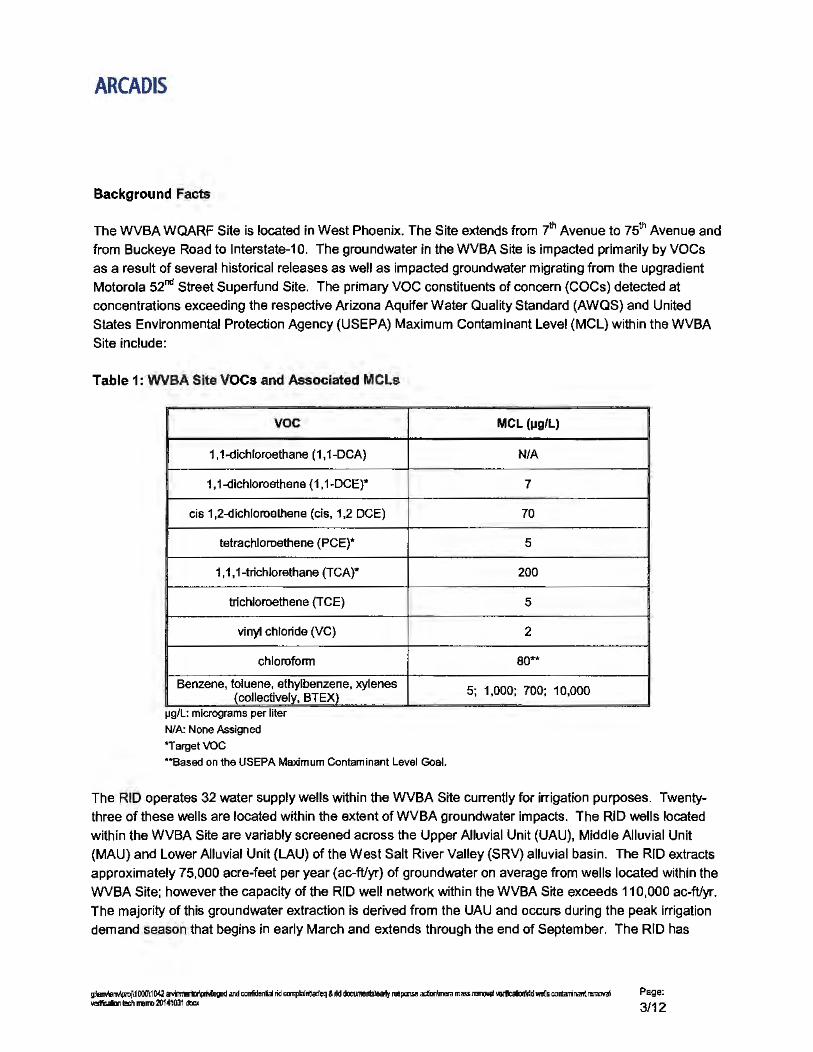
ARCA DIS
Background Facts
The WVBA WQARF Site is located in West Phoenix. The Site extends from 7th Avenue to 75lh Avenue and
from Buckeye Road to lnterstate-10. The groundwater in the WVBA Site is impacted primarily by voes as a result of several historical releases as well as impacted groundwater migrating from the upgradient Motorola 52nd Street Superfund Site. The primary voe constituents of concern (COes) detected at
concentrations exceeding the respective Arizona Aquifer Water Quality Standard (AWQS) and United States Environmental Protection Agency (USEPA) Maximum Contaminant Level (MCL) within the WVBA
Site include:
Table 1: WVBA Site VOCs and Associated MCLs
voe
1, 1-dichloroethane (1, 1-DCA)
1, 1-dlchloroethene (1, 1-DCE)*
cis 1,2-dichloroathene (cis, 1,2 DCE)
tetrachloroethene (PCE)*
1 , 1, 1-trichlorethane (TCA)"
trichloroethene (TCE)
vinyl chloride (VC}
chloroform
Benzene, toluene, ethylbenzene, xylenes (collectively, BTEX)
µg/L: micrograms per hter
NIA: None Assigned
"Target voe ••eased on the l/SEPA Maximum Contaminant Level Goat
MCL (IJgfL)
N/A
7
70
5
200
5
2
so-
5; 1,000; 700; 10,000
The RID operates 32 water supply wells within the WVBA Site currently for irrigation purposes. Twentythree of these wells are located within the extent of WVBA groundwater impacts. The RID wells located
within the WVBA Site are variably screened across the Upper Alluvial Unit (UAU), Middle Alluvial Unit (MAU) and Lower Alluvial Unit (LAU) of the West Salt River Valley (SRV) alluvial basin. The RID extracts approximately 75,000 acre-feet per year (ac-ft/yr) of groundwater on average from wells located within the
WVBA Site; however the capacity of the RID well network within the WVBA Site exceeds 110,000 ac-ft/yr.
The majority of this groundwater extraction is derived from the UAU and occurs during the peak irrigation demand season that begins in early March and extends through the end of September. The RID has
g:lenvlenv°j)l'l)M000\1042~.andconfidenlalridCM¥Jlafn\la<feq&dd~rds\eatyre1ponseactiD111mera mi1S$tlm)Yel1191111c*cl'lldwells contamnantrerraval ~ ~h memo20141031 .docx
Page:
3/12
ARCA DIS
elected to pursue a voluntary early response action (ERA) (Montgomery & Associates, 2010) which has been significantly modified and is commonly referred to as the MERA. Details of the MERA are found in the MERA Proposal (July 2012) and the MERA Work Plan (October 2012).
RIO Wellhead Treatment Systems
The MERA Work Plan outlines the RID's intent to install wellhead treatment systems at eight of RID's production well locations. Currently, the RID has installed wellhead treatment systems at only four locations (Phase 1), including production wells RID-89, RID-92, RID-95 and RID-114. Phase 2 of the MERA consists of Installing wellhead treatment at the remaining four locations: RID-100, RID-106, RID-112 and RID-113. According to the RI D's proposed Draft Feasibility Study (July 2014 ), the concept of implementing the Phase 2 wellhead treatment systems has been abandoned in the MERA and will instead be evaluated as part of the Arizona Department of Environmental Quality's (ADEQ's) review of the merits of the Draft Feasibility Study (see pgs 131, 138 [Synergy Environmental, LLC and Montgomery & Associates, 2014])3
.
The Phase 1 wellhead treatment systems consist of Siemens HP1220 treatment skids, which include two 20,000 pound LGAC vessels per skid connected in series. Each treatment skid is capable of treating up to 1,100 gallons per minute (gpm). Several treatment skids are operated in parallel for those wellhead treatment systems requiring greater than 1, 100 gpm treatment capacity. Table 2 below provides basic information for each Phase 1 wellhead treatment system. Several sources of information provide estimated treatment system flow rates {Table 2). The flow rates reported in the MERA Work Plan are obtained from actual 2012, 2013 and 2014 data. The flow rates reported by Montgomery & Associates (Groundwater Response Action Implementation Plan [Montgomery & Associates, 2009}) and HOR Engineering LLC (Early Response Action Conceptual Design Summary [HOR Engineering Inc., 201 OJ) were estimated before head loss associated with the treatment system components and piping was well understood. Figure 1 provides the location of each Phase 1 RID well and associated treatment system.
3 "RID-100, RID-106, RID-109 and RJD-112: Wellhead treatment at these four (4) impacted water supply wells was authorized by ADEQ in the Modified ERA Work Plan. The wellhead treatment systems were to be installed in Phase 2 of the Modified ERA Work Plan, but now have been incorporated into the FS." (Synergy Environmental, LLC, 2014 p. 131)
g:lenvle~1000\1042avinmeri!Df'¢vile1Jed and oontldl!flflll lld oon>j)fain\ladeq &rid doouments1eat1y fllSIJOllSI doo'm!ra mass<emovlll llricalon'tid welluootarrinant ren'()YSI ~ntecll men.> 20141031.doox
Page:
4/12
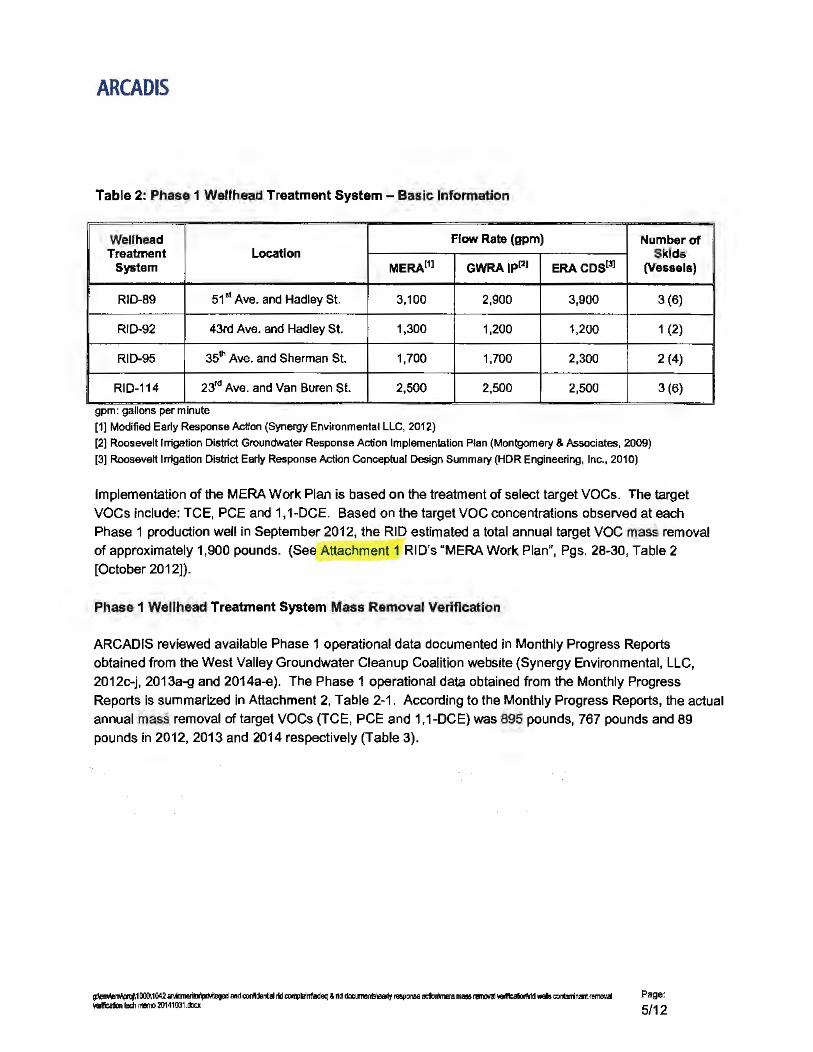
ARCA DIS
Table 2: Phase 1 Wellhead Treatment System - Basic Information
Wellhead Flow Rate (gpm) Number of Treatment Location Skids
System MERA111 GWRAIPE21 ERA CDSC31 (Vessels)
RID-89 51 61 Ave. and Hadley St. 3,100 2,900 3,900 3 (6)
RID-92 43rd Ave. and Hadley St. 1,300 1,200 1,200 1 (2)
RID-95 35u. Ave. and Sherman St. 1,700 1,700 2,300 2 (4)
RID-114 23rd Ave. and Van Buren St. 2,500 2,500 2,500 3 (6)
gpm: gallons per minute
[1] Modified Early Response Action (Synergy Environmental LLC, 2012)
[2] Roosevelt Irrigation District Groundwater Response Action Implementation Plan (Montgomery & Associates, 2009)
[3] Roosevelt Irrigation District Early Response Action Conceptual Design Summary (HOR Engineering, Inc., 2010)
Implementation of the MERA Work Plan is based on the treatment of select target VOCs. The target
VO Cs include: T CE, PCE and 1, 1-DCE. Based on the target VOe concentrations observed at each
Phase 1 production well in September 2012, the RID estimated a total annual target VOC mass removal
of approximately 1,900 pounds. (See Attachment 1 RI D's "MERA Work Plan", Pgs. 28-30, Table 2 [October 20121).
Phase 1 Wellhead Treatment System Mass Removal Verification
ARCADIS reviewed available Phase 1 operational data documented in Monthly Progress Reports
obtained from the West Valley Groundwater Cleanup Coalition website (Synergy Environmental, LLC,
2012c-j, 2013a-g and 2014a-e). The Phase 1 operational data obtained from the Monthly Progress
Reports is summarized In Attachment 2, Table 2-1. According to the Monthly Progress Reports, the actual
annual mass removal of target voes (TCE, PCE and 1, 1-DCE) was 895 pounds, 767 pounds and 89
pounds in 2012, 2013 and 2014 respectively (Table 3).
g:\enV\e~1000\1042dfWvneti~tr1dcomlde1'llllridOOlllllainftadeq&liddoc1.mmts1,e.tyresponseac6on'lneramasstenl0\1111Wrilblioo'fldwekcontlrrinMtrl!ITOVal Wlb&ln tecll flll!m) 20141001 .docx
Page:
5/12
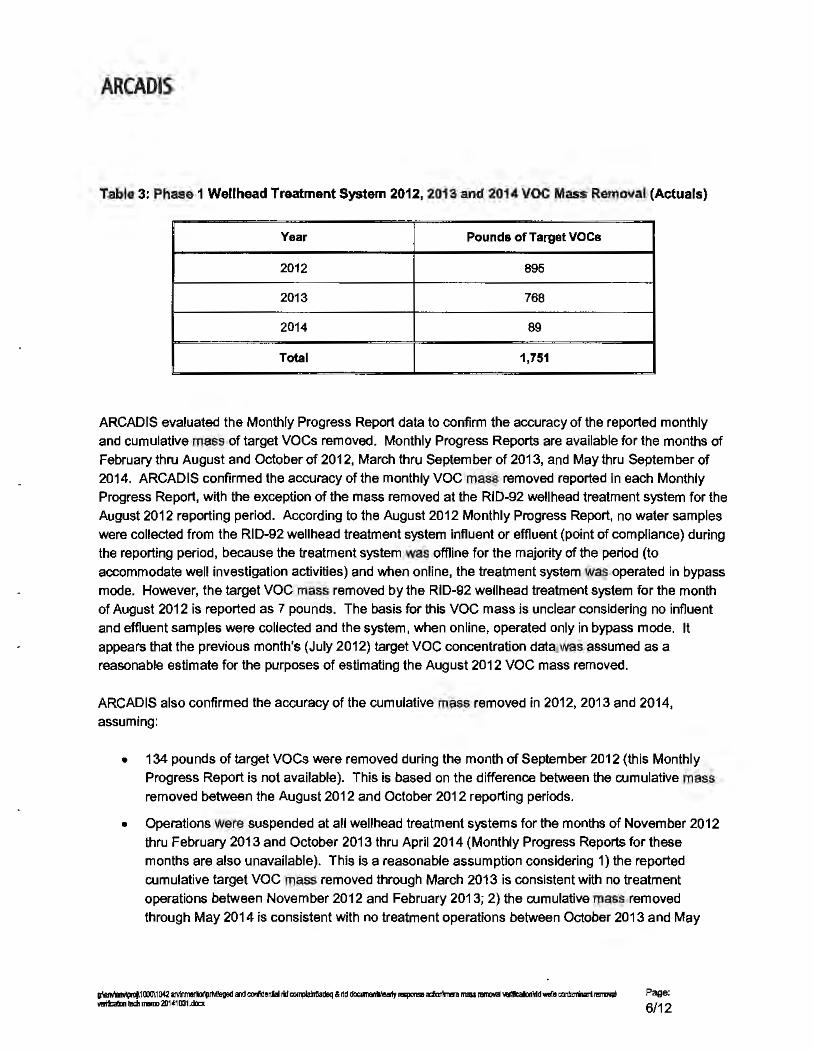
AR CAD IS
Table 3: Phase 1 Wellhead Treatment System 2012, 2013 and 2014 VOC Mass Removal (Actuals)
Year Pounds of Target voes
2012 895
2013 768
2014 89
Total 1,751
AReADIS evaluated the Monthly Progress Report data to confirm the accuracy of the reported monthly and cumulative mass of target voes removed. Monthly Progress Reports are available for the months of February thru August and October of 2012, March thru September of 2013, and May thru September of 2014. AReADIS confirmed the accuracy of the monthly voe mass removed reported in each Monthly
Progress Report, with the exception of the mass removed at the RID-92 wellhead treatment system for the August 2012 reporting period. According to the August 2012 Monthly Progress Report, no water samples were collected from the RID-92 wellhead treatment system influent or effluent (point of compliance) during the reporting period, because the treatment system was offline for the majority of the period (to
accommodate well investigation activities) and when online, the treatment system was operated in bypass mode. However, the target voe mass removed by the RID-92 wellhead treatment system for the month of August 2012 is reported as 7 pounds. The basis for this voe mass is unclear considering no influent
and effluent samples were collected and the system, when online, operated only in bypass mode. It appears that the previous month's (July 2012) target voe concentration data was assumed as a reasonable estimate for the purposes of estimating the August 2012 voe mass removed.
ARCADIS also confirmed the accuracy of the cumulative mass removed in 2012, 2013 and 2014, assuming:
• 134 pounds of target VO Cs were removed during the month of September 2012 (this Monthly Progress Report is not available). This is based on the difference between the cumulative mass
removed between the August 2012 and October 2012 reporting periods.
• Operations were suspended at all wellhead treatment systems for the months of November 2012 thru February 2013 and October 2013 thru April 2014 (Monthly Progress Reports for these
months are also unavailable). This is a reasonable assumption considering 1) the reported cumulative target voe mass removed through March 2013 is consistent with no treatment
operations between November 2012 and February 2013; 2} the cumulative mass removed through May 2014 is consistent with no treatment operations between October 2013 and May
~1000\1042~Mdccnidenialrid~Md~lutJrmponseootion'm!ramassrernovall<!lllcalon'lldw'11scxmtanila11ll!ITllYal Yl!rifcalicll ll!dl nwno 20141031.docx
Page;
6/12
AR CAD IS
2014; and 3) that the irrigation demand season typically begins in early March and extends
through the end of September.
• Use of the treatment systems was suspended in May 2014 and the wel Is were operated in bypass
mode through the majority of the 2014 pumping season. The Phase 1 treatment systems will not
likely be restarted until March 2015 (Roosevelt Irrigation District, 2014).
AReADIS' verified the mass of each target voe removed (TCE, PCE and 1, 1-DeE}, total target voe mass removed (sum of the TCE, PCE and 1, 1-DeE mass removed), and cumulative target voe mass
removed. The results of these calculates are provided in Attachment 2, Table 2-1 under the columns titled
"MASS REMOVED-VERIFICATION". The difference, expressed as a percentage, between the reported
voe mass removed and AReADIS' calculations is provided in the final column of Table 2-1. The net
percent d ifference for 2012 and 2013 is less than 0.50 percent, which could be entirely attributed to
rounding; therefore ARCADIS has determined that the actual quantity of target voe mass removed
reported by the RID is accurate.
Phase 1 Wellhead Treatment System Potentiar Maximum VOC Mass Removal
Table 4 below summarizes the potential maximum annual target VOC mass removal for the Phase 1
wellhead treatment systems. The maximum potential mass removal is based on each wellhead treatment
system operating at:
• maximum flow rate, continuously 365 days per year;
• sustained target voe concentrations, represented by the maximum of each target voe
exceeding the respective USEPA MCL observed at each respective location between 2012 and
2014;and
• 100 percent mass removal efficiency (VOCs are reduced to concentrations below the detection
limit).
This annual target VOC mass removal represents the wbest-case· scenario. T he maximum flow rate for
each wellhead treatment system is taken as the lesser of the actual maximum flow rate observed between
2012 and 2013, or the wellhead treatment system capacity (based on 1, 100 gpm per treatment skid). The
reported maximum flow rate is not a representative flow rate because these flow rates were estimated
before head loss associated with the treatment system components and piping was well understood. The
USEPA MCL is 5 µg/L for TCE and PCE and 7 µg/L for 1, 1-DeE.
g:lim~ro/11000\1042~nmeri~111dconlldenootrldC001Jlaint\adeq&liddocwnenls\81ftyrespcnseldonmranmsllml\r.llvetilicatt'onl/ldwelsccotarrinantrllll'IOV3 verificaljon !l!d1 IT8TI) 20141031 .docx
Page:
7/12
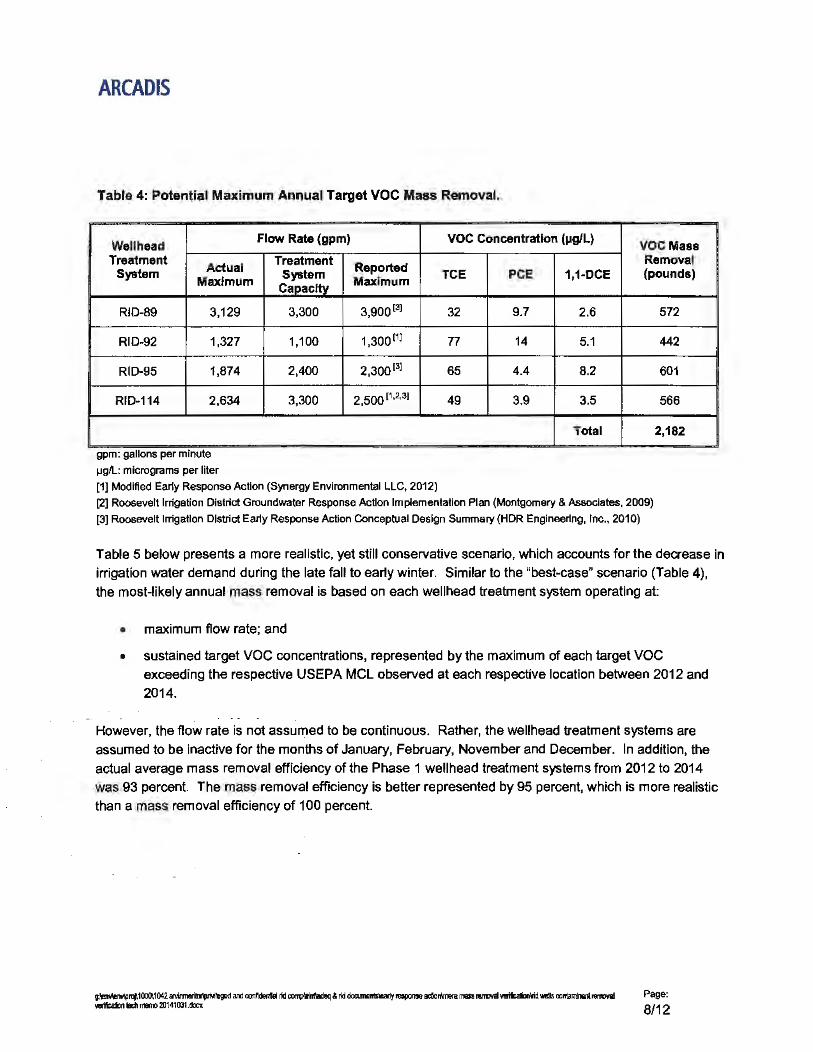
AR CAD IS
Table 4: Potential Maximum Annual Target VOC Mass Removal.
Wellhead Treatment
Actual System Maximum
RI0-89 3,129
RI0-92 1,327
RID-95 1,874
RID-1 14 2,634
gpm: gallons per minute
µg/L: micrograms per liter
Flow Rate (gpm)
Treatment Reported
System Capacftv
Maximum
3,300 3,9ool3l
1,100 1,300 111
2,400 2,300 131
3,300 2,500 11.2·31
[1) Modified Eariy Response Action (Synergy Environmental LLC, 2012)
VOC Concentration (µg{L)
TCE PCE 1,1-0CE
32 9.7 2.6
77 14 5.1
65 4.4 8.2
49 3.9 3.5
Total
VOCMass Removal {pounds)
572
442
601
566
2,182
[2] Roosevelt Irrigation District Groundwater Response Action Implementation Plan (Montgomery & Associates, 2009)
[3] Roosevelt Irrigation District Earty Response Action Conceptual Design Summary(HDR Engineering, Inc., 2010)
Table 5 below presents a more realistic, yet still conservative scenario, which accounts for the decrease in irrigation water demand during the late fall to early winter. Similar to the "best-case" scenario (Table 4),
the most-likely annual mass removal is based on each wellhead treatment system operating at:
• maximum flow rate; and
• sustained target voe concentrations, represented by the maximum of each target voe exceeding the respective USEPA Mel observed at each respective location between 2012 and
2014.
However, the flow rate is not assumed to be continuous. Rather, the wellhead treatment systems are
assumed to be inactive for the months of January, February, November and December. In addition, the
actual average mass removal efficiency of the Phase 1 wellhead treatment systems from 2012 to 2014 was 93 percent. The mass removal efficiency is better represented by 95 percent, which is more realistic than a mass removal efficiency of 100 percent.
g:~......,lll/l1000l1042aWlmeri1D1'¢1"1eged and oonlldeflllii ild COO'Qllai~eq & rid doctllnenislealy ~rise aciion'roera mass l'8l1lOYal veriicaDl'<id wells c:ontlmlfl1111"'1lOVlll Wl1ficcllion ladl memo 20141031.docx
Page:
8/12
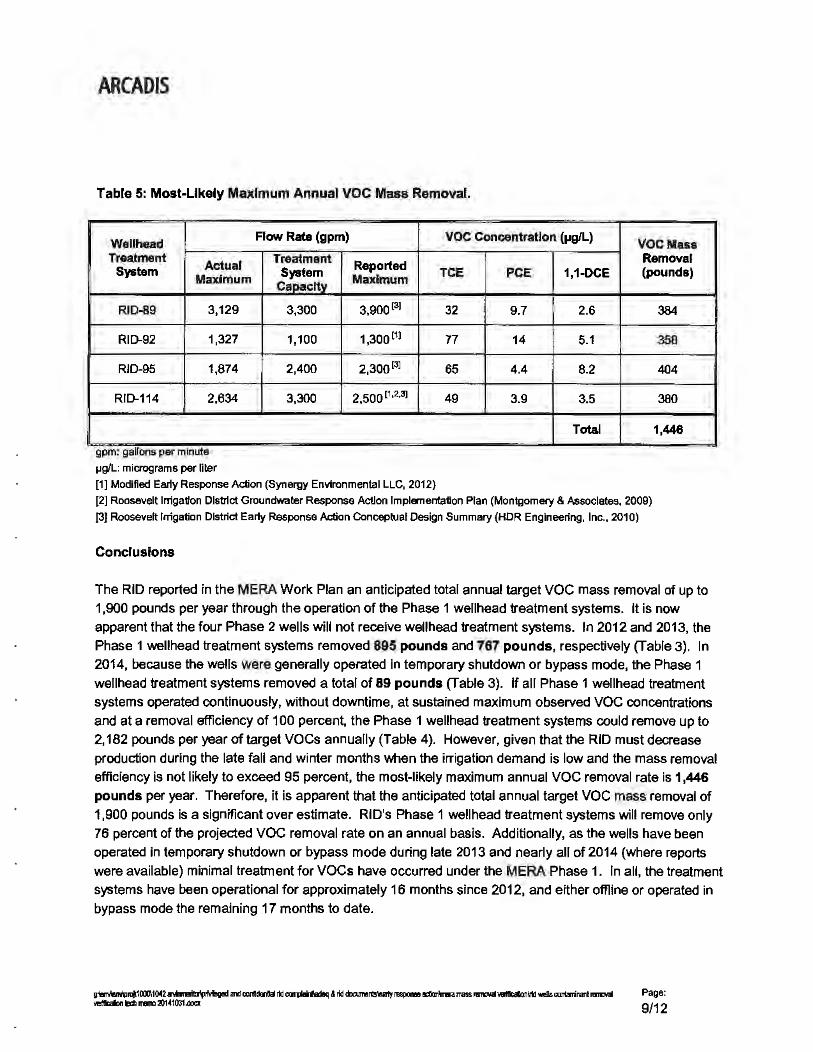
ARCADIS
Table 5: Most-Ukely Maximum Annual VOC Mass Removal.
Wellhead Treatment
Actual System Maximum
RID-89 3,129
RID-92 1,327
RID-95 1,874
RID-114 2,634
gpm: gallons per minute
~g/L: micrograms per liter
Flow Rate (gpm)
Treatment Reported System Cai>aclty Maximum
3,300 3,900(3)
1,100 1,300111
2,400 2,300 131
3,300 2,500 ci .2.3]
[1] Modified Early Response Action (Synergy Environmental LLC, 2012)
VOC Concentration (pg/L)
TCE PCE 1,1-DCE
32 9.7 2.6
77 14 5.1
65 4.4 8.2
49 3.9 3.5
Total
VOCMass Removal (pounds)
384
358
404
380
1,446
[2] Roosevelt Irrigation District Groundwater Response Action Implementation Plan (Montgomeiy & Associates, 2009)
[3] Roosevelt Irrigation District Earty Response Action Conceptual Design Summaiy (HOR Engineering, Inc., 2010)
Conclusions
The RID reported in the MERA Work Plan an anticipated total annual target voe mass removal of up to 1,900 pounds per year through the operation of the Phase 1 wellhead treatment systems. It is now
apparent that the four Phase 2 wells will not receive wellhead treatment systems. In 2012 and 2013, the Phase 1 wellhead treatment systems removed 895 pounds and 767 pounds, respectively (Table 3). In 2014, because the wells were generally operated in temporary shutdown or bypass mode, the Phase 1
wellhead treatment systems removed a total of 89 pounds (Table 3). If all Phase 1 wellhead treatment systems operated continuously, without downtime, at sustained maximum observed voe concentrations and at a removal efficiency of 100 percent. the Phase 1 wellhead treatment systems could remove up to
2, 182 pounds per year of target voes annually (Table 4). However, given that the RID must decrease production during the late fall and winter months when the irrigation demand is low and the mass removal efficiency is not likely to exceed 95 percent, the most-likely maximum annual voe removal rate is 1,446
pounds per year. Therefore, it is apparent that the anticipated total annual target voe mass removal of 1,900 pounds is a significant over estimate. RID's Phase 1 wellhead treatment systems will remove only
76 percent of the projected voe removal rate on an annual basis. Additionally, as the wells have been operated in temporary shutdown or bypass mode during late 2013 and nearly all of 2014 (where reports
were available) minimal treatment for voes have occurred under the MERA Phase 1. In all, the treatment systems have been operational for approximately 16 months since 2012, and either offiine or operated in bypass mode the remaining 17 months to date.
g~rof.100l\1042~rMlegedandoonlldenlallld~&riddocumnblellrlympcneeactionmnm=nmiv;!l~~...-COl1t<Wlinantmmova1 ~tidl- 20141001.00Q
Page:
9/12
ARCA DIS
References
HOR Engineering, Inc., 2010. RID Groundwater Remediation Early Response Action Conceptual Design
Summary Technical Memo. Prepared for Montgomery and Associates, Inc. February 2.
Montgomery and Associates, 2009. Draft Roosevelt Irrigation District Groundwater Response Action
Implementation Plan, West Van Buren Water Quality Assurance Revolving Fund Site. September
25.
Montgomery and Associates, 2010. Roosevelt Irrigation District Groundwater Response Action
Implementation Plan, West Van Buren Water Quality Assurance Revolving Fund Site. February 3.
Roosevelt Irrigation District, 2014. Response to Comments: Review of Operation and Maintenance Plan
Roosevelt Irrigation District Wellhead Treatment Systems, West Van Buren WQARF Registry Site,
Phoenix, Arizona. October 20.
Synergy Environmental, LLC, 2012a. Modified Early Response Action Proposal, for the West Van Buren
Water Quality Assurance Revolving Fund Site, Phoenix, Arizona. Submitted to the Arizona
Department of Environmental Quality on behalf of Roosevelt Irrigation District. July 17.
Synergy Environmental, LLC, 2012b. Modified Earty Response Action Work Plan, West Van Buren
WQARF Registry Site, Phoenix, Arizona. Prepared for Arizona Department of Environmental
Quality on behalf of Roosevelt Irrigation District. October.
Synergy Environmental, LLC, 2012c. February 2012 Monthly Progress Report - RID·95 Wellhead Pilot
Treatment Systems. March 19.
Synergy Environmental, LLC, 2012d. March 2012 Monthly Progress Report - RI D-95 Well head Pilot
Treatment Systems. April 10.
Synergy Environmental, LLC, 2012e. April 2012 Monthly Progress Report- RID-95 Wellhead Pilot
Treatment Systems. May 14.
Synergy Environmental, LLC, 2012f. May 2012 Monthly Progress Report- RID-95 Wellhead Pilot
Treatment Systems. June 14.
Synergy Environmental , LLC, 2012g. June 2012 Monthly Progress Report- RID-95 Wellhead Pilot
Treatment Systems. July 14.
pii~ro~1000\1042~rt.tevedand oontldenlalrldOOIJl)(afnl\8deq&riddoolrnen!s\emyresponsedon'lllerllmassl'lmMllW!lilicdlon'ffd wellscootafrinantRm>Val 'lelflo8loo lech ll1llO¥) 20141001.docx
Page:
10/12
ARCADIS
Synergy Environmental, LLC, 2012h. July 2012 Monthly Progress Report- RID-95 Wellhead Pilot
Treatment Systems. August 14.
Synergy Environmental, LLC, 2012i. August 2012 Monthly Progress Report- RID-95 Wellhead Pilot
Treatment Systems. May 14.
Synergy Environmental, LLC, 2012j. October 2012 Monthly Progress Report- RID-95 Wellhead Pilot
Treatment Systems. November 13.
Synergy Environmental, LLC, 2013a. March 2013 Monthly Progress Report- RID Wellhead Treatment Systems. April 15.
Synergy Environmental, LLC, 2013b. Apr~ 2013 Monthly Progress Report- RID Wellhead Treatment Systems. May 8.
Synergy Environmental, LLC, 2013c. May 2013 Monthly Progress Report- RID Wellhead Treatment Systems. June 12.
Synergy Environmental , LLC, 2013d. June 2013 Monthly Progress Report - RID Wellhead Treatment Systems. July 11.
Synergy Environmental, LLC, 2013e. July 2013 Monthly Progress Report- RID Wellhead Treatment Systems. August 12.
Synergy Environmental, LLC, 2013f. August 2013 Monthly Progress Report- RID Wellhead Treatment Systems. September 12.
Synergy Environmental, LLC, 2013g. September 2013 Monthly Progress Report - RID Wellhead
Treatment Systems. October 7.
Synergy Environmental, LLC, 2014a. May 2014 Monthly Progress Report- RID Wellhead Treatment
Systems. June 17.
Synergy Environmental, LLC, 2014b. June 2014 Monthly Progress Report- RID Wellhead Treatment Systems. July 18
Synergy Environmental, LLC, 2014c. July 2014 Monthly Progress Report- RID Wellhead Treatment Systems. August 11 .
~llt!~1000.1042 ;r;illlllfl~ed and ootllldenGal dd CC1n1>Painf.adeq & rid dcculrenls'ally f8lllClllS8actonmlramaul!lmOllill~"1d Ml.!co~nanl~ Y8tlG8lon ladl memo 20141031Jlocx
Page:
11/12
ARCADIS
Synergy Environmental, LLC, 2014d. August 2014 Monthly Progress Report - RID Wellhead Treatment
Systems. September 15.
Synergy Environmental, LLC, 2014e. September 2014 Monthly Progress Report- RID Wellhead
Treatment Systems. October 15.
Synergy Environmental, LLC, and Montgomery & Associates 2014. Draft Feasibility Study Report, West
Van Buren WQARF Site, Phoenix, Arizona. Prepared for Arizona Department of Environmental
Quality on behalf of Roosevelt Irrigation District. July 11.
g:'em.'1el>~M000\1042<!1'1l~.id oorojjdrialridoorrcilaln!\adeq&riddoclllleotslelw1yf9Sll0nsaa:tioo'roeramassr8T'Ol'alverificab'onllfdl!ellscon1alrdnantrerrovaf vtflicaliootach memo 20141031.4ocx
Page:
12112
~ ARCADIS
Figures
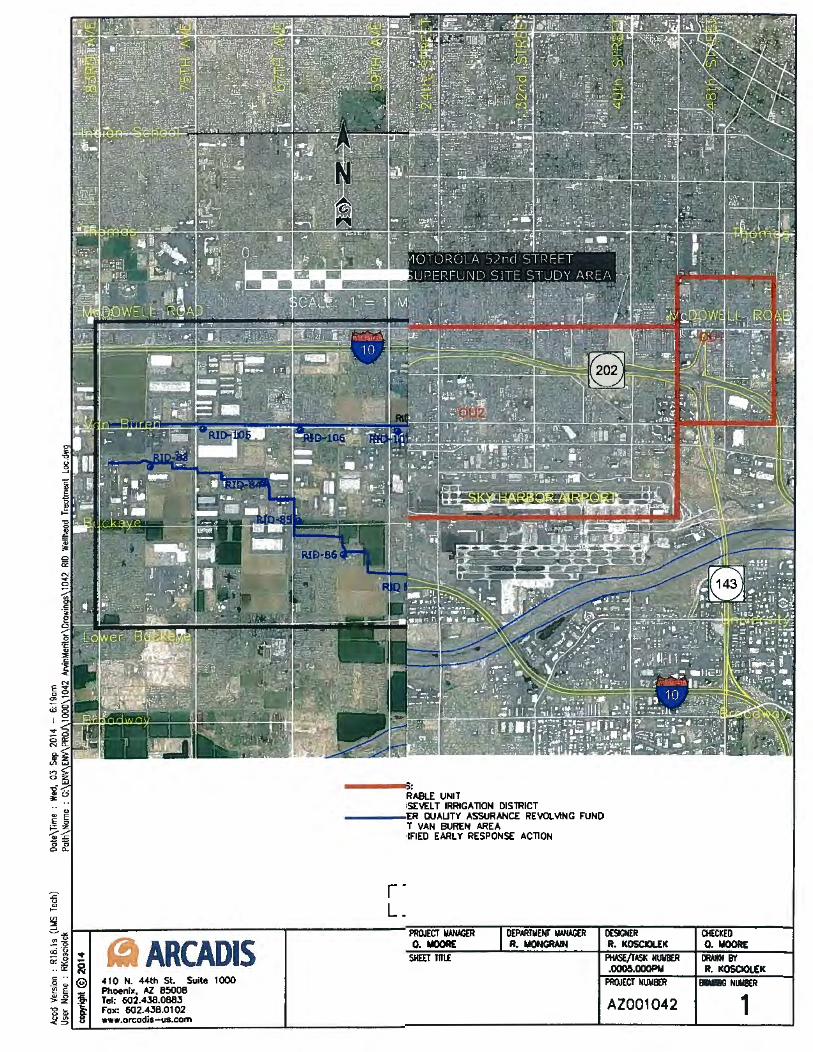
RABLE UNIT >SEVEL T IRRIGATION DISTRICT
----:ER QUALITY ASSURANCE REVC\.IANG FUND T VAN BUREN AREA •IFIED EARLY RESPONSE ACTION
DEPARTMENI' ~ A. MONGRAIN
OE9CNER CHECKED R. KOSCIOl.EIC O. MOORE
PHASE/IASK NIMlR ORAWH BY .ooo&.OOOPM R. ICOSCIOl£K
PRWCCT N\JMBER ~NLl&R
AZ001042 1
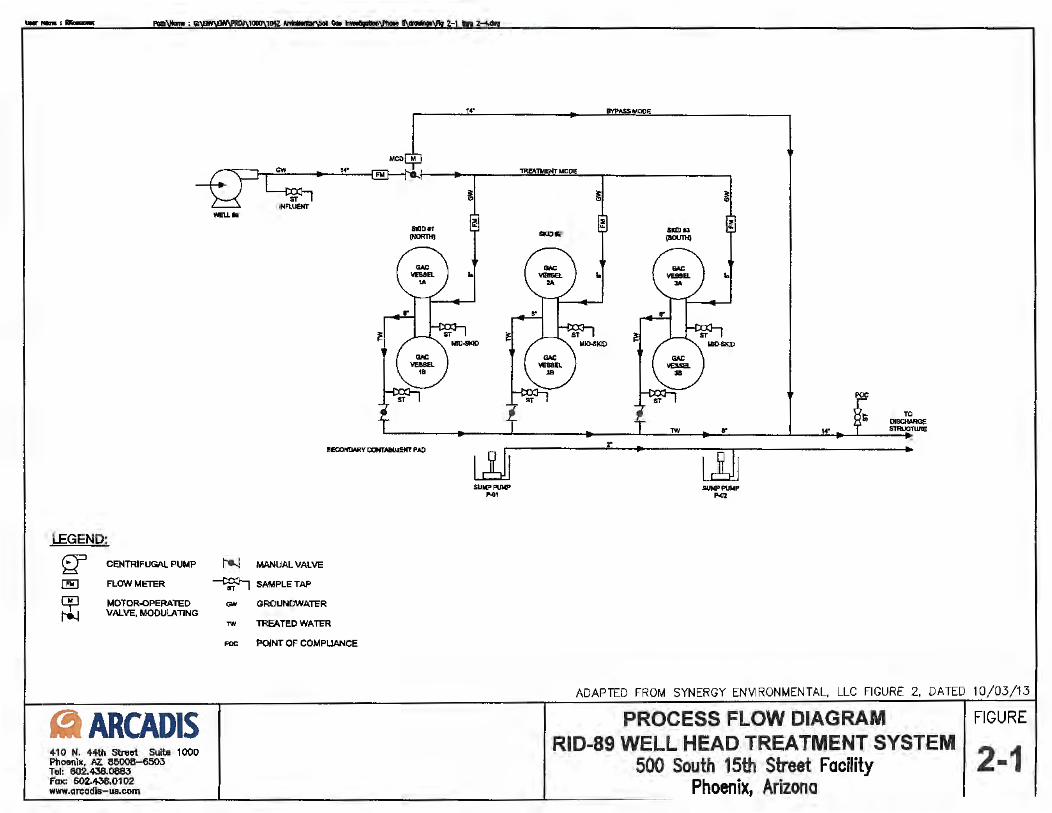
__ ,.._
l'IEU. ..
cw
ST 1Jffi.U81T
Clo
...
SICIDll (l'IOR1M)
Sl!CO!IDAllV CONTMN!.a!TPAD
LEGEND:
<;;J:3 CENTRIFUGAL PUMP ~ MANUAL VALVE
CTEJ FLOW METER ~ SAMPLE TAP
~ t-...i
MOTOR.OPERATED VALVE, MODULATING
fl ARCADIS +10 N. 44th Stniet Suite 1000 Phoenix. Kl. "5008-6503 Tel: 602.438.0883 fax: 602.4-38.0102 www.areocf..-ua.com
t1>N GROUNDWATER
iw TREATED WATER
jO()C POINT OF COMPLIANCE
.. llVl'..ss ~-E
~l)IDl'rMOJ)tt
i1
! Sl(IDR
lol ..
ama (80U1l4
1W
lol
,. M"
TO IMllCIWIClf: STRPJC1UllE -+
LJJJ r ~ LD . SUIPPUMP SUMl'PUM~
N>• P.Q2
ADAPTED FROM SYNERGY ENVIRONMEN TAL. LLC FIGURE 2. DATED 10/03/13
PROCESS FLOW DIAGRAM I FIGURE
RID-89 WELL HEAD TREATMENT SYSTEM I 2 1 500 South 15th Street Facility -
Phoenix, Arizona
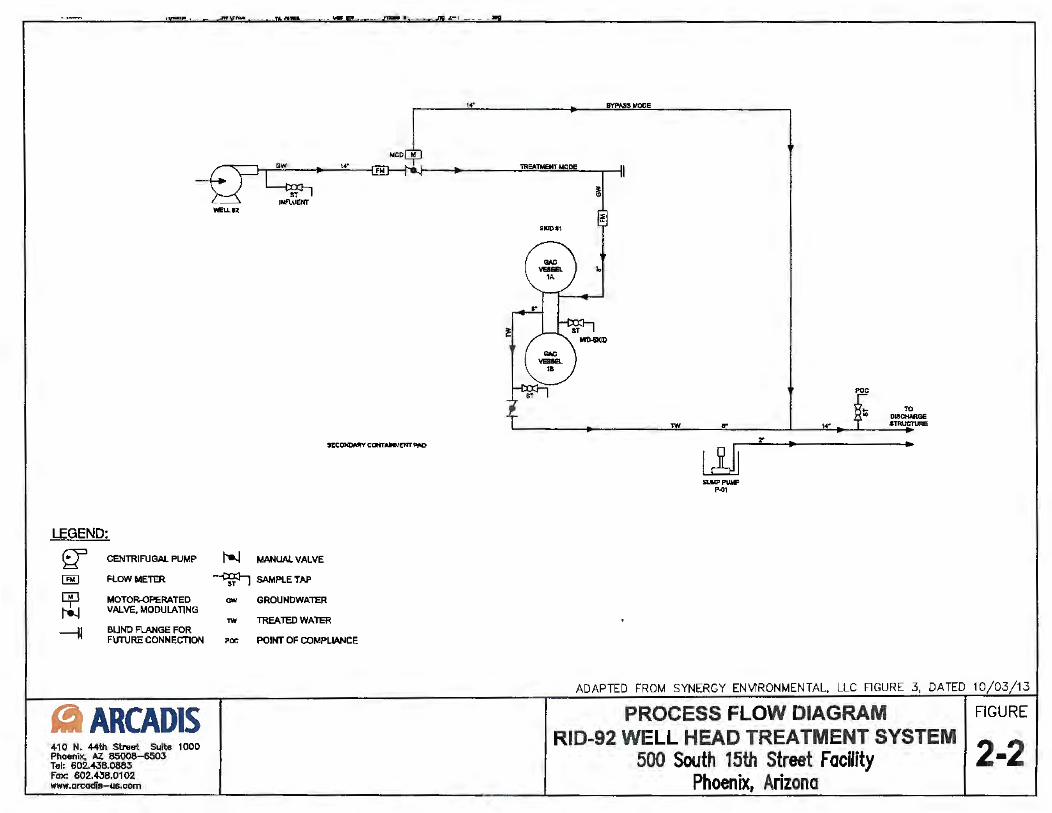
LEGEND:
rfJ: CENTRIFUGAL PUMP
@ FLOW METER
~ MOTOR-OPERATED VALVE, MODULATING
-41 BUND FLANGE FOR FUT\JRE CONNECTION
f.t ARCADIS 4-1 0 N. 4-4th Stnlet Suite 1 000 Phoenix. l1'Z. 85008-6503 Tel: 602.-438.0SSJ fQX: 602.~B.0102 www.aroodls- us.com
WEU.9%
i-..J
aw
ST lllfl.UENT
MANUAL. VALVE
1•·
-~c:a!T .... .ia<T,.,..,
-cg:r, SAMPlE TAP
ew GROUNDWATER
TW TREATED WATER
POC POINT OF COMPLIANCE
1C" E
TIIOATMEMT~M
~
~ SKJl)tl
lo
1W r
TO 018CHAAGE ~ __....,
l!Jjr ~ • SUMl'PVMP
Ml
ADAPTED FROM SYNERGY ENVIRONMENTAL. LLC FlGURE 3, DA TED 10 /03 /13
PROCESS FLOW DIAGRAM I FIGURE
RID-92 WELL HEAD TREATMENT SYSTEM J 2 2 500 South 15th Street Facility • Phoenix, Arizona
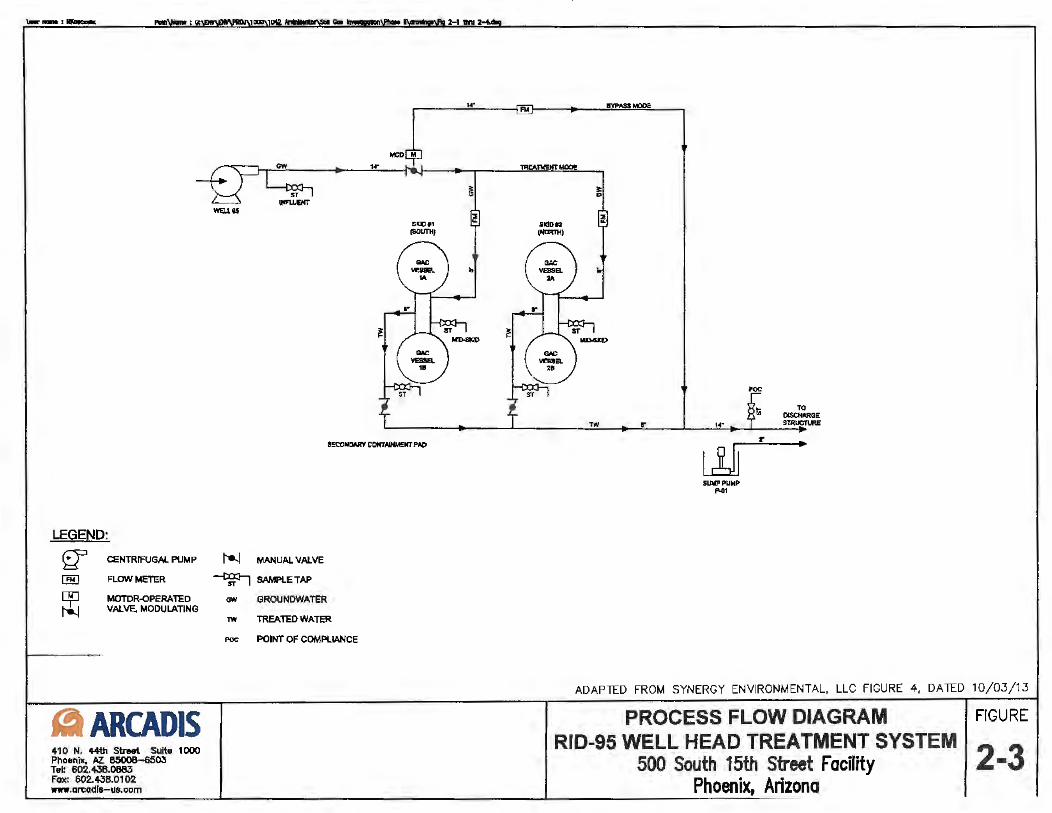
... ..... ,~ Qot 2-1.,.
-~ - ~ aw
sr · I ~I ~
J SlllDf1
WEI.I.ts
(SDLml/
S~COKTMIM~Kl'PAO
LEGEND:
~ CENTRIFUGAi. PUMP ~ MANUAL VALVE
l!EJ FLOW METER -tg:J-i SAMPlE TAP
q:i 1'*-1
MOTOR-OPEAATEO VN.VE. MODULATING
fl ARCADIS 410 N. 4-4th Street Suite 1000 Phoenix, R. 85008-6503 Tel: 602.436.0683 fQ)(: 602.435.0102 www.artiadls-us.com
GJN GROUNDWATER
TW TREATEDWATER
POc POINT OF COMPLIANCE
8ICIDll2 (NOJITH)
~
..
~I
la!
I " I
~MODE
S" 14•
TO DISCIWIOE S~UC'IUIE
~ SUMI" PUMP
p.ot
ADAPTED FROM SYNERGY ENVIRONMENTAL, LLC FIGURE 4, DATED 10/03/13
PROCESS FLOW DIAGRAM I FIGURE
RID-95 WELL HEAD TREATMENT SYSTEM I 2 3 500 South 15th Street Facility -
Phoenix, Arizona
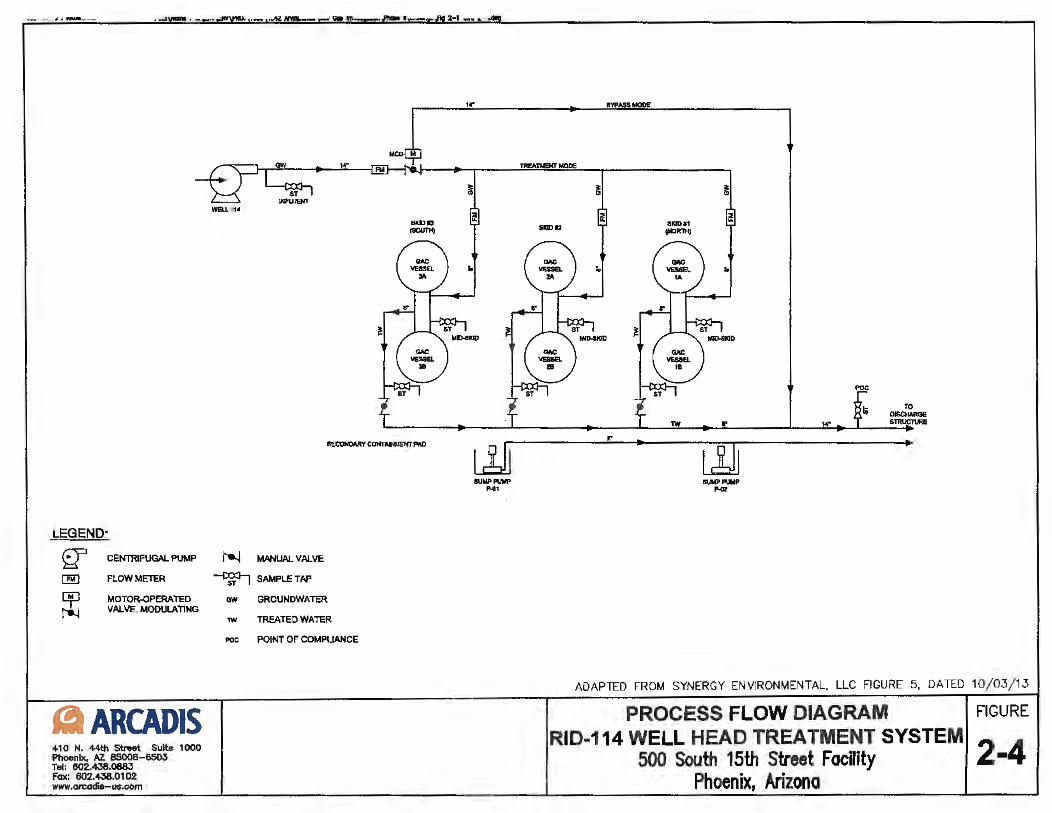
- ··.-..I. • ......,.,.__
LEGEND:
fr CENTRIFUGAL PUMP
[!El FLOW METER
~ MOTOR-OPERATED
l'9..l VALVE, MODULATING
fi ARCADIS 4-10 N. 4-4th ~et Suite 1000 Phoenix, AZ 85008-6503 Tel: 502.438.0883 Fax: 602.438.0102 w-.orcadie-w.com
~ ,,
<Ill_ .. , . ~ 1_,~ ~--- __t-...!.l ~
ar · 1 IHFWDIT
WQ.L t1•
llKlltrS (90lmf)
~~PAD
1-...i MANUAL VALVE
-cg:r-, SAMPLE TAP
aN GROUNDWATER
'IW TREATED WATER
POC POINT OF COMPLIANCE
14'" l'll'l\SS~
~.I TREl<'IMENT MODE
~I i
1 1 51111)112
Q Sl<ll>•1 jNOlml)
r~ I
~I
1a
lo
14'
TO ~ STRIJC'IUU: -lJJj r • l!Jj •
SU\IP l'IN.P SIJY' PUN.I' "41 P«
ADAPTED FROM SYNERGY ENVIRONMENTAL, LLC FIGURE 5, DATED 10/ 03/1 3
PROCESS FLOW DIAGRAM I FIGURE
RID-114 WELL HEAD TREATMENT SYSTEM' 2 4 500 South 15th Street Facility • · Phoenix, Arizona
fa ARCADIS
Attachment 1
f 1
MODIFIED EARLY RESPONSE ACTION
WORK PLAN
Prepared by:
On Behalf of:
Prepared fon
Synergy Environmental, LLC
Roosevelt Irrigation District
CCIEOVIE ; OCT 2 2 2012 [
Arizona Department of Environmental Quality
r)
((~~YNERGY )'' ERVIROMMl?NTU. LLC
(}
MODIJlllD !ARLY R.BSPONSIACTlON WORK PLAN WEST VAN BURIN AREA WQ,ARFRBGISTJlY SIT!
already present at concentrations below MCLs, to pass through the LGAC vessels wUI result in a significant reduction In O&M costs while achieving MCLs for all voes. This approach wlll enable much longer LGAC bed life compared to GAC replacement at the first detection of these demtnrmrs voes In the treatment system effluent.
Table 2 has been revised to Include mass removal estimates that Include only target voes. The VOC concentrations In Table 2 have also been updated to include the latest ADEO. sampling results and the reduced flow rates due to treatment system head losses.
The Modffled ERA Work Plan will be implemented In a two-phase approach as described in the following sections.
4.3.1 Phase 1
Phase 1 of the Modified ERA Work Plan consists of lnstallatlon and operation of the four wellhead treatment systems Included In the RID-95 Wellhead Ptlot Treatment System Proposal (Synergy, 2011c). These four wells are among the most highly contaminated wells, and treatment of these wells has resulted In restoring the quallty of the water supply from these wells to concentrations protective of all RID current and reasonably foreseeable end uses. One of these wells, RID-114, Is located at the eastern end of the Salt canal at 23n1 Avenue and West Van Buren Street (Aaure 14). The remaining three wells, the #southern.tier wells" (RI0-89, RID-92 and RID-95), are all located approximately % mUe south of the Saft canal that runs parallel to West Van Buren Street along the southern alignment. RID· 89, ·92 and ·95 are located on s1•, 43rd and 35th Avenues, respectively.
Phase 1 design and construction has been completed and wellhead treatment at all four wells 1s currently underway. The most recent lnformatlon regarding volumes of water treated and voe mass removed from these Phase 1 wells is available In the August 2012 Monthly Progress Report - Rf ~95 Wellhead Pilot Treatment Systems (Synergy, 2012a).
Based on current voe concentrations fn the Phase 1 RID wells, the estimated total annual voe mass removal durtng Phase 1 would be up to approximately 1,900 pounds, which would be more than the total pounds of voes removed In FY2011 at all other WQARF sites. (Table 2). System performance monitoring is being conducted to assess well operations and treatment effectiveness. The treated water from Phase 1 wlll be used for Its highest beneficial use, which In addition to lrrlgatf on could include Industrial supp Iv and/or potable supply, In the reasonably foreseeable future.
Production capacity of these four wells decreased as a result of the addltlonal head losses through the treatment systems. Reductions In pump output have been observed fn each well with average losses of approximately 10%. Well RID·92 has the highest production
28
)
((~~YNERGY J ' EimRoRMIWl'AL. LLC
0
MODIFIJID BARLYRl!.sPOHSBAC'nON WORK PLAN Wm' VAN BUUN ARIA WQARP RIGinRY Sm
capacity loss of approximately 18%. RIO Intends to recover this lost capacity at each of these wells as part of this ERA through well equipment replacement and Installation of an additional treatment skid at RID-92. Additional engineering assessment 1s needed to determ lne the most a pproprtate means of restoring the lost water production capacity that resulted frQm the wellhead treatment, and this assessment wlll occur as part of the Modffled ERA Work Plan.
4.3.2 Phase 2
Phase 2 of the Modified ERA Work Plan consists of equipping four additional RID wells with high voe concentrations with wellhead treatment. These additional wells (anticipated as RID-100, RI0-106, Rt0-112, and RID-113) will be equipped with wellhead treatment systems slmllar to those constructed at the pilot treatment system sites, as fllustrated In Fl1Ure 14. The objective ls the restoration of the quality of the water supply from these addltlonal contaminated RID wells to concentrations protective of all RID current and reasonably foreseeable end uses. Three of the Phase 2 wells are located a Ions the Salt Canal that runs parallel to West Van Buren Street along the southern alignment. RID-106, -112 and -113 are located just east of 6i", at 32nd and Just east of 28th Avenues, respectlvefy. The remaining Phase 2 well, RtD-100, Is an additional southern-tier well located at 27tti Avenue approximately% mile south of Van Buren Street.
Phase 2 wellhead treatment systems Installation Is antldpated to begin In late 2013, upon avallablllty of project funds. These Installations will be designed consistent with the Phase 1 treatment systems as detailed In the RI0-95 Wellhead Pilot Treatment System Proposal, dated August 18, 2011, whose Implementation was agreed to by ADEQ by letter dated September 2, 2011.
Phase 2 lmplementatlon may require access to, or acquisition of, addlttonal land for siting of wellhead treatment units at the targeted RID well sftes. Information obtained during Phase 2 planning and destan concerning land availability, site access, and well and water quality conditions will dictate final decisions concerning treatment system fnstallatlon and/or mav necessitate alternative siting for wellhead treatment, particularly associated with RIO wells on the Salt Canal.
Based on current voe concentrations In the Phase 2 wells, the estimated total annual contaminant voe mass removal following Implementation of Phase 2 would be approximately 440 pounds {Table 2). The treated water from Phase 2 would be used for Its highest beneficial use, which In addition to Irrigation could include Industrial supply and/or potable supply In the reasonably foreseeable future.
29
((~SYNERGY , , EltYUlONMllllTAS.. LLC MODIFIED BARLY RBSPONSJI AcnoN WORK PLAN
warr VAN BUREN ARIA WQ,ARF RBCJSl'RY SIT!
The total annual volume of water pumped during the ERA would be nominally equivalent to the current annual volume pumped by RID from this area and future groundwater levels will be unaffected by the ERA.
As c:llscussed ln Phase 1, the production capacity of these Phase 2 wells wlll also be reduced due to head losses through the treatment systems. RID Intends to recover this lost capacity at each well as part of this ERA and Installation of an addlttonal treatment skid at RI0.106.
30
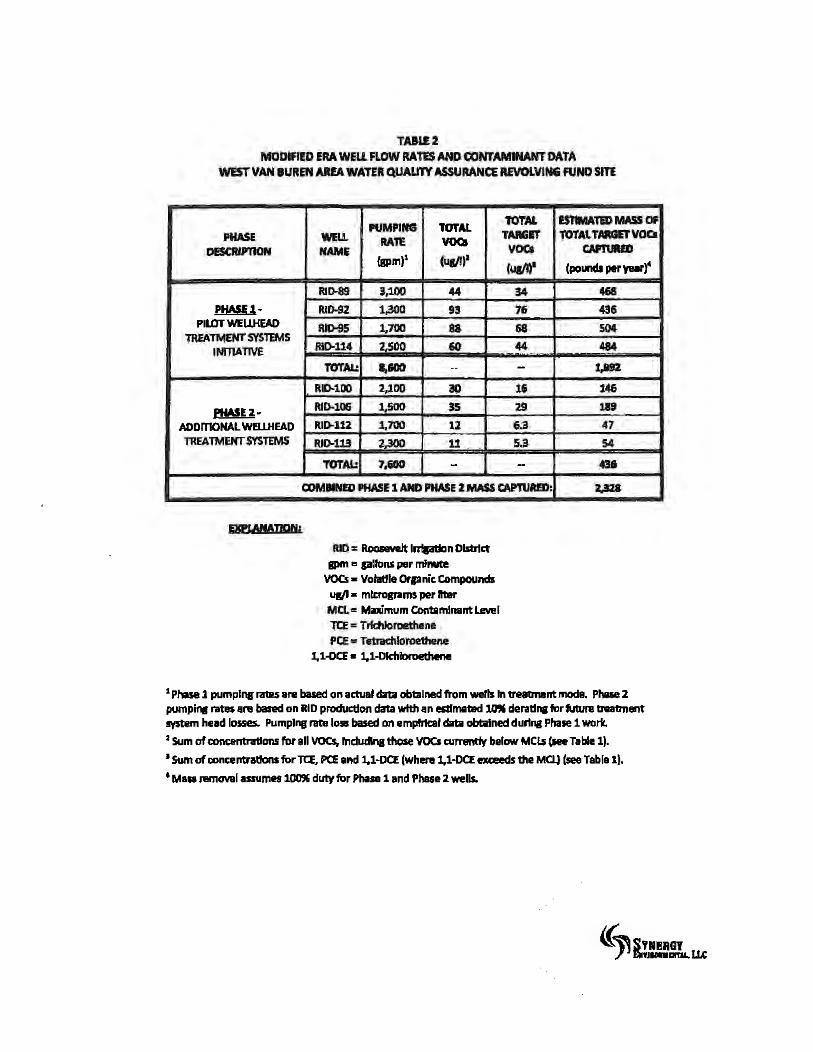
TAILE2 MODIFIED ERA WELL FLOW RATES AND CONTAMINANT DATA
WEST VAN IUREN AREA WATER QUALITY ASSURANCE RfVOl.VING FUND sm
PHASE DESCRIPnON
PHA5E1-PILOT WELLHEAD
TREATMENT SYS'TtMS INITIATIVE
PftASE2w AOOmoNAL WEl.l.HfAD TREATMENT SYSTEMS
PUMPING lOTAL TOTAL WEU. RA1E VOCI TAIGIT NAME voes
(lpm)i Cu1m1 (utll)'
RID-89 3,100 44 34
RID-92 1,300 93 76
RI0-95 1,700 88 68
R10-114 2,500 60 44 -TM.AL: 11,&GO -- -
RI0-100 2,100 34) 16 RID-106 1,500 35 29 IUD-112 1,700 12 6.3
R•D-113 2,300 11 . . S.3
TOTAL: 7,&00 - -CX>MllNB> PHASE 1 ANO PHASE 2 MASS CAPTURED:
RID s Roosevelt l~n District m>m • plfons per mJnute
VOCs • Volat!le Orpnic Compounds Ul/t • micrograms per lltar Ma.• M•mum Contaminant LIM!I TCE • TrftHoraethene PCE • Tetrachloroethene
!,1-0CE • 1,1-Dlchloroethene
ES'NM1'ED MASS OF TOTAL TMGET VOC.S
CAPTURED
(Pounds per yur)4
468
436
504 484
1,192
146
lit
47
54
4H
UZI
i Phase 1 pumping rata •re based on actual dllta obtained from wefts In treatment .mode. Phue 2 pumplfll ratn are based on RID production data wfth an estimated 1°" deratll'I forfutu!ll tiatment system head losses. Pumping me loss based on empfJ1cal data obt.llned during Phase 1 worfc. 2 sum of concentrations for all voes, lndudfnl those voes currentfy below MCb (He Table 1). 1 SUm of concentratfons for Ta, PC£ and 1,1-DCE (where 1,l·DCE uc::eeds the Ma.) (see Tabl• 1).
•Mass removal assumes 100% duty for Phase 1 and Phase 2 wells.
~ ARCADIS
Attachment 2
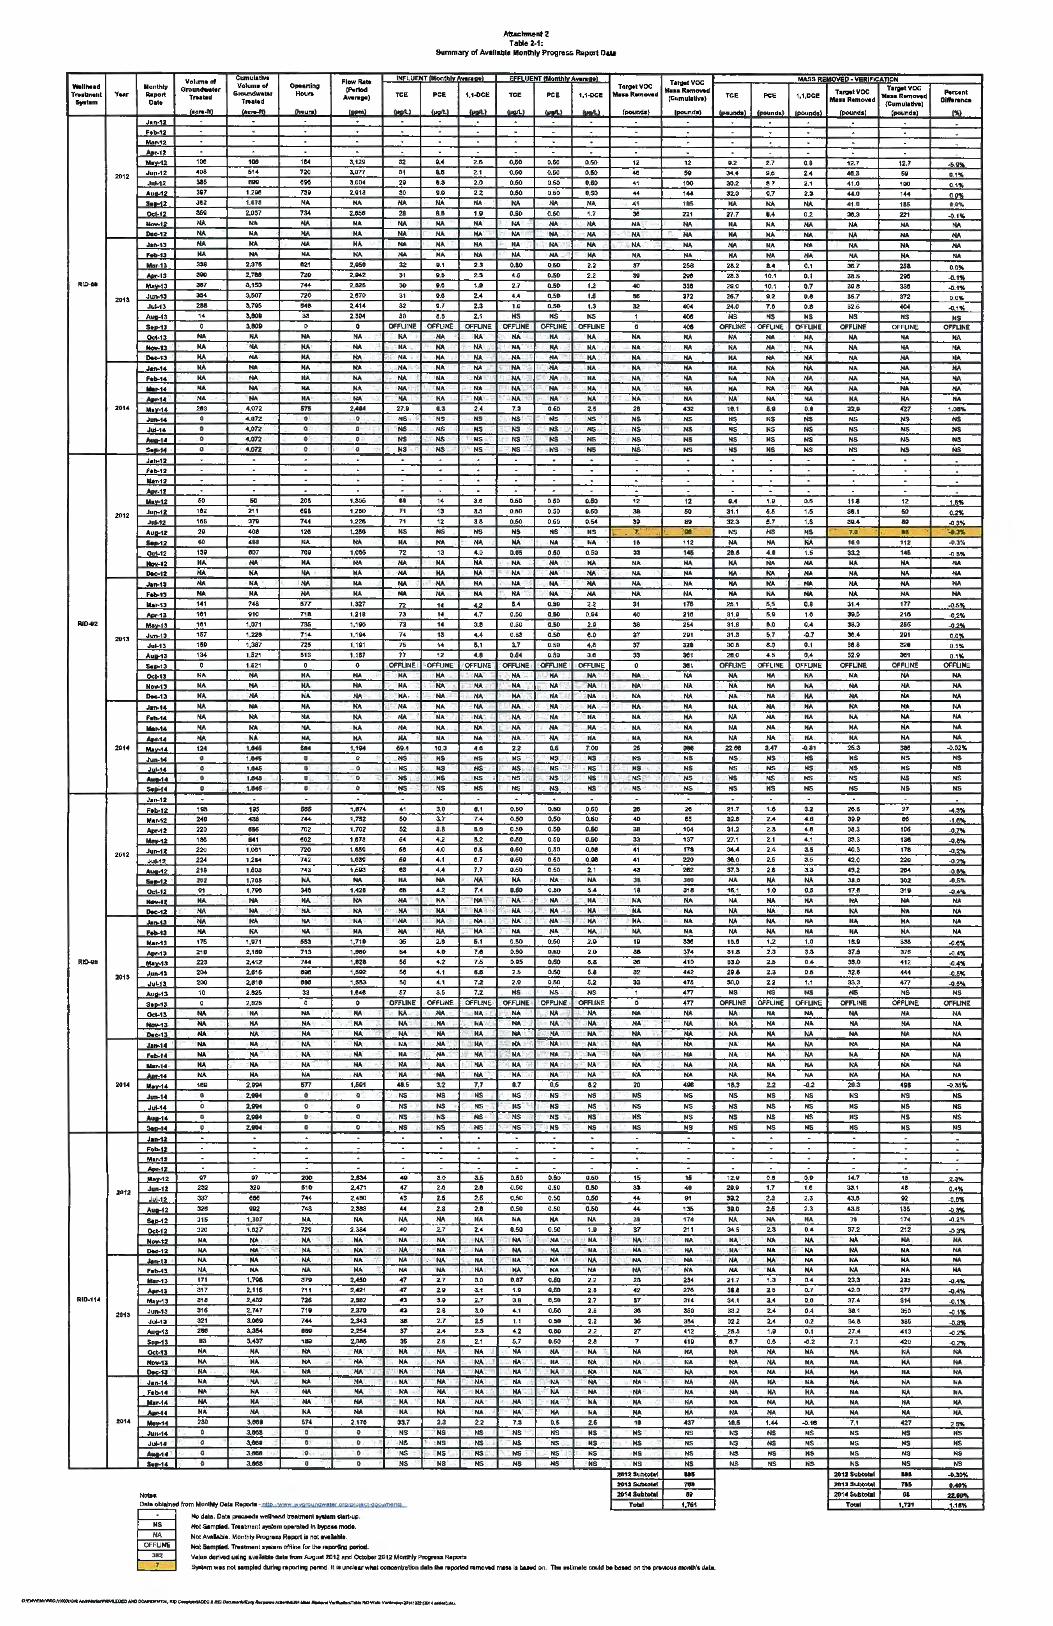
WollhHd Tr.1tmant Ywr
Sya!om
2012
RID-M
20U
J01 '
~12
RID .. 2
2013
20t4
2012
RID-Q6
201$
201'
;11)12
RID·•f1.t
201$
2014
VoMr\• of C4nU.l&tlYI F\owRa• ~·· Monthly '/oklm.• ol o,.""""' O:romuh1t1•r tf'*rtod 11<> ... 11 r,.. .. ., <;~tt.r - n:e Awn..p,) Datt Tr.ea.It
llCl'lt·M "'•--"' thou"'l ,_, .... ,
..t1n-.12. - -h'b-'2 - - . Mnr.1a . Aor-.12 . MaY>'l2 1oe 100 184 3.129 112
Jun-12 408 614 720 3.077 31
J11"'12 S86 8DQ 0\16 3.004 20
Au .. ...t~ 3117 1,2Ge 730 2.Gt8 30
S••12 J U 1,111 HA HA NA
OcM2 ~ 2,037 734 2.058 28 -·2 NA NA NA NA NA
0.c.1:2 NA NA NA "" NA
JaA-U NA NA NA HA .... _., NA NA .... .... NA
Mar--U - 2.375 02t 2,oso 32
•-13 SQQ 2.708 no 2.0'2: " Mi""13 887 3,153 744 2.826 "° JIU>-'3
,... 3,1507 n o 2,070 SI
Jul-13 218 M05 ... 2,41' 32
Auo-13 ,. MOO S3 2.304 30
s. .... , a uoo 0 0 Dl'FUINE
Ocs-13 NA NA NA NA NA -. .. NA NA NA NA HA -13 NA NA HA NA NA
..1-..14 NA NA NA NA HA
F•l:>-14 NA NA NA HA NA ...... ,. NA NA NA NA .... ~ .. NA ..... NA NA NA
M•v.-14 213 4.072 61S ...... 27.9
-'-" 0 <&.0'7% 0 0 HS Jui.t4 0 •.on 0 0 NS ._, .. 0 4,072 0 0 NS
"-t4 0 4.072 0 0 N8
Jar..12 . . l•b-12 . . llan12 . ....... 2 . M1.""1a llO 60 ~s 1,306 60
Ju.,..12 102 211 ODS 1.200 71
JuJ..12 188 3711 744 1.22& 71
AU"'12 20 401 129 t.2!!0 HS
s-.a IO 41& "" NA NA
Od.-1:2 130 007 1')0 1.oes 72
-•2 "" NA llA "" NA - llA "" llA HA NA
.Ja~t3 HA "" llA "" NA ..... , .... NA NA NA "" Mat .. 13 141 74& tfTT l .~7 .,., •-n 101 010 718 1,218 73
Me-.;..13 181 1.011 785 1.100 r.J
J~i) 167 •.228 714 1.104 74
Jw&-11 1'9 1,387 7l5 t,101 7lJ
Ai.11~11 •34 1,52• 118 1,187 77
S.n..13 0 t,621 0 0 Ofl'\JN£
()et.U N" NA. NA .... .... Nov-13 NA NA NA NA NA _,,
"" Nil NA HA NA
..ll&ot4 NA NA NA "" "" ,...... .. NA NA NA llA HA ....... NA NA NA. .... HA -.... "" NA AA NA HA
Ma .... 124 1,845 584 1,104 89.4
""""" 0 t .M5 0 0 NS
JuJ..14 0 1A46 0 0 HS .._,. 0 1,M6 0 0 NS
S.p.f4 0 1.1146 0 0 NS
Jan-12 . . . . Fob-12 195 1"5 606 1.874 41
Mar·12 2'IQ 438 744 1,752 eo .-..2 220 856 702 t .702 62
u-t2 186 841 •02 1,078 6 4
Juft.<12 220 t,001 720 1.&SQ Ge
Ju~1~ 224 1.lM 742 1,830 H
•--.A2 218 1.aoa 743 Ui113 93
S.•1.2 202 t ,705 "" "" NA
()d.t2 "1 t,7'00 :Me 1,.421 85
-•2 "" NA HA NA HA
Doe-12 HA HA NA. HA NA
.... -~· HA NA HA "" NA
-ti HA NA "" NA NA
Mo"'1S 176 U17t 5S3 1,11t 36 A~3 2•• 2_,t&O 713 1.19<10 .. ...... :s 223 2.412 744 1.828 ~
Jun--1• 204 2.8•6 eoe 1.602 ~
Jua.13 200 2,818 ucr 1.5&3> se Auo--i3 10 2.126 33 1.9"11 07
Seo-n 0 2,826 0 0 DFFUNE
Ocs-1! HA NA NA NA NA _,. NA "" NA MA NA
0.e.1-3 HA NA NA Hlo. NA
J.1~1..t HA NA "" NA .... f.t..H .... NA NA ..... NA ...... "" NA NA ..... NA
~" .... .... ... NA NA
Mo .... •oo 2.Dll4 m 1.601 41.6
Ju.1• 0 2.014 0 0 NS
Jlll-t4 () 2.- 0 0 HS
&·-1' 0 2.014 0 0 NS ........ 0 2.004 0 0 NS
J1 .. u . . . ...... o . . y.,..12 . . . .t.or.tz . . •-12 07 O? 200 2.534 411
Jun·12 232 320 510 2.471 47
JvJ.12 337 eoe 744 2,400 4S
A-.t2 32$ 002 74S 2.383 44
"'~•2 l1S 1,l07 NA. HA NA
0...12 = •.OV 729 2 384 • O
NO¥ot2 NA NA HA Mio. NA _ .. NA NA NA "" HA
H,..13 .... NA NA "" NA
ht...tS NA "" NA NA NA
MaC&1J 171 1.7 .. 370 2,450 47 ........ 317 2.116 7'1 2.'21 47
Mav·13 318 2.~ ?26 2.1182 43
Ju,...1~ 316 2.747 711> 2..370 ·~ Jul-13 321 11.oeo 744 2,343 38
.Au-1:s 2&e S.'"4 090 2.254 37
Sop.1S 113 "437 181> 2.Ba6 SS
Oct-i, "" NA NA NA NA
-~ "" "" NA NA NA
0.C.13 NA NA NA NA NA
J•a.1-4 .... NA "" "" NA
F.0-14 NA "" "" NA NA ....... .... .... NA NA NA
&-.f4 .... NA NA "" NA
....... 4 230 3.1181 574 2.179 33.7
Juin-14 0 3,116& 0 0 NS
JuJ.1• 0 a.- 0 0 NS
··-14 0 3,818 0 0 NS ........ 0 J.116& 0 0 HS
Nolet: Cata cibt91rlod f.rom Mo,..,,. 0.t. R•pott1 • Dlll ~ a~~OSIWAiiC mA AlllJISd :Sl~:Mml:DIJ
No dtte. Odl pr.ce.d• we•hNd lrHtrMn• ly'IUIM Slart..uO.
Hoc S.mlMd. TtHtmenl t!y91em OPtl"lbtd Cn bype11 mod•. Not A""161>1e. MoolNy ~aa Report io not """:lellla • ..,_ S.mJMd,. Ti'Htm.nl ....i.m oft.be f:at the ... ~ period ..
Attachment l Table 2-1:
Summary of Avalllblo Monlhly Progrus Report Oallt
1-.1MvAvtnia.l EFFLUENT lMOft'lh~ Awn.•1 T•19<t'IOC
PCl l ,1.0CE TCE PC£ t,1..0C'! Ma-.R..moved
,...,., ··~· ·-· ,,_. ._., , __ ,
- . . . . . . . . . . ~4 2 ,& G.60 o.60 0.5<> 12
8.• 2.1 o.60 0.60 uo 4CI
a.a 2.0 o.60 0.60 uo 41 o,o 2.2 MO 0.60 uo 44
HA NA MA HA HA ~1
8.8 1.11 o.so G.60 1.7 31! .... NA NA NA HA NA .... NA NA .... NA NA .... NA "" HA .... HA .... .... .... NA "" "" G.1 u O.llO o.50 2.2 37
u u 4.6 o.so 2.2 39
u u 2.7 a.so 1.2 40
o.G 2.4 ... a.so t.6 88
G.7 2-3 1.0 0..50 1.3 32
M 2.1 HS HS NS 1
OFFUN!: Ofl'UNE OFFUHE OFfUNE OFFUNE a HA HA "" NA NA NA
"' NA HA HA NA HA
NA NA NA NA NA llA llA NA NA NA "" llA
"" NA NA HA NA NA
"" .... NA .... NA NA
"" NA NA NA HA NA n 2.• 7.3 060 u 29
NS NS HS NS HS HS NS NS NS NS HS HS NS NS NS NS NS HS N$ NS NS HS NS NS
. . . . . . . . . . .
. . 14 u 0.60 0.60 0.60 12
13 3.S 0.50 0.50 0.50 38
12 3.8 O.GG 0.60 0.54 30
NS NS lj$ NS NS 7
NA NA NA NA HA .. 13 .... CU! 0..50 o.so 33
llA "" .... NA NA NA
NA NA llA NA NA .... NA NA NA "" NA NA
NA NA NA "" NA "" ,. 4.2 8.4 0.50 2.2 31
14 4.7 o.oo 0.50 a,04 40
" 3.8 o.»o 0.50 2.0 3&
'" 4.4 0.83 a.so 8 .0 37 .. 5.1 3.7 o.50 4.8 37
12 •.8 o.64 0.60 3 ,8 S3 OfR.IHE OFFUNE Ol'FUllE Off'UHE Ofl'UHE 0
NA NA NA NA .... NA
NA HA "" "" NA NA .... "" NA "" NA NA
NA NA NA NA NA "" NA NA. HA "" NA NA
NA NA NA NA "" "" NA NA NA NA NA NA
10 .. 3 ... 2.2 G.6 7.00 2S
NS NS NS NS NS NS
NS NS N$ HS NS NS
HS NS NS NS NS HS llS HS NS NS NS NS
. . . . $.0 0.1 0.00 MO 0.60 20 3.T 7.4 o.eo 0.50 0.50 40
3 .8 8.0 a.so 0.60 0 .60 38
4.2 8.2 o.llO 0.60 0 .60 33
4.0 0 .6 o.so 0.50 o.ea 41
4. t e .1 0.60 D,50 o.oe 41 ... 7.7 0.60 0.50 2.1 43 .... HA HA NA .... .. ~ 7.4 0.60 0.60 S.A 1$
"" llA NA NA ..... "" MA NA NA NA ..... NA NA NA NA NA NA HA
HA NA NA NA HA HA
.2.8 5.1 0.110 0.6<1 l.O 10
4.0 74 a.50 O.GO 2.0 38
4.2 7.1; o.os o.60 0.8 3&
4.1 6.8 2.li 0.50 5.8 32
4.1 7.2 2.0 O.&O 6.2 33
3.5 7.2 HS NS NS 1
OfFUN£ OFl'UNE OfFUHE OfFlJNI! OffUNE 0
NA NA NA NA HA NA
..... HA NA HA NA. HA
"" "" HA HA .... HA
NA NA MA "" NA HA
NA NA NA NA .... NA.
NA HA NA NA NA "" "" NA NA NA NA NA
3.2 7.7 1.7 G.6 1.2 20
NS llS NS NS NS N$
NS NS HS HS NS NS NS NS NS NS HS HS
NS HS NS NS HS HS . . . .
. . . . . . .
a.o 3.6 0.60 0.60 0.60 15
2.11 2.e 0.60 a.10 a.so sa 2.5 2.6 0.5-0 0.50 0.60 #
2.8 2.9 o.so a.so 0.60 #
NA "" ~ NA "" 31
47 2.4 G.50 0.50 u S1
"" NA NA NA NA NA. NA NA NA .... NA NA
HA NA NA "" HA ...... NA NA NA "" ... NA 2.7 11.0 0,47 0.50 2.2 23
2.0 3.1 1.0 0,60 2 .• 42
3 .0 2.7 3.8 a.so 2.7 !7
2.$ 3.0 4,1 a.so 2.8 ~
2.7 u 1.1 o.so 2.2 3& 2.A 2.~ 4.2 0.60 2.2 27 z.s 2.1 6.7 O.GO u 7
HA "" NA NA HA NA NA NA "" "" NA NA NA NA NA NA NA NA .... NA. NA .... HA ..... .... NA MA NA .... NA NA NA NA "" NA. NA NA NA NA NA NA "" 2.3 2.2 7.3 0.6 2.6 18
NS NS NS NS NS HS
NS NS NII NS NS HS NS NS NS NS NS NS
NS NS HS NS HS HS
l012 s..b<otat
IO't31~otd
20!•Svbtota1
TO!a!
V""'9 de-ut!og &W-• Ck!o &om~ .... ~ end Oc>obe.r 2012 M.,.Hy p_... R&porta
T ....... YOC lllaaaltllm~
(l'umu11u .. > ,.,.,......)
12
~
100
144
llS
221
NA
NA
"" "" 268
200
330
372
~
400 40tl
NA
NA
NA
NA
HA
NA
"" -HS
NS NS
NS . .
12
60 ... ge
112
146
"" NA
llA
w. 179
218
2 ..
201
:n• 301
301
NA
llA
NA
HA
NA
NA NA -NS
NS
HS
HS
29
O.I
104
137
173
220
282
J60
318
HA
NA
.....
..... 330
37•
410
442
475
•n 477
NA
NA
NA
llA ... NA
NA
4\16
NS
NS
HS
NS
.
. 16
48
91
136
•1• 211
NA
"" .... NA
234
au 314
300
304
412
410
..... NA
NA
NA
NA
"" HA 437
NS
HS
NS
NS ... .,.. " t,761
~was not NM~td durl~ ft porting Ptfiod-, 9t ia undl:11 wbtl oonoentratbn dale ltlll "'PQl1odl ,..mo* maM ll b&lltd on Ttt. nti1Ntlt cmM bl boMd on~ ~ "'°"°''* 6-la
llASS RDIQVi;D - \ll;fll•JCAllOlol Taf'DtlVOC
TCg PCe 1,1pce T•rvt.lVOC "'9HllMtOVit-d hrcitftt
MIHRtmowd (Cumullllw)
OlffeNnc•
'-•"""' 1--.nd1\ •-·ndsl •-ndal c_.,dal C'Al
-. . .
0,2 2,7 0,$ 12.7 12.7 •S .... 34.4 9,6 2.4 4Cl.8 60 0.1 ... au 87 2.1 41 .0 100 0.11'
12.0 0.7 u 44.0 144 .,,... NA .... NA •1 .0 11$ O,OY,
27. 7 1.4 0.2 31!.3 221 .<>.1 ... NA NA NA NA NA HA NA NA NA NA "" NA NA .... NA .... HA NA
HA NA HA .... HA .... 2L2 ... 0.1 :!G.7 261 0 .0% 221.1 10.1 0.1 38.5 208 .0.1% 20.a 10.1 0.1 aa.a 3SO ..0.1% U..7 9.2 o.a 36.7 372 0.0% 14.0 7.0 u 82.6 ~ ~-1" HS NS NS NS NS HS
OfFIJN6 Off\.INE OFFUHE OF FUNE OfFUNE OfFLINE'
NA .... HA NA NA HA NA HA HA NA NA NA NA NA NA .... NA HA NA NA NA NA NA HA
HA NA HA NA NA AA NA NA NA NA .... NA
NA HA NA NA NA NA
11.1 6.0 G.I 22.0 '27 1.oao.
NS >IS NS NS NS HS
'" HS NS NS NS NS NS , .. NS NS NS NS
NS NS NS NS NS NS . . .
-.... 1.0 0.6 11.8 12 1.5% 31. t 5.5 u 38.1 60 a.2"' 32.3 M 1.6 au 80 .Q~'Jf.
NS N$ NS 10 .. ..O.l%
NA NA NA 110 uz ~.1%
29.1 4.1 t.6 33.2 146 .oa.,. HA "" NA NA NA "" NA NA HA llA "" "" NA .,..
"" llA NA NA
NA NA "" NA .... "" .ZS.• 5 ,S 0.8 3t.4 1n ..o.s ... 3U 0,0 1.0 So.6 210 .02% 31.8 6.Q OA :SU 26$ .<>.2 ... 31 ,8 5.7 .0.7 31!.• 201 0.0 ...
30.S 6.0 o. t 30.8 3.28 0.1'.4
28.0 4.S o.• 32.0 301 ...... OFFIJllE OffllNE OF FUNE OFFUNf. OFFIJNE OFFl.INE
NA N" NA NA "" "" "" NA NA NA NA NA
NA NA NA NA NA NA
NA NA NA NA NA NA NA NA NA "" "" NA
NA HA NA NA NA NA
NA HA NA "" "" "" 22.118 3.47 ~.81 2U - .0.02%
NS HS NS HS HS NS
NS NS HS HS ""' NS
HS NS NS NS NII NS
NS HS NS NS NS NS
. 2'-7 1.0 u 20.0 2 7 -4.3% 32.0 2 .4 4.8 39.0 06 .1.a ...
3t.l 2.3 4.8 38.3 106 .0.7 ... 27.1 2.1 4.1 33.3 138 .0.8 ... 34.A 2.4 3.5 40.3 17& .02 ... '6.0 2.6 3.6 '2.0 220 -'>.2 ... S7,S 2.1 3.3 '3.2 - ~.s"° NA NA NA lt.O ••z .0,5,.
11.1 1.0 0.5 17.e 310 .0.4 ... .... MA NA .... HA .... NA NA NA NA NA NA
NA NA "" "" HA .... NA NA NA HA NA "'" 1U 1.2 1.0 11.9 11311 .0.11%
31.8 2.3 3.3 37.6 "'' '°·'"' n .o 2.li 0.4 30.0 412 "'""' 2U 2 .3 0.6 32.6 ... .0.5% 311.0 2.2 1.1 33.3 •n .0.5 ... NS NS NS NS NS NS
OfFUllE Ofl'UNE OFFUtiE OFFllNE OFFUNE OFFl.IHE NA HA NA NA NA 114 NA NA HA NA NA NA.
NA llA NA HA .... NA
NA NA NA "" NA NA
HA NA NA .... NA NA ..... NA ... NA .... .... "" NA .... NA NA NA
11.3 2.2 .0.2 20.a 401 .<>.35,.
NS HS NS NS NS NS
NS NS NS NS NS HS
NS NS HS HS llS N$
NS NS NS HS NS llS . .
. . . . . .
12.9 0.8 0.0 14.7 11 ... ,. 211.0 1,7 1.e 33.1 •• 0.4" 311.2 2.3 2,3 43.6 02 .(I.Olli 30.0 2.6 2.3 •a.a \'6 ~3"'
NA NA "" 31 114 ..... ,. 34.S 2.3 u S7.2 2t2 -<>3"' ..... NA NA NA NA NA
NA NA "" NA NA NA
HA NA NA NA NA NA
NA NA NA NA HA NA
21.7 1.3 ... 23.3 ns ..0.4'11.
3U 2.6 0.7 42.0 277 .., ..... 34.1 3-4 0.0 37.4 314 .0.1 ... 33.2 2.4 0.4 38.1 tl50 .0.1 ...
322 2.4 0.2 114.8 386 '°""" 25.5 1.0 0.1 27.4 •t3 .Q,2'1(,
a.1 0.6 .0.2 7,1 420 '°·"' NA NA Nr\ "" NA NA NA HA "" "" HA "" "" .... NA NA NA NA
llA NA NA "" "" Nlo.
NA MA Nr\ ..... NA "" NA "" "" ..... NA NA
NA HA "" NA N" "" 1U 1.44 ..0.18 7,1 427 23"' NS ljS NS NS NS HS
HS NS tlS HS HS HS
NS NS HS NS NS NS
NS NS NS NS HS NS
2011 Subtotat ... .0.30%
2011 SUbtot.1 7H OM'l< 2014Sublolot II& 22. ......
TOtAlt t,'J'J1 1 .115%
EXHIBIT "5''
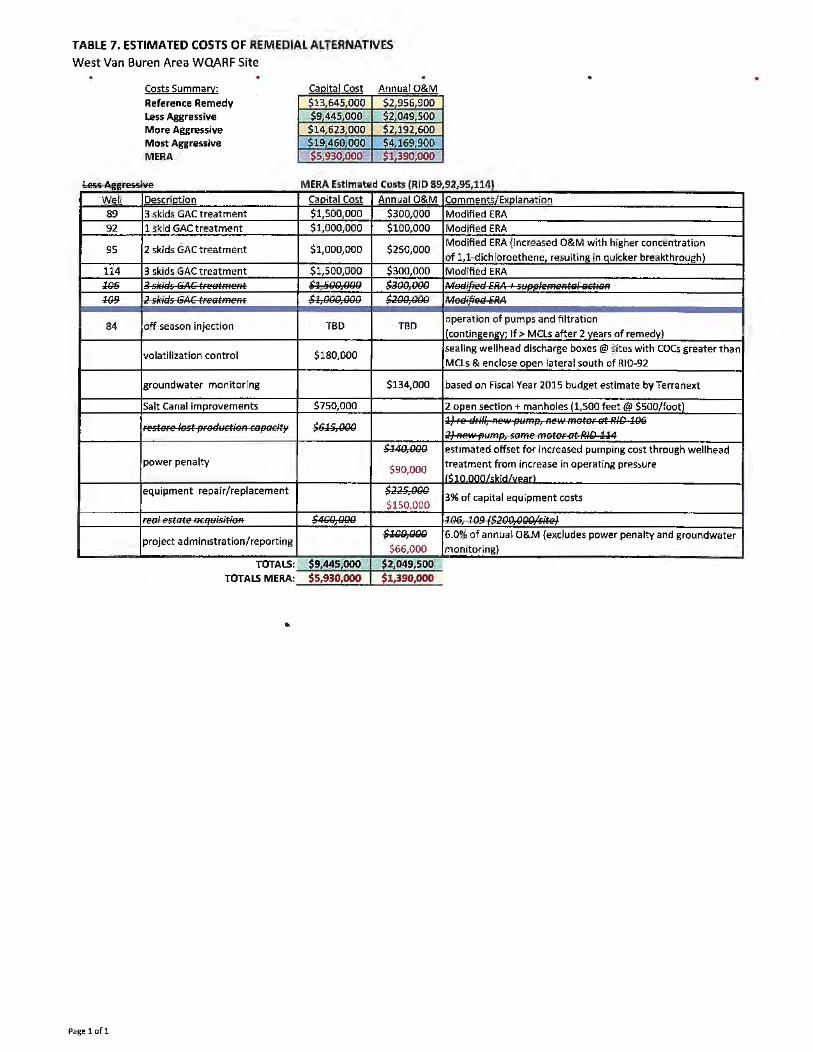
TABLE 7. ESTIMATED COSTS OF REMEDIAL ALTERNATIVES West Van Buren Area WOARF Site
Costs Summary:
Reference Remedy less Aggressive More Aggressive Most Aggressive MERA
Caoital Cost Annual O&M
$13 645 000 $2 956,900 $9 445.00() $2,049 500 $14 623 000 S2 192 600 $19.460000 $4,169 900 $5,930,000 $1390000
. . MERA Estimated Costs (RID 8.9,92,95,114)
Well Oescriotion CaQital Cost Annual O&M Comments/Exolanation
89 3 skids GAC treatment $1,500,000 $300,000 Modified ERA 92 l skid GAC treatment $1,000,000 $100,000 Modified ERA
95 2 skids GAC treatment $1,000,000 $250,000 Modified ERA (increased O&M with higher concentration
of 11-dichloroethene, resulting in quicker breakthrough)
114 3 skids GAC treatment $1.500,000 $300,000 Modified ERA Wt; 6 5lfifl5 G.~ G fft>e~ eR~ $1,!;00,QQll $3QQ,{}00 .. ·- ~"· - ··· ·-· ~ 2-?k.ff/5 GAG ff:eelmeRI $1,€JGO,OOQ $~QQ,QQQ Madifiea QA
84 off-season injection TSO TBO operation of pumps and filtration
(continl!enav; If> MCLs after 2 vears of remedy)
volatilization control $180,000 sealing wellhead discharge boxes@ sites with COCs greater than
MCLs & enclose open lateral south of RID-92
groundwater monitoring $134,000 based on Fiscal Year 2015 budget estimate by Terra next
Salt Canal improvements $750,000 2 ooen section+ manholes (1,500 feet@ $500/footl
1J ff! tkll/, Aew 19ump, Rew meter 11t Fl.'g 1'18 l'eSkl•<e lest f9•"6GIJffiEIA aJpfileit)i $GJ~ggg
~ r1.i,... 1 'f A ,-, ·- -~, - - - ··- --
$140,00G estimated offset for Increased pumping cost through wellhead power penalty
$90,000 treatment from increase in operating pressure llC:tn nnnl< ~l~/"p;irl
equipment repai r/ replacement $~~uoo $150,000
3% of capital equipment costs
Fef1! est11te 11cqu.i&ifieR $4GQ,QOO • "' - .. -- I,,.. ___ I•
I
project administration/reporting $100,QQQ 6.0% of annual O&M (excludes power penalty and groundwater
$66,000 monitoring)
TOTALS: $9,445,000 $2,049,500
TOTALS MERA: $5,930,000 $1,390,000
•
Page 1of1
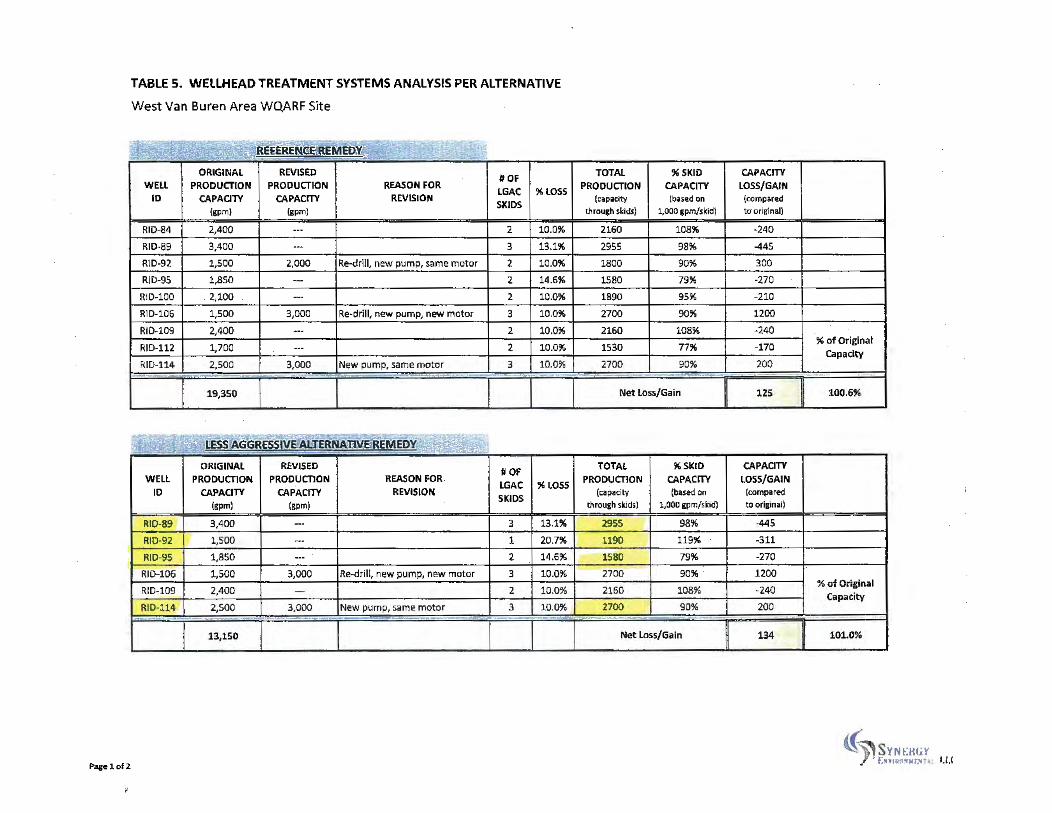
TABLE 5. WEllHEAD TREATMENT SYSTEMS ANALYSIS PER ALTERNATIVE
West Van Buren Area WQARF Site
o-~~ --- ,~ ~rem= · ~ ~-=-:~~-~ '''Ii" 'h · -KE EN • RE·Nleo: . . ~· ~ ·',',<!~ 1;1· ~ '1'. ~ ~ ~~' T.'. "A,..,~ .. · · ~.... 1~•,,L.I
ORIGINAL REVISED #OF
WELL PRODUCTION PRODUCTION REASON FOR LGAC % LOSS
10 CAPACITY CAPACITV REVISION SKIDS
(gpm) (gpm)
RI0-84 2,400 --- 2 10.0%
RID-89 3,400 ··- 3 13.1%
RlD·92 1,500 2,000 Re-drill, new pump, same motor 2 10.0%
RID-95 1,850 - 2 14.6%
RI0-100 2.,100 --- 2 10.0%
RlD-106 1,500 3,000 Re-drill, new pump, new motor 3 10.0%
R!0-109 2,400 -·- 2 10.0%
RID-112 1,700 --· 2 10.0%
RID-114 2,500 3,000 New pump, ~ame motor 3 10.0% ~ ~ - - ·-
19,350
•~....!-~ ---- - - - ·-·-·-- - - - --- - - - ------ - --- - ~~-I J ·._,
ORIGINAL REVISED #OF
WELL PRODUCTION PRODUCTION REASON FOR LGAC % LOSS
ID CAPACITY CAPACITY REVISION SKIDS
(gpm) (gpm)
RI0-89 3,400 -· 3 13.1%
RID·92 1,500 ... l 20.7%
RID-95 1,850 ·-- 2 14.6%
RI0-106 1,500 3,000 Re-d rill, new pump, new motor 3 10.0%
RID-109 2,400 - 2 10.0%
RID·ll4 2,SOO 3,000 New pump, same motor 3 10.0%
TOTAL %SKID
PRODUCTION CAPACITY (capacity (based on
through skids) l,000 gpm/skldl
2160 108%
2955 98%
1800 90%
1580 79%
1890 95%
2700 90%
2160 108%
1530 77%
2700 90% - -
Net Loss/Gain
TOTAL % SKID
PRODUCTION CAPACITY (capacity (based on
through skids) 1,000 gpm/skid)
2955 98%
1190 119%
1580 79%
2700 90%
2160 108%
2700 90%
- .. ,_r ...- - ~ ~ -- -- ~ -· - ~ __, =--- -------- " -~
13,lSO Net Loss/Gain
Pagel of l
CAPACITY
LOSS/GAIN (compared to original)
-240
-445
300
-270
-210
1200
-240
-170 % of Original
Capacity 200
-125 100.6%
CAPACITY
LOSS/GAIN (compared to original)
.445
-311
-270
1200
-240 % of Original
Capacity 200
--
U4 101.0%
((""SYNERG Y, u.c , 1 I r."""" ~" '-~
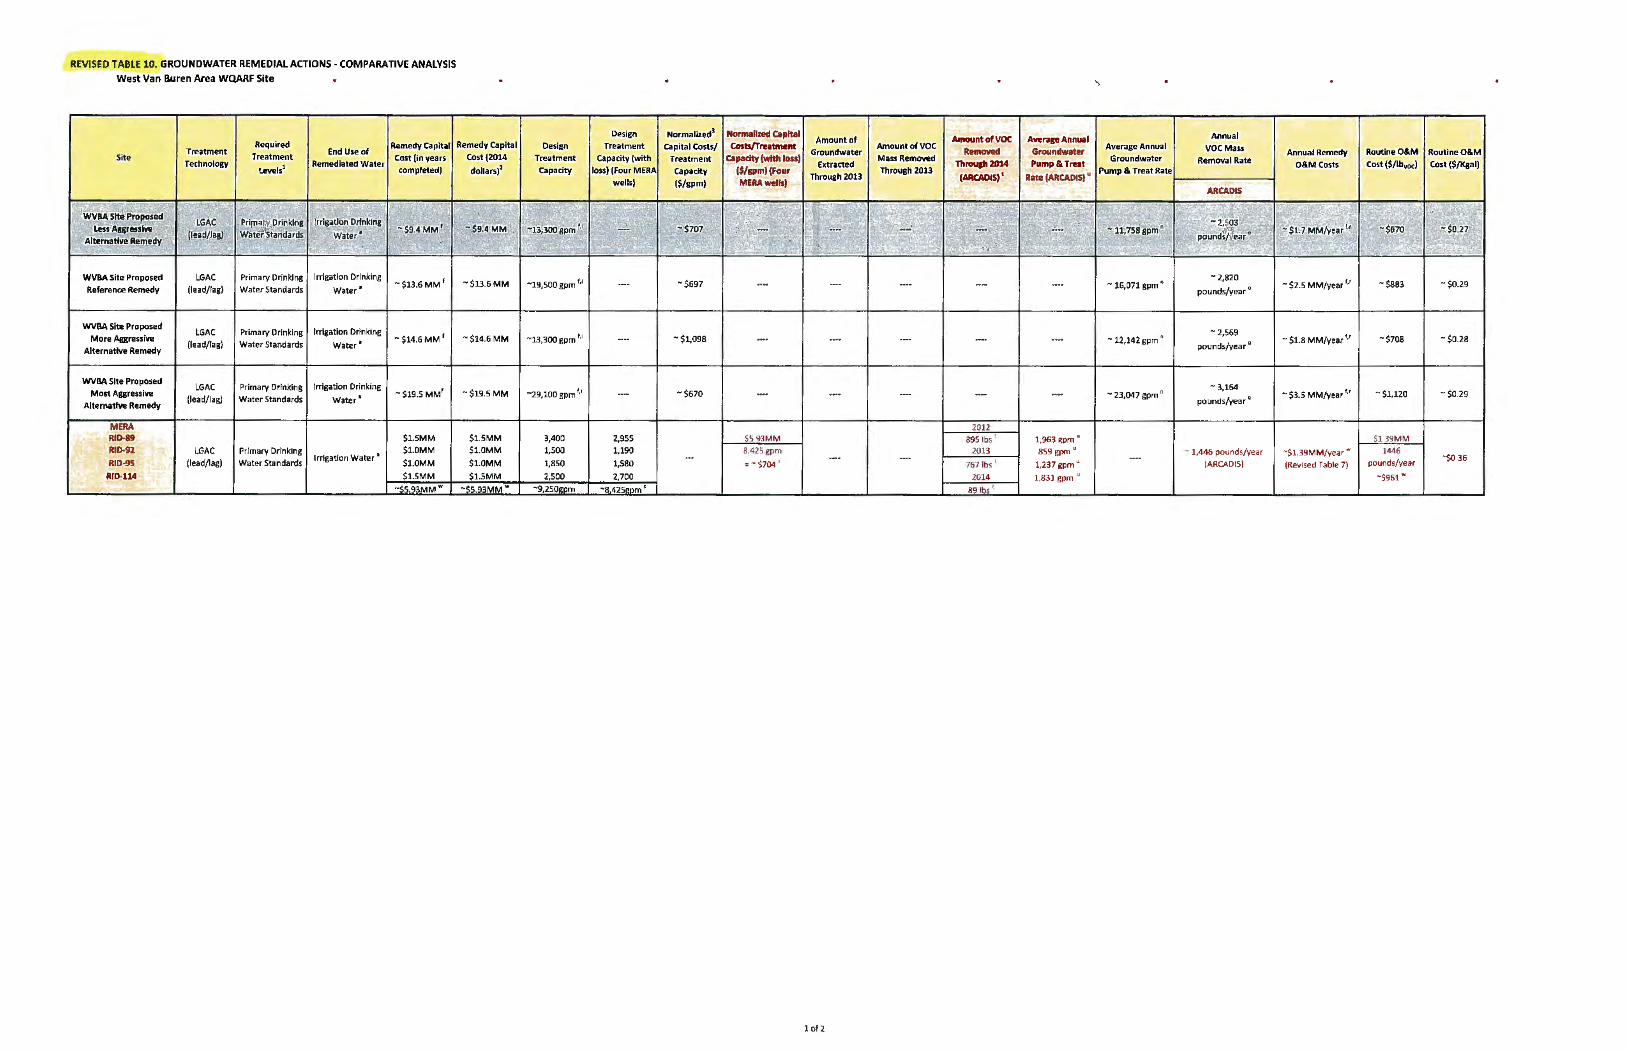
REVISED TABLE 10. GROUNDWATER REMEDIAL ACTIONS· COMPARATIVE ANALYSIS West Van Buren Area WQARF Site
. .---, ~'"t..-~ ... ~ ~ ~
..
Required End llse of
RA!medy Ca pitat Treatment
Site Treatment con [in years Technology
leVel•' Remediated Water
completed)
- - ~ ~
Remedy Capital Design Cost (2014 Treatment dollars)' capacity
- " . I ' I .. .. " I I -. - - - ..
~. .. -~ ~
WVllA Site Proposed LGAC Prll"a~Drln~lng trrisatlon Drinking
Less Acpesi~ -se.4MM' -$11-4 MM -13_,300 spm i• Water• (lead/Jag) Water Standard$
Alternative Re.medy -
WVBA Site Proposed LGAC Primary Drinking Irrigation Drinking -$13.6 MM 1 -$l3.5MM -19,500 gpm I; (lead/lag) Reference Remedy Water St3ndards Water•
WV8A Site Proposed LGAC Prim.a ry Drinking Irrigation Drinking
More Aggressive (lead/lag) Water'
-$14.6MM 1 -$14.6MM -H,300 gpm r; Alt~tlve Remedy
Water Standards
WVBASlle Proposed LGAC Primary Drinking Irrigation Drinking
Most Aggressive (lead/lag) Water•
-Sl9.S MM' -$19.S MM -29,100 gpm 1•1
Alternative Remedy Water Standards
MERA Rlo-89 $1.SMM $1.SMM 3,400 1110.92 LGAC Primary Drinking $1.0MM $1.0MM 1,500
Pead/l<lg) Irrigation Wall!r •
$1.0MM $1.0MM R:ID-95 Water Standards 1,850 ltlD-114 $1.SMM $1.SMM 2,500
-ss.93MM" -~5,93MM" ""'9,250~cm
Design Normall.ted1
Treatment Capital CoSU/ Capacity (with Treatment
loss} (four MERA Capacity wells) ($/gpm)
r. "" -s101 -"
-
·-- - $697
- -$1,098
··- -$670
2,955 1.190 -1,580
2,700
-a 425ecm'
..,
. f"> Normallted Capital
llmount of Amwnt of VOC Averap Annual Annual Costsffteiltment
Groundwater Amount of voe
ltl!lllCM!d Groundwater Average lln nua I VOCMass Annual Remedy RoutineO&M RoutineO&M
Clpacity (with loss} Mass Removed Throuslt 2014 Pump ll Treat Groundwater Removal Rate O&Mcosts Cost ($/lhllOC) Cost ($/l<&al)
($/gpm) (Four E~tracted
Through 2013 Pump & Treat Rate Through 2013 (AACAOIS)' Rate (ARCADIS) •
MWwelfs) AR CAD IS I ,
~
r~ " ~ ~. - e - . -..l' ~
-i~oa - . r' ·- ,, ~ ~~: .. I - 11, 758 apm • ~ - $1.7 MM/year It -$&70 - $0.27 - . . ~ -- ·..:; -· poundiN ear 0 .... , ....
.,,. .k
' '. • ~- I " ; J<. - .. ~- ...;. .. ·- -
- 16,071 gpm " -2.820
- $2.5 MM/year'·' -$883 -$0.29 -·-- ~··- --~- -- ........ pounds/year 0
- 2,569 - ·-· -- -- ·- - 12,142 gpm • pounds/vear 0 - $1.8 MM/ye.at t.r -$108 -$0.28
- 3,164 - ........ ··- -- ........ - 23,047 gpm" pounds/year•
-s3.S MM/year t• - s1.120 -$0.29
2012 SS.93MM 895 lbs ' 1.903 i:pm • Sl.39MM 8,425gpm 2<113 8S9gpm • - 1,446 pounds/yeu "$1.39MM/year . 1446
·-S?04 ' ·-- - 767 fbS I l ,237 gpm " -- (ARCADISl (Rf!"lrise.d fable 71 pounds/year ~36
2014 1.831 gpm " -S961"' 891bs '
1of2
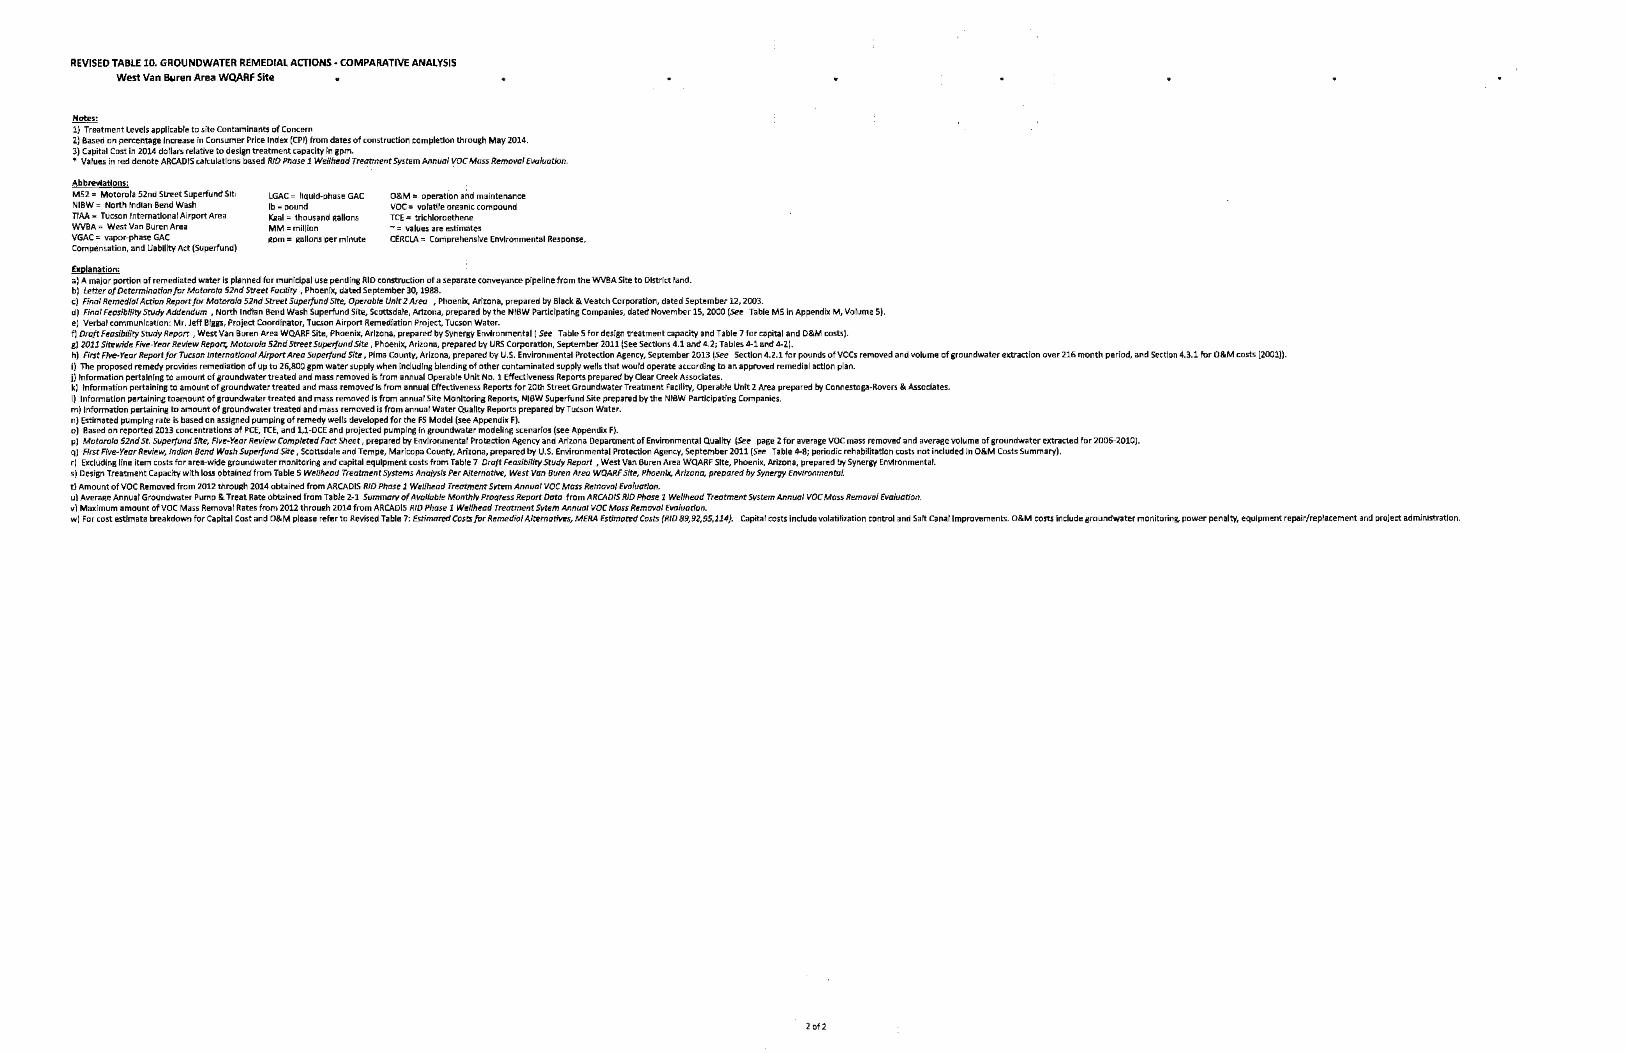
REVISED TABLE 10. GROUNDWATER REMEDIAL ACTIONS· COMPARATIVE ANALYSIS West Van &iren Area WQARF Site
~ l) Treatment Levels applicable to site Contaminants of Concern 2) Based on percentage Increase in Consumer Price Index (CPI) from dates of construction completion through May 2014. 3) Capital Cost in 2014 dollars relative to design treatment capacity in gpm. • Values in red denote ARCADIS ulculatlons based RID Phase l Wellhead Treatment System Annual VOC Mass Removal E11aluatlon.
Ab brevlattons: M52 = Mot.orot.i 52nd Street Superfund Sib NIBW = North Indian Bend Wash TIAA = Tucson International Airport Area WVBA = West Van Buren Area VGAC = vapor-phase GAC Compensatio n, and Liability Act (Superfund)
Explanation:
LGAC = liqu!d-11hase GAC lb• pound Kaai • thousand itallons MM=million 111om = 111allons oer minute
O&M = operation and maintenance voe,. volatile or1m1ic compound TCE = trichloroethene ~ = values are estimates CERCLA = Comprehensive Environmental Response.
a) A major portion of remediated water is planned for municipal use pending RIO construction of a separate conveyance pipel ine from the WVBA Site to OIStrfct land. b! l etter of Determination [Dr Motorola 52nd Street For:itir:y , Phoenix, dated September 30, 1988. c) Fino/ Remedlol Action Reportfr>r Matorolo 5211d Street Superfu11d Site, Operable Unit 2 Area , Phoenix. Ariiona, prepared by Black & Veatch Corporation, dated September 12, 2003. d) Final Feaslb/Jlfy Stvdy Addendum , North Indian Bend Wash Superfund Site, Scottsdale, Arizona, prepared by the Nl6W Participating Companies, dated November lS, 2000 (See Table MS in Appendix M, Volume 5). e) Verbal communication: Mr. Jeff Biggs, Project Coordinator, Tucson Airport Remediation Project, Tucson Water. fl Draft Feoslbllify Study Report , West Van Buren Area WQARF Site, Phoenix, Arizona, prepared by Synergy En11lronmental ( See Table 5 for design treatment capacity and Table 7 for capital and O&M costs) . g) 2021 Sitewide Five-Yeor Review Report Motorola Slnd street Superfund Site, Phoenix, Arizona, prepared by URS Corporation, September 2011 (See Sections 4.1and4.2; Tables 4-1 and 4-2!. h) First Five· Year Report for Tucson International Airport Area Supelfund Sit", Pima County, Arizo na, prepared by U.S. Environmental Protection Agency, September 2013 (See Section 4.2 .1 for pounds of VOCs removed and volume of groundwater extraction over 216 month period, and Section 4.3.1 for O&M costs [2001)). i) The proposed remedy provides remediation of up to 26,800 gpm water supply when indudlng blending of other conl>lminated supply wells that would operate according to an approved remedial action plan. j) Information pertaining to amount of groundwater treated and mass removed is from annual Operable Unit No. l Effectfveness Reports prepared by Clear Creek Associates. kl Information pertaining to amount of groundwater treated and mass removed Is from annual Effectiveness Reports for 20th Street Groundwater Treatment Facility, Operable Unit 2 Area prepared by Connestoga·Rovers & Associates. I) Information pertaining toamount of groundwater treated and mass removed ts from annual Site Monitoring Reports, NISW Superfund Site prepared by the NIBW Participating Companies. m) Information pertaining to amount of groundwater treated and mass removed is from annual Water Qual!ty Reports prepared by Tucson Water. n) Estimated pumping rate is based on assigned pumping of remedy wells developed for the FS Model (see Appendil< F). o) Based on reported 2013 concentrations of PCE, TCE, and 1,1-0CE and projected pumping In groundwater model!ng scenarios (see Appendix F). p) Motorola 52nd St. Superfund Site, Five-Year Review Completed Fact Sl!eet , prepared by Envlronmental Protection Agency and Arizona Department of Environmental Quality (See page 2 for average voe mass removed and average volume of groundwater extracted for 2006-2010). q) Rm Five-Year Rl!lfiew, lndlon fJend Wosh Superfund Site, Scottsdale and Tempe, Maricopa County, Arizona, prepared by U.S. Environmental Protection Agency, September 2011 (Stt Table 4-8; periodic rehabilitation costs not included In O&M Costs Summary). r) Excluding line item costs for area•wkle groundwater monitoring and capital equipment costs from Table 7 Draft F"asibiliry Stvdy Report , West Van Suren Area WQARF Site, Phoenix, Arizona, prepared by Syl\er1Y Enllironmental. s) Design Treatment Capacity with loss obtained from Table 5 Wellhead Treatment Systems Analysis p,,, Alternative, West Van fJuren Area WQARF Site, Phoenbi, Arizona, prepared by Synergy Environmental.
ti Amount of VOC Removed from 2012 throuRh 2014 obtained from ARCAOIS RID Phase l Wellhead Tr,,otment Sytem Annual VOC Man Removal Evalvat/on. ul AveraEe Annual Groundwater Pump & Treat Rate obtained from Table 2-1 Summarvof Available Monthlv Proaress Report Data from ARCA DIS RID Phase l Wellhead Tr,,atment System Annual VOC Mass Removal Evaluation. vl Maxim.um amount of VOC Mass Removal Rates from 2012 throu11h 2014 from ARCA0!5 RID Phose l W"llhead Treatment Svtem Annual VOC Mass Removal Evaluotlon. wJ For cost estimate breakdown for Capital Cost and O&M please refer to Revl5ed Table 7: Emmated Costs for Rl!media/ Alternatives, MERA Estimated Costs {RID 89,92,95,114}. Capital costs include volatili?ation control and Salt Cana l Improvements. O&M costs Include groundwater monitoring. power penalty, equipment repair/replacement and project administration.
2 of2

EXHIBIT "6"
'HALEY. ALDRICH
FEASIBILITY STUDY REPORT WEST VAN BUREN WQARF SITE PHOENIX, ARIZONA
by
Haley & Aldrich, Inc. Tucson, Arizona
for
The West Van Buren WQARF Site Working Group
File No. 37503-204 July 2014
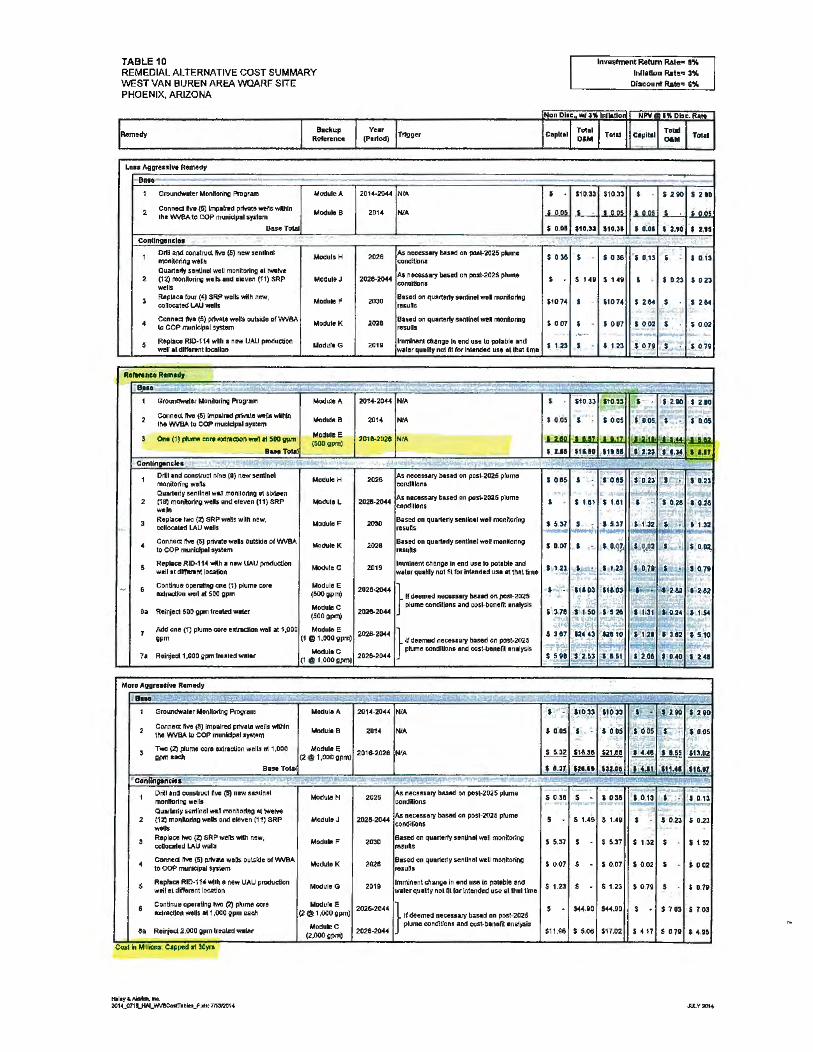
TABLE 10 REMEDIAL ALTERNATIVE COST SUMMARY WEST VAN BUREN AREA WOARF SITE PHOENIX. ARIZONA
Remocty
~ ... AQ!jfU •IY<t Remedy
-Baso- - ~ -· 1 Gtl>undwater Monllorino Program
2 Connecl ftw (5) "'1>•1ra• pr1v8t• -• .. 1111n Iha v.NeA to COP mvnids;i11 syslem
6ue Tolll
Conll-m:lu
1 Drli aM CO<\Slnld m (5) now . .. 11ne1 moni1orina ..,,. .. Quanorly sonllno1 .... m m0'1Morirov t i twe!v•
2 (12) monRoorov wells and elovM (11) SRP wells
3 Roplaea !OUT (4-) SRI' welb with new, <0R0<.iled I.AU woll1
4 ConntCI !Iva (S) privale well$ ou1slde ofWV8A to COP ""'nlclp•I Sys1om
5 Replaoe RI0-114 wllh . ..... UAU pra<1•<1i0'1 weir al differe.nt tocaUon
1!111fenc1 Rtn1tdr
e,u I
COnned IMI (S) lmpl!nd p<Mlo -wltllll lMi Wt/BA to COP munldp1l ayst111"1
On• (1) pl\lme ,,.,,.. e>C!ra.-On wwll al 500 gpm
•-Tota COflllngoncJu ..
2
Dr\11 a•d con&llud nln o (8) new sentinel moni!olfnci weRs Quartuiy senllt1e1 wl.Jf mor'lllol1ng et sb<toen (16) m••~o~ng weas an<l eloven (II) SRP wills Replaat 1WO (2) sRP w•h• with new, a>l ocated LAU walls
C<•M • CI five (5) priva!o waas outside 01 V'lll8A to COP mul1iclpal •Y•ltm
Repl1u;e RID-11-4 wtlh . •-UAU ~ wellat-loCO!Jon
C001inut 0pera1inp one (1) plume r:<>re axl-'•n ..... ol 500 gpm
6• Reinjee\ SDD gpm 1reated woter
Backup R$Jerenc.
MO<luloA
Module 6
Modul• H
Moaul&J
Modult F
Module K
ModutoG
_n
Moduli B
Module E (5£111gpm)
ModuloH
Moduro F
Mo<lule K
-ltE (SOO gpm)
ModuloC (SOOgpm)
Yur (Period) T11l19er
2014-2044 N/A
2014 NIA
2028 As natusary bas:ld c:n po.£:~2025 p.Jumc condlllons
As ntoaUary bl•ed on post-202S plume 202&-2044 co.ndfflont
2000 B11ed on qtn11'tecfyi sentinel wel montloMg ruulll
2028 eucid on quarterly untiMI wtl rnoniloriig resu!lt
20 19 lm!Nnent change rn end use to 90l1bl1 and w•t•r qua!tty not At fo< lmerw!ed use et that time
2014-2044 NIA
2014 NIA
2018-202$ NIA
I
2028 IA> nooo .. ary ba•ed on po&i-2025 plume ex>ndHon•
B.sed on quarter1y sentJnel wall mo"itcrlog resuts
8u9d on quartady u~f11ei well rnonl oring ruu'lls
lnv• tlment RelUm Rat- S% Inflation Rata• S%
Discount RatG" &%
Non Dl1c w/ 314 lnllall
Copllol ~~~
~
$ s10.n $1 0.3,
l.1...W s 1 11 ..
s o.oa $1 1.33 sn.n
s 0 36 s s 0 :Ill
s s 1 41 s 1.09
510 74 I $1074
$ 0 07 ' s 007
' 1.as s ' 1.23
s
l..LW. • 1.01
$ D.13
' s 2.$4
$ 0 .02
Totol O&M
.... S HO
.L...:.. I U O
$
$ D 23
$
$
..... -·it' $ 0.79 $
T01al
S 2 .IO
l..LW. S U I
so b
S OZ>
s 2.64
$ 0 ,02
$ 079
110 ll S10.U S $ 2.111 S 2 IO
$ o.os $ s oos ' o.os $ • s 005
l ... l l .n I I t1
$ I .II SI U O $!1 H
I D.IS I a· o.e~
S I I.II I Ut
•. - 1~1µ.u '.},2i 'l ··~ .... ,
S D.2:1' ,S ~ ' $ 0.2J , ,,
' so.~ • o.1a
• 537 J..,...;, ~ .i 1 .~ • .! . ~ s 132
• 0.21 $ .ii.,q_2 •
2019 1,.,,,;n• nt en~ ill end..., to potollle w w1lerqu1!11ynolf11fot-- uu•th<l limo I I ZJ S II~~ ~ 0.II' I s o;re
2025·2044 $ 111~ S1US .,..,... •• .If HI $ :U2
2IJ20.2044
Addona (1) plumooor .. Jlltadlon w.D ot 1,0DD Modul& e 20U-
2044
gpm (I @ 1,000 gpm)
} lfdoemod neCtilaty based on posl-202$ ptume condfUo11g end COS't-t:Jenelil tn811$11
$ H7 124.0 1.28.10 $• 1.2i S H2 I 5.10
Mor• A9gr11tJve Remedy
llM--~-..,..-. ~ _.,_
1 GroundWallr Mo .. O'Wlg Ptovr•m
2 COllll8ct •ve (SJ imp•~"' p<1v111 web wllHn IM WV6A to COP munlcipol Jystom
l Two (2) plUmo ooro IX!ndion wells ti 1.0DD gprn u ch
BoHToW
Conlliige11clli• -- .~
Orif and oons(rud five {5) nsw sentlnet 1 monttortng wens
Qu1rterty urrtfnel we.n monJtorfno et twelve 2 {12) mon•o~no wolls on<I ellv•n (1 1) SRP
wells
3 Replace two (2) SRP weRs wtll1 now, ooUocaled ~u wel~
4 Con••d 1lvo (5) prlvO\e wtll• ouukle of V'lll8A 10 COP !TNniCipal •yslem
5 Rep!act RI0·114 w!I~ a n<w UAU pRIOu<:!lon wti!•ldill'<.....ilocelion
6 Continue cpara!lng IWO (2) IWmt oort 1><1rac!lon ,..ds Ill 1,000 gpm eaoh
3• Reinjod 2,000 gpm beal<d waler
Cos! In M,, .... C1pped It lOY'l'
H9lay6:AlclAc1\k 20t4_a71 !5..,.tW...WYeCO'ltT•b\u_l....it:71$3'lOi4
Module C {1 • 1,000 gpm) 2026-2 044
·- ... Modul• A 201•- 2044
-B 2014
Modul1E 2018.2028 (20 t ,ODDgpm)
~
Mo<llileH 202&
ModutsJ 2028-2044
Module F 20JD
Module K 2029
Modu!eG 2019
MO<Mol! 2026-2044
(2@ 1 ,000g~
lllodule C (2.000 gi>nl)
2028-2044
• • r. f ,,. 1~ s ua • U3 11~ # 1 s 2~ ·~! o.~ \ 2.41
-- .u......- -NIA $ . StOS3 $1033 . .. _:! :l.1.'° s uo
NIA $ 0 05 • $ o:os $"0US -r $ D.05
NIA $ S.32 11630 ..!!lA! ~ .!.!a 113,02
• f.11 UI.~ U1 t!, J..W. ·11u1 •.1!!1 --- ,.... ' " noc11u ry baHd on ?OSl·202$ plum•
~
$ o.se $ . '03& s o.t3 $ • 0.1~ condUcn.s - -p,,. necessary ba&OQ •• posl-2025 plume eond~lons
s a 1.49 3 l.f9 $ $ 0.23 $ 0.23
Based on quartttrfy .sanl.lntt well monitoring $ S.31 $ s 5.37 s 1.32 $ $ 1 32 ruuls
81.Stel en quarterly senOM!I we:U mat1lttHirig s om rasutls s . $ 0.D7 s 0.02 s i 0 D2
Imminent chi/Ill• In end use lo potebte llllCI s 1.23 $ . s 1.23 s 0.79 s $ 0.7' w1ler q,u1tly not ftl (:1r i'd.ended uw el 1h1il Line
s S4UD $44.90 $ . s 103 $ 1 OJ } II cleem•d necesn ry based en post-2025
pJume conditions and CO$.t"'ben.e.fit • nifp;is $11 .98 s s.oe SH .02 $ 417 $ 0.79 S UI
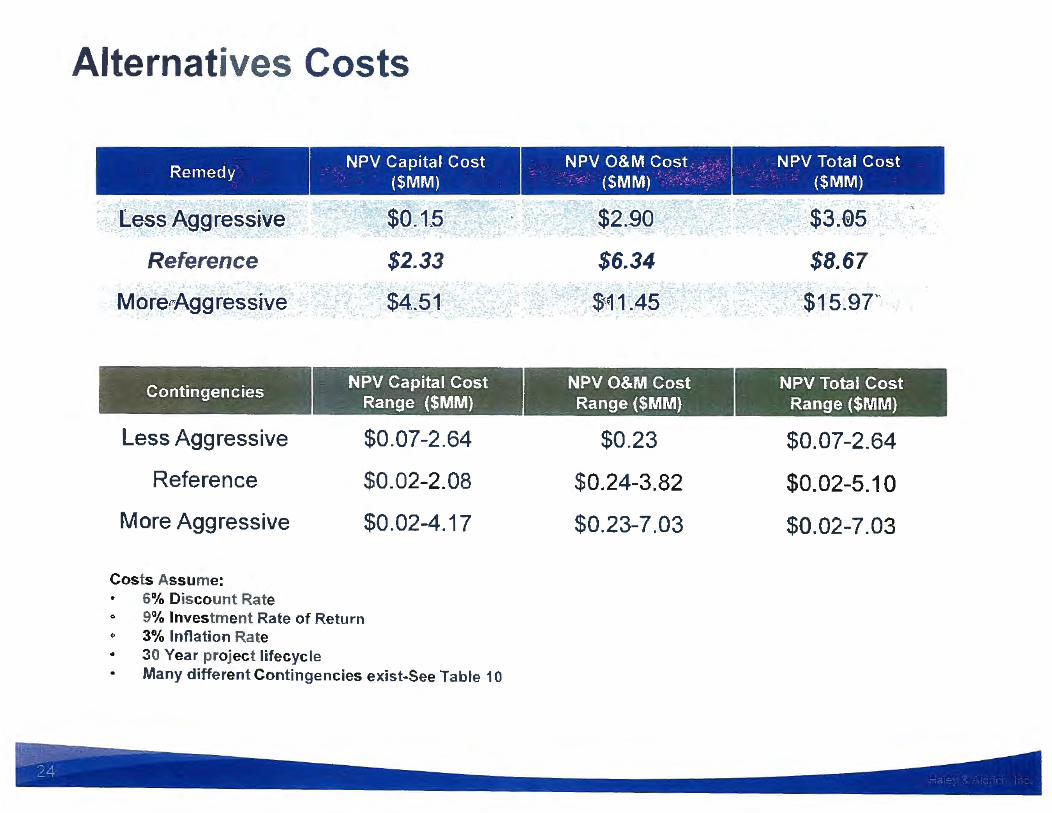
Alternatives Costs
Remedy
less Aggressive
Reference
Marer-Aggressive
Contingencies
Less Aggressive
Reference
More Aggressive
Costs Assume: • 6% Discount Rate
NPV Capital Cost ($MM)
$0.t5
$2.33
$4.51
NPV Capital Cost Range ($MM)
$0.07-2.64
$0.02-2.08
$0.02-4.17
0 9% Investment Rate of Return 0 3% Inflation Rate • 30 Year project lifecyc le
Many different Contingencies exist-See Table 10
NPV O&M Cost .; ($MM) . · · · .
$2.90
$6.34
$~1.45
NPVO&M Cost Range ($MM)
$0.23
$0.24-3.82
$0.23-7.03
NPV Total Cost ($MM)
$3.@S.
$8.67
$15.97"
NPV Total Cost Range ($MM)
$0.07-2.64
$0.02-5.10
$0.02-7.03
DRAFT :FEASIBILITY STUDY REPORrf
July 201 4 West Van Buren Area WQARF Site
Phoenix, Arizona
Prepared for: Arizona Department of Environmental Quality
On behalf of: Roosevelt Irrigation District
Prepared by: Synergy Environmental
and
Montgomery & Associates
e MONTGOMERY fall" & ASSOCIATES
. _ _)
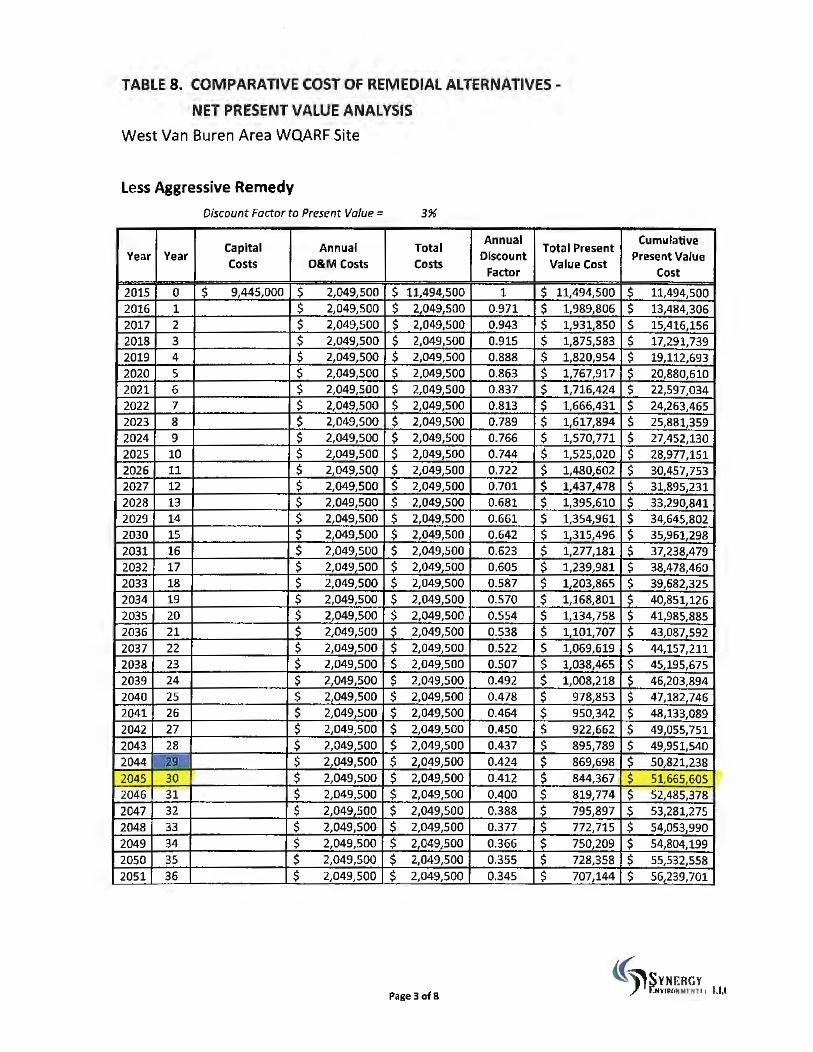
TABLE 8. COMPARATIVE COST OF REMEDIAL ALTERNATIVES -
NET PRESENT VALUE ANALYSIS
West Van Buren Area WQARF Site
Less Aggressive Remedy
Discount Factor to Present Value = 3%
Capital Annual Total Annual
Total Present Year Year Discount
Costs O&M Costs Costs Factor
Value Cost
2015 0 $ 9,445,000 $ 2,049,500 $ 11,494,500 1 $ 11,494,500 2016 1 $ 2,049,500 $ 2,049,500 0.971 $ 1,989,806 2017 2 $ 2,049,500 s 2,049,500 0.943 $ 1,931,850 2018 3 $ 2,049,500 $ 2,049,500 0.915 $ 1,875,583 2019 4 $ 2,049,500 $ 2,049,500 0.888 $ 1,820,954 2020 5 s 2,049,500 s 2,049,500 0.863 $ 1,767,917 2021 6 $ 2,049,500 $ 2,049,500 0.837 $ 1,716,424 2022 7 $ 2,049,500 $ 2,049,500 0.813 $ 1,666,431 2023 8 $ 2,049,500 $ 2,049,500 0.789 $ 1,617,894 2024 9 $ 2,049,500 $ 2,049,500 0.766 $ 1,570,771 2025 10 $ 2,049,500 $ 2,049,500 0.744 $ 1,525,020 2026 11 $ 2,049,500 $ 2,049,500 0.722 $ 1,480,602 2027 12 $ 2,049,500 $ 2,049,500 0.701 $ 1,437,478 2028 13 $ 2,049,500 $ 2,049,500 0.681 $ 1,395,610 2029 14 $ 2,049,500 $ 2,049,500 0.661 $ 1,354,961 2030 15 $ 2,049,500 $ 2,049,500 0.642 $ 1,315,496 2031 16 $ 2,049,500 $ 2,049,500 0.623 $ 1,277,181 2032 17 $ 2,049,500 $ 2,049,500 0.605 $ 1,239,981 2033 18 $ 2,049,500 $ 2,049,500 0.587 $ 1,203,865 2034 19 $ 2,049,500 $ 2,049,500 0.570 $ 1,168,801 2035 20 $ 2,049,500 $ 2,049,500 0.554 $ 1,134,758 2036 21 $ 2,049,500 $ 2,049,500 0.538 $ 1,101,707 2037 22 $ 2,049,500 $ 2,049,500 0.522 $ 1,069,619 2038 23 $ 2,049,500 $ 2,049,500 0.507 $ 1,038,465 2039 24 $ 2,049,500 $ 2,049,500 0.492 $ 1,008,218 2040 25 $ 2,049,500 $ 2,049,500 0.478 $ 978,853 2041 26 $ 2,049,500 $ 2,049,500 0.464 $ 950,342 2042 27 $ 2,049,500 $ 2,049,500 0.450 $ 922,662 2043 28 $ 2,049,500 $ 2,049,500 0.437 $ 895,789
~ $ 2,049,500 $ 2,049,500 0.424 $ 869,698 2045 30 $ 2,049,500 $ 2,049,500 0.412 $ 844,367 2046 31 $ 2,049,500 $ 2,049,500 0.400 $ 819,774 2047 32 s 2,049,500 $ 2,049,500 0.388 $ 795,897 2048 33 $ 2,049,500 $ 2,049,500 0.377 $ 772,715 2049 34 $ 2,049,500 $ 2,049,500 0.366 $ 750,209 2050 35 $ 2,049,500 $ 2,049,500 0.355 $ 728,358 2051 36 $ 2,049,500 $ 2,049,500 0.345 $ 707,144
Cumulative Present Value
Cost
$ 11,494,500 $ 13,484,306 $ 15,416,156 $ 17,291,739 $ 19,112,693 $ 20,880,610 s 22,597,034 $ 24,263,465 $ 25,881,359 $ 27,452,130 $ 28,977,151 $ 30,457,753 $ 31,895,231 $ 33,290,841 $ 34,645,802 $ 35,961,298 $ 37,238,479 $ 38,478,460 $ 39,682,325 $ 40,851,126 $ 41,985,885 $ 43,087,592 $ 44,157,211 $ 45,195,675 $ 46,203,894 $ 47,182,746 $ 48,133,089 $ 49,055,751 $ 49,951,540 $ 50,821,238 $ 51,665,605 $ 52,485,378 $ 53,281,275 $ 54,053,990 $ 54,804,199 $ 55,532,558 $ 56,239,701
«~~YN~:RGY ./ f...v1PQMMllfUt I.I.I Page3 of8
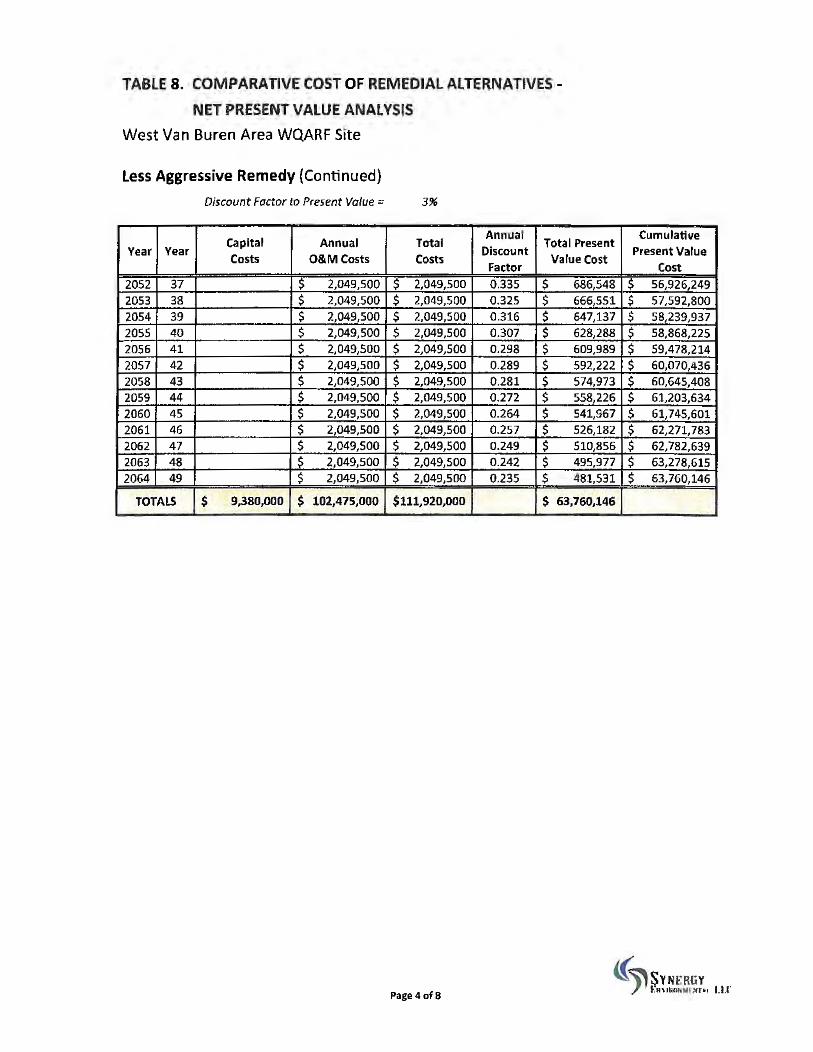
TABLE 8. COMPARATIVE COST OF REMEDIAL ALTERNATIVES -
NET PRESENT VALUE ANAL VSIS
West Van Buren Area WQARF Site
Less Aggressive Remedy (Continued)
Discount Factor to Present Value = 3%
Capital Annual Total Annual
Total Present Vear Year Discount
Costs O&M Costs Costs Factor
Value Cost
2052 37 $ 2,049,500 $ 2,049,500 0.335 $ 686,548 2053 38 $ 2,049,500 $ 2,049,500 0.325 $ 666 551 2054 39 $ 2,049,500 $ 2,049,500 0.316 $ 647,137 2055 40 $ 2,049,500 $ 2,049,500 0 .307 $ 628,288 2056 41 s 2,049,500 $ 2,049,500 0 .298 $ 609,989 2057 42 $ 2,049,500 $ 2,049,500 0.289 $ 592,222 2058 43 $ 2,049,500 $ 2,049,500 0 .281 $ 574,973 2059 44 $ 2,049,500 $ 2,049,500 0.272 $ 558,226 2060 45 $ 2,049,500 $ 2,049,500 0.264 $ 541,967 2061 46 $ 2,049,500 $ 2,049,500 0.257 $ 526,182 2062 47 $ 2,049,500 $ 2,049,500 0.249 $ 510 856 2063 48 $ 2,049,500 $ 2,049,500 0.242 $ 495,977 2064 49 $ 2,049,500 $ 2,049,500 0 .235 $ 481,531
TOTALS $ 9,.380,000 $ 102,475,000 $111,920,000 $ 63,760,146
Paga4of8
Cumulative Present Value
Cost
$ 56,926,249 $ 57,592,800 $ 58,239,937 $ 58,868,225 $ 59,478,214 $ 60,070,436 $ 60,645,408 $ 61,203,634 $ 61,745,601 $ 62,271,783 $ 62,782,639 $ 63,278,615 $ 63,760,146