Embed Size (px)
Citation preview

The copyright of this thesis rests with the University of Cape Town. No
quotation from it or information derived from it is to be published
without full acknowledgement of the source. The thesis is to be used
for private study or non-commercial research purposes only.
Univers
ity of
Cap
e Tow
n

High Speed Flywheel and Test Rig Design for Rural Energy Storage
By Richard Okou
This thesis is submitted to the Department of Electrical Engineering, University of Cape Town, in complete fulfilment of the requirements for the degree of Doctor of
Philosophy
February 2010
Univers
ity O
f Cap
e Tow
n

ii
Declaration I hereby:
(a) Grant the University free license to reproduce the above thesis in whole
or in part, for the purpose of research;
(b) Declare that:
(i) The above thesis is my own unaided work, both in conception and
execution, and that apart from the normal guidance of my supervisor.
Where collaboration with other people has taken place, or material
generated by other researchers is included, the parties and/or
materials are indicated in the acknowledgements or are explicitly
stated with references as appropriate.
(ii) Except as stated below, neither the substance nor any part of the
thesis has been submitted in the past, or is being, or is to be submitted
for a degree at this University or any other University.
(iii) I am now presenting the thesis for examination for the Degree of
PhD.
Richard Okou Date
Univers
ity O
f Cap
e Tow
n

iii
To Dad (Rtd Dr), Mum
(MP) and the entire Otim
Family
For all the sacrifice, love and encouragement.
Univers
ity O
f Cap
e Tow
n

iv
Acknowledgements Firstly, I would like to thank the almighty Lord God for giving me life and
protecting me throughout my time. There is truly nothing impossible with the Lord
and his son Jesus Christ by your side.
Special thanks to my loving mother Mrs. Dorothy Otim (Sr. MP) and loving father,
Dr. (Rtd) Charles Peter Otim for your consistent encouragement, love and sacrifice
over the years. You are the best parents anyone would ever wish for.
My sincere thanks to my thesis supervisors, Professor Pragasen Pillay, Dr.
Mohamed Azeem Khan and Dr. Paul Stanley Barendse for the high level guidance,
advice and financial support throughout my studies.
I am indebted to Dr. Dave Johnson, Mr. Guan Rui, Mr. Gomezyani Mwaba and Mr.
Michel Nlandu for laying the foundation to this work. Special thanks are extended to
Dr. Ben Sebitosi and Dr. Marubini Manyage for the encouragement and in depth
insight into this research.
I am also grateful for the support received from Mr. Chris Wozniak, Mrs. Marlene
Joubert and Mr. Philip Titus, thank you so much. To my colleagues and friends
Barbara Herndler, John Wanjiku, Ashwill, Stefan Sager and Jaffer Abu baker,
thanks for consistent assistance in the laboratory.
My sincere thanks to my friends Diana Nakkazi, Jerry Oluk, Stephen Kinara, Julio
Sebanenya, Milton Edimu, Mao Amis, Justin Masuka, Josephine Nakato, Sara
Kabahuma, Raymond Mugwanya, Nalongo, Gladys Kigozi, Fredo, Jojo, Charlie,
Dora and John Kazembe for the support and love. Special thanks to my brothers
from Pallisa, Denis Etyono, John Okoboi, Abdallah, Omadang, Obelle, Jomo
Erugudo, Simon Okanya, Engineer, Joshua and Tom.
Univers
ity O
f Cap
e Tow
n

v
I am indebted to the CAP family, for all the derailing and the special memories but
most importantly your comfort and love. You brought Pallisa so close to Cape
Town! Thank you so much!
To the Otim family Kernan, Keroy, Elaine, Emma, Baraka, Ps. Arot, Charles, Karla,
Rachel, Jane, Charles and Jemimah. I could not have done this without your support,
encouragement and sacrifice. You are the best family anyone would love to have and
cherish. Thank you for the prayers, I love you all.
Finally to the Tatas, Mamei Keda Nu Ija Kere, you always listened and welcomed
me to your homes and loved me like your own. I thank you and Yalama Ailip.
May the Almighty Lord bless you all.
Univers
ity O
f Cap
e Tow
n

vi
Abstract There is considerable growth in the renewable energy sector to contribute to
sustainable development, environmental conservation and most importantly to
provide affordable energy to isolated rural communities of sub-Saharan Africa.
Renewable energy sources such as solar and wind require energy storage since the
source of energy is intermittent. Electrochemical batteries especially from lead acid
are commonly used to store energy in Solar Home Systems (SHS) for rural
electrification in sub-Saharan Africa. Disadvantages such as low efficiencies, low
life cycle costs, high maintenance, comparatively short life and serious
environmental and human toxicity effects exist. Since recycling is not widespread,
replacement costs are high, as are the resultant environmental damage and health
hazards from lead and sulphuric acid. In this thesis, an electromechanical flywheel
energy storage device is proposed as an alternative to a lead acid battery in order to
increase efficiency, life expectancy, increased high depth of discharge, low life cycle
cost and elimination of adverse environmental effects.
Due to income and service skill constraints in rural areas, the proposed, high speed
flywheel systems (for long time energy storage) will require the use of low cost
configurations and topologies, special considerations on the flywheel rotor profile
design, robust electrical machines, simple power electronics and a low cost bearing
set. Low loss magnetic bearings are also possible but were limited by time while
also making their maintenance complex especially in rural areas.
Conventional high strength composite materials used in flywheel rotor manufacture
for high speed operation are expensive. Therefore there is a need to develop
techniques to profile the rotor shape so as to improve on material usage and exhibit
lower mechanical stresses. A robust electrical machine topology for high speed
operation and a simple drive system are investigated to ensure simple assembly, low
cost and low maintenance.
Univers
ity O
f Cap
e Tow
n
vii
The various flywheel components were designed using analytical and numerical
methods. Two techniques were used to develop two optimal profiles for the flywheel
rotor structure. Partial differential equations and analytical solutions were employed
to develop the profiles. Analytical equations were used to design the electrical
machine, drive, bearing system and other accessories. The final electromechanical
battery prototype consisted of a composite flywheel rotor made from E-glass fibre
materials, double rotor Axial Flux Permanent Magnet (AFPM) machine and a drive
system using Brushless DC (BLDC) mode of operation. The system was designed
for 300Wh of energy storage for the delivery of 100W and 500W of power and an
operating speed range of 8,000 rpm-25,000 rpm.
The design and development of the flywheel energy storage system and test rig
using locally available materials was investigated. Experiments were conducted for
speeds up to 6,000 rpm. The electromechanical battery was able to store a maximum
of 77Wh of energy. The shortfall of the system to meet its design specifications was
investigated and found to have been caused by vibrations resulting from prototyping
issues. A thermal model was developed to predict the temperature rise in the system
which showed a good correlation with the experimental results.
Univers
ity O
f Cap
e Tow
n

viii
Table of contents
DECLARATION ...................................................................................................... II
ACKNOWLEDGEMENTS .................................................................................... IV
ABSTRACT ............................................................................................................. VI
TABLE OF CONTENTS ..................................................................................... VIII
LIST OF FIGURES .............................................................................................. XII
LIST OF TABLES ............................................................................................... XVI
LIST OF ABBREVIATIONS ........................................................................... XVII
CHAPTER 1: INTRODUCTION ............................................................................ 1
1.1 BACKGROUND .................................................................................................. 1 1.2 BRIEF LITERATURE SURVEY ............................................................................ 4
1.2.1 Flywheel Rotor Configurations ............................................................... 5 1.2.2 Flywheel Rotor Profile ............................................................................ 6 1.2.3 Electrical Motor/Generator ..................................................................... 7 1.2.4 Bearing System ....................................................................................... 8 1.2.5 Power Electronics.................................................................................. 10
1.3 RESEARCH QUESTIONS AND OBJECTIVES ....................................................... 11 1.4 JUSTIFICATION ............................................................................................... 12 1.5 STRUCTURE OF THE THESIS ............................................................................ 13 1.6 CONCLUDING REMARKS ................................................................................. 13 1.7 REFERENCES .................................................................................................. 13
CHAPTER 2: SYSTEM DESCRIPTION AND COMPONENTS ..................... 19
2.1 SYSTEM DESCRIPTION .................................................................................... 19 2.2 PERMANENT MAGNET MACHINES .................................................................. 21 2.3 AXIAL-FLUX PERMANENT MAGNET MACHINE .............................................. 24
2.3.1 Different Combinations of AFPM ........................................................ 25 2.3.2 Comparison of the Permanent magnet Brushless AC and DC Machine28 2.3.3 Mathematical Model of the BLDC ....................................................... 29 2.3.4 Mechanical Design Considerations ....................................................... 30 2.3.5 Electrical Considerations ...................................................................... 31 2.3.6 Stator Windings Design ........................................................................ 32 2.3.7 Armature Reaction ................................................................................ 34
2.4 BLDC MACHINE LOSSES ............................................................................... 35 2.4.1 Copper Loss .......................................................................................... 35
Univers
ity O
f Cap
e Tow
n

ix
2.4.2 Core Loss .............................................................................................. 36 2.4.3 Eddy Current Loss ................................................................................ 36
2.5 POWER ELECTRONICS .................................................................................... 37 2.6 OPERATING MODES ........................................................................................ 38
2.6.1 Flywheel Start Up Mode of Operation .................................................. 38 2.6.2 Motoring Mode of Operation ................................................................ 38 2.6.3 Generating Mode of Operation ............................................................. 39 2.6.4 Free Spinning Mode of Operation ........................................................ 39
2.7 DC-DC CONVERTER ...................................................................................... 39 2.7.1 DC-DC Converter Topologies .............................................................. 40 2.7.2 Choice of DC-DC Converter Topology ................................................ 46 2.7.3 Sizing of Components ........................................................................... 47 2.7.4 DC/DC Converter Simulation ............................................................... 52
2.8 BLDC CONVERTER AND ENCODER DESIGN ................................................... 54 2.8.1 Rotor Position Measurement Using Hall Sensors ................................. 56 2.8.2 Rotor Position Using Back EMF Sensing ............................................. 57 2.8.3 BLDC Converter Simulation ................................................................ 57
2.9 FLYWHEEL DRIVE SYSTEM SIMULATION ....................................................... 59 2.10 PRACTICAL DRIVE SYSTEM ......................................................................... 62 2.11 CONCLUDING REMARKS ............................................................................. 63 2.12 REFERENCES .............................................................................................. 63
CHAPTER 3: FLYWHEEL ROTOR DESIGN ................................................... 67
3.1 FLYWHEEL ROTOR CONFIGURATIONS ............................................................ 67 3.1.1 Inside-Out Configuration ...................................................................... 67 3.1.2 Conventional Configuration .................................................................. 71
3.2 CHOICE OF FLYWHEEL ROTOR MATERIAL ..................................................... 73 3.3 FLYWHEEL ROTOR PROFILE ........................................................................... 74 3.4 OPTIMAL DESIGN OF A ROTATING DISK -ULTIMATE SHAPE ........................... 75
3.4.1 Description of Flywheel Rotor Profile .................................................. 77 3.4.2 A General Exact Optimal Shapes .......................................................... 79 3.4.3 The Optimum Design Problem ............................................................. 82 3.4.4 Optimal Shape for High-Speed Operation ............................................ 82
3.5 HYPERBOLIC APPROACH ................................................................................ 84 3.5.1 Design Literature ................................................................................... 85 3.5.2 Application of the Technique to Flywheel Design ............................... 88
3.6 MODAL ANALYSIS ......................................................................................... 89 3.6.1 Analytical Approach ............................................................................. 90 3.6.2 Numerical Approach Using ANSYS .................................................... 91 3.6.3 Profile One Results ............................................................................... 92 3.6.4 Profile Two Results ............................................................................... 93
Univers
ity O
f Cap
e Tow
n

x
3.7 NUMERICAL STRESS ANALYSIS ...................................................................... 95 3.7.1 Profile One Stress Analysis Results ...................................................... 99 3.7.2 Profile Two Stress Analysis Results ................................................... 101
3.8 ANALYSIS OF PROFILE TWO WITH MODIFICATIONS ..................................... 103 3.8.1 Numerical Stress Analysis .................................................................. 104 3.8.2 Numerical Modal Analysis ................................................................. 107
3.9 CONCLUDING REMARKS ............................................................................... 109 3.10 REFERENCES ............................................................................................ 109
CHAPTER 4: PROTOTYPING OF SYSTEM COMPONENTS .................... 113
4.1 INTRODUCTION............................................................................................. 113 4.2 FLYWHEEL ROTOR CONSTRUCTION ............................................................. 113
4.2.1 Development of the Cast Flywheel Rotor ........................................... 115 4.2.2 Development of the Layered Flywheel Rotor ..................................... 121 4.2.3 Static and Dynamic Balancing ............................................................ 122 4.2.4 Comparison of Casting and Layered Manufacturing Techniques....... 125
4.3 ELECTRICAL MACHINE CONSTRUCTION ....................................................... 125 4.3.1 Rotor Disks ......................................................................................... 125 4.3.2 Stator Windings ................................................................................... 127 4.3.2 Stator Holding Structure ..................................................................... 128
4.4 ASSEMBLY OF FLYWHEEL SYSTEM .............................................................. 129 4.5 CONCLUDING REMARKS ............................................................................... 130 4.8 REFERENCES ................................................................................................ 130
CHAPTER 5: TEST RIG DESIGN AND THERMAL ANALYSIS OF THE
FLYWHEEL SYSTEM ........................................................................................ 133
5.1 DESIGN OF TEST RIG AND CONTAINMENT STRUCTURE ................................ 133 5.1.1 Need for a Flexible and Safe Test Rig ................................................ 134 5.1.2 Design of the Burst Containment for the Test Rig .............................. 135 5.1.3 Mechanical Specifications .................................................................. 138 5.1.4 Flywheel Rotor Testing Specifications ............................................... 140 5.1.5 Electrical Machine Test Specifications ............................................... 142 5.1.6 Drive System Specifications ............................................................... 143 5.1.7 Thermal, Bearing and Vacuum Specifications.................................... 145
5.2 MODAL ANALYSIS OF TEST RIG ................................................................... 146 5.2.1 Free Vibration Analysis ...................................................................... 148 5.2.2 Pre-Stressed Modal Analysis .............................................................. 149
5.3 THERMAL ANALYSIS .................................................................................... 150 5.3.1 Heat Sources........................................................................................ 151 5.3.2 Heat Transfer ....................................................................................... 157 5.3.3 Thermal Equivalent Circuit ................................................................. 160
Univers
ity O
f Cap
e Tow
n

xi
5.3.4 Thermal Parameters ............................................................................ 161 5.3.5 Simulation Results .............................................................................. 164
5.4 CONCLUDING REMARKS ............................................................................... 166 5.5 REFERENCES ................................................................................................ 166
CHAPTER 6: EXPERIMENTAL RESULTS .................................................... 169
6.1 RESULTS OF FLYWHEEL SYSTEM WITH 100 W MACHINE .............................. 169 6.1.1 Rated Current at 10A .......................................................................... 170 6.1.2 Over-Load at 30A ............................................................................... 171
6.2 RESULTS OF FLYWHEEL SYSTEM WITH MODIFICATIONS .............................. 173 6.2.1 Rundown Curve .................................................................................. 175 6.2.2 Flywheel System Efficiency ............................................................... 176 6.2.3 Thermal Results .................................................................................. 178
6.3 CONCLUDING REMARKS ............................................................................... 181
CHAPTER 7: CONCLUSIONS AND RECOMMENDATIONS ..................... 182
7.1 CONCLUSIONS .............................................................................................. 182 7.1.1 Findings Based on Experimental Results ............................................ 184 7.1.2 Limitations of the Flywheel Prototype ................................................ 187
7.2 RECOMMENDATIONS .................................................................................... 188
APPENDICES ....................................................................................................... 190
APPENDIX A: PUBLICATIONS ................................................................................ 190 APPENDIX B: NUMERICAL STRESS ANALYSIS ....................................................... 196
Univers
ity O
f Cap
e Tow
n

xii
List of Figures Figure 2.1: General schematic of flywheel system ................................................... 19
Figure 2.2: Inner rotor radial flux machine ............................................................... 22
Figure 2.3: Double rotor machine topology [Source: Lipo] ..................................... 23
Figure 2.4: Double rotor axial flux machine [Source: Lipo] .................................... 23
Figure 2.5: AFPM configuration combinations ........................................................ 25
Figure 2.6a: NN configuration Figure 2.6b: NS configuration ............................ 27
Figure 2.7: General schematic of the power electronics ........................................... 37
Figure 2.8: Buck Converter ....................................................................................... 41
Figure 2.9: Boost Converter ...................................................................................... 41
Figure 2.10: Voltage gain curve for boost converter ................................................ 42
Figure 2.11: Tapped inductor converter .................................................................... 43
Figure 2.12: Voltage gain curves for tapped inductor converter .............................. 44
Figure 2.13: Bidirectional synchronous buck-boost converter ................................. 44
Figure 2.14: Bidirectional synchronous DC-DC converter with resonant capacitors45
Figure 2.15: Topology that was implemented for the DC-DC converter ................. 47
Figure 2.16: MOSFET driver circuit for DC-DC converter (change picture) .......... 52
Figure 2.17: Buck mode of DC-DC Converter ......................................................... 53
Figure 2.18: Boost mode of DC-Dc Converter ......................................................... 53
Figure 2.19: Buck mode of DC-DC Converter in when generating ......................... 54
Figure 2.20: BLDC Inverter ...................................................................................... 55
Figure 2.21: Start up and motor mode of operation .................................................. 58
Figure 2.22: Generating mode of operation .............................................................. 59
Figure 2.23: Start-up and motor mode of operation .................................................. 60
Figure 2.24: Output Voltage for start-up and motor mode of operation ................... 60
Figure 2.25: Generator mode of operation ................................................................ 61
Figure 2.26: DC voltage at terminals of BLDC drive for generator mode of operation
................................................................................................................................... 61
Figure 2.27: Consumer voltage for generator mode of operation ............................. 62
Univers
ity O
f Cap
e Tow
n

xiii
Figure 2.28: Practical drive system ........................................................................... 62
Figure 3.1: Inside out design ..................................................................................... 68
Figure 3.2: Levitating system .................................................................................... 68
Figure 3.2: Levitating and stationary parts ............................................................... 69
Figure 3.3: Conventional configuration .................................................................... 72
Figure 3.4: Five shapes used to derive the ultimate shape ........................................ 76
Figure 3.5: Optimal shape for medium speed with five basic shapes ....................... 79
Figure 3.7: Optimal flywheel profile for 25,000 rpm ............................................... 84
Figure 3.8: 3-D view of flywheel profile .................................................................. 89
Figure 3.10: Modal analysis results .......................................................................... 92
Figure 3.11: FE results .............................................................................................. 93
Figure 3.12: Analytical results of the critical speed for hyperbolic approach .......... 94
Figure 3.13: FEA results of the first and second natural modes for hyperbolic
approach .................................................................................................................... 94
Figure 3.14: Shear stress distribution on XY plane for profile one ........................ 100
Figure 3.15: Normal stress of profile one ............................................................... 101
Figure 3.16: Normal stress of profile two ............................................................... 102
Figure 3.17: Shear stress distribution of profile two ............................................... 102
Figure 3.18: Profile two with modifications ........................................................... 104
Figure 3.19: maximum shear stress of modified profile two ................................. 105
Figure 3.20: 2D maximum shear stress of modified profile two ............................ 106
Figure 3.21: maximum principal stress of modified profile two ............................ 106
Figure 3.22: Maximum principal stress of modified profile two ............................ 107
Figure 3.23: Free vibration total deformation at 232.58HZ .................................... 108
Figure 3.24: pre-stressed total deformation at 369.72HZ ....................................... 108
Figure 4.1: Stress distribution over a short fibre ..................................................... 115
Figure 4.2: Hyperbolic profile mould ..................................................................... 118
Figure 4.3: Optimal profile mould .......................................................................... 118
Figure 4.4: Failed manufacture of optimal shape.................................................... 119
Figure 4.5: Optimal shape after completion without central hole ........................... 119
Figure 4.6: Hyperbolic profile after manufacture with shaft .................................. 120
Univers
ity O
f Cap
e Tow
n

xiv
Figure 4.7: Six parts of hyperbolic profile for easy manufacture ........................... 121
Figure 4.8: Complete hyperbolic profile using layered technique .......................... 122
Figure 4.9: Flywheel with shaft being balanced ..................................................... 124
Figure 4.10: Rotor disks with PM and reinforced sleeve ........................................ 126
Figure 4.12: Comparison between two stators ........................................................ 128
Figure 5.1: Failure of isotropic flywheel (Source: Genta) ...................................... 136
Figure 5.2: Transformation of old pipe to containment .......................................... 138
Figure 5.3: Test rig structure. ................................................................................. 139
Figure 5.4: Tee and base plates as viewed from above. ......................................... 139
Figure 5.5: High speed test rig ................................................................................ 140
Figure 5.6: Containment structure limits with accessories. .................................... 141
Figure 5.7: 500W electrical machine for flywheel testing. ..................................... 142
Figure 5.8: Schematic of Drive System .................................................................. 144
Figure 5.9: Overall flywheel system ....................................................................... 144
Figure 5.10: Fifth mode shape with displacement .................................................. 148
Figure 5.11: Fifth mode shape with direction of displacement ............................... 148
Figure 5.12: 4th Mode shape at 336.12Hz ............................................................... 149
Figure 5.13: Hybrid bearing losses with speed ....................................................... 153
Figure 5.14: Windage loss model for the flywheel system ..................................... 156
Figure 5.15: Cross section of the flywheel system with loss sources and resistors 160
Figure 5.16: Lumped parameter model of flywheel system ................................... 164
Figure 5.17: Temperature rise at rated current. ....................................................... 165
Figure 5.18: Temperature rise at low load condition .............................................. 165
Figure 5.19: Temperature rise at overload condition .............................................. 166
Figure 6.1: Experimental set up of flywheel system ............................................... 169
Figure 6.2: Speed response at rate power................................................................ 170
Figure 6.3: Line current response at rated power .................................................... 171
Figure 6.4: Speed response at 30A .......................................................................... 172
Figure 6.5: Line current response at 30A ................................................................ 172
Figure 6.6: Flywheel system with modifications .................................................... 173
Figure 6.7: Assembled flywheel system ................................................................. 174
Univers
ity O
f Cap
e Tow
n

xv
Figure 6.8: The acceleration and run down curve of the flywheel system. ............ 175
Figure 6.9: Measured and calculated mechanical losses. ........................................ 176
Figure 6.10: Motor mode efficiency ....................................................................... 177
Figure 6.11: Shows the overall efficiency at 6,000rpm .......................................... 177
Figure 6.12: Calculated stator temperatures............................................................ 178
Figure 6.13: Measured stator temperatures ............................................................. 179
Figure 6.14: Calculated peripheral temperatures .................................................... 180
Figure 6.15: Measured peripheral temperatures...................................................... 180
Univers
ity O
f Cap
e Tow
n

xvi
List of Tables Table 2.1: Stator winding parameters 34
Table 2.2: Various switch states for operation of the synchronous converter in the
four different modes of operation ............................................................................. 45
Table 2.3: Advantages and disadvantages of bi-directional buck/boost DC-DC
converters .................................................................................................................. 46
Table 2.4: Boost converter specifications and component sizes ............................... 48
Table 2.5: Buck converter specifications and component sizes ................................ 49
Table 2.6: Switch Commutation for CW Rotation ................................................... 56
Table 3.1: Specifications of the optimal flywheel .................................................... 83
Table 3.2: Design parameters of profile two ............................................................. 88
Table 3.3: Comparison of analytical and FEA results for profile one ...................... 93
Table 3.4: Comparison of analytical and FEA results for profile two ...................... 95
Table 4.1: shows the balancing results of the flywheel profiles ............................. 124
Table 5.1: Frictional Components of the Bearings ................................................. 145
Table 5.1: Material properties ................................................................................. 162
Table 5.2: Thermal parameters ............................................................................... 163
Univers
ity O
f Cap
e Tow
n

xvii
List of Abbreviations AFPM -Axial Flux Permanent Magnet
BLDC -Brushless Direct Current Machine
CAD -Computer Aided Design
CAES -Compressed Air Energy Storage
CNC -Computer Numerical Controlled
CFCA -Crushing Fragment Containment Analysis
CW -Clockwise
DC -Direct Current
DOF -Degrees of Freedom
EMF -Electro Motive Force
FEA -Finite Element Analysis
FEM -Finite Element Method
HOMER -Hybrid Optimisation Model for Distributed Power
Hz -Hertz
ID -Inner Diameter
MGoe -Mega Gauss Oersteds
MMF -Magneto Motive Force
MPa -Mega Pascal
NASA -Nationals Aeronautics Space Administration
NdFeB -Neodymium Iron Boron
Univers
ity O
f Cap
e Tow
n

xviii
OECD -Organization for Economic Cooperation and Development
OD -Outer Diameter
NREL -National Renewable Energy Lab
PM -Permanent Magnet
PMAC -Permanent Magnet Alternating Current
PWM -Pulse Width Modulation
RFPM -Radial Flux Permanent Magnet
RPM -Revolutions Per Minute
SHS -Solar Home Systems
SKE -Specific Kinetic Energy
USD -United States Dollar
Univers
ity O
f Cap
e Tow
n

Chapter 1
Introduction __________________________________________________________________
This thesis critically evaluates the development of a low cost high speed flywheel
energy storage system for energy applications in rural areas. Detailed analysis of
the flywheel rotor system are clearly described. A design approach of the Axial Flux
Permanent Magnet machine and Brushless DC drive are described. The design of
the test rig is also explained. In this chapter, the background to the research is
given, a review of other energy storage systems is provided, a brief literature review
is compiled and an overview of the thesis is presented.
1.1 Background
There is renewed interest in renewable energy, which is largely attributed to
concerns over increased global energy demand, climate change effects and
continued depletion of conventional energy sources. These conventional sources
account for 79% [1.1] of the total global energy supply. The increased use of
conventional fuels has created a versatile change in climate an aspect linked to
global warming. The global energy demand is projected to grow by 50% from 2005
to 2030 [1.2] and the non Organization for Economic Cooperation and Development
(OECD) countries account for 85%. In addition, this increase can also be attributed
to a large portion of the world’s population not having access to electricity. Two
billion people in the world today lack access to electricity and other modern sources
of energy. In South Africa alone, 66% have access to electricity [1.3] and in the case
of Uganda; only 6% have access to electricity and only 1% from rural areas [1.4],
2% for Zambia and 5% for Kenya and Mali [1.1]. These non-electrified rural areas
in sub-Saharan Africa are usually far away from the grid, are mountainous, or not
Univers
ity O
f Cap
e Tow
n

2
considered economically viable. They are gifted by nature giving rise to renewable
energy resources that can be harnessed to produce electricity from anywhere. This
means, unlike traditional central power generation, some renewable energy can be
generated close to where it is required and massive savings on transmission
infrastructure and power delivery losses can be realized. The intermittent nature of
the resources however, means that power is often generated before or after it is
required [1.5]. Therefore, in order to reliably utilize these resources, suitable energy
storage must be available.
Current energy storage technologies are however, still riddled with various
problems. The lead acid battery, which is extensively used in Sub Saharan Africa in
solar Photovoltaic (PV) cells, for example, is characterized by high maintenance
costs, low depth of discharge, limited number of charge cycles and short life spans.
In addition, the lead acid battery is widely used in rural electrification projects where
environmental waste policies are not enforced making its hazardous waste a
potential threat. Hydropower storage technology on the other hand has high capital
costs and requires adequate water resources with the right geo-terrain. Others
include magnetic storage in superconducting medium but are currently still in its
development stages. Needless to say, energy storage is by far one of the biggest
challenges to the viable exploitation of renewable energy resources. Today, the total
storage capacity worldwide is the equivalent of about 90GW of a total production of
3400 GW, or roughly 2.6% [1.6]. The development of low-cost, long-life storage
systems that are also environmentally friendly will lead to increased potential,
particularly for rural sub-Saharan Africa.
Energy storage systems can be classified as electrical, thermal, magnetic, chemical,
potential and kinetic. The selection criteria of a particular energy storage system is
based on a number of characteristics [1.6]; storage capacity, available power, depth
of discharge, discharge time, efficiency, durability, autonomy, cost, self discharge,
mass, control, reliability and environmental aspects. In a typical rural setting, a
standard small Solar Home Systems (SHS) can operate several lights, a radio and
Univers
ity O
f Cap
e Tow
n

3
charge a phone. This eliminates the need for candles, kerosene, liquid, and battery
charging, and provides improved indoor air quality, safety and better lighting for
reading. Furthermore, savings from constant purchase of these products can be used
for other productive purchases within the household. In addition, energy through
powering radios and TVs can be used to send information related to health,
education etc. The size of the system (typically 10 to 100 W) determines the number
of hours available for a specific load. A typical rural household requires 300Wh
approximately for lighting, radio, phone charging and the possibility of a using a
TV.
An electromechanical battery is a simple machine which stores energy in the form of
rotational motion. Advances in rotor material, power electronics, mechanical
bearings and others have found the flywheel to be a viable replacement of lead acid
batteries [1.6-1.8]. In addition to its predicted long life span, the flywheel is
environmentally friendly as it’s made of largely inert materials. The system exhibits
short charge times and has an unlimited number of discharge cycles. The
maintenance is simple, inexpensive and the systems are usually made compact [1.9].
However, high speed flywheel systems (for long time energy storage) require special
considerations on the rotor profile design, machine parameters and power
electronics. These systems require high strength materials to withstand the stresses
involved. These materials are expensive and as a result various approaches were
used to improve on the material usage whilst increasing on the strength of the rotor.
With this in mind, the flywheel system was built on locally available materials and
other commodity items. A test rig for testing the flywheel system and other system
components was also designed, built and tested using locally available materials.
Univers
ity O
f Cap
e Tow
n

4
1.2 Brief Literature Survey
An initial literature survey was conducted to determine the evolution of the
electromechanical battery and its components through the years. The origins and use
of modern flywheel technology for mechanical energy storage can be traced to
several hundred years ago and was further developed throughout the industrial
revolution. This development was to a large extent as a result of seminal work by
Dr. A. Stodola on the theoretical stress limitations of rotational disks [1.10][1.11],
whose first translation to English was made in 1917.
The development of flywheel for power and vehicle applications started in the 1940s
[1.12]. These systems were constructed with steel rotors, conventional bearings and
only run at low speed. For example, the first commercial gyro bus was constructed
in Switzerland, started operations in 1953 and ended in 1960. The bus carried a large
flywheel that was spun up to 3,000 rpm by an electric motor. The gyro bus was
charged at booms and this took between 30 seconds to 3 minutes. The maximum
distance of the bus was 6 km with a top speed of 60 km/h.
In the 1960s and 1970s, NASA sponsored flywheel programs for space and
stationary applications. However, not until the 80s and 90s with the development of
high strength materials, power electronics and magnetic bearings did renewed
interest in the system occur. Subsequent works by Post [1.5] [1.13], University of
Austin, Beacon Power Corp [1.14] and Trinity [1.15] have seen the flywheel used
for power, attitude control, vehicle and telecommunication back up applications
[1.16]. Various components, configurations and designs are used to ensure proper
operation of the system. For high speed operations, the rotor configuration, rotor
profile, bearing, power electronics and electrical machine are of significant
importance as explained further in the following sections.
Previous work in the research group at University of Cape Town investigated the use
of the electromechanical flywheel to replace the lead acid battery. The system was
Univers
ity O
f Cap
e Tow
n

5
designed to operate at 100,000 rpm and store 300Wh using an outside rotor PM
Halbach array with hybrid magnetic bearings and a heat pipe cooling system.
Special emphasis was placed on implementing the Halbach array, using even and
odd numbers of magnet segments. A passive control hybrid magnetic bearing system
was used to levitate the machine. Two radial repelling magnetic bearings were used
in combination with an axial journal bearing, like a spinning top with the precession
limited by radial magnetic bearings.
An ultimate shape composite flywheel was designed to reach high speeds with high
energy density. This shape incorporated the electric machine and hybrid magnetic
bearing. It was operated in a vacuum, where the machine / bearing system
approached efficiencies in the upper 90s. The flywheel rotor was manufactured from
glass reinforced epoxy. The prototype was hand layered, in stages, to minimize the
heating problem. This process was considered since the stresses are all perpendicular
to the axis of rotation and in the plane of the glass layers. Previous attempts to have
the flywheel made by a local manufacturer in one single piece were futile due to
thermal cracking of the thick parts. The flywheel system was tested up to 120rpm
achieving 1.92 J of energy. The problems encountered with this system included:
vibrations, damping of the bearing system and heat evacuation with the heat pipe.
1.2.1 Flywheel Rotor Configurations
There are mainly three types of rotor configuration described, the inside-out type,
integrated and the conventional design. The first configuration is the barrel or
inside-out type. This design is advantageous when high strength composite fibres are
used. This means the rotor can be spun to high speeds, increasing the stored energy
without increasing the weight. This configuration opens avenues for the use of the
Halbach array machine which can be used in high speed operation and is able to
reach high efficiencies as presented in [1.13] [1.17]. The major disadvantage of this
topology is the dependence of the electrical machine dimensions to the flywheel
rotor design. A change in the machine dimensions requires a change in the flywheel
rotor design. Further, the configuration experiences thermal problems resulting from
Univers
ity O
f Cap
e Tow
n

6
having an embedded machine. Using a heat pipe is a possible solution but further
increases the thermal complexity in design.
The second configuration is an integrated design in which the electromagnetic and
energy storage portions of the rotor are combined as presented in [1.18] [1.19]
[1.20]. This type of design is not well suited for a composite rotor flywheel because
of the need for electromagnetic material for torque production. The argument
brought forth in this design is minimization of the weight of the containment,
reduced material costs, lower mechanical complexity and reduced manufacturing
costs. However, its dependency on steel for torque development in high speed
operation requires high levels of safety and this is attributed to poor failure criteria
of isotropic materials [1.21].
The conventional rotor design is the most common configuration as seen in [1.5]
[1.22] [1.23], where most of the energy is stored in the rotor which is attached to a
shaft used by the motor to spin the flywheel. The shaft connection induces problems
of radial elongation differences at the interface and dynamic instability, which
includes lateral and tilt mode shapes during whirl motion about the axis of rotation
[1.17] [1.24]. These problems can be addressed during the prototyping and assembly
as discussed in chapter 6. The advantage of this configuration is the possibility of
both horizontal and vertical orientation mounting. Furthermore, the machine and
flywheel can be designed independently giving flexibility in the design process.
1.2.2 Flywheel Rotor Profile
Conventional shape profiles have been used widely in rotor design as presented in
[1.5] [1.16] [1.25]. However, the need to optimize on the material usage [1.26] is
motivated by the high cost of high strength materials [1.13]. This is enhanced when
conventional shapes are used since they utilize more material.
In [1.27], the best thickness distribution along the radius of a centrally bored
flywheel is investigated. A simplified model was developed and found not to exhibit
Univers
ity O
f Cap
e Tow
n

7
an even stress shape for a hole radii greater than the square root of one third of the
radius flywheel. Chern [1.28] investigated the optimal design of the rotating disks
with the radial displacement as a prescribed value. David Eby [1.29] discussed the
optimal design of elastic flywheels using injection island genetic algorithm to search
for the shape variations to optimize the specific energy density. The limitation of this
technique is that it’s not implemented with a central hole, making it complex for the
electromechanical flywheel application in this study.
This thesis considers two approaches to the derivation of an optimal shape. Firstly,
the derivations of the novel shape for optimal design of the rotor based on work by
Berger and Porat with a central hole [1.30]. This is done mathematically using
partial differential equations theory, a piecewise differentiable disk built with four
shapes. In [1.26] piecewise optimal shapes are used to create the ultimate shape.
This profile exhibits exponential characteristics and is analysed numerically.
The second approach involves the use of Dr Stodola’s stress solutions for isotropic
material together with solutions by Timoshenko, Hartog [1.31] and Faupel [1.32] to
ascertain a profile that reduces stress. A Matlab program is used to preselect the
profile parameter and inertia is validated using CAD software. This profile exhibits
hyperbolic characteristics.
1.2.3 Electrical Motor/Generator
This component of the flywheel is charged with converting electrical energy to
mechanical energy when charging and vice versa when discharging. Various
machine types have been used since 1970 to date as seen in [1.13] [1.18] [1.23]
[1.33]. The operating speed of the motor/generator sets presented varies from a few
hundred rpm to thousands. For this flywheel application, the choice of the machine
lies in simplicity of construction, cost and consideration on the power electronics.
For example, the conventional induction machines suffer high rotor losses which are
undesirable in low air pressure environments.
Univers
ity O
f Cap
e Tow
n

8
The synchronous reluctance motor has previously been used in flywheels however
acquiring a high Ld/Lq ratio during construction is complex leading to increased cost
due to high VA rating requirement [1.34]. Switched reluctance motors have high
torque density, are simple to construct and are cheap but use of a laminated rotor is
not suitable and high strength material is necessary for this application. The homo-
polar machines are not widely used for flywheel applications, however in [1.18] a
machine was designed for a high speed flywheel with an efficiency of 83%.
Klaus Halbach, a scientist at Lawrence Livermore laboratory conducted research on
permanent magnets for use in particle accelerators and further discovered its usage
in high power, high efficiency machines called the Halbach arrays [1.35]. His paper
[1.36] describes the novel approach in generating multi-pole magnetic fields
arrangement of PMs. In the 90s, Post [1.13] further developed this for use in
motor/generator designs. Other designs have since been built as seen in [1.13] [1.17]
with efficiencies of up to 99% and 90% respectively. This particular machine
exhibits high power density, low losses due to ironless stator core and a high
electromagnetic field within the bore.
Permanent Magnet (PM) motors are currently the most commonly used motors for
flywheel systems as seen in [1.25] [1.37-1.39]. They exhibit high efficiency and low
rotor losses, however, they are temperature sensitive. This can be overcome by the
use of temperature resistant magnets and evaluation of the heat flow. From
investigations discussed in chapter two, an Axial Flux Permanent Magnet (AFPM)
machine was selected.
1.2.4 Bearing System
The bearings are used to constrain relative motion of the flywheel system. This
allows for free rotation of the system. The demand on stationary applications is less
rigorous than that for mobile applications; however some of the issues that transcend
both applications are dynamic load, residual balance, high speeds and the life time of
the bearing system. Bearings are classified as either conventional or magnetic.
Univers
ity O
f Cap
e Tow
n

9
1.2.4.1 Conventional Bearings
These are contact bearings and provide support in either the axial or radial planes.
The common types of these bearings are: rolling element and journal bearings. A
widely used rolling element bearing type is the deep groove bearings. In this
application, hybrid and energy efficient bearings were considered. These hybrid and
energy efficient bearings have a higher speed capability and will provide longer
service life than all-steel bearings in most applications. Other successful bearings for
high speed applications are the high precision angular contact ball bearings with
axial preloading. In these systems, the preloading should be adjusted to its minimum
so as to minimize frictional loss, increase the speed limit and control the bearing
stiffness. The major advantage of the conventional bearings is the low cost and
simplicity of handling.
Conventional bearings are specifically relevant to rural applications as replacement
is made easier. They ensure quick and ease of assembly making them achievable in
the rural areas. With bearing manufacturers moving towards energy efficiency, more
efficient contact bearings will see a further reduction in cost.
1.2.4.2 Magnetic Bearings
Magnetic bearings are non contact bearings and hence exhibit low friction, low wear
and are well suited for high speed operation [1.13] [1.17] [1.23]. Magnetic bearing
advantages include very low and predictable friction, ability to run without
lubrication and in a vacuum. They also provide cleaner, faster and more efficient
bearings at extreme temperatures [1.40]. The main disadvantages include high cost
and relatively large size. There are different types of magnetic bearings currently
being tested, i.e. passive magnetic bearings and the active magnetic bearings [1.10]
[1.41-1.43].
The active magnetic bearings require control hardware, digital signal processors,
amplifiers, digital to analog converters, analog to digital converters and software
[1.41 - 1.44]. In addition, the control current of the system is proportional to the
Univers
ity O
f Cap
e Tow
n
10
stator rotor gap. On the other hand, the passive systems do not require any control.
These bearings are constructed from PMs, electrodynamic effects, super conductors,
diamagnetic materials and ferro fluids. It is difficult to build a magnetic bearing
using permanent magnets due to the limitations imposed by Earnshaw's theorem,
and techniques using diamagnetic materials, in the past were relatively undeveloped.
Nevertheless, passive magnetic bearings exhibit advantages, that is, larger rotor-
stator gaps may be possible since the current for active magnetic bearings is
proportional to the square of the rotor-stator gap.
The major disadvantage of passive magnetic bearing systems is the low stiffness and
damping and so in designing, sufficient stiffness and damping must be built in to
allow them to perform over their entire operating range. In selecting the type of
bearings to use, complexity and cost are major issues. It can be noted that passive
magnetic bearings are easier to construct and are more cost effective than active
magnetic bearings as they require a simpler control system.
The passive magnetic bearings have a high potential because they are economically
viable, reliable and practical. Passive systems have already replaced some active
magnetic bearings, predominantly in situations where, smaller sized equipment
systems with large air gaps are used. Combinations of superconductor and PM
bearings have been tested in flywheel applications whereby efficiencies of up to
84% have been recorded. High temperature superconducting magnetic bearings have
been found to perform best, however, these require cryogenic cooling by liquid
nitrogen [1.10] [1.43].
1.2.5 Power Electronics
The power electronics mainly include the drive, DC-DC converter and the control
system. Brushless DC mode of operation was chosen due to its simplicity in design
and operation, low cost and availability of the system components.
Univers
ity O
f Cap
e Tow
n

11
1.3 Research Questions and Objectives
The main research question associated with this research project is:
"Can an efficient, low cost flywheel energy storage system be manufactured with
consideration given to the structural integrity of the rotor component, optimised
material usage and use of locally available materials?”
This question will be addressed through detailed consideration of each of the
following secondary research questions:
• What are the past and current technological trends in flywheel energy
storage systems?
• Which component configurations are best suited for efficient, safe, robust
low cost flywheel energy storage applications?
• Which considerations in the flywheel rotor configuration and profile in
stress, modal and thermal analyses will ensure structural integrity of the
complete system? This will be done analytically, numerically and
experimentally.
• Which electric machine topology is best suited for this application?
• What considerations will be made to increase the energy stored in the
flywheel while keeping the flywheel safe, cheap and robust?
• What test rig facility will be considered for testing the flywheel system?
The main objective of this research is to design and develop an efficient, robust
flywheel system.
The specific objectives of this research include the following:
• Identifying the past and current technological trends in flywheel energy
storage systems.
Univers
ity O
f Cap
e Tow
n

12
• Investigating the component configurations best suited for this
application.
• Critically evaluating the identified flywheel rotor configurations and
profile procedure for material optimisation.
• Identifying and assessing the most suitable bearing set for the flywheel
system.
• Evaluating the electric machine topologies for the system.
• Prototyping and integrating the various components of the system.
• Identifying and improving on the design trade-offs encountered when
integrating the complete system.
• Developing a test rig for flywheel system testing.
1.4 Justification
A comparison was carried out between the life cycle costs of the traditional lead acid
battery storage system and a proposed electromechanical flywheel battery for a rural
energy storage application, using two different models. The flywheel system was
found to be more cost effective in the long run than the traditional lead acid battery.
It was evident that small-scale flywheel energy storage has the potential to improve
rural electrification problems. Integrating the flywheel system into SHSs would
mean a saving of 35% per kWh with rural systems. The use of electromechanical
flywheel battery storage would further mitigate the environmental problems
associated with lead acid battery disposal. These systems can also be used in health
centres; schools and telecommunications base stations as they fall within the
power/energy range. In addition, money that would have been used on maintenance
and replacement on the traditional lead acid batteries can now be used for more
productive activities like education, health, food and other basic household needs
hence addressing the United Nations Millennium Development Goals, which
includes eradication of poverty among others.
Univers
ity O
f Cap
e Tow
n

13
A simulation program, HOMER (NREL, 2007) was used to validate the results. The
levelized cost of energy for the system using batteries as energy storage was found
to be $ USD1.611 and for the flywheel was $USD 1.368.
1.5 Structure of the Thesis
Chapter two considers the flywheel system components namely the electrical
machine and the power electronics. In chapter three, analytical methods are used to
develop two flywheel profiles. Chapter four analyses the prototyping of the different
system components. The test rig design, prototyping and thermal analysis of the
flywheel system are discussed in chapter five. The experimental results are discussed
in chapter six. Conclusions and recommendations are finally drawn in chapter 7.
1.6 Concluding Remarks
This introduction chapter gives an overview of energy storage technologies. The
motivation for better energy storage systems is highlighted. A brief literature is
given for the various components used in the flywheel system. The main objectives
this thesis seeks to answer are mentioned. The following chapters give a step by step
process of how the flywheel system was designed, prototyped and tested.
1.7 References
[1.1] E. Martinot, Global status report, Renewable, 2007.
[1.2] International energy outlook, DOE/EIA-0484, June 2008.
[1.3] H. Winkler, "Renewable energy policy in South Africa: Policy options for
renewable electricity," Energy Policy, vol. 33, pp. 27-38, 2005.
Univers
ity O
f Cap
e Tow
n

14
[1.4] G. Kamese, Renewable Energies in Uganda, March 2004.
[1.5] R. F. Post, "A New Look at an Old Idea," Electromechanical battery Science
and Technology Review, pp. 13-19, April 1996.
[1.6] H. Ibrahim, A. Ilinca and J. Perron, "Energy storage systems—
Characteristics and comparisons," Renew Sustain Energy Rev,
doi:10.1016/j.rser.2007.01.023.
[1.7] J. Tzeng, R. Emerson and R. Moy, "Composite Flywheels for energy
storage," Science and Technology, vol. 66, pp. 2520-2527, 2006.
[1.8] US Department of Energy, Federal Technology Alert, DOE/EE-0286, 2003.
[1.9] G. Genta, Kinetic energy storage, Theory and practice of advanced flywheel
systems, Butterworth & Co. Ltd, 1985.
[1.10] J. G. Bitterly, "Flywheel technology, Past, Present, and 21St Century
Projections," in Proc.1997 IECEC Energy Conversion Engineering
Conference, vol.4, pp. 2312-2315.
[1.11] A. Stodola, Steam and Gas Turbines, McGraw-Hill Book Company, Inc,
1927.
[1.12] The Oerlikon Electrogyro, Automobile Engineer, pp. 559-566, Dec 1955.
[1.13] R. F. Post, T. K. Fowler and S. F. Post, "A high efficiency
electromechanical battery," Proceedings of the IEEE, 81(3), March 1993.
[1.14] http://www.beaconpower.com/ Last checked 20th October, 2009.
Univers
ity O
f Cap
e Tow
n

15
[1.15] D. Bender, R. O. Barlett, "Improved high performance flywheels," DOE
Energy Storage Systems Annual Review, November 19-20, 2002.
[1.16] S. Ginter, G. Gisler, J. Hanks, D. Havenhill, W. Robinson and L. Spina,
"Spacecraft energy storage systems," NAECON, 1997.
[1.17] T. M. Mulcahy, J. R. Hull, K. L. Uherka, R. G Abboud and John J Juna,
"Test results of 2-kWh flywheel using passive PM and HTS bearings," IEEE
transactions on applied superconductivity, 11(1), March 2001.
[1.18] P.I. Tsao, "An integrated flywheel energy storage system with a homopolar
Induction motor/generator and high frequency drive," Ph.D. dissertation,
University of California Berkeley, 2003.
[1.19] S. Richey, "Cleansource2 battery –free energy storage: theory of operation,"
Electrical energy storage systems applications and technologies (EESAT)
conference proceedings, 2002.
[1.20] P. P. Acarnley, B.C. Mecrow, J.S. Burdess, J.N. Fawcett, P.G. Dickinson
and Kelly, J.G, "An integrated flywheel/machine energy store for road
vehicles," IEE In colloquium on new topologies for permanent magnet
machines, vol. 090, pp. 1-6, August 2002.
[1.21] J. Widmer, P. V. Burg, Failure of tangentially wound composite energy
storage flywheels, unpublished.
[1.22] K. Murakami, M. Komori, H. Mitsuda and A. Inoue, "Design of an energy
storage flywheel system using permanent magnet bearing (PMB) and
superconducting magnetic bearing (SMB)," Cryogenics, vol. 47, pp. 272-
277, 2007.
Univers
ity O
f Cap
e Tow
n

16
[1.23] G. G. Sotelo, R.D. Andrade Jr, Antonio Carlos Ferreira, "Magnetic bearing
sets for a flywheel system," IEEE transactions on applied superconductivity,
vol.17 (2 ), June 2007.
[1.24] F.J.M. Thoolen, "Development of an Advanced High speed
Flywheel for Energy Storage System," Ph.D. dissertaion, Eindhoven
University of Technology, 1993.
[1.25] F.N. Werfel, U. Floegel-Delor, T. Riedel, R. Rothfeld, D. Wippich, B.
Goebel, G. Reiner, and N. Wehlau, "A compact HTS 5 kWh/250 kW
flywheel energy storage system," IEEE transactions on applied
superconductivity, vol. 17(2), June 2007.
[1.26] M. Berger and I. Porat, Optimal design of rotating disk for kinetic energy
storage, Faculty of mechanical engineering, Technikon-Israel institute of
technology, Haifa Israel.
[1.27] G.R Kress, Struct Multidisc potim, vol. 19, pp. 74-81, 2000.
[1.28] J.M Chern, W. Prager, "Optimal design of rotating disk for given radial
displacement of edge," Journal of Optimization Theory and Applications,
vol. 6, no 2, 1970.
[1.29] D. Eby, R.C Averill, E. Goodman, and W. Punch, "An injection island GA
for flywheel design optimization," Artificial Intelligence in Engineering ,
Design, Analysis and Manufacturing, vol. 13, pp. 389-402. 1999.
[1.30] D. Johnson, "Design Considerations and Implementation of an
Electromechanical Battery System," Ph.D. dissertation, University of Cape
Town, 2008.
Univers
ity O
f Cap
e Tow
n

17
[1.31] D. Hartog, J. Pieter, Advanced strength of materials, Network McGraw-hill,
1952.
[1.32] J.H. Faupel, F.E Fischer, Engineering design, a synthesis of stress analysis
and materials engineering, 1st edition. New York: Wiley; 1964.
[1.33] S. Samineni, B. K. Johnson, H. L. Hess and J. D. Law, "Modelling and
analysis of a flywheel energy storage system for voltage Sag correction,"
IEEE Transactions on Industry Applications, vol. 42(1), February 2006.
[1.34] H. Hofmann, Sr. Sanders, "High speed synchronous reluctance machine with
minimized rotor losses," IEEE transactions on industry applications, vol. 36,
pp. 531-539, 2000.
[1.35] B.T. Merritt, R.F. Post, G.R. Dreifuesrt, D.A. Bender, "Halbach array
motor/generator. A novel generalized electric machine," Halbach festschrift
symposium, Berkeley, California, February 3, 1995.
[1.36] K. Halbach, Design of permanent multi-pole magnets with oriented rare earth
cobalt material.
[1.37] D. A. Bender and P.K. Snyder. DC power management with a high
performance flywheel, in Proc. Electrical Energy Storage Systems
Applications and Technologies (EESAT), 2002.
[1.38] R. Hockney and C. Driscoll, Powering of standby power supplies using
flywheel energy storage, International-Telecommunications-Energy-
Conference (INTELEC), pp. 105–109, 1997,.
[1.39] R. Wagner and R. Jansen, Flywheel technology development at the NASA
Univers
ity O
f Cap
e Tow
n

18
Glenn research Centre, Electrical Energy Storage Systems Applications and
Technologies (EESAT) Conference Proceedings, 2002.
[1.40] M. A. Arslan, Flywheel geometry design for improved energy storage using
finite element analysis, Materials and design, 2007.
[1.41] B. Bolund, H. Bernhoff, M. Leijon, "Flywheel energy and power storage
systems," Renewable and Sustainable Energy Reviews, Vol. 11, pp. 235–258,
2007.
[1.42] M. Siebert, "Passive magnetic bearing development," University of Toledo,
NASAGlenn Mechanical components branch, May 14 2002.
[1.43] J. Hillyard, Magnetic Bearings, Technische Universität München, Joint
Advanced Student School, 2006.
[1.44] G. Schweitzer, Active magnetic bearings - chances and limitations,
International Centre for Magnetic Bearings, ETH Zurich, CH-8092 Zurich,
Univers
ity O
f Cap
e Tow
n

Chapter 2
System Description and
Components ____________________________________________________________________
This chapter gives a brief system description. A machine topology selection and
design is described. The power electronics for the control of the system is also given.
2.1 System Description
The flywheel energy storage system consists of a flywheel rotor coupled to a three
phase AFPM machine. The flywheel rotor provides the required inertia to store the
designed energy and the electrical machine is charged with the energy conversion in
the system. The machine is powered through a 100A rectifier dc supply via a three
phase bidirectional inverter driven by PWM switching from control desk as shown
in Fig.2.1.
Figure 2.1: General schematic of flywheel system
Switch
Drivers
Inverter
Control
Load Flywheel/Machine
Computer
DC-DC Solar Panel
Univers
ity O
f Cap
e Tow
n

20
The control of the system is determined by the rotor position of the magnets given
by the hall sensor magnets and the PWM switching of the inverter switches. Details
of this control strategy are given in section 2.3.
The amount of energy in the system increases exponentially with speed hence the
need to have a high operating speed limit. This is illustrated in equation (2.1). In
principle, the amount of energy stored in a flywheel is given by [2.1].
2
2
1ωJE = (2.1)
Where J is the moment of inertia and ω is the rotational speed of the flywheel rotor
The designed operating speed range is 8,000 rpm to 25,000 rpm. During motor
mode, the flywheel system is ramped to its maximum designed speed when the PV
panel (dc source) transfers energy to the machine. During generator mode, the
supply is switched off, a load is connected as shown in Fig. 2.1. This in turn absorbs
energy from the flywheel hence reducing its speed. For the case when no load is
connected, the speed drops due to the rotational losses. As the voltage magnitude
and frequency of the machine are directly proportional to the speed of rotation, a
DC-DC converter is required to ensure constant voltage at the load side. However, in
the final system, the DC-DC converter was neglected and the load was supplied
directly.
The ability of a flywheel to reach high speeds is mainly dependent on the maximum
strength of the material, which is given by equation (2.2) below [2.1].
22 ωρσ r= (2.2)
Univers
ity O
f Cap
e Tow
n

21
Where σ is the ultimate tensile strength of the rotor material, ρ is the density of the
flywheel rotor material, r is the radius of the flywheel rotor and ω is the rotational
speed of the flywheel.
In addition, the energy density of a rotor at burst speed is dependent only on the
flywheel design and the characteristics of the material [2.1] as shown in equation
(2.3) below.
ρ
σK
m
e=
(2.3)
Where
m
eis the energy density and K is the shape factor
From equation (2.3) it can be seen that the energy stored is proportional to the
strength of the material. In fact, structural integrity is by far the biggest challenge to
this technology.
For improved safety, the system is contained in a thick steel cylinder with reduced
air pressure to reduce windage losses. In this design, the windage loss is ignored due
to its low magnitude.
2.2 Permanent Magnet Machines
The machine is charged with converting electrical energy to mechanical energy and
vice versa when discharging. In this thesis, the major driving factors of choice for
the electrical machine are; low cost, simple control, high torque and high power
density. In addition, a good thermal behaviour and simple construction of the
machine is essential. Section 1.2.3 described the various machines that can be used
for flywheel operation and these include induction machines, switched reluctance
and Halbach machines [2.2] [2.3]. The characteristics in relation to the high speed
Univers
ity O
f Cap
e Tow
n

22
operation were also discussed and the PM machines were found to be more suitable
for this design due to their high torque density, high power density, high efficiency
and low rotor losses.
PM machines are widely used for automation and industry applications as a result of
advancement in PM technology. These machines are highly efficient, exhibit high
torque and power densities and can be used for high speed applications [2.4] [2.5].
The conventional Radial Flux Permanent Magnet (RFPM) machine has been used
for decades and it has one rotor and stator just like the conventional Axial Flux
Permanent Magnet (AFPM) machine. As shown in Fig. 2.2, the RFPM machine has
an external stator and internal rotor with either surface mounted or interior magnets.
Figure 2.2: Inner rotor radial flux machine
These machines are extensively used for industrial applications and have higher
torque than the conventional induction machines [2.6]. The RFPM can be
constructed with either a slotted or non-slotted stator. The major disadvantage of this
machine is that only the windings facing the rotor PMs are used for torque
production. In addition, this machine topology is considered to have long end
windings on the other side of stator which means increased copper loss. This
topology also has a large air gap which results in reduced flux density. However, this
topology has a great thermal transfer capability giving a relatively high machine
electrical loading.
Stator Rotor
Univers
ity O
f Cap
e Tow
n

23
Alternatively, the conventional AFPM machines have been seen as an alternative to
conventional RFPM machines in domestic and naval applications [2.6]. The
advantages of the conventional AFPM machine over the conventional RFPM
machine include; higher power to weight ratio, compactness and hence can be used
in space limited applications. They also have planar and adjustable air gaps. The
major disadvantage of this machine is the machine structure can easily be twisted by
the large axial forces exerted on the stator. The similarity with these machines is that
they can be constructed with multiple rotors and stators as shown in Fig. 2.3 and 2.4.
Figure 2.3: Double rotor machine topology [Source: Lipo]
Figure 2.4: Double rotor axial flux machine [Source: Lipo]
The two major disadvantages can be eliminated by introducing a second stator to the
machine. These machines have been investigated and found to increase the torque
density as well as the efficiency of the machine.
Magnets
Rotor Stator
PMs Rotor disks stator
Univers
ity O
f Cap
e Tow
n

24
According to Qu [2.7], the RFPM and AFPM machines exhibit similar performance
in torque density, torque-to-mass ratio, losses and efficiency although the material
cost of the AFPM are higher than those of the RFPM. In addition to stronger cooling
capabilities in the AFPM machine, the ratio of the length to diameter can be
optimized for various applications as compared to the RFPM whose ratio is constant
hence limiting applications. On the contrary, the optimization of the RFPM topology
is more complex as the resultant two air gaps are associated with two different
electric loadings. The flat profile of the AFPM topology is desirable as it adds less to
the volume of the flywheel container. Most importantly, the AFPM is a compact
machine making its use in flywheel systems quite desirable.
2.3 Axial-Flux Permanent Magnet Machine
This machine can be designed with various types of topologies, ranging from the
number of disks used, armature slots to location of magnets (surface mounted or
buried). The choice of which topology to use is dependent on the application. The
selection of the parameters is very important, that is, torque, power density and cost
should be outlined and the topology selected from these aspects. This AFPM
machine exhibits high torque output, high power density, is maintenance free,
among others [2.8]. As compared to other machines, there are various advantages
and disadvantages to the AFPM.
The major advantages of the AFPM are:
• Compact machine construction and short frame
• High power density
• High efficiency, no rotor copper losses due to permanent magnet excitation
• Have a short rotor in axial direction and it can be constructed without steel
• More robust structure than cylindrical type
Univers
ity O
f Cap
e Tow
n

25
The major disadvantages of the AFPM are:
• High windage losses at high speed applications which may be minimised by
operating in a vacuum.
• Complicated machine topology with two air gaps
2.3.1 Different Combinations of AFPM
The different configurations for the AFPM can best be expressed in the Fig. 2.5
below.
Figure 2.5: AFPM configuration combinations
AFPM
Multi-stage AFPM
Double-sided AFPM
Single-sided AFPM
Internal stator Internal rotor
Slotless stator Slotted stator Salient stator
Salient stator
Slotless stator
Slotted stator
Salient stator
Slotless stator
Slotted stator
Coreless stator & rotor
Coreless stator
Iron core stator
Univers
ity O
f Cap
e Tow
n

26
2.3.1.1 Stator-Rotor Arrangement
The AFPM structure can be arranged as single-sided, double-sided or multi-disk.
The choice of the structure depends on the application, cost and volume available for
the machine. The single sided structure [2.9] [2.10] is the cheapest although it
suffers from high attractive forces [2.11] and requires a thicker rotor disk. Two
techniques are used in chapter 4 to handle the attractive forces. The double-sided
arrangement can be used to resolve the problem [2.12] and this can be configured
with an internal or external stator. The internal stator, that is, one stator-two rotors
[2.13] ensures better utilization of the copper hence improving the efficiency and
power density.
The reduced cost of the single sided structure makes it attractive for the flywheel
application but this structure does not have good utilization of the copper.
Furthermore, the double stator also has long end windings thus increasing the copper
and iron losses, however this is good for cooling. The double rotor fully utilises the
copper used. The rotor disk frames act as fans but this increases the windage and
frictional losses. On the other hand, in multi-disc topologies, the mechanical stresses
and windage losses are higher and costly due to the large number of PM used.
2.3.1.2 Type of Mounting
The choice between the two types of mountings is based on the simplicity of
construction and the ability to withstand high centrifugal forces. The buried type
mounting offers better protection from centrifugal forces however this is more
complex to construct as compared to the surface mounted magnets. This can be
made easier by slicing a small section of the iron to embed the magnets and also
applying glue with nickel coating to improve the ruggedness of the magnet
attachment. From an electrical point of view, the effective air gap of the surface
mount is larger because the permeance of magnets nears that of the air gap. This
lowers the inductance of the stator windings limiting the operation of the machine
above its base speed.
Univers
ity O
f Cap
e Tow
n

27
2.3.1.3 Armature Slots
AFPM machines can be constructed with or without armature slots. A machine with
armature slots is more robust than the slotless machine. In addition, the effective air
gap is much smaller. However, because of the stator slots, the machine exhibits flux
ripple, tooth iron losses, tooth saturation and tooth related vibrations which are
eliminated when using the slotless armature. In contrast, the slotless stator is not
suitable for applications where the machine is subjected to excessive mechanical
stress. This can be minimised by applying resin over the windings. In addition, the
copper losses are minimized as this topology has relatively short end windings.
2.3.1.4 Topology Selection for AFPM
The AFPM can either be constructed as a NN or NS machine as shown in Fig. 2.6
(a,b) below. Each configuration exhibits both advantages and disadvantages.
Figure 2.6a: NN configuration Figure 2.6b: NS configuration
The flux path of the NS passes through the stator and does not pass circumferentially
making the axial length shorter. This characteristic makes the NS less heavy than the
NN weight. It also ensures less iron and hence higher efficiency. In addition, the NS
can be manufactured with no core for small power machines.
In coreless stator, the hysteresis and eddy current losses do not exist and the rotor
steel losses are negligible ensuring higher efficiencies with zero cogging torque,
however, hysteresis loss may occur at high frequency [2.14].
S N
N S
N S
N S
Univers
ity O
f Cap
e Tow
n

28
2.3.2 Comparison of the Permanent magnet Brushless AC and
DC Machine
According to [2.9], AFPM machines can be classified as either a brushless AC or
DC machine. The brushless AC also known as the permanent magnet synchronous
machine is characterised by:
• Sinusoidal or quasi-sinusoidal distribution of the magnet flux in the airgap
• Sinusoidal or quasi sinusoidal current waveforms
• Quasi-sinusoidal distribution of stator conductors
Brushless DC machines (BLDC) contains most of the characteristics of PMAC
motors. They are generally designed as surface-mounted motors with concentrated
windings on the stator. With the appropriate placement of the PM on the rotor, a
trapezoidal back-EMF shape is obtained.
The brushless DC machines are characterised by:
• Rectangular distribution of the magnet flux in the airgap
• Trapezoidal current waveforms
• Concentrated stator winding
These machines are similar in nature and only differ when choice for a specific
application has to be made. According to [2.9] there is no significant torque density
difference between these machines. The AC machine is considered to be more
efficient and produces a smoother torque at higher speeds. Torque of square wave
machines decreases at high speed or with low supply voltage because of the
distortion of the phase current.
However, the sine wave machines need a high precision and expensive position
transducers. The control of sine wave machines is more complicated and the
converter switching losses are higher in sine wave operation.
Univers
ity O
f Cap
e Tow
n

29
2.3.3 Mathematical Model of the BLDC
The mathematical model of the BLDC is presented with the underlying assumptions:
• The motor windings have a constant resistance, self inductance and mutual
inductance.
• All the three phases have identical back EMF shapes
• Power semi conductor devices in the inverter are ideal
The BLDC is represented by three phases resulting in the total sum of the currents
being equal to zero. The designed machine is surface mounted and hence no saliency
such that the stator self inductances are independent of the rotor position. This
means that the self inductances are equal. Under balanced three phase conditions,
all three phases are equal as in equation (2.4).
cbas rrrr === (2.4)
The matrix that describes the model is hence given by equation (2.5).
+
−
−
−
+
=
c
b
a
c
b
a
c
b
a
s
s
s
c
b
a
e
e
e
i
i
i
dt
d
ML
ML
ML
i
i
i
r
r
r
V
V
V
00
00
00
00
00
00
(2.5)
The back EMF waveforms are trapezoidal in nature and can be represented by either
Fourier series or Laplace transforms. The BLDC voltage equation originates from
the voltage equation of the Brush DC motor given by equation (2.6).
dt
tdiLtktirtV a
ameaa
)()()()( ++= ω (2.6)
This results into
a
a
a
a
a
a
L
tEti
L
r
L
tv
dt
tdi )()(
)()(−−= (2.7)
Univers
ity O
f Cap
e Tow
n

30
The electromechanical torque Tem is linearly proportional to the armature current ia
and expressed as
aTem ikT = (2.8)
The resultant solution gives the motion equation in Laplace form as:
aa
rmeT
emsLr
ksVkT
+
Ω−=
)( (2.9)
2.3.4 Mechanical Design Considerations
There are various mechanical design considerations in AFPM design. In the first
instance, the integration of the rotor disc and shaft is significant especially for high
speed operation. Any imbalance could cause deterioration in the performance of the
machine component, vibrations and reduce the life time of the system. The different
radial expansions of the shaft and discs means the joint needs to be well designed
and the fabrication done properly. In addition, a uniform air gap of a double sided
AFPM is complex to achieve. This is further reduced if the attractive forces are not
catered for as the discs will tend to attract. In the analysis, the impact of the
attractive forces is compensated using a fixed pressure load on the system.
Of great importance for high speed design is the maximum radius of the rotor discs.
The major limitation is the strength of the back iron and the maximum strain. In this
design, the thickness of the back iron was fixed as well as the pressure due to the
attractive forces. Ideally, a smaller disc would reduce the stress and strain
components on the disc at high speeds; however the small diameter means smaller
areas for the stator windings. This results in lower torque in the machine and lower
cooling capability. Enlarging the discs has an impact on rotor dynamics and
mechanical integrity of disc-shaft joint.
Univers
ity O
f Cap
e Tow
n

31
To establish the maximum stress on the rotor disk, equation (2.10) is used as shown
[2.14].
( )222
max 602
87.3983
io rrg
−
×
+=
πωρυσ (2.10)
Where σmax is the maximum allowable stress, υ is the poison’s ratio, ρ is the density
of the material, ω is the rotational speed, 2or and 2
ir are the outer and inner radius
respectively.
In [2.14], the normal attractive force between parallel discs with magnets is given by
equation (2.11) and this was used to ascertain the fixed pressure between the disks.
PM
o
mg
z SB
Fµ
2
21
= (2.11)
The numerical package ANSYS is used to determine the maximum stress and strain
at the maximum operating speed range of 25,000 rpm. The stresses on the rotor discs
with magnets are much lower than the maximum allowable stresses for the steel
used.
2.3.5 Electrical Considerations
This section introduces the electrical considerations of the designed machine. The
major aspects are the excitation voltage, power and developed torque.
2.3.5.1 Back EMF
The back EMF induced in the stator winding of an axial flux BLDC PM Machine is
given by:
nkE eph = (2.12)
Where n is the speed and ke is the armature voltage constant, given by:
Univers
ity O
f Cap
e Tow
n

32
wphe kpNk φπ
22
= (2.13)
Where p is the number of poles, Nph is the number of phases, Φ is the flux and kw is
the winding factor.
2.3.5.2 Developed Torque
The developed torque is derived from the apparent electromagnetic power induced
in the stator winding which is given by:
s
em
dn
ST
π
ψ
2
cos= (2.14)
But the apparent electromagnetic power is given by equation (2.15)
32outmmgswDem DABnkkS π= (2.15)
Hence
ψπ
CosABDkkT mmgoutwDd
3
2= (2.16)
Where Td is the developed torque, kD is a function of the ratio of outer to inner
diameter of the stator, kw is the winding factor, Dout is the outer diameter of the
stator, Bmg is the magnetic flux, Am is the magnetic area and Cosψ is the power
factor.
2.3.6 Stator Windings Design
A BLDC machine was selected with a coreless stator. The material selection for the
stator holding structure is vital. A high strength and thermal conductivity material is
required for this purpose. The tooth saturation and core losses are neglected for this
topology. The essential parameter for maximising the flux linkage is the inner to
outer ratio of the stator diameter which is kept at 1.73. A low value of the electric
loading is considered to ensure better thermal performance of the machine. Two
machines were designed and the design procedure is explained as follows.
Univers
ity O
f Cap
e Tow
n

33
The number of turns and diameter of the conductor of the electrical machine is given
by equations (2.17) and (2.18) respectively.
( )D
mINA
rmsph
π
2= (2.17)
=
DA
ImND
rmsph
cond 2
8
π (2.18)
Where Nph is the number of turns per phase, A is the electric loading, m is the
number of phases, D is the average diameter of the stator, Irms is the rms current.
The slot area and depth are given by equations (2.19) and (2.20).
filc
phcond
slotSN
NAA = (2.19)
width
slot
depthS
AS = (2.20)
Where Acond is the conductor area, Nph is the number of phases, Nc is the number of
coils per phase and Sfil is the slot fill factor.
The design parameters of the stator windings are calculated based on the analytical
equations given in section 2.2.7. The two machines are, a 100W machine rated at
12V and a 500W machine rated at 150V. Table 2.1 shows the design parameters.
Univers
ity O
f Cap
e Tow
n

34
Table 2.1: Stator winding parameters
Design
parameters
100 W Machine 500W Machine
Number of poles 4 4
Inner/outer diameter 64mm/80mm 80mm/150mm
Axial length 23mm 26mm
Airgap 2mm 2mm
Electric loading 10,000A/m 15,000A/m
Current density 4A/mm2 6A/mm2
Conductor gauge 18AWG 17AWG
Number of turns per phase 32 32
Magnetic loading 0.47T 0.7T
Magnet thickness 8.5mm 10mm
Remnant flux density 1.2T 1.35T
Back iron thickness 9mm 10mm
2.3.7 Armature Reaction
This refers to the magnetic field produced when currents flowing in the stator which
distort the field flux created by the PMs. This reduces the flux density in the air gap.
Armature reaction in PM machines can cause partial or full demagnetization of the
magnets. In surface mounted BLDC machines, the magnets present low permeability
to the impressed MMF hence the distortion is weak. However, for the buried
magnet, the protruding iron presents a high permeability causing high distortion in
the field [2.15]. The rotor disc introduces saturation in the magnetic material hence
the need for a non linear analysis. The topology selected introduces a large air gap
and high energy magnets.
Univers
ity O
f Cap
e Tow
n
35
2.4 BLDC Machine Losses
The losses were investigated to estimate the efficiency of the machine component
and to observe the thermal behaviour of the machine. The total losses in the machine
include the copper losses, iron losses, mechanical losses and stray losses.
Distribution of the stator windings, short pitching of the windings and magnet
skewing reduce higher order winding and slot harmonics but reduce torque. High
speed machines tend to generate very high windage losses hence the need to reduce
the air pressure in the containment. This reduction in the air pressure brings about a
decreased heat transfer which results in rise in magnet and rotor temperature.
2.4.1 Copper Loss
This is referred to as the I2R loss and contributes to the total machine loss. It is
mainly a function of the loading and the stator winding resistance. Minimizing the
copper losses requires shortening the end windings. Concentrated windings are used
and connected in series with each coil.
The copper loss for the BLDC is expressed as:
RIP DCcu
22= (2.21)
Where IDC is the rms current and R is the stator winding resistance.
Temperature correction of the stator winding resistance is given as
( )[ ]2020 00393.01 TTRRT −+= (2.22)
Where R20 is the resistance at 20oC and T is the temperature of the resistance
measurement.
Univers
ity O
f Cap
e Tow
n
36
2.4.2 Core Loss
This is significant at very high speeds however the topology selected avoids the use
of a core using a NS configuration.
2.4.3 Eddy Current Loss
In high speed operation of the machine, there is a rapid variation of the flux density
within the stator windings, which results in induced eddy currents in the windings. A
finite element aided model is used to predict winding eddy current losses [2.16].
This incorporates the static equation with flux densities obtained from finite element
simulations and is expressed as:
[ ] 222222
4 dmymxcone BBmdfP ηρ
σπ+= (2.23)
Where σ is the conductivity of the winding material, ρ is the density of the winding
material, f is the frequency, d is the diameter of the conductor, mcon is the mass of
the conductor, Bmx and Bmy are the x and y components of the flux density
respectively.
The harmonic factor dη is expressed as [2.16]
( ) ( ) ( ) ( )....
55331
21
21
22
21
21
22
++
++
+
++=
yx
yx
yx
yx
dBB
BB
BB
BBη (2.24)
Where Bx1 and By1 are the x and y components of the flux density for the first and
second harmonic respectively.
The mechanical losses of the machine are combined with the flywheel windage loss
and presented in chapter 5.
Univers
ity O
f Cap
e Tow
n

37
2.5 Power Electronics
The power electronics in the flywheel system control the energy conversion process.
The designed power electronics include a DC-DC converter and BLDC drive. The
BLDC drive ensures that the MMF frequency of the stator is in synchronism with
the position of the rotor’s magnetic field. The back EMF generated by the machine
is dependent upon speed, therefore a DC-DC converter ensures that the voltage at
the consumer output is maintained at reference voltage, irrespective of the system
mode of operation. For the purpose of this thesis, the solar panel side of the DC-DC
converter shall be referred to as the input and the flywheel side of the converter shall
be referred to as the output of the converter. Preliminary work by Dave Johnson
[2.17] on BLDC and further analysis of the drive and DC-DC converter by Mac
Stuart [2.18] and Paul Barendse made this section of the thesis possible. Their
contributions to this section well appreciated. The topology considered in the work
is shown in Fig. 2.7.
Figure 2.7: General schematic of the power electronics
Univers
ity O
f Cap
e Tow
n

38
2.6 Operating Modes
The purpose of the control system is to process the flow of power while ensuring the
current is maintained below its rated value. The above flywheel system has been
designed such that the BLDC machine has a back EMF of approximately 12V at the
nominal operating point of 8 000 rpm and a back EMF of approximately 36V at a
maximum speed of 25,000 rpm.
The control strategy of the flywheel system can be split into 4 different modes of
operation:
• Flywheel start-up mode of operation
• Motoring mode of operation
• Generating mode of operation
• Free spinning mode of operation
2.6.1 Flywheel Start Up Mode of Operation
When the flywheel accelerates from 0 rpm to 8,000 rpm the output voltage increases
from 0V to 12V, while the input voltage remains at 12V. During this phase the DC-
DC converter operates in current control mode, ensuring the current does not surpass
the rated value of the machine, 10A. The need for current limiting arises due to the
low stator impedance within this low speed range. As the motor spins at low speeds,
the back EMF is small resulting in a high potential difference across the small stator
impedance. This results in high stator currents and potential motor burn out. When
the flywheel reaches 8,000 rpm, the controller will switch from this mode of
operation into the motoring mode of operation.
2.6.2 Motoring Mode of Operation
The flywheel will be in this mode of operation whenever the input voltage is above
the low voltage threshold of 11V and the flywheel speed is above 8,000 rpm. During
Univers
ity O
f Cap
e Tow
n

39
this mode the DC-DC converter will transfer power from the solar panels to the
flywheel, while the speed is ramped from 8000 rpm to 24000 rpm and the power is
limited to its rated value.
2.6.3 Generating Mode of Operation
The flywheel will be in this mode of operation whenever the input voltage is below
the low voltage threshold of 11V and the flywheel speed is above 8,000 rpm. The
DC-DC converter will transfer power from the flywheel to the load, since the BLDC
machine will be operating as a generator. The DC-DC converter will try and
maintain the input voltage at 12V. This will be achieved by bucking the voltage
produced by the generator down to 12V.
2.6.4 Free Spinning Mode of Operation
The flywheel will be in this mode whenever the input voltage is below the low
voltage threshold of 11V and the flywheel speed is below 8,000 rpm. The DC-DC
converter will be switched off, to prevent power from continuing to be drawn from
the flywheel. The motor will still slowly run down due to frictional and windage
losses.
2.7 DC-DC Converter
The interface between the BLDC drive and the consumer-end, takes the form of a
DC-DC converter. Assuming that the solar panel provides the necessary 12V at start
up, the current flowing to the motor will need to be limited. This is achieved by
limiting the DC motor voltage; hence a buck mode DC-DC converter is required,
since the output voltage range during this mode is between 0V and 12V. While the
flywheel is accelerating from its nominal operating point, 8000 rpm to its maximum
speed, the voltage needs to be increased above its input voltage of 12V; therefore a
boost converter is required, whereby the output voltage range varies between 12V
and 36V. During this mode, the power is limited by the converter. In these two
Univers
ity O
f Cap
e Tow
n

40
modes of operation, power is transferred from the solar panel to the flywheel,
however the DC-DC converter also requires power to be transferred in the opposite
direction when generating. In this mode the speed of the machine is between 8000
rpm and 24000 rpm, providing a voltage range of between 12V to 36V at the
terminals of the BLDC. The voltage at the user-end needs to be maintained at 12V;
therefore a buck converter with necessary voltage control is required.
In order for power to flow in both directions, from solar panel to the flywheel system
during the charging of the electromechanical battery and from the electromechanical
battery to the user, a bidirectional DC-DC converter needs is required.
2.7.1 DC-DC Converter Topologies
A buck converter works in such a way that the average output voltage is lower than
the input voltage.
The average output voltage is given by [2.19]:
DV
V
in
out= (2.25)
Where Vin is the input voltage to the converter, Vout is the output voltage from the
converter and D is the duty ratio.
This topology, as shown in Fig. 2.8, works by varying the ratio of the time that the
switch is on to the time that the switch is off (the duty cycle/ratio). The inductor and
the capacitor at the output stage act as current and voltage filters respectively. This
converter is a linear converter as the output voltage varies linearly with respect to
changes in the duty cycle.
Univers
ity O
f Cap
e Tow
n

41
Figure 2.8: Buck Converter
This converter topology acts as a fundamental building block in numerous DC-DC
converter topologies. The second topology examined is that of a boost converter, as
shown in Fig. 2.9. A boost converter works in such a way that the average output
voltage is higher than the average input voltage. When the switch is turned on, the
input supplies energy to the inductor as the diode is reverse biased and the output
stage is isolated. When the switch is turned off, the energy stored in the inductor
flows to the output stage. Additionally, energy flows from the input stage to the
output stage. This energy stored in the inductor boosts the output voltage above the
input voltage.
The average output voltage is given by [2.19]:
DV
V
in
out
−=
11
(2.26)
Where Vin is the input voltage to the converter, Vout is the output voltage from the
converter and D is the duty ratio.
Figure 2.9: Boost Converter
Univers
ity O
f Cap
e Tow
n

42
The ideal gain of 1/(1-D) is not realizable as the duty ratio gets close to 1. This is
because of the parasitic losses associated with the inductor, the capacitor and the
diode. These losses put an upper bound on the step up ratio that a boost stage can
achieve. This drop off in the available gain is shown in Fig. 2.10.
Figure 2.10: Voltage gain curve for boost converter
The third topology is a combination of the buck and boost converter, known as a
buck-boost converter. There are numerous circuit configurations available in
literature for the buck-boost converter topology. A number of these converters are
analysed below.
The tapped inductor converter is one which uses a tapped inductor (auto
transformer) to increase the input to output gain ratios. The proposed converter is
shown in Fig. 2.11. The converter is both bi-directional and can either buck or boost
the input voltage depending on the requirements. The advantage of this
configuration is that it only consists of 2 switching devices, resulting in fewer
components and a simplified control circuit.
Univers
ity O
f Cap
e Tow
n

43
Figure 2.11: Tapped inductor converter
The voltage transfer ratio for the tapped inductor converter is given by the following
equation:
( )D
nD
U
UM
−
⋅==
11
2 (2.27)
2
21
N
NNn
+= (2.28)
Where N1 and N2 are the number of windings on the first half and second half of the
tapped inductor respectively.
Fig. 2.12 shows how the gain is achievable by the converter. The gain may be varied
by changing the value of n, the ratio of turns on the tapped inductor.
Univers
ity O
f Cap
e Tow
n

44
Figure 2.12: Voltage gain curves for tapped inductor converter
This converter is controlled by varying both the switching frequency and the duty
cycle of switches. The frequency is varied to prevent an oscillation of energy
between the two sides of the converter at low loads. The two switches are driven in
push-pull mode.
The following converter topology is based on the buck and boost converter
topologies, as discussed earlier. It consists of two synchronous converters in tandem
sharing a single inductor. The converter is designed to use four switches to allow bi-
directional power flow and the ability to operate in both buck and boost modes. The
design schematic is shown in Fig. 2.13. The various states of the switches required
for the converter to operate in the four different modes of operation are shown in
Table 2.2.
Figure 2.13: Bidirectional synchronous buck-boost converter
S1
S2
S3
S4
Univers
ity O
f Cap
e Tow
n

45
Table 2.2: Various switch states for operation of the synchronous converter in the
four different modes of operation
An addition to the above synchronous converter is suggested by [2.20], as shown in
Fig. 2.14. Across each diode and switch, a resonant capacitor is placed which
enables soft switching of the switching devices. This soft switching could result in
the reduction of switching losses in the converter by thirty percent. A thorough
analysis of the operation of the converter topology in Fig. 2.14 is presented by [2.20]
and will not be repeated here.
Figure 2.14: Bidirectional synchronous DC-DC converter with resonant capacitors
Power flow direction Mode of operation S1 S2 S3 S4
Left to right Step Up ON OFF OFF SW
Left to right Step Down SW OFF OFF OFF
Right to left Step Up OFF SW ON OFF
Right to left Step Down OFF OFF SW OFF
S1
S2
S3
S4 Univers
ity O
f Cap
e Tow
n

46
2.7.2 Choice of DC-DC Converter Topology
In order to meet the requirements for the flywheel system the following criteria were
used in the choice of the design of the system:
• low cost
• materials available locally
• high efficiency
• low complexity
• low maintenance
The three converters that meet the requirements for bi-directional buck/boost power
flow are the converters proposed by [2.20]. These are the synchronous buck-boost
converter, the synchronous buck boost converter with resonant capacitors and the
tapped inductor converter. A summary of the advantages and disadvantages of the
converters are presented in Table 2.3 below.
Table 2.3: Advantages and disadvantages of bi-directional buck/boost DC-DC converters
Advantages Disadvantages
Synchronous buck-boost
converter
Simple design
Easy control
High number of switching devices
Synchronous buck-boost
converter with resonant
capacitors
High efficiency Complicated control required to
implement soft switching
High number of components
Tapped inductor converter Only two
switching
devices
High boosting
ability
Complicated control since gain is
affected by both switching
frequency and duty cycle
Higher cost of tapped inductor vs.
normal inductor
Univers
ity O
f Cap
e Tow
n

47
The topology that is implemented is the synchronous buck boost converter. This
topology is implemented because it meets the design requirements stipulated at the
beginning of this chapter and is shown in Fig. 2.15. Out of all the three options, the
control required for the synchronous buck/boost converter is the simplest. While the
tapped inductor converter has the fewest components, the price of the tapped
inductor is sufficiently higher than the price of a normal inductor to negate this
advantage.
Figure 2.15: Topology that was implemented for the DC-DC converter
2.7.3 Sizing of Components
For the sizing of the components, the buck and boost stages were sized separately,
after which these are combined for the bi-directional buck-boost converter. The
design of the boost component of the converter will now be discussed.
The maximum boosting required is stepping up the input voltage by 3 times. This
will occur when the motor is accelerating up to its maximum operating speed of
24,000 rpm. At this speed the back EMF is approximately 34V and therefore the
applied voltage will need to be 36V. The minimum voltage required is 12V.
Therefore if the converter is to be kept in the continuous region, the range of duty
cycle required is from 0% to 66% (from equation 2.26).
Univers
ity O
f Cap
e Tow
n

48
From [2.19] and [2.21] the following equations were used to determine the
inductance and capacitance required:
o
os
I
VTL
×= 074.0 (2.29)
o
som
V
TDIC
∆
××= (2.30)
Where L is the inductance (H), Ts is the switching period (s), Vo is the output voltage
(V), Io is the minimum output current (A), C is the capacitance (F), Iom is the
maximum output current (A), D is the duty cycle, ∆Vo is the percentage voltage
ripple.
The specifications of the boost converter and its component sizes are summarised in
Table 2.4.
Table 2.4: Boost converter specifications and component sizes
Specification Value
Ts 1/f=0.00005s
Vo 36V
D 0.66
∆V0 0.05
Io 1A
Iom 10A
L 0.1mH
C 7mF
The maximum reduction required for generator mode of operation is 3:1. This will
occur when the flywheel is at its maximum speed and the back EMF is 36V. The
minimum reduction that the converter will be required to perform is when the
flywheel is spinning at 8,000 rpm and the back EMF is 12V. At this time no bucking
Univers
ity O
f Cap
e Tow
n

49
will be required from the converter. Therefore if the converter is kept in the
continuous conduction region the range of duty cycles required is from 33% to
100% (from equation 2.25). From [2.21], the components of the buck converter can
be selected as follows:
( )fI
VDL
L
o
∆
−≥
min1 (2.31)
fV
IC
o
oL
××∆
∆=
8 (2.32)
Where Dmin is the minimum duty cycle, ∆IL is the inductor current ripple (A), f is the
switching frequency (Hz), Co is the output capacitance (F), ∆Vo is the output voltage
ripple (V).
The specifications of the buck converter and its component sizes are summarised in
Table 2.5.
Table 2.5: Buck converter specifications and component sizes
Parameter Value
Vo 12V
Dmin 0.33
∆IL 2A
F 20 000Hz
∆Vo 5%
L 0.2mH
C 19uF
The component sizes for the two converters were of a similar nature. The larger of
the two options were chosen in each case to enable the converter to buck and boost
effectively. The inductor was over-rated to ensure that the output current is as
Univers
ity O
f Cap
e Tow
n

50
smooth as possible to prevent torque pulsations in the motor. The final component
sizes are as follows:
Input capacitance: 7mF
Output capacitance: 7mF
Inductor size: 0.4mH
The inductor was designed from first principles. The core used was the Ferro cube E
55/28/21 core with grade 3C90 material. This core was used due to its availability.
The starting point in inductor design is the product: LI L ×2max . This is used to
determine the core size and the corresponding relative permeability. This is done
using the DC magnetisation curve.
AI L 10max = (The maximum rated motor current), L=0.4mH
mHALI L
22max 40=×
From the magnetisation curve, µe is found to be ≈33. Using the following formula
from [2.21] and the data from the Ferox cube data sheet:
( )Al
HA oeL /
µµ= (2.33)
Where AL is the inductance rating, µe is the relative permeability of the magnetic
core, oµ is the permeability of free space = 4π x 10-7 H/m and l/A is the core factor
AL was found to be 119nH.
Univers
ity O
f Cap
e Tow
n

51
From the Ferox cube data sheet the airgap required was found to be 5mm. Finally
the number of turns required was found to be 58 turns using the formula below from
[2.21].
Required turns = ( )
2/1
2
N
nHA
nHDesiredL
L
(2.34)
The size of the wire used was as large as possible, to limit the resistance of the
inductor, while still allowing the correct number of turns to fit on the core. The wire
size chosen was copper wire with a diameter of 0.315mm.
The converter was controlled using PWM control. The switching frequency was 20
kHz.
The driver circuit used to switch the MOSFETs is shown in Fig. 2.16. The input
driver signals are sourced from a dSPACE controller card. All control is performed
by the controller card, which allows for rapid control prototyping. The MOSFETs
were mounted on a heat sink to dissipate the heat generated.
Univers
ity O
f Cap
e Tow
n

52
Figure 2.16: MOSFET driver circuit for DC-DC converter
2.7.4 DC/DC Converter Simulation
The following set of simulation results shows the DC-DC converter operating under
its various modes. These tests were performed on the DC-DC converter in isolation
of the flywheel system. For all tests conducted, a load of 1Ω is used.
Fig. 2.17 shows the voltage and current waveforms for the converter operating in
buck mode with a duty cycle of 50%. The input to the converter (consumer-end) is
12V and the output, which is connected to the BLDC drive end, is shown in Fig.
2.17. At a 50% duty cycle the expected output should be 6V, however taking the
diode losses into account, the output voltage settles at 4.6V as shown in the figure.
Univers
ity O
f Cap
e Tow
n

53
0 0.05 0.1 0.15 0.2 0.25 0.3 0.35 0.4 0.45 0.50
1
2
3
4
5
Voltage (
V)
0 0.05 0.1 0.15 0.2 0.25 0.3 0.35 0.4 0.45 0.50
1
2
3
4
5
Curr
ent
(A)
Time (s)
Figure 2.17: Buck mode of DC-DC Converter
Figure 2.18 shows voltage and current waveforms for boost operation. Again the
input (consumer-end) is 12V and the duty cycle is 66%. Under these conditions the
voltage should be boosted to 3 times its input value, 36V, however taking the losses
into account, the output settles to 33.5V. Both buck and boost modes of operation in
this case are transferring power from the solar panel to the flywheel via the machine
of operation would be responsible for ramping up the flywheel to 25,000 rpm.
0 0.1 0.2 0.3 0.4 0.5 0.6 0.70
10
20
30
40
Voltage (
V)
0 0.1 0.2 0.3 0.4 0.5 0.6 0.70
10
20
30
40
Curr
ent
(A)
Time (s)
Figure 2.18: Boost mode of DC-Dc Converter
Univers
ity O
f Cap
e Tow
n

54
The third test shows power being transferred from the flywheel to the load. In this
mode, the DC-DC converter would need to be bucking in the opposite direction. The
input in this case is the BLDC drive-end, which would have a maximum voltage of
34V, which would need to be reduced to 12V at the output, therefore the duty cycle
is set to 30%. Fig. 2.19 shows the output voltage at the consumer-end, whereby the
voltage is approximately 9V, instead of 12V, again attributed to losses. Therefore,
indicating that a greater duty cycle would be required to maintain the voltage at 12V.
These results illustrate the converters ability to transfer power in both directions
while also highlighting the losses which need to be catered for in the experimental
design.
0 0.1 0.2 0.3 0.4 0.5 0.6 0.70
5
10
15
Vo
lta
ge
(V
)
0 0.1 0.2 0.3 0.4 0.5 0.6 0.70
5
10
15
Cu
rre
nt
(A)
Time (s)
Figure 2.19: Buck mode of DC-DC Converter in when generating
2.8 BLDC Converter and Encoder Design
Due to the absence of brushes in the machine, commutation cannot occur naturally
but forced commutation is required. This commutation is controlled by electronics.
The purpose of the commutation strategy is to ensure the commutation of the stator
windings corresponds to the correct position of the rotor. In order for this to occur,
the controller needs to know the position of the rotor. However, a precise
determination of the rotor position is not necessary, as it is only required that the
Univers
ity O
f Cap
e Tow
n

55
position of the rotor is known at the commutation points [2.23] Two methods for
detecting the rotor position will be presented and discussed below.
To control the stator windings for commutation, an inverter consisting of three half
bridges is used. Fig. 2.20 shows the standard schematic of a BLDC inverter.
Figure 2.20: BLDC Inverter
In order to control the machine, only two of the windings are energised at any one
time. This is achieved by connecting the terminal of one phase to the positive
terminal of the supply and one end of another phase to the negative terminal. This
switching strategy results in currents of a trapezoidal shape flowing through the
stator windings.
The table 2.6 below gives the switches that are required to be on for each of the 6
possible commutation segments.
Univers
ity O
f Cap
e Tow
n

56
Table 2.6: Switch Commutation for CW Rotation
Hall Sensors value (CBA) Phase Switches
101 A-B SW1;SW4
001 A-C SW1;SW6
011 B-C SW3;SW6
010 B-A SW3;SW2
110 C-A SW5;SW2
100 C-B SW5;SW4
If the number of magnetic poles on the rotor is increased, the commutation strategy
does not change [2.23], however it is necessary to account for the conversion
between electrical and mechanical revolutions.
2.8.1 Rotor Position Measurement Using Hall Sensors
Three Hall-effect sensors are placed 120 electrical degrees apart within the stator.
With the sensors placed in these positions, there are six different possible outputs
from the sensors. With every change in hall sensor output, commutation occurs.
The advantages of using Hall sensors to determine the position of the rotor are:
• Simplified signal processing as the hall sensor output is not greatly affected
by electrical noise.
• Simplified signal processing as the commutation sequence is easily obtained
from Hall sensor outputs.
The disadvantages of using Hall sensors to determine the position of the rotor are:
• Increased cost of the machine
• Temperature sensitivity
Univers
ity O
f Cap
e Tow
n

57
2.8.2 Rotor Position Using Back EMF Sensing
The direct Back-EMF method of sensorless position determination is the most
popular method used [2.24]. This method involves sensing the back EMF in the
phase that is not being fed by the motor inverter. The instant of commutation is
reached when the slope of the back EMF changes from a positive or negative value
to zero [2.23]. The problem of sensing these commutation points is extremely
difficult due to the large amount of electrical noise that is present at any stage [2.23].
Significant processing power or additional circuitry is required to filter out this noise
so that a clear reading of the back EMF can be obtained.
A significant disadvantage of using the sensorless approach when driving a BLDC
motor is the complicated start up procedure required [2.23]. A start up procedure is
required since the rotor is at standstill; therefore no back EMF is present. This makes
estimation of the rotor position from the back EMF impossible at start up. A start up
procedure is proposed by H.C. Chen and C.M Liaw in [2.25].
For this high speed application, the hall sensors provide a more reliable and
simplistic means of rotor position detection, therefore these were selected.
2.8.3 BLDC Converter Simulation
The BLDC drive performs the necessary commutation for the PM machine, speed
control is merely performed by varying the input DC voltage. For the simulations, a
DC source is used instead of the DC-DC converter, as this validates the operation of
the drive in isolation of the DC-DC converter. Speed, line voltage and current are
shown in the figures below.
Fig 2.21 shows results for start up and motor mode of operation. The start up
procedure occurs between 0-0.45 seconds, whereby the DC voltage is maintained at
12V while the speed ramps up to 8,000 rpm, after which the DC voltage is stepped
to 36V, whereby the speed then ramps up to 25,000 rpm.
Univers
ity O
f Cap
e Tow
n

58
0 0.1 0.2 0.3 0.4 0.5 0.6 0.7 0.8 0.90
1
2
3x 10
4
Speed (
rpm
)
0 0.1 0.2 0.3 0.4 0.5 0.6 0.7 0.8 0.9-50
0
50
Voltage (
V)
0 0.1 0.2 0.3 0.4 0.5 0.6 0.7 0.8 0.90
20
40
Curr
ent
(A)
Time (s)
Figure 2.21: Start up and motor mode of operation
Based on the short time required to ramp up to 25,000 rpm, it is quite evident that
the flywheels inertia is not taken into account for these simulations. This was done
to reduce the processing time required for simulation, which proved too lengthy for
the processing capabilities of the PC. Fig. 2.22 illustrates the generating mode of
operation whereby the power from the flywheel is dissipated into a 1Ω resistor.
Univers
ity O
f Cap
e Tow
n

59
0.5 1 1.5 20
1
2
3x 10
4
Speed (
rpm
)
0.5 1 1.5 2-50
0
50
Voltage (
V)
0.5 1 1.5 2-40
-20
0
20
Curr
ent
(A)
Time (s)
Figure 2.22: Generating mode of operation
The machines speed falls off from 25,000 rpm to standstill. The overall flywheel
system however would disconnect from the load at 8,000 rpm. It is clear from the
Fig. 2.22 that current is reversed in this mode, since it is now generating.
2.9 Flywheel Drive System Simulation
The following set of results shows tests conducted on the overall flywheel system,
i.e. DC-DC converter and BLDC drive. Fig. 2.23 shows the speed, voltage and
current for start up and motor mode of operation. When operating the motor below
8,000 rpm, the motor is current limited to a maximum of 10A. When surpassing
8,000 rpm, the machine enters the constant power region whereby the machines
power is limited to rated power, 100W. Fig. 2.24 shows the steps in output voltage
of the DC-DC converter as the voltage is firstly stepped from 0V to 10V, then at
0.8seconds it is stepped from 10V to 33V, to achieve the desired speed response.
Univers
ity O
f Cap
e Tow
n
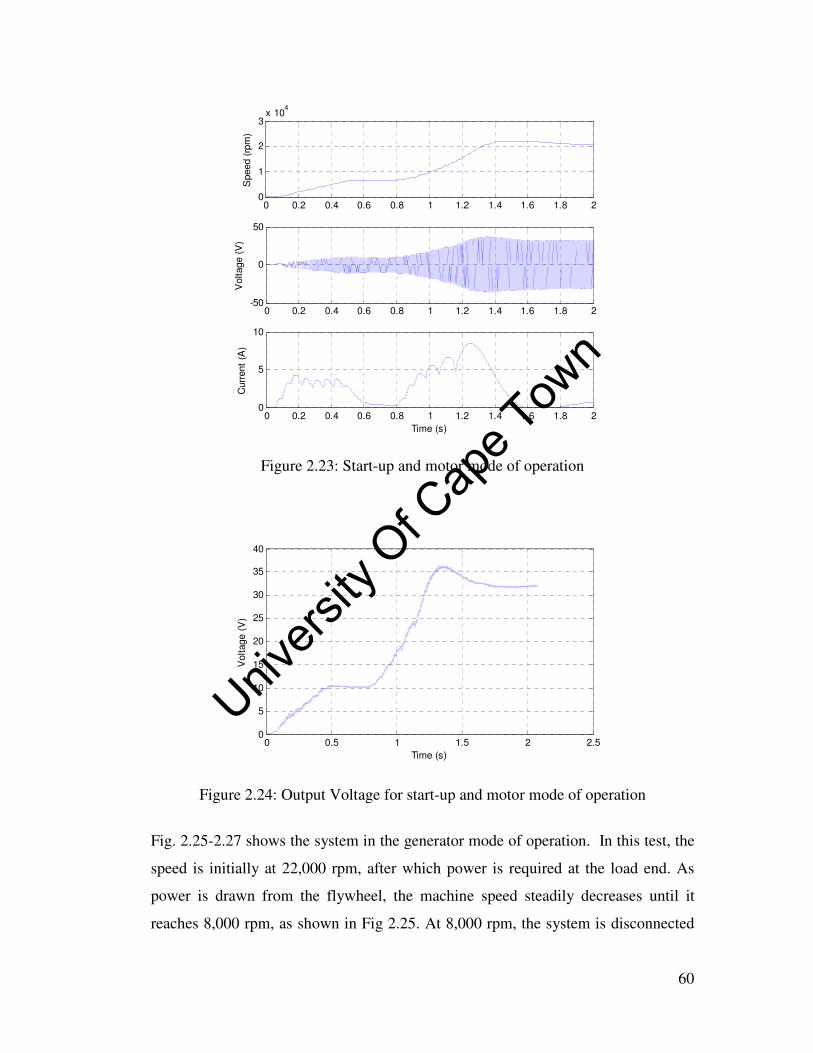
60
0 0.2 0.4 0.6 0.8 1 1.2 1.4 1.6 1.8 20
1
2
3x 10
4
Speed (
rpm
)
0 0.2 0.4 0.6 0.8 1 1.2 1.4 1.6 1.8 2-50
0
50V
oltage (
V)
0 0.2 0.4 0.6 0.8 1 1.2 1.4 1.6 1.8 20
5
10
Curr
ent
(A)
Time (s)
Figure 2.23: Start-up and motor mode of operation
0 0.5 1 1.5 2 2.50
5
10
15
20
25
30
35
40
Voltage (
V)
Time (s)
Figure 2.24: Output Voltage for start-up and motor mode of operation
Fig. 2.25-2.27 shows the system in the generator mode of operation. In this test, the
speed is initially at 22,000 rpm, after which power is required at the load end. As
power is drawn from the flywheel, the machine speed steadily decreases until it
reaches 8,000 rpm, as shown in Fig 2.25. At 8,000 rpm, the system is disconnected
Univers
ity O
f Cap
e Tow
n

61
from the load. Fig 2.26 shows the voltage at the BLDC drive-end of the DC-DC
converter. As power is drawn, the machines speed decreases and so does the back-
emf. As this decreases, the control attempts to maintain an output voltage at the
consumer-end of 12V, as shown in Fig. 2.27.
1.5 1.55 1.6 1.65 1.7 1.75 1.8 1.851
1.5
2
2.5x 10
4S
pe
ed
(rp
m)
1.5 1.55 1.6 1.65 1.7 1.75 1.8 1.85-50
0
50
Vo
lta
ge
(V
)
1.5 1.55 1.6 1.65 1.7 1.75 1.8 1.85
-10
0
10
Cu
rre
nt
(A)
Time (s)
Figure 2.25: Generator mode of operation
1.5 1.55 1.6 1.65 1.7 1.75 1.810
15
20
25
30
35
Voltage (
V)
Figure 2.26: DC voltage at terminals of BLDC drive for generator mode of operation
Univers
ity O
f Cap
e Tow
n

62
1.5 1.55 1.6 1.65 1.7 1.75 1.8
2
4
6
8
10
12
14
Voltage (
V)
Time (s)
Figure 2.27: Consumer voltage for generator mode of operation
2.10 Practical Drive System
The simulated drive system was partially implemented due to prototyping time
constraint and safety concerns. The DC-DC converter was not considered instead a
manual switch was used during the testing phase to ensure full control of the system
as shown in Fig. 2.28.
Figure 2.28: Practical drive system
Switch
Drivers
Inverter
Control
Load Flywheel/Machine
Computer
Solar Panel
Univers
ity O
f Cap
e Tow
n

63
2.11 Concluding Remarks
This chapter examined different machine topologies that should be considered for
the flywheel system. The major driving factors of choice where ease of construction,
compact and less cost. The axial flux machine with brushless mode of operation was
considered. A bi-directional DC-DC converter and drive system were designed and
simulated in MATLAB simulink. The results showed the ability of the converter to
transfer power in both directions. The flywheel drive simulations showed its ability
to control the machine during motor and generator mode. I acknowledge the
contributions by Dave Johnson, Mac Stuart and Paul Barendse on the DC-DC
converter and the drive system. Conventional bearings were considered for this
research due to cost and time constraint.
2.12 References
[2.1] G. Genta, Kinetic energy storage, Theory and practice of advanced flywheel
systems, Butterworth & Co. Ltd, 1985.
[2.2] P. I. Tsao, "An integrated flywheel energy storage system with a homopolar
inductor motor/generator and high-frequency drive," PhD Thesis, fall 2003.
[2.3] J. Lahteenmaki, "Design and Voltage Supply of High-Speed Induction
Machines," PhD Thesis, Helsinki University of Technology, 2002.
[2.4] N. Bianchi, S. Bolognani and F. Luise, "Analysis and Design of a PM
Brushless Motor for High-Speed Operations," IEEE Transactions on Energy
Conversion, vol. 20, no. 3, September 2005
Univers
ity O
f Cap
e Tow
n

64
[2.5] Z.Q. Zhu, K.Ng, D. Howe, "Design and analysis of high speed brushless
permanent magnet motors," in Proc. EMD97, No 444, 1-3 September
1997.
[2.6] M.Aydin, S.Huang, T.A. Lipo, "Axial flux permanent magnet disc machines:
review, " Research report, 10-2004.
[2.7] R. Qu, M. Aydin and T. A. Lipo, "Performance comparison of dual
rotor radial flux and axial flux permanent magnet BLDC machines,"
[2.8] J. F. Eastham, M. J. Balchin, T. Betzer, H.C. Lai, and S. Gair. "Disk motor
with reduced unsprung mass for direct EV wheel drive," IEEE Int. Symp. On
Industrial Electronics, vol. 2, pp. 569—573, 1995.
[2.9] F. Sahin, "Design considerations of the flywheel mounted axial-flux
permanent magnet machine for a hybrid electric vehicle," EPE, Lausanne,
1999.
[2.10] K.R. Pullen, M.R. Etemad, and M.R. Fenocchi. "The high speed axial flux
disk generator unlocking the potential of automotive gas turbine," IEE
colloquium on Machines and Drives for Electric and Hybrid Vehicles, pp.
1—4, June 1996.
[2.11] P. R. Upadhyay, K.R. Rajagopal, B.P. Singh, "Effect of armature reaction on
the performance of the axial field permanent magnet brushless dc motor
using FE method," IEEE Transactions on Magnetic, vol.40, no 4, July 2004.
[2.12] P. Campbell, "Principles of a Permanent-Magnet Axial-Field D.C.
Machine," In Proceedings of the IEE, vol. 121, no. 12, pp. 1489-1494, 1974
Univers
ity O
f Cap
e Tow
n

65
[2.13] D. Platt. "Permanent magnet synchronous motor with axial flux geometry.
IEEE Trans. on Magnetics," vol. 25, No. 4, pp. 3076—3079, 1989.
[2.14] J. F. Gieras, R. Wang and M. J. Kamper, Axial Flux Permanent Magnet
Brushless Machines, Dordrecht, Kluwer Academic Publishers: 2004.
[2.15] P. Kurronen, Torque Vibration Model of Axial-Flux Surface-Mounted
Permanent Magnet Synchronous Machine. Dissertation. Lappeenranta
University of Technology, Finland, pp. 123, 2003.
[2.16] R. Wang and J. Kamper, "Calculation of Eddy Current Loss in Axial
Field Permanent Magnet Machine with coreless Stator, " Energy Conversion,
vol. 19, No. 3, pp. 39, 2000.
[2.17] D. Johnson, "Design Considerations and Implementation of an
electromechanical Battery System, PHD thesis, " University of Cape Town.
2007.
[2.18] S. Mac William, "Design of a drive system for a flywheel battery," Bsc
thesis, University of Cape Town, 2008.
[2.19] N. Mohan, T.M. Undeland and W.P. Robbins. Power Electronics,
Converters, Applications, and Design, John Wiley and Sons Inc, Third Ed.,
2003.
[2.20] Symmetrical DC/DC converter,
http://www.freepatentsonline.com/6636431.html. Last visited 21 September
2008
[2.21] K. Otmar, Switched Mode Power Supplies in Practice, John Wiley and Sons
Ltd, 1989.
Univers
ity O
f Cap
e Tow
n

66
[2.22] Atmel AVR492: Brushless DC Motor Control using AT90PWM3/3B,
http://www.atmel.com/dyn/resources/prod_documents/doc7518.pdf. Last
visited 14 October 2008
[2.23] J. Dixon, Position Estimator and Simplified Current Control Stratergy for
Brushless –DC Motors, Using DSP Technology, (2002)
[2.24] T. Siostrzonek, S. Pirog, "The Flywheel Energy Storage with Brushless DC
Motor- The Practical Results," IEEE Transactions on Power Electronics,
vol. 21, no. 4, pp. 1541-1545, 2006,
[2.25] H.C. Chen, C.M Liaw, "Current-Mode Control for Sensorless BDCM Drive
With Intelligent Commutation Tuning, " IEEE Transactions on Power
Electronics, vol. 17, no. 5, pp. 747- 756, 2002
Univers
ity O
f Cap
e Tow
n

Chapter 3
Flywheel rotor design ____________________________________________________________________
This chapter discusses the rotor configurations and design for the flywheel rotor
profile. The various configurations are described and selection is made for the most
suitable type. The rotor designs and results are presented. The analyses include
stress, modal, fatigue and windage models developed for the profiles.
3.1 Flywheel Rotor Configurations
There are three main types of rotor configurations as mentioned in section 1.3.1.
Two rotor configurations are considered in this thesis, the inside out and the
conventional design. The details of each configuration are discussed in the following
sections.
3.1.1 Inside-Out Configuration
The inside-out configuration is also referred to as the vertical axis concentric system.
The configuration is shown in Fig. 3.1 with an electrical machine embedded in the
flywheel. This configuration was considered due to the choice of the Halbach array
machine because of its high efficiency and low cost [3.1]. This configuration ensures
safety of the machine during high speed rotation.
Univers
ity O
f Cap
e Tow
n

68
Figure 3.1: Inside out design
The major disadvantage of this configuration for this specific application is the
thermal considerations. The evacuation of the heat from the machine is complex
especially in the vacuum unit. A heat pipe is required in the shaft as the heat
accumulation in the flywheel material would induce thermal stresses, reducing the
integrity of the flywheel. The heat stored in the central hole would reduce the
efficiency of the machine. The testing of the machine which is embedded in the
flywheel as shown in Fig. 3.2 is challenging. This follows from the machine being
embedded in the middle of the entire system.
Figure 3.2: Levitating system
Up Permanent Magnet Ring
Ring-Bearing Rotor Coupling
Radial Bearing RotorFlywheel
Halbach Array
Axial Bearing-Radial Bearing Coupling
Axial Bearing Rotor
Univers
ity O
f Cap
e Tow
n
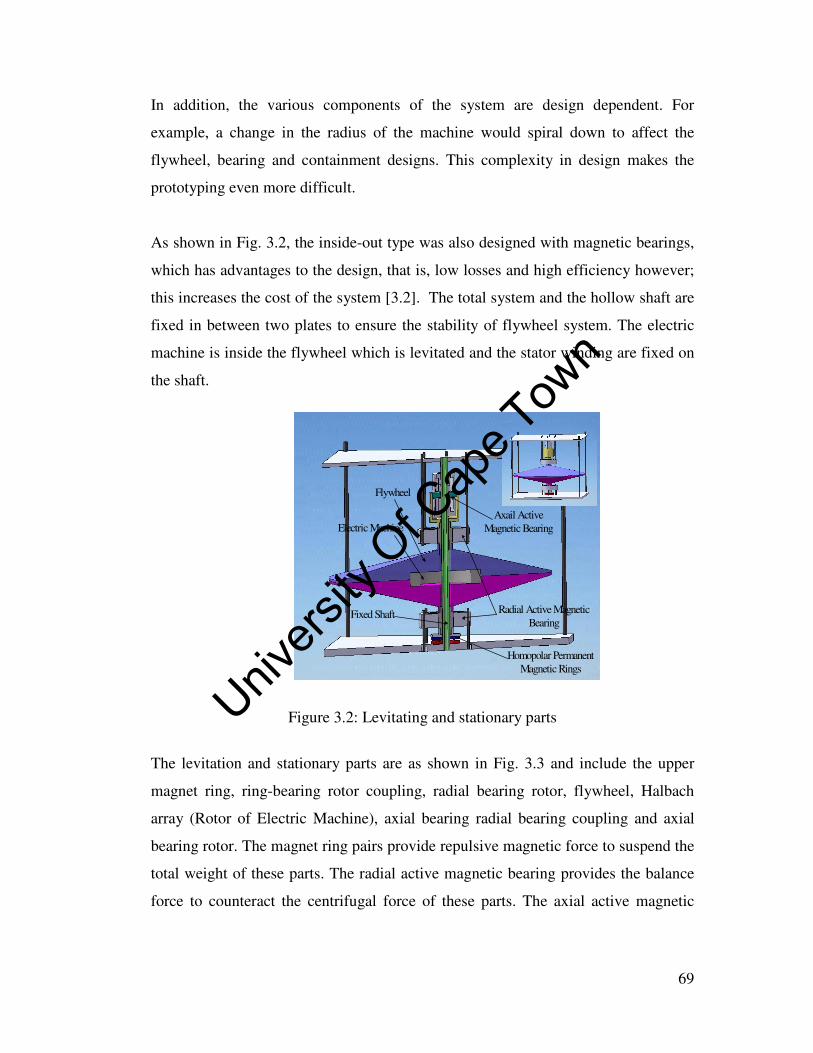
69
In addition, the various components of the system are design dependent. For
example, a change in the radius of the machine would spiral down to affect the
flywheel, bearing and containment designs. This complexity in design makes the
prototyping even more difficult.
As shown in Fig. 3.2, the inside-out type was also designed with magnetic bearings,
which has advantages to the design, that is, low losses and high efficiency however;
this increases the cost of the system [3.2]. The total system and the hollow shaft are
fixed in between two plates to ensure the stability of flywheel system. The electric
machine is inside the flywheel which is levitated and the stator winding are fixed on
the shaft.
Figure 3.2: Levitating and stationary parts
The levitation and stationary parts are as shown in Fig. 3.3 and include the upper
magnet ring, ring-bearing rotor coupling, radial bearing rotor, flywheel, Halbach
array (Rotor of Electric Machine), axial bearing radial bearing coupling and axial
bearing rotor. The magnet ring pairs provide repulsive magnetic force to suspend the
total weight of these parts. The radial active magnetic bearing provides the balance
force to counteract the centrifugal force of these parts. The axial active magnetic
Homopolar Permanent Magnetic Rings
Radial Active Magnetic Bearing
Axail Active Magnetic Bearing
Flywheel
Electric Machine
Fixed Shaft
Univers
ity O
f Cap
e Tow
n

70
bearing provides the axial magnetic force to offset the axial direction vibration of
this part.
The magnet ring pairs at the bottom of system are applied to levitate the total weight
of flywheel and other bearing components. The magnet ring is formed by a
Neodymium Iron Boron (NdFeB) material, which is brittle. In order to protect the
ring pairs against large pressures imposed, the lower and upper magnet ring is
encased into the lower steel plate.
In order to keep the magnet ring in the centre of the shaft and reduce the difficulty in
the assembly, the inner radius of ring-bearing rotor coupling is 1.5 mm larger than
the shaft. In case the radial active magnetic bearing malfunctions, the ring-bearing
rotor coupling will detach and rotate along the shaft, rather than destroy the
permanent magnet ring pairs.
The stator of radial active magnetic bearing is suspended by six suspension steel to
ensure the stability of the stator. The rotor, levitated and rotating with the flywheel,
is in the centre of the stator. The air gap between rotor and stator is 1.5 mm and this
is the same for the air gap between the rotor and shaft. This ensures that there is no
contact between stator and rotor which could damage the stator in the case of radial
magnetic bearing failures. The junction of the flywheel and rotor is 15 mm and is
reserved for the displacement sensor.
In order to keep the axial stability of the flywheel, an axial magnetic bearing is
applied in the system. The rotor of the axial magnetic bearing is connected to the
rotor of the radial magnetic bearing by the axial bearing radial bearing coupling. All
these three parts are levitated and rotate with the flywheel. The two stators of the
axial magnetic bearing are fixed onto the shaft while the lower one is enwrapped by
the axial bearing-radial bearing coupling. The air gap between the rotor, axial
bearing-radial bearing coupling and shaft is 1.5mm to prevent interference between
the embedded stator and axial bearing-radial bearing coupling.
Univers
ity O
f Cap
e Tow
n
71
The radial bearing coupling and ring bearing rotor coupling were designed using
non-magnetic stainless steel to avoid interruption of the flux circuit and to reduce the
hysteresis losses in the steel. This configuration and design was not pursued beyond
the design due to a time cost factor especially in South Africa where the magnets
have to be imported.
3.1.2 Conventional Configuration
The conventional rotor design is the most commonly used configuration as presented
in [3.3-3.5]. Most of the energy is stored in the rotor which is attached to a shaft
used by the motor to spin the flywheel. The horizontal axis cascaded
flywheel/machine system topology is shown in Fig. 3.4. The main features of this
topology include:
• Horizontal axis rotation
• Flywheel rotor attached directly to shaft
• Free choice of machine
• Ability to use conventional bearings
The main advantages of this system include:
• The machine and flywheel design are independent of each other
• Limited heat problems from machine to flywheel
• The machine and flywheel are compact
• Possibility of a low cost design
This is the simplest configuration; however, the complications arise from the shaft
and flywheel attachment. The major problems are the radial elongation at the
connection point and the dynamic stability of the flywheel.
Univers
ity O
f Cap
e Tow
n

72
Figure 3.3: Conventional configuration
The radial elongation differences are represented by the relationship:
Er
U32ρω= (3.1)
Where U is the radial displacement, E is the young’s modulus, r is the radius of
connection interface, ρ is the mass density and ω is the angular speed.
The E glass composite material will exhibit higher elongation than the stainless steel
shaft. The impact of the radial elongation is different for a thin or thick rim. The thin
rim is dependent on the inner radius while the thick rim is dependent on the density
of Young’s modulus ratio.
The dynamic stability of a flywheel rotor depends on the material to inner damping
of a system. As presented in [3.6], various solutions are suggested, for example, for
thin rim, a disc or a spoke system can be used but for a thick rim, an elastomeric
layer can be used. Generally, the press fit is more reliable because it curbs the radial
Bearings
Flywheel rotor Rotor disks
Stator
Univers
ity O
f Cap
e Tow
n

73
elongation and also solves the problem of dynamic stability. The press fit in the
thick rim is possible by shrink fitting, conical interfaces and by pre-tension winding
techniques. The two options are explored in the prototyping phase in chapter 4.
3.2 Choice of Flywheel Rotor Material
Steel has been in used in flywheel rotor design for over 20 years [3.6]. Arguably, the
reason for this is better predictable dynamic performance, homogeneous
characteristics, ease of mass production and low manufacturing cost with typical
values of $0.25/kg. This may be low but so is the J/kg of metallic flywheels. High
power density metal flywheels require expensive and difficult processes and
materials to create pre-stressed flywheels. However, their low energy densities and
poor failure criteria raise concerns of safety and hence increase the cost of the
containment structure. Massive containment structures made from reinforced
concrete/metal is required to contain these steel systems in case of failure. In
addition, these systems are bulky and difficult to handle and are usually fixed
installations. The mode of metal failure is elastic, which stores large amounts of
elastic energy into the fragments before severing off the structure. During failure,
these steel structures will typically break into 3 main fragments and some smaller
pieces with high translational energies and this can cause severe damage to
equipment and personnel around if not contained.
Composite flywheels, on the other hand, are much smaller and are lightweight
because of their high specific kinetic energy. Their physical properties are not
homogeneous, like metals, and these have to be taken into consideration.
Composites failures occur differently and the main causes are debonding, fibre
pullout and delamination [3.7]. For example, delamination is prevented in current
filament wound designs by using a multi-rim approach, which is a function of wall
thickness. The process of filament winding and separating the rims with an
elastomer and balancing the resulting structure is cumbersome and reflected in the
Univers
ity O
f Cap
e Tow
n

74
price of commercial flywheels. Various flywheel manufacturing techniques with
benign failure are further elaborated in chapter 4.
3.3 Flywheel Rotor Profile
Conventional shape profiles have been widely used in rotor design as presented in
[3.3] [3.5] [3.8]. These shapes are used because of existing analytical approaches to
establish profile parameters. However, in order to increase the energy stored, high
speeds have to be exerted on the rotor which necessitates high strength materials.
These materials are expensive [3.9], hence there is need to optimize the shape [3.10]
used in the flywheel in order to reduce subsequent costs from extra material required
when using conventional shapes. Literature in material and shape optimization is
limited.
As presented in [3.11], the best thickness distribution along the radius of a centrally
bored flywheel is investigated. Stodola’s solution for an evenly stressed turbine disk
without a hole is used to examine the shape for even stress distribution with a central
hole. A numerical shape optimization of the shape with a FEM based structural
model was used. A simplified model was developed and found that an even stress
shape does not exist for a hole radii greater than the square root of one third of the
radius flywheel. The optimum shape predictions are in agreement only when the
radius of the bore does not exceed the approximately one third of the radius of the
disk.
JM Chern [3.12] investigates the optimal design of the rotating disks with the radial
displacement as a prescribed value. In this work, a sufficient optimal condition is
derived and used to determine the optimal disk profiles. The resulting disks were
found to be far from satisfying the uniform strength condition despite the weights
being almost similar.
Univers
ity O
f Cap
e Tow
n

75
David Eby [3.13] discusses the optimal design of elastic flywheels using a genetic
algorithm to search for the shape variations to optimize the specific energy density.
The use of genetic algorithm was due to decreased process time and better search
space. The limitation to this technique is that it’s not implemented with a central
hole, making it complex for the flywheel application in this thesis.
In section 3.4, Berger and Porat’s work on the flywheel rotor is investigated and
section 3.5 discusses Stodola’s work using non-uniform solutions for flywheel rotor
design with a central hole. Considerable contributions from design work in [3.14]
made this section of this work possible. Further, high level mathematical analysis
using maple soft by Michael Nlandu made this work achievable.
3.4 Optimal Design of a Rotating Disk -Ultimate
shape
This section discusses the derivation of the general shape for optimal design of the
flywheel rotor and is based on work by Berger and Porat with a central hole. Partial
differential equations theory is used with a piecewise differentiable disk built with
five shapes. In [3.10] piecewise optimal shapes are used to create the ultimate shape.
Berger does not provide for a central hole however, this hole is required to attach the
shaft on which the machine will also be placed. As shown in Fig. 3.5, the five shapes
are considered with the central hole (P1-P2), exponential (P2-P3), minimum thickness
(P3-P4), maximum slope (P4-P5), and maximum thickness profiles (P5-P6)
Univers
ity O
f Cap
e Tow
n

76
Figure 3.4: Five shapes used to derive the ultimate shape
In the derivation of the ultimate shape, dimensionless equations are considered as
shown in equations (3.2) to (3.5)
oR
Rr = (3.2)
oR
RWrW
)()( = (3.3)
Max
RR
S
RSrS
)()( = (3.4)
Max
TT
S
RSrS
)()( = (3.5)
A solid disk of homogeneous isotropic material of mass density ρ is considered. A
thin ring of the same diameter and material properties is added with respect to the
different locations. A hole is created in the centre and allows for the disk to rotate
about its axis attaining a continuously varying hole and bounded thickness W(r)
which will be axi-symmetrical and symmetrical with respect to the centre plane.
The variable and different thickness are bounded in the closed interval [0, 1] which
can be subdivided into five thickness called shapes W(r) in our case.
Univers
ity O
f Cap
e Tow
n

77
A general optimal analytical shape is made possible by locating different points
along the shape. The thickness is bounded in relative sizes as well as in profile
slope so that the disk can be treated as a two-dimensional axisymmetrical problem.
As the disk rotates, the curve of the shape acquires a new location as it changes in
the XY direction.
The structural configuration of the system is fully specified by the design
parameters which may be fixed or varied. The fixed parameters are called
geometrical constraints and the varying parameters are called strength constraints
but these vary within a specified range in a closed interval [0, 1]. A thin
homogeneous rotating disk of a variable thickness is considered for the purpose of
storing kinetic energy.
The exact optimal shape is one with piecewise smooth derivatives. Applying a
parametric study in which optimal designs for a sequence of rotational speeds are
observed reveals the existence of three speed intervals, each characterised by a
common type of optimal design.
3.4.1 Description of Flywheel Rotor Profile
The homogeneous disk shown in Fig. 3.5 has five basic shapes: the hole at the
centre, the exponential constant (maximum) stress shape, the minimum thickness
shape, the maximum slope shape and the maximum thickness shape which are
defined analytically. This is represented by general equation (3.6).
This part describes the rotating disk process starting from low to high speed. While
( ) )6.3(
65)(5
54)4('2)(4
43)(3
32)]22
3)(2
2exp[()(2
210)(1
≤≤=
≤≤−+=
≤≤=
≤≤−=
≤≤=
=
prpUrw
prpprLrw
prpLrw
prprpk
Lrw
prprw
rw
δ
δδ
δ
δ
Univers
ity O
f Cap
e Tow
n

78
observing this evolving process of this optimal design as function of the speed k, it
is realised that from the low speed, the optimal design appears to accumulate the
bundle of mass at the rim as we choose the location of P4. The maximum mass at
the rim will shrink as the speed increases. In the medium speed range, a constant
(maximum) stress shape with exponential profile develops in this region, the size of
which extends both in thickness and in length.
In the high speed range, the exponential constant stress shape in this section,
retreats back towards the hole in the centre and covers a shorter inner section of the
disk. The parameters which contribute on the design variables are geometrical and
behavioural constraints;
The geometrical constraints are imposed on the disc dimension as in equation (3.7)
and (3.8).
UL rW σσ ≤≤ )( (3.7)
σ2)(' ≤rW (3.8)
The structure of the configuration is given below in respect to the geometrical
constraints:
• P1 and P6 are fixed
• P1≤…..≤P6
• P1…P6 are all fixed during low speed
• P2…P5 are variable in medium to high speed
• UL δδ ≤ are fixed but can be modified
• ( ) ( )( )2exp222
32krprw L −= δ is variable
• ( ) ( )4'
4 2 prrw L −+= δδ is variable
Univers
ity O
f Cap
e Tow
n

79
3.4.2 A General Exact Optimal Shapes
The general exact optimal shape is shown in Fig. 3.6. The five basic shapes do not
slope but show different shape that are functions separated by different locations
from P1 to P6.
Figure 3.5: Optimal shape for medium speed with five basic shapes
3.4.2.1 Creating the Hole: First Profile
The differentiable configuration of piecewise disk profile is a hole when the
Specific Kinetic Energy (SKE) e(k,w) that provides the shapes is zero, this implies
that the first shape W1(r) is zero.
The first shape is illustrated by equation (3.9).
0
)(
)(
),(1
0
1
1
0
13
2 ==
∫
∫
drrrw
drrwr
kwke (3.9)
Exponential function
Logarithmic function
Tangent slope at P4 with negative angle
W(2) W(3) W(4) W(5 W(1)
Univers
ity O
f Cap
e Tow
n

80
3.4.2.2 Finding the Exponential Shape W2(r): Second Shape
The configuration of the profile provides the exponential shapes at the location [P2,
P3] in the medium speed range. The SKE is isolated and reduced at this interval [P2,
P3] which results into the two axis-symmetrical function problems, the exponential
curve on both sides of the r-axis. This is defined in equation (3.10).
∫
∫=
3
3
)(
)(
),(
2
23
2p
r
p
r
drrrw
drrwr
kwke (3.10)
The solution in equation (3.11) is given by integrating equation (3.10)
krpwke 223
221
)(),( += (3.11)
When P3 is extended to the left, we have
(3.12)
Where ( )2
23
2k
Inp
σ−= and )()( 32 rwrw =
The resulting solution for the second shape is
(3.13)
( ) 22232
1
2 )(krp
erw+
=
ewrw krpr2)22
3()( 21
32 )( −=
Univers
ity O
f Cap
e Tow
n

81
3.4.2.3 Finding the Minimum Thickness Line W3(r): Third Shape
The third shape is an ordinary point and the tangent at this point is the straight line
which is a constant. The solution at this interval for ( ) 43 ,, PrrP → is:
( ) 223
23 2
1)( kPrrw += (3.14)
Where Lrw δ=)(3 for 01.0=Lδ
3.4.2.4 Finding the Slope Shape W4(r) that Maximises the SKE: Fourth
Shape
This case is reduced only in the interval (P4, P5) where r → P4 from the
geometrical restriction we know ( )
σ2≤∂
∂
r
rwand by the theory of non-linear
differential equation, ( ) ( )42 prr
rw→=
∂
∂σ , where dPP += 34 .
At the point P4 is given by equation (3.15).
( )prw Lr 4)( 24 −+= σδ
(3.15)
Therefore, this result shows how the maximum thickness shrinks from the outer
section of the ring to a certain point in the inner section.
3.4.2.5 Find the Maximum Thickness Shape w5(r): Fifth Shape
The same analysis for the minimum thickness is made here, with the only
difference being the interval (P5, P6), and the infimum provided by the set of the
smallest r, k in this closed interval are bigger than the one provided at the minimum
shape. When solving the piecewise shape, it is assumed that other locations are zero
and their integrals are zero. Hence ( )urw δ=5 where 1.0=uδ
Univers
ity O
f Cap
e Tow
n

82
3.4.3 The Optimum Design Problem
The objective of the design is to maximize the SKE subject to certain geometrical
restrictions and strength requirements for a given rotational speed defined in
equation (3.16).
( )0;0,,, >≤≤ σδδµσδδ uLuL (3.16)
The continuous function W(r) for which the SKE occurs as Maxwke →),( ,
where ]1,0[∈r . The following constraints hold for ( ) uL rw δδ ≤≤ resulting in
equation (3.17).
( )1,1,2 ≤≤≤
∂
∂τσ SS
r
rwR (3.17)
With the constraints defined, the stress behaviour of the shapes can be analysed for
high speed operation.
3.4.4 Optimal Shape for High-Speed Operation
During high speed rotation, the mass moves from the rim towards to the central hole
to increase the strength as shown in Fig. 3.7. The centre thickness must therefore be
guarded from violating both stress and maximum thickness constraints. The optimal
shape of this rotating free-disk is terminated at its slope as it converges to the upper
bound less than the given limit.
Figure 3.6: The optimal shape for the ultimate high speed profile
P4=P5=P6 P3
P1 P2
Central hole
Univers
ity O
f Cap
e Tow
n

83
The joining of many finite smooth curves is a path created by the radius r with the
parameter interval [P1, P6]. This interval was subdivided into five parts and at each
interval a continuous function is seen as the SKE attains its maximum on the
boundary of that subinterval. This is defined in equation (3.17).
( ) ( ) 2rkrw
dr
rdw−= (3.17)
This gives a solution in equation 3.18
( ) Akrrw +−= 22
21
log (3.18)
Where ( )rwA 3log=
Considering the focus is for P2 to P3, solution becomes
( )( )
22
2
1
3
2kr
erw
rw −
= (3.19)
The table 3.1 below shows the specifications of the optimal flywheel profile
developed as shown in Fig. 3.8.
Table 3.1: Specifications of the optimal flywheel
Results
Inertia 0.299kg.m2
Mass 12.04 kg
Outer radius 0.255m
Height 0.09 m
Univers
ity O
f Cap
e Tow
n

84
Figure 3.7: Optimal flywheel profile for 25,000 rpm
3.5 Hyperbolic Approach
This is the second profile design approach. Analytical stress solutions for isotropic
materials are used to derive the profile. In principle, the amount of energy stored in a
flywheel is given by equation (3.20) [3.6];
)2min
2max
(2
1ωω −= JE (3.20)
Where J is the moment of inertia and ω is the rotational speed of the flywheel
rotor.
The moment of inertia can hence be derived from equation (3.20) given the
rotational speed and amount of energy required from the storage system. The initial
mass of the flywheel system can be estimated given the volume required to store the
energy requirement and the density of the material [3.1] [3.6]. The volume is derived
from equation (3.21) below.
VolkE σααα ′′′′′′= (3.21)
Univers
ity O
f Cap
e Tow
n

85
Where E is the energy required, α ′ is the safety factor,α ′′ is the depth of discharge,
α ′′′ is the ratio between mass of the flywheel and mass of the system, σ is the
maximum tensile strength of the material and Vol is the volume of the profile
required to store the required energy
The initial mass is calculated from the mass, volume, density relation. As the energy
stored is proportional to the moment of inertia, the outer radius of the flywheel is
required and this can be derived from the relationship in equation (3.22) below,
which is used for estimating the moment of inertia of a cylinder. The final moment
of inertia for the required profile is approximately 90% of that of a cylinder.
( )22
21
io rrmJ += (3.22)
Where J is the moment of inertia, m is the mass of the flywheel, or is the outer
radius and ir is the inner radius.
The approximate values considered up to this point are for a cylinder, that is, mass,
height and radius; however the real profile values are a percentage of the cylinder
values as some material is sliced to generate the profile. Thus for various rotational
speeds, different factors should be used to derive optimized results.
3.5.1 Design Literature
This design work is developed from solutions in [3.15-3.18] on steam and gas
turbine work on variable disks. Due to problems associated with stresses and
deformation in flat disks rotating at high speeds in steam and gas turbines, a
methodology of increasing the thickness at the centre to increase the strength of the
turbine was established. This approach was used to develop a non-uniform stress
approach to flywheel profile design.
By writing all forces acting on an element of unit thickness gives;
Univers
ity O
f Cap
e Tow
n

86
( ) 022 =+− rrdr
dhr ρωσσ (3.23)
Where r is the radius, rσ is the radial stress and hσ is the hoop stress.
A new equilibrium equation can be derived from equation (3.23) giving;
( ) 022 =+− rhhhrdr
dhr ρωσσ (3.24)
From Hooke’s law, the displacement can be established from equations (3.25) and
(3.26).
)(1
hrEdr
duµσσ −= (3.25)
)(1
rhEr
uµσσ −= (3.26)
Where u is the displacement (strain) and E is the Young’s modulus
Eliminating u from equations (3.25) and (3.26) gives a compatibility equation (3.27)
which holds for variable thickness.
)(1
)()( rhrhrdr
d
dr
dσσ
µσµσ −
++− (3.27)
Eliminating the hoop stress from equation (3.23) and (3.27) we obtain a result that is
variable of the radial stress only. Differentiating equation (3.23) and substituting into
equation (3.27) gives a differential equation (3.28) as shown below.
( ) ( ) ( ) 03)()()( 322 =++
−
′′−+′+′′ hrhrhrr
h
hrhrhrrhrr rrrrr ρωµσµσσσσ
(3.28)
Univers
ity O
f Cap
e Tow
n

87
For disks of variable thickness, the radius and thickness are related by the thickness
function
q
i
r
hh = (3.29)
Where q is any positive number.
As the outer height of the flywheel varies with radius to cope with varying rotational
speeds, the equation is modified to;
q
i
o
o
i
r
r
h
h
= (3.30)
Hence, substituting equation (3.29) into equation (3.28) gives a linear equation as
shown below;
( ) ( ) ( ) ( ) 03 322 =++−′
+″
rrrrrr rrr ρωµσσσ (3.31)
Equation (3.31) has variable coefficients so that a reduced equation (3.32) can be derived when 02 =ρω
n
r rhr =σ (3.32)
Where n is a solution to a generated quadratic equation.
The values of n are solved from the quadratic equation
++±
−= 1
42&
2
21 qqq
nn µ (3.33)
To solve for the radial stress, two simultaneous equations are generated from
equation (3.34) with the assumption that for non-uniform stress profiles, the radial
stress at the inner radius and the outer radius is zero; hence two simultaneous
equations can be generated and solved.
Univers
ity O
f Cap
e Tow
n
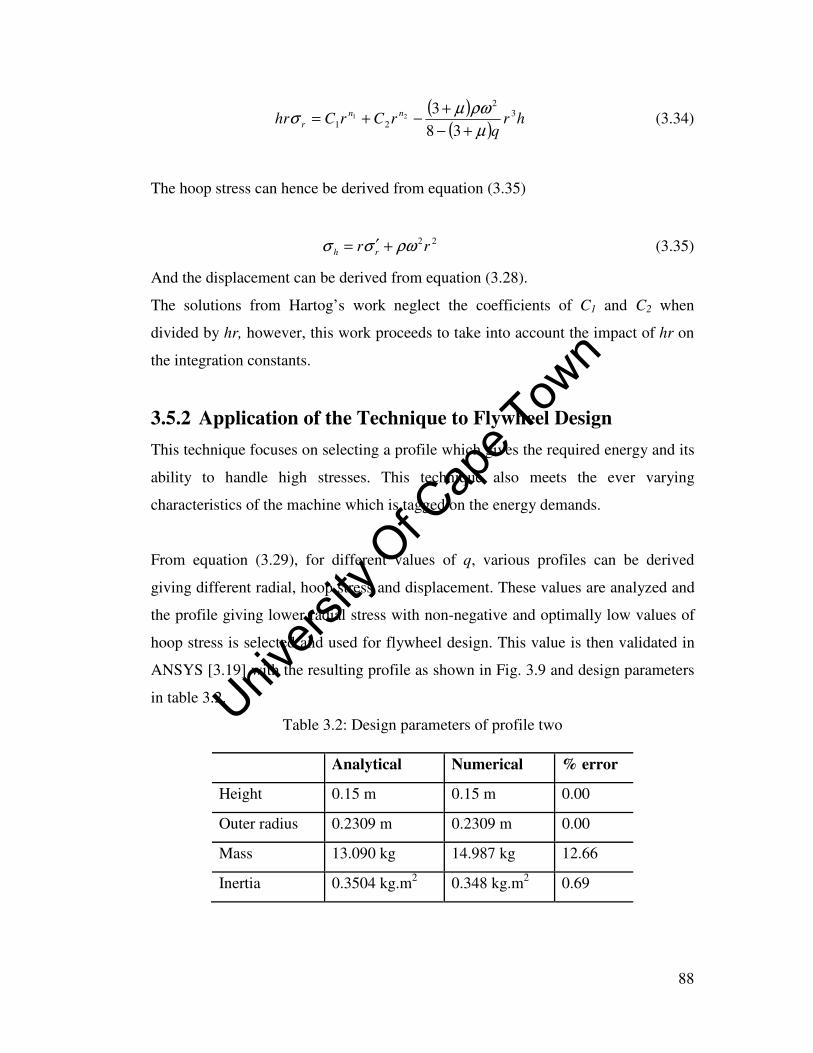
88
( )( )
hrq
rCrChrnn
r
32
21 383
21
µ
ρωµσ
+−
+−+= (3.34)
The hoop stress can hence be derived from equation (3.35)
22rr rh ρωσσ +′= (3.35)
And the displacement can be derived from equation (3.28).
The solutions from Hartog’s work neglect the coefficients of C1 and C2 when
divided by hr, however, this work proceeds to take into account the impact of hr on
the integration constants.
3.5.2 Application of the Technique to Flywheel Design
This technique focuses on selecting a profile which gives the required energy and its
ability to handle high stresses. This technique also meets the ever varying
characteristics of the machine which is tagged on the energy demands.
From equation (3.29), for different values of q, various profiles can be derived
giving different radial, hoop stress and displacement. These values are analyzed and
the profile giving lower radial stress with non-negative and optimally low values of
hoop stress is selected and used for flywheel design. This value is then validated in
ANSYS [3.19] with the resulting profile as shown in Fig. 3.9 and design parameters
in table 3.2.
Table 3.2: Design parameters of profile two
Analytical Numerical % error
Height 0.15 m 0.15 m 0.00
Outer radius 0.2309 m 0.2309 m 0.00
Mass 13.090 kg 14.987 kg 12.66
Inertia 0.3504 kg.m2 0.348 kg.m2 0.69
Univers
ity O
f Cap
e Tow
n

89
Figure 3.8: 3-D view of flywheel profile
3.6 Modal Analysis
In high-speed flywheel design, emphasis must be taken in accurately predicting the
natural frequencies of the rotor at the design stage so as to minimize high vibration
when operating through resonant frequencies [3.20]. Accurate prediction also lowers
the probability of failure [3.21]. Modal analysis is also used to predict critical speed
and damage of structures [3.22] using mode shapes and natural frequencies.
Analytical and FE analyses are used to establish the natural frequencies and modes
of the flywheel rotor and to verify the influence of the shaft length, shaft diameter,
the bearings, and the material properties. In this work, the shaft length and bearings
are varied while the material properties are kept constant.
In [3.21], the shaft frequencies are calculated using equation (3.36) below [3.23] and
the analytical results were compared to the numerical results with a close
correlation. However, the simplifications in the analytical models may cause
undesirable errors [3.24].
Univers
ity O
f Cap
e Tow
n

90
41 l
EIann
µω = (3.36)
Where E, I, µ1, l are the Young’s modulus, inertia, mass per unit length, and length
of the shaft, respectively, and an is a numerical constant calculated by the Rayleigh
method, which is dependent on the problem boundaries.
FE solutions on the other hand can be used to ascertain the natural frequencies and
accurately predict the modes [3.21] [3.24]. For example, cylindrical and conical
modes introduced by mounting of the rotor in bearings require FEA to accurately
predict.
A modal analysis was done to ensure that the flywheel system design operates in the
sub-critical region and also to ascertain the natural mode shapes and frequencies
during free and pre-stressed vibration. Residual unbalance in the flywheel, which is
inevitable, can excite critical speeds in the rotor-bearing systems and are a function
of unbalance and shaft speed.
To ensure a safe operating point from the design stage, the shaft length was varied
and the results observed. Initially, a 500mm long shaft with 25mm diameter was
considered however a preliminary analysis indicated low natural frequencies. A
365mm long shaft with 30mm shaft diameter was later considered giving more
desirable results. The variation of the shaft diameter and length was limited by the
by the peripheral speed of the commercially high speed ceramic and energy efficient
bearings. After manufacture of the flywheel, static and dynamic balancing was
performed to ensure reduction of residual unbalance.
3.6.1 Analytical Approach
The symmetric rotor model developed in [3.25] is used to calculate the analytical
natural frequencies. The rigid body translational frequencies, 1γ , 2γ for the X and Y
are derived from equation (3.37) below.
Univers
ity O
f Cap
e Tow
n
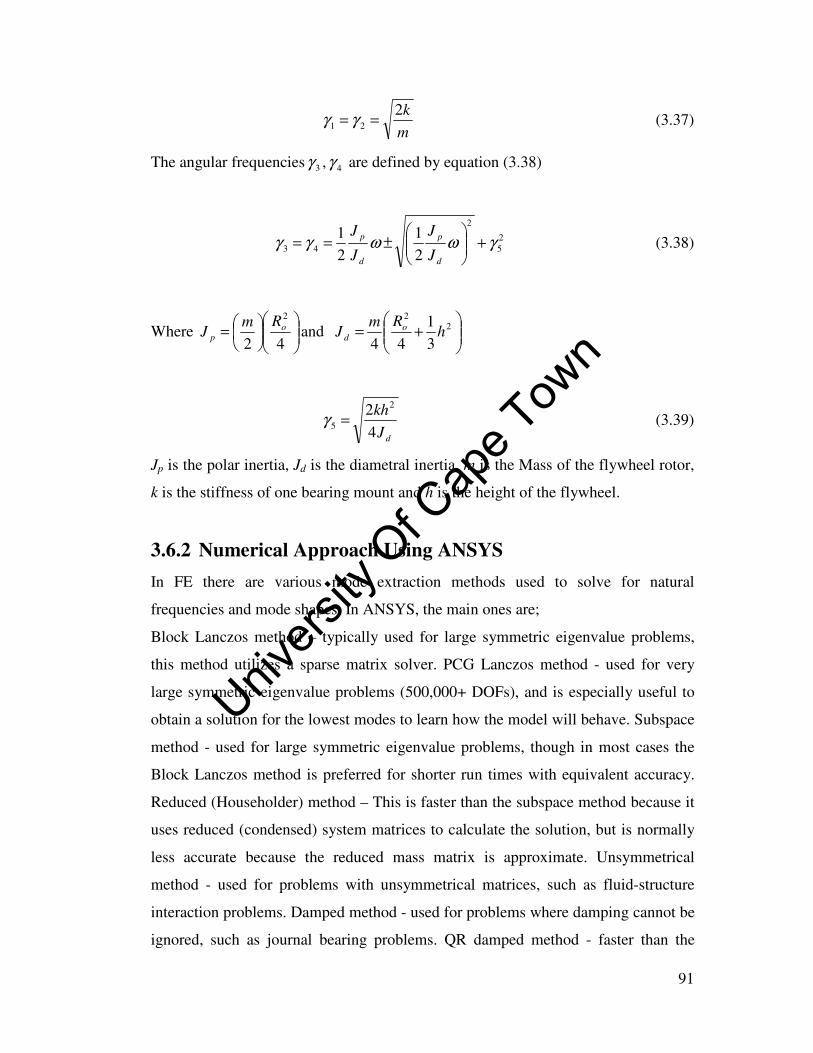
91
m
k221 == γγ (3.37)
The angular frequencies 3γ , 4γ are defined by equation (3.38)
25
2
43 21
21
γωωγγ +
±==
d
p
d
p
J
J
J
J (3.38)
Where
=
42
2o
p
RmJ and
+= 2
2
31
44h
RmJ o
d
dJ
kh
42 2
5 =γ (3.39)
Jp is the polar inertia, Jd is the diametral inertia, m is the Mass of the flywheel rotor,
k is the stiffness of one bearing mount and h is the height of the flywheel.
3.6.2 Numerical Approach Using ANSYS
In FE there are various mode extraction methods used to solve for natural
frequencies and mode shapes. In ANSYS, the main ones are;
Block Lanczos method – typically used for large symmetric eigenvalue problems,
this method utilizes a sparse matrix solver. PCG Lanczos method - used for very
large symmetric eigenvalue problems (500,000+ DOFs), and is especially useful to
obtain a solution for the lowest modes to learn how the model will behave. Subspace
method - used for large symmetric eigenvalue problems, though in most cases the
Block Lanczos method is preferred for shorter run times with equivalent accuracy.
Reduced (Householder) method – This is faster than the subspace method because it
uses reduced (condensed) system matrices to calculate the solution, but is normally
less accurate because the reduced mass matrix is approximate. Unsymmetrical
method - used for problems with unsymmetrical matrices, such as fluid-structure
interaction problems. Damped method - used for problems where damping cannot be
ignored, such as journal bearing problems. QR damped method - faster than the
Univers
ity O
f Cap
e Tow
n
92
damped method, this method uses the reduced modal damped matrix to calculate
complex damped frequencies.
3.6.3 Profile One Results
The profile one represents the ultimate shape profile. The results of the analytical
and FE simulations are shown in Fig. 3.10 and 3.11.
Figure 3.10: Modal analysis results
Fig. 3.10 plots these natural frequencies as a function of angular speed in rad/s and
the resonances which occur when the natural frequencies intersects with ω. From
this plot it can be seen that the all three of these resonance speeds fall above 24,000
rpm.
The FE results for profile one is given in Fig. 3.11. A vector deformation plot
provides the relative magnitude and orientation of displacement in response to the
loading environment.
Univers
ity O
f Cap
e Tow
n

93
Figure 3.11: FE results
The first critical speed occurs at 413.65HZ which represents 2,597 rad/s. A
comparison was considered between the analytical and FE and presented in Table
3.3.
Table 3.3: Comparison of analytical and FEA results for profile one
Critical speed (Rad/s)
Mode Analytical Finite Element
First 2,590 2,597
Second 2,650 2,715
There is a correlation between the analytical and FE results which shows the system
will be able to ramp to speed without passing through a critical speed. However, in
reality, this is not possible as the manufactured components have numerous
anomalies resulting from non-linearity of the materials.
3.6.4 Profile Two Results
Profile two represents the hyperbolic shape profile and the results of the analytical
and FE simulations are shown in Fig. 3.12 and 3.13.
Univers
ity O
f Cap
e Tow
n

94
Figure 3.12: Analytical results of the critical speed for hyperbolic approach
Figure 3.13: FEA results of the first and second natural modes for hyperbolic approach
Univers
ity O
f Cap
e Tow
n

95
Table 3.4: Comparison of analytical and FEA results for profile two
Critical speed (Rad/s)
Mode Analytical Finite Element
First 0 25
Second 0 29
Third 2,490 2,433
Fourth - 2,474
Fifth 2,750 2,709
The results of profile two also show a close correlation for the resonant frequencies.
3.7 Numerical Stress Analysis
Numerical stress analysis was performed to ensure that the entire system withstands
the static and dynamic forces applied to it. The FE analysis was performed using the
ANSYS package on both flywheel profiles. This is achieved when the determined
stress from the applied forces is less than the known maximum strength of the
material. A safety factor is considered in the design process as shown in section 3.4.
The solutions of the stress-strain relationship for orthotropic materials are an
extension of the isotropic solution.
For a uniform thickness ring, the stress distribution is given by equation (3.40):
02 =+−
+ rrdr
d rr ρωσσσ θ (3.40)
For orthotropic materials, the stress-strain relationship in the r and θ direction is
given by equations (3.41) and (3.42) [3.7] [3.26].
Univers
ity O
f Cap
e Tow
n

96
θ
θθ
θ
θθ
ευυ
υε
υυσ
rr
rrr
rr
rr
EE
⋅−+
⋅−=
11 (3.41)
θ
θθθθ
θθθ ε
υυε
υυ
υσ
rr
rr
rr
r EE
⋅−+
⋅−=
11 (3.42)
Solving equation (3.42) and equation (3.40) gives a differential equation solution in
equation (3.43).
322
22 1
rE
uE
E
dr
dur
dr
udr
r
rrr
r
rr ρωυυ θθθ ⋅
⋅−−=++ (3.43)
Solving equation (3.43) with the boundary conditions being [ ] 0==arrσ and
[ ] 0==brrσ gives:
( )
−
−
−
−
−
−
−
+−=
−
−
+−
−
+
1
2
3
1
2
3
2
2
22
1
1
1
1
9
3N
N
N
N
N
N
rr
b
r
b
a
b
a
b
r
b
a
b
a
b
r
N
bρωυσ θ (3.44)
( )
−
−
−
−
−
−+
+
−
+−=
−
−
+−
−
+
1
2
3
1
2
3
22
2
22
1
1
1
1
3
3
9
3
N
N
N
N
N
N
r
r
r
b
r
b
a
b
a
N
b
r
b
a
b
a
NN
b
r
N
b
θ
θ
θθ
υ
υ
ρωυσ (3.45)
Univers
ity O
f Cap
e Tow
n

97
( )
−
−
+−
−
−
−
++
+−
−
+=
−
−
+−
+
N
N
N
r
N
N
N
rr
r
r
b
r
a
b
a
b
N
b
r
b
a
b
a
Nb
r
N
b
Eu
2
3
2
3
3
2
32
1
11
1
11
31
931
θ
θθ
θθ
υ
υυ
ρωυ (3.46)
Where N is an orthotropic parameter and rE
EN θ=2
In the numerical package considered the stress analysis principle is the similar to
that mentioned. The stress-strain relationship is given by
[ ] elD εσ = (3.47)
Where σ is the stress vector, [D] is the elastic stiffness matrix and eel is the
elastic strain.
Equation (3.47) can be resolved into
[ ] σεε1−
+= Dth (3.48)
Where elth εεε += is the total strain vector, thε is the thermal strain vector.
For a symmetric system, the matrix is given such that
x
xy
y
yx
EE
υυ= (3.49)
x
xz
z
zx
EE
υυ= (3.50)
y
yz
z
yz
EE
υυ= (3.51)
Univers
ity O
f Cap
e Tow
n

98
This gives resulting solution for stress and strain as shown
( ) ( ) ( ) ( )
( )( )Th
E
TABE
E
h
ET
E
E
h
E
zzxyyzxzz
yy
y
zyzxzxy
y
xx
y
zyz
xx
∆−+
+∆−++∆−
−=
αευυυ
αευυυαευσ21
(3.52)
( ) ( ) ( )
( )TE
E
h
E
TE
E
h
ET
E
E
h
E
zz
x
y
xyxzyzz
yy
x
z
xz
y
xx
y
z
yzxzxy
y
y
∆−
+
+∆−
−+∆−
+=
αευυυ
αευαευυυσ21
(3.53)
( )( ) ( )
( ) ( )TE
E
h
E
TE
E
h
ET
h
E
zz
x
y
xyz
yy
x
y
xyxzyzz
xxxyyzxzz
z
∆−
−
+∆−
++∆−+=
αευ
αευυυαευυυσ
21
(3.54)
xyxyxy G εσ = (3.55)
yzyzyz G εσ = (3.56)
xzxzxz G εσ = (3.57)
Where ( ) ( ) ( )x
zxzyzxy
x
zxz
y
zyz
x
y
xyE
E
E
E
E
E
E
Eh υυυυυυ 21 222
−−−−=
For axisymmetrical models, the transformation is given by
[ ]
−−
−−
−−
=−
−−
zz
zy
z
zx
y
yz
yy
yx
x
xz
x
xy
x
zyx
EEE
EEE
EEE
D
1
1
1
1
υυ
υυ
υυ
(3.58)
Rearranging the transform into 3D elements using polar coordinate system gives
Univers
ity O
f Cap
e Tow
n
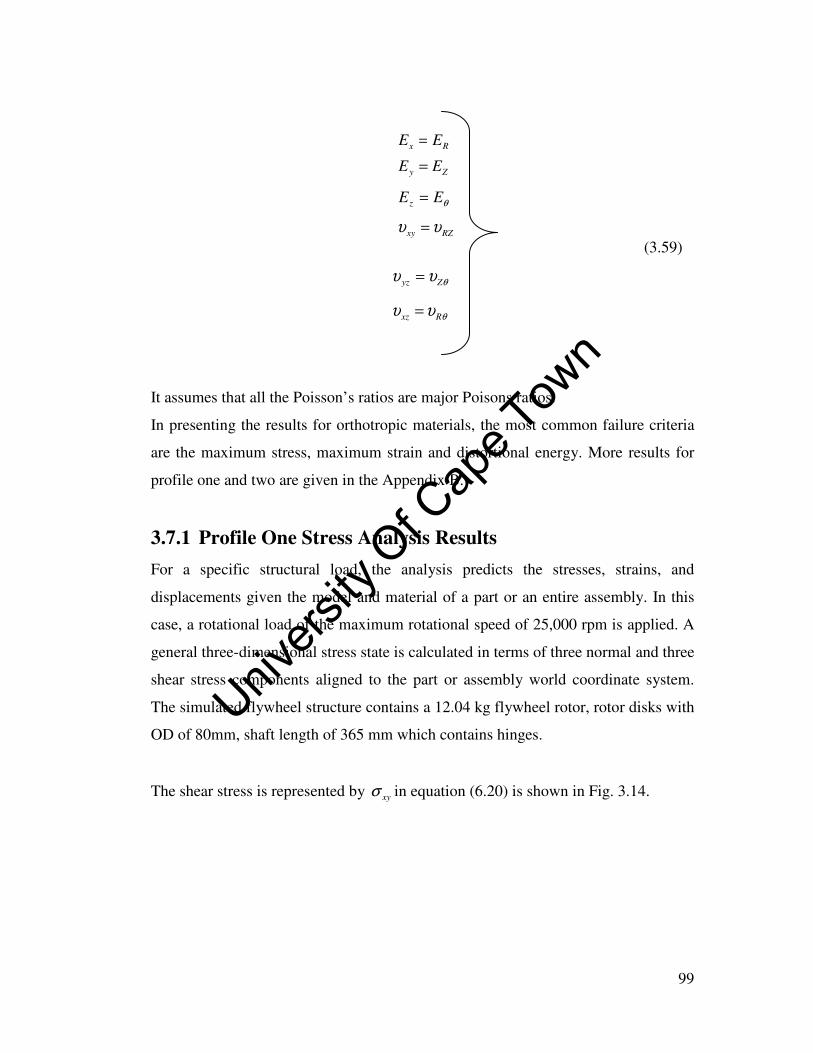
99
(3.59)
θυυ Zyz =
θυυ Rxz =
It assumes that all the Poisson’s ratios are major Poisons ratios.
In presenting the results for orthotropic materials, the most common failure criteria
are the maximum stress, maximum strain and distortional energy. More results for
profile one and two are given in the Appendix B.
3.7.1 Profile One Stress Analysis Results
For a specific structural load, the analysis predicts the stresses, strains, and
displacements given the model and material of a part or an entire assembly. In this
case, a rotational load of the maximum rotational speed of 25,000 rpm is applied. A
general three-dimensional stress state is calculated in terms of three normal and three
shear stress components aligned to the part or assembly world coordinate system.
The simulated flywheel structure contains a 12.04 kg flywheel rotor, rotor disks with
OD of 80mm, shaft length of 365 mm which contains hinges.
The shear stress is represented by xyσ in equation (6.20) is shown in Fig. 3.14.
RZxy υυ =
θEEz =
Zy EE =
Rx EE =
Univers
ity O
f Cap
e Tow
n

100
Figure 3.14: Shear stress distribution on XY plane for profile one
The shear stress was found to be 35.9MPa. This value is lower than the maximum
tensile strength of the flywheel components used, that is, steel, composite fibre and
the magnets.
According to elasticity theory, the principal stresses are the three normal stresses
remaining after an infinitesimal volume of material at an arbitrary point on or inside
the solid body can be rotated such that only normal stresses remain and all shear
stresses are zero. This is represented in Fig. 3.15 which shows the normal stress.
Univers
ity O
f Cap
e Tow
n

101
Figure 3.15: Normal stress of profile one
3.7.2 Profile Two Stress Analysis Results
An analytical stress approach was considered when designing this profile as shown
in chapter 2. This profile is based on the inertial mass and angular speed required to
store a specific amount of energy without failure. A numerical stress analysis was
performed to ensure the maximum allowable strength was not exceeded. Fig. 3.16
and 3.17 show the normal shear stress exerted on the flywheel system when a
rotational load of 25,000 rpm is applied. The simulated flywheel structure contains a
14.987 kg flywheel rotor, rotor disks with OD of 170 mm, shaft length of 365mm,
spacers in between the rotor disks.
Univers
ity O
f Cap
e Tow
n

102
Figure 3.16: Normal stress of profile two
The maximum normal stress occurs between the centre of the flywheel rotor and the
shaft. This results from the radial elongation between the shaft and flywheel as these
two adjoined components have different young’s modulus. This could result into
dynamic instability of the system as the shaft could create excessive unbalanced
forces on the bearing structure.
Figure 3.17: Shear stress distribution of profile two
Univers
ity O
f Cap
e Tow
n

103
The maximum shear stress occurs at the peripheral of the flywheel rotor. The
magnitude, given as 37 MPa is low as compared to the maximum strength of the
system. From the numerical stress analysis, it can be noted that the profiles one and
two can withstand the high stresses exerted during high speed operation.
3.8 Analysis of Profile Two with Modifications
During the prototyping phase, a few adjustments were made to the flywheel rotor
profile two. This was done to ease on the manufacturing as elaborated in chapter 4.
This hence required new simulations. Other modifications made include:
• Central hole made larger from 1mm to 3mm
• Elastomeric layer used for shaft to reduce on the flywheel radial elongation.
Central hole was changed from 30mm to 35mm to accommodate the layer.
• A new machine (500W) was used to run the flywheel. The system consists of
rotor disks with OD of 170mm with an overhang with grub screw and two
aluminium retainer rings.
• A new stainless steel shaft with a key way and spacers was also considered.
• The modified flywheel rotor changed from 14.987kg to 17.6kg mass.
Univers
ity O
f Cap
e Tow
n

104
Figure 3.18: Profile two with modifications
Stress and modal analysis were performed on the modified integrated flywheel, shaft
and machine. The results are discussed below. The combination of both isotropic
and orthotropic materials in the combined system means that Von Mises failure will
not be used for predicting failure. Maximum stress, maximum strains among others
are commonly used failure criteria [3.27] and will be used to predict structural
performance of the flywheel system. The simulated flywheel structure contains a 20
kg flywheel rotor, rotor disks with OD of 170mm, shaft length of 365mm, spacers in
between the rotor disks
3.8.1 Numerical Stress Analysis
The two stress and strain results used for post processing are the maximum shear
stress and maximum principal stress. More of the results are given in the Appendix
B and these include the maximum principal strain, normal stress, shear stress.
The maximum shear stress τmax, is given as in equation (3.60) [3.19].
Flywheel rotor
Rotor disk with overhang and grub screw
Stator winding
Univers
ity O
f Cap
e Tow
n

105
231
max
σστ
−= (3.60)
Where 1σ is the first principal stress and 3σ is the third principal stress.
The derivation of the maximum shear stress can also be explained using Mohr’s
circle. The simulation results from applying a rotational load on the modified
systems are shown in Fig. 3.19-3.20.
Figure 3.19: maximum shear stress of modified profile two
The maximum tensile strength of the material used in the flywheel is 484 MPa with
a safety factor. The 3D result shows a maximum shear stress of 590 MPa which is
higher than the nominal strength. However, on closer observation as shown in Fig.
3.20, the high stresses originate from the centre of the flywheel system.
Univers
ity O
f Cap
e Tow
n

106
Figure 3.20: 2D maximum shear stress of modified profile two
This is attributed to the modelling of the elastomeric layer and interference fit. In
addition, the increased mass of the flywheel rotor stretches the shaft. Fig.3.21 and
3.22 show the maximum principal stress.
Figure 3.21: maximum principal stress of modified profile two
Univers
ity O
f Cap
e Tow
n

107
Figure 3.22: Maximum principal stress of modified profile two
It is observed from Fig. 3.22 that the maximum stress is higher than the nominal
strength however; the average stress all over the flywheel system is approximately
332 MPa. The sporadic high stresses are a result of modeling and non-linearity
which could occur experimentally.
From the simulations, it was observed that a more high strength with adjoining
Young’s modulus be considered to reduce the high stresses at the interface of the
rotor and shaft. Most importantly, the design parameters used for simulations are for
66% glass content yet the final product was manufactured with 70-74% fibre
content. This was possible using the technique mentioned in the prototyping section.
3.8.2 Numerical Modal Analysis
The results of the numerical modal analysis for the modified system are presented in
the Fig. 3.23 and 3.24. The free vibration and pre-stressed modal analysis results are
presented. The first significant deformation is the fourth mode happening at
232.58HZ.
Univers
ity O
f Cap
e Tow
n
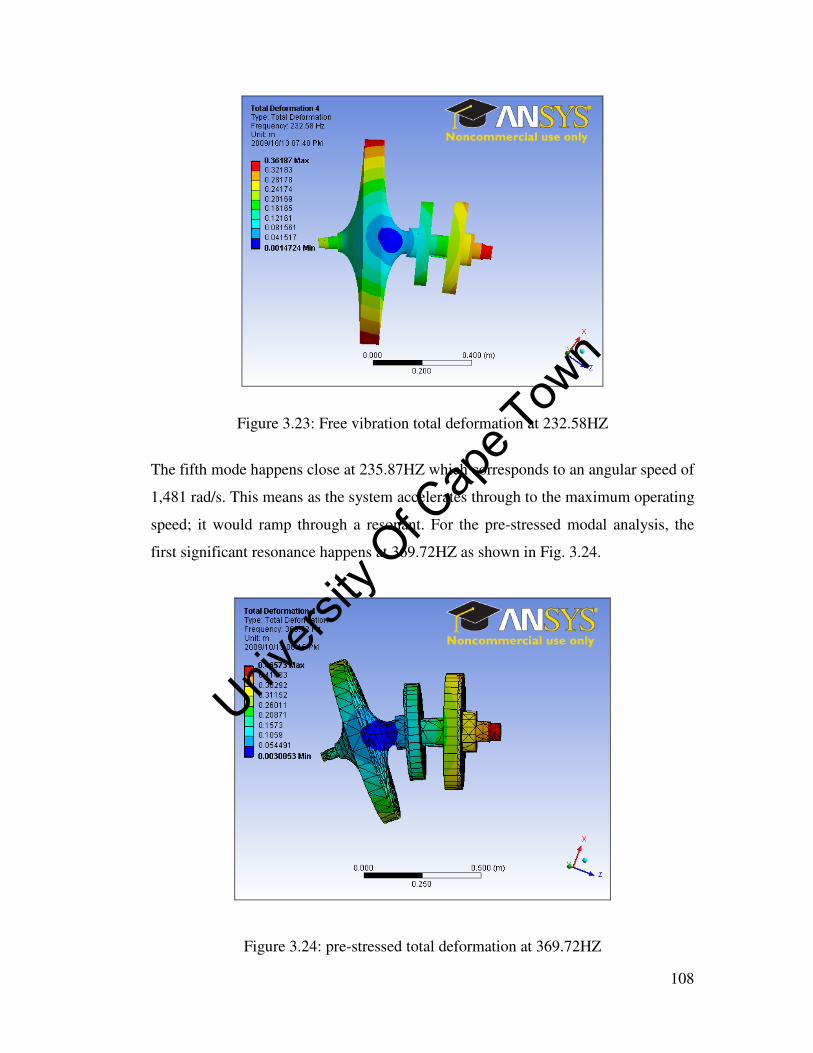
108
Figure 3.23: Free vibration total deformation at 232.58HZ
The fifth mode happens close at 235.87HZ which corresponds to an angular speed of
1,481 rad/s. This means as the system accelerates through to the maximum operating
speed; it would ramp through a resonant. For the pre-stressed modal analysis, the
first significant resonance happens at 369.72HZ as shown in Fig. 3.24.
Figure 3.24: pre-stressed total deformation at 369.72HZ
Univers
ity O
f Cap
e Tow
n

109
There is a significant difference in the simulation results of the two systems. The
modifications in the flywheel, shaft and electrical machine resulted in changes in the
system. The first resonances happen in the operating speed range of the flywheel
system. However, the deformation and strain do not interfere with the containment
structure as this was designed with a good clearance. This can be solved by
expanding the operating speed range to avoid resonance. The advantage of this is the
following resonances occur far beyond the maximum operating speed. However, this
would mean reducing the safety margin of the system.
The discrepancy from the previous design results arise from:
• Increased mass portions on the flywheel rotor
• Increased shaft mass, rotor disks and magnets
• Change in stiffness of the bearing structure used
• Also, the inclusion of the key way
• Change in material properties
3.9 Concluding Remarks
This chapter explains the various flywheel system topologies. The pros and cons of
each are given. The flywheel rotor profiling, which is a critical element in flywheel
design is given. Two methodologies are given to derive the profiles with low stress
rotors. The parameters and shapes are used to manufacture the flywheel rotors as
shown in chapter 4.
3.10 References
[3.1] P. I. Tsao, "An integrated flywheel energy storage system with a homopolar
inductor motor/generator and high-frequency drive," Ph.D Thesis, U.C.
Berkeley, September, 2003.
Univers
ity O
f Cap
e Tow
n

110
[3.2] G. Rui, "Magnetic bearings for flywheel energy storage," MSc Thesis,
Clarkson University, 2008.
[3.3] S. Robert, Wesibach, G.G. Karady and R. G. Farmer, "A combined
uninterruptible power supply and dynamic voltage compensator using a
flywheel energy storage system," IEEE Transactions on Power Delivery, vol.
16, April 2001.
[3.4] F. J. M. Thoolen, "Development of an Advanced High speed Flywheel for
Energy Storage System," PhD thesis, Eindhoven University of Technology,
1993.
[3.5] F. N. Werfel, U. Floegel-Delor, T. Riedel, R. Rothfeld, D. Wippich, B.
Goebel, G. Reiner, and N. Wehlau, "A compact HTS 5 kWh/250 kW
flywheel energy storage system," IEEE Transactions on Applied
Superconductivity, vol. 17, No. 2, June 2007.
[3.6] G. Genta, Kinetic Energy Storage, Theory and Practice of Advanced
Flywheel Systems, Butterworth & Co. Ltd; 1985.
[3.7] S. Kitade, "Comprehensive composite materials," chapter 6: flywheel, vol. 6,
Elsevier, pp.571-580, 2000.
[3.8] S. Ginter, G. Gisler, J. Hanks, D. Havenhill, W. Robinson and L. Spina,
"Spacecraft energy storage systems," NAECON, 1997.
[3.9] R. F. Post, T. K. Fowler, S. F. Post, "A high efficiency electromechanical
battery," in Proceedings of the IEEE, vol. 81, No.3, March 1993.
Univers
ity O
f Cap
e Tow
n

111
[3.10] M. Berger and I. Porat, Optimal design of rotating disk for kinetic energy
storage, Faculty of mechanical engineering, Technikon-Israel institute of
technology, Haifa Israel.
[3.11] G.R. Kress, "Shape optimization of a flywheel," Struct. Multidisc. Optim,
vol. 19 No.1, pp. 74-81, 2000.
[3.12] J.M. Chern, W. Prager, "Optimal design of rotating disk for given radial
displacement of edge," Journal of optimization theory and applications, vol.
6, no. 2, 1970.
[3.13] D. Eby, RC Averill, "An injection island GA for flywheel design
optimization," Artificial Intelligence in Engineering, design, analysis and
manufacturing, vol. 13, pp. 389-402, 1999.
[3.14] D. Johnson, "Design considerations and implementation of an
electromechanical battery system," Ph.D. dissertation, Dept. Electrical
Engineering, University of Cape Town, 2008.
[3.15] S.Timoshenko, Strength of Materials. Huntington, N.Y: R. E. Krieger Pub.
Co, 1976.
[3.16] J.H. Faupel, F.E Fischer. Engineering Design, a Synthesis of Stress Analysis
and Materials Engineering. 1st ed. New York: Wiley; 1964.
[3.17] D. Hartog, J. Pieter. Advanced strength of materials. Network McGraw-hill:
1952.
[3.18] A. Stodola. Steam and gas turbines. McGraw-Hill Book Company, Inc;
1927.
Univers
ity O
f Cap
e Tow
n

112
[3.19] ANSYS, Inc Theory Reference, ANSYS Release 9.0.002114. SAS IP Inc
[3.20] B. T. Murphy, J. R. Kitzmiller, R. Zowarka, J. Hahne and A. Walls,
"Rotordynamics and test results for a model scale compulsator rotor, " IEEE
Transactions on Magnetics, vol. 37, issue 1, pp. 310-313, 2001.
[3.21] J. D. Ede, Z. Q. Zhu, and D. Howe, "Rotor resonances of high-speed
permanent-magnet brushless machines," IEEE Transactions on Industry
Applications, vol. 38, No. 6, Nov/Dec. 2002.
[3.22] R.J. Wang, D.G. Shang , L.C. Li, and C.S. Li, "Fatigue damage model based
on the natural frequency changes for spot-welded joints," International
Journal of Fatigue, vol.30, pp. 1047–1055, 2008.
[3.23] D. Hartog, Mechanical Vibrations, 4th ed., New York: McGraw-Hill, 1956,
pp.285-337
[3.24] W. Cai and P. Pillay,"Resonant Frequencies and Mode Shapes of Switched
Reluctance Motors," IEEE Transactions on Energy Conversion, vol. 16, no.
1, march 2001.
[3.25] E. Kramer. Dynamics of Rotors and Foundations. New York: Springer-
Verlag, 1993.
[3.26] E. L. Danfelt, S. A. Hewes, T. W. Chou, "Optimization of composite
flywheel design," Int. J. Mech sci, vol.19, pp. 69-78, 1977.
[3.27] G. Genta, The shape factor of composite material filament wound flywheels.
Composites, IPC Business press Ltd, April 1981.
Univers
ity O
f Cap
e Tow
n

113
Chapter 4
Prototyping of System
Components ____________________________________________________________________
This chapter discusses the procedure manufacturing the flywheel rotor, rotor disks
and stator windings of the system.
4.1 Introduction
In chapters two and three, the designs of the flywheel components were discussed.
This chapter describes the manufacturing procedure of the flywheel rotor and
electrical machine. The major problems faced during construction are described.
4.2 Flywheel Rotor Construction
There are various methods that have been used in manufacturing composites for
flywheel rotors [4.1-4.3]. The failure of these structures is dependent on a number of
parameters. For example, the single-material, circumferentially-wound composite
rims suffer from limited inner to outer radius ratio range. The solid disks with single
or multi-oriented fibres with radial profiles are hindered by stress concentrations on
the surfaces, have complex shaft attachment and are expensive to manufacture.
Composite structures with radially thin rims made by winding high strength fibres in
the circumferential direction which achieve higher specific energy than other
composite structures [4.4]. These rims are easily manufactured with low cost
Univers
ity O
f Cap
e Tow
n

114
however thicker rims cannot be achieved due to limited radial strength [4.5]. In
addition, the radial growth of the flywheel against the shaft is essential especially
with a metallic shaft. With this technique, the successive layers can be oriented
differently from the previous layer to vary performance of the composite structure.
Circumferentially wound rings can be improved by reducing the radial stress and
also by improving the radial strength. In the single rim, the energy density can be
increased by:
• Increasing the ratio of circumferential Young’s modulus to mass density,
Eh/q, with increasing radius.
• Pre-stressing the filament wound rims to induce residual radial compressive
stresses.
Thicker rims can be achieved in this technique by increasing the radial strain to
failure and decreasing the radial Young’s modulus of a filament wound composite
rim. The radial stress can be reduced by using multi ring filament wound rims.
These are the most commonly used for commercial flywheel rotors and achieve high
energy densities. In addition, these multi-ring rotors exhibit natural frequencies far
beyond the operating speed range [4.6]. Choosing two rings of different materials
can change the stress distribution enormously. However, residual thermal stresses
are often a sizeable percentage of the radial tensile strength of the composite and
must be accounted for [4.5] [4.7].
The radial strength can also be improved by using layered laminates, woven fabrics
among others; however this complex fibre laying can lead to delamination and micro
cracking at relatively low stress levels [4.8] [4.9].
A woven ribbon was developed in ETH Zurich for small power application
flywheels [4.3]. With this technique, unidirectional fibres under large pretension on
the hub is pre-stressed by winding the fibres. Stress distribution is optimized by
Univers
ity O
f Cap
e Tow
n

115
varying the pretension. Energy densities to a tune of 100Wh are realised with this
approach.
In this particular research, the profiles of the flywheels are liable to homogeneity
problems, balancing concerns and inclusion of a central hole which creates a
dynamic instability problem. The two approaches considered in this thesis include
casting and the layered and are discussed in the following sections.
4.2.1 Development of the Cast Flywheel Rotor
This process was considered using chopped fibre which results in better
homogeneity of the end product. However, the length of the fibre is critical as short
fibres do not reinforce as effectively as long or continuous fibres [4.10]. The
advantages of short fibre composites are that they can be easily formed into complex
shapes, by casting, injection, layering and spraying [4.11]. Fibres longer than the
minimum critical length are only marginally weaker than a continuous fibre
composite and were not considered for this design. This is particularly of interest in
this research as complex shapes are used to derive the required stress distributions
and material optimization. In addition, the critical length of a fibre is determined by
evaluating the process of load transfer. The load transfer mechanism results in end
effects which may reduce the fibre stress as shown in Fig. 4.1.
Figure 4.1: Stress distribution over a short fibre
σ
2cl
2cl
Univers
ity O
f Cap
e Tow
n

116
The alignment of the short fibres is also difficult to control and randomly-oriented
short fibres cannot be packed at such high volume fractions as continuous fibres. At
fibre ends, the strain in the matrix is higher than in the fibre and the load to the fibre
is transferred through the shear strength between the fibre and the matrix interface.
When a stiff fibre is embedded in a relatively flexible matrix, shear stress and strain
are a maximum at the fibre ends. The tensile stress, on the other hand, is zero at the
fibre end and increases towards the centre. A fibre is said to be of the critical length
if it is just long enough for the tensile stress to reach its maximum value.
Considering a half fibre, the maximum tensile force in the fibre with a diameter, D is
balanced by the shear force at the fibre/matrix interface giving:
(4.1)
τ
σ
2
maxD
Lf
c = (4.2)
τ
σλ
2
maxfc
cD
L== (4.3)
Critical fibre as defined in [4.12] thus depends on τ, the interfacial or matrix shear
strength, and varies according to both fibre and matrix and because of the low stress
at fibre ends, the average stress in the fibre will be lower than that in a continuous
fibre, even if it is longer than the critical length. The interface between fibre and
matrix is crucial to the performance of the composite. For example, weak interfaces
provide a good energy absorption mechanism however the composite results having
low strength and stiffness with high fracture toughness. Strong interfaces on the
other hand provide strong, stiff but brittle composites.
There are various mechanisms that explain the nature of adhesion between fibre and
matrix and these can be explained as follows. Adsorption and wetting involves
accumulation of atoms or molecules on the surface of the material and this depends
24
2max cf
DLD τππσ =
Univers
ity O
f Cap
e Tow
n

117
on the surface energies of the two surfaces. Glass and carbon are readily wetted by
epoxy and polyester resins, which have lower surface energies. Interdiffusion
(autohesion) - diffusion and entanglement of molecules: Electrostatic attraction -
important in the application of coupling agents. Glass fibre surface may be ionic
due to oxide composition: Chemical bonding - between chemical group in the matrix
and a compatible chemical on the fibre surface: Mechanical adhesion - depending on
degree of roughness of fibre surface.
In this process, a high strength rotor design with a good safety factor can be
achieved as the resulting strength of the shape which is approximately half of the
unidirectional laminate. For an even fibre distribution and orientation, the main
cause of failure is fibre pullout which is defined as:
24
2cc
fp
ld
l
lW
τπ
= (4.4)
Where Wfp is the fibre pullout work, lc is the critical fibre length, l is the fibre length,
d is the fibre diameter and τ is the maximum interface shear stress
The number of fibres per volume fraction can be written as.
2d
VN
f
⋅=
π (4.5)
Where N is the number of fibres, Vf is the volume fraction and d is the fibre
diameter.
Multiplying equation (4.4) with (4.5) gives the total amount of work as:
ld
lVW
cf
fp 24
3τ= (4.6)
Univers
ity O
f Cap
e Tow
n

118
The master plugs for the profiles designed in chapter two were machined from
supawood as shown in Fig.4.2 and 4.3. Supawood is an inexpensive wood product
which is often used for making plugs for composite manufacture.
Figure 4.2: Hyperbolic profile mould
Figure 4.3: Optimal profile mould
The parts were over sized by 3mm, in order to allow for shrinkage. Two female
moulds were then made using the master plugs as the manufacture of the flywheel
rotor in one piece was cumbersome, especially with the heat generated during curing
of the thick centre section as shown in Fig. 4.4.
Univers
ity O
f Cap
e Tow
n

119
Figure 4.4: Failed manufacture of optimal shape
The mould surface was coated with a release agent, wax. The E-glass short fibres
and epoxy resin were measured, mixed and poured into the moulds. The heating
problem was solved partially by splitting the flywheel in two halves and this reduced
the cracking significantly as in Fig. 4.5.
Figure 4.5: Optimal shape after completion without central hole
Univers
ity O
f Cap
e Tow
n

120
Once the E-glass/epoxy composite had cured, the two halves were surfaced and
glued together with a milled fibre-epoxy composite. This did not affect the strength
of the structure, as all the stresses were limited to the plane of rotation i.e.
perpendicular to the axis of rotation. Using this method, other flywheels can be
manufactured inexpensively, given the basic tools and skills. For a mass produced
flywheel of unique profiles, the moulds can be inexpensively manufactured with
aluminium moulds.
The benefits of this method of manufacturing the flywheel are that the special shape
yields a higher SKE, reduced material cost and lower overall cost of production.
As a result of the complexity in manufacture, only 30-40% fibre was used. This
significantly reduced the ultimate strength of the composite flywheel. For the casting
profiles, the stainless steel shaft was press-fitted onto the flywheel as in Fig. 4.6.
Figure 4.6: Hyperbolic profile after manufacture with shaft
Further, during the manufacture, the areas around the flywheel cracked. This was
attributed to the thin layer around the hole and the low percentage of fibre in the
composite. Increasing the size of central hole wall was considered in the layered
flywheel to eliminate the cracking.
Univers
ity O
f Cap
e Tow
n

121
4.2.2 Development of the Layered Flywheel Rotor
This is also called the laminating method and is mainly considered to improve the
radial strength created when using the filament wound. This method makes use of a
vacuum and autoclave assisted resin transfer moulding process. The flywheel was
manufactured using layers of woven fibre glass and epoxy resin to a fibre to resin
ratio of at least 70-74%. The woven fibre is layered in several directions to improved
strength in all directions with acceptable thickness levels. The final geometry is then
CNC machined to specification.
In the first instance, the fibre was layered and resin injected. Due to the viscosity of
the resin and compactness of the fibre, the resin was not able to penetrate the entire
flywheel. This created voids in the product. To eliminate the reoccurrence of the
voids, the profile was subdivided into six parts as shown in Fig. 4.7.
Figure 4.7: Six parts of hyperbolic profile for easy manufacture
Univers
ity O
f Cap
e Tow
n

122
The six parts were manufactured separately and joined using high strength adhesive.
This was sufficient to withstand the axial forces exerted on the flywheel. The profile
was then CNC machined to create the profile shown in Fig. 4.8.
Figure 4.8: Complete hyperbolic profile using layered technique
With this technique, a high fibre to resin ratio was achieved. The final product had
an inner diameter of 35mm, outer diameter of 460mm with a mass of 17.6kg. The
increased inner diameter meant a change in the shaft connection used. An
elastomeric bushing was utilised to reduce on the radial elongation between the
flywheel and shaft. These bushings for shaft-flywheel connections have been
explored in [4.3] [4.10] with no inherent problems.
4.2.3 Static and Dynamic Balancing
In practice, constructing a well balanced rotor is difficult. There are usually residual
masses which cause the centre of gravity not to coincide with the nominal
geometrical centre and the rotational axis not to coincide with the principal axes of
inertia. The unbalance occurs as static and dynamic unbalance. Static balancing is a
state of balance existing such that the body exhibits equilibrium under the action of
static forces. The unbalance due to static forces is expressed as 2ωmu . Dynamic
balance exists when a mass is distributed about an axis of rotation such that it does
Univers
ity O
f Cap
e Tow
n

123
not have a tendency to displace the axis of rotation when subjected to rotational
forces. The dynamic results into a moment ( ) 2χωpt JJ − .
Consider a rotor rotating about an axis at an angle χ . If the principal inertia is z,
then the angular moment H is [4.13]:
iJkJH tp χωχω sincos −= (4.7)
Differentiating with respect to time
dt
idJ
dt
kdJ
dt
Hdtp χωχω sincos −= (4.8)
( ) ( ) jJJjJJdt
dHptpt χωχχω −−≅−−= 22 cossin (4.9)
Where jidt
diχωω cos=×= and jk
dt
dkχωω sin=×=
This gives ( ) jJJdt
HdM pt χω −== 2 (4.10)
Static and dynamic balance is achieved by adding or removing a mass from the
flywheel in both planes perpendicular to the axis of rotation. In this case, the
flywheel is considered as a rigid body. Static and dynamic balancing was done on
both profiles to reduce vibrations, noise and maintain the bearing life as in Fig. 4.9.
Univers
ity O
f Cap
e Tow
n

124
Figure 4.9: Flywheel with shaft being balanced
It was noted that profile two was more unbalanced and this was attributed to the
poor fibre distribution at the thick edges of the profile. Table 4.1 gives the balancing
results.
Table 4.1: Balancing results of the flywheel profiles
Casting Layered
Parameters Profile 1 Profile 2 Profile 2
Specifications ISO 1940
Grade G2.5
Speed 2,000 rpm 1,000 rpm
Unbalance, left 14gr 35gr 10gr
Unbalance, right 0gr 0gr 0gr
Residual unbalance, left 0.02gr 0.02gr 0.1gr
Residual unbalance, right 0gr 0gr 0gr
gr- grams
Univers
ity O
f Cap
e Tow
n

125
4.2.4 Comparison of Casting and Layered Manufacturing
Techniques
The two manufacturing techniques were considered so as to reduce the cost of the
overall system without compromising on the structural integrity. Two flywheel
rotors of different profiles were considered for the casting while only profile two
was considered for the layered technique. The amount of fibre to resin ratio was
found to be between 30 to 34% in the casting technique as compared to the layered
technique with 70 to 74% fibre to resin ratio. It was realised that the casting
approach was not able to withstand high stresses however, this technique was five
times less expensive to manufacture as compared to the layered technique.
Improvements in the casting technique can increase the strength of the composites
for mass production. Use of aluminium moulds and vacuum bagging can
considerably increase the strength. The stainless steel connections of the two profiles
manufactured using the casting technique were pres-fitted while the shaft of the
layered profile two flywheel was connected using an elastomeric layer.
4.3 Electrical Machine Construction
Two machines were constructed, a 100W, 36V and a 500W, 150V all with a current
rating of 10A. Design and construction concerns realised in the 100W machine were
used to improve on the structural integrity of the 500W machine. The details of the
problems are mentioned in chapter 6. Both electrical machines are AFPM with
BLDC mode of operation. The major components in the machine are the rotor disks
containing PMs and the stator windings.
4.3.1 Rotor Disks
In the 100W machine, the rotor consists of two disks containing NdFeB magnets.
The rotor disks were constructed with 300WA low carbon steel and are 84mm in
diameter. The design is a four pole machine that uses arc magnet segments with a
Univers
ity O
f Cap
e Tow
n

126
thickness of 10mm, outer diameter of 80mm and inner diameter of 40mm. They are
galvanized NdFeB magnets. These were glued onto rotor disks and epoxy resin was
poured into the spaces between the PMs which improved the retention of the
magnets. The position of the PMs is further reinforced by placing a stainless steel
sleeve around the disk and the disks are press fitted onto the rotor shaft. The PMs are
galvanized NdFeB as shown in Fig. 4.10.
Figure 4.10: Rotor disks with PM and reinforced sleeve
The two disks are arranged to create a NS arrangement as stipulated in the design.
The attractive forces from the magnets are contained with use of shoulders in the
shaft design. The flux paths from the one pole through the windings to the second
disk and through the back iron.
The rotor of the 500W machine is derived using the same methodology. The rotor
disk is 150mm OD, 80mm ID, arc segment of 75o, 10mm thick made from high
strength carbon steel. The magnets are grade 40 (maximum energy product
40MGoe), NiCuNi plating with operating temperature of 120oC.
Steel Sleeve
Univers
ity O
f Cap
e Tow
n
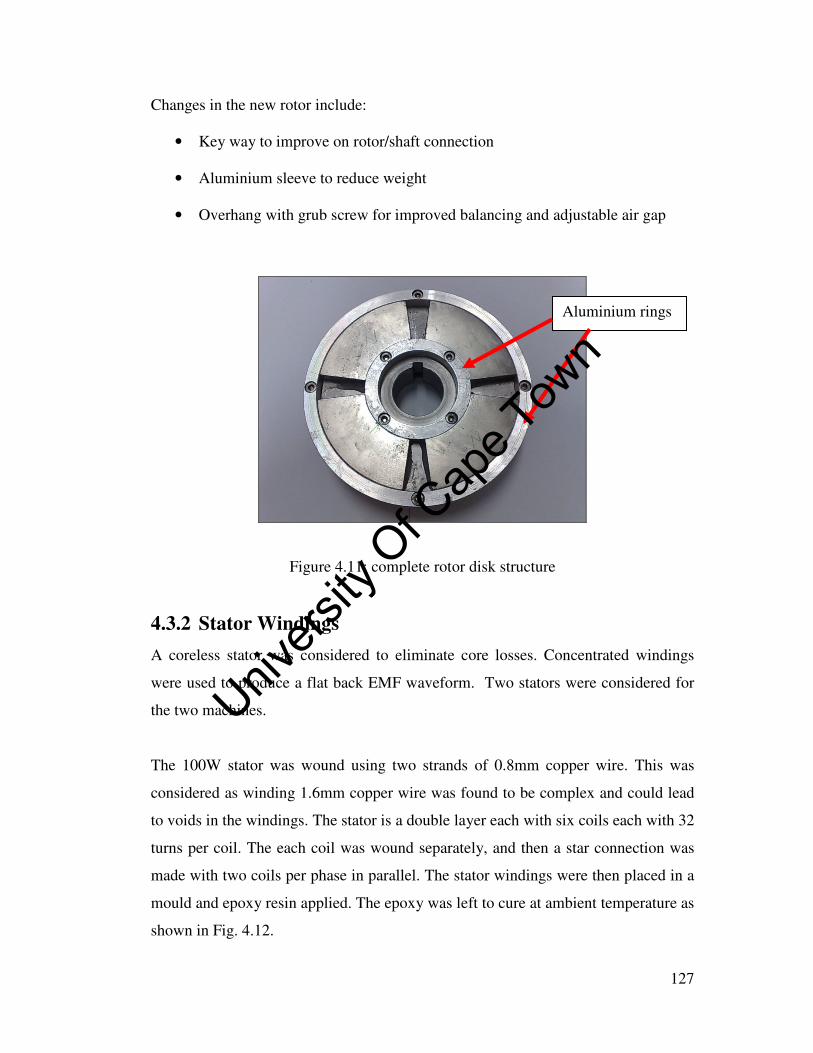
127
Changes in the new rotor include:
• Key way to improve on rotor/shaft connection
• Aluminium sleeve to reduce weight
• Overhang with grub screw for improved balancing and adjustable air gap
Figure 4.11: complete rotor disk structure
4.3.2 Stator Windings
A coreless stator was considered to eliminate core losses. Concentrated windings
were used to produce a flat back EMF waveform. Two stators were considered for
the two machines.
The 100W stator was wound using two strands of 0.8mm copper wire. This was
considered as winding 1.6mm copper wire was found to be complex and could lead
to voids in the windings. The stator is a double layer each with six coils each with 32
turns per coil. The each coil was wound separately, and then a star connection was
made with two coils per phase in parallel. The stator windings were then placed in a
mould and epoxy resin applied. The epoxy was left to cure at ambient temperature as
shown in Fig. 4.12.
Aluminium rings
Univers
ity O
f Cap
e Tow
n

128
The stator for the 500W machine was constructed from a 1.6mm conductor size with
class H insulation. It has the same number of coils per phase with 16 turns per coil
with voltage of 150V. Thermal couples were placed on each phase before the epoxy
was poured onto the winding.
Figure 4.12: Comparison between two stators 4.3.2 Stator Holding Structure
In this system configuration, the rotor disks are fixed on to the stainless steel shaft
coupled to the flywheel rotor. The levitating component is the stator winding hence
the need for a holding structure. This was made from stainless steel to prevent
interference of the magnetic path. This structure also acts as conductive path for the
heat from the stator windings. Fig. 4.13 shows the structure.
Univers
ity O
f Cap
e Tow
n

129
Figure 4.13: Stator holding structure
4.4 Assembly of Flywheel System
For safety concerns the flywheel system was tested in a vacuum containment system
as shown in Fig. 4.14. All the assembly components are stand alone units. The
power and signal cables are taken through circular connectors. The power cables are
isolated from the signals to avoid interference. The details of the flywheel system
combinations is shown in chapter 6 with the results.
Stator holding with axial movement
Fixed stator holding structure
Univers
ity O
f Cap
e Tow
n

130
Figure 4.14: Assembly of the flywheel system.
4.5 Concluding Remarks
This chapter presented the prototyping of the different system components. A
summary of the various flywheel rotor manufacturing techniques is explained. The
construction of the machine rotor and stator windings is explained with photos. The
assembly of the entire system is briefly explained and shown.
4.8 References
[4.1] G. Genta, "Spin tests on medium energy density flywheels," Composites.
Butterworth & Co (Publishers) Ltd, January 1982.
[4.2] D. Johnson, "Design considerations and implementation of an
electromechanical battery system," Ph.D. dissertation, Dept. Electrical
Engineering, University of Cape Town, 2008.
Univers
ity O
f Cap
e Tow
n

131
[4.3] F.J.M. Thoolem, "Development of an advanced high speed flywheel energy
storage system," Ph.D. dissertation, Eindhoven university of technology,
December 1993.
[4.4] Y. Bai, Q. Gao, H. Li, Y. Wu, M. Xuan, "Design of composite flywheel
rotor," Mech. Eng. Vol. 3, no. 3, pp. 288–292, China 2008.
[4.5] A. C. Arvin, C. E. Bakis, "Optimal design of press-fitted filament wound
composite flywheel rotors," Elsevier Composite Structures, vol. 72, pp.47–
57, 2006.
[4.6] E.L. Danfelt, S.A. Hewes and T.W. Chou, "Optimization of composite
flywheel design," Int. J. Mech. Sci. vol. 19, pp. 69-78, 1977.
[4.7] S.K. Ha, D.J Kim, T.H.Sung, "Optimum design of multi-ring composite
flywheel rotor using a modified generalized plane strain assumption,"
Elsevier, International Journal of Mechanical Sciences, vol.43, pp.993-1007,
2001.
[4.8] S. Kitade, Comprehensive composite materials, vol. 6. Elsevier, 2000,
Chapter 6 Flywheel, pp.571-580.
[4.9] Giancarlo Genta, "The shape factor of composite material filament-wound
flywheels," Composites, April 1981.
[4.10] S-Y Fu, B. Lauke and Y-W Mai, Science and Engineering of Short Fibre
Reinforced Polymer Composites, Woodhead, July 2009.
[4.11] J. Epaarachchi, H. Ku and K. GOHEL, "A Simplified Empirical Model for
Prediction of Mechanical Properties of Random Short Fiber/Vinylester
Univers
ity O
f Cap
e Tow
n
132
Composites," Journal of Composite Materials Online, First published on
August 26, 2009
[4.12] P.J.E. Forsyth, Composite Materials, London: Institution of Metallurgists,
British Crown Copyright, Illiffe Books LTD, 1966.
[4.13] G. Genta, Kinetic Energy Storage, Theory and Practice of Advanced
Flywheel Systems, Butterworth & Co. Ltd, 1985.
Univers
ity O
f Cap
e Tow
n

Chapter 5
Test Rig Design and
Thermal Analysis of the
Flywheel System ____________________________________________________________________
The previous chapters discuss the design and prototyping of the system components. This
chapter describes the design of the test rig for evaluating the flywheel system and a
thermal model of the flywheel energy storage system. The calculated losses are used to
establish the temperature behaviour of the system using a lumped parameter circuit
model. The flywheel system is encased in a vacuum hence only conduction and radiation
are considered, however, convection is also discussed.
5.1 Design of Test Rig and Containment Structure
High-speed electromechanical flywheel components carry an inherent risk of failure due
to design errors or manufacturing anomalies specifically in the flywheel rotor where
different manufacturing techniques suffer from different failure criteria [5.1] [5.2]. Each
high speed rotating component contains a large amount of kinetic energy and component
failure presents a danger to surrounding equipment and personnel. Proper design and
construction of the test rig and burst containment is essential.
Univers
ity O
f Cap
e Tow
n

134
Facilities capable of testing high-speed electromechanical flywheels of this nature are not
available in South Africa. The facilities that come close are limited by speed, inertia and
the required outputs. Commercial testing facilities are quite expensive and in most cases
are built with generic instrumentation requiring hardware to suite specific needs. Testing
of high-speed machinery requires special attention regarding safety and accuracy. This
section focuses on the development of a test rig for high-speed electromechanical
flywheels. The rig will be capable of testing various flywheel diameter sizes, different
machine types and has a computer based control desk to drive the systems under
different operating environments.
5.1.1 Need for a Flexible and Safe Test Rig
A flywheel system may fail for any of the following reasons; failure of the controllers,
fluctuation in the vacuum increasing the losses leading to loss in material strength,
fatigue, creep, failure of other parts, bearing, machine, dynamic stresses due to vibrations
among others [5.3]. Containment structures are hence required to avoid any fragments
from damaging equipment and harming personnel in the surrounding environment.
Various options have been considered for the flywheel containment systems and these
include steel structures, aluminium, fibre composites or a combination of any of the
materials [5.4] [5.5]. Steel structures have been used as in [5.6] and these are designed
based on Crushing Fragment Containment Analysis (CFCA). These structures are
reliable but are known to increase the weight of the entire system. This is particularly
disadvantageous for applications where the weight is significant. The reduction of the
containment thickness to reduce the weight is dangerous hence the use of combination
designs is more attractive. These light weight systems are more feasible for mobile
applications and makes transportation of standalone systems easy during purchase and
for repair.
In [5.7], a transient model was developed for a metal containment for a flywheel system
designed with a rotor diameter of about one-third of the full-scale locomotive flywheel
diameter. The tip speed of the subscale rotor is equal to that of the full-scale rotor with a
Univers
ity O
f Cap
e Tow
n

135
stored energy of 500 MJ. The major issues include the ability to withstand a rotor burst
and the strength of the containment joints.
Existing commercial test rigs are expensive and not built to particular design
specifications. In one of the test facilities visited, a special hub was required each time a
flywheel was to be tested. This facility is limited to speeds up to 15,000 rpm for a 3 kg
flywheel and the entire system needs to be tested in a vacuum.
The design specifications for the test rig takes into consideration; safety, flexibility, the
operating environment, proper alignment, drive system and data acquisition. The burst
containment is designed with a large safety margin to ensure the safety of personnel. The
operating environment can constitute a vacuum or helium/air mixture together with
controls and level gauge.
5.1.2 Design of the Burst Containment for the Test Rig
The containment must be able to contain any fragment from penetrating. The system
should be able to limit forces, moments and vibrations transferred outside during the
failure process and also avoid the emission of pollutant substances. The approaches
presented in [5.6] [5.8] [5.9] are used to design the burst containment used in this rig. In
this test rig, the containment design for isotropic materials is used. These materials burst
into few particles with high translational forces as compared to orthotropic materials
which exhibit higher rotational forces.
Consider a cylinder of thickness t, inner radius of Rci, with clearance of rotor c, with
isotropic flywheel rotating at angular speed of ω. During failure, the rotor will
disintegrate as shown in Fig. 5.1.
Univers
ity O
f Cap
e Tow
n

136
Figure 5.1: Failure of isotropic flywheel (Source: Genta)
The angle, θ the centre of mass the fragment displaces before it contacts the ring is given
by:
( )
−−=
GC dR
car
1
1cosθ (5.1)
Where Gd is the half-length of the fragment after rupture.
The radial velocity at instant of impact is given by
θωθ sin)(sin Gor drVV −== (5.2)
Where V is the tip speed of the fragment.
On impact, total radial kinetic energy of the fragment becomes;
θω 2222 sin)(21
21
Gorrrr drmVme −== (5.3)
Univers
ity O
f Cap
e Tow
n

137
The energy dissipated during impact is given by
( )cf
rcf
dmm
Vmme
+=
2
2
(5.4)
This results into a centrifugal pressure given as;
hdRR
drm
hdRR
VmP
GCC
Gof
GCC
f
c )(2
cos)(
)(2
cos
1111
22222
−
−=
−=
π
θω
π
θ (5.5)
Hence the radial kinetic energy and work done by the pressure is converted to elastic
then plastic strain energy
−
−<+
trP
EhtRVmm uc
uu
u
rcf εδ
εδπ21
2)(21 2
1 (5.6)
References [5.6] [5.8] give an empirical formula for calculating the minimum required
ring thickness as in (5.7).
lT
mVt
f
2sinθ= (5.7)
Where t is the containment thickness, V is the velocity of the particle, θ the centre of
mass the fragment displaces before it contacts the ring, mf is the mass of the fragment,
and l is effective length
In [5.9], the containment thickness is investigated using the temperature of the
containment after burst conditions. The total energy before fracture should be equal to
the total energy after fracture. The mass of the containment, me is shown as in (5.8).
2
)( 22io
e
RRHm
−=
ρπ (5.8)
Where H is the height of the containment, ρ density of the material used and Ro and Ri
are the outer and inner radius respectively.
Univers
ity O
f Cap
e Tow
n

138
The containment structure dimensions were calculated as in equation (5.7) however
purchase of such structures with specific dimensions is very costly. This is because a
solid rod is considered and bored through to get the required dimensions. The
containment was manufactured from an old pipe and transformed as shown in Fig. 5.2.
Figure 5.2: Transformation of old pipe to containment
The mechanical integrity of the old pipe was checked. Two flanges were fitted to hold
the containment on the Tee plates. For increased safety, the containment was reinforced
with a steel box.
5.1.3 Mechanical Specifications
For flexibility, the rig is built with flexible Tee plates and flat base plate. As shown in
Fig. 5.3, the shaft length can be adjusted to correspond to the system specifications. A
top plate is hinged onto the top plates to increase stiffness of the rig.
Univers
ity O
f Cap
e Tow
n
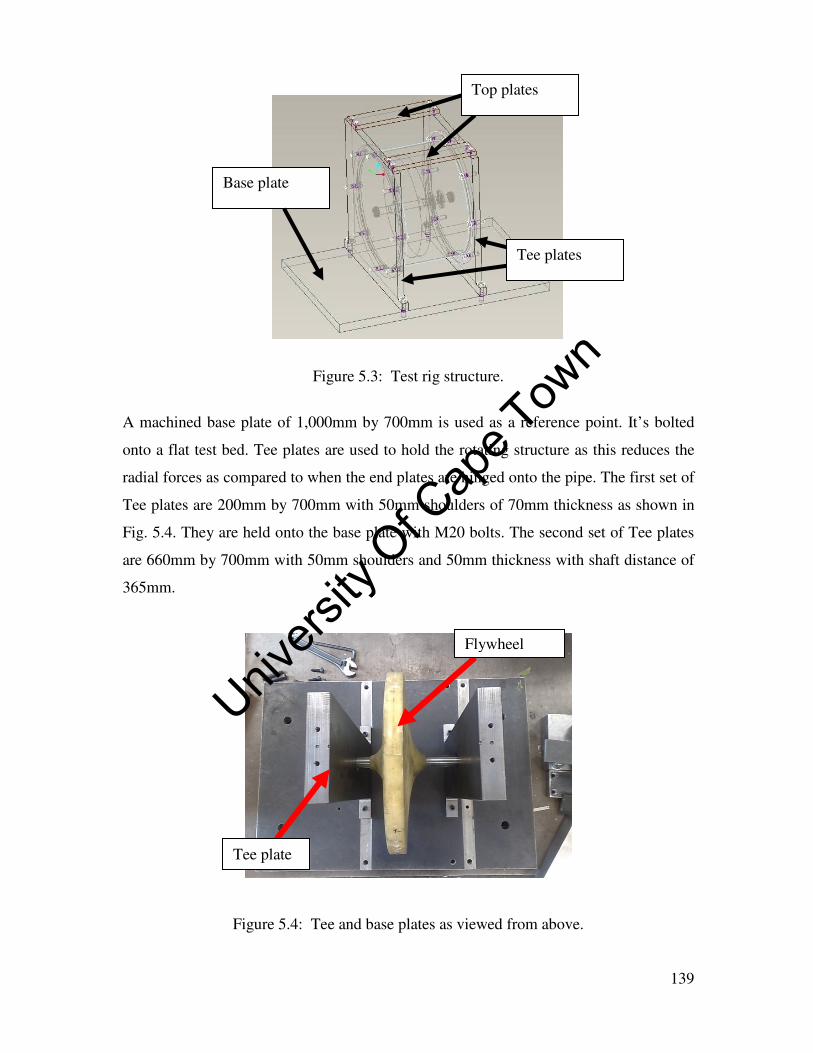
139
Figure 5.3: Test rig structure.
A machined base plate of 1,000mm by 700mm is used as a reference point. It’s bolted
onto a flat test bed. Tee plates are used to hold the rotating structure as this reduces the
radial forces as compared to when the end plates are hinged onto the pipe. The first set of
Tee plates are 200mm by 700mm with 50mm shoulders of 70mm thickness as shown in
Fig. 5.4. They are held onto the base plate with M20 bolts. The second set of Tee plates
are 660mm by 700mm with 50mm shoulders and 50mm thickness with shaft distance of
365mm.
Figure 5.4: Tee and base plates as viewed from above.
Tee plate
Flywheel
Top plates
Tee plates
Base plate
Univers
ity O
f Cap
e Tow
n
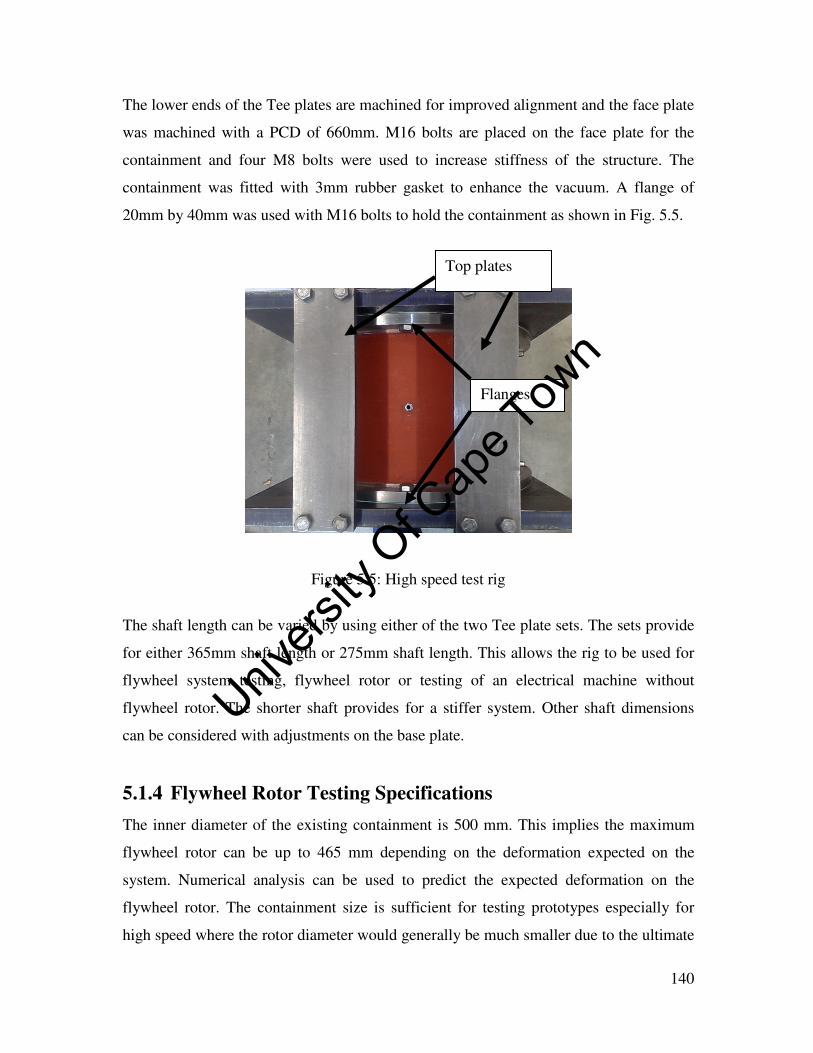
140
The lower ends of the Tee plates are machined for improved alignment and the face plate
was machined with a PCD of 660mm. M16 bolts are placed on the face plate for the
containment and four M8 bolts were used to increase stiffness of the structure. The
containment was fitted with 3mm rubber gasket to enhance the vacuum. A flange of
20mm by 40mm was used with M16 bolts to hold the containment as shown in Fig. 5.5.
Figure 5.5: High speed test rig
The shaft length can be varied by using either of the two Tee plate sets. The sets provide
for either 365mm shaft length or 275mm shaft length. This allows the rig to be used for
flywheel system testing, flywheel rotor or testing of an electrical machine without
flywheel rotor. The shorter shaft provides for a stiffer system. Other shaft dimensions
can be considered with adjustments on the base plate.
5.1.4 Flywheel Rotor Testing Specifications
The inner diameter of the existing containment is 500 mm. This implies the maximum
flywheel rotor can be up to 465 mm depending on the deformation expected on the
system. Numerical analysis can be used to predict the expected deformation on the
flywheel rotor. The containment size is sufficient for testing prototypes especially for
high speed where the rotor diameter would generally be much smaller due to the ultimate
Top plates
Flanges
Univers
ity O
f Cap
e Tow
n

141
strength limit. Various configurations can be considered, that is the inside-out and
conventional as shown in Fig. 5.6.
Figure 5.6: Containment structure limits with accessories.
Different flywheel rotors can be tested, that is, cast, laminated, filament wound etc. The
shaft thickness can be varied depending on the bearings utilised. The existing bearing
structure houses 47mm OD bearings with 25mm inner diameter. In this thesis, two
flywheel rotors are considered, a cast rotor with profile one characteristics and laminated
flywheel with profile two characteristics.
Other accessories include four and twelve pin circular connectors used for power and
signals respectively. These connectors are special as they can be used in vacuum
environments with the ability to contain 8 bar pressure levels. They are built with O-
rings to prevent leakage in vacuum.
4-pin power connector
8-pin circular connector
Containment length, 365mm
Max OD, 500mm
Univers
ity O
f Cap
e Tow
n

142
5.1.5 Electrical Machine Test Specifications
The test rig has two electrical machines rated at 100W and 500W. The system can be
assembled in normal air pressure or reduced air pressure. The 100W machine has a
voltage rating of 36V and can be used to test light weight rotor systems or validate
friction coefficients of bearings and also test drive prototypes. The 500W machine has a
voltage rating of 150V with stator wound from class H insulation and is able to withstand
up to 200oC. This means the stator has the ability to over load due to its high temperature
tolerance. The stator has an option of water cooling through silicon tubing placed in the
hot spot and peripheral areas of the stator. This tubing has a temperature rating of 200oC
which matches the stator windings. This further allows for increased current loading of
the machine.
Structural analysis was performed on the electrical machine structure to ensure
mechanical integrity. Some additions to improve integrity include a key way and grub
screw, which act as secondary protection in case of a short circuit on the load side. The
500W electrical machine is shown in Fig. 5.7.
Figure 5.7: 500W electrical machine for flywheel testing.
Silicon tubing
Rotor disk with mechanical adjustments
Electrical machine
Univers
ity O
f Cap
e Tow
n

143
From experimental verification, the 500W machine has accelerating torque of 0.758Nm
at start up and this is measured through the run up time of the prototyped flywheel
system.
This test rig also has the ability to test other high speed machine types. The current
system is able to test AFPM machines up to an OD of 465mm. The bearing structure is
restricted to 47mm OD however the shaft size is flexible. As shown in section 5.1.6, the
test rig has hall sensors driven from a dSPACE control desk which can be programmed
for any machine. The stator holding structure for any AFPM is available. For the case of
machines with a radial configuration, a new stator holding structure needs to be built.
The axial length of the test machine is dependent on whether it’s tested with the flywheel
rotor or not.
5.1.6 Drive System Specifications
The control system used is shown in Fig. 5.8. The system consists of power supply from
the mains, 100A rectifier and a switch that is manually used to change from motor mode
to generator mode in case a load is connected. Also included is an inverter driven by
dSPACE PWM switching, data acquisition system which is performed by a power
analyser, control desk (PC) and signals from the flywheel system. It’s envisioned that a
solar panel would act as the power source for a fully functional system and a DC-DC
converter to regulate the voltage on the reference DC bus. Univers
ity O
f Cap
e Tow
n

144
Figure 5.8: Schematic of Drive System During motor mode, the mains supplies the system which ramps up in speed and in
generator mode, the switch is changed, power supply is shut down and the load is
supplied. This was done manually during the testing process. The current set up is able to
test BLDC machines and this can be programmed to test any other type of machine. The
full set up of the drive system is shown in Fig. 5.9 below.
Figure 5.9: Overall flywheel system
Power analyser
Flywheel system
Drive system
Univers
ity O
f Cap
e Tow
n

145
5.1.7 Thermal, Bearing and Vacuum Specifications
The temperature acquisition is provided by eight probes available on a Pico logger
system. The thermal parameters are essential in predicting failure, malfunction and
performance of the system. Temperature prediction is also essential especially for
vacuum enclosed systems where the major medium of heat transfer is radiation and
conduction. This system is able to store up to a million seconds worth of data.
The bearing structure is limited to an outer diameter of 47mm, but the inner can be
adjusted. Hybrid ceramic bearings and energy efficient bearings are currently being used
in this test rig and are capable of reaching 40,000 rpm and 18,000 rpm respectively. The
friction loss moments of these bearings are given and based on the rolling frictional
moment, sliding frictional, from the seals and drag coefficient. This is essential in loss
analysis of a new machine or a flywheel system to be tested. The friction moment for
6005 hybrid ceramic bearings with a radial force of 210N is given in table 5.1. The base
oil viscosity is given as 15.8 at 80oC.
Table 5.1: Frictional Components of the Bearings
Moment Calculated value (Nm)
Rolling friction 0.0139
Sliding friction 0.0748 x 10⁻³
Seal friction 3.7 x 10⁻³
Drag friction 45.34 x 10⁻³
This moment translates into a loss of 164W for the hybrid ceramic bearings and 82W for
the energy efficient bearings of the same dimensions.
The vacuum has the capability of reaching up 1 mbar using a one stage single phase
vacuum. The single stage rotary vane pump used has low sound levels of 50 dB,
pumping speed of 10 m3 per hour, reaching an ultimate vacuum of 99.9 %. The
performance of the vacuum is sensitive to leaks in the containment structure.
Univers
ity O
f Cap
e Tow
n

146
5.2 Modal Analysis of Test Rig
A modal analysis of the test rig was performed to ascertain the vibration characteristics,
that is, the natural frequencies and mode shapes of the test rig when the flywheel rotates.
In determining the vibration characteristics, suitable initial conditions are set causing the
rig to vibrate at one of its natural frequencies and the shape of the vibration will be a
scalar multiple of a mode shape.
The mode and Eigen values represent the natural frequency of a system and the
eigenvector is the mode shape shown by displacements of the structure [5.10] and this is
expressed as seen in equation (5.9)
][][][ FuKuCuM =++ &&& (5.9)
Where M, C and K are mass, damping and stiffness matrices are constant with time
respectively and F is the unknown nodal displacements varying with time. A continuous
structure has an infinite number of degrees of freedom (DOF). The finite element method
approximates the real structure with a finite number of DOFs. N mode shapes can be
found for a FEM having N DOFs.
At a single degree of freedom
)cos( tu ωφ= (5.10)
u is the vector of nodal displacements and φ is the vector of amplitudes for each DOF.
For the entire structure the structural vibration is:
)cos( tu ωφ= (5.11)
u is the displacement of a nodal DOF and φ is the amplitude
Univers
ity O
f Cap
e Tow
n

147
Considering a multi DOF system assuming the system is undamped and not excited by
any external forces, then;
0][][ =+ uKuM && (5.12)
If system vibrates according to a particular mode shape and frequency as shown in
equation
)cos( tu ii ωφ= (5.13)
Where iφ is the ith mode shape and iω is the ith natural frequency.
The first and second derivatives are inserted into equation (5.12) resulting into equation
(5.14).
0])[][( 2 =+− ii KM φω (5.14)
Solving the equation gives
0 =iφ (5.15)
0])[][det( 2 =+− KM iω (5.16)
Hence the Eigen problem is solved giving the results as in (5.17-5.20).
][][ xIxA λ= (5.17)
0])[][( 2 =+− ii KM φω (5.18)
][][ 2 φωφ MK i= (5.19)
][][][ 21 φωφ IKM i=− (5.20)
Hence the natural frequencies are Eigen values 2iω and the mode shapes are Eigen
vectors φ .
The mesh controls and solver algorithm are preselected by the ANSYS workbench and
this is done automatically. The analysis was based on two varying initial conditions, the
free vibration analysis and the other based on pre-stressed static structural analysis.
Univers
ity O
f Cap
e Tow
n

148
5.2.1 Free Vibration Analysis
In this free vibration analysis, only one constraint was applied on the base plate. The rest
of the system was left to vibrate freely. The fifth mode had an impact on the rig as shown
in Fig. 5.10 and 5.11. This happened at 266.2Hz which corresponds to 15,900 rpm.
Figure 5.10: Fifth mode shape with displacement
Figure 5.11: Fifth mode shape with direction of displacement
Univers
ity O
f Cap
e Tow
n

149
The forces on the rig represent lateral movement at the top of the test rig. This can be
mitigated by reinforcing the top plates with hinges bolted onto the flat base. This would
increase the stiffness of the entire structure.
5.2.2 Pre-Stressed Modal Analysis
In this analysis, the initial condition is set as the static structural analysis. A direct solver
was considered and pre-stressed selected as input to the modal analysis. The fourth mode
was found to be significant to the rig structure and this occurred at 336.12Hz as in Fig.
5.12, corresponding to approximately 20,000 rpm.
Figure 5.12: 4th Mode shape at 336.12Hz
The occurrence of the fourth mode shape can be increased by reinforcing the top plates
to increase the stiffness and rigidity. Considering the rig was constructed for up to
40,000 rpm testing, further modes were extracted. The eighth mode shape was shown to
form a deformation at approximately 40,000 rpm. The same solution as mentioned
earlier would extend the mode occurrence further.
Univers
ity O
f Cap
e Tow
n

150
5.3 Thermal Analysis
An electromechanical flywheel system represents a very intricate thermal system and this
can be attributed to the various components and different materials used in its
construction [5.11]. The system consists of a machine, composite rotor, bearings and its
environment which contribute to losses transforming into heat. The temperature
tolerance of the materials used in the system, such as the glass fibre composite,
permanent magnets, winding insulation and rotor disks, determine the safe operating
limits of the system [5.12]. It is difficult to determine the thermal behaviour of the
complete system due to many variable factors, which include unknown loss components
and their distribution, and the three-dimensional complexity of the problem [5.13].
Therefore, prior knowledge of the temperature rises in various parts of the system
especially for high speed operation is crucial. Investigating the thermal behaviour of the
system ensures that appropriate cooling or heat conductivity path is designed to provide
for an increased operating temperature range [5.13] [5.14].
The flywheel system is operated in a vacuum containment to eliminate the windage loss
resulting from the large diameter of the flywheel rotor. The inextricable link between the
heat accumulation in the containment and the windage losses from the flywheel rotor
results into temperature rise during high speed operation. This heat can cause high
thermal stresses in the rotor causing early failure [5.15]. The windage loss is a major loss
factor from the flywheel rotor as it increases exponentially with angular speed.
In addition, the stator windings are covered in epoxy resin for increased structural
integrity and robustness of the stator; however, epoxy is a poor conductivity of heat with
average of 0.35 W/mK. The evacuation of the heat from the stator is vital in ensuring a
long life of the system. The energy efficient bearings also produce a significant amount f
heat and this needs to be accounted for. It is therefore essential to develop models that
predict the thermal performance of the system in order to re-adjust designs, and put in
place measures to curb the heat problem. For example, the selection of the bearings can
be influenced by the results of an accurate model used. These aspects can be dealt with
Univers
ity O
f Cap
e Tow
n

151
before prototyping. Also, the model can be used in ascertaining the over load capability
of the system. This study considers the lumped parameter thermal model.
5.3.1 Heat Sources
The flywheel system consists of various heat sources that are expressed as electrical and
mechanical losses. The electrical losses can be categorised into copper, eddy current,
magnet losses and were discussed in the chapter 3. The mechanical losses are frictional
losses from the bearings, windage from the flywheel and machine.
5.3.1.1 Frictional Losses
The frictional losses due to the bearings are evaluated using a new approach [5.16] which
considers all the sources of loss in the bearing. There are mainly four distinctive sources
as expressed in equation (5.21).
dseslr MMMMM +++= (5.21)
Where M is the total frictional moment, Mr is the rolling frictional moment, Msl is the
sliding frictional moment and Md is the drag frictional moment in Nmm
The rolling frictional moment is calculated from the equation (5.22).
( ) 6.0nGM rr ν= (5.22)
Where Gr is a variable depending on, bearing type, bearing mean diameter dm, radial
load (Fr), axial load (Fa); n is the rotational speed (rpm) and ν is the kinematic viscosity
of the lubricant at the operating temperature (mm2/s).
The sliding frictional moment is calculated from the equation (5.23).
slslsl GM µ= (5.23)
Univers
ity O
f Cap
e Tow
n

152
Where Gsl is a variable that depends on the bearing type, bearing mean diameter, radial
and axial load; slµ is the sliding friction coefficient
The frictional moment of seals on both sides can be estimated using the following
empirical equation (5.24).
21 SsSse KdKM +=β (5.24)
Where KS1 is the constant depending on the bearing type, KS2 is the constant depending
on the bearing and seal type, ds is the seal counter diameter and β is the exponent
depending on the bearing and seal type.
For one seal only, the friction generated is 0,5 Mse, however, for RSL seals for deep
groove ball bearings with an outside diameter over 25 mm, the moment of friction is
constant for either one or two seals.
The drag frictional moment as in equation (5.25).
25ndKVM mballMd = (5.25)
Where Kball is the bearing related constant, Kroll is the rolling bearing related constant; dm
is the bearing mean diameter.
The ball bearing related constant is defined as in equation (5.26).
( )( ) ( ) 1210/ −−+= dDdDKiK Zrwball (5.26)
and the roller bearing related constant is defined as in equation (5.27).
( )( ) ( ) 1210/ −−+= dDdDKKK ZLroll (5.27)
Where irw is the number of ball rows, KZ is the bearing type related geometry constant,
KL is the roller bearing type related geometry constant, d is the bearing bore diameter and
D is the bearing outside diameter.
Univers
ity O
f Cap
e Tow
n

153
The total power loss was calculated using the equation (5.28).
MnNR
41005.1 −×= (5.28)
Where M is the total moment of frictional in Nmm and n is the rotational speed.
For the case of the energy efficient bearings only 50% of the loss is considered and as
shown in Fig. 5.13 below, the total losses would be 80W from the energy efficient
bearings.
Figure 5.13: Hybrid bearing losses with speed
5.3.1.2 Flywheel Windage Loss
The flywheel windage losses are largely dependent on the angular speed, magnitude of
the air pressure and the radius of the profile as well as the axial and radial gap clearance
of the profile from the containment. Windage losses have been investigated as presented
in [5.17] [5.18] where the use of a vacuum is suggested to reduce the air frictional losses
and in [5.19] where a mixture of helium with air is used to reduce the windage losses.
Windage losses in the flywheel translate to:
• Reduced efficiency of the overall system.
Univers
ity O
f Cap
e Tow
n

154
• Power absorbed is converted into heat which increases the temperature of the
rotor
In [5.17], the model was developed to predict windage loss in rotating electrical
machines and an equation for a cylindrical rotor was developed and modified to suite the
homopolar inductor alternator. This model will henceforth be considered as model one.
The following assumptions were made;
• No axial flow exists
• The gap is small compared to the radius and length
• The fluid in the gap is homogeneous, and no pressure differential exists across
the top
• The flow in the air gap is laminar
Hence the windage power loss is
eR
LRW
342 ωπρ= (5.29)
As Reynolds number increases, turbulence occurs hence relation between Cd and Re no
longer exists.
( )de
d
CRInBC
768.11
+= (5.30)
For the case of this study, new assumptions are described:
• The air gap over the whole flywheel is large as compared to the radius hence the
pressure difference across the gap is significant.
• The flow of air is turbulent hence increased value of Reynolds number
In the model discussed in [5.18], the aerodynamic torque is given by
mCRT52ρω= (5.31)
Univers
ity O
f Cap
e Tow
n
155
Where Cm is non-dimensional coefficient and a function of Reynolds number Re, Mach
number M and Knudsen number Kn.
In the analysis made in this model, for a flywheel operating in atmospheric pressure
conditions, the Knudsen number is very small and hence the gas surrounding it is said to
be in continuous medium and for high values of Knudsen number, free molecule stream
can be assumed.
High values of Knudsen number are chosen in this instance the containment has reduced
air pressure. The solution for this is given in equation (5.32) and is considered the second
model and henceforth called model two:
m
KT
RW
2
4ρω= (5.32)
Reynolds number is defined by η
ωρ
υ
ω 22RR
Re ==
Another model used for the estimation of windage loss is found in [5.19]. This model
was used to accurately the predict windage loss for an ultimate shape flywheel system as
in [5.2]. This model is considered as model three. The flywheel windage loss is given by
352 ωρRCW df= (5.33)
A comparison of the three models gives varying results for reduced air pressure as shown
in Fig. 5.14. Univers
ity O
f Cap
e Tow
n

156
Figure 5.14: Windage loss model for the flywheel system
The selection of the required model is only possible with experimental verification. In
this case, the windage loss is expected to be small. Considering the worst case scenario,
model three is selected. This result is used in the loss prediction to study the thermal
behaviour of the system during its operation. Different scenarios can be predicted based
on the models mentioned.
5.3.1.3 Machine Windage Loss
The windage loss of machine is expressed as shown in equation (5.34).
( ) ( )553221
inoutfwind RRnCP −= πρ (5.34)
Where Rout is the outer radius, Rin is the inner radius, n is the speed of the rotor, Cf is the
windage coefficient, ρ is the density of the medium through which the rotor rotates.
Univers
ity O
f Cap
e Tow
n

157
5.3.2 Heat Transfer
As mentioned, the thermal complexity of the system presents a unique and formidable
difficulty. Heat is transferred or removed from the system by conduction, convection
and radiation into the atmosphere.
There are three main methods of thermal modelling; exact analytical solution (distributed
loss model), lumped parameter equivalent (concentrated loss model) and numerical
analysis. The lumped-parameter thermal method is the most commonly used method to
approximate the temperature behaviour in systems with internal losses [5.21]. Generally,
the lumped-parameter thermal model is composed of thermal conduction resistances,
thermal capacitances and power losses inside the system. Such a model is based on the
hypothesis that the system, under the thermal point of view, can be divided into several
parts that are connected to each other by means of thermal resistors and capacitors.
5.3.2.1 Conduction
In solids, heat is transferred from a high temperature region to low temperature region,
taking into account the temperature gradient. The Fourier’s law explains the heat transfer
as shown.
x
TAQ
∂
∂−= κ (5.35)
Where Q is the rate of heat conduction, A is the area of the flow path, k is the thermal
conductivity and x is the length of the conduction path.
There are other laws that describe the steady-state conditions of heat conduction. The
first law states that the energy is conserved and the second law states that the heat flux at
any point in an isotropic region is proportional to the temperature gradient at the point.
The two laws result into poison’s equation given by equation (5.36).
κ
ω−=∇ T
2 (5.36)
Univers
ity O
f Cap
e Tow
n

158
Equation (5.36) has similarity to electrostatic solutions and can be used to solve thermal
conduction problems.
5.3.2.2 Radiation
In radiation, heat transfer transpires using electromagnetic waves. The transfer of radiant
energy between surfaces is proportional to absolute temperature, emissivity and the
geometry of each surface. Consider two surfaces at different temperatures T1 and T2 with
surfaces areas A1 and A2 respectively. The transfer of heat is described by equation
(5.37).
( )
−++
−
−=
22
2
12111
1
42
41
111
AFAA
TTQ
ε
ε
ε
ε
σ (5.37)
Where σ is the Stephan Boltzmann constant, ε denotes the emissivity of each surface, F12
is the view factor which is the orientation of the two surfaces and Q is the heat transfer.
5.3.2.3 Convection
Heat transfer occurs in fluids and can happen from surface to fluid. This is by either
natural or forced convection. With natural convection, no artificial means of cooling are
considered and the process of heat dissipation is governed by Newton’s law of cooling as
shown below.
( )21 TThAQ −= (5.38)
Where h is the convection heat transfer coefficient.
The main difficulty with this equation is the calculation of the heat transfer coefficient,
which depends on many variables such as the temperature differences between the heated
body and air, the geometry and properties of the surface. In addition, the complex
construction of the flywheel system makes the calculation of the values even more
complex.
Univers
ity O
f Cap
e Tow
n

159
A fan or a pump can be used in forced while in natural convection, buoyancy forces
induced by density gradients cause the fluid to flow across a solid surface. The heat
transfer coefficient is dependent on; Reynolds number, Nusselts number and Prandtl
number. Reynolds number describes the characteristics of the velocity boundary layer,
that is, laminar, transition, turbulent. Nusselts number provides the measure of the
convective heat transfer at the surface. Prandtl number is the ratio of the rate at which
momentum is transported to the rate at which thermal energy is transported in the
laminar boundary layer. This number is an indication of relative rates of growth of the
velocity and thermal boundary layers.
Heat transfer coefficient between the rotor discs
For Reynolds number,
Laminar flow Re ≤ 2300
Transition 2300 < Re < 10,000
Turbulent Re ≥ 10,000
It’s assumed the flow is turbulent with natural convection
ν
DU m=Re (5.39)
uNR
kh = (5.40)
Where 2
54
100015.0
−=
R
rRN c
eu and ( ) 21
5105.2Ω
×= νcr
Heat transfer coefficient around flywheel is similar to equation (5.40) where the Nusselts
number is given as in equation (5.41).
n
reu PRN54023.0= (5.41)
Where n is 0.4 for heated fluid, 0.7<Pr<160 and Re>10,000. It’s noted that for gases,
Prandtl is approximately zero [5.20].
Univers
ity O
f Cap
e Tow
n
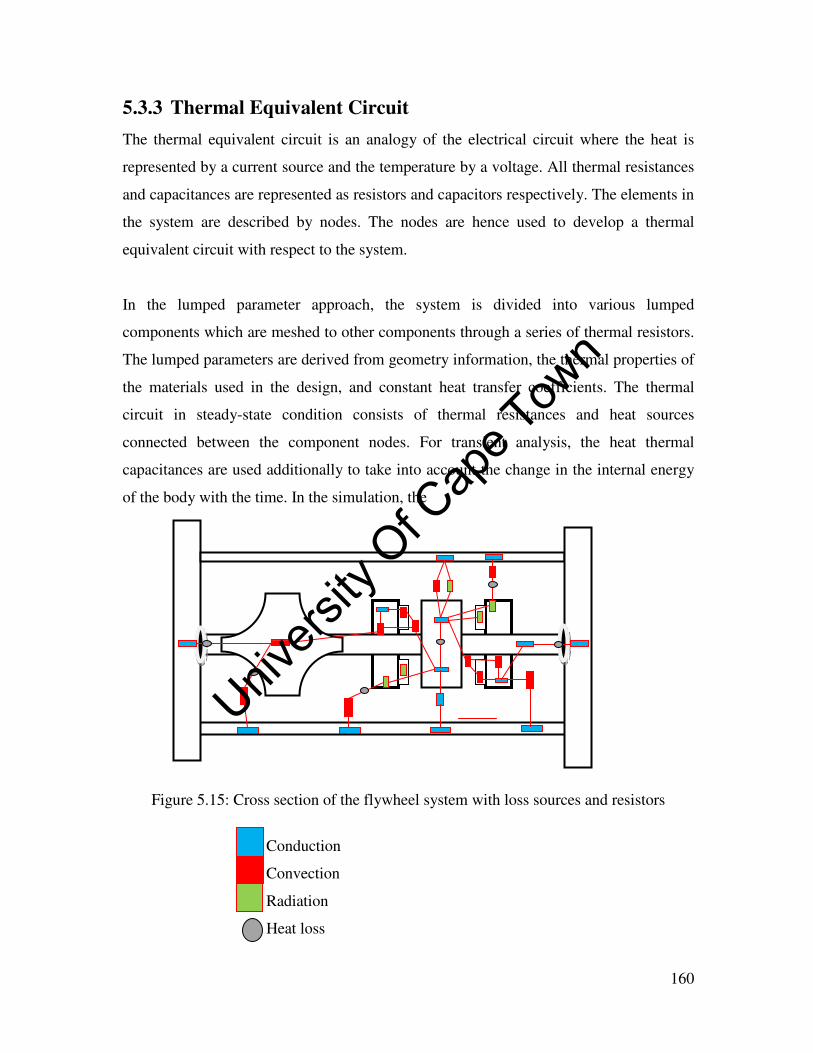
160
5.3.3 Thermal Equivalent Circuit
The thermal equivalent circuit is an analogy of the electrical circuit where the heat is
represented by a current source and the temperature by a voltage. All thermal resistances
and capacitances are represented as resistors and capacitors respectively. The elements in
the system are described by nodes. The nodes are hence used to develop a thermal
equivalent circuit with respect to the system.
In the lumped parameter approach, the system is divided into various lumped
components which are meshed to other components through a series of thermal resistors.
The lumped parameters are derived from geometry information, the thermal properties of
the materials used in the design, and constant heat transfer coefficients. The thermal
circuit in steady-state condition consists of thermal resistances and heat sources
connected between the component nodes. For transient analysis, the heat thermal
capacitances are used additionally to take into account the change in the internal energy
of the body with the time. In the simulation, the
Figure 5.15: Cross section of the flywheel system with loss sources and resistors
Conduction
Convection
Radiation
Heat loss
Univers
ity O
f Cap
e Tow
n

161
5.3.4 Thermal Parameters
Accurately estimating the corresponding resistances and capacitances of the different
nodes is a very complex process. The geometry must be well established and to ensure
good results, a major assumption that the heat flows in the radial and axial directions are
independent is made. Other assumptions are; Capacity and heat generation are uniformly
distributed and no circumferential heat flow.
The thermal capacitances and conduction resistance is calculated as shown in equations
(5.42) and (5.43).
VcC ρ= (5.42)
Where c is the heat capacity of the material, V is the volume of the material and ρ is the
density.
=
kA
lR (5.43)
Where k is the thermal conductivity of the material, l is the length and A is the cross
sectional area.
The more complex parameters is the thermal convection resistances as this depends on
the angular speed, air nature of the flow, turbulent or laminar as well as distance of the
flywheel and containment among others. The thermal resistance is given by equation
(5.44).
( )AR
α
1= (5.44)
Where A is the surface area of the convective heat transfer between areas and α is the
heat transfer coefficient.
For radiation, the thermal radiation resistance is given by equation (5.45).
( ) ( )[ ]( ) ( )[ ]22
2121
22
2
12111
1
273273273273
111
++++++
−++
−
=θθθθσ
ε
ε
ε
ε
AFAARr (5.45)
Univers
ity O
f Cap
e Tow
n

162
Where ε is the emissivity of the material, F12 is the view factor and A is the respective
emitting surface.
There are two unknowns in equation (5.45) and hence to ascertain the values of the
thermal radiation resistance, an iterative process is performed. The material properties
used in calculating the thermal parameters are given in table 5.1.
Table 5.2: Material properties
Material Density(kg/m3) Thermal conductivity
(W/mC)
Emissivity
Copper 8946 398 0.87
Epoxy resin 1400 0.35 0.88-0.94
Mild steel 7846 54 0.17-0.32
Aluminium 2700 250 0.02-0.19
Stainless steel 8000 16 0.28-0.66
The parameters are calculated for vacuum operation with temperature correction.
Univers
ity O
f Cap
e Tow
n

163
Table 5.3: Thermal parameters
Parameter Representation Resistance
Rce1 Conduction Face epoxy 0.175
Rra1 Radiation from stator to environment 0.220
Rcc1 Conduction through containment 0.035
Rrm1 Radiation from stator to magnets 0.004
Rrd1 Radiation from stator to rotor disk 0.003
Rcb1 Conduction through stator brazing 0.028
Rcb2 Conduction through stator brazing 2 9.950
Rcr1 Conduction through rotor disks 0.002
Rcs1 Conduction through shaft 0.106
Rct2 Conduction through Tee plate 0.001
Ce1 Epoxy 92
Cf2 Bearings 47.6
Ce2 Copper 63
Cf1 Stray 48
The lumped parameter mode considered is based on the axial flux machine model a heat
flow path within the flywheel system. The heat transfer due to convection was neglected
as the system was operated under reduced air pressure. The bearings losses together with
stray losses are considered in the simulation.
Univers
ity O
f Cap
e Tow
n

164
Figure 5.16: Lumped parameter model of flywheel system
5.3.5 Simulation Results
The model was used to carry out various analysis and considerations. For these
simulations, the ambient temperature is taken as 30oC. The system was simulated for
various speeds and air pressure to obtain the transient and steady-state temperatures in
the stator, rotor disk, and permanent magnets among others. For this application, the
high speed operation is vital. Fig.5.17 shows the temperature rise of vacuum, rotor disk
and stator temp at reduced air pressure.
Univers
ity O
f Cap
e Tow
n

165
Figure 5.17: Temperature rise at rated current.
In the simulations the maximum temperature limit is not reached in transient state
ambient and water temperatures are taken 30C and 20C respectively. The same
analysis is repeated for the case where the system is running under different load
conditions. The results are shown in Fig.5.18. In comparison to the previous case, the
steady-state temperatures are relatively low due to low current.
Figure 5.18: Temperature rise at low load condition
Univers
ity O
f Cap
e Tow
n

166
The thermal conditions in the case of an overloaded machine are also investigated.
Fig.5.19 shows the temperature curves at reduced air pressure conditions.
Figure 5.19: Temperature rise at overload condition
From Fig. 5.19, it’s clear that cooling is required to for overloading capability of the
system for proper operation.
5.4 Concluding remarks
This chapter summarized the development of thermal models using lumped parameter
for the flywheel energy storage system. The thermal parameters are calculated based on
the material properties and dimensions of the flywheel system. The results presented
show temperature rise at vital operating points. In chapter 6, the measured temperatures
are compared to simulation results.
5.5 References
[5.1] G. Genta, "Spin tests on medium energy density flywheels," Composites.
Butterworth & Co (Publishers) Ltd, January 1982.
Univers
ity O
f Cap
e Tow
n

167
[5.2] D. Johnson, "Design considerations and implementation of an electromechanical
battery system," Ph.D. dissertation, Dept. Electrical Engineering, University of
Cape Town, 2008.
[5.3] F.J.M. Thoolem, "Development of an advanced high speed flywheel energy
storage system," Ph.D. dissertation, Eindhoven university of technology,
December 1993.
[5.4] Y. BAI, Q. Gao, H. Li, Y. Wu, M. Xuan, "Design of composite flywheel rotor,"
Mech. Eng. Vol. 3, no. 3, pp. 288–292, China 2008.
[5.5] A. C. Arvin, C. E. Bakis, "Optimal design of press-fitted filament wound
composite flywheel rotors," Elsevier Composite Structures, vol. 72, pp.47–57,
2006.
[5.6] E.L. Danfelt, S.A. Hewes and T.W. Chou, "Optimization of composite flywheel
design," Int. J. Mech. Sci. vol. 19, pp. 69-78, 1977.
[5.7] S.K. Ha, D.J Kim, T.H.Sung, "Optimum design of multi-ring composite #ywheel
rotor using a modi"ed generalized plane strain assumption," Elsevier,
International Journal of Mechanical Sciences, vol.43, pp.993-1007, 2001.
[5.8] S. Kitade, Comprehensive composite materials, vol. 6. Elsevier, 2000, Chapter 6
Flywheel, pp.571-580.
[5.9] Giancarlo Genta, "The shape factor of composite material filament-wound
flywheels," Composites, April 1981.
[5.10] ANSYS, Inc Theory Reference, ANSYS Release 9.0.002114. SAS IP Inc
Univers
ity O
f Cap
e Tow
n

168
[5.11] C. Huynh, L. Zheng and P. Mc Mullen, "Thermal performance evaluation of a
high speed flywheel energy storage system," presented at the 33rd Annual
Conference of the IEEE Industrial Electronics Society (IECON), Taipei, Taiwan,
Nov. 5-8, 2007.
[5.12] O. Aglén, Å. Andersson, Thermal analysis of a high-speed generator, IEEE, 2003
[5.13] F. Sahin, "Design and development of a high-speed axial-flux permanent-magnet
machine," Ph.D dissertation, Technische Universiteit Eindhoven, 2001.
[5.14] J. Saari, "Thermal analysis of high speed induction machine," Ph.D dissertation,
Helsinki University of Technology, Espoo, Finland, 1998.
[5.15] E.L. Danfelt, S.A. Hewes and T.W. Chou, "Optimization of composite flywheel
design," Int. J. Mech. Sci. vol. 19, pp. 69-78, 1977.
[5.16] www.skf.com last checked 27th November 2009
[5.17] J.E. Vrancik, "Prediction of windage loss in alternators," NASA technical note D-
4849, 1968.
[5.18] G. Genta. Kinetic Energy Storage, Theory and Practice of Advanced Flywheel
Systems, Butterworth & Co. Ltd, 1985.
[5.19] Y.Suzuki, A. Koyanagi, M. Kobayashi, R.Shimada, "Novel applications of the
flywheel energy storage system," Energy, vol. 30, pp. 2128-2143, 2005.
[5.20] Kirk D. Hagen, Heat Transfer with Applications, 1st ed., Pearson Education, June1998
Univers
ity O
f Cap
e Tow
n

Chapter 6
Experimental Results ____________________________________________________________________
This chapter discusses the experimental results of the flywheel testing. Two flywheel set
ups are considered with 100W and 500W machine. The analysis includes isolation of the
losses, efficiency, run down and thermal results.
6.1 Results of Flywheel System with 100 W machine
The first test of the flywheel system consisted of a cast flywheel rotor, hybrid deep
groove bearings, with the 100W machine. The system was set up as shown in Fig. 6.1.
The test was conducted to examine the overall performance of the system whereby the
flywheel rotor and machine are coupled on the same shaft and tested under normal
pressure.
Figure 6.1: Experimental set up of flywheel system
Flywheel rotor Embedded rotor disk
Stator windings
Shaft
Univers
ity O
f Cap
e Tow
n

170
The cast flywheel rotor named profile one was considered in this case as it exhibited
lower weight compared to the others. This was attributed to the manufacturing and gentle
exponential curve it exhibits. The shaft consisted of fixed hinges (shoulders) to afford the
rotor disks from crushing onto the stator windings. This resulted in a fixed airgap of the
electrical machine. In addition, one of the rotor disks was fixed through the flywheel
side. This meant for every assembly process, the flywheel had to be removed first before
the rotor disk making the system inflexible. The press-fitting of the flywheel rotor made
the process even more cumbersome.
The grub screw used to hold the rotor disks in place were placed on the outer face of the
disk. This resulted in an imbalance during the low speed operation. In Fig. 6.1, it can be
seen that the test system exhibits a low energy to weight ratio. The system was ramped
up at rated current and overload as explained in sections below.
6.1.1 Rated Current at 10A
Rated current was supplied to the system. Fig. 6.2 shows the speed response at start up,
whereby the flywheel reaches a maximum speed of 320 rpm. The flywheel was unable to
reach high speed operation and this was attributed to the low developed torque in the
system.
Figure 6.2: Speed response at rate power
Univers
ity O
f Cap
e Tow
n

171
The line current response of the system at rated power is given in Fig. 6.3, whereby
BLDC mode of operation is evident by the square waveforms with a conduction angle of
120o.
Figure 6.3: Line current response at rated power The high losses resulting from the system were from the bearing structure which shows
evidence of very high stiffness. The electrical machine was rated at low power yet the
losses increased exponentially with speed. This meant the machine was unable to
accelerate to the required speed.
6.1.2 Over-Load at 30A
To overcome the high frictional losses in the bearing structure, the system was supplied
with 30A while monitoring the stator winding temperature. The system accelerated
quickly to 1,000 rpm as shown in Fig. 6.4; however the flywheel was disconnected from
the supply due to high temperature rise. The stator windings used in this case were of
class F.
Univers
ity O
f Cap
e Tow
n

172
Figure 6.4: Speed response at 30A
The line current response of the system at 30A is given in Fig. 6.5. It was evident that a
high current, the operation was still exhibiting square waveforms with a conduction
angle of 120o. The start up transients drop as the system ramps to speed.
Figure 6.5: Line current response at 30A The results from the first test set up showed that the machine was relatively small and
inadequate to produce enough torque to accelerate to the designed speed. This together
with the high friction bearings and large airgap made it even more complex.
Supply is cut off due to high temperature
Univers
ity O
f Cap
e Tow
n

173
In fact, there are numerous possible contributors to the unaccounted power loss in the
system. The misalignment in the test rig would add to the frictional losses. Furthermore,
these tests were not performed in the vacuum sealed containment; therefore the windage
losses would be considerably higher as the system ramped up to speed. Since the motor
is only rated at 100W, any of these factors could attribute to the results shown above. All
the above issues were considered in the 500W machine. The efficiency and losses at the
low speeds were not measured due to the low speeds achieved.
6.2 Results of Flywheel System with Modifications
As mentioned in section 6.3, the first flywheel set up exhibited low developed torque,
high temperature rise, low power and had a fixed air gap. The new machine was
designed and prototyped with other accessories to ensure elimination of the problems
encountered earlier as shown in Fig. 6.6.
Figure 6.6: Flywheel system with modifications
Flywheel rotor with modifications
Rotor Disk with overhang and grub screw
Energy efficient bearings
Univers
ity O
f Cap
e Tow
n

174
For this test, the layered flywheel rotor exhibiting profile two with modification was
considered. This meant more energy could be stored for any increased rotational speed
achieved. New energy efficient bearings were considered and these bearings reduce the
losses by 50% with a 95% saving.
To eliminate the fixed air gap problem, spacers between the rotor disks were considered
to vary the airgap. This meant better air gap sizing and flexibility. In addition, the rotor
disks were manufactured with an overhang and grub screw to hold the disks in place.
This ensured easier assembly of the electrical machine and flywheel rotor, making it
more flexible.
The 500W machine was considered for this test. The details of the prototype are given in
chapter 4. The use of the 500W machine meant increased cost of the system. However,
the construction and assembly was made much easier. The system was assembled in a
containment structure and air pressure reduced to eliminate the windage loss resulting
from the air friction as shown in Fig. 6.7.
Figure 6.7: Assembled flywheel system
Stator
Containment structure
Univers
ity O
f Cap
e Tow
n

175
The flywheel system was ramped up to 6,000 rpm. Vibrations were observed and the
testing was stopped at this stage due to safety concerns.
6.2.1 Rundown Curve
The system was accelerated to maximum speed of 6,000 rpm at reduced air pressure. Fig
6.8 shows the accelerating and run down curves. From the run down curve, the idling
losses (mechanical losses at no load) are extracted. During operation at normal air
pressure, the losses include, windage, frictional and stray losses. For reduced air
pressure, the losses include frictional and stray losses. The windage losses are considered
negligible at reduced air pressure.
Figure 6.8: The acceleration and run down curve of the flywheel system.
Fig.6.9 shows the measured and calculated losses. The measured loss shows an
exponential profile, which signifies the existence of windage loss. This is attributed to
the pressure leakages existing in the test rig.
Univers
ity O
f Cap
e Tow
n

176
Figure 6.9: Measured and calculated mechanical losses.
The vacuum pump used was not able to hold the vacuum consistently. In addition, due to
leaks in the containment structure, perfect vacuum was not achieved. The leaks result
from numerous connections required for the hall sensors, thermocouples, power cables
and stator brazing.
6.2.2 Flywheel System Efficiency
The charging efficiency during motor mode of operation and the total efficiency for a
resistive load test were measured and shown in Fig. 6.10 and 6.11. The system was
found to accelerate quickly, gaining the developed torque required to ramp the flywheel
rotor. The flywheel experiences relatively lower losses during low speed operation as
compared to high speed operation. Fig. 6.10 shows the motor mode efficiency with line
of best fit.
Univers
ity O
f Cap
e Tow
n

177
Figure 6.10: Motor mode efficiency
To ascertain the total round trip efficiency, the system is loaded during generator mode.
This efficiency is also termed as the energy conversion efficiency is result of power
required to convert electrical energy to mechanical in the rotating mass and back to
electrical energy in generator mode. Fig. 6.11 shows the overall flywheel efficiency at
rated current.
Figure 6.11: Shows the overall efficiency at 6,000rpm
Univers
ity O
f Cap
e Tow
n

178
It is observed that the efficiency rises with speed and takes the same form as the charging
efficiency of the system. The maximum attainable is not reached due to vibrations
experienced; however, this result gives a good indicator of what efficiencies can be
reached.
6.2.3 Thermal Results
A thermal model was developed in chapter 5 to predict the thermal behaviour of the
system. Temperature rises in the various parts of the system extracted using
thermocouples in the flywheel system and Pico logger. The parts where the temperature
readings were taken include, the stator windings, surface of the stator over the epoxy
resin, expected routes of the heat path. The temperature on the epoxy is very important as
it validates the conduction through the resin and temperature radiated to the magnets and
rotor disks. Fig. 6.12 and 6.13 shows the calculated and measured stator temperatures
respectively.
Figure 6.12: Calculated stator temperatures
Univers
ity O
f Cap
e Tow
n

179
The calculated temperatures in Fig. 6.12 show the predicted temperature for the stator
hotspot and epoxy temperature. In Fig.6.13, the measured values are presented.
Figure 6.13: Measured stator temperatures
The predicted and measured results show some level of correlation although the
difference in temperature could be between 10oC to 15oC. The flywheel system was not
run until the temperature stabilized and this was because of the vibrations concerns.
However, the model gives an approximation of what the temperature rise in the various
components could be. The temperature rise of the other peripheral components is given
in Fig. 6.14 and 6.15 which show the calculated and measured temperatures respectively.
Univers
ity O
f Cap
e Tow
n

180
Figure 6.14: Calculated peripheral temperatures
Figure 6.15: Measured peripheral temperatures
Fig. 6.14 shows only one temperature rise while Fig. 6.15 shows three. This is because in
the lumped parameter thermal model considered, all the components were not considered
and it is observed that the temperature rises are insignificant at rated current. The
position in the model seeks to observe the worst case temperature in the stator brazing
Univers
ity O
f Cap
e Tow
n

181
area which is considered the heat conductivity path for this system. The model shows a
good prediction against the measured values.
The accuracy of the thermal equivalent circuit can be validated by considering the
measured values of the losses. It can be concluded from these tests that the thermal
analysis of the flywheel system through an equivalent circuit gives sufficient information
about the thermal behaviour of the system.
6.3 Concluding Remarks
This chapter explained the analysis performed on two flywheel test set ups. The results
and impact of the modal and stress analysis on the performance of the system are
discussed. The flywheel system with 100W machine was tested, only achieving low
speed operation. The results of the system with modifications showed great improvement
in performance reaching up to 6,000 rpm. The modifications of the system are also. It
was observed that the sensitive parameters are the bearing system, machine, vacuum,
balancing of the shaft with rotor. It was observed that the system with modifications
acquired high energy to weight ratio as compared to first test system.
Univers
ity O
f Cap
e Tow
n

Chapter 7
Conclusions and
Recommendations _______________________________________________________________________
This chapter discusses conclusion and recommendations made to the research findings.
This thesis aimed to answer questions related to design and prototyping of flywheel
system rural application. The findings and further work are discussed in this chapter.
7.1 Conclusions
The main research question of this thesis was whether a low cost flywheel energy storage
system could be manufactured using locally available materials while maintaining its
technical integrity. Replacement of lead acid battery technology with the flywheel
storage systems for rural applications presents numerous advantages including, quick
charge times, extended operating life, being environmentally friendly and increased
efficiency. The specific objectives of this study are summarised as; critical literature
review of technological trends, establishment of flywheel rotor design techniques,
selection of a robust low cost electrical machine and drive and use of locally available
materials to design and construct a flywheel for energy storage.
Firstly, a critical review of the concept of flywheel energy storage was explored. This
was performed by reviewing the literature on flywheel development over the years by
industry and academia. A number of flywheel systems have been developed to date by
numerous companies and research groups but mainly for power applications. These were
Univers
ity O
f Cap
e Tow
n

183
mainly for frequency regulation, voltage compensation and bulk supply of power for a
few seconds. No commercial flywheels are available for long term energy storage
specifically for rural areas. However, advances in technologies for power and other
applications were found to be vital in promoting this technology for the rural agenda.
Notable is the advances in flywheel systems for vehicle application in hybrid electric &
electric vehicles and the use of these systems in space applications.
The review showed that the major limitations to flywheel development are; flywheel
rotor design and manufacture with high structural integrity, availability of low loss, low
cost bearings, efficiency of the electrical machine, simplicity of the drive system, safety
and reliability of the entire system. In addition, maintaining the idling losses at bare
minimum during free spinning is very critical in realising long term energy storage.
Various techniques for designing and optimising the flywheel rotor shape were reviewed.
The rationale for profiling the rotor shape of the flywheel rotor instead of the
conventional shape is due to the high cost of high strength materials required for high
speed operation. Two techniques were considered in the final design. Furthermore,
numerous flywheel rotor manufacturing techniques were reviewed and the main driving
factors of choice were cost and mechanical integrity.
The various electrical machine topologies for high speed operation were analysed. The
PM machines were found to be more efficient and exhibited numerous advantages
required in flywheel design. An axial flux topology for the electrical machine was finally
selected due to high torque, power density, compactness and simplicity in assembly as
compared to the radial topology. The machine was designed to operate in Brushless DC
mode of operation due to simpler control, lower maintenance, an attribute suitable for
rural applications.
It was realised that magnetic bearings are well suitable for flywheel applications as they
improve on the idling efficiency. Preliminary designs for vertical oriented configurations
were considered however, due to cost time factor, the use of the horizontal configuration,
Univers
ity O
f Cap
e Tow
n

184
conventional bearings were used. Hybrid ceramic and E2 energy efficient bearings were
considered and tested for both flywheel test set ups. These bearings are locally available
and fault diagnosis and maintenance can be done by local staff.
7.1.1 Findings Based on Experimental Results
The two design techniques for calculating the optimal flywheel rotor dimensions were
found to ascertain the required shape that utilised less material and exhibited low
mechanical stresses. One of the profiles exhibited exponential characteristics, henceforth
called profile one and the one with hyperbolic characteristics called profile two. These
design techniques were also found to cut down on time and complexity involved in
optimal shape design.
The two profile shapes were manufactured using two techniques, cast and layered
techniques. The casting method was used to manufacture both profile one and two
shapes. With this technique, only 30-35% fibre to resin ratio was realised and this was
attributed the low grade moulds used, which were selected for their low cost. The
process of creating the shape was found to be cumbersome due to the thermal cracking of
the thick flywheel rotor. The process was highly exothermic and with several attempts,
the cracks were only minimised. The casting approach was hence found to be cheaper
but the resultant product was limited in tensile strength. The layered technique was only
used to manufacture profile two shape. Due to the thickness of the piece, the inner wall
thickness was increased to accommodate the shaft and elastomeric layer. Numerous
attempts to hand lay the fibre with resin infusion were fruitless. The final product was
split into six parts, manufactured with 70-74% fibre-resin ratio and joined together to
form a 17.6kg flywheel rotor. The flywheel rotor manufactured from this technique was
found to be of high structural integrity however, the cost was more than quadruple the
casting technique flywheel.
Two AFPM machines were constructed, a 100W and 500W using a similar
methodology. The rotor disk of the 100W machine was built with 300WA low carbon
steel and had OD of 84mm. The four pole machine utilised NdFeB arc magnet segments
Univers
ity O
f Cap
e Tow
n

185
with a thickness of 10mm, outer diameter of 80mm and inner of 40mm. Glue, epoxy
resin and stainless steel ring were used to provide retention on the disk. The attractive
forces between the magnets were contained using fixed hinges on the shaft. The 100W
machine stator had a voltage rating of 36V and was wound using two strands of 0.8mm
copper wire. The double layer had six coils each with 32 turns per coil. The each coil
was wound separately, and then a star connection was made with two coils per phase in
parallel. The stator windings were moulded in epoxy resin.
The rotor disks of the 500W machine were made from high strength carbon steel with
170mm OD. This machine utilised NdFeB magnets with arc segment of 75o, 150mm
OD, 80mm ID and 10mm thick. The magnets were grade 40 (maximum energy product
40MGoe), NiCuNi plating with operating temperature of 120oC. The same retention
method was used except aluminium was used instead of stainless steel for mass
reduction. Also, spacers rather than fixed hinges were considered to increase flexibility
during assembly. The stator for the 500W machine was constructed from a 1.6mm
conductor size, class H insulation with voltage rating of 150V.
Two types of conventional bearings were considered, high speed hybrid ceramic
bearings used in a first flywheel test and E2 energy efficient bearings used in the second
test. The frictional moments for both bearing sets were analysed. The E2 bearings reduce
the frictional losses by 50% and are 95% less expensive. The major difference is in the
material used in the manufacture.
The profile one rotor manufactured from the casting technique and profile two from the
layered technique were shaft-coupled to the 100W and 500W electrical machine
respectively. The first set was tested at normal pressure and speeds of up to 350 rpm
were achieved at rated current. The system was supplied with three times the current
reaching speeds of up to 1,000 rpm. This high loss was mainly attributed to the frictional
loss from the hybrid ceramic bearings. During this time, over heating was realised in the
100W electrical machine and the supply cut off. The flywheel system with the 500W
machine was assembled with E2 energy efficient bearings and accelerated under reduced
Univers
ity O
f Cap
e Tow
n

186
air pressure containment up to 6,000 rpm at rated current of 10A. Measurements of
charging efficiency, which excluded losses in the inverter and generator mode, were
made reaching up to 21% efficiency. The average energy conversion efficiency was
found to be 18% at 6,000 rpm. The flywheel system was able to store up to 77Wh, which
represents 25.6% of the design energy requirement.
A thermal model was developed for the flywheel system to accurately determine the
thermal behaviour of the system. This was essential in predicting temperature rise in the
different components of the system. The experimental results were found to agree with
theory; hence the model was sufficient to check for temperature rises in the different
parts of the flywheel system in case of change in design parameters.
Critical to this research was the design, prototyping and analysis of a test rig used to
evaluate the performance of the flywheel system. This system was designed with the
ability to test various flywheel energy storage systems, flywheel rotors, high speed
electrical machines, drives and bearings.
A comparison was done between the life cycle costs of the traditional lead acid battery
storage system and a proposed electromechanical flywheel battery for a rural energy
storage application, using two different models. It was shown that the flywheel is more
cost effective in the long run than the traditional lead battery. Integrating the flywheel
system into Solar Home Systems would mean making a saving of 35% per kWh with
rural systems, under current conditions. This situation will improve even further in
favour of the flywheel given that this technology is still in transition while the lead acid
has practically reached its technical development.
Univers
ity O
f Cap
e Tow
n

187
7.1.2 Limitations of the Flywheel Prototype
The flywheel system was not accelerated to its rated operating speed range due to
vibrations encountered at 6,000 rpm. Numerous reasons were attributed to this.
• During the prototyping stage, only low speed balancing was achieved. Yet, high
speed balancing is essential in eliminating residual imbalance in the system
during high speed operation. Attempts to have the shaft-flywheel-machine system
balanced were unsuccessful as commercial high speed balancing experts were not
familiar with the flywheel rotor and its failure criteria.
• The flywheel rotor used in the high speed acceleration was hand layered creating
uneven fibre distribution in the E-glass composite rotor. At higher speeds, the
distribution affects the balancing inducing vibrations.
• The vibrations were also attributed to the flywheel shaft load imbalance. The
placement of the flywheel rotor and rotor disks on the shaft was analysed using a
FE method however the positioning was not optimised. The unbalance created in
the positioning resulted into excessive forces on one side of the bearing structure.
Notably, the bearing had to be changed during further testing.
• The assembly of the flywheel system on the test rig was considered as a source of
error. Small fabrication errors resulted in misalignment, unbalance and uneven air
gap clearance in the electrical machine. This was attributed to using many
fabricators.
Other problems include; fluctuation in the vacuum levels, limited thermal conductivity
path and increased size of flywheel rotor.
Univers
ity O
f Cap
e Tow
n

188
7.2 Recommendations
Results, analysis and performance of the high speed flywheel have been presented and
based on the findings, the following recommendations are made.
An optimised flywheel system can be achieved by closely linking the optimisation
design criteria of the flywheel rotor design to the electrical machine and drive design
algorithms.
Two techniques for developing flywheel rotor profiles have been discussed and were
sufficient in delivering the required inertial mass however, mechanical and structural
design optimisation could be investigated using numerical optimisation techniques. This
could open avenues to use the more expensive carbon fibre which can attain higher
rotational speeds.
The flywheel rotor, which is the only orthotropic composite in the system, was balanced
for only low speed. High speed balancing is therefore required to avoid vibrations. A
more balanced flywheel rotor could be achieved using an aluminium master plug-in for
the casting manufacturing technique and computer based programs to lay the fibre in the
lamination (layered) manufacturing approach.
A critical and sensitive aspect of this thesis was the bearings. Further research could
focus on low cost magnetic bearings and these would significantly reduce the frictional
losses. For rural applications, the research could focus at ease of construction, repair,
assembly and replacement. Magnetic bearings were considered in the first phase of this
research however due to cost and time constraints, this was not achieved. In the short
run, it is envisioned that cheaper and more efficient conventional bearings will be
produced. This specific trend is driven by the armature rewind market. These bearings
could further ease the cost. In the long run, magnetic bearings will drop in cost and
complexity, making them readily available for rural applications. Importantly, the
Univers
ity O
f Cap
e Tow
n

189
conventional bearings are easy to assemble and fault detection is possible using local
technology, something well suited for the rural applications.
The stator winding structure was appropriately designed however the use of epoxy resin
to improve on the structural integrity is counter progressive. The heat from stator
windings is not sufficiently conducted across. An epoxy resin with a thermal
conductivity of 0.35W/mK was considered. The use of a good conductor would mean a
clear heat conductivity path from the source hence reducing the complexity resulting
from modelling radiation. However, the utilisation of a good conductor would interfere
with the magnetic path. In addition, the material considered should be able to withstand
the high mechanical forces exerted on the stator as current is supplied. Further work
could also consider the use of a water cooled stator using silicon tubing. The efficiency
and the choice between natural and forced cooling could be investigated.
Cost optimisation of the electrical machine is essential as the PM magnets were found to
be expensive. However, the South African government is looking at manufacturing
magnets to reduce the cost of PM machine manufacture that can be used for not only
flywheel technology but also the penetration of PM machines for renewable energy.
The drive system topology was not fully utilised. The system was manually operated
without the use of the DC-DC converter. The system could be extended to fully utilise
the DC-DC converter and replace the dSPACE control desk with a microcontroller. This
study could also include the efficiency considerations due to the power electronics.
The performance of the flywheel energy storage system was not fully assessed because
of the vibrations observed during its operation. Vibration analysis concerns arising from
imbalance and mechanical alignment could be investigated so as to realize increased
operating speed range of the flywheel energy storage system.
Univers
ity O
f Cap
e Tow
n

190
APPENDICES
Appendix A: Publications
A1. Conferences
1. R.Okou, M.A Khan, A.B Sebitosi, P.Pillay A Case for Electromechanical
Energy Storage, SAUPEC08, Durban, 2008.
Flywheels are energy storage devices that have been around for thousands of years. The origins and use of modern flywheel technology for mechanical energy storage can be traced to several hundred years ago and was further developed throughout the industrial revolution. These systems exhibit many advantages over other energy storage systems. However, the original designs were costly, unsafe and limited by power electronics, strength of materials and bearings. In the recent years, there have been renewed interests due to technology developments in those areas. This paper could contribute to the betterment of various sectors and applications including; transport, environment, rural electrification, power quality among others.
2. R.Okou, M.A. Khan, A.B. Sebitosi, P. Barendse, P. Pillay, An Approach to
High Speed Electromechanical Flywheel and Brushless DC Machine
design, SAUPEC09, Stellenbosch 2009.
This paper presents a design of a high speed electromechanical flywheel for energy storage. A brushless dc machine was designed as a motor/generator. The design procedures for the machine are discussed. The system is explored both analytically and using finite elements. The rotating flywheel rotor is designed using fibre and epoxy and envisaged to operate between 8,000 rpm and 25,000 rpm. Stress and electromagnetic analyses together with loss models are presented. The total loss of the system was found to be 28.3W which corresponds to 10 hours of idling. The maximum radial and hoop stresses were found to be below the designed maximum stresses for all the rotating components.
3. G.Mwaba, R.Okou, M.A Khan, P. Pillay, Comparison of Permanent
Magnet Topologies for High Speed Flywheels, SAUPEC09, Stellenbosch,
2009.
Univers
ity O
f Cap
e Tow
n

191
This paper discusses the comparison of several PM machine topologies for use in high speed flywheels. A high level comparison of four topologies is done including outer rotor Halbach array, radial flux, axial flux and double rotor single stator machines. A detailed comparison based on analytical modeling is then performed for a brushless ac and brushless dc machines.
4. R.Okou, G.Mwaba, MA Khan, P. Barendse, P Pillay, High Speed
Electromechanical Flywheel Design for Rural Electrification in Sub
Saharan Africa, IEEE International Electrical Machines and Drives
Conference (IEMDC) 2009.
This paper presents the electromechanical flywheel energy storage system designed to enhance rural electrification in sub-Saharan Africa. Most non-grid connected areas, mostly rural, are powered with solar home systems whose sustainability is limited by the short life span, low power density and low storage efficiency of the battery storage. The electromechanical flywheel rotor is made from glass fiber and epoxy composite and designed using novel shape profiles based on Berger, Porat and Stodola’s design. Dr. Stodola’s design utilizes a stress based solution by introducing a central hole for a shaft inclusion. An Axial flux brushless DC machine was considered because of the low cost, ease of construction and simple control. The system stores 1,080kJ and supplies 100W with an operating speed range of 8,000-25,000 rpm. Stress, modal and thermal analysis are performed on the flywheel system using finite elements and analytical methods. The brushless DC drive together with the DC-DC converter were constructed and tested. The various components were simulated, prototyped using locally available material and the results presented.
5. R.Okou, MA Khan, P. Barendse, P. Pillay, Test Rig for High Speed
Electromechanical Flywheels in Sub Saharan Africa, IEEE International
Electrical Machines and Drives Conference (IEMDC) 2009.
This paper presents a test rig designed at the University of Cape Town to evaluate the performance of a high speed electromechanical flywheel for energy storage. The electromechanical flywheel is specifically designed to enhance rural electrification through improving the energy storage component in solar home systems. A safe, flexible and low vibration test rig has been designed. Modal analysis using an FE package ANSYS was used to validate the low vibrations at high speed rotation. Special attention was given to the alignment issues and this was done to avoid imbalance in the rig. The rig has the ability to test up to 40,000 rpm flywheel with maximum diameter of 0.55m as is. With changes in the bearings, much faster flywheels can be tested. In addition, the rig was built to ensure testing under various operating environments. A thermal model was developed for the rig and simulated with analytical and FE packages. Sensors are
Univers
ity O
f Cap
e Tow
n

192
installed in the containment to monitor performance of flywheel system. 6. R.Okou, M.A. Khan, P. Barendse, P. Pillay, Considerations to high speed
electromechanical flywheel design for sub-Saharan Africa, IEEE, Electrical
Power and Energy Conference (EPEC) 2009, Montreal, Canada.
The results of an electromechanical flywheel are presented to ascertain the considerations during the design stage. The design procedure is explained in brief. The considerations include, load profiling, mechanical and electrical aspects are discussed. This is essential in achieving the numerous advantages associated with the flywheel energy storage system. The results for low speed testing are presented with considerations to improving the system.
7. R.Okou, MA Khan, P. Barendse, P Pillay, Thermal Analysis of flywheel
with brushless DC machine, IEEE, Electrical Power and Energy Conference
(EPEC) 2009, Montreal, Canada
A thermal model of an electromechanical flywheel with a brushless DC machine is presented. Thermal analysis is particularly important during vacuum operation of the flywheel. Accurate prediction of temperature facilitates material selection and structural integrity which good performance. In addition, the choice of vacuum level, bearings, conductor sizes and system overload capability can be attributed to a good thermal model. A thermal model was developed and simulated on MATLAB Simulink. The simulation results were compared with experimental results and a good correlation was observed.
A2. Journals
8. AB Sebitosi, R.Okou, Re-thinking the power transmission model for sub-
Saharan Africa, Elsevier Policy 38 (2010) 1448-1454.
A vision for a United States of Africa has been advocated since the dawn of independence by, among others, pioneers like Kwame Nkrumah, Gamal Abdel Nasser and Julius Nyerere. More recently the idea gained new momentum, through such initiatives as the New Partnership for African Development (NEPAD) and the African Union (AU) to create a single market of Africa’s 750 million people that is competitive within itself and within the global economy. This would be achieved through a deliberate, systematic and concerted effort to integrate, upgrade and modernize
Univers
ity O
f Cap
e Tow
n

193
infrastructure that would offer the required catalyst for economic growth. However, the prioritization by African policy makers of a grand plan to link up the entire African continent’s electric power grid networks would appear to be incompatible with 21st century thinking. The specifications for a centrally managed power grid were made by Nicola Tesla in 1883 and have served the power industry for over 125 years but are now obsolete in the era of digital micro-electronics and smart grid concepts. This paper examines some issues that surround the evolution of sub-Sahara African regional power pools and highlights the anomalies and perhaps wrong timing around the conceptualization and prioritization of grand inter-state power grids. The authors then propose an alternative model that conforms to a new and more sustainable paradigm in electricity supply economics. The proposals are however not meant to provide a panacea but it is hoped that the article will ignite a debate that will lead to a lasting solution.
9. R.Okou, M.A. Khan, A.B. Sebitosi, P. Pillay, Possible Impact of Small Scale
flywheel Energy Storage Technology on Uganda’s Energy Sector, Journal of
Energy South Africa, Volume 20, No 1, February 2009.
The energy crisis in Uganda has caused a sharp decline in the growth of the industry sector from 10.8% to 4.5% between 2004/5 and 2005/6. This crisis has escalated the power disruptions, which have had adverse effects on various sectors. While business owners have resorted to importation of fossil fuel generators that have increased the cost of production, others have resorted to battery energy storage systems to cater for short outages, which are limited in life span, depth of discharge, among others. These interventions have, thus further, increased the cost of goods and services. In addition, the rural populations using solar home systems incur high battery maintenance and replacement costs. In this paper an electromechanical flywheel battery is proposed as a better alternative in mitigating energy storage problems. It is found that by replacing the battery storage systems with the electromechanical flywheel battery, a saving of up to 35% on cost of energy can be made in the solar home systems and for the industry sector, the power disruptions could be reduced.
A3. Under review
10. R.Okou, M.A. Khan, P. Barendse, A.B. Sebitosi, P. Pillay, An
electromechanical battery for rural electrification in sub-Saharan Africa,
IEEE ECCE 2010.
This paper presents an electromechanical battery energy storage system designed to enhance rural electrification in sub-Saharan Africa. The system consists of a flywheel rotor, an electrical machine, bearings and a containment structure. The flywheel rotor was constructed from E-glass fiber, the machine from imported NdFeB magnets and commercial energy efficient bearings. With the exception of the power electronics and magnets, local materials were used for the manufacture of the flywheel system. The
Univers
ity O
f Cap
e Tow
n

194
system was designed to operate between 8,000 rpm to 25,000 rpm with a rated storage capacity of 300Wh. Numerical stress analysis was performed during the design stage to ensure that the maximum tensile strength is not exceeded. A lumped parameter thermal model was used to estimate the temperature distribution to ensure safe operating conditions of the flywheel system and environment. The system was accelerated to 6,000 rpm and the results are presented.
11. R.Okou, M.A. Khan, P. Barendse, P. Pillay Test rig for high speed
electromechanical flywheels in sub-Saharan Africa, IEEE Transactions on
Energy Conversion
This paper presents a test rig designed and developed to evaluate the performance of a high speed electromechanical flywheel for energy storage. The system is specifically designed to enhance rural electrification through improving the energy storage component in Solar Home Systems (SHSs). Two electrical machines built with high mechanical integrity rated at 100W and 500W are used to test different flywheel rotors. The drive system is able to test different types of machines and/or flywheel systems. The friction moments of the bearings used are highlighted. Modal analysis using an FE package ANSYS was used to investigate the vibrations at high speed rotation. The rig has the ability to test up to 40,000 rpm flywheels with a maximum outer diameter of 465mm as is. With changes in the bearings, much faster flywheels can be tested. The rig was built to ensure testing under various operating environments. A thermal model was developed for the rig and simulated with analytical and FE packages. Thermocouples are installed in the containment to monitor thermal performance of flywheel system.
12. R.Okou, M.A. Khan, P. Barense, P. Pillay, High Speed electromechanical
flywheel design for rural electrification in sub-Saharan Africa, IEEE
Transactions on Energy Conversion
This paper presents the electromechanical flywheel energy storage system designed to enhance rural electrification in sub-Saharan Africa. The system consists of a flywheel rotor, electrical machine, drive system, bearings and containment structure. The flywheel rotor is made from glass fiber and epoxy composite and designed using novel shape profiles based on Berger, Porat and Stodola’s design. Dr. Stodola’s design utilizes a stress based solution by introducing a central hole for a shaft inclusion. An Axial Flux Permanent Magnet (AFPM) machine topology was considered for two machines with the driving factors of choice being low cost, ease of construction and simple control. The system is capable of storing 227kJ with a designed operating speed range of 8,000-25,000 rpm. Stress, modal and thermal analysis are performed on the flywheel system using Finite Elements (FE) and analytical methods. The Brushless DC drive (BLDC) was constructed and tested. The various components were prototyped using locally available material, assembled, tested and the results presented.
Univers
ity O
f Cap
e Tow
n

195
13. R.Okou, M.A. Khan, A.B. Sebitosi, P. Pillay, Local manufacture of high
speed flywheel rotors for rural communities in sub-Saharan Africa, IEEE
Transactions on Sustainable Energy
This paper presents the electromechanical flywheel rotor prototypes designed to enhance rural electrification in sub-Saharan Africa. The flywheel rotor was made from E-glass fibre with epoxy resin and designed using novel shape profiles based on Berger, Porat and Stodola’s designs. Dr. Stodola’s design utilizes a stress based solution by introducing a central hole for a shaft inclusion. The rotors were manufactured using locally available materials. A test rig with an axial flux brushless DC machine topology was used to test one of the flywheel rotors storing 227kJ. A life cycle cost analysis was performed to compare the energy costs between the battery and flywheel rotor system. It was realized that by integrating the flywheel system into Solar Home Systems would result in a saving of 37% per kWh for rural system installations.
Univers
ity O
f Cap
e Tow
n

196
Appendix B: Numerical stress analysis
B1. Profile one stress analysis
• Normal Stress
• Shear Stress
Univers
ity O
f Cap
e Tow
n

197
B2. Profile two stress analysis
• Normal stress
• Shear stress
Univers
ity O
f Cap
e Tow
n

198
B3. Profile two with modifications
• Maximum Principal elastic strain and normal stress
• Shear Stress
Univers
ity O
f Cap
e Tow
n

199
• Maximum shear elastic strain
Univers
ity O
f Cap
e Tow
n


![Understanding and the functionality of GIS Richard Knight, Biodiversity and Conservation Biology, University of the Western Cape Email: knight.rich[at]gmail.com](https://img.pdfslide.us/doc/110x75/56649eac5503460f94bb265f/understanding-and-the-functionality-of-gis-richard-knight-biodiversity-and.jpg)