Embed Size (px)
Citation preview

Richard Layard Has social science a clue?: what is happiness? Are we getting happier? Lecture
Original citation: Originally presented at Layard, Richard (2003) Has social science a clue?: what is happiness? Are we getting happier? In: Lionel Robbins memorial lecture series , 03-05 Mar 2003, London, UK. This version available at: http://eprints.lse.ac.uk/47425/ Available in LSE Research Online: November 2012 © 2003 CEP & LSE LSE has developed LSE Research Online so that users may access research output of the School. Copyright © and Moral Rights for the papers on this site are retained by the individual authors and/or other copyright owners. Users may download and/or print one copy of any article(s) in LSE Research Online to facilitate their private study or for non-commercial research. You may not engage in further distribution of the material or use it for any profit-making activities or any commercial gain. You may freely distribute the URL (http://eprints.lse.ac.uk) of the LSE Research Online website.
Lionel Robbins Memorial Lectures 2002/3
Delivered on 3, 4, 5 March 2003 at the London School of Economics
HAPPINESS: HAS SOCIAL SCIENCE A CLUE?
Richard Layard
Lecture 1. What is happiness? Are we getting happier? Lecture 2. Income and happiness: rethinking economic policy. Lecture 3. How can we make a happier society?
RL348b 25 February 2003
Lecture 1
What is happiness? Are we getting happier?
Definition
The fluctuation of mood
Evidence from neuro-science
The desire to feel good
The overall social outcome
Trends in happiness
Comparing happiness across countries
Trends in depression and crime
1
RL348b 25 February 2003
I’m delighted to be giving these lectures because when I was very young and
impressionable, I had the great experience of working with Lionel Robbins. He was
chairman of the Robbins Committee on Higher Education and in his autobiography he
says that working with Claus Moser and me at that time was “one of the most
rewarding experiences” of his life. I feel exactly the same. Discussing any issue with
Lionel was like a great voyage of discovery, and, if anyone ever practised the
evidence-based approach to social policy, it was him.
However in these lectures I shall be taking a very different line from the one
he took on the subject of happiness, and a little intellectual history will set the scene
for what I want to do.
In the eighteenth century Bentham and others proposed that the object of
public policy should be to maximise the sum of happiness in society. So economics
evolved as the study of utility or happiness, which was assumed to be in principle
measurable and comparable across people. It was also assumed that the marginal
utility of income was higher for poor people than for rich people, so that income
ought to be redistributed unless the efficiency cost was too high.
All these assumptions were challenged by Lionel Robbins in his famous book
on the Nature and Significance of Economic Science published in 1932. Robbins
argued correctly that, if you wanted to predict a person’s behaviour, you need only
assume he has a stable set of preferences. His level of happiness need not be
measurable nor need it be compared with other people. Moreover economics was, as
Robbins put it, about “the relationship between given ends and scarce means”, and
how the “ends” or preferences came to be formed was outside its scope.
So this was to be the agenda of positive economics, and it has remained so to
this day. But what are we to say about public policy? Robbins himself was not
averse to public debate but he did not believe that optimal public policy could be
analysed within a formal economic framework. However his followers in the
remarkable economics department which he created here were more bold. Hicks and
Kaldor proposed as a measure of national welfare something close to the GDP
2
RL348b 25 February 2003
adjusted for leisure and pollution. Though some economists (including some here)
have objected to this,1 the majority of economists work with it quite happily.
But in fact the GDP is a hopeless measure of welfare. For since the War that
measure has shot up by leaps and bounds, while the happiness of the population has
stagnated. To understand how the economy actually affects our well-being, we have
to use psychology as well as economics. Fortunately psychology is now moving
rapidly in the right direction and I hope economics will follow.
Interestingly, psychology like economics went through its behaviourist phase,
but a little earlier. In the nineteenth century psychologists were allowed to talk about
feelings. But then along came Pavlov, followed by Skinner, who argued that we can
never know other people’s feelings and that all we can therefore do is to study their
behaviour. At that time behaviour was largely attributed to conditioning. You may
know the story of how Skinner’s students decided to test his theory. When he was
lecturing, Skinner used to walk up and down the platform, and the students agreed
that, whenever he went to the left part of the platform, they would look down and
frown, and when he went to the right end they would look up and smile. After a short
time they had him falling off the right of the platform.
So behaviourism was the intellectual climate of the 1930s and it is not
surprising that economics absorbed that credo. But in the last 20 years psychologists
have returned in strength to the study of feelings – measuring them, comparing them
across people, and explaining them. 2 And many anthropologists have also concluded
that there are important universals in human nature, without which it would be
impossible for us to understand each other.3
So people concerned with policy can now revert to the task of maximising the
sum of human well-being, based on a steadily improving social science. In these
lectures I want to develop a picture of this project and some initial conclusions. What
I shall do is this. In the first lecture I shall discuss the nature and measurement of
1 e.g. Meade, Sen, Atkinson, Mirrlees and others working mainly in the utilitarian tradition. 2 Kahneman et al (1999). 3 Brown (1991).
3
RL348b 25 February 2003
happiness and provide compelling evidence that, despite economic growth, happiness
in the West has not grown in the last 50 years.
In the second lecture I shall ask why happiness has not increased, despite huge
increases in living standards, and draw some startling conclusions about the efficient
level of taxation. And in the third lecture I shall discuss what other policies really
would produce a better quality of life. I shall end with a rousing defence of the
utilitarian philosophy, which motivates this whole endeavour.
DEFINITION
So what do I mean by happiness? By happiness I mean feeling good –
enjoying life and feeling it is wonderful. And by unhappiness I mean feeling bad and
wishing things were different. There are countless sources of happiness, and
countless sources of pain and misery. But all our experience has in it a dimension
which corresponds to how good or bad we feel. In fact most people find it easy to say
how good they are feeling, and in social surveys such questions get 99% response
rates – much higher than the average response rate to questions.
I want to stress the point about a single dimension. Happiness is just like
noise. There are many qualities of noise, from a trombone to a caterwaul. But they
can all be compared in terms of decibels. In the same way different types of pain, like
toothache and tummy ache, can be compared, and so can different modes of
enjoyment. Moreover, as I shall show, happiness and unhappiness are not separate
dimensions; they are simply different points along a continuum. They may feel quite
different, like heat and cold, but they are all part of the same phenomenon.
This is what Bentham thought, but John Stuart Mill of course made a
distinction. He thought there were two dimensions of happiness, quantity and quality.
However psychologists have not been able to identify a separate qualitative
dimension. Mill was surely onto something, but what he should have said is that there
4
RL348b 25 February 2003
are different causes of happiness – those that produce enduring effects on happiness
and those whose effects are transient.
THE FLUCTUATION OF MOOD
Obviously people’s feelings fluctuate from hour to hour and from day to day.
Using peoples’ own reports psychologists have begun to study carefully how peoples’
mood varies from activity to activity. I will give only one example, from a study of
around 1000 working women in Texas.4 They were asked to divide the previous day
into episodes, like a film. Typically they identified about 15 episodes. They then said
what they were doing in each episode, and who they were doing it with. Finally they
also asked how they felt in each episode, along twelve dimensions which were then
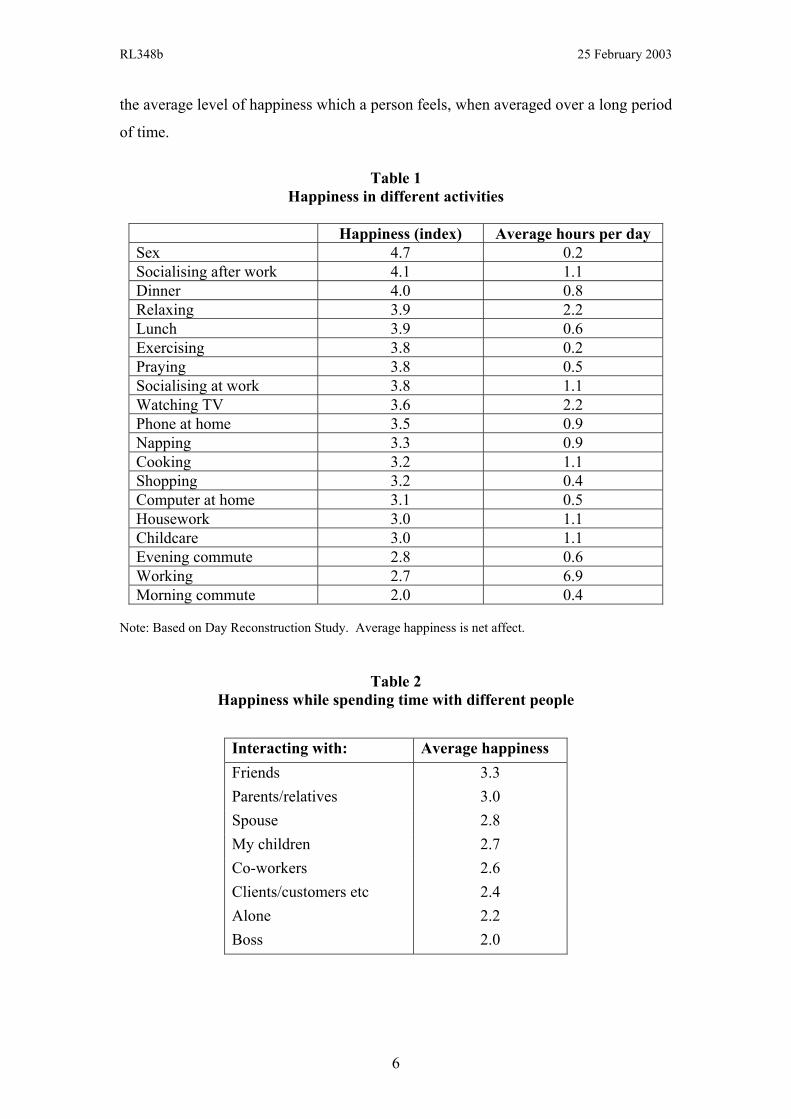
combined into a single index of feeling. The first table shows what they liked most –
sex, and what they liked least – commuting.
The second table shows what company they most enjoyed. They were highly
gregarious – preferring almost any company to being alone. Only the boss’s company
was worse, which presumably means that there was little sex involved.
We can also use these reports to measure how feelings change as the day goes
on. As the graph shows, people feel better as time passes, except for a dip after lunch
(Figure 1). They also feel more tired as the day goes on – except for a period around
about now (Figure 2). But the most striking finding of the study is not the movement
in the graph as people move between activities but the huge difference in the general
level of happiness between different people.5 It is this underlying happiness and its
determinants which these lectures are about.6 What we really want to understand is
4 See Kahneman et al (2003) – reference needed. Add graph of tiredness. 5 We can take the 13,000 episodes reported and divide the variance of happiness across these episodes into three additive effects: the fixed effect of the type of episode (as listed in Table 1), the fixed effect of the person, and an unexplained effect. Of the total variance, only 6% is due to the type of episode, while 40% is due to the person, leaving 54% unexplained.. 6 See Kahneman (1999). In principle we are interested in the objective reality of life as it was experienced. There is the well-known problem that people do not always recall their feelings accurately. In medical operations they tend to remember mainly the peak of pain and the degree of pain at the end of the operation, and not to remember how long the pain lasted. So ideally experience should be measured at the same time as it occurs. This can be done by the Experience Sampling Method (ESM). But, as Kahneman et al (2003) show, for our purposes asking them one day later gives similar results.
5
RL348b 25 February 2003
the average level of happiness which a person feels, when averaged over a long period
of time.
Table 1
Happiness in different activities
Happiness (index) Average hours per day Sex 4.7 0.2 Socialising after work 4.1 1.1 Dinner 4.0 0.8 Relaxing 3.9 2.2 Lunch 3.9 0.6 Exercising 3.8 0.2 Praying 3.8 0.5 Socialising at work 3.8 1.1 Watching TV 3.6 2.2 Phone at home 3.5 0.9 Napping 3.3 0.9 Cooking 3.2 1.1 Shopping 3.2 0.4 Computer at home 3.1 0.5 Housework 3.0 1.1 Childcare 3.0 1.1 Evening commute 2.8 0.6 Working 2.7 6.9 Morning commute 2.0 0.4
Note: Based on Day Reconstruction Study. Average happiness is net affect.
Table 2 Happiness while spending time with different people
Interacting with: Average happiness Friends 3.3 Parents/relatives 3.0 Spouse 2.8 My children 2.7 Co-workers 2.6 Clients/customers etc 2.4 Alone 2.2 Boss 2.0
6

RL348b 25 February 2003
Figure 1 Average happiness through the day
6 8 10 12 14 16 18 20 22
Time of day (24 hour clock)
6 8 10 12 14 16 18 20 22
Time of day
6 8 10 12 14 16 18 20 22
Time of day (24 hour clock)
6 8 10 12 14 16 18 20 22
Time of day
Figure 2 Average tiredness through the day
-2.0
-1.5
-1.0
-0.5
0.0
0.5
1.0
1.5
2.0
8 9 10 11 12 13 14 15 16 17 18 19 20 21Time of Day
7
RL348b 25 February 2003
EVIDENCE FROM NEURO-SCIENCE
But before we do that we have to ask whether the feelings which people
report correspond at all accurately to any kind of objective reality? We need to be
sure that, when people say they feel something, there is a corresponding event that can
be objectively measured.
We now know that there is. For the feelings which people report correspond
closely to activities in the brain which we can now measure from instant to instant.
This relationship is important to us for two reasons. First, the correlation applies quite
accurately over time within each individual, providing a solid basis for the notion that
happiness is a cardinal variable, rising and falling just like your blood pressure. And,
second, the correlation holds strongly across people, confirming our view that
happiness can be compared between people.
So let me tell you a bit about these findings, many of which are due to the
remarkable work of Richard Davidson at Wisconsin.7 The main finding is that
positive feelings correspond to brain activity in the left side of the pre-frontal cortex,
somewhat above and in front of the ear. And negative feelings correspond to brain
activity in the same place on the right side of the brain. (All this is for right-handed
people.) To detect the activity, you can use electrodes on the scalp to get an EEG
which measures the electrical activity in that part of the brain. Or, more reliably, you
can pick up the flow of oxygen to replace the energy used up in the electrical activity.
This can be measured by functional magnetic resonance imaging (fMRI). Or, slightly
less instantaneous, you can used the so-called PET scan to measure the blood flow
using radio-active isotopes put into the blood.
All these methods give good correlations between reported feelings and brain
measurements. Here is an example when people are put inside an MRI scanner and
then shown nice or nasty pictures. People are shown the following two pictures: of a
happy baby and of one that is severely deformed. The MRI scanner picks up the
corresponding change in oxygen flow in the brain and records it as light patches in the
7 Davidson (2000).
8
RL348b 25 February 2003
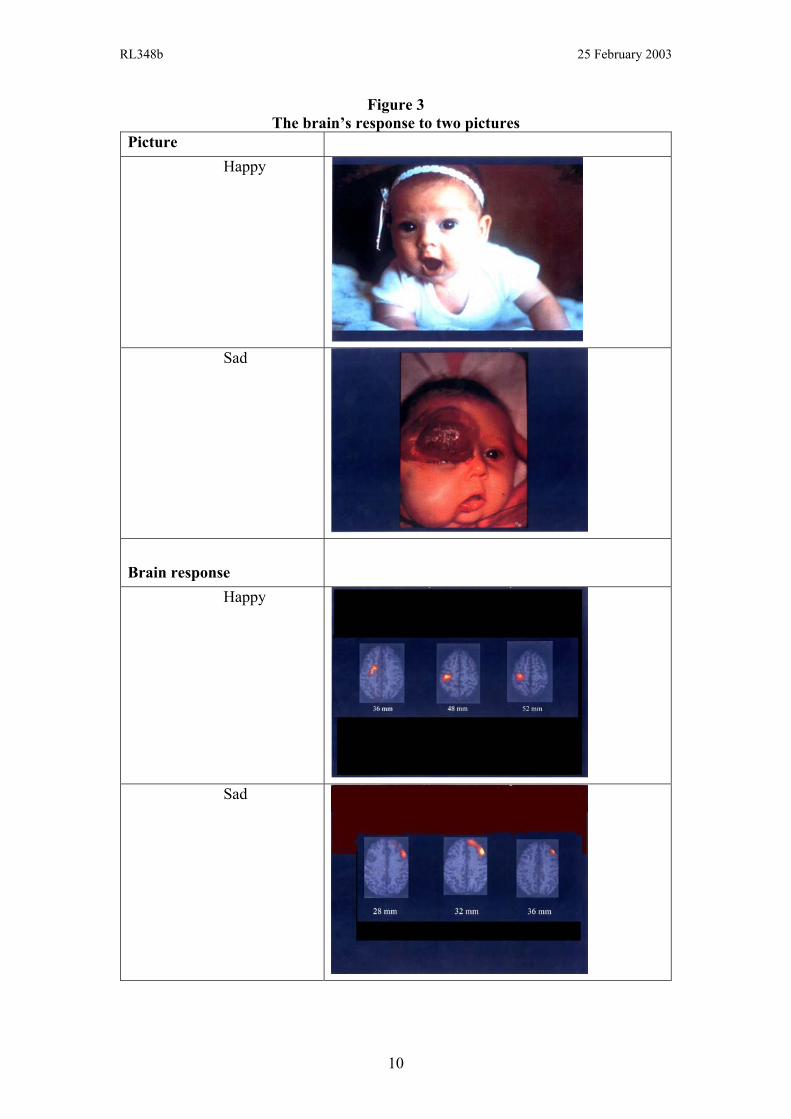
following two photographs. The nice picture activates the left side of the brain and
the horrendous picture activates the right side.8
So here we have objective measurements of how feelings change over time. More
important, the same measurements can also be used to compare the happiness of
different people. For people differ in the pattern of their brain activity, even when
they are at rest. People whose left side is especially active (‘left-siders’) report more
positive feelings and memories than ‘right-siders’ do. Left-siders smile more and
their friends assess them as happier. By contrast, people who are especially active on
the right side tend to report more negative thoughts, to smile less and to be assessed as
less happy by their friends. Interestingly, the EEG approach works even on newly-
born babies. When given something nice to suck, their left fore-brain starts humming,
while a sour taste sets off activity in the right brain. At 10 months old, a baby’s brain
activity at rest predicts how well it will respond if its mother disappears for a minute.
Babies who are most active on the right side tend to howl, while the left-siders remain
upbeat. And at 2½ years old, left-sided youngsters are more exploratory, while right-
siders cling more to their mothers. However, fortunately, between the ages of 3 and
11 there are many changes in the ranking of children, both by character traits and by
brain-waves.9
8 I am grateful to Richard Davidson for this material. 9 Davidson et al. (2000).
9
RL348b 25 February 2003
Figure 3 The brain’s response to two pictures
Picture Happy
Sad
Brain response
Happy
Sad
10
RL348b 25 February 2003
And what about the question of whether negative feelings are simply the
negative end of positive feelings? The evidence supports this view. Provided we
measure feelings over short periods of time, positive and negative feelings are
strongly inversely correlated. This is true whether we are comparing the same
individual at different moments of time, or comparing different individuals. And it is
true whether we are using psychological reports of feeling or measurements on the
brain. If feelings are measured over longer periods of time, the correlation goes down
but this is because the variance of true happiness falls and gets buried under
measurement error. So once again we can conceptually think of happiness as a single
variable.10
Finally, let me mention that the measures of happiness that I have discussed
are well correlated with many measures of physical health – with better immune-
system responses and with lower stress-causing cortisol. As one example, when the
flu virus was administered to a group of people, those with strong activity in the left
forebrain were less likely to get ill.
THE DESIRE TO FEEL GOOD
So I hope I have persuaded you that there is such a thing as happiness, as
Bentham believed. But Bentham also believed that happiness matters because it is
what people want. Indeed he argued that in the end all actions are driven by the desire
to feel good. So what does modern psychology say?
Most psychologists believe two things about this. First they believe that we
are always, often unconsciously, evaluating our situation and the elements in it.
Second, we are attracted to the favourable elements and seek to have them or to
prolong them; and we are repelled by the unfavourable elements and seek to avoid
them or try to bring them to an end. Psychologists call this “approach and
avoidance”.
10 For operational purposes we often find that the difference between positive and negative feelings, whether measured by self-report or readings on the brain, is the best measure of happiness – on the basis of its correlation with other measures of happiness, or with behaviour, or with physical health.
11
RL348b 25 February 2003
It is easy to see why evolution would have selected beings who behaved like
this. First we like what is good for our survival. We then seek what we like. And so
it follows that we survive.
The two psychological propositions are illustrated by two ingenious
experiments of John Bargh.11 His technique is to flash up good or bad words on a
screen and observe how people respond. In one experiment he flashed the words
subliminally and recorded the impact on the subject’s mood. The good words
improved mood and the bad ones worsened mood – showing the passive nature of the
evaluation process. He next examined approach and avoidance behaviour by making
the words on the screen legible but asking the subject to remove them with a lever.
For group A the words were to be removed in the natural way by pulling for the good
words and pushing for the bad. But group B had to pull for the bad words and push
for the good which is unnatural. They did the job much more slowly.
So there is an evaluative faculty in all of us which tells us how happy we are
and then directs our actions towards improving our happiness. From the various
possibilities open to us, we choose whichever combination of activities will make us
feel best.
This is not a vacuous statement, as is sometimes alleged. It means quite
specifically that if a person likes A and B, and the cost of A in terms of B rises, the
person will choose less A. This so-called law of demand has been confirmed
throughout human life and among rats.12 It is not uniquely human but probably
applies to most living things, all of which have a tendency to pursue their own good
as best they can. In lower animals the process is unconscious, and even in humans it
is mostly so, since the conscious brain could not possibly handle the whole of this
huge problem. However we do have a massive frontal cortex which other mammals
lack, and that is where the conscious part of the balancing operation is performed.
11 Bargh and Chartrand (1999). 12 Shizgal and Conover (1996).
12
RL348b 25 February 2003
This psychological model is very much like the one that economists have used
from Adam Smith onwards. We want to be happy and we act to promote our own
happiness, given the possibilities open to us.
There are of course exceptions. Some types of behaviour which are desired
are bad for survival – anorexia is bad for you and so is cigarette smoking. And people
are often short-sighted and bad at forecasting their future feelings. Natural selection
has not produced perfect psyches nor has it produced perfect bodies. We are clearly
selected to be healthy but we sometimes get sick. Similarly we are selected to feel
good, and it would be impossible to explain human action and human survival except
by the desire to achieve that feeling.
THE OVERALL SOCIAL OUTCOME
And what is the result of this process? Good in parts. In the standard
economic model, private actions and exchanges get us to a Pareto optimum where no
one could be happier without someone else being less happy. There are of course
problems of information, foresight, externality and economies of scale which require
some collective action. But, broadly speaking, the economic model says that the
higher the real wage the happier the population.
What is wrong with that model is that it assumes constant tastes. It fails to
realise that our wants (once we are above subsistence level) are largely derived from
society and that they are major factors affecting our happiness.13 To a large extent we
want things and experiences because other people have them. We are also products of
our education and the moral values which we inherit. And we live in communities
which can be more or less peaceful and trusting. All these outside influences come at
us direct, and not through contractual agreements in which we exercise our choice.
13 As Karl Marx said “A house may be large or small; as long as the surrounding houses are equally small, it satisfies all social demands for a dwelling. But if a palace rises beside the little house, the little house shrinks into a hut”.
13

RL348b 25 February 2003
If these social influences were unaffected by economic policy and by
economic ideology, we could think of economic policy in one compartment and social
policy in another. But unfortunately the world is not like that, and rational policy
requires the simultaneous use of many disciplines.
The need is pretty obvious, but one fact makes it absolutely essential. People
in the West have got no happier in the last 50 years. They have become much richer,
they work much less, they have longer holidays, they travel more, they live longer,
and they are healthier. But they are no happier. This shocking fact should be the
starting point for much of our social science.
So let me spend the rest of this lecture documenting this fact.
TRENDS IN HAPPINESS
For the US the General Social Survey has asked the following question since
the early 1970s, “Taken all together, how would you say things are these days –
would you say you are very happy, pretty happy or not too happy”. Here are some
answers (Table 3). As you can see, the distribution of happiness is practically
unchanged over the period.
Table 3 Distribution of happiness in the U.S. (%)
1975 1996 Very happy 32 31 Pretty happy 55 58 Not too happy 13 11 100 100
Source: General Social Survey. Persons over 15.
Before the early 1970s a similar question was asked by the Gallup
organisation and in Figure 4 I have linked the two series together to show what
proportion of people were very happy throughout the post-war period. As you can
14

RL348b 25 February 2003
see, the proportion of people who said they were very happy rose in the 1950s, fell in
the 1960s and has been fairly stable ever since. The contrast with the trend in GDP
per head is striking.
Figure 4 Income and happiness in the USA
GDP per head ($, 2001 prices)% very happy
GDP per head
% Very Happy
For Japan figures on happiness are also available on a continuous basis since
1950. They show no change in happiness despite a 6-fold rise in income per head.14
In Europe the series collected by Eurobarometer began in the early 1970s. Again
there has been no increase in happiness. And if we look at individual European
countries separately, there has been no rise in happiness except in Denmark and
Italy.15
These findings are all the more surprising since at any time within any
community there is a clear relation between happiness and income. This is shown for
example in Table 4. In 1975 39% of the rich (in the top quarter) were very happy,
compared with only 19% of the poor (in the bottom quarter). This would lead you to
15
14 Frey and Stutzer (2002), p.9 15 Eurobarometer tapes from Eurostat. See also Inglehart and Klingemann (2000), Figure 7.1.
RL348b 25 February 2003
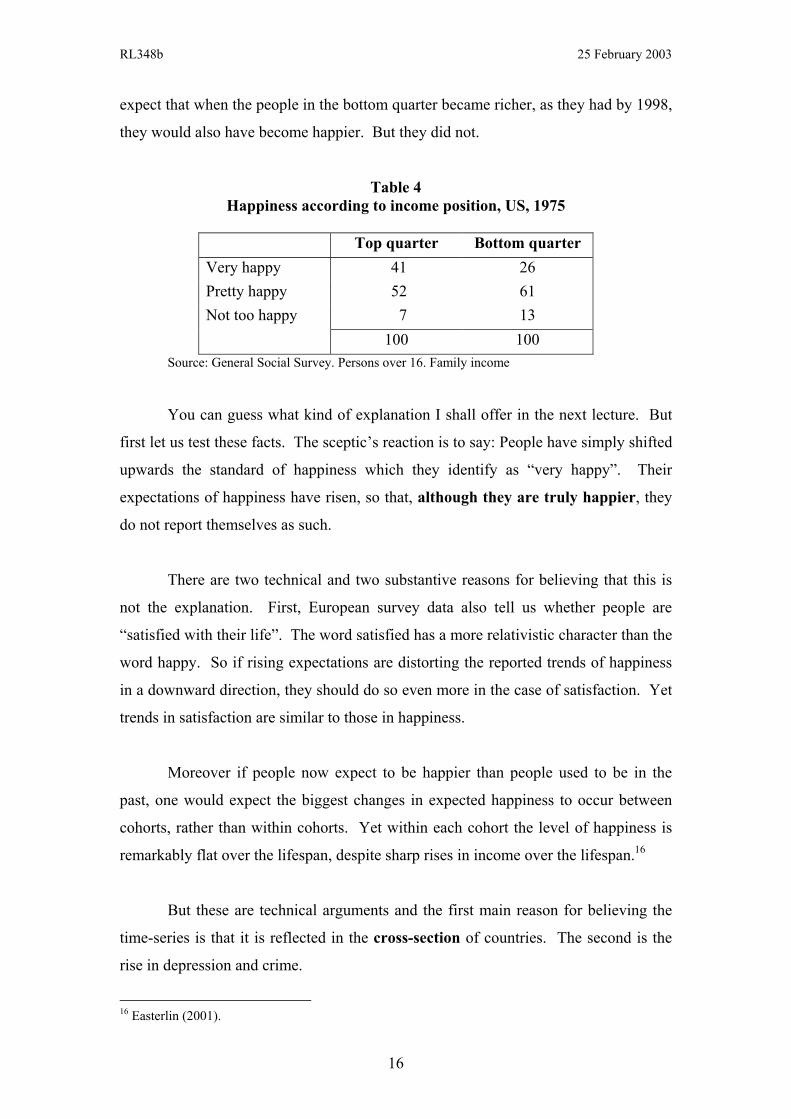
expect that when the people in the bottom quarter became richer, as they had by 1998,
they would also have become happier. But they did not.
Table 4 Happiness according to income position, US, 1975
Top quarter Bottom quarter Very happy 41 26 Pretty happy 52 61 Not too happy 7 13 100 100
Source: General Social Survey. Persons over 16. Family income
You can guess what kind of explanation I shall offer in the next lecture. But
first let us test these facts. The sceptic’s reaction is to say: People have simply shifted
upwards the standard of happiness which they identify as “very happy”. Their
expectations of happiness have risen, so that, although they are truly happier, they
do not report themselves as such.
There are two technical and two substantive reasons for believing that this is
not the explanation. First, European survey data also tell us whether people are
“satisfied with their life”. The word satisfied has a more relativistic character than the
word happy. So if rising expectations are distorting the reported trends of happiness
in a downward direction, they should do so even more in the case of satisfaction. Yet
trends in satisfaction are similar to those in happiness.
Moreover if people now expect to be happier than people used to be in the
past, one would expect the biggest changes in expected happiness to occur between
cohorts, rather than within cohorts. Yet within each cohort the level of happiness is
remarkably flat over the lifespan, despite sharp rises in income over the lifespan.16
But these are technical arguments and the first main reason for believing the
time-series is that it is reflected in the cross-section of countries. The second is the
rise in depression and crime.
16 Easterlin (2001).
16
RL348b 25 February 2003
COMPARING HAPPINESS ACROSS COUNTIRES
Figure 5 shows the cross-section of countries. Income is on the horizontal axis
and on the vertical axis is happiness measured by the average of two numbers: the
percentage happy and the percentage who are satisfied with their life. As it shows,
once a country has over $15,000 per head, its level of happiness appears to be
independent of its income per head. For poorer countries, however, there is a clear
impact of income on happiness, which is also borne out by the time-series in India,
Mexico and the Philippines. When you are near the bread-line, income really does
matter. But, for countries above $15,000 per head, the flat cross-sectional finding in
the graph ought to bother economists just as much as the flat time-series.
If Figure 5 tells us something about economics, it also tells us something about
politics. The most striking finding is the misery of Russia and South Africa, where
oppression as well as poverty has degraded the human condition. At the height of
Communism Russians were among the most miserable people on earth.17 But the
economic chaos which followed the collapse of Communism has made things even
worse, for the time being. In the 1990s all the ex-Communist countries except Poland
were more unhappy than India, and the suffering was greatest in what was once the
Soviet Union.
Of course one could question whether the word ‘happy’ means the same thing in different languages. If it does not, we can learn nothing by comparing different countries. However countries can be rated separately on three different measures: how ‘happy’ they are, how ‘satisfied’ they are, and what score they give to life, using a scale running from ‘worst possible life’ to the ‘best’. The ranking of countries is almost identical on all three measures.18 This suggests that words are not causing a problem.
17 See Inglehart and Klingemann (2000), Fig 7.4. 18 Veenhoven (2000) p.10,
17

RL348b 25 February 2003
Figure 5 Income and happiness
Happiness (index)
Income per head ($)
Source: Inglehart and Klingemann (2000), Figure 7.2 and Table 7.1. Latest year (all in 1990s).
Moreover there is direct evidence, for a number of languages, that the words
do have the same meaning in different languages. For example a group of Chinese students were asked to answer the happiness question, once in Chinese and once in English, with two weeks between the two events. The students reported almost exactly the same average level of happiness in both Chinese and English, and the answers in the different languages were highly correlated across the students.19
Since the English and Chinese languages are very far apart, this finding is
highly reassuring. Similarly we can take the three groups of people in Switzerland – 19 Shao (1993). Indeed the answers in the two languages were as consistent as the answers found in another group of Chinese students who were asked the same questions three weeks apart, using the Chinese language both times.
18
RL348b 25 February 2003
those speaking French, German and Italian. All three groups give similar replies to the question about happiness. And, interestingly, each group of Swiss people is happier than those who speak the same language but live next door in France, Germany or Italy. So the country and its life, rather than language, is the overriding factor which influences how people report their level of happiness.
But, again, might not people in some countries feel more impelled to report high or low levels of happiness, because of local cultural norms? There is no evidence of this – for example no clear tendency for individualistic countries to report high or collectivist cultures to report low.20 And the concept of happiness seems equally familiar in all cultures – getting response rates of around 99% in every country.
So comparing countries confirms what history also shows – that, above
$15,000 per head, higher average income is no guarantee of greater happiness.
TRENDS IN DEPRESSION AND CRIME
In any case we also have other time-series measures of national well-being, at
the lower tail of happiness: we have the evidence of increased depression, alcoholism
and crime.
All the evidence suggests that clinical depression has increased since the
Second World War. 21 By clinical depression I do not mean the spells of misery that
we all experience at some stage. I mean a tightly defined psychiatric condition in
which individuals cannot perform their normal social roles for at least some weeks.
To assess the prevalence of depression we rely on interview surveys where people
report their experiences which are then diagnosed by specialists in the survey
organisation. In the US roughly 14% of people aged 35 have experienced a
depression. Many who have experienced it once have experienced it again, so that at
any one time about 2% of the population are suffering from it.
20 Veenhoven (2000) p.10-11. Note also that happiness levels appear correlated across countries with data on mental stress given in Blanchflower and Oswald (2000a), Table 16. Needs checking. 21 Fombonne (1995).
19
RL348b 25 February 2003
The main evidence of an increase comes from comparing the memories of
people born in different years. If we take Americans who reached 35 in the 1950s,
only 2% had experienced depression by that age. And now it is 14%. What is
striking is that this recorded depression increased mainly in the golden period of
economic growth in the decades after the Second World War. Increases are also
found in most countries where data exist. There is some controversy over the
magnitude of the increase, but no one believes depression has fallen despite the huge
reduction in absolute poverty.
Suicide data provide less relevant evidence since in the typical country only
about 1% of deaths are by suicide. So it is at the very extreme of misery. But suicide
has indeed increased in most advanced countries except the US, Britain, Sweden and
Switzerland, and youth suicide has increased in almost every advanced country.22
I shan’t dwell on the growth of drug abuse, since this is partly propelled by
easier access to the countries which supply drugs. But alcohol addiction is a very
meaningful indicator of unhappiness. The history of alcoholism, is if I may say so,
very sobering. In the first quarter of the twentieth century alcohol consumption fell in
many countries, despite economic growth, and it stayed roughly constant in the
second quarter. Since then it has soared in every country except France, which still
consumes more alcohol than anywhere else. Much of this drinking is unhealthy. In
the US over a quarter of young white men say they have already experienced
problems with alcohol.23 This compares with under 15% of older men (over 65) who
say they have ever experienced such problems. The hardest evidence however is
medical – deaths from cirrhosis of the liver are up since 1950 in every country except
France.
And then there is crime – a similar story. In most advanced countries, crime
fell in the years before the First World War, again despite economic growth. It was
then stable between the Wars and most people thought that, if full-employment could
be achieved, crime would fall still lower. The opposite happened. In most countries
except Japan crime increased by a factor of around five between 1950 and 1980 – a 22 Dickstra et al (1995). 23 Silbereisen et al (1995).
20
RL348b 25 February 2003
truly astonishing increase.24 In Britain a third of all young men have been convicted
of a crime by the time they are 30. If there is this degree of alienation, it is not
surprising that the overall happiness figures have failed to rise.
LOOKING AHEAD
So what is going on? In the next lecture I shall try to provide some answers,
and then discuss what policies might lead us in a better direction. The dominant issue
will be the trade-off between economic growth and the social costs which might result
from policies to maximise growth.
But let me finally look back on what we have done so far.
1. I’ve argued that rational policy-making is possible since happiness is a
real scalar variable and can be compared between people. I’ve given
evidence that both these conditions are satisfied. We’re at the very
beginning of developing this knowledge and these measurements. But
we know enough to see the way ahead.
2. We also know that happiness is basic to human motivation, even though we
often do act in ways that are against our overall interest.
3. We have found that happiness has not increased in the last 50 years. That
should not depress us, because we probably live in the happiest society that
has ever existed. But it would be good if we could do better, especially for the
people who are least happy.
That is what I want to discuss in the next two lectures.
24 Smith (1995). The crime figures are based on police records but since 1980 trends in police records are similar though not identical to those based on victim studies.
21
RL348b 25 February 2003
References
Bargh, J. and Chartrand, T.L. (1999) ‘The unbearable automaticity of being’, American
Psychologist, 54, 462-479. Brown, D.E. (1991) Human Universals, New York: McGraw Hill. Davidson, R.J. (2000) ‘Affective style, psychopathology and resilience: Brain mechanisms
and plasticity’, American Psychologist, 55, 1196-1214. Davidson, R.J., Jackson, D.C. and Kalin, N.H. (2000) ‘Emotion, plasticity, context and
regulation: Perspectives from affective neuroscience’, Psychological Bulletin, 126, 890-906.
Diener, E. and Suh, E.M. (eds) (2000) Culture and Subjective Well-being, Cambridge MA:
MIT Press. Dickstra, R.F.W., Kienhorst, C.W.M. and de Wilde, E.J. (1995) ‘Suicide and suicidal
behaviour among adolescents’, in Rutter and Smith (1995). Easterlin R.A. (2001), ‘Income and happiness: towards a unified theory’, Economic Journal,
111, pp.465-484. Fombonne, E. (1995) ‘Depressive disorders: Time trends and possible explanatory
mechanisms’, in Rutter and Smith (1995). Frey, B.S. and Stutzer, A. (2002) Happiness and Economics: How the Economy and
Institutions Affect Human Well-being, New Jersey: Princeton University Press. Inglehart, R. and Klingemann, H-D. (2000) ‘Genes, culture, democracy and happiness’, in
Diener and Suh (2000). Kahneman, D. (1999) ‘Objective happiness’, in Kahneman et al (1999). Kahneman, D., Diener, E. and Schwarz, N. (eds) (1999) Well-being: The Foundations of
Hedonic Psychology, New York: Russell Sage Foundation. Rutter, M. and Smith, D.J. (eds) (1995) Psychosocial Disorders in Young People. Time
Trends and Their Causes, Chichester: John Wiley & Sons. Shizgal, P. and Conover, K. (1996) ‘On the neural computation of utility’ Current Directions
in Psychological Science, 5 (2): 37-43. Shao, L. (1993) ‘Multilanguage comparability of life satisfaction and happiness measures in
mainland Chinese and American students’, mimeo, University of Illinois. Silbereisen, R.K., Robins, L. and Rutter, M. (1995) ‘Secular trends in substance use:
Concepts and data on the impact of social change on alcohol and drug abuse’, in Rutter and Smith (1995).
Smith, D.J. (1995) ‘Youth crime and conduct disorders: trends, patterns and causal
explanations’, in Rutter and Smith (1995).
22

RL348b 25 February 2003
Veenhoven, R. (2000) ‘Freedom and happiness: A comparative study in 44 nations in the early 1990s’, in Diener and Suh (2000).
23
![Untitled-15 [ftp.columbia.edu]ftp.columbia.edu/itc/barnard/arthist/wolff/pdfs/week6_duncan...John Layard, Stone Men of Malekula, Yao (London, 1942), 652. Layard drew from his own field](https://img.pdfslide.us/doc/110x75/5b1e05907f8b9ab85b8b46c4/untitled-15-ftp-ftp-layard-stone-men-of-malekula-yao-london-1942-652.jpg)