Embed Size (px)
Citation preview

Richard FirmingerGeneral Manager, Europe
February, 2012
Using analytics to take your mobile games to the next level

Flurry Overview
60,000
150,000
App Developers:
Live Applications:
Flurry Analytics Better Apps: iOS, Android, BB, WP, J2ME, HTML5
390MDevices per month:
27BSessions per month:
AppCircle NetworkAcquisition & Monetization: iOS, Android
5,000App Developers:
180MDevices per month:
300BEvents per month:
6MDaily Completed Views

AppCircle: App Traffic Acquisition & Monetization• Data-driven app recommendations across iOS and Android apps• Get your app discovered, drive more daily active users and earn revenue
Analytics: Audience Insight, Engagement and Retention• Free and powerful. Leading app analytics (iOS, Android, WP, BB, J2ME, HTML5)• Understand and segment app audiences to maximize engagement and revenue
AppCircle Clips: Engaging Brand Impressions & CTAs with TV-style video• Distribute and serve highly targeted video across iPhone and iPad apps• Cost-Per-Completed-View Model for best ROI
1
2
3
Flurry Services

Important Industry Trends

2,300 20,000
80,000
200,000
250
350,000
27,500
160,000
250,000
400,000 425,000
500,000 iTUNES APP STOREANDROID MARKET
August 2010 May 2011 July 2011 October 2011December 2009March 2009
Supply: Already Hundreds of Thousands of Available Apps
Sources: Google, Apple, Flurry Estimates; Numbers in thousands
Source: Flurry Analytics
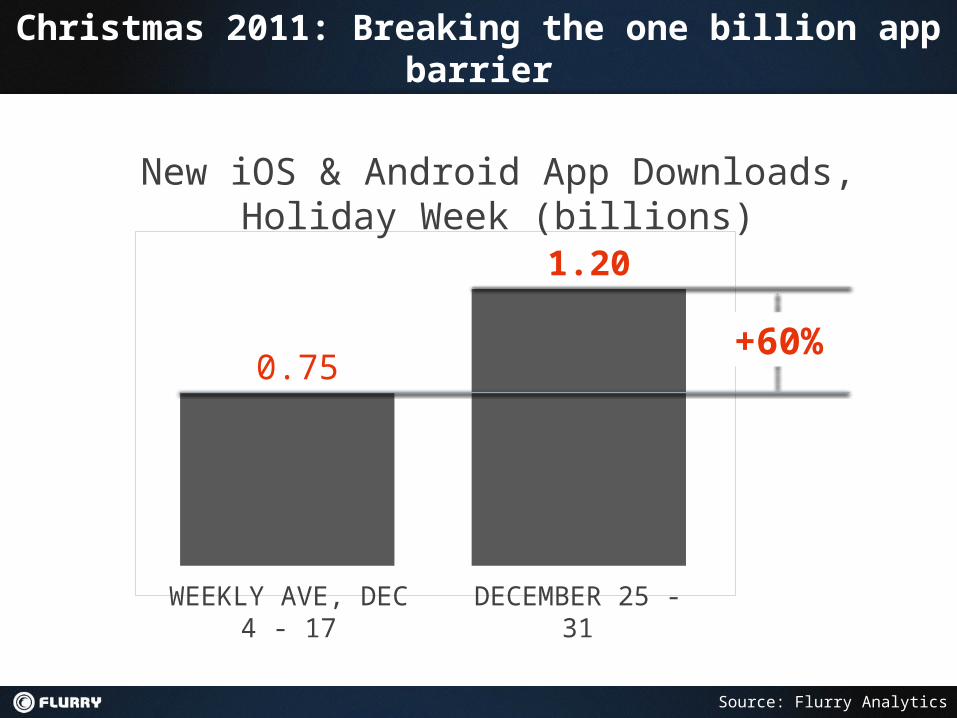
Christmas 2011: Breaking the one billion app barrier
0.75
1.20
New iOS & Android App Downloads, Holiday Week (billions)
+60%
WEEKLY AVE, DEC 4 - 17
DECEMBER 25 - 31

iOS and Android, Addressable MarketU.S.
China
U.K.
So. K
orea
Japan
Fran
ceGer
man
yAustr
alia
Canad
aSp
ain Italy
Holland
Russia
Brazil
Mex
icoIn
diaSw
eden
S. Ara
biaTa
iwan
Hong Kong
109
35
17 1610 10 10 8 8 5 5 4 4 4 4 3 3 3 3 3
Addressable Market: iOS & Android Users Running Apps, Last 30 Days (MM)
Sources: Flurry Analytics, Nov 20 – Dec 20, 2011; CIA World Factbook; IMF; Miller-McCune

iOS and Android, Market Upside
Source: Flurry Analytics & Estimates; CIA, The World Factbook, Adults = 15 – 64 years old

Gam
esEn
terta
inm
ent
Utiliti
es
Socia
l Net
workin
gLif
esty
leM
usic
Gam
es -
Arca
deGa
mes
- Ac
tion
Gam
es -
Boar
dGa
mes
- Pu
zzle
Trav
elPh
otog
raph
yNe
wsPr
oduc
tivity
Refe
renc
eSp
orts
Heal
thca
re &
Fitn
ess
Book
sNa
vigati
onBu
sines
sEd
ucati
onGa
mes
- Sp
orts
Finan
ceGa
mes
- Ki
ds
Gam
es -
Simul
ation
Gam
es -
Card
Gam
es -
Wor
d
Gam
es -
Adve
ntur
e
Gam
es -
Stra
tegy
Wea
ther
Gam
es -
Fam
ilyGa
mes
- Ra
cing
Gam
es -
Role
Pla
ying
Gam
es -
Casin
oGa
mes
- Tr
ivia
Gam
es -
Educ
ation
alGa
mes
- M
usic
Med
ical
0%
2%
4%
6%
8%
10%
12%
Customers Try a Lot of New Content
Sources: Flurry Analytics, New App Downloads Across Categories
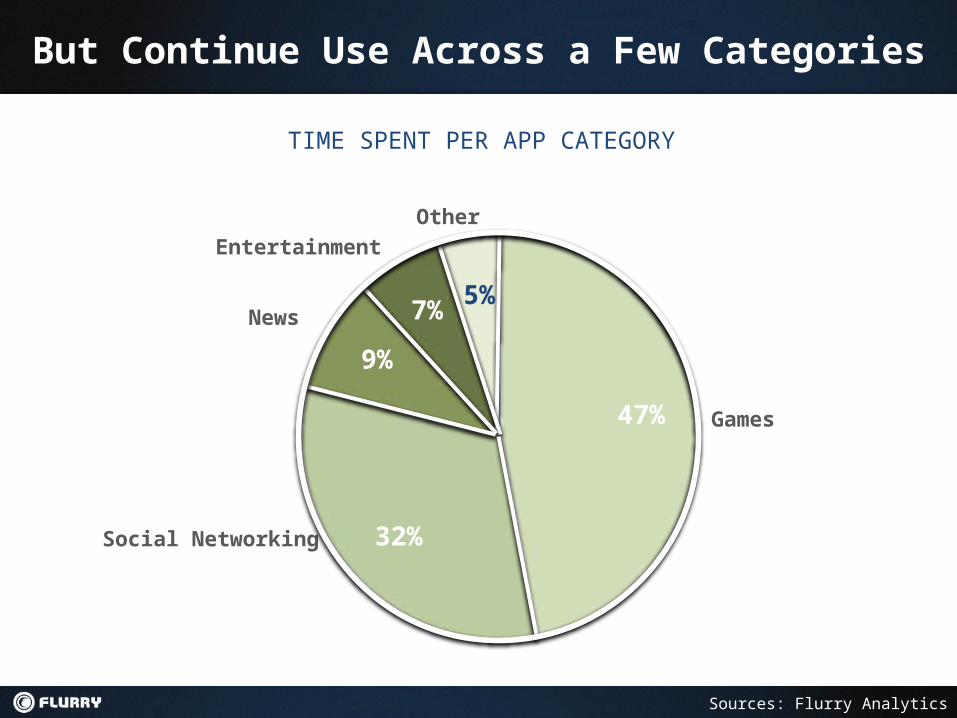
47%
32%
9%
7% 5%
Games
Social Networking
News
EntertainmentOther
TIME SPENT PER APP CATEGORY
Sources: Flurry Analytics
But Continue Use Across a Few Categories

Mobile Freemium Games: Women Thrifty, Men Binge
Source: Flurry Analytics
0%
5%
10%
15%
20%
25%
30%
Mobile Freemium Games: Money Spent by Age and Sex
Males (58%)
Females (42%)
13 – 17 18 – 24 25 – 34 35 – 54 55+
9%
16%
7%
20%
12%
1% 1%3% 2%
29%

Men Spend More per Transaction (31%)
$0
$2
$4
$6
$8
$10
$12
$14
$16
Mobile Freemium Games: Transaction Size by Age and Sex
$15.5 $15.2
$12.0 $12.0 $12.5
$14.8
$10.4$11.8
$8.2
$16.4Males ($15.6)
Females ($11.9)
13 – 17 18 – 24 25 – 34 35 – 54 55+
Source: Flurry Analytics
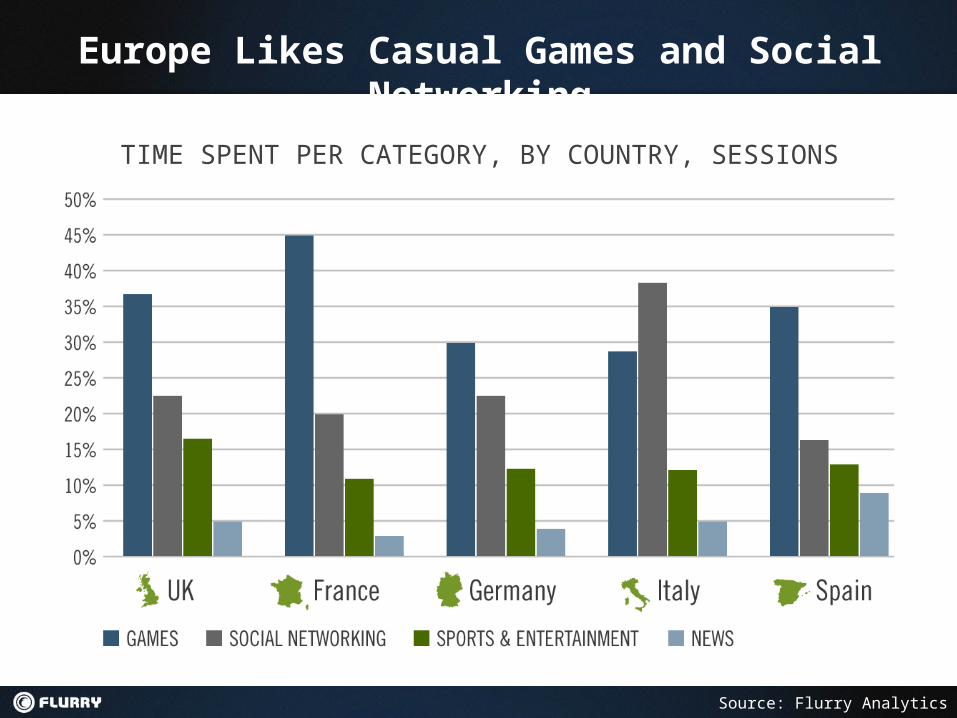
TIME SPENT PER CATEGORY, BY COUNTRY, SESSIONS
Europe Likes Casual Games and Social Networking
Source: Flurry Analytics

Source: Flurry Analytics & Estimates
0 1 2 3 4 5 6 7 8 9 10 11 12
100%
38%29%
24%20% 16% 14% 11% 9% 7% 6% 5% 4%
iOS & ANDROID APP RETENTION, MONTHS SINCE ACQUISITION
App Audience Retention is a Challenge

Understanding your customers
Using analytics to make better games and deepen engagement

Key Insights Delivered by Analytics
Usage Statistics Measure the absolute performance of an app
Usage Benchmarks Measure the relative performance of an app
Audience Analysis Understand the make-up of an app audience
Audience Segmentation Group your audience into meaningful groups based on any metric
Event Tracking Learn what tasks users complete within your app
Portfolio Management Measure overlap in consumer usage across your portfolio
1
2
3
4
5
6

Understand and Improve User Experience

Measure and Segment Audiences

Conduct Market Analysis

Track Sales Conversions

Track Ad Network Performance

Sales of Virtual Goods, Last 30 Days
Track IAP Sales and Customer LTV
Virtual Goods Sales, Last 30 Days
Monetise your customers

Android AppCircle Rewards Greatly Boosts Creative Mobile Revenue
$0.40-$0.45 per install Flexible and fast
Flurry’s better ad targeting drives higher payouts and is simple to integrateUses Flurry AnalyticsTracking 150K+ apps
Pub Payout per Install
Daily Installs
Metric Definition Result
Publisher revenue earned from each AC Rewards install
Publisher Installs generated per day through AC Rewards
$0.45
20,000
We are so pleased with AC Rewards that we are adding it in more & more parts of our game, and our revenue keeps on growing.
-Vladimir Funtikov – MD Creative Mobile
Android Success Story: Drag Racing