Embed Size (px)
Citation preview
fcx.com
Richard C. Adkerson
Vice Chairman of the Board,
President & Chief Executive Officer
Cautionary Statement Regarding Forward-Looking Statements
This presentation contains forward-looking statements in which FCX discusses its potential future performance. Forward-looking statements are all statements other than
statements of historical facts, such as plans, projections or expectations relating to ore grades and milling rates; production and sales volumes; unit net cash costs;
operating cash flows; capital expenditures; FCX’s expectations regarding its share of PT Freeport Indonesia’s (PT-FI) net (loss) income and future cash flows through
2022; PT-FI’s development, financing, construction and completion of a new smelter in Indonesia; FCX’s expectations regarding results associated with productivity and
innovation initiatives; exploration efforts and results; development and production activities, rates and costs; liquidity; tax rates; export quotas and duties; the impact of
copper, gold and molybdenum price changes; the impact of deferred intercompany profits on earnings; reserve estimates; execution of the settlement agreement
associated with the Louisiana coastal erosion cases; and future dividend payments, share purchases and sales. The words “anticipates,” “may,” “can,” “plans,” “believes,”
“estimates,” “expects,” “projects,” "targets," “intends,” “likely,” “will,” “should,” “to be,” ”potential" and any similar expressions are intended to identify those assertions as
forward-looking statements. The declaration of dividends is at the discretion of the Board of Directors (Board) and will depend on FCX’s financial results, cash
requirements, future prospects, and other factors deemed relevant by the Board.
FCX cautions readers that forward-looking statements are not guarantees of future performance and actual results may differ materially from those anticipated, expected,
projected or assumed in the forward-looking statements. Important factors that can cause FCX's actual results to differ materially from those anticipated in the forward-
looking statements include, but are not limited to, supply of and demand for, and prices of, copper, gold and molybdenum; mine sequencing; changes in mine plans;
production rates; timing of shipments; results of feasibility studies; potential inventory adjustments; potential impairment of long-lived mining assets; the potential effects of
violence in Indonesia generally and in the province of Papua; the Indonesian government’s extension of PT-FI’s export license after March 8, 2020; risks associated with
underground mining; satisfaction of requirements in accordance with PT-FI’s special mining license (IUPK) to extend mining rights from 2031 through 2041; FCX’s ability to
achieve the expected results of its productivity and innovation initiatives; industry risks; regulatory changes; political and social risks; labor relations; weather- and climate-
related risks; environmental risks; litigation results; cybersecurity incidents; and other factors described in more detail under the heading “Risk Factors” in FCX's Annual
Report on Form 10-K for the year ended December 31, 2019, filed with the U.S. Securities and Exchange Commission (SEC).
Investors are cautioned that many of the assumptions upon which FCX's forward-looking statements are based are likely to change after the forward-looking statements
are made, including for example commodity prices, which FCX cannot control, and production volumes and costs, some aspects of which FCX may not be able to control.
Further, FCX may make changes to its business plans that could affect its results. FCX cautions investors that it does not intend to update forward-looking statements
more frequently than quarterly notwithstanding any changes in its assumptions, changes in business plans, actual experience or other changes, and FCX undertakes no
obligation to update any forward-looking statements.
This presentation also includes forward-looking statements regarding mineralized material and potential resources not included in proven and probable mineral reserves.
Mineralized material is a mineralized body that has been delineated by appropriately spaced drilling and/or underground sampling to support the estimated tonnage and
average metal grades. Such a deposit cannot qualify as recoverable proven and probable reserves until legal and economic feasibility are confirmed based upon a
comprehensive evaluation of development costs, unit costs, grades, recoveries and other material factors. Our estimates of potential resources are based on geologically
reasonable interpolation and extrapolation of more limited information than is used for mineralized material (measured and indicated) and requires higher copper prices.
Significant additional drilling is required and no assurance can be given that the potential quantities of metal will be produced. Accordingly, no assurances can be given
that estimated mineralized material and potential resources not included in reserves will become proven and probable reserves.
This presentation also contains certain financial measures such as unit net cash costs per pound of copper and molybdenum, net debt and adjusted EBITDA (earnings
before interest, taxes, depreciation and amortization) that are not recognized under U.S. generally accepted accounting principles. As required by SEC Regulation G,
reconciliations of unit net cash costs per pound of copper and molybdenum to amounts reported in FCX's consolidated financial statements are in the supplemental
schedules of FCX’s 4Q19 press release, which are also available on FCX's website, "fcx.com.” Net debt equals consolidated deb t less consolidated cash. A reconciliation
of adjusted EBITDA to amounts reported in FCX’s consolidated financial statements is included on slide 10 of this presentation.
2
3
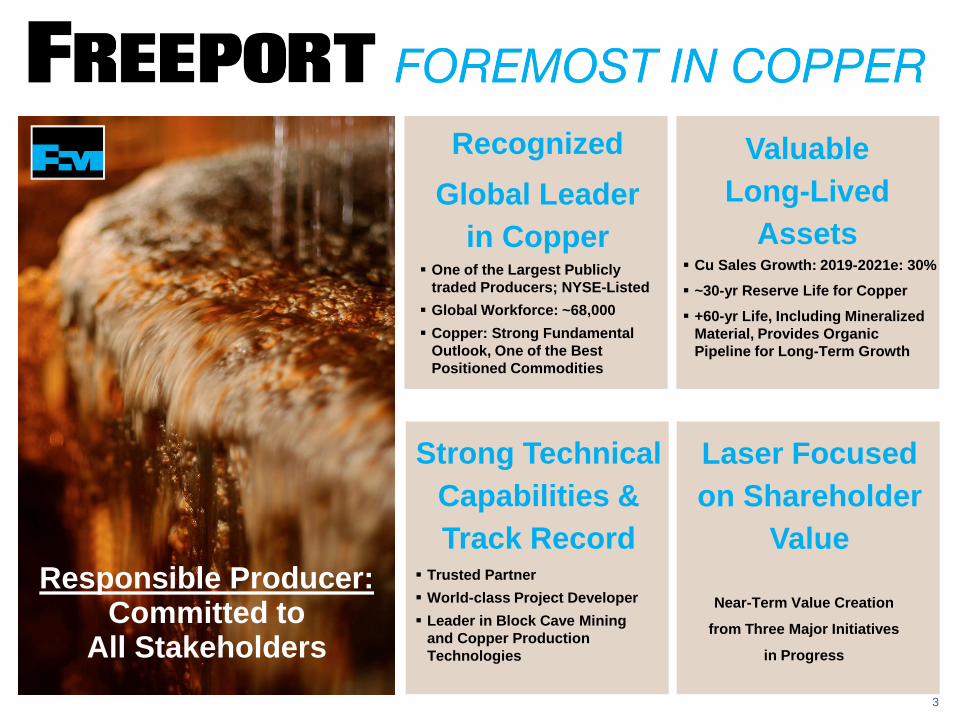
Recognized
Global Leader
in Copper One of the Largest Publicly
traded Producers; NYSE-Listed
Global Workforce: ~68,000
Copper: Strong Fundamental
Outlook, One of the Best
Positioned Commodities
Strong Technical
Capabilities &
Track Record Trusted Partner
World-class Project Developer
Leader in Block Cave Mining
and Copper Production
Technologies
Valuable
Long-Lived
Assets Cu Sales Growth: 2019-2021e: 30%
~30-yr Reserve Life for Copper
+60-yr Life, Including Mineralized
Material, Provides Organic
Pipeline for Long-Term Growth
Laser Focused
on Shareholder
Value
Near-Term Value Creation
from Three Major Initiatives
in Progress
Responsible Producer:Committed to
All Stakeholders
4
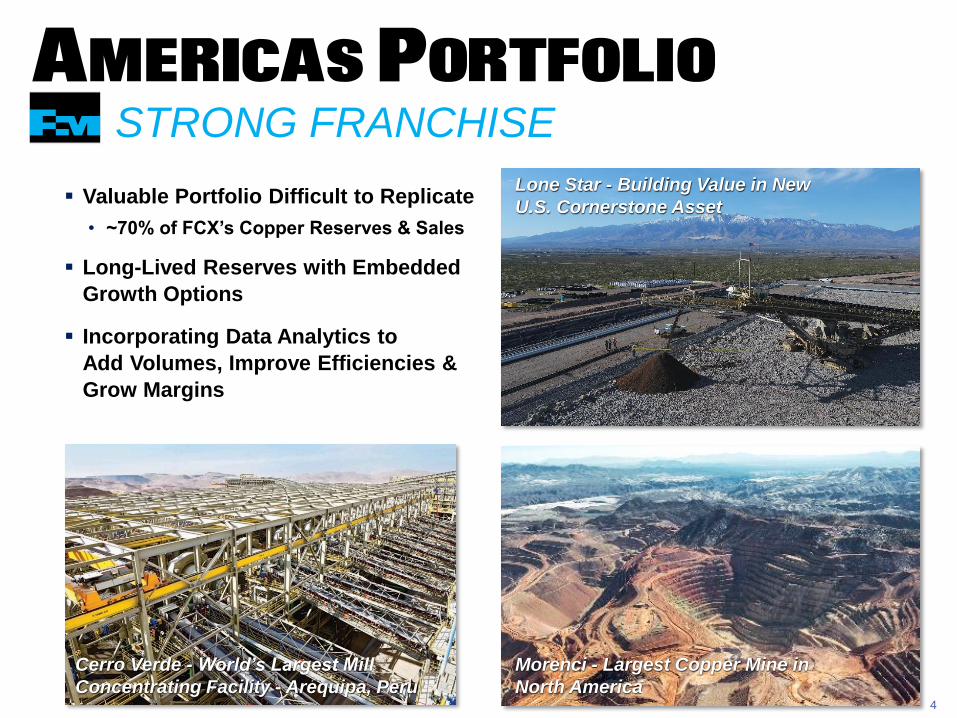
STRONG FRANCHISE
Valuable Portfolio Difficult to Replicate
• ~70% of FCX’s Copper Reserves & Sales
Long-Lived Reserves with Embedded
Growth Options
Incorporating Data Analytics to
Add Volumes, Improve Efficiencies &
Grow Margins
Morenci - Largest Copper Mine in
North America
Lone Star - Building Value in New
U.S. Cornerstone Asset
Cerro Verde - World’s Largest Mill
Concentrating Facility - Arequipa, Peru
Americas Portfolio
5
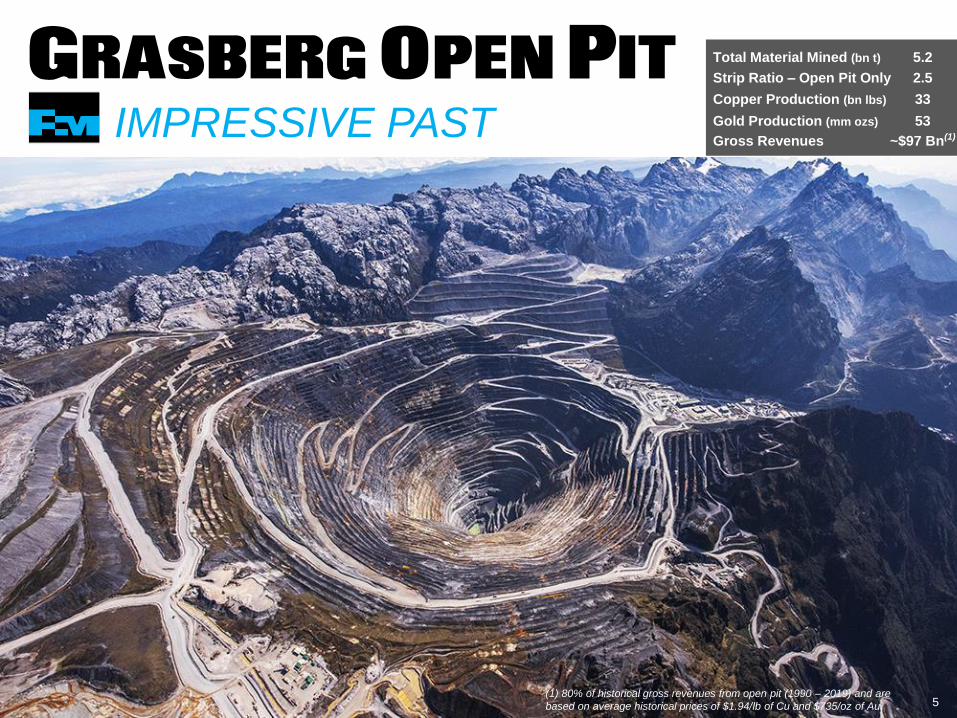
IMPRESSIVE PAST
Total Material Mined (bn t) 5.2
Strip Ratio – Open Pit Only 2.5
Copper Production (bn lbs) 33
Gold Production (mm ozs) 53
Gross Revenues ~$97 Bn(1)
(1) 80% of historical gross revenues from open pit (1990 – 2019) and are
based on average historical prices of $1.94/lb of Cu and $735/oz of Au.
Grasberg Open Pit
6
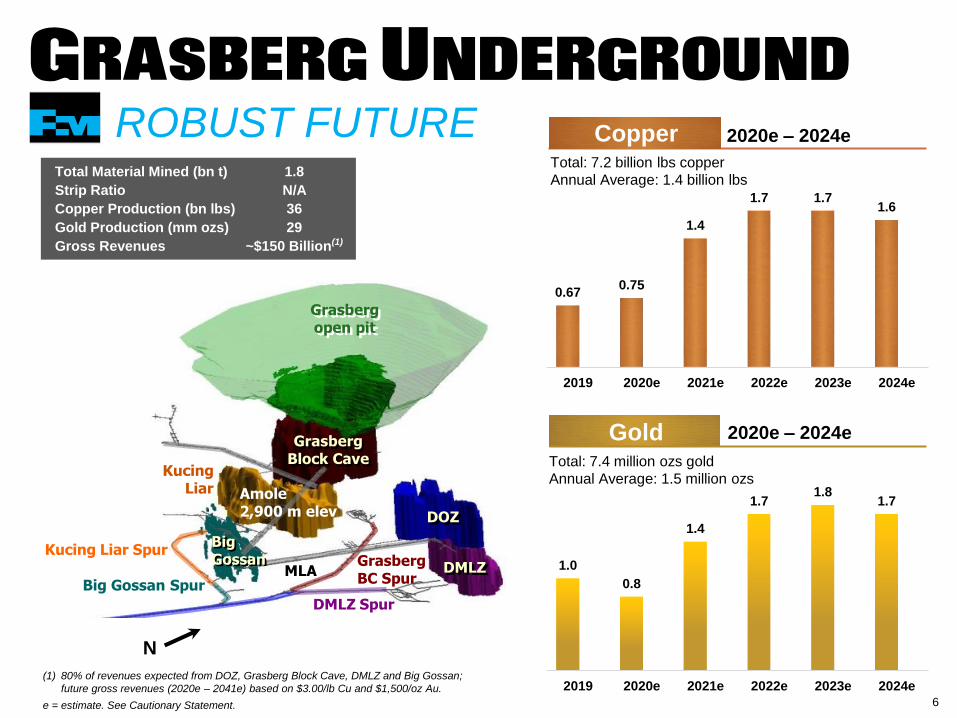
ROBUST FUTURE
Plan View
DOZ
DMLZ
Grasberg &Kucing Liar
BigGossan
N
N
DOZ
DMLZ
GrasbergBlock Cave
KucingLiar
Grasbergopen pit
MLA
Common Infrastructure2,500 m elev
GrasbergBC Spur
Kucing Liar Spur
Big Gossan Spur
DMLZ Spur
Portals(at Ridge Camp)
BigGossan
Amole2,900 m elev
N
Total: 7.2 billion lbs copper
Annual Average: 1.4 billion lbs
0.670.75
1.4
1.7 1.71.6
2019 2020e 2021e 2022e 2023e 2024e
2020e – 2024e Copper
1.0
0.8
1.4
1.71.8
1.7
2019 2020e 2021e 2022e 2023e 2024e
2020e – 2024e GoldTotal: 7.4 million ozs gold
Annual Average: 1.5 million ozs
Total Material Mined (bn t) 1.8
Strip Ratio N/A
Copper Production (bn lbs) 36
Gold Production (mm ozs) 29
Gross Revenues ~$150 Billion(1)
(1) 80% of revenues expected from DOZ, Grasberg Block Cave, DMLZ and Big Gossan;
future gross revenues (2020e – 2041e) based on $3.00/lb Cu and $1,500/oz Au.
e = estimate. See Cautionary Statement.
Grasberg Underground
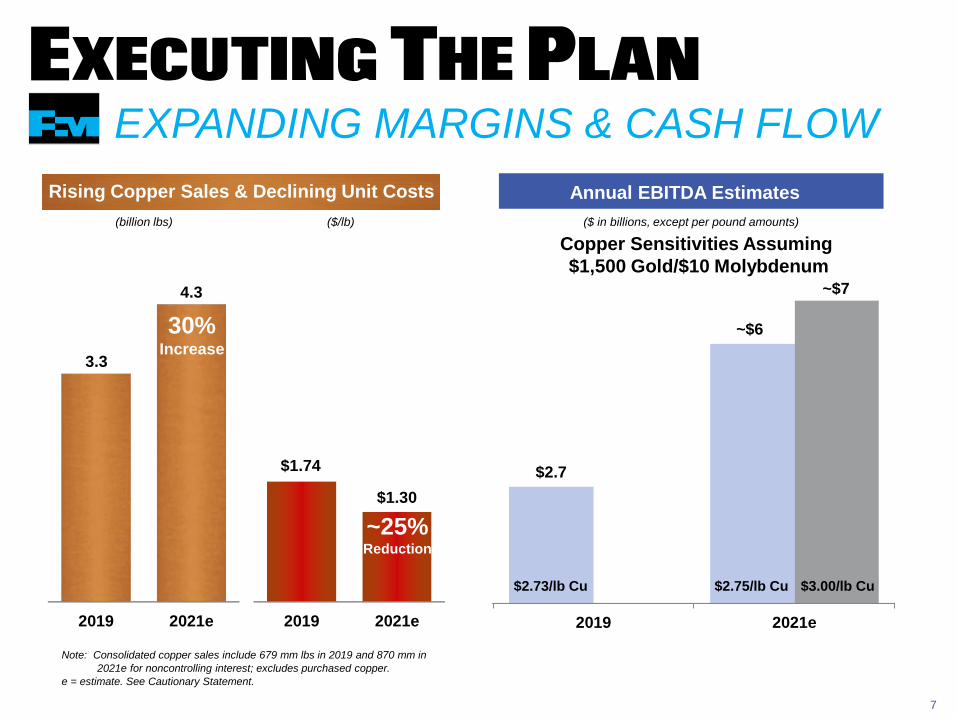
2019 2021e
3.3
4.3
7
2019 2021e
$2.7
($ in billions, except per pound amounts)
Annual EBITDA Estimates
$2.73/lb Cu $2.75/lb Cu
EXPANDING MARGINS & CASH FLOW
Note: Consolidated copper sales include 679 mm lbs in 2019 and 870 mm in
2021e for noncontrolling interest; excludes purchased copper.
e = estimate. See Cautionary Statement.
Rising Copper Sales & Declining Unit Costs
(billion lbs)
$3.00/lb Cu
Copper Sensitivities Assuming
$1,500 Gold/$10 Molybdenum
2019 2021e
$1.74
$1.30
($/lb)
30%Increase
~25%Reduction
Executing The Plan
~$6
~$7

Reference Slide
9
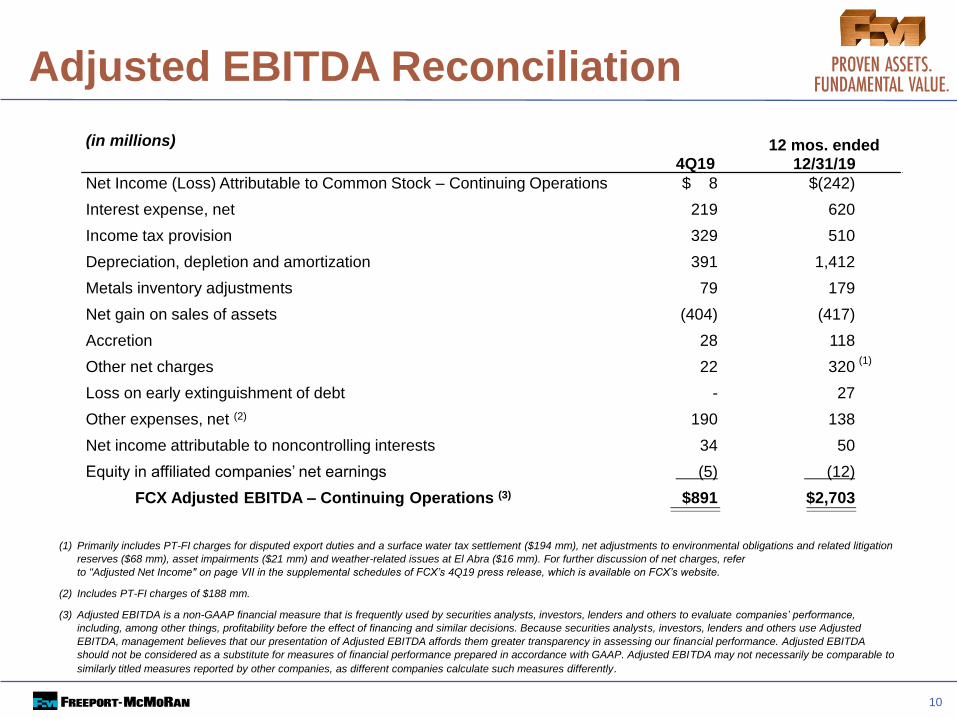
Adjusted EBITDA Reconciliation
10
(in millions)
4Q1912 mos. ended
12/31/19
Net Income (Loss) Attributable to Common Stock – Continuing Operations $ 8 $(242)
Interest expense, net 219 620
Income tax provision 329 510
Depreciation, depletion and amortization 391 1,412
Metals inventory adjustments 79 179
Net gain on sales of assets (404) (417)
Accretion 28 118
Other net charges 22 320
Loss on early extinguishment of debt - 27
Other expenses, net (2) 190 138
Net income attributable to noncontrolling interests 34 50
Equity in affiliated companies’ net earnings (5) (12)
FCX Adjusted EBITDA – Continuing Operations (3) $891 $2,703
(1) Primarily includes PT-FI charges for disputed export duties and a surface water tax settlement ($194 mm), net adjustments to environmental obligations and related litigation
reserves ($68 mm), asset impairments ($21 mm) and weather-related issues at El Abra ($16 mm). For further discussion of net charges, refer
to "Adjusted Net Income" on page VII in the supplemental schedules of FCX’s 4Q19 press release, which is available on FCX’s website.
(2) Includes PT-FI charges of $188 mm.
(3) Adjusted EBITDA is a non-GAAP financial measure that is frequently used by securities analysts, investors, lenders and others to evaluate companies’ performance,
including, among other things, profitability before the effect of financing and similar decisions. Because securities analysts, investors, lenders and others use Adjusted
EBITDA, management believes that our presentation of Adjusted EBITDA affords them greater transparency in assessing our financial performance. Adjusted EBITDA
should not be considered as a substitute for measures of financial performance prepared in accordance with GAAP. Adjusted EBITDA may not necessarily be comparable to
similarly titled measures reported by other companies, as different companies calculate such measures differently.
(1)