Embed Size (px)
Citation preview
Richard Barnes, Dora Morillo, Annie Sun, Rochelle Sinclair, Luis Solis
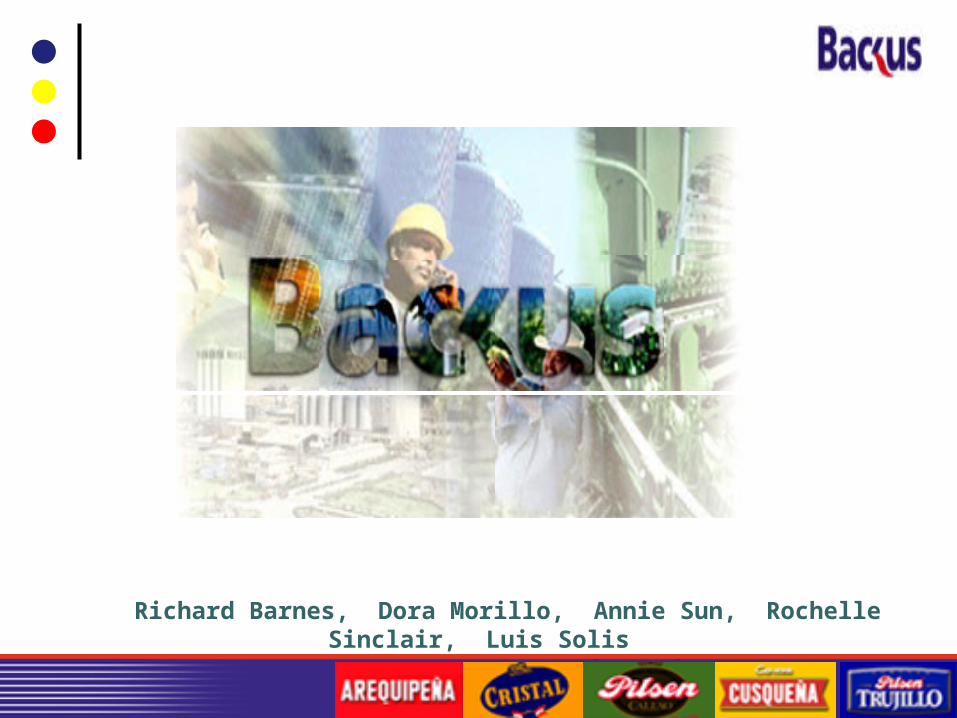
Agenda
Introduction
Case Value to Students
Peruvian Political History
Social Conditions
Economic Conditions
Peruvian Brewery Industry
Backus Company History
Backus SWOT Analysis
Backus Financial Performance
Backus Relative Valuation
Backus DCF Analysis
Q&A
Introduction
The purpose of this case is to examine the future performance of Union De Cervecerias
Peruanas Backus y Johnston (UCP Backus), the largest beer supplier in Peru, given the potential entry of competitors, specifically
Companhia de Bebidas America (AmBev), the fifth largest brewer in the world; and the
political and economic atmosphere that highly affects the organization’s competitive response.
Case Value to Students
Reinforcing our knowledge of key financial measures and valuation toolsLearning to measure the distinct risks of investing in companies from developing countries Identifying certain financial dynamics that will be essential in our career developmentAppreciating cultural, political and socioeconomic factors that cause an impact in making business in companies in developing nationsGaining added confidence in companies managed by nationals in developing countries
Peruvian Political History (1992-2002)
1992Sendero Luminoso’s leader, Abimeal Guzmán, had been captured after threatening the Peruvian People with guerilla warfare since 1980.New Constitution was written and instilled, dissolving both the legislative and judicial branches and allowing presidents to hold consecutive terms
1998Peru signed a treaty with Ecuador resolving a contentious 57-yr old border dispute
Peruvian Political History (1992-2002)
2000Top security advisor, Vladimiro Montesinos, was videotaped bribing opposing Congressmen to switch political sides Fujimori renounced his presidency and fled to Japan for self-exile, was declared “morally unfit” to govern, and the Supreme Court issued an international arrest warrant
2001Peru held a new presidential election and named Alejandro Toledo the new president of Peru Peru received President Bush’s backing to visit to the country and US Congress approval of ATP (Andean Trade Program) which allows almost 600 Peruvian products to enter US without paying tariffs
Peruvian Political History (1992-2002)
2002-3Establishment through free elections of autonomous regional governments, which resembles US states. Thus converting the centralized government into a government of transition
Social Conditions
Backus’ performance within the past decades has also been affected by the Peruvian economic and social conditions. High levels of unemployment led to civil unrest In the 1990s, Peru was one of the politically riskiest countries in Latin America From increasing levels of poverty, poverty rates increased from 1998-2000, especially in urban areas which led to high crime rates that took a toll on Peru’s economy
Security Risk
Many industries declinedIn 2000, President Fujimori and the Peruvian government actively decreased rebel violence and political dissent by arresting political rebelsPoor social conditions led to poor economic conditions that took a toll on Backus giving them negative or slow growth rates during the past two decades
Security Risk Decreases
Peru’s security problems has seen dramatic improvement Peru is considered one of the safest countries in Latin America More capital investments poured into the country due to the decrease in political risk
Social Conditions
Steady population growth from 1997-2002 reached an average of 1.7% a yearThis population rate is projected to remain steady for the next few yearsIn 2001, President Toledo increased the education budget by 139%
Educational systems are still inadequate Leads to lack of good human resources
Economic Conditions in 1980s
During the 1980s Debt Crisis GDP fell
Inflation accelerated to 7,500% El Nino ruined the fishing industry Currency devalued
Economic Growth (1990s-2003)
In 1990s, Peru underwent economic recovery Huge increases in capital inflows from investments both private and publicConsumer confidence grew along with a strong currency Interest rates fell that spurred credit demandFrom 2000-2001, the Peruvian government brought the fiscal deficit down to just 0.9% of GDP During 2001-2002, inflation rate was at its lowest in 40 years
Economic Growth (1990s-2003)
However, at the end of 2001, the deficit widened to 2.5% of the GDP due failure of keeping expenditures down and revenues declining
In 2002, Peru experienced one of the highest GDP growth in Latin America and grew by 4.2%
All industries were showing signs of growth
The country is expected to privatize many public institutions.
Currently, Peru is showing signs of stability, global bonds are issued at 512 basis points away from the US treasury bonds: giving the country a risk rate of BB/BBB
Peruvian Brewery Industry
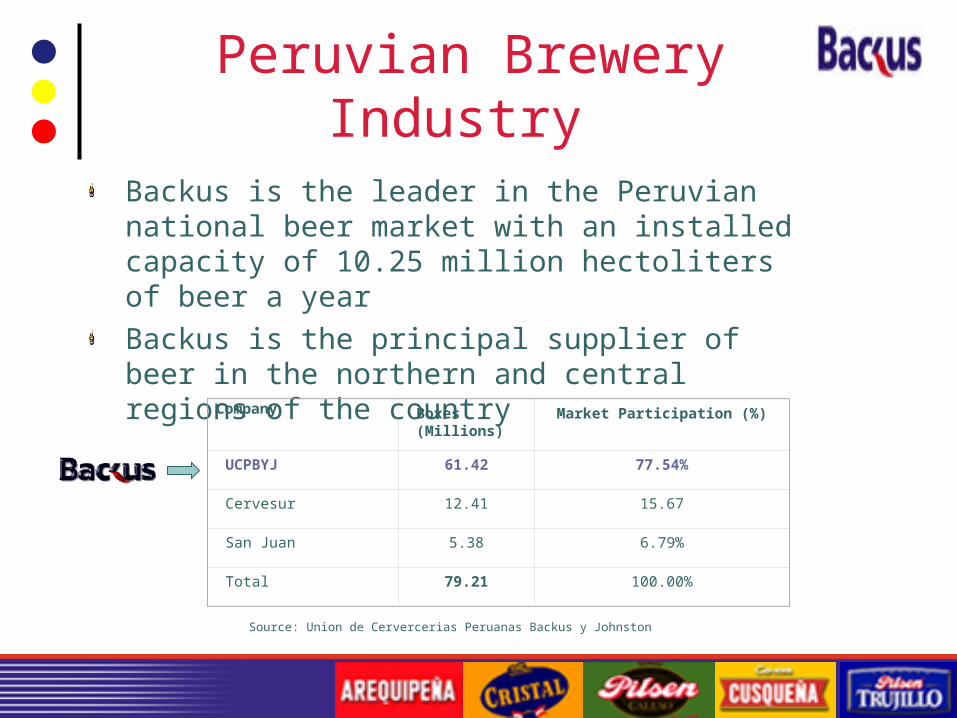
Backus is the leader in the Peruvian national beer market with an installed capacity of 10.25 million hectoliters of beer a year Backus is the principal supplier of beer in the northern and central regions of the country
Company Boxes (Millions)
Market Participation (%)
UCPBYJ 61.42 77.54%
Cervesur 12.41 15.67
San Juan 5.38 6.79%
Total 79.21 100.00%
Source: Union de Cervercerias Peruanas Backus y Johnston
Peruvian Brewery Industry
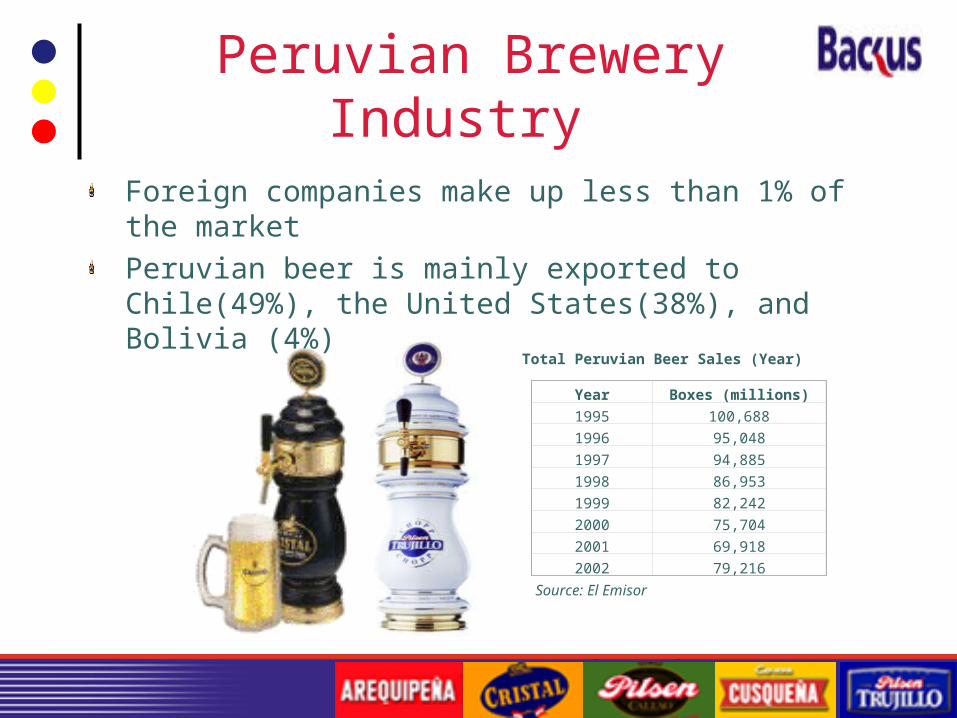
Foreign companies make up less than 1% of the market Peruvian beer is mainly exported to Chile(49%), the United States(38%), and Bolivia (4%)
Total Peruvian Beer Sales (Year)
Year Boxes (millions)
1995 100,688
1996 95,048
1997 94,885
1998 86,953
1999 82,242
2000 75,704
2001 69,918
2002 79,216
Source: El Emisor
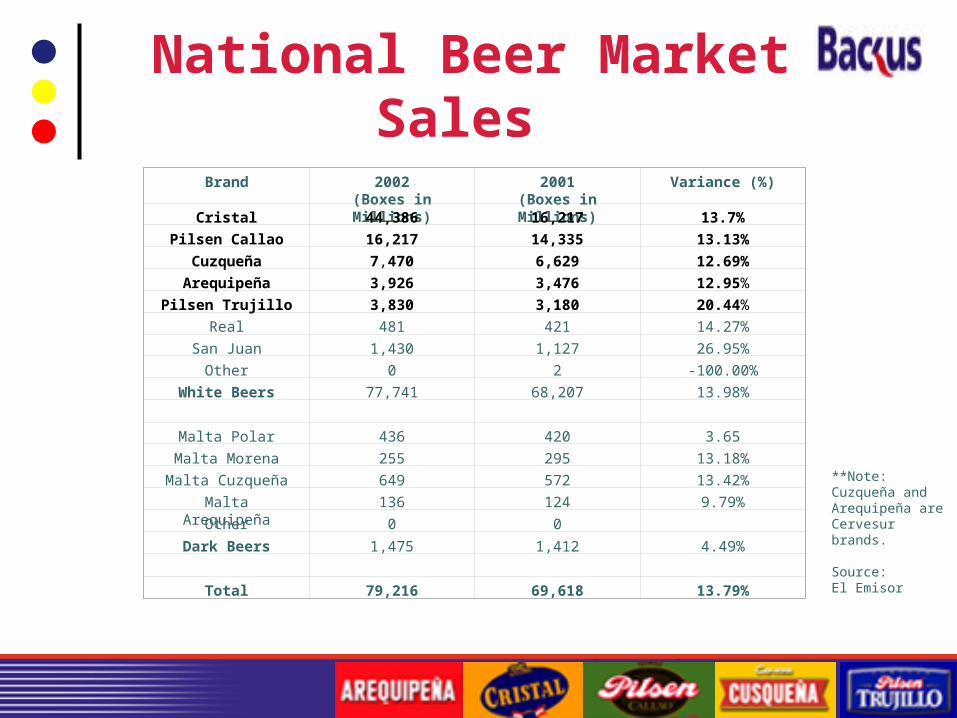
National Beer Market Sales
Brand 2002(Boxes in Millions)
2001(Boxes in Millions)
Variance (%)
Cristal 44,386 16,217 13.7%
Pilsen Callao 16,217 14,335 13.13%
Cuzqueña 7,470 6,629 12.69%
Arequipeña 3,926 3,476 12.95%
Pilsen Trujillo 3,830 3,180 20.44%
Real 481 421 14.27%
San Juan 1,430 1,127 26.95%
Other 0 2 -100.00%
White Beers 77,741 68,207 13.98%
Malta Polar 436 420 3.65
Malta Morena 255 295 13.18%
Malta Cuzqueña 649 572 13.42%
Malta Arequipeña 136 124 9.79%
Other 0 0 Dark Beers 1,475 1,412 4.49%
Total 79,216 69,618 13.79%
**Note: Cuzqueña and Arequipeña are Cervesur brands.
Source: El Emisor
History of Backus
Created in 1876 as an ice factory, and currently an alliance of 20 diversified companies
Throughout its history, Backus merged with various companies to create operative and financial synergies.
In March 2000, Backus acquired competitor, Cervesur
History of Backus
Engages in the preparation, manufacturing, sale, and distribution of beers, malts, non-alcoholic drinks, and soft drinksAdditionally involved in agribusiness and foods, transport services, bottling and packaging, and Peruvian and foreign securities investmentBeers and carbonated drinks account for most of company’s revenues
Peruvian Beer Markets
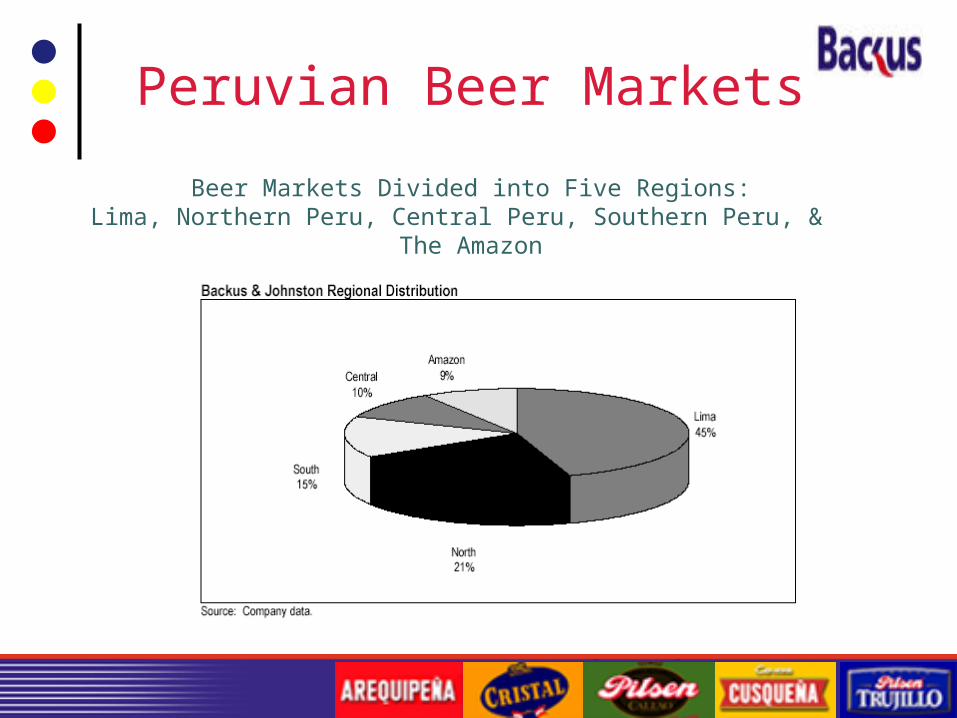
Beer Markets Divided into Five Regions:Lima, Northern Peru, Central Peru, Southern Peru, & The
Amazon
SWOT Analysis
Strengths:High preference and brand loyalty for beerAfter acquisition of Cervesur, Backus has become sole producer of beer in PeruSophisticated and ample channels of distribution
Weaknesses:Common Share price looks overpriced when compared to sector
SWOT Analysis
Opportunities:Potential growth in Peruvian beer marketRecovery of consumer purchasing power
Threats:Potential competition (AmBev)Beer taxes (currently 67%)
Financial Performance
Growth During 2002, revenues grew by 18.3% and net sales by 13.4% Improvements of gross margin (65.0%), operating margin (32.4%) and EBITDA (30.8%) Analysts remain optimistic of the growth potential of the firm in light of AmBev’s entry
Financial Performance
Asset Utilization During 2002, Backus increased production capacity by buying new equipment, bolstered its distribution channels and broaden its storage capacity in certain plants by almost 80%. Analysts forecasted a slight increase in sales for 2003.
LeverageFrom 1997-2001 leverage has more than doubled In 2002, Backus’ debt load was reduced by 35.2 million sols
Financial Performance
LiquidityDuring 2002, the debt restructuring of nearly 35 million significantly decrease interest payments.
Financial expenses dropped by an impressive 51% due to improved efficiencies; leading to relatively larger cash flows for 2003.
The Competitor- AmBev
Fifth largest worldwide producer, distributor and seller of beers and soft drinks. Primarily located in Brazil. AmBev has its brands located all over Latin America, including Argentina, Uruguay, Chile and Venezuela Beta is 1.44, 5 year sales growth rate of 19.66%, and an earnings per share growth rate of 17%. Five-year profit margins of 43.89% (gross); 32.80% (EBITDA) and an effective tax rate of 8.34 Average return on assets is 11.53% and average return on equity 27.69%
The Future
AmBev aims to be the most profitable company in the industry in terms of EBITDA margin and its targets it distribution channels and leading brands in order to achieve this goal
AmBev has now set their eyes on Peru
How will Backus compete against a foreign firm who has a wealth of experience in capturing new markets?
Equity Valuation
Relative and Discounted Cash Flows Models used to price an ‘Investment’ share issued by Backus, currently trading at $0.42 a share per ADR (as of 4/4/03). The ADR reflects a more accurate value of Backus’ equity.
Two Scenarios:I. Current Valuation – Under or Overvalued?II. AmBev vs. Backus – Sales Erosion
Relative Valuation
Dominant Latin American Breweries:AmBev, Brahma (Brazil), Femsa (Brazil) and Grupo Modelo S.A (Mexico). Competitors have strong presence throughout Latin America vs. Backus’ sole market in Peru
Earnings Per Share & Book Value per Share- adjust for relative dominance in markets
Relative Valuation: Grupo Modelo
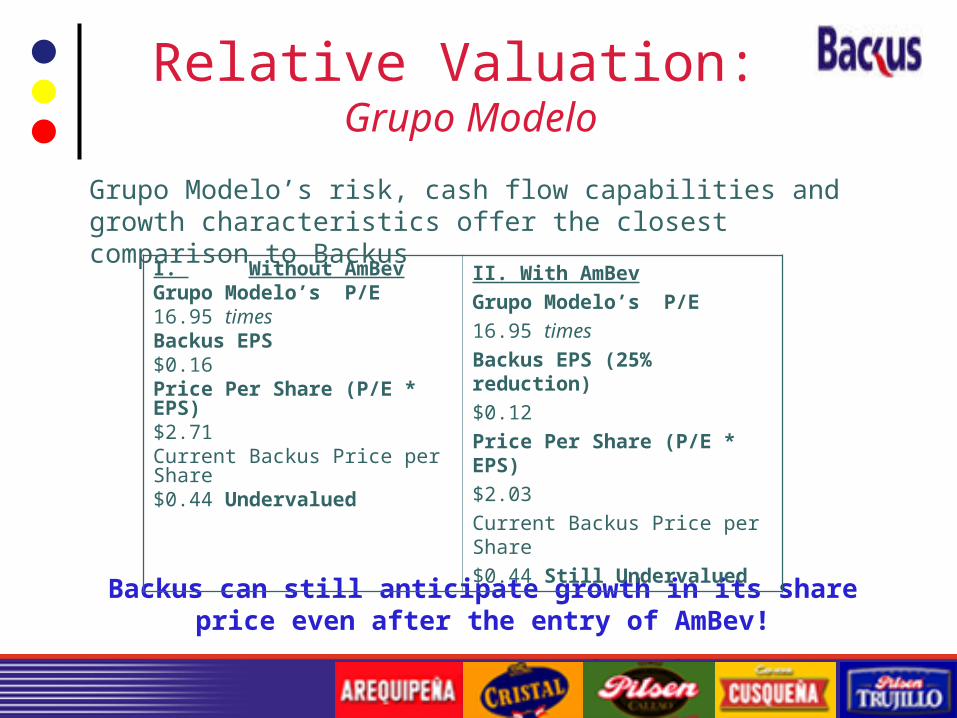
Grupo Modelo’s risk, cash flow capabilities and growth characteristics offer the closest comparison to Backus
Backus can still anticipate growth in its share price even after the entry of AmBev!
I. Without AmBevGrupo Modelo’s P/E16.95 timesBackus EPS$0.16Price Per Share (P/E * EPS)$2.71Current Backus Price per Share$0.44 Undervalued
II. With AmBev Grupo Modelo’s P/E16.95 timesBackus EPS (25% reduction)$0.12Price Per Share (P/E * EPS)$2.03Current Backus Price per Share$0.44 Still Undervalued
DCF Valuation
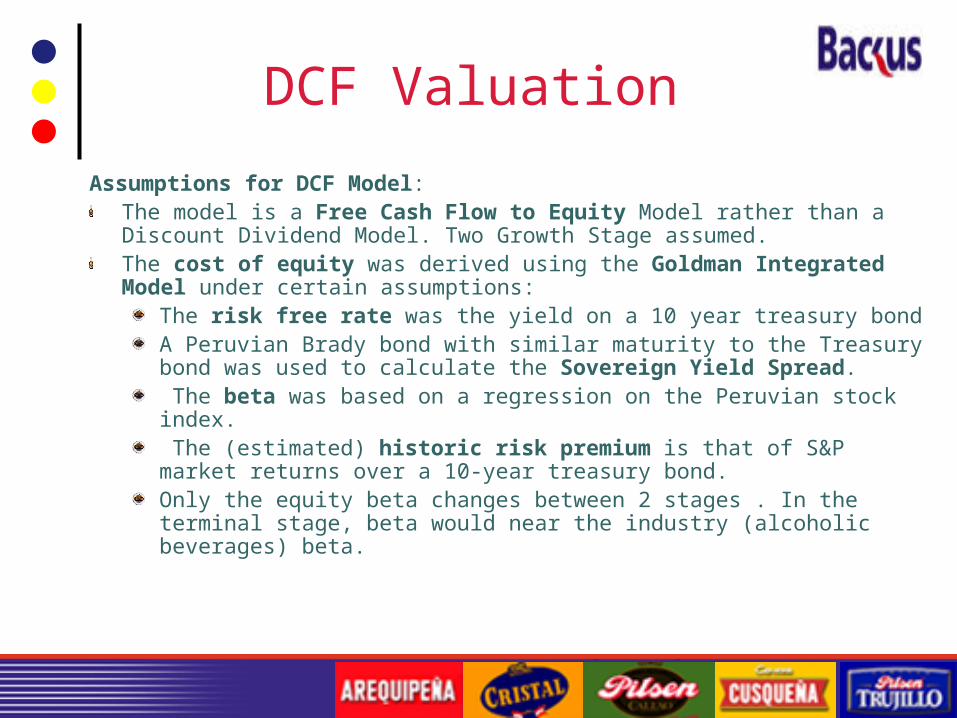
Assumptions for DCF Model:The model is a Free Cash Flow to Equity Model rather than a Discount Dividend Model. Two Growth Stage assumed.The cost of equity was derived using the Goldman Integrated Model under certain assumptions:
The risk free rate was the yield on a 10 year treasury bondA Peruvian Brady bond with similar maturity to the Treasury bond was used to calculate the Sovereign Yield Spread. The beta was based on a regression on the Peruvian stock index. The (estimated) historic risk premium is that of S&P market returns over a 10-year treasury bond. Only the equity beta changes between 2 stages . In the terminal stage, beta would near the industry (alcoholic beverages) beta.
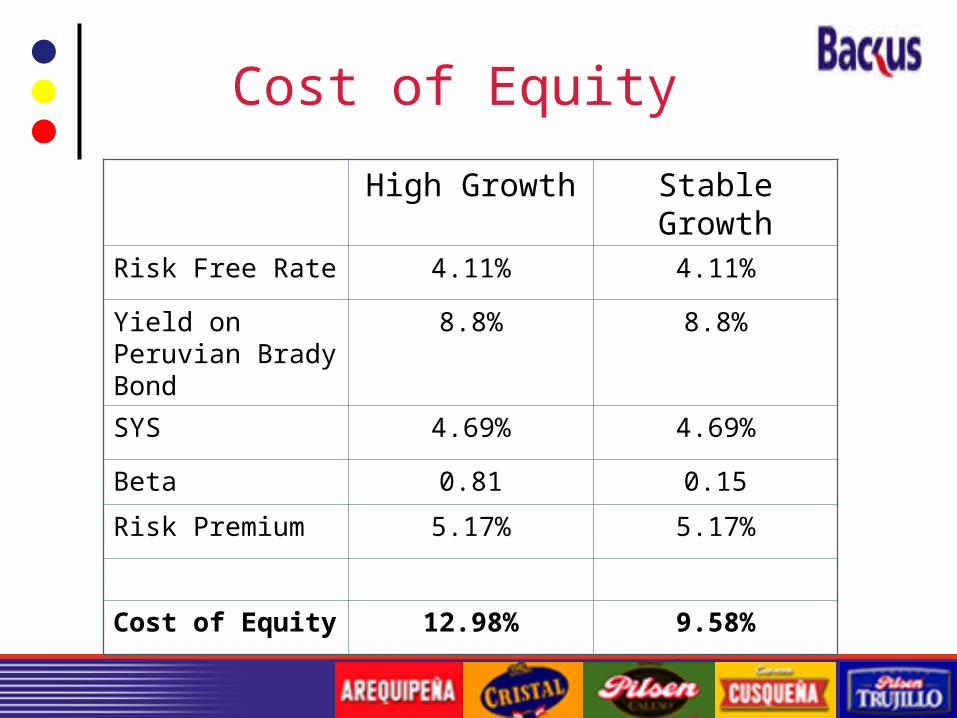
Cost of Equity
High Growth Stable Growth
Risk Free Rate 4.11% 4.11%
Yield on Peruvian Brady Bond
8.8% 8.8%
SYS 4.69% 4.69%
Beta 0.81 0.15
Risk Premium 5.17% 5.17%
Cost of Equity 12.98% 9.58%
DCF Assumptions
Growth we expect a constant growth of 6% for the next five years and a stable growth rate of 4% for terminal.Net Income: Conservative position - Average of last two years. Cap Ex: Will increase.∆ Working Capital and Debt Ratio: New capital structure.
Macro-economic Assumptions
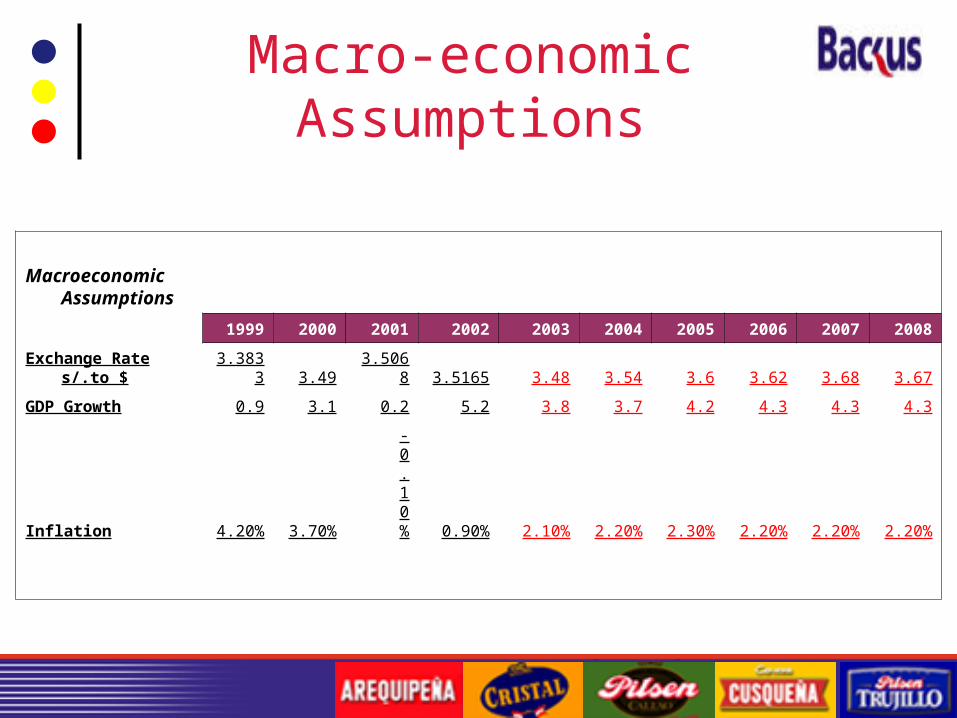
Macroeconomic Assumptions
1999 2000 2001 2002 2003 2004 2005 2006 2007 2008
Exchange Rate s/.to $ 3.3833 3.49 3.5068 3.5165 3.48 3.54 3.6 3.62 3.68 3.67
GDP Growth 0.9 3.1 0.2 5.2 3.8 3.7 4.2 4.3 4.3 4.3
Inflation 4.20% 3.70% -0.10% 0.90% 2.10% 2.20% 2.30% 2.20% 2.20% 2.20%
Macro-Economic Assumptions (currency exchange)
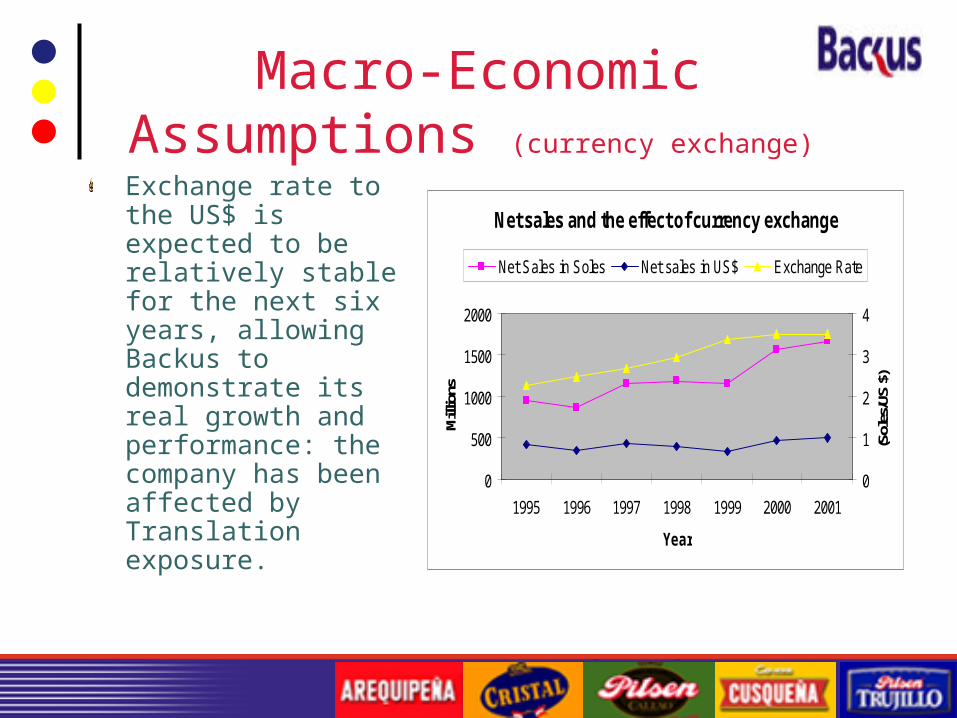
Exchange rate to the US$ is expected to be relatively stable for the next six years, allowing Backus to demonstrate its real growth and performance: the company has been affected by Translation exposure.
Net sales and the effect of currency exchange
0
500
1000
1500
2000
1995 1996 1997 1998 1999 2000 2001
Year
Mill
ions
0
1
2
3
4
(Sol
es/U
S $)
Net Sales in Soles Net sales in US$ Exchange Rate
Macro-Economic Assumptions (Inflation)
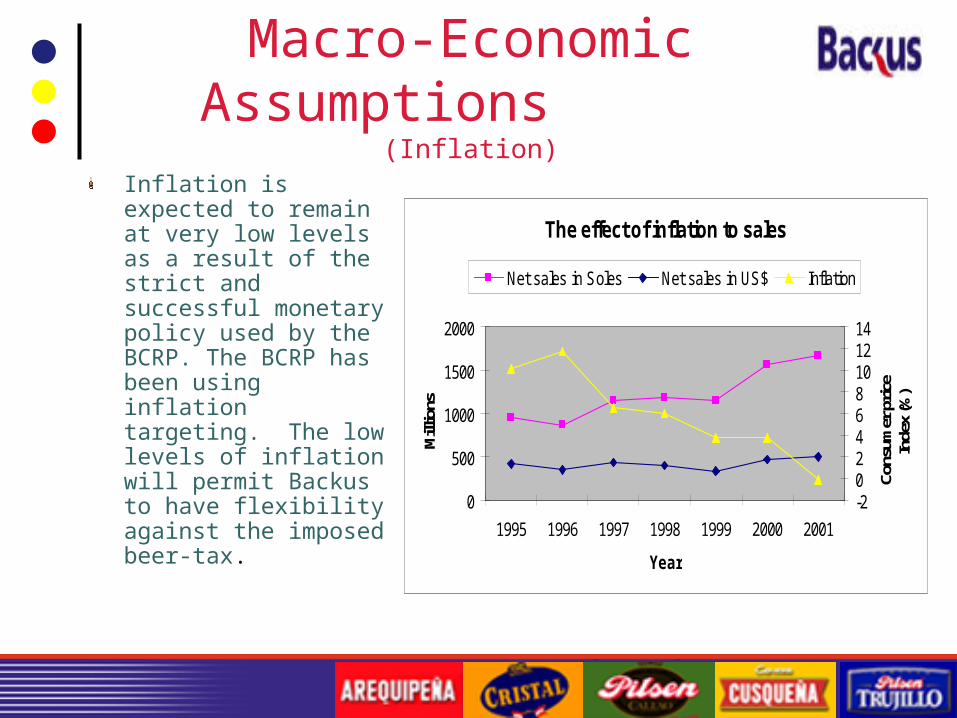
Inflation is expected to remain at very low levels as a result of the strict and successful monetary policy used by the BCRP. The BCRP has been using inflation targeting. The low levels of inflation will permit Backus to have flexibility against the imposed beer-tax.
The effect of inflation to sales
0
500
1000
1500
2000
1995 1996 1997 1998 1999 2000 2001
Year
Mill
ions
-202468101214
Cons
umer
pric
e In
dex
(%)
Net sales in Soles Net sales in US$ Inflation
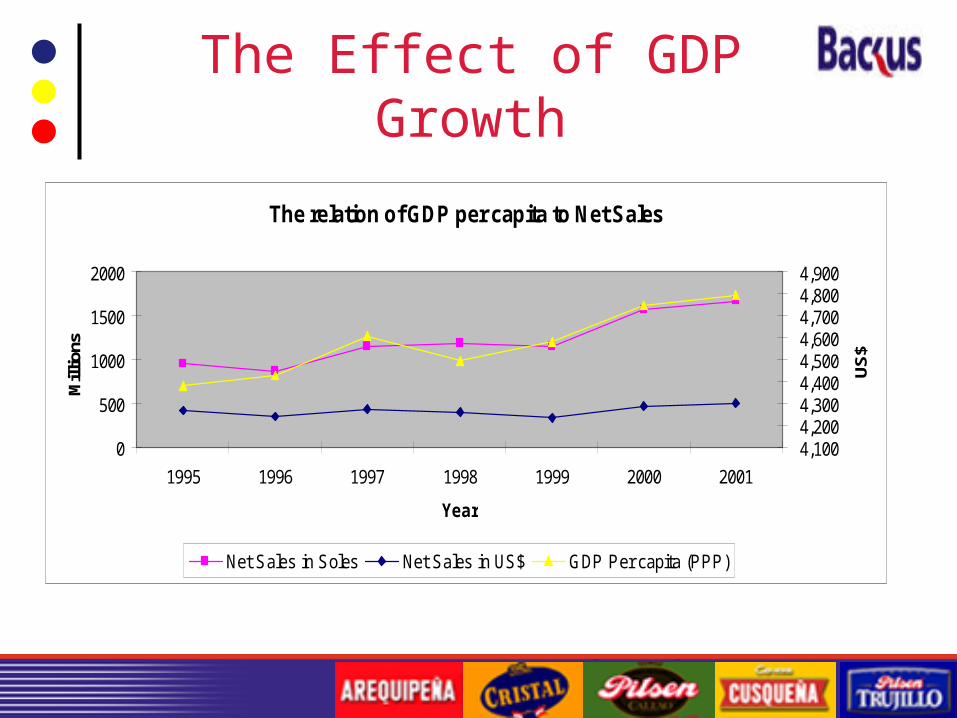
The Effect of GDP Growth
The relation of GDP per capita to Net Sales
0
500
1000
1500
2000
1995 1996 1997 1998 1999 2000 2001
Year
Mill
ions
4,1004,2004,3004,4004,5004,6004,7004,8004,900
US
$
Net Sales in Soles Net Sales in US$ GDP Per capita (PPP)
Political Assumption/Concern
The future of Backus is partially in hands of the government because the company is highly sensible to the situation of the country.
We believe as long ex-presidents Alberto Fujimori nor Alan Garcia are not re-elected our valuation should be accurate.
Peru is a country highly dependable on foreign investment, and investors do not like the two ex-presidents.
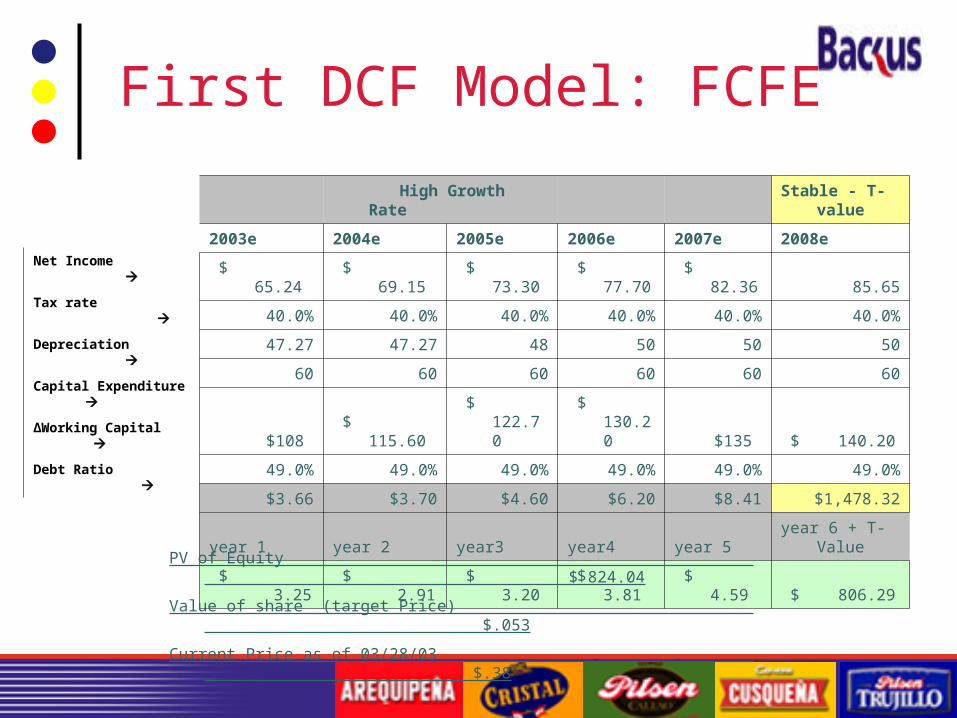
First DCF Model: FCFE
High Growth Rate Stable - T-value
2003e 2004e 2005e 2006e 2007e 2008e
$ 65.24 $ 69.15 $ 73.30 $ 77.70 $ 82.36 85.65
40.0% 40.0% 40.0% 40.0% 40.0% 40.0%
47.27 47.27 48 50 50 50
60 60 60 60 60 60
$108 $ 115.60 $ 122.70 $ 130.20 $135 $ 140.20
49.0% 49.0% 49.0% 49.0% 49.0% 49.0%
$3.66 $3.70 $4.60 $6.20 $8.41 $1,478.32
year 1 year 2 year3 year4 year 5 year 6 + T-Value
$ 3.25 $ 2.91 $ 3.20 $ 3.81 $ 4.59 $ 806.29
Net Income
Tax rate
Depreciation
Capital Expenditure
∆Working Capital
Debt Ratio
PV of Equity $ 824.04
Value of share (target Price) $.053
Current Price as of 03/28/03 $.38

Reason for a Second DCF Valuation
Quantitative data obtained in the last days.
AmBev decision to penetrate the Peruvian market.Future Agreement of Free Trade between Peru and Brazil.Bavaria becoming the major shareholder of Backus common shares w/ voting rights.
Difference between DCF Valuations
Net IncomeDepreciation and Capital Expenditure∆ Working Capital and Debt Ratio
*Macro-economic assumptions and political concerns did not change across the DCF
models.
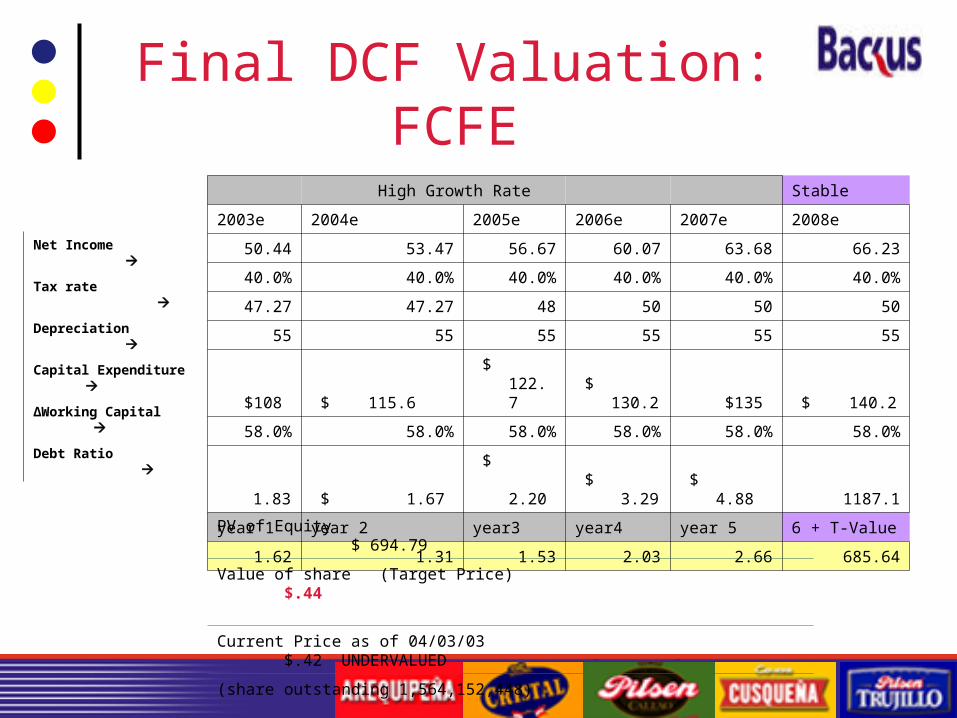
Final DCF Valuation: FCFE
High Growth Rate Stable
2003e 2004e 2005e 2006e 2007e 2008e
50.44 53.47 56.67 60.07 63.68 66.23
40.0% 40.0% 40.0% 40.0% 40.0% 40.0%
47.27 47.27 48 50 50 50
55 55 55 55 55 55
$108 $ 115.6 $ 122.7 $ 130.2 $135 $ 140.2
58.0% 58.0% 58.0% 58.0% 58.0% 58.0%
1.83 $ 1.67 $ 2.20 $ 3.29 $ 4.88 1187.1
year 1 year 2 year3 year4 year 5 6 + T-Value
1.62 1.31 1.53 2.03 2.66 685.64
PV of Equity $ 694.79
Value of share (Target Price) $.44
Current Price as of 04/03/03 $.42 UNDERVALUED
(share outstanding 1,564,152,448)
Net Income
Tax rate
Depreciation
Capital Expenditure
∆Working Capital
Debt Ratio
Conclusion
After utilizing macro-economic assumptions, firm dominance, relative valuation, and FCFE analysis, UCP Backus’ performance will not be significantly deterred due to the entry of AmBev into the market. Our relative, DCF valuations indicate that even after the entry of AmBev, the ADR will still be UNDERVALUED; indicating growth capabilities due to strong brand loyalty and dominance over distribution channels.
We maintain our target price at $.44 and Buy recommendation for Backus I shares.

Any Questions??

The “L” Factor
Final results are not calculated by formulas… but by rumors and government policies. In order to have an accurate estimation, you have to become a Sherlock Holmes.
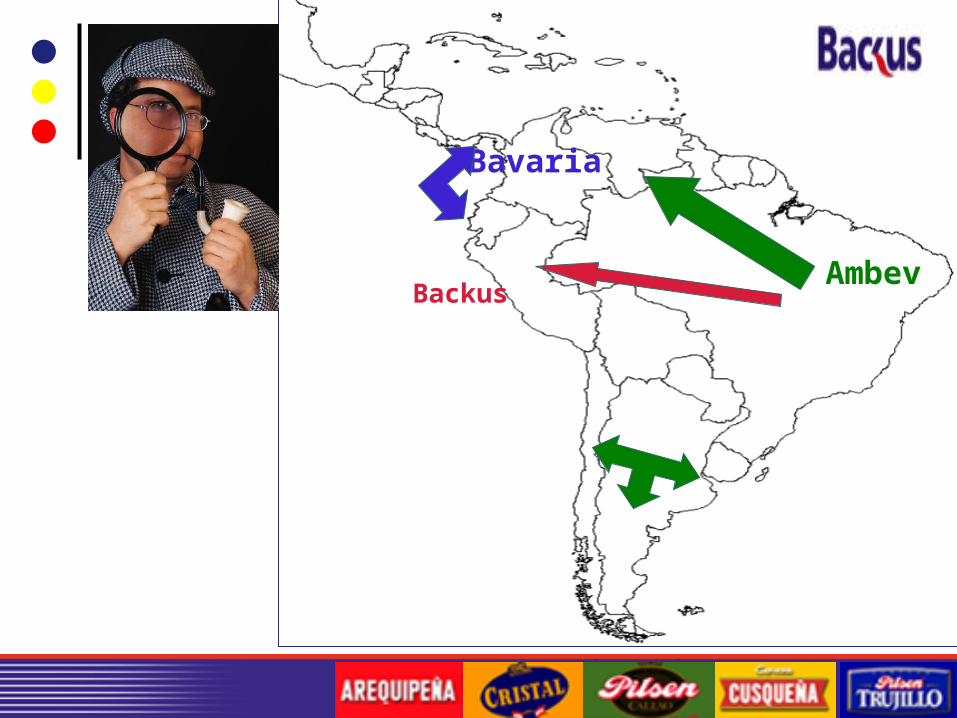
Ambev
Bavaria
Backus
The Valuation
To assess future changes, look at the changes to the value of equity:
The value of the share is usually one of the most sensitive financial indicators to both external and internal changes to a company’s performance. Share information is usually the most readily available data set to find and analyze.Share data is not readily affected by discrepancies in accounting standards across financial markets.