Embed Size (px)
Citation preview

Rhode Island HIT Survey: 2014 Results and Plans
for 2015
January 2015

Survey Objectives
1. To measure presence (structural measures) and use (process measures) of HIT by clinicians caring for Rhode Island patients
2. To capture HIT data for state agencies and other key stakeholders using single instrument (i.e., minimize data collection burden)

• Administered to all Licensed Independent Practitioners (LIPs):• Advanced Practice Registered Nurses (APRNs)• Physicians• Physician Assistants (PAs)
• Electronic survey instrument sent via:• Hard copy mailing (for physicians, with licensure renewal*)• If email available, email notification and up to two reminders
• Analyses limited to LIPs:• Licensed in Rhode Island• In active practice• Located in Rhode Island or an adjacent state (Connecticut or
Massachusetts)*During 2014 survey year.
Methods

1. Electronic Health Records (EHRs): Access to “EHR components,” including functions such as visit notes, lab orders, or prescriptions
2. Basic EHR use: Among those with EHRs, functionality/clinical use relating to documentation and results management
3. Advanced EHR use: Among those with EHRs, functionality/clinical use relating to decision support, external communication, order management, and reporting
4. e-Prescribing: Transmitting prescriptions/medication orders electronically to a pharmacy
Publicly-Reported Measures, 2014

20092010
20112012
20132014
0%
20%
40%
60%
80%
100%
58.1% 57.8%62.9%
55.4%62.3%
68.3%
46.2% 44.0%
PhysiciansAPRNs/PAs
The HIT Survey has a relatively high response rate for a single-wave mailed survey. It is
higher among physicians than APRNs/PAs.
Response rate by year

Physician Results
Overall Trends

Measure
Survey Respondents(N = 2,567)
All Physicians(N = 3,761)
N Score N Score
1. EHRs, n(%) 2,567 2,236 (87.1%) 3,761 2,236 (59.5%)
2. Basic EHR use, mean 2,236 77.0 -- --
3. Advanced EHR use, mean 2,236 62.6 -- --
4. e-prescribing, n(%) 2,349 1,884 (80.2%) 3,543 1,884 (53.2%)
The 2014 results provide a point-estimate of HIT adoption among physicians for the four publicly-
reported measures.
Use of EHRs and e-prescribing, among respondents and all physicians

Measure
Office-Based by Specialty
All Office-Based Physicians (N=1,544)
PCP(N=698)
Non-PCP(N=846)
1. EHRs, n(%) 625 (89.5%) 642 (75.9%) 1,267 (82.1%)
2. Basic EHR use, mean 87.1 70.5 78.7
3. Advanced EHR use, mean 68.3 42.2 55.1
4. e-prescribing, n(%) 590 (85.1%) 576 (73.0%) 1,166 (78.7%)
When looking at office-based physicians by specialty, HIT adoption is highest among office-
based primary care physicians (PCPs).
Respondents’ use of EHRs and e-prescribing, by physician specialty and practice location

1:EHRs
(%)
2:Basic EHR Use
(0-100)
3:Advanced EHR Use
(0-100)
4:e-Prescribing
(%)
0
20
40
60
80
100
67.6%63.6 pts
44.1 pts 41.2%
87.1%
77.0 pts
62.6 pts
80.2%
200920102011201220132014
Since 2009, physicians’ HIT adoption has increased for all four publicly-reported measures. EHR adoption increased by nearly 30% and e-prescribing by 95%.
Survey respondents’ use of EHRs and e-prescribing

Physician Results
Impact of EHRs

Other
Do not have access to EHR outside of practice
Do not use EHR outside of practice
To return patient or family telephone calls
To prepare for the upcoming work day
When covering other physicians' patients
To review labs, imaging, notes or reports
To catch up on documentation
When covering own patients
0.0% 20.0% 40.0% 60.0% 80.0% 100.0%
3.6%
12.1%
24.6%
21.0%
29.6%
32.3%
43.6%
49.5%
43.0%
3.6%
9.9%
12.0%
49.0%
49.5%
52.7%
61.6%
64.7%
68.8%
Office-basedHospital-based
(N=1,247)(N=954)
Compared to hospital-based physicians, office-based physicians more frequently report using
their EHR outside of regular work hours.
Percentage of physicians who say “yes,” they use their EHR outside of work hours

Despite agreeing that EHRs improve many aspects of care, fewer than half of hospital-and office-based
physicians agree that EHRs improve job satisfaction.
Percentage of physicians who “agree or strongly agree” that EHRs…
Improves job satisfaction
Improves clinical work flow
Improves communication with outside physicians (hospital-based only)
Improves the care patients receive
Improves ability to do QI work
Improves patient safety
Improves communication among the physicians and staff
Increased the timeliness of receiving test results (hospital-based only)
Improves billing processes (office-based only)
0% 20% 40% 60% 80% 100%
48.7%
59.8%
58.6%
68.8%
70.1%
74.5%
72.7%
82.9%
35.4%
51.0%
56.6%
62.0%
66.8%
72.8%
83.4%
Office-basedHospital-based
Improves billing processes (office-based only)
Improves communication among physicians and staff
Improves ability to do QI work
Improves communication with outside physicians (hospital-based only)
Improves job satisfaction
0% 20% 40% 60% 80% 100%
77.5%
77.7%
65.4%
63.4%
57.1%
49.0%
51.4%
42.0%
83.4%
82.9%
72.8%
70.2%
65.6%
62.0%
58.6%
54.8%
41.2%20142013
Percentage of physicians who “agree or strongly agree” that EHRs…
Compared to 2013, physicians’ agreement increased for all statements about how EHRs improve care,
except that EHRs improve job satisfaction.

Workload increased
Workload stayed the same
Workload decreased
0% 20% 40% 60% 80% 100%
40.5%
47.8%
11.7%
Percentage of all physician respondents who reported an impact of EHRs on take-home workload (N=2,110)
About 40% of physicians say that EHRs increased the amount of work they take home.

Workload increased
Workload stayed the same
Workload decreased
0% 50% 100%
10.1%
32.6%
57.3%
For office-based PCPs, EHRs have increased take-home workload.
Percentage of office-based PCPs who reported an impact of EHRs on take-home workload (N=595)

Physician Results
Public Health

Don't know
No
Yes
0% 20% 40% 60% 80% 100%
41.8%
31.7%
26.4%
Approximately one-quarter of office-based physicians are using their EHR for population
health management.
Percentage of physicians using their EHR for population health management (N=1,137)

I am not a decision maker for my practice
Other
Technical assistance
Additional staff members
Financial support
0% 20% 40% 60% 80% 100%
49.7%
7.3%
30.1%
33.6%
35.0%
Among office-based physicians not using their EHR for population health management, responses were
relatively evenly distributed about “what it would take” to start: cost, staff, or assistance.
Percentage of physicians who thought it would take the following for them to use their EHR for population health management… (N=1,022) (Select all that apply.)

0%
<30%
30%-60%
>60%
0% 20% 40% 60% 80% 100%
56.2%
27.3%
8.1%
8.3%
52.8%
32.5%
9.0%
4.6%
Hospital-basedOffice-based
(N=1,430)(N=778)
% of patients for whom physicians consult the PMP before prescribing
Among physicians who prescribe, fewer than half are consulting the Prescription Monitoring Program (PMP)
before prescribing opioids or benzodiazepines.

Physician Results
CurrentCare

CurrentCare Viewer (N=2,501)
Hospital Alerts (N=2,476)
EHR Integration (N=2,468)
0% 20% 40% 60% 80% 100%
26.7%
21.9%
17.6%
Percentage of physicians who are familiar with these CurrentCare services…
Approximately a quarter of all physician respondents are familiar with various components
of the state’s health information exchange, CurrentCare.

>60%
30-60%
<30%
0% - I am able to view or receive data from CurrentCare, but I am not using it
0% - My practice is not yet signed up to view or receive data from CurrentCare
1.6%
2.5%
9.4%
14.0%
72.6%
Percentage of patients for whom physicians view or receive CurrentCare data (N=2,492)
Nearly 75% of physicians are not signed up to view or receive data, highlighting opportunities for engagement.
Among those signed up, about half are using it.

Current Care Viewer
Hospital Alerts
EMR Integration
0% 20% 40% 60% 80% 100%
47.4%
36.5%
30.9%
Percentage of PCPs familiar with these CurrentCare services
Office-based PCPs were more familiar with CurrentCare services than non-PCPs.
N=684
N=676
N=670

Physician Results
Meaningful Use

Percentage of physicians who have attested to Meaningful Use
Two-thirds of office-based physicians report that they have attested to Meaningful Use.
Don't know (n=251)
No (n=129)
Yes (n=742)
0.0% 20.0% 40.0% 60.0% 80.0% 100.0%
22.3%
11.5%
66.1%

Percentage of physicians who attested to each stage of Meaningful Use in 2014
Medicare Stage 1 is the most common Meaningful Use attestation
Medicaid Stage 2 (n=79)
Medicaid Adoption, Implementation, Upgrade (n=157)
Medicare Stage 2 (n=158)
Medicaid Stage 1 (n=198)
Medicare Stage 1 (n=426)
0.0% 20.0% 40.0% 60.0% 80.0% 100.0%
12.9%
25.7%
25.8%
32.4%
69.6%

Percentage of physicians who plan to attest to Meaningful Use in 2014
The vast majority (nearly 90%) of office-based physicians who haven’t yet attested to
Meaningful Use intended to do so in 2014.
Undecided (n=72)
No (n=20)
Yes (n=623)
0.0% 20.0% 40.0% 60.0% 80.0% 100.0%
10.1%
2.8%
87.0%

Physician Results
Physician Quality Reporting System (PQRS)

Percentage of office-based physicians using PQRS in 2014 (N=1,422)
About one-third of office-based physicians say they are already using PQRS and plan to
continue in 2014.
Don't know (n=584)
Yes, and plan to continue in 2014 (n=481)
Yes, but plan to discontinue in 2014 (n=7)
No, and have no plans to start (n=254)
No, but plan to start in 2014 (n=94)
0% 20% 40% 60% 80% 100%
41.1%
33.8%
0.5%
17.9%
6.6%
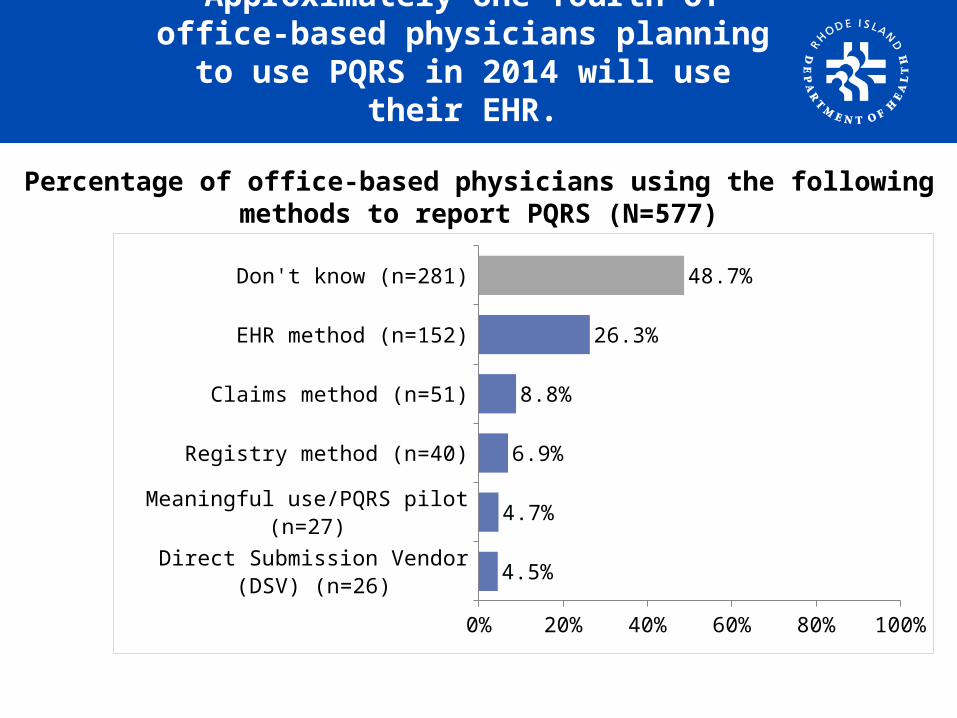
Percentage of office-based physicians using the following methods to report PQRS (N=577)
Approximately one-fourth of office-based physicians planning to use PQRS in 2014 will use
their EHR.
Direct Submission Vendor (DSV) (n=26)
Meaningful use/PQRS pilot (n=27)
Registry method (n=40)
Claims method (n=51)
EHR method (n=152)
Don't know (n=281)
0% 20% 40% 60% 80% 100%
4.5%
4.7%
6.9%
8.8%
26.3%
48.7%

Percentage of office-based physicians using the following approaches to report PQRS (N=582)
Office-based physicians who know how they plan to report PQRS in 2014 are approximately evenly split between Group Practice and Individual Reporting.
Don’t know (n=157)
Individual (n=199)
Group Practice Reporting Option (GPRO) (n=226)
0% 20% 40% 60% 80% 100%
27.0%
34.2%
38.8%

APRN and PA Results
Overall Trends

Measure
Survey Respondents(N = 662)
All APRNs/PAs(N = 1,505)
N Score N Score
1. EHRs, n(%) 662 522 (78.9%) 1,505 522 (34.7%)
2. Basic EHR use, mean 522 72.6 -- --
3. Advanced EHR use, mean 522 58.4 -- --
4. e-prescribing, n(%) 560 394 (70.4%) 1,403 394 (28.1%)
The 2014 results provide a point-estimate of HIT adoption among APRNs and PAs for the four
publicly-reported measures.
Use of EHRs and e-prescribing, among respondents and all APRNs/PAs

2015 Survey

2015 Survey Process
Administered to all Licensed Independent Practitioners (LIPs):• Advanced Practice Registered Nurses (APRNs)• Physicians• Physician Assistants (PAs)
Electronic survey instrument sent via:• Hard copy mailing in April of 2015• If email available, email notification and up to two
remindersAnalyses limited to LIPs:
• Licensed in Rhode Island• In active practice• Located in Rhode Island or an adjacent state (Connecticut
or Massachusetts)

2015 Survey
Goals of 2015 Survey:• Meet the needs of survey stakeholders, including HEALTH,
payers, Rhode Island HIE and provider groups• Reduce the length of the survey• Measure provider participation in value-based payment
programs• Measure provider use of patient engagement tools• Update publicly reported measures to better reflect
current HIT use, programs and state/federal requirements
Discussion Topics
• Updating publicly reported measures o Needs of providers, patients, other stakeholder
groups
• Use of HIT as part of patient engagement efforts and value-based payment programs
o Current and future uses of this technology
• Provider participation in value-based payment programso Provider knowledge and administrative practices

Rebekah Gardner, MD, FACPChair, Physician Reporting [email protected]
Samara Viner-Brown, MSChief, Center for Health Data and Analysis

![HIT-HY 200 Injection mortar HIT-Z HIT-V HIS-(R)N Rebar · Technology Manual 09 / 2015 Version 201 1 Anchor Fastening HIT-HY 200 Injection mortar HIT-Z HIT-V HIS-(R)N ... [mm] 60 60](https://img.pdfslide.us/doc/110x75/5ad347117f8b9a665f8d77ee/hit-hy-200-injection-mortar-hit-z-hit-v-his-rn-rebar-manual-09-2015-version.jpg)