Embed Size (px)
Citation preview

Rheology of Foaming Polymers and Its Influence on Microcellular Processing
by
Jing Wang
A thesis submitted in conformity with the requirements for the degree of Doctor of Philosophy
Department of Mechanical and Industrial Engineering University of Toronto
© Copyright by Jing Wang 2009

ii
Rheology of Foaming Polymers and Its Influence on Microcellular
Processing
Jing Wang
Doctor of Philosophy
Department of Mechanical and Industrial Engineering
University of Toronto
2009
Abstract
The rheological properties of polymer melts and polymer/blowing agent (BA) solutions
are determined experimentally and the influences of material rheological properties and
crystallization on low-density foaming behaviour of polylactic acid (PLA) are investigated.
Understanding the rheological properties of foaming polymers allows the optimization of
polymer chemical structure and the development of technologies that produce desired cell
morphologies.
Although the technology for producing CO2-blown polystyrene (PS) foams is well
established, the rheological properties of a PS/CO2 solution, especially its extensional property,
are not well understood. In this study, these properties are determined with an in-house
developed, online technique, and the measured data are compared with those from commercial
rheometers. The online measurement system consists of a tandem foam extrusion system and a
die for measuring pressure drops. Shear viscosity is determined from the pressure drop over a
straight rectangular channel, while planar extensional viscosity from the pressure drop over a
thin hyperbolic channel, taking into account the pressure drop due to shearing. Measured
viscosities of the polystyrene without CO2 compare well with those from commercial

iii
rheometers. With the presence of dissolved CO2, both the shear and extensional viscosities of the
polystyrene are significantly reduced. The influence of CO2 on the two viscosities is found to be
similar to an increase of temperature.
Polylactic acid is the first mass-produced biodegradable polymer, and has potential to
replace petroleum-based polymers in foaming applications. In this study, the influences of
material rheological properties and crystallization on the low-density, microcellular extrusion
foaming behaviour of polylactic acids (PLAs) are investigated. Comparisons are made between
linear and branched PLAs and between amorphous and crystalline PLAs. The branched PLAs are
found to produce foams with higher expansion ratios and reduced open-cell content compared to
the linear PLA. The foaming behaviour of the linear PLA, then, is significantly improved by
adding a small amount of long-chain-branched PLA. The improved cell structure with branched
PLAs is attributed to their relatively high melt strength and strain to break. For the first time, it is
shown that crystallization, induced by cooling and macroscopic flow during processing,
increases melt strength, which aids the production of low-density foams.

iv
Acknowledgments
In a thesis project of this scale, there are certainly a multitude of people that have helped
to make it possible. I want to start by acknowledging my supervisors, Professors Chul Park and
David James, for guiding me into the world of science and technology. Professor Park taught me
how to approach complex engineering problems effectively by identifying the key issues and
focusing on them, and his industrial collaborations have always impressed me how useful
cellular polymers can be. I learnt from Professor James how to express my opinions in precise
scientific language, and that a serious researcher should be willing to cast doubt on what seems
established theories and practices. I wish my future career can combine both their styles and win
respects from practitioners as well as theoreticians.
I thank Professor Hani Naguib and Professor Markus Bussmann for agreeing to join my
thesis committee three years ago and having provided useful advice at each of the annual
progress review meetings. I thank Professor John Dealy for agreeing to be my external examiner.
His reputation in the rheology community has certainly been an encouragement for me to work
hard on this thesis.
During my graduate study at the University of Toronto, I received help from many
colleagues including all members of the microcellular plastics manufacturing laboratory. I thank
Dr. John Lee for collaborating with me on so many projects. He is one of the most dutiful
engineers I know, and I wish him all the best in your future career. I thank Nan Chen for always
being helpful. I hope he will enjoy receiving the same degree as I did, again. I thank Esther Lee
for tipping me off on the local life. With her tips the city of Toronto is never a boring place. I
thank Dr. Wenli Zhu for helping me with the experiments, and for all the dinners she cooked for
us: they are just delicious! I thank all other past and present MPML members, including Dr.
Guangming Li, Dr. Zhenjin Zhu, Dr. Gangjian Guo, Dr. Wenli Zhu, Dr. Gary Li, Dr. Qingping
Guo, Dr. Chunmin Wang, Dr. Wenge Zheng, Dr. Hongbo Li, Dr. Jin Wang, Xindong Zhu, Dr.
Donglai Xu, Lilac Wang, Hongtao Zhang, Jingjing Zhang, Qingfeng Wu, Mingyi Wang,
Professor Guoliang Tao, Dr. Changwei Zhu, Sunny Leung, Raymond Chu, Anson Wong, Dr.
Ryan Kim, Dr. Kevin Lee, Peter Jung, Dr. Yongrak Moon, Dr. Patrick Lee, Dr. Kyungmin Lee,
Dr. Jae Yoon , Richard Lee, Sue Chang, Johnny Park, Hojin Chi, Alex Lee, Dr. Takashi Kuboki,
Dr. Bhuwnesh Kumar, Dr. Mohammed Serry, Mohammad Hasan, Dr. Maridass

v
Balasubramanian, Professor Taher Azdast, Professor Wanrudee Kaewmesri, Florien Gunkel,
and Ivan Gutierrez, for both the collaborations on research projects and the technical discussions
that were always insightful and inspiring.
I thank Jeff Sansome, David Esdaile, Ryan Mendell, Mike Smith, and Tai Tran Do at the
MIE machine shop for their quality work and for always going out of the way to tell me better
mechanical designs.
Many staff members at the department of mechanical & industrial engineering have
helped me in one way or another. My special thanks go to Brenda Fung, Sheila Baker, Teresa
Lai, Joe Baptista, Lorna Wong, Geoffrey Chow, and Oscar Del Rio.
Finally, I thank my parents for their support throughout my student life. Working through
the years without getting a job is a big commitment, but they were always there to encourage me.
I will make every effort to make them proud of me in my future career.

vi
Table of Contents
Abstract ……………………………………….……….…...……………………….….……… ii
Acknowledgements ……………………………………………….……….…...……...…….. iv
List of Tables ……………………………………………………..………………………..….. ix
List of Figures ………………………………………………….………………...............…….. x
List of Symbols ………………………………………………………………….……….…..... xv
Chapter 1 Introduction
1.1 Thermoplastic Foams and Their Processing Technology ……...………….…….. 2
1.2 Rheology of Polymeric Fluids …...…………………………………………….... 4
1.3 Motivations for the Study ………………………………………………..…… 6
1.3.1 Challenges with Characterizing Rheological Properties ……….……… 6
1.3.2 Importance of Material Rheology Properties to Foam Processing …… 7
1.4 General Objectives …………………………..……...………………………….. 8
1.5 Overview of the Thesis ………………....…………………………………........ 9
Chapter 2 Background and Literature Review
2.1 Thermoplastic Foams and Their Processing Technology ……………………. 10
2.1.1 Categories of Foams ………………………………………………… 10
2.1.2 Microcellular Foam Processing – Formation of Polymer/BA Solution 11
2.1.3 Microcellular Foam Processing − Cell Nucleation and Growth ………. 17
2.2 Rheology of Polymer Melts and Polymer/BA Solutions …………...……...… 21
2.2.1 Shear Rheometry of Polymer/BA Solutions …………………………… 21
2.2.2 Extensional Rheometry Involving Shear-Free Flows ………………….. 24
2.2.3 Extensional Rheometry Involving Mixed Flows ……………………… 26
2.3 Relationship between Cell Growth and Rheological Properties ………….…… 29
2.4 Objectives of the Thesis ……………………………………………………….. 32
Chapter 3 Characterization of the Shear Properties
3.1 Experimental …………………………………………………………..........…. 33
3.1.1 The Hele-Shaw Channels ………………………………………………. 33

vii
3.1.2 The Processing System ………………………………………………… 35
3.2 Properties of the Polymer and the Polymer/Blowing Agent Solution ……...... 37
3.2.1 General Physical Properties ……............................................……….. 37
3.2.2 Rheological Properties Using Commercial Rheometers ……..………… 39
3.3 Shear Viscosity of Polystyrene Alone ….………….………………….……… 40
3.3.1 Calculating the Viscosity ……………………………………….……… 40
3.3.2 Viscosity Data ………………………………………………………… 42
3.4 Shear Viscosity of Polystyrene/CO2 Solution ………………………….…….. 46
3.4.1 Viscosity Data and Prediction by the Free Volume Theory ………… 46
3.4.2 Comparing Viscosity Reductions of Various BAs …………………… 48
Chapter 4 Characterization of the Extensional Properties
4.1 Introduction ………………………………….………………………........….... 52
4.2 Uniaxial Extensional Viscosity from EVF …………………..………………… 54
4.3 Calculating the Pressure Drop due to Extension ……………………………… 57
4.4 The Extensional Rate and Total Strain …………………………………..…….. 62
4.5 Comparing Extensional Viscosities ………………………………………….… 64
4.6 Extensional Flow Resistance of the Solution ………………………………… 71
Chapter 5 Influence of Rheological Properties on the Low-Density Microcellular
Foaming of Polylactic Acids
5.1 Introduction ……………………………….………………………...………… 75
5.2 Experimental ………………………………………………………………... 78
5.3 Properties of the Polymers …….….….….………………………………….. 78
5.3.1 General Physical Properties ………………………………………...… 78
5.3.2 Rheological Properties ………………………………………………. 82
5.4 Results and Discussions ……………………………………………………… 86
5.4.1 Processing Strategies …………………………….……..…………….. 86
5.4.2 Cell Densities …………………………………………....…………. 89
5.4.3 Expansion Ratios ………………………...………………..………….. 89
5.4.4 Cell Morphology from SEM ……………………………....………… 93
5.5 Influence of Processing Conditions on PLA Crystallization …………………. 96

viii
5.6 Controlling PLA Crystallization and Its Influence on Foaming ……………… 101
Chapter 6 Conclusions ……………………………………………………………...…… 105
Bibliography ………………………………………………………………………….……. 110
Appendix ……...………….……………………………………….………………………… 117

ix
List of Tables
Table 3-1 Relaxation times of PS685D, based on oscillatory shear data …………..…… 39
Table 3-2 Best fitting parameters for the master plot of PS685D ………………………. 44
Table 5-1 Properties of the three PLAs ………………………………………………...... 82

x
List of Figures
Figure 1-1 Illustrations of the main stages of microcellular processing: (a) formation of
polymer/blowing agent (gas) solution; reproduced from Park and Suh (1996); (b)
cell nucleation and growth ………………….………………………..….............. 3
Figure 1-2 Illustrations of simple flows for rheological characterization: (a) simple shearing;
(b) uniaxial extension; where V is the velocity ………………….......................... 5
Figure 2-1 Scanning electron microscopy (SEM) photos of: (a) open-cell structure; (b) close-
cell structure; reproduced from Park et al. (1998) …………………………… 12
Figure 2-2 Mixing elements on the plasticating screw ……………………………….......... 15
Figure 2-3 Schematic of heat exchanger containing static mixers used in foam extrusion
……………………………………………….………………………………… 16
Figure 2-4 Free energy of forming bubble from supersaturated polymer melt …………… 18
Figure 2-5 Surface force balance for a heterogeneously nucleated bubble, where θ is the
wetting angle and σ is the surface tension ……………………………………… 20
Figure 2-6 Schematic of an extruder setup for measuring PS/CO2 solution viscosity;
reproduced from Lee et al. (1999) …………………………………………...…. 23
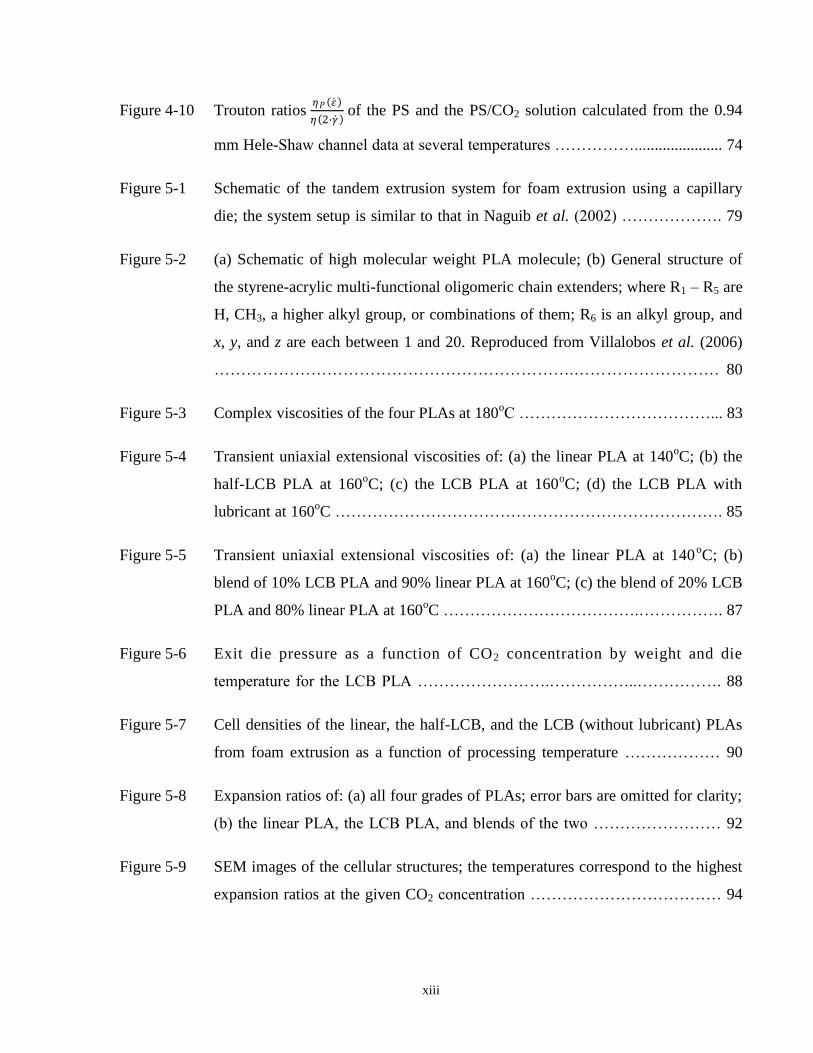
Figure 2-7 Rotary clamp rheometers for measuring: (a) planar extensional viscosity; (b)
biaxial extensional viscosity; reproduced from Meissner (1987) …...…………. 25
Figure 2-8 Basic elements of an entry flow for flow from a large tube through an abrupt entry
into a small tube. The illustration applies to both axisymmetric contraction and
planar contraction; reproduced from Boger (1987) ……………………………27
Figure 2-9 Distribution of BA concentration in the surrounding of a cell (a gas bubble), as
described by the cell model; 𝑐 𝑟, 𝑡 is the BA concentration, 𝑐𝑅 𝑡 is the BA
concentration at cell surface, 𝑃𝑔 𝑡 is the cell pressure, 𝑘𝐻 is Henry‟s Law

xi
constant, 𝑅 𝑡 is the cell radius, and 𝑅𝑠 𝑡 is the outer radius of the melt envelope
[Amon and Denson (1984)] …………………………………………………… 30
Figure 3-1 The two test dies. The circles indicate the diaphragms of the pressure transducers.
The dimensions are: 𝐵0 = 30 𝑚𝑚 , 𝐵1 = 3 𝑚𝑚 , 𝐿0 = 20 𝑚𝑚 , 𝐿1 = 5 𝑚𝑚 ,
𝐿2 = 20 𝑚𝑚. The depth H (into the page) is 𝐻 = 0.94 𝑚𝑚 or 1.96 𝑚𝑚. and
–𝐻
2< 𝑧 <
𝐻
2 …………………………………………………………………. 34
Figure 3-2 Schematic of the tandem extrusion system …………………………………… 36
Figure 3-3 Density of polystyrene and polystyrene/CO2 solution; extracted from Li (2008)
………………………………………………………………………………… 38
Figure 3-4 (a) Estimates of the first normal stress difference in shearing for the PS at 172oC;
(b) Estimated exit pressure of flows in the Hele-Shaw channels at several
temperatures …………………………………….………………………….…. 41
Figure 3-5 (a) Shear viscosity data of the polystyrene from various rheometers; (b) master plot
of the shear viscosities from data in Figure 3-5(a) ……………………………… 43
Figure 3-6 Shear viscosity of polystyrene, determined from flow measurements in the Hele-
Shaw channels ………………………………………………………………… 45
Figure 3-7 (a) Shear viscosity of PS/CO2 solution, compared with that of PS only; (b) Master
plot of the PS/CO2 solution for a reference temperature of 172oC, compared to the
viscosity of PS alone at 172oC ………………………………………………… 47
Figure 3-8 Reduction of glass transition temperature for PS as a function of CO 2
concentration; reproduced from Wissinger and Paulaitis (1987) ….…………… 49
Figure 3-9 Viscosity reduction factors of the present PS with various blowing agents: (a) as a
function of molar concentration and (b) as a function of weight concentration.
Values for CFC-11 and CFC-12 are calculated from Han et al. (1983)
………………………………………………………………………………. 51

xii
Figure 4-1 (a) Schematic of the ARES-EVF (Extensional Viscosity Fixture); (b)
representative positions of the rotating cylinders, and corresponding Hencky
strains; Reproduced from the product note on EVF technology by TA Instruments
Inc ………………………………………………………….…………………. 55
Figure 4-2 Transient uniaxial extensional viscosity of PS determined with the EVF fixture;
the symbols “x1”, “x0.2”, and “x0.1” indicate that the original data were
multiplied by these factors to avoid overlapping ………………………………. 56
Figure 4-3 Ratio of pressure gradient neglecting the aspect ratio of a rectangular channel over
that considering the aspect ratio, 𝑘 =𝑑𝑝 /𝑑𝑥𝐻𝑆
𝑑𝑝 /𝑑𝑥, with values obtained from the
literature and from running an in-house code ………………………….............. 60
Figure 4-4 The total pressure drop and the pressure drop related to extension in the 0.94 mm
channel (see Equation 4-8 for definitions of ∆𝑃𝑐𝑜𝑛𝑣𝑒𝑟𝑔𝑒𝑛𝑡 and ∆𝑃𝑒) ……………. 61
Figure 4-5 Ratio of centreline velocity for a finite aspect ratio over that for an infinite aspect
ratio, used as a correction factor and determined from literature sources and from
an in-house numerical code ……………………………...................................... 63
Figure 4-6 Comparison of planar extensional viscosity 𝜂𝑃 𝜀 from two Hele-Shaw channels
with uniaxial extensional viscosity 𝜂𝐸 𝜀 predicted from EVF measurement
………………………………………………………………………………… 66
Figure 4-7 Trouton ratio of the PS calculated from the 1.96 mm Hele-Shaw channel and from
EVF measurement. Comparison of 𝜂𝑃 𝜀
𝜂 2∙𝛾 with
𝜂𝐸 𝜀
𝜂 3∙𝛾 …………………………. 68
Figure 4-8 Plot of 𝜏𝑦𝑦 /𝜏𝑥𝑥 in planar extensional flow, calculated using the upper-convected
Maxwell model ………………………………………………............................. 70
Figure 4-9 Planar extensional viscosity of PS and PS/CO2 solution from the 0.94 mm Hele-
Shaw channel ……………………………………………………….................... 72
xiii
Figure 4-10 Trouton ratios 𝜂𝑃 𝜀
𝜂 2∙𝛾 of the PS and the PS/CO2 solution calculated from the 0.94
mm Hele-Shaw channel data at several temperatures ……………...................... 74
Figure 5-1 Schematic of the tandem extrusion system for foam extrusion using a capillary
die; the system setup is similar to that in Naguib et al. (2002) ………………. 79
Figure 5-2 (a) Schematic of high molecular weight PLA molecule; (b) General structure of
the styrene-acrylic multi-functional oligomeric chain extenders; where R1 – R5 are
H, CH3, a higher alkyl group, or combinations of them; R6 is an alkyl group, and
x, y, and z are each between 1 and 20. Reproduced from Villalobos et al. (2006)
………………………………………………………….……………………… 80
Figure 5-3 Complex viscosities of the four PLAs at 180oC ………………………………... 83
Figure 5-4 Transient uniaxial extensional viscosities of: (a) the linear PLA at 140oC; (b) the
half-LCB PLA at 160oC; (c) the LCB PLA at 160
oC; (d) the LCB PLA with
lubricant at 160oC ………………………………………………………………. 85
Figure 5-5 Transient uniaxial extensional viscosities of: (a) the linear PLA at 140oC; (b)
blend of 10% LCB PLA and 90% linear PLA at 160oC; (c) the blend of 20% LCB
PLA and 80% linear PLA at 160oC ……………………………….……………. 87
Figure 5-6 Exit die pressure as a function of CO2 concentration by weight and die
temperature for the LCB PLA …………………….……………..……………. 88
Figure 5-7 Cell densities of the linear, the half-LCB, and the LCB (without lubricant) PLAs
from foam extrusion as a function of processing temperature ……………… 90
Figure 5-8 Expansion ratios of: (a) all four grades of PLAs; error bars are omitted for clarity;
(b) the linear PLA, the LCB PLA, and blends of the two …………………… 92
Figure 5-9 SEM images of the cellular structures; the temperatures correspond to the highest
expansion ratios at the given CO2 concentration ……………………………… 94

xiv
Figure 5-10 Cross sections of the extruded filament: (a) LCB PLA with 9% CO2 at 115oC; (b)
half-LCB PLA with 9% CO2 at 117oC; Notice the open-cell structure in the core
of the half-LCB PLA filament ………………………………………………… 95
Figure 5-11 Crystallinity of the foams as a function of CO2 content and temperature, for the
LCB PLA (without lubricant) and the half-LCB PLA ……………………… 97
Figure 5-12 Crystallization half time for the LCB PLA with and without shearing; the
crystallinity at these half times is approximately 15% ...............................…… 99
Figure 5-13 Ratio of the storage modulus of crystalline PLA to that of the amorphous PLA as
a function of crystallinity; the material is LCB PLA without lubricant ………. 100
Figure 5-14 Expansion ratios of foams produced after different time for crystallization. The
material is LCB PLA and crystallinity of the foam skin, determined on DSC, is
shown for several conditions ………………………………………………….. 102
Figure 5-15 SEM images of the cellular structures, the polymer is LCB PLA, and 9% CO2 is
used: (a) tcry ≈ 0 s, 112oC; (b) tcry ≈ 0 s, 120
oC; (c) tcry ≈ 90 s, 110
oC; (d) tcry ≈ 90 s,
120oC ………………………………………………………………………….. 103

xv
List of Symbols
𝛼𝑇 Shift factor for viscosity
𝛾 Shear rate, [𝑠−1]
𝛾 𝑎 Apparent shear rate, [𝑠−1]
∆𝐸𝐷 Activation energy, [𝐽]
∆𝐺 Gibbs free energy, [𝐽]
∆𝐺𝑜𝑚∗ Free energy to form critical nucleus during homogeneous nucleation, [𝐽]
∆𝐺𝑒𝑡∗ Free energy to form critical nucleus during heterogeneous nucleation, [𝐽]
∆𝐺𝑉 Free energy difference between the bubble phase and the polymer phase, [𝐽]
∆𝑃 Pressure drop, [𝑃𝑎]
∆𝑃𝑒𝑛 Entrance pressure drop, [𝑃𝑎]
∆𝑃𝑒𝑥 Exit pressure drop, [𝑃𝑎]
∆𝑃𝑒 Extra pressure drop, [𝑃𝑎] ; ∆𝑃𝑒 = ∆𝑃𝑒𝑛 + ∆𝑃𝑒𝑥
𝜀 Elongation (or extension, or stretch) rate, [𝑠−1]
𝜀𝐻 Hencky strain
𝜂 Shear viscosity, [𝑃𝑎 ∙ 𝑠]
𝜂0 Zero-shear-rate viscosity, [𝑃𝑎 ∙ 𝑠]
𝜂∞ Viscosity at infinite shear rate, [𝑃𝑎 ∙ 𝑠]
𝜂𝑃,𝑎𝑝𝑝 Apparent planar extensional viscosity, [𝑃𝑎 ∙ 𝑠]
𝜂∗ Complex viscosity, [𝑃𝑎 ∙ 𝑠]

xvi
𝜂𝐵+ Transient biaxial extensional viscosity, [𝑃𝑎 ∙ 𝑠]
𝜂𝐸+ Transient uniaxial extensional viscosity, [𝑃𝑎 ∙ 𝑠]
𝜂𝑃+ Transient planar extensional viscosity, [𝑃𝑎 ∙ 𝑠]
𝜆 Relaxation time, [𝑠]
𝜌 Density, [𝑔/𝑐𝑚3]
𝜍 Surface tension, [𝑁/𝑚]
𝜏21 or 𝜏𝑦𝑥 Shear stress, [𝑃𝑎]
𝜏𝑤 Wall shear stress, [𝑃𝑎]
𝜏11 − 𝜏22 Principal tensile stress difference, [𝑃𝑎]
𝜏22 − 𝜏33 Secondary tensile stress difference, [𝑃𝑎]
𝜒 Crystallinity [%]
𝛹1 First normal stress coefficient, [𝑃𝑎]
𝜔 Angular frequency, [𝑟𝑎𝑑/𝑠]
𝐴 Bubble surface area, [𝑚2]
𝑏 Extensional flow parameter, [0 < 𝑏 < 1]
𝐵 Width, [𝑚]; used in various contexts
𝐶 Weight concentration, [𝑔/𝑐𝑚3 or 𝑔/𝑔]
𝐶𝑚 Molar concentration, [𝑚𝑜𝑙/𝑐𝑚3 or 𝑚𝑜𝑙/𝑔]
𝐶𝑝 Heat capacity, [𝐽/𝑘𝑔 ∙ 𝐾]
𝐷 Diffusivity, or diffusion coefficient [𝑚2/𝑠]

xvii
𝑫 Rate-of-strain tensor [𝑠−1]
𝐷0 Maximum diffusion coefficient (at infinite temperature) [𝑚2/𝑠]
𝐷𝑒 Deborah number
𝑓 Fractional free volume
𝐹 Force, [𝑁]
𝑔 Gravitational constant, 9.8 𝑚/𝑠2
𝐺 Elastic modulus, [𝑃𝑎]
𝐺 ′ Storage modulus, [𝑃𝑎]
𝐺" Loss modulus, [𝑃𝑎]
𝐻 or Height, [𝑚]; used in various contexts
𝑘 Thermal conductivity, [𝑊/𝑚 ∙ 𝐾]
𝑘𝐵 Boltzmann constant, 1.38 × 10⁻²³ 𝐽/𝐾
𝑘𝐻 Henry‟s Law constant
𝑙𝐷 Striation thickness [𝑚]
𝐿 Length, [𝑚]; used in various contexts
𝑀𝑛 Number-averaged molecular weight, [𝑔/𝑚𝑜𝑙]
𝑀𝑤 Weight-averaged molecular weight, [𝑔/𝑚𝑜𝑙]
𝑚 Power Law parameter
𝑛 Non-Newtonian index in Power Law
𝑁𝐴 Avogadro number, 6.022 × 10²³ 𝑚𝑜𝑙−1

xviii
𝑁1 First normal stress difference, [𝑃𝑎]
𝑁𝑜𝑚 Cell nucleation rate during homogeneous nucleation [𝑐𝑒𝑙𝑙𝑠/𝑠]
𝑁𝑒𝑡 Cell nucleation rate during heterogeneous nucleation [𝑐𝑒𝑙𝑙𝑠/𝑠]
𝑃 Pressure, [𝑃𝑎]
𝑃𝑔 Gas pressure inside a cell, [𝑃𝑎]
𝑃𝑠 System pressure, [𝑃𝑎]
𝑄 Volumetric flow rate, [𝑚3/𝑠]
𝑟, 𝜃, and 𝑧 Cylindrical coordinates
𝑅 or 𝑟 Radius, [𝑚]
𝑟∗ Critical radius, [𝑚]
𝑅𝑔 Molar gas constant, 8.314 𝐽 ∙ 𝐾−1 ∙ 𝑚𝑜𝑙−1
𝑅𝑒 Reynolds number
𝑡1/2 Crystallization half time, [𝑠]
𝑡𝐷 Characteristic time for gas diffusion [𝑠]
𝑡𝑓𝑙𝑜𝑤 Characteristic time of the flow system [𝑠]
𝑇 Temperature, [𝐾]
𝑇𝑐 Crystallization temperature, [𝐾]
𝑇𝑔 Glass transition temperature, [𝐾]
𝑇𝑚 Melting temperature, [𝐾]
𝑇𝑟 Reference temperature, [𝐾]

xix
𝑇𝑟 Trouton ratio
𝑣 Velocity, [𝑚/𝑠]
𝑉𝑏 Initial volume of bubble, [𝑚3]
𝑉𝑡 Theoretical expansion ratio
𝑉𝑅𝐹 Viscosity reduction factor
𝑥, 𝑦, and 𝑧 Cartesian coordinates

1
Chapter 1 Introduction
In less than a century, polymers have evolved into a global industry that influences every
aspect of our lives. For the year 2000, nearly 200 million tons of synthetic polymeric materials,
or plastics, were produced worldwide to satisfy ever-growing market needs. This amount equals
to 2% of the wood and nearly 5% of the oil consumed by the world in that year. As a leading
producer, the United States produced $250 billion-dollar worth of plastics in the year 2000,
contributing about 4% of the gross domestic product [Carraher (2003)].
Polymers have no competing materials in terms of weight, ease of processing, economy,
and versatility. However, polymers can be made lighter and more versatile by foaming them with
a blowing agent (BA), usually a gas under room temperature and pressure. The foams, also
called cellular polymers, first came into use during the 1940s, and have since enjoyed a
continuously growing market. As of 2005, the world consumption of foamed polymers was
approximately 23 billion pounds, with 1/3 of this amount occurring in the United States [The
Freedonia Group (2001)]. Growth is attributed to their light weight, excellent strength-to-weight
ratio, superior insulation properties, and energy absorbing capability.
During the past three decades, foaming technology has evolved from purely heuristic
efforts to fundamental approaches relying on science and engineering. Today, advanced
technologies such as the microcellular foaming technology [Baldwin et al. (1994a) and (1994b)]
enable engineers to control details of the cellular structures and to design foam-based materials
for advanced applications [Suh et al. (2000)].
Nearly all advanced foaming technologies subject the polymer/BA mixtures to a series of
well-defined kinematic events, such that the main stages of processing, dissolution of the
blowing agent, phase separation, and hardening of the cellular structure, are precisely controlled.
The development of these technologies requires accurate knowledge of the rheological (flow)
properties of the polymer/BA mixtures and how these mixtures react to processing conditions
and geometric constraints. Unfortunately, rheological properties of polymers and polymer/BA
mixtures are notoriously difficult to determine. Even if they can be determined, using this
information to analyze a foaming process and to predict cell morphology is not straightforward.

2
This thesis is concerned in general with these two challenges. The polymers of interest will be
polydisperse homopolymer, typically used in foam processing, and the BA will be supercritical
CO2, extensively investigated in recent years because of its environmental friendliness and its
tendency to induce high-cell-density, microcellular foams [Tomasko et al. (2003)]. In this thesis,
techniques for characterizing rheological properties will be presented, and the result will help
with understanding and predicting of cellular structures in processing.
1.1 Thermoplastic Foams and Their Processing Technology
Thermoplastic foams are cellular materials consisting of dispersed, usually spherical,
gaseous voids and a continuous thermoplastic matrix. They belong to a more general class of
foams with various matrices, including thermosetting foams (e.g., polyurethane foams),
naturally-occurring foams (e.g., wood and cancellous bones), food foams (e.g., steamed rice and
flour dough), and liquid foams (e.g., soap foam). „Foam‟ is different from „porous materials‟
because the former involves volume expansion and the latter does not.
Most thermoplastics can be foamed. Thermoplastic foams possess unique physical,
mechanical, and thermal properties, which are governed by the polymer matrix, characteristics of
the cellular structure (e.g., cell density and cell size), and the BA composition. They have found
widespread uses as insulating materials, light-weight structural components, cushioning
materials, filters, and many others. Moreover, thermoplastic foams which are recyclable or
biodegradable are expected to replace traditional non-recyclable thermosetting foams.
To generate thermoplastic foams, dissolved gas molecules have to be converted into
spherical bubbles through cell nucleation and growth, which typically take place when the gas
phase becomes supersaturated and the surrounding conditions change too abruptly to allow a
smooth and quasi-equilibrium phase separation through diffusion and vaporization [Lee et al.
(2007)]. Once nucleated, cells continue to grow as gas diffuses into it, and growth continues until
the cell stabilizes (usually when the melt becomes hardened by cooling) or ruptures (when the
melt is overstretched). Figure 1-1 illustrates the formation of polymer/gas (BA) solution and the
generation of cells during microcellular foaming, an advanced technology requiring complete
dissolution of the BA in the melt and inducing microcellular structures through a rapid pressure

3
(a)
(b)
Figure 1-1 Illustrations of the main stages of microcellular processing: (a) formation of
polymer/blowing agent (gas) solution, reproduced from Park and Suh (1996); (b) cell nucleation
and growth

4
drop. The key is to control the dynamics of cell nucleation and growth by controlling rheological
properties, processing conditions, and geometries of the flow channels.
1.2 Rheology of Polymeric Fluids
Rheology is the science that deals with deformation and flow [Bird et al. (1987)]. A
polymer is a large molecule composed of many repeating carbon-based chemical units, called
structural units. Different side groups may be attached to the carbon chain, giving rise to
different chemical properties. A polymer melt is both viscous and elastic. That is, polymers
exhibit both fluid-like, viscous behaviour, such that the stress is related to the strain rate, and
solid-like, elastic behaviour, such that the stress is related to the strain. The elastic component is
often described by the dimensionless Deborah number. This number may be interpreted as the
ratio of the elastic forces to viscous forces, and is defined as the ratio of a characteristic time of
the fluid, λ, to a characteristic time of the flow system, 𝑡𝑓𝑙𝑜𝑤 [Bird et al. (1987)]
𝐷𝑒 = 𝜆/𝑡𝑓𝑙𝑜𝑤 (1-1)
The characteristic time of the fluid is related to molecular motion, while the flow
characteristic time depends on macroscopic motion. At a low strain rate, corresponding to a long
characteristic flow time, the fluid has ample time to relax into its equilibrium state, and its
behaviour is mostly viscous. At high strain rates, however, the polymer chains are stretched by
the flow and do not have time to relax. Fluid behaviour is then more elastic in nature. The
viscoelasticity gives rise to highly non-Newtonian properties such as a shear-rate dependent
viscosity, a extension-thickening viscosity, and normal stresses in shearing [Macosko (1994)].
To characterize the flow behaviour, or rheology, of a polymeric fluid, the material is
generally subjected to two basic motions: shearing and elongation. As illustrated in Figure 1-2(a)
and Equation (1-2), during shearing the distance between local fluid elements on neighboring
streamlines grows linearly in time, and the rate-of-strain tensor D contains only off-diagonal
components

5
(a)
(b)
Figure 1-2 Illustrations of simple flows for rheological characterization: (a) simple shearing; (b)
uniaxial extension; where V is the velocity

6
𝑫 =
0 𝛾 𝑦𝑥 𝑡 0
𝛾 𝑦𝑥 𝑡 0 0
0 0 0
(1-2)
where 𝛾 𝑦𝑥 𝑡 is the time-dependent shear rate. Figure 1-2(b) and Equation (1-3) illustrates
uniaxial elongation, which is free of vorticity and local fluid elements move apart exponentially
with time, resulting in a much stronger deformation. The rate-of-strain tensor for elongational
flow contains only diagonal components
𝑫 = − 1 + 𝑏 𝜀 𝑡 0 0
0 − 1 − 𝑏 𝜀 𝑡 00 0 2𝜀 𝑡
(1-3)
where 𝜀 𝑡 is the time-dependent elongation rate and b is the type of flow. The major types are
uniaxial elongation (𝑏 = 0), planar elongation (𝑏 = 1), and biaxial elongation (𝑏 = 0), all
relevant to foam processing as will be discussed later in this thesis [Bird et al. (1987)].
1.3 Motivations for the Study
1.3.1 Challenges with Characterizing Rheological Properties
The fluids of interest in foam processing are polymer melts and polymer/BA solutions,
both exhibiting viscoelasticity which influences the fluids‟ processing behaviours. However, two
major challenges arise when characterizing the rheological properties of these fluids. One is the
need for high pressure during measurement of polymer/BA solutions, so that the BA stays
dissolved in the melt. The other is the difficulty of determining extensional properties. To
address the first challenge, customized rheometers, both pressure-driven and drag-driven, have
been developed because commercial ones cannot be operated under sufficiently high pressures.
As a result, shear characteristics of polymer/BA solutions are now relatively well established, at
least compared to extensional characteristics. Such studies have shown that even a few percent of
BA can reduce the shear viscosity of a polymer melt significantly, and that the shape of the
solution viscosity curve is similar to that of the polymer alone at a higher temperature. The
customized rheometers, however, have not been successful in determining other rheological
properties of the polymer/BA solutions.

7
The difficulty of determining extensional properties pertains to both the polymer and the
polymer/BA solutions. In contrast to a Newtonian fluid, in which the extensional viscosity in
uniaxial extension 𝜂𝐸 is three times the shear viscosity 𝜂 , polymeric liquids can exhibit
extensional viscosities that are orders of magnitude higher than the shear viscosity [Macosko
(1994)]. This extreme strain hardening contributes directly to unexpected behaviour in
processing, such as an excess pressure drop in convergent channel flow, die swell, and a high
strain to break, which aids the production of polymer thin films and low-density foams.
Characterizing the extensional viscosity 𝜂𝐸 requires a shear-free flow, as prescribed by
Equation (1-3). This is a difficult task, but uniaxial extensional viscosity can be routinely
measured nowadays because the associated shear-free flow can be generated with commercial
instrumentations. Planar and biaxial extensional viscosities, however, which are also relevant to
foam processing, are rarely determined because commercial instrumentation is not available. At
extensional rates of industrial relevance (usually above 1 s-1
), planar extensional viscosity has
been determined approximately from planar contraction flows, and biaxial extensional viscosity
from stagnation flows [Macosko (1994)]. These measurements, obtained with laboratory
instruments, also seem to be the only methods available for evaluating the extensional properties
of polymer/BA solutions. Ladin et al. (2001) and Xue and Tzoganakis (2003) determined the
apparent extensional viscosity of polymer/CO2 solutions by measuring the pressure drop in a
sudden planar contraction. They found that BA reduces the extensional viscosity, but their
methods lack detailed control of the extensional flow, and their data involved large errors.
Details of these studies will be discussed in Chapter 4.
1.3.2 Importance of Material Rheological Properties to Foam Processing
During foam processing, rheological properties of the polymer and the polymer/BA
mixtures determine the distributions of pressure and velocity in the processing system, and
therefore the generation and growth of cells. Specifically, cell nucleation occurs when the system
pressure drops below a critical pressure, called the solubility pressure; cell nucleation density and
initial cell growth rate, then, are determined by the degree of supersaturation of the blowing
agent, a close function of the pressure drop rate in a die or a mold; and finally, the velocity

8
history of a local flow element defines its current rheological state, which influences cell
nucleation and growth within this element.
Rheological properties influence cell growth. For example, the extensional properties of a
polymer influence the deformation at the surface of an expanding cell, which is essentially
biaxial stretching. Many studies (e.g., Münstedt & Stange (2006) and Spitael & Macosko (2004))
have found that foams produced with a long-chain-branched polypropylene show more uniform
cell size distributions and fewer cell openings (i.e., fewer ruptures of cell walls) than foams
produced with a linear polypropylene. The viscosity reduction effect of BA is also important. It
has beneficially allowed foams to be processed at very low temperatures such that the melt is
strong enough to sustain expansion of the cells. As the BA diffuses into the cells, the melt is
quickly hardened, causing cell growth to slow down and even to stop.
Despite the importance of material rheological properties to foam processing, previous
attempts to quantitatively relate these properties to cell growth behaviour have only been
limitedly successful, mainly because no constitutive model is capable of describing the
rheological properties accurately, and actual foaming involves complicated interactions between
momentum, energy, and mass transports.
1.4 General Objectives
Given the difficulty to determine rheological properties relevant to foam processing, and
the need to relate these properties to cell nucleation and growth, the general objectives of this
thesis are: first, to determine the rheological properties, especially the extensional properties of
polymer melts and polymer/BA solutions.; secondly, to analyze foam processing based on
knowledge of the rheological properties, especially to investigate how rheological properties
determine cell morphology. More detailed objectives will be presented in Chapter 2 after a
literature review.

9
1.5 Overview of the Thesis
Chapter 2 reviews relevant literature, leading to detailed objectives of this thesis.
Chapters 3 and 4 present a technique for determining the shear and extensional viscosities of a
polymer melt and its BA solution. The technique involves measuring pressure drops over well-
defined flow channels, and the analyses for extracting the rheological properties are presented in
detail. The measured viscosities from channels are compared to viscosity data from commercial
rheometers. In Chapter 5, then, the extrusion foaming behaviour of polylactic acid (PLA) with
different rheological properties is presented, and the optimal material compositions to produce
low-density PLA foams are investigated. Finally, Chapter 6 summarizes the contributions of this
thesis, and concludes by recommending future research directions.

10
Chapter 2 Background and Literature Review
Thermoplastic foam processing is a physical process driven by the diffusion of a gaseous
blowing agent into and out of the polymer melt under processing conditions. The diffusion
process is heavily influenced by the flows induced during processing. For example, shearing can
increase significantly the mixing efficiency of polymer and gas bubbles, and cell nucleation
density is closely related to the rate of pressure drop of the polymer/BA solution. From an
engineering point of view, it is important to model the cell nucleation and growth processes, and
thereby to predict cellular structures. Existing models have been derived from conservations of
momentum, energy, and mass at the single cell level, but they are only partially useful in actual
processing. A major limitation of these models is the lack of an accurate description of the
rheological properties of viscoelastic polymer/BA solutions, particularly their extensional
properties.
In this chapter, we start by reviewing the major scientific issues related to microcellular
foaming technology in Section 2.1. This is followed by a review of rheometric techniques for
polymer melts and polymer/BA solutions, especially techniques for determining extensional
properties, in Section 2.2. In Section 2.3, then, both the cell model and relevant experimental
foaming studies are reviewed to clarify the relationship between rheological properties and cell
growth. Finally, in Sections 2.4, detailed objectives of this thesis are presented.
2.1 Thermoplastic Foams and Their Processing Technology
2.1.1 Categories of Foams
Thermoplastic foams have been categorized by cell size, expansion ratio, and cell wall
integrity. The categories are independent of processing technology and the thermoplastics used,
and they reflect different applications and different physical properties of the foams. The major
categories by cell size are conventional (coarse) foams, with an average cell size above 100 μm,
fine-celled foams, between 20 and 100 μm, and microcellular foams, with an average cell size
below 20 μm [Klempner and Sendijarevic (2004)]. Studies have focused on microcellular foams

11
in recent years, because smaller cell size reduces convection and increases insulation of the
foam. Some mechanical properties, such as impact strength and fatigue life, are also improved
when cell size decreases, an effect attributed to the cells‟ ability to absorb micro-cracks.
Performance-to-weight ratios are also improved when cell size decreases [Suh et al. (2000)].
The major categories by expansion ratio, defined as the ratio of polymer density to foam
density, are high-density foams, with expansion ratios below 4, medium-density foams, between
4 and 10, and low-density foams, with expansion ratios above 10. High-density foams have been
used in structural applications where mechanical properties are important, while low-density
foams have been used in insulation and packaging applications, where energy absorption is
important [Throne (1996)].
Finally, the major categories by cell wall integrity are open-cell foams and closed-cell
foams. The former have openings in the cell walls such that adjacent cells interconnect with each
other (see Figure 2-1(a)), and the latter have complete cell walls such that adjacent cells are not
connected (Figure 2-1(b)). Open-cell foams have been used as sound insulation materials and
filters while closed-cell foams are suitable for packaging and cushioning applications [Lee et al.
(2007)].
2.1.2 Microcellular Foam Processing - Formation of Polymer/BA Solution
A. Solubility
As illustrated in Figure 1-1(a), microcellular processing begins with the formation of a
polymer/BA solution. Only a soluble amount of BA should be injected into the polymer melt,
because excess BA results in undesirable voids. These voids suppress cell nucleation because the
BA molecules preferentially diffuse to larger cells, resulting in hollow cavities in the final
product [Park and Suh (1996)]. The solubility of a BA also determines the plasticizing (viscosity
reduction) limit and the maximum expansion ratio of the foams. For example, carbon dioxide,
which has a solubility limit in polymers comparable to that of CFC blowing agents, has been a
good candidate for making low-density foams. Nitrogen, on the other hand, is much less soluble,
and has been used for making high-density foams with a high cell number density. The solubility

12
(a)
(b)
Figure 2-1 Scanning electron microscopy (SEM) photos of: (a) open-cell structure; (b) close-cell
structure; reproduced from Park et al. (1998).

13
limit usually depends on the polymer, the BA, the temperature, and the pressure. In general, only
loosely-packed phases in the polymer, usually amorphous phases, can dissolve BA, and densely-
packed phases, such as crystalline phases and solid particles, do not dissolve much BA [Tomasko
et al. (2003)].
B. Diffusivity
The diffusivity (or diffusion coefficient) of BA in a polymer is one of the key parameters
that determine the time needed to dissolve the BA and the kinetics of phase separation (i.e., cell
nucleation and growth). In general, BA diffusivity in a polymer follows an Arrhenius-type
temperature-dependence [Lee et al. (2007); Bird et al. (2002)]
𝐷 = 𝐷0 ∙ 𝑒𝑥𝑝 −∆𝐸𝐷/𝑅𝑔𝑇 (2-1)
where 𝐷0 is the maximum diffusion coefficient (at infinite temperature), ∆𝐸𝐷 is the activation
energy for diffusion, 𝑅𝑔 is the molar gas constant, and T is the absolute temperature. For
example, the typical diffusivity of CO2 and N2 in a thermoplastic at 200oC is 10
-6 cm
2/s, and that
at room temperature is 10-8
cm2/s [Bird et al. (2002)]. The much higher diffusivity at processing
temperatures facilitates formation of the polymer/BA solution in the extruder. The diffusivity
also depends on the type of blowing agent. In general, a BA with a lower molecular weight
exhibits higher diffusivity under the same temperature and pressure. This characteristic has
caused the cell nucleation and growth kinetics of CO2 and N2 to be much higher than those of
CFC blowing agents, making CO2 and N2 foaming more difficult to control.
C. Convective Diffusion and Convective Cooling
Convective diffusion and cooling are important characteristics of the microcellular
processing in this study, and they are briefly reviewed here. During microcellular processing, the
two-phase polymer/BA mixture evolves into a single-phase solution through gas diffusion under
elevated temperature and pressure. Before delivering the solution to the foaming element, usually
a die or a mold, the solution has to be cooled to achieve temperature uniformity and to increase

14
melt strength. Both mass transfer by molecular diffusion and heat transfer by conduction are very
slow processes when they occur in polymer melts under laminar flow conditions [Tadmor and
Klein (1970)]. Park and Suh (1996) demonstrated that convective flows can accelerate both
processes, thereby enabling microcellular processing to attain industrial efficiency. According to
mixing theory, convective flows bring fluid particles with a lower BA concentration or a lower
temperature into contact with particles with a higher BA concentration or a higher temperature,
thereby accelerating diffusion and cooling by inducing higher concentration and temperature
gradients [Tadmor and Klein (1970)].
Convective flows, i.e., flows driven by the bulk motion (observable movement) of fluids,
during polymer/BA mixing are induced by mixing sections on the plasticating screw, as
illustrated in Figure 2-2. A characteristic time 𝑡𝐷 to dissolve the BA completely [Tadmor and
Klein (1970)] is
𝑡𝐷 =𝑙𝐷
2
𝐷 (2-2)
where 𝑙𝐷 is the striation thickness, the average distance between two adjacent BA bubble
surfaces, and 𝐷 is the diffusion coefficient introduced in Equation (2-1). This time has been
estimated as 50 μm during typical extrusion processing [Park and Suh (1996)], and the time
needed to dissolve the BA in this case is only 20 s, giving rise to very high mixing efficiency.
Convective flows during cooling are induced by a second extruder with a cooling screw
and/or a heat exchanger containing static mixers, the latter being illustrated in Figure 2-3. Unlike
the mixing sections on the first plasticating screw, which induces mixing in the axial and circular
direction, the cooling screw and the static mixers induce mixing in the radial direction, cooling
the melt by keeping the extruder barrel at a low temperature. Because static mixers generate
pressure drops, they are usually used in systems with relatively low flow rates. In this thesis, the
processing systems are designed to induce both convective diffusion and convective cooling.
Details of the systems will be presented in Chapters 3.

15
Figure 2-2 Mixing elements on the plasticating screw

16
Figure 2-3 Schematic of heat exchanger containing static mixers used in foam extrusion

17
2.1.3 Microcellular Foam Processing - Cell Nucleation and Growth
A. Thermodynamics of Cell Nucleation
As illustrated in Figure 1-1(b), phase separation occurs when the BA becomes
supersaturated in the melt, usually as the result of a quick pressure drop. The excess amount of
BA diffuses out of the melt mainly through cell nucleation and growth. According to the
classical nucleation theory, an excess Gibbs free energy has to be exceeded in order to create the
bulk (bubble) phase and the bubble surface [Colton and Suh (1987)]
∆𝐺 = −𝑉𝑏 ∙ ∆𝐺𝑉 + 𝐴 ∙ 𝜍 (2-3)
where 𝑉𝑏 is the initial volume of the bubble, ∆𝐺𝑉 is the free energy difference between the
bubble phase and the polymer phase, A is the interfacial area (bubble surface area), and σ is the
surface tension. If the bubble is generated from a single homogeneous phase without impurity or
dirt, the process is called homogeneous nucleation. This is rarely the case, however, because
most polymers contain additives or impurities. If bubbles are formed at solid/liquid interface,
e.g., at the surface of foreign particles, the process is called heterogeneous nucleation.
For homogeneous nucleation into spherical bubbles, Equation (2-3) can be rewritten as
∆𝐺 = −4
3𝜋𝑟3 ∙ ∆𝑃 + 4𝜋𝑟2𝜍 (2-4)
where ∆𝑃 = 𝑃𝑠𝑜𝑙 − 𝑃𝑠 is the difference between the solubility pressure, i.e., the pressure required
to prevent phase separation, and the system pressure, i.e., the pressure sensed by a transducer,
and r is the initial bubble radius. The relationship between ∆𝐺 and r is plotted in Figure 2-4. It
suggests that in order for a bubble to grow larger, it has to exceed a critical radius 𝑟∗ =
𝑟 𝜕∆𝐺
𝜕𝑟=0
=2𝜍
∆𝑃. The free energy needed to form this critical nucleus is
∆𝐺𝑜𝑚∗ =
16𝜋𝜍3
3∆𝑃2 (2-5)
The nucleation rate, the number of bubbles formed per unit time, can also be calculated
following classical nucleation theory [Colton and Suh (1987)]
𝑁𝑜𝑚 = 𝐶𝑜𝑚 𝑓𝑜𝑚 ∙ 𝑒𝑥𝑝 −∆𝐺𝑜𝑚∗ /𝑘𝐵𝑇 (2-6)

18
Figure 2-4 Free energy of forming bubble from supersaturated polymer melt

19
where 𝐶𝑜𝑚 and 𝑓𝑜𝑚 relate to the kinetics of gas diffusion, 𝑘𝐵 is the Boltzmann‟s constant, and
T is the temperature. It is worth noting that if the rate of pressure drop is increased, such that ∆𝑃
becomes larger, the free energy to form bubbles will decrease, the cell nucleation rate will
increase, and the average cell size will decrease accordingly. This explains why pressure drop
rate is closely related to the cell morphology during microcellular processing.
The more common type of nucleation in a polymer melt is, however, heterogeneous
nucleation. Here the free energy barrier may be significantly reduced if the bubble is formed at a
solid/liquid interface. As illustrated in Figure 2-5, for a flat solid surface and a wetting angle of θ
for the liquid phase, the free energy barrier, Equation (2-3), is now a function of θ. The
nucleation rate in this case takes on a form similar to that of homogeneous nucleation [Ramesh et
al. (1994a) and (1994b)]
∆𝐺𝑒𝑡∗ = ∆𝐺𝑜𝑚
∗ ∙ 𝑓 𝜃 =16𝜋𝜍3
3∆𝑃2 ∙ 1
4 2 + 𝑐𝑜𝑠𝜃 1 − 𝑐𝑜𝑠𝜃 2 (2-7)
𝑁𝑒𝑡 = 𝐶𝑒𝑡𝑓𝑒𝑡 ∙ 𝑒𝑥𝑝 −∆𝐺𝑒𝑡∗ /𝑘𝐵𝑇 (2-8)
The free energy barrier can be further reduced if the solid surface has cavities. Many
types of solid particles have been used as nucleating agents during foam processing, talc being
the most common choice, and the search for the “ideal” nucleating agent is likely to continue
[Lee & Ramesh (2004); Spitael et al. (2004)].
B. Cell Growth and Stabilization
Once nucleated, cells continue to grow until they are either stabilized by cooling or
ruptured by overstretching. The growth process is very complicated because many variables
influence the polymer‟s rheological response to the deformation induced by expansion. With
amorphous polymers, as an example: first, when BA dissolves in the melt, it reduces both its
viscosity and its elasticity; secondly, as the BA bubbles grow, gas diffusion and expansion
induce cooling and polymer viscoelasticity increases due to the loss of BA; thirdly, the bubble
growth rate changes over time, again influencing the transient rheology of the polymer melt; and
finally, cell growth continues until the polymer reaches its 𝑇𝑔 or when the melt reaches its

20
Figure 2-5 Surface force balance for a heterogeneously nucleated bubble, where θ is the wetting
angle and σ is the surface tension

21
stretching limit, causing cell wall opening or cell coalescence.
Much effort has been expended to model cell growth. The models have evolved from a
single bubble surrounded by fluid with an infinite amount of BA available for its growth [Barlow
& Langlois (1962); Street (1968)] to the more recent “cell models” in which the melt is divided
into unit cells of equal and constant mass, each one consisting of a liquid envelope surrounding a
single bubble [Amon and Denson (1984), (1986)]. The cell model will be discussed in relation to
actual processing in Section 2.3.
2.2 Rheometry of Polymer Melts and Polymer/BA Solutions
2.2.1 Shear Rheometry of Polymer/BA Solutions
It is well known that the dissolution of a small amount of low-molecular-weight blowing
agent can reduce the viscosity of a polymer melt significantly [Ferry (1980)]. In this section we
review customized drag-driven and pressure-driven rheometers developed to measure
polymer/BA solution viscosity under sufficiently high pressures.
Drag-driven rheometers usually operate at low shear rates, because several types of flow
instability occur for viscoelastic fluids at even modest shear stresses and rates [Macosko (1994)].
Royer et al. (2002) developed a magnetically levitated sphere rheometer to study the viscosity of
a PDMS/CO2 solution. More recently, Wingert et al. (2009) determined the viscosity of a
PS/CO2 solution using a pressurized Couette viscometer. The maximum shear rate was 0.5 s-1
for
both rheometers. The most successful drag-driven rheometer has been the high pressure sliding
plate rheometer developed by Park and Dealy (2006). It shears a polymer film between two
parallel plates in a BA-pressurized chamber. The solution viscosities of HDPE/CO2 and
HDPE/N2 were determined over a wide ranges in pressure (0 to 50 MPa), in BA concentration (0%
to 25% by weight), and in shear rates (0.1 to 100 s-1
).
In general, a drag-driven rheometer requires a small amount of polymer, and, unlike a
pressure-driven rheometer, the stress and the strain rate are uniformly distributed over the sample.
The drag-driven devices have several limitations, however, which have prevented them from
widespread use. First, they require a long saturation time before measurement can start, because

22
the BA diffuses slowly into the melt in the pressure chamber, and reaching equilibrium can take
hours [Park and Dealy (2006)]. Secondly, the BA concentration has to be determined from a
separate solubility measurement, which takes time and is subject to error. Finally, many drag-
driven rheometers require the signals (torque, force, and displacement) to be transferred under
pressure through a dynamic seal, which may introduce serious errors. The last limitation has
been solved, at least partially, using magnetic signal transmissions or, in the case of sliding plate
rheometer, using local shear stress transducers.
Contrary to drag-driven rheometers, pressure-driven ones are ideal for high-shear-rate
measurements. According to a review by Tomasko et al. (2003), these rheometers fall into two
categories: in-house rheometers and customized commercial ones. Rheometers of the first
category usually consist of an extruder for generating a single-phase solution, a die at the
extruder exit for measuring pressure drops, and a regulator at the die exit for keeping the channel
pressure high (see Figure 2-6). Different types of extruders have been used to generate solutions.
These include single-screw extruders [Han and Ma (1983a) and (1983b); Lee et al. (1999) &
(2000); Royer et al. (2000) & (2001); Areerat et al. (2002)], tandem systems [Ladin et al.
(2001)], and twin-screw systems [Elkovitch et al. (1999), (2000), and (2001)]. The second
category includes customized capillary rheometers with high pressure seals [Gerhardt et al.
(1997) & (1998); Kwag et al. (1999) & (2001)] and a gear-pump driven online rheometer used
by Gendron et al. (1996), (1997), and (1998). The gear pump rheometer is useful in industry
because measurements can be performed at any time by sampling the melt stream, without
affecting the ongoing production.
Overall, pressure-driven techniques are convenient and reliable means of determining
viscosity. In particular, when a rectangular channel with a high aspect ratio is used, pressure
transducers can be flush mounted on the channel wall to eliminate pressure errors [Macosko
(1994)]. The BA concentration is also easily controlled by a gas pump. Pressure-driven
rheometers also suffer from several limitations: One limitation is a potentially-large temperature
gradient in the flow channels, caused by poor mixing or viscous heating, which may affect the
accuracy of data; another limitation is the shear history of the fluid preceding pressure
measurement; and finally, the variation of pressure along the flow channel makes measurement
at controlled pressure impossible. In spite of these limitations, pressure-driven rheometers
determine viscosity under conditions similar to those in processing, and are therefore chosen in

23
Figure 2-6 Schematic of an extruder setup for measuring PS/CO2 solution viscosity; reproduced
from Lee et al. (1999).

24
this thesis to characterize the viscous resistance.
2.2.2 Extensional Rheometry Involving Shear-Free Flows
Extensional properties of polymer melts and polymer solutions play a dominant role in
several processing techniques, including fiber spinning, film blowing, blow molding, and foam
processing. Despite their importance, few extensional properties are available compared to shear
properties, because controlling shear-free flows, like those prescribed by Equation (1-3), are very
difficult. When solid boundaries are used to control the flow, shear is introduced, which makes it
difficult to extract extensional properties [Macosko (1994)]. In this section, we briefly review
shear-free techniques. Techniques involving mixed flows will be reviewed in Section 2.2.3.
Perhaps the most versatile and accurate shear-free technique is achieved using a rotary
clamp device, such as those described in Meissner (1987) and Meissner and Hostettler (1994).
These devices can generate the major types of elongational flows, i.e., uniaxial, planar, and
biaxial flows, as well as combinations of the major types. Two possible configurations of the
rotary clamp devices, for measuring planar and biaxial extensional viscosities, are shown in
Figure 2-7. A constant strain rate is maintained by rotating the clamps at a constant speed, and
the type of elongation is determined by the clamps‟ geometrical arrangement. Extensional
viscosities are calculated from the stresses sensed at the clamps.
The rotary clamp devices, however, involve complicated designs, and are incapable of
generating extensional rates above 0.5 s-1
, except for uniaxial extension. Temperature control is
also difficult because a large sample is necessary. Recently, Sentmanat (2003) and (2004)
developed a compact shear-free fixture, called the Sentmanat Extensional Rheometer (SER) that
can be mounted on commercially available rotational rheometers. Two counter-rotating windup
drums replace the rotary clamps, and both constant and variable uniaxial extensional rates can be
induced by programming the rotation rate of the drums. The viscosity data from the SER was
found to agree well with that from the rotary clamp devices [Sentmanat et al. (2005)]. In this
study, a device similar to the SER will be used to determine the uniaxial extensional viscosity of
polymer melt without BA. Details of the device will be presented in Chapter 4.
25
(a)
(b)
Figure 2-7 Rotary clamp rheometers for measuring: (a) planar extensional viscosity; (b) biaxial
extensional viscosity; reproduced from Meissner (1987).

26
Instead of stretching a polymer sample, a shear-free flow can also be induced in a
squeeze-film flow. The sample ends are usually lubricated with a lower viscosity liquid to
eliminate shearing during compression, and the resultant devices are called lubricated squeezing
rheometers [Chatraei et al. (1981)]. Biaxial extensional viscosity has been determined by radial
flow, and planar extensional viscosity has been determined by keeping one dimension of the
sample constant. It was found that strain hardening during planar or biaxial extension is weaker
than that during uniaxial extension. Measurements could not be made under extensional rates
above 1 s-1
or Hencky strains above 1, however, because of the loss of lubricant [Macosko
(1994)].
2.2.3 Extensional Rheometry Involving Mixed Flows
Although shear-free rheometers allow measurement of the true extensional viscosity, they
may not be the most relevant devices for studying foam processing. In the first place, shear-free
devices cannot generally achieve industry-relevant extensional rates, usually of order 1 𝑠−1 ;
secondly, polymer/BA solutions cannot be measured on a shear-free rheometer because the BA
evaporates; and finally, during processing, both shearing and extension are present, and it is of
interest to study material rheological responses under mixed flow conditions. One technique to
overcome the limitations of shear-free devices is to determine extensional properties from
entrance pressure drops.
When a viscoelastic fluid flows internally from a large cross section to a smaller one, the
streamlines converge, producing an extensional flow. Because extensional stresses are produced,
an entrance pressure drop ∆𝑃𝑒𝑛 is necessary. The entrance pressure drop, though, is not uniquely
determined by the extensional flow component, because the shear component, caused by the
channel walls, also affects the velocity and stress distributions.
Flow through a sudden contraction is illustrated in Figure 2-8. The flow progresses from
being fully developed at some distance upstream from the contraction to being almost (e.g.,
98%) fully developed a distance 𝐿𝑒 downstream. Depending on the Reynolds number of the flow
and the characteristics of the fluid, a secondary-flow vortex may be present in the corner of the
upstream channel. In Figure 2-8, the Hencky strain is 𝐷𝑢/𝐷𝑑 2 for axisymmetric contraction

27
Figure 2-8 Basic elements of an entry flow for flow from a large tube through an abrupt entry
into a small tube. The illustration applies to both axisymmetric contraction and planar
contraction; reproduced from Boger (1987)

28
and 𝐷𝑢 /𝐷𝑑 for planar contraction. The extensional rate, then, is related to both the flow rate and
the channel cross section. A “better” design of the flow channel, a hyperbolic convergent
channel, has been proposed for extensional measurement [Kim et al. (1994)]. With this shape,
vortices are minimized or nonexistent, and a constant extensional rate is induced along the
centreline and in the region around it. Accounting for the shear stress, though, is not
straightforward, and previous studies simply assumed shear-free flow in the channel [Feigl et al.
(2003)]. For a planar hyperbolic channel, generating an adequate pressure drop due to extension
has been difficult, because a large aspect ratio is required to induce a two-dimensional flow. This
leads to low extensional rates, and hence weak strain hardening of the fluid, because the flow
rates of lab-scale experiments are usually limited [Kim et al. (1994)].
Two widely used analyses for estimating extensional viscosity from measurements
of ∆𝑃𝑒𝑛 are those by Cogswell (1972) and Binding (1988). Both analyses assume that ∆𝑃𝑒𝑛 can
be separated into shear and extensional components, that velocity distribution is determined by
shearing only, and that, in the case of a sudden contraction, the vortex size is determined by
minimizing pressure drop over the contraction. For a planar contraction, Cogswell calculated the
stresses and the vortex size by applying a simple force balance on an elemental wedge and
minimizing the sum of elemental pressure drops along the contraction. From his analysis, the
average extensional rate is [Macosko (1994)]
𝜀 =𝜏𝑤 ∙𝛾 𝑎
3∙ 𝜏11−𝜏22 (2-9)
where 𝜏𝑤 and 𝛾 𝑎 are the wall shear stress and the apparent shear rate in the downstream channel,
repectively. The apparent planar extensional viscosity is calculated from the normal stress 𝜏11 −
𝜏22 and the average extensional rate 𝜀
𝜂𝑃,𝑎𝑝𝑝 =𝜏11 −𝜏22
𝜀 =
1
2∙𝜀 𝑛 + 1 ∙ ∆𝑃𝑒𝑛 (2-10)
where n is the non-Newtonian index in the power law model.
Binding (1988) calculated the stresses and the vortex size for a sudden contraction by
applying energy balance and minimizing the energy consumption. Interestingly, Cogswell‟s and

29
Binding‟s approaches are related, and it has been shown that both analyses predict the same
values of apparent extensional viscosities [Tremblay (1989)]
2.3 Relationship between Cell Growth and Rheological Properties
Section 2.1.3 B briefly explains the relationship between cell growth and the rheological
properties of polymer/BA mixture. To be more specific, cell growth is driven by the pressure
difference between the cell and its surrounding, as a result of both BA diffusion into the cell
(diffusion-driven growth) and the decrease of system pressure (pressure-driven growth) [Amon
and Denson (1984)]. The dynamics of cell growth, then, is related to both this pressure difference
and the rheological properties of the polymer/BA mixture. A quantitative understanding of this
relationship not only allows cell growth to be controlled, thereby inducing desired cell
morphology, but also yields information about the type, rate, and strain of deformation relevant
to foaming, which is critical to the optimization of the chemical structure and composition of
foaming polymers. Information about cell growth comes from either theoretical modeling,
usually using the cell model [Amon and Denson (1984), (1986)], or from direct observation of
cell growth [Guo et al. (2006)]. In this section, we briefly review the results from these two
approaches and from previous studies aimed at relating material rheological properties to the
final cell morphology.
According to the cell model (Figure 2-9), each cell is surrounded by an envelope of melt,
of which the volume is inversely proportional to the cell density. The time-dependent momentum
balance near the cell surface is [Amon and Denson (1984)]
𝑃𝑔 𝑡 − 𝑃𝑠 𝑡 −2𝜍
𝑅 𝑡 + 2 ∙
𝜏𝑟𝑟 −𝜏𝜃𝜃 𝑡
𝑟
𝑅𝑠 𝑡
𝑅 𝑡 ∙ 𝑑𝑟 = 0 (2-11)
where 𝑃𝑔 𝑡 = 𝐶𝑅 𝑡 /𝑘𝐻 is the bubble pressure, with 𝐶𝑅 𝑡 being the BA concentration at cell
surface and 𝑘𝐻 the Henry‟s Law constant; 𝑃𝑠 𝑡 is the system pressure, the pressure measured by
a transducer; 𝜍 is the surface tension, usually negligible in calculation; 𝑅 𝑡 is the bubble
radius, 𝑅𝑠 𝑡 is the radius of the outer envelope, and 𝜏𝑟𝑟 − 𝜏𝜃𝜃 is the normal stress difference in
the melt.

30
Figure 2-9 Distribution of BA concentration in the surrounding of an expanding cell (a gas
bubble), as described by the cell model; 𝑐 𝑟, 𝑡 is the BA concentration, 𝑐𝑅 𝑡 is the BA
concentration at cell surface, 𝑃𝑔 𝑡 is the cell pressure, 𝑘𝐻 is Henry‟s Law constant, 𝑅 𝑡 is the
cell radius, and 𝑅𝑠 𝑡 is the outer radius of the melt envelope [Amon and Denson (1984)]

31
When a proper constitutive equation is chosen, Equation (2-11) allows the calculation of
cell growth rate and stress distribution from basic physical properties of the polymer/BA mixture,
such as the viscosity, the relaxation time, and the diffusivity of the BA. The calculated values
have been compared to experimentally observed cell growth rate, and the two were found to
agree reasonably [Leung et al. (2006)]. For typical processing conditions, the extensional rate
reaches a maximum following cell nucleation, usually of order 𝑂 10 𝑠−1 , and then slows down
monotonically due to strain hardening or cooling of the melt and decreased pressure difference at
the cell surface.
The Hencky strain at cell surface is obtained by integrating extensional rate over time
𝜀𝐻 = 𝜀 𝑅 𝑡 ∙ 𝑑𝑡𝑡
0= −𝑙𝑛
𝑅 𝑡
𝑅0 (2-12)
where R0 is the initial bubble radius, usually between 0.1 μm and 10 μm [Leung et al. (2006)].
The Hencky strain increases with the expansion ratio of the foams, and usually ranges between 2
and 6. Such strain can induce significant hardening in branched polymers and rupture of the melt
for both linear and branched polymers [McKinley and Hassager (1999)].
The above information about cell growth has been used in the literature to select or
synthesize polymers with optimized rheological properties for foaming. Most of these studies
focused on polypropylene, because of both the commercial value of PP foams and the
(undesirable) low cell density and low expansion ratio associated with conventional linear PP.
Park and Cheung (1997) and Naguib et al. (2002) used a long-chain-branching polypropylene
(LCB-PP), which exhibits significant strain hardening under extension, and demonstrated much
higher cell density and expansion ratio during foam extrusion compared to linear PP. Similar
results were obtained by Michaeli et al. (2004). All three studies attributed the better foaming
behaviour of branched PP to its higher melt strength and reduced cell coalescence during the
early stage of cell growth. Recently, Spitael & Macosko (2004) and Stange & Münstedt (2006)
characterized the uniaxial extensional viscosities of a series of linear PPs, LCB-PPs, and their
blends at conditions relevant to foaming, and attempted to relate rheological properties to cell
morphology. Besides showing that long chain branching suppresses cell coalescence, they found
that even a small amount of LCB-PP (e.g., 10% by weight) in the blend can improve the
expansion and reduce the cell opening of linear PP. Stange & Münstedt attributed the higher

32
volume expansion of LCB-PP and blends containing LCB-PP to their higher strains at rupture
and their more uniform deformation during extension compared to linear PP. The maximum
expansion ratio achieved by Stange & Münstedt, however, was only 3 times, and the associated
Hencky strain was relatively low. Spitael & Macosko were able to produce high-expansion-ratio
PP foams and induce high strain in the melt, but they did not find any direct correlation between
strain hardening and cell density or expansion ratio. The conclusions regarding linear PP and
LCB-PP still need to be confirmed for other polymers, because the interaction between the
polymer and the blowing agent can be very different. A detailed discussion of these issues is
found in Chapter 5.
2.4 Objectives of the Thesis
The objectives of this thesis are:
(1) To determine experimentally the rheological properties, especially extensional properties,
of a polymer melt and its BA solution. The rheological properties of the fluids will be
determined on various commercial rheometers, and the properties of polymer/BA
solution will be determined on an in-house rheometer by measuring pressure drop over
well-defined flow channels. Data from the two types of rheometers will be compared to
validate the in-house technique, and the influence of BA on the rheological properties
will be studied.
(2) To investigate the relationship between polymer rheological properties, especially
extensional property, and cell morphology, including cell size, cell density, volume
expansion, and cell opening. As mentioned in Section 1.5, a polymer other than
polypropylene will be used, and both linear and branched structures will be studied. The
results will be compared to those for polypropylene in the literature, and general
conclusions will be attempted.

33
Chapter 3 Characterization of the Shear Properties
This chapter describes a technique for determining the rheological properties of a
polymer melt and a polymer/blowing agent solution. The technique is based on measuring
pressure drops in a high-aspect-ratio straight rectangular channel for determining the shear
viscosity, and in a thin convergent rectangular channel with a hyperbolic shape for determining
extensional viscosity with the pressure drop due to shearing accounted for. For both the shear
and the extensional viscosities, channel values for the polymer alone will first be compared to
values from commercial rheometers. Then the technique will be utilized to determine the
corresponding rheological properties of a polymer/BA solution. This chapter describes
measurement of the shear viscosities, while determination of the extensional viscosity will be
presented in Chapter 4. For the shear viscosities, channel data of the polymer alone will be
compared to data from a commercial rotational rheometer and a commercial capillary rheometer.
The viscosity of the polymer/BA solution will be found from channel data, and will be compared
to previous measurements and predictions by the free volume theory.
3.1 EXPERIMENTAL
3.1.1 The Hele-Shaw Channels
The term „Hele-Shaw‟ is normally associated with slow flow of a Newtonian fluid
through a narrow gap between two parallel plates (a Hele-Shaw cell) [Batchelor (2000)]. In this
study, the term still refers to slow flow through a thin channel but the fluids will be viscoelastic.
Two dies were made with the same shape, which is illustrated in Figure 3-1, and different
thicknesses. The inlet section of each die is a three-dimensional wedge-shaped diffuser that
distributes tube flow to rectangular flow evenly. The subsequent Hele-Shaw section consists of a
high-aspect-ratio straight channel followed by a hyperbolic channel. The channel shape was
machined out of a metal insert to a specific depth, and the insert was then bonded to a flat plate
to create a channel with a rectangular cross section everywhere. The profile of the hyperbolic
channel, given by Equation (3-1), subjects a Newtonian fluid to a constant rate of extension near
the centreline [Kim et al. (1994)]

34
Figure 3-1 The two test dies. The circles indicate the diaphragms of the pressure transducers.
The dimensions are: 𝐵0 = 30 𝑚𝑚, 𝐵1 = 3 𝑚𝑚, 𝐿0 = 20 𝑚𝑚, 𝐿1 = 5 𝑚𝑚, 𝐿2 = 20 𝑚𝑚. The
depth H (into the page) is 𝐻 = 0.94 𝑚𝑚 or 1.96 𝑚𝑚. and –𝐻
2< 𝑧 <
𝐻
2
B0
L0
L2 L1
B1
Flow x
y
z
B(x)
ΔP shear ΔP convergent

35
𝐵 𝑥 = 1
𝐵0+
1
𝐵1−
1
𝐵0 ∙
𝑥
𝐿2
−1
, 0 ≤ 𝑥 ≤ 𝐿2 (3-1)
The dimensions in Figure 3-1 indicate that the aspect ratios of the straight sections were
32 and 15.3. The convergent section varied in width from 30 mm at the inlet to 3 mm at the
outlet, so that the contraction ratio was 10:1. The channel depths (or thicknesses) were 0.94 mm
and 1.96 mm. As indicated by the figure, two pressure transducers (PT462E-M10, Dynisco Inc.)
were flush-mounted along the centreline of the straight channel. A third transducer was installed
in the downstream reservoir immediately after the die exit. The pressure drop between the first
two transducers (∆𝑃𝑠𝑒𝑎𝑟 ) is caused by shear only, while the pressure drop between the second
and the third transducers (∆𝑃𝑐𝑜𝑛𝑣𝑒𝑟𝑔𝑒𝑛𝑡 ) is caused by both shear and extension. The three
transducers were calibrated at a representative processing temperature using a dead-weight tester
(M2800/3, Druck Inc.). Detailed design of the die (CAD drawing) can be found in the Appendix
of this thesis. While the Hele-Shaw channel was designed for rheological purposes, the channel
shape is not unrelated to the world of polymer processing; that is, the geometry is similar to the
shape of many injection molds and bears a close resemblance to annular and sheet extrusion dies.
3.1.2 The Processing System
Measurements with the Hele-Shaw channels were conducted on a tandem extrusion
system, shown in Figure 3-2, the type commonly used for foam processing [Lee et al. (2007)].
The system consists of a 0.75”-diameter plasticating extruder with a mixing screw, a 1.5"-
diameter extruder with a cooling screw, a syringe pump for injecting the blowing agent, a gear
pump, and a heat exchanger containing homogenizing static mixers. The first extruder plasticates
the polymer resin and disperses the blowing agent into the polymer melt. The mixing section on
the plasticating screw is already illustrated in Figure 2-2. The gear pump controls the flow rate,
independent of temperature and pressure. The second extruder provides further mixing and initial
cooling of the melt, and the heat exchanger, the design of which is already shown in Figure 2-3,
removes the remaining heat for testing at a particular temperature. The Hele-Shaw channel is
attached to the exit of the heat exchanger. Following the channel is a reservoir where the
pressure – the „back pressure‟ – is controlled by a valve. With the valve, a constant average
pressure can be maintained in the channel during flow measurements, so that the known effect of

36
Figure 3-2 Schematic of the tandem extrusion system [Ladin et al. (2001)]
firstextruder
second extruder
syringegaspump
gear pump
Hele-Shawchannel
pressure transducers
valve
heat exchanger
PS
CO2
ΔPshear ΔPconvergent
reservoir

37
pressure on the viscosity becomes negligible. The mass flow rate was found by collecting a
sample at the valve exit over a known time and weighing it. For all experiments, flow data were
not recorded until a steady state had been reached, typically in 10 to 20 minutes.
3.2 Properties of the Polymer and the Polymer/Blowing Agent Solution
3.2.1 General Physical Properties
The polymer was a general-purpose polystyrene from Dow Chemical Inc. (grade Styron
685D, 𝑇𝑔 = 100𝑜𝐶, 𝑀𝐹𝐼 = 1.5 𝑔/𝑚𝑖𝑛, 𝑀𝑛 = 120,000 𝑔/𝑚𝑜𝑙, 𝑀𝑊/𝑀𝑁 = 2.6, and no mineral
oil content), a polymer commonly used for foam processing. The blowing agent was CO2 of 99%
purity from BOC Inc. The concentration of CO2 in the PS was 5% by weight, a typical value in
industrial processes. Melt and solution densities depend on pressure, temperature as well as on
CO2 concentration, and values at two representative temperatures are presented in Figure 3-3.
The data were determined from PVT measurements of a PS droplet in a CO2-pressurized
chamber [Li (2008)]. The plot shows the melt density varying little with temperature and
pressure, and the solution density by no more than 10%. Consequently, a constant density of 1.0
g/cc was assumed for both materials in the calculations which follow. According to solubility
measurements using a CO2-pressurized magnetic suspension balance [Li et al. (2004)], the
minimum pressure to dissolve CO2 in polystyrene is 1650 psi at 150oC and 1850 psi at 190
oC.
Pressures higher than these were maintained throughout the tandem system to prevent phase
separation. The zero-shear-rate viscosity of the polystyrene was measured before and after
processing. No difference was found, indicating that shear degradation in the tandem system was
negligible. Samples collected at the exit of the thinner (𝐻 = 0.94 𝑚𝑚) Hele-Shaw channel at a
low processing temperature (172oC) showed little melt fracture. Consequently, no slip at the
boundary was assumed to hold, at least approximately. Nucleating agents, often used in foaming,
were not used in this study.

38
0 1000 2000
0.88
0.90
0.92
0.94
0.96
0.98
1.00
1.02
De
nsity (
g/c
m3
)
Pressure (psi)
Melt and solution
density
150oC, PS
200oC, PS
150oC, PS/CO
2
200oC, PS/CO
2
Figure 3-3 Density of polystyrene and polystyrene/CO2 solution; Extracted from Li (2008)

39
3.2.2 Rheological Properties Using Commercial Rheometers
A. Shear Properties
Shear properties of the polystyrene were determined using several commercial
rheometers. Oscillatory shear and low-shear-rate data were obtained with an ARES rheometer
(TA Instruments Inc.) using 25-mm parallel disks and a 0.8-mm gap. For high shear rates,
viscosity values were determined using a twin-bore capillary rheometer (RH2000, Malvern Inc.).
For this device, melts were extruded through a 1-mm diameter, zero length capillary die and a 1-
mm diameter, 20-mm long capillary die at the same time. The pressure drop over the zero length
die is subtracted from that over the long die to account for entrance and exit pressure drops. The
remaining pressure drop over the long die is due to shearing alone, and allows the shear viscosity
to be calculated. The obtained viscosity data will be presented in Section 3.3, along with data
from the Hele-Shaw channels.
The linear viscoelastic properties, 𝐺 ′ and 𝐺", were measured at several temperatures, and
a single characteristic relaxation time was determined for each temperature from the crossover
point. This relationship between the moduli and this relaxation time may be derived from
Macosko (1994, pp. 124) by equating Equation (3.3.31) with (3.3.32) there and setting k=1. The
relaxation times, given in Table 3-1, were generally longer than 1 s, indicating a highly elastic
material.
Table 3-1 Relaxation times of PS685D, based on oscillatory shear data
Temperature (oC) 172 190 210
Relaxation time λ (s) 18.1 3.3 0.83
B. First Normal Stress in Shearing and Exit Pressure
In Chapter 4, it will be shown that the pressure drop in the hyperbolic channel in Figure
3-1 depends on the pressure at the exit, but the pressure there is different from that measured in
the downstream reservoir. The difference is the exit pressure (∆𝑃𝑒𝑥 ), and the only way of
estimating is to use the first normal stress difference N1 [see, e.g., Macosko (1994)]. However,

40
N1 could not be measured above about 1 s-1
, which was far below the channel shear rates,
because of edge failure. Instead N1 was estimated using, at low shear rate, the relation 𝑁1 𝜔 =
2 ∙ 𝐺 ′ 𝜔 , where 𝐺 ′ 𝜔 is the storage modulus, and, at high shear rate, Gleissle‟s correlation
[Macosko (1994)],
𝑁1 𝛾 ∗ = 2 ∙ 𝛾 ∗2 ∙ 𝑑𝜂
𝛾
𝛾 ∗
0 , where 𝛾 ∗ = 2.5 ∙ 𝛾 (3-2)
The two sets of data are presented in Figure 3-4(a), for one of the test temperatures. There
is a mismatch of 20%, which is similar to data for other melts [Macosko (1994)].
The exit pressure (∆𝑃𝑒𝑥 ) was then estimated from N1 by inverting the following relation
[Davies et al. (1973)]
𝑁1 = ∆𝑃𝑒𝑥 + 𝜏𝑤 ∙𝜕∆𝑃𝑒𝑥
𝜕𝜏𝜔=
𝜕 𝜏𝑤 ∙∆𝑃𝑒𝑥
𝜕𝜏𝑤 (3-3)
to yield
∆𝑃𝑒𝑥 𝛾 =1
𝜏𝑤 𝛾 ∙ 𝑁1 𝛾 ∙ 𝑑𝜏𝑤 𝛾
𝛾
0 (3-4)
where 𝜏𝑤 = 𝜂 ∙ 𝛾 𝑤 is the wall shear stress at the channel exit. Values of ∆𝑃𝑒𝑥 were determined
this way at several temperatures, and they are presented in Figure 3-4(b) as a function of the wall
shear rate 𝛾 𝑤 .
3.3 Shear Viscosity of Polystyrene Alone
3.3.1 Calculating the Viscosity
The pressure loss in the straight section of the Hele-Shaw channel is determined by the
fluid‟s viscosity, and thus it should be possible to calculate this property from pressure drop data.
In this section, we present the method to calculate the viscosity and then compare computed
values to those measured with commercial rheometers.
Our calculation method depends on channel dimensions and on measurements of pressure
drop and flow rate, and follows Laun (1983)

41
10-2
10-1
100
101
102
103
104
105
106
N1 = 2 * G'()
parallel plate, oscillatory measurement
using known shear viscosity at 172oC
capillary, Glessisle's correlation
First
no
rma
l str
ess d
iffe
ren
ce
N1 (
Pa
)
(Hz) or (s-1)
(a)
100
101
102
103
104
20
40
60
80
100
PS685D
164oC
172oC
190oC
Exit p
ressu
re d
rop
P
ex (
psi)
Wall shear rate at die exit w (s
-1)
(b)
Figure 3-4 (a) Estimates of the first normal stress difference in shearing for the PS at 172oC; (b)
Estimated exit pressure of flows in the Hele-Shaw channels at several temperatures

42
𝜏𝑤 = ∆𝑃
𝐿0∙
𝐻
1+𝐻/𝐵 (3-5)
𝛾 𝑤 = 6∙𝑄
𝐵0∙𝐻2∙
2+𝑏
3 , where 𝑏 =
𝑑 𝑙𝑜𝑔 6𝑄/𝐵0𝐻2
𝑑 𝑙𝑜𝑔 𝜏𝑤 (3-6)
𝜂 = 𝜏𝑤 /𝛾 𝑤 (3-7)
where ∆𝑃 is the pressure difference between the first two transducers in Figure 3-1, 𝜏𝑤 is the
wall shear stress, 𝛾 𝑤 is the corrected wall shear rate, η is the (shear) viscosity, and Q is the
volumetric flow rate. The aspect ratio of the straight channel is accounted for in Equation (3-5)
by the term 1 + 𝐻/𝐵, but was ignored in Equation (3-6) because an explicit expression for it is
not available [Laun (1983)]. The resultant error is negligible because these equations are only
used to calculate shear viscosity from the straight channel, which has a very high aspect ratio.
Equation (3-6) includes the Rabinowitch correction, which takes into account the wall shear rate
difference between a Newtonian fluid and a shear-thinning one [Macosko (1994)].
Viscosity values from the capillary rheometer were calculated from the pressure drop
difference between the long capillary and the zero-length capillary, as mentioned in Section 3.2.2
A. The Rabinowitch correction for tube flow was incorporated in the calculation.
3.3.2 Viscosity Data
Viscosity values from the 0.94-mm channel and those from the rheometers are presented
in Figure 3-5(a). There is a gap in the data at moderate shear rates, but the sets of data are not
inconsistent. The 210oC channel data compare well with data from the capillary rheometer.
The viscosity data were reduced to a master curve of 𝜂/𝛼𝑇 as a function of 𝛾 ∙ 𝛼𝑇 in
Figure 3-5(b), where 𝛼𝑇 is the temperature shift factor with 210oC as the reference temperature.
A shift factor is designated for each temperature such that the shifted curves agree with each
other. The master plot is well described by the Carreau-Yasuda model in Equation (3-8), using
the best-fitting parameters from Table 3-2 [Bird et al. (1987)]
𝜂−𝜂∞
𝜂0−𝜂∞= 1 + 𝜆𝛾 𝑎
𝑛−1
𝑎 (3-8)

43
10-2
10-1
100
101
102
103
104
101
102
103
104
105
106
Shear
vis
cosity (
Pa.s
)
Shear rate (s-1)
Hele-Shaw channel
H = 0.94 mm
164oC
172oC
190oC
210oC
rotational rheometer
164oC
172oC
210oC
capillary rheometer
210oC
(a)
10-2
10-1
100
101
102
103
104
105
101
102
103
104
Hele-Shaw 0.94mm
164oC
172oC
190oC
210oC
227oC
Hele-Shaw 1.96mm
164oC
172oC
190oC
210oC
227oC
Capillary Rheometer
210oC
Rotational Rheometer
210oC
/
T
T
(b)
Figure 3-5 (a) Shear viscosity data of the polystyrene from various rheometers; (b) master
plot of the shear viscosities from data in Figure 3-5(a)
fitted curve
using
Carreau-
Yasuda
model

44
The viscosity data were reduced to a master curve of 𝜂/𝛼𝑇 as a function of 𝛾 ∙ 𝛼𝑇 in
Figure 3-5(b), where 𝛼𝑇 is the temperature shift factor with 210oC as the reference temperature.
A shift factor is designated for each temperature such that the shifted curves agree with each
other. The master plot is well described by the Carreau-Yasuda model in Equation (3-8), using
the best-fitting parameters from Table 3-2 [Bird et al. (1987)]
𝜂−𝜂∞
𝜂0−𝜂∞= 1 + 𝜆𝛾 𝑎
𝑛−1
𝑎 (3-8)
Table 3-2 Best fitting parameters for the master plot of PS685D
𝜂0 (Pa.s) 𝜂∞ (Pa.s) 𝜆 (s) 𝑎 𝑛
2.5x10⁴ 0 0.566 0.5 0.158
The viscosities determined from the two Hele-Shaw channel flows are compared in
Figure 3-6. The included error bars overlap, indicating some reliability in the measurements and
in the non-simple calculation technique. The power-law index (n) at high shear rates is 0.16,
identifying a strongly shear-thinning melt. This characteristic means that, in the hyperbolic
channels, the velocity profiles are close to uniform in the core of the flows, creating large regions
of extensional flow with minimal shear, as will be shown in Chapter 4. High-shear-rate values of
the viscosity will be needed to determine the exit pressure, given by Equation (3-4) in Section
3.2.2 B, as well as to calculate the pressure drop due to shearing in the convergent channel, in
Chapter 4. The Carreau-Yasuda equation, with Table 3-2 parameters, will be used for these
calculations, along with the shift factor 𝑎𝑇 which describes temperature dependence of the
viscosity.

45
1 10 100 1000
100
1000
10000
Hele-Shaw
H = 0.94 mm
164oC
190oC
210oC
227oC
H = 1.96 mm
164oC
190oC
210oC
227oC
capillary rheometer
210oC
Vis
co
sity
(P
a.s
)
Shear rate (s-1)
Figure 3-6 Shear viscosity of polystyrene, determined from flow measurements in the Hele-
Shaw channels

46
3.4 Shear Viscosity of Polystyrene/CO2 Solution
3.4.1 Viscosity Data and Prediction by the Free Volume Theory
Having established techniques to determine the shear viscosity of the polystyrene, the
same techniques were applied to our PS/CO2 solution. For this fluid, the pressure in the system
was maintained well above the solubility pressure, so that the CO2 stayed in solution. In this
section and in Chapter 4, we will refer to CO2 as the „solvent‟ in spite of its low concentration,
because the gas has the same effect as a solvent of the polymer. That is, it reduces the viscosity
and elasticity of the melt.
The viscosity data of our PS/CO2 solution, determined at several temperatures and from
both Hele-Shaw channels, are presented in Figure 3-7(a), with PS values added for comparison
purposes. Note that the two materials are compared at the same viscosities, not at the same
temperatures, because the viscosities of the solution are so much lower than those of the
polystyrene alone that they could not be measured accurately at the same temperatures. The
viscosities of the solution at all temperatures were shifted to a master plot, following the same
procedures as described in Section 3.3.2 for PS alone. The results are shown in Figure 3-7(b),
where 172oC is the reference temperature, and which includes the previously-determined shear
viscosity of the PS alone at 172oC.
As to comparable solution viscosity data in the literature, Royer et al. (2000) determined
CO2 solution viscosity for several polystyrenes, including the present Styron 685D, and found
that the temperature dependence at a fixed CO2 concentration is well described by a modified
WLF equation in Equation (3-9)
𝑙𝑛 𝜂0,𝑇 𝐶
𝜂0,𝑇𝑔 𝐶
=−𝑐1∙ 𝑇−𝑇𝑔 𝐶
𝑐2+ 𝑇−𝑇𝑔 𝐶 (3-9)
where C is the CO2 weight concentration, 𝑐1 and 𝑐2 are fitting parameters independent of C, 𝜂0,𝑇𝑔
is the zero-shear-rate viscosity at the glass transition temperature 𝑇𝑔 , and T is the temperature.
Equation (3-9) was originally derived by Williams et al. (1955) from the free volume theory
without considering the effect of solvent concentration. The modified WLF equation suggests
that CO2 affects the solution viscosity mainly by suppressing the glass transition temperature of
the polystyrene.

47
100
101
102
103
104
PS + 5% CO2
H = 0.94 mm
130oC
140oC
150oC
172oC
H = 1.96 mm
130oC
140oC
PS alone
from both channels
172oC
190oC
210oC
Vis
co
sity
(P
a.s
)
Shear rate (s-1)
(a)
10-2
10-1
100
101
102
103
104
102
103
104
105
PS + 5% CO2, T
ref=172
oC
H = 0.94 mm
130oC
140oC
150oC
172oC
H = 1.96 mm
130oC
140oC
PS only at 172oC
o
r *
T
or / T
(b)
Figure 3-7 (a) Shear viscosity of PS/CO2 solution, compared with that of PS only; (b) Master
plot of the PS/CO2 solution for a reference temperature of 172oC, compared to the viscosity of
PS alone at 172oC
48
One way to compare our solution viscosity data to those by Royer et al. (2000) is to apply
Equation (3-9) to our data. For this, the glass transition temperature of PS/CO2 solution needs to
be determined. It was determined by Wissinger and Paulaitis (1987) as a function of CO2 weight
concentration and their results are reproduced in Figure 3-8. The relationship applies to most
commercial polystyrenes regardless of their molecular weight distribution. The ratio 𝑇𝑔/𝑇𝑔0is the
glass transition temperature of the solution over that of the PS alone, and it is 0.87 for a 5% CO2
concentration. The glass transition temperature of a PS + 5% CO2 solution, then, is 323 K, or
50oC, given that the 𝑇𝑔 of the PS alone is 373 K.
Knowing the glass transition temperatures of the two fluids, a BA concentration-
temperature equivalence can be established, as suggested by Equation (3-9). That is, the viscosity
reduction effect of 5% CO2 should be equivalent to a temperature increase of 50oC for the PS
alone, where 50oC is the difference of 𝑇𝑔 between the PS and the PS/CO2 solution. This is indeed
the case in Figure 3-7(a), where the solution viscosity at 140oC almost overlaps the PS viscosity
at 190oC, and the viscosities at other temperatures seem to follow a similar trend. The modified
WLF equation, therefore, accurately predicts the influence of CO2 on the viscosity of our
polystyrene.
3.4.2 Comparing Viscosity Reductions of Various BAs
Before moving on to extensional measurements in Chapter 4, it is worthwhile to compare
the viscosity reduction effect of CO2 with that of other blowing agents. Such information is of
interest to the polymeric foaming industry, because the present PS is a commonly used material,
and thus a comparison may be helpful for predicting the behaviour of a new agent. The
dependence of solution viscosity on BA concentration is derived in the present study from the
modified WLF equation in Equation (3-9):
𝑙𝑛 𝜂0,𝑇 𝐶
𝜂0,𝑇 0 = 𝑙𝑛
𝜂0,𝑇 𝐶
𝜂0,𝑇𝑔 𝐶
− 𝑙𝑛 𝜂0,𝑇𝑔
0
𝜂0,𝑇 0 =
−𝑐1 ∙𝑐2∙ 𝑇𝑔 0 −𝑇𝑔 𝐶
𝑐2+ 𝑇−𝑇𝑔 0 ∙ 𝑐2+ 𝑇−𝑇𝑔 𝐶 (3-10)
In Equation (3-10), if we define BA concentration such that the plots of 𝑇𝑔 versus this
concentration reduce to a single curve for different BAs, then the viscosity reduction of other

49
0.00 0.02 0.04 0.06 0.08 0.10 0.12 0.14 0.16
0.70
0.75
0.80
0.85
0.90
0.95
1.00
Tg /
Tg0
CO2 concentration by weight (wt%)
Figure 3-8 Reduction of glass transition temperature for PS as a function of CO2
concentration; reproduced from Wissinger and Paulaitis (1987)

50
BAs can be predicted. A proper definition of BA concentration in this sense is the molar
concentration 𝐶𝑚 = 𝐶/𝑀𝑠𝑜𝑙 , where 𝑀𝑠𝑜𝑙 is the molecular weight of the solvent. The molar
concentration naturally arises because the WLF equation is derived from the free volume theory
(e.g., Ferry (1980)), and the latter suggests that viscosity reduction of a polymer solution is
determined by the free volume contributed by the solvent (here free volume is defined as holes of
monomeric dimensions or smaller in the polymer resulting from packing irregularity). At the
same molar concentration then, the free volume contributions of different BAs to the same
polymer may be similar. In fact, Park and Dealy (2006) plotted BA concentration shift factors,
defined as the ratio of solution zero-shear-rate viscosity to that of the polymer alone, against BA
molar concentration in HDPE, and found that the plots for CO2 and N2 almost overlapped.
For our comparison between different BAs in the PS, a viscosity reduction factor is
defined based on 𝐶𝑚
𝑉𝑅𝐹 =𝜂 𝑇,𝐶𝑚 ,𝛾
𝜂 𝑇,𝛾 (3-11)
where 𝜂 𝑇, 𝐶𝑚 , 𝛾 is the solution viscosity at a fixed temperature and shear rate, and 𝜂 𝑇, 𝛾 is
the corresponding viscosity of the polymer only. Han and Ma (1983) used the same polystyrene
as in the present study and determined solution viscosities for the blowing agents CFC-11 and
CFC-12. Measurements showed that the VRF values based on Equation (3-11) from both studies
were nearly constant at high shear rates (i.e., at 𝛾 > 100 𝑠−1), and these high-shear-rate values
are presented in Figure 3-9(a). The plot shows that our VRF values with CO2 (𝑀𝑊 = 44 𝑔/𝑚𝑜𝑙,
𝜌𝑠𝑢𝑝𝑒𝑟𝑐𝑟𝑖𝑡𝑖𝑐𝑎𝑙 ≈ 1 𝑔/𝑐𝑐 ) are close to the values with CFC-11 ( 𝑀𝑊 = 137 𝑔/𝑚𝑜𝑙 ,
𝜌𝑠𝑢𝑝𝑒𝑟𝑐𝑟𝑖𝑡𝑖𝑐𝑎𝑙 ≈ 1.5 𝑔/𝑐𝑐 ) and CFC-12 ( 𝑀𝑊 = 121 𝑔/𝑚𝑜𝑙 , 𝜌𝑠𝑢𝑝𝑒𝑟 𝑐𝑟𝑖𝑡𝑖𝑐𝑎𝑙 ≈ 1.5 𝑔/𝑐𝑐 ).
Differences between the BAs grow at higher molar concentrations, but they are in general much
lower than those between VRFs based on the weight concentration C (Figure 3-9(b)), by a factor
of 𝑀𝐶𝐹𝐶 −𝑀𝐶𝑂 2
𝑀𝐶𝐹𝐶≈ 67%. It is thought, then, that the viscosity reduction plots of other blowing
agents in our PS, as a function of their respective molar concentrations, will follow the trend in
Figure 3-9(a).
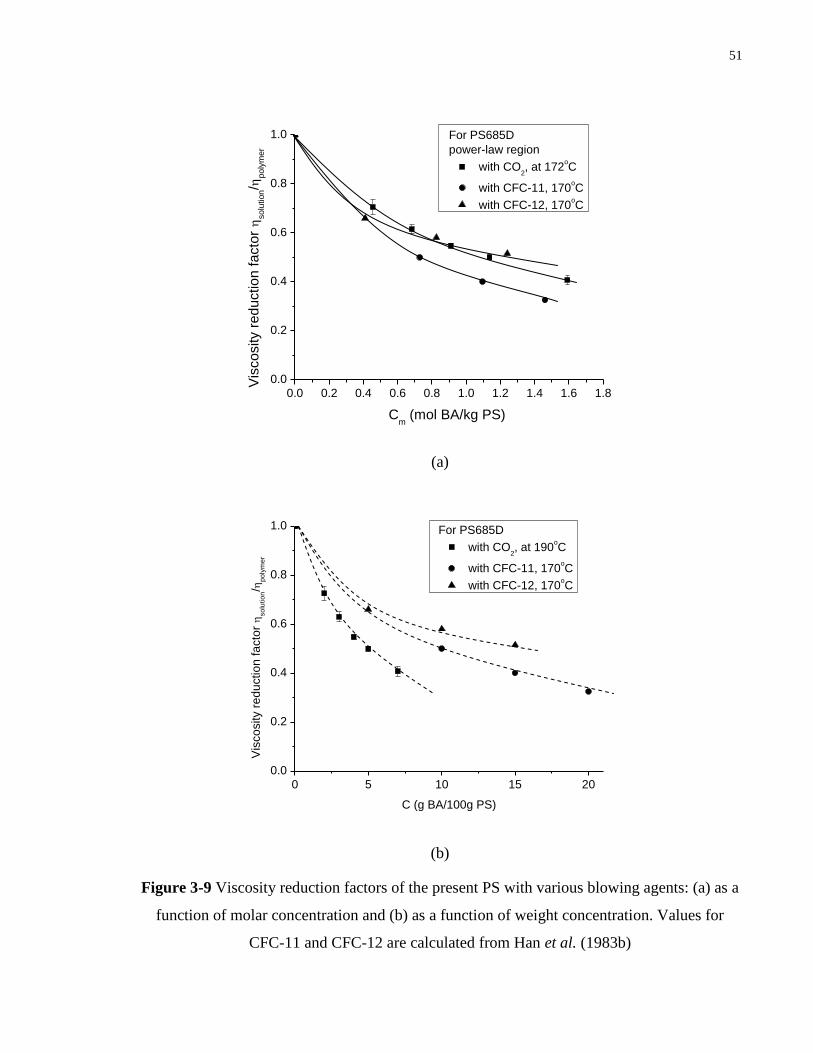
51
0.0 0.2 0.4 0.6 0.8 1.0 1.2 1.4 1.6 1.8
0.0
0.2
0.4
0.6
0.8
1.0
Vis
co
sity r
ed
uctio
n f
acto
r
solu
tion/
poly
mer
Cm (mol BA/kg PS)
For PS685D
power-law region
with CO2, at 172
oC
with CFC-11, 170oC
with CFC-12, 170oC
(a)
0 5 10 15 20
0.0
0.2
0.4
0.6
0.8
1.0
Vis
co
sity r
ed
uctio
n fa
cto
r
so
lutio
n/
po
lym
er
C (g BA/100g PS)
For PS685D
with CO2, at 190
oC
with CFC-11, 170oC
with CFC-12, 170oC
(b)
Figure 3-9 Viscosity reduction factors of the present PS with various blowing agents: (a) as a
function of molar concentration and (b) as a function of weight concentration. Values for
CFC-11 and CFC-12 are calculated from Han et al. (1983b)

52
Chapter 4 Characterization of the Extensional Properties
This chapter determines the extensional properties of PS melt and PS/CO2 solution from
pressure drop measurement over the thin hyperbolically-convergent rectangular channel
illustrated in Figure 3-1. Because of its shape, the channel induces approximately constant-
extensional-rate flow over a good fraction of its volume, which facilitates the calculation of
viscosity values. It should be mentioned that fluids behave differently under different types of
extensional flow. For example, the uniaxial extensional viscosity for a Newtonian fluid is three
times its shear viscosity, while the planar viscosity is four times, and the biaxial viscosity is six
times the shear viscosity. Whenever extensional viscosity is presented in this study, the type of
flow from which it is determined will be pointed out.
This chapter begins with a review of previous studies on the elasticity of polymer/BA
solutions in Section 4.1. This is followed by a presentation of the uniaxial extensional properties
of the PS alone determined on a shear-free rheometer in Section 4.2. In Sections 4.3, 4.4, and
4.5, a method is presented for extracting the planar extensional viscosity from pressure drop
measurements in the hyperbolic channels after the pressure drop due to shearing is accounted for.
Extensional viscosities from the channel are compared to those from the shear-free rheometer,
and error sources with the channel technique are discussed. Finally, in Section 4.6, planar
extensional viscosities of PS/CO2 solution are determined from the hyperbolic channels, and the
influence of the blowing agent on this property is clarified.
4.1 Introduction
In Chapter 3, it was shown that the shear viscosity of a polymer melt is significantly
reduced by a blowing agent even if the BA concentration is only a few percent by weight. The
dissolved gas reduces the viscosity by increasing the free volume of the melt and therefore chain
mobility [e.g., Utracki and Simha (2001) and Lee et al. (2007)]. This increase of free volume
likely reduces the material‟s elasticity as well because it reduces the relaxation time [Ferry
(1980)], but this has not been confirmed for polymer/BA solutions because measurement
techniques have not been generally available. That is, characterizing the elastic properties of a

53
polymer/gas solution is exceedingly difficult because the tests must be carried at 103 psi
pressures to prevent the gas from coming out of the solution. In contrast to shear properties, there
have been very few studies of the elastic properties of the solutions. One study was by Ouchi et
al. (2008) who measured the storage modulus of a LDPE/CO2 solution using a rotational
rheometer with a high pressure chamber. After taking magnetic signal errors into account, they
found that G’ decreased by about 30% when the LDPE was saturated with CO2 at 10 MPa.
Extensional flow resistance has been measured by Ladin et al. (2001) and Xue & Tzoganakis
(2003). They determined apparent extensional viscosity by measuring the pressure drop in a
sudden planar contraction. The contraction ratios in their flow channels were 10:1 and 18:1,
respectively. Ladin et al. found that the apparent extensional viscosity of a polybutylene
succinate (PBS) solution decreased by 40% to 60% for a CO2 concentration of 6% by weight,
while Xue and Tzoganakis reported a comparable decrease for a 4% CO2 concentration in
polypropylene. In both studies, the decrease of extensional viscosity was similar to the decrease
in shear viscosity at the same CO2 concentration. The aspect ratios of their rectangular channels,
however, were only 1 or 2, and extensional rates varied in unknown ways because of upstream
vortices. Moreover, their calculated values of the extensional viscosity had large errors because
the pressure drops due to extension were a small fraction of the total pressure drop. Both studies
followed Cogswell‟s approach in calculating the extensional viscosity [Cogswell (1972)], i.e.,
they assumed that the extensional viscosity is a function of strain rate only, ignoring the
dependence of this property on strain [Macosko (1994)].
Compared to the techniques of Ladin et al. and Xue & Tzoganakis, our technique is an
improvement because it is based on pressure drop measurements in a thin hyperbolically
convergent channel. With this geometry, extensional rates are nearly constant, at least in the core
of the flow, and so the flow field is more suitable and better defined than that in an abrupt
contraction. Also, our technique considers the dependence of extensional viscosity on strain as
well as on strain rate. Details of the technique will be presented after a presentation of the
uniaxial extensional viscosity of the PS alone, determined from a shear-free rheometer.

54
4.2 Uniaxial Extensional Viscosity from EVF
Measurements of uniaxial extensional viscosity were made using an Extensional
Viscosity Fixture (EVF, TA Instrument Inc.) attached to the ARES rheometer. This device is
similar to the fixture developed by Sentmanat et al. (2005). As shown in Figure 4-1, the EVF
design is based on the original Meissner concept [Meissner and Hostettler (1994)] of elongating
a sample within a confined space by a pair of rotary clamps. Instead of the rotary clamps, the
EVF uses two cylinders to wind up the sample: one cylinder rotates, while the other measures the
force. In order to wind up the sample equally on both sides, the rotating cylinder moves on a
circular orbit around the force measuring cylinder while rotating around its own axis at the same
time. Time-dependent extensional stress and extensional viscosity can be calculated from the
force 𝐹 𝑡 sensed by the static cylinder
𝜏𝑥𝑥 𝑡 − 𝜏𝑦𝑦 𝑡 =𝐹 𝑡
𝐴 𝑡 =
𝐹 𝑡
𝐴0∙ 𝑒𝜀 0𝑡 (4-1)
where 𝐴0 is the initial cross-sectional area of the sample, 𝐴 𝑡 is the instantaneous cross-
sectional area, and 𝜀 0 is the constant extensional rate [Sentmanat et al. (2005)]. The transient
uniaxial extensional viscosity, then, is calculated from the normal stress difference and the
extensional rate
𝜂𝐸+ 𝑡 =
𝜏𝑥𝑥 𝑡 −𝜏𝑦𝑦 𝑡
𝜀 0 (4-2)
To characterize our PS685D on the EVF, rectangular samples of 18 mm × 10 mm × 0.8
mm in dimensions were prepared on a compression molding machine. For these dimensions,
sagging of the sample during measurement is negligible if the zero-shear-rate viscosity of the
material is above 104 Pa.s [Sentmanat et al. (2005)]. The maximum strain rate achievable with
the EVF is 5 s-1
and the maximum Hencky strain achievable is usually 3.5.
Values of uniaxial extensional viscosity were obtained for the PS at temperatures of
172oC, 190
oC and 210
oC, and at extensional rates of 0.1, 0.5, 1.0, and 3.0s
-1. These temperatures
and extensional rates are relevant to flows in the Hele-Shaw channels. The EVF data are
presented in Figure 4-2, showing significant strain hardening because of a high molecular weight
component in the PS [Münstedt (1980)], and necking at the two lowest strain rates.

55
(a)
(b)
Figure 4-1 (a) Schematic of the ARES-EVF (Extensional Viscosity Fixture); (b) representative
positions of the rotating cylinders, and corresponding Hencky strains; reproduced from the
product note on EVF technology by TA Instruments Inc.
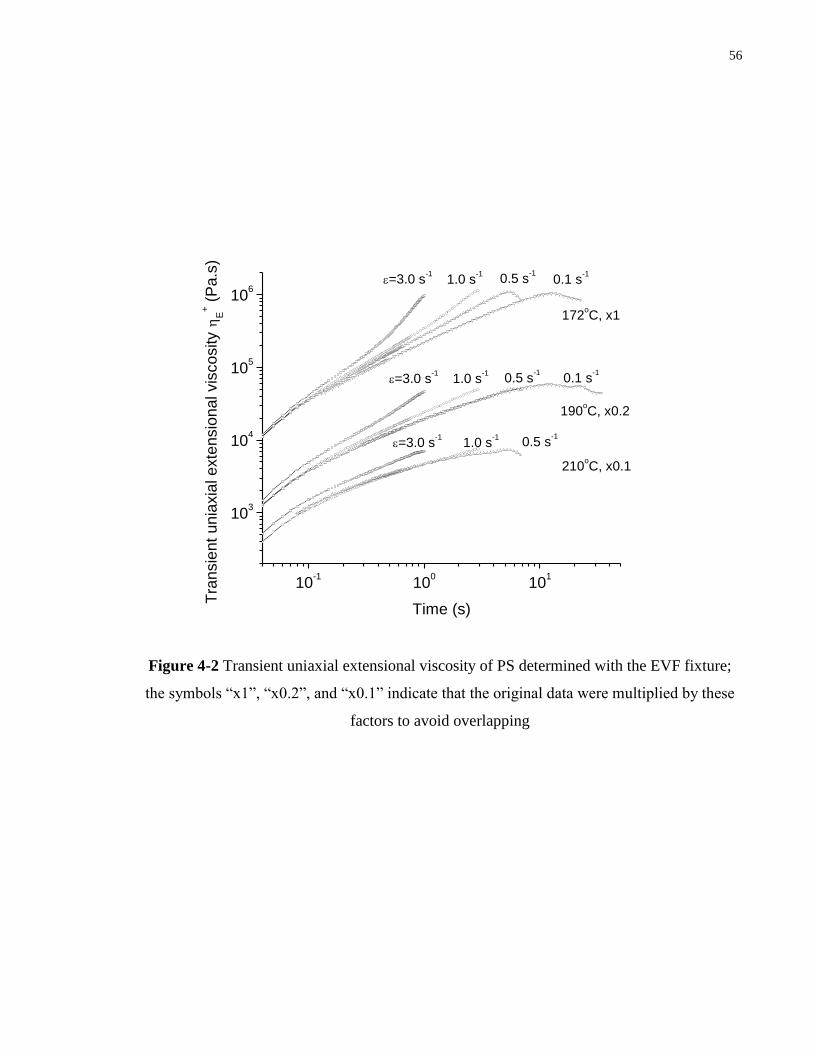
56
10-1
100
101
103
104
105
106
0.5 s-1
1.0 s-1
=3.0 s-1
0.1 s-1
0.5 s-1
1.0 s-1
=3.0 s-1
210oC, x0.1
190oC, x0.2
0.1 s-1
1.0 s-1
0.5 s-1
Tra
nsie
nt
unia
xia
l exte
nsio
nal vis
cosity
E
+ (
Pa.s
)
Time (s)
=3.0 s-1
172oC, x1
Figure 4-2 Transient uniaxial extensional viscosity of PS determined with the EVF fixture;
the symbols “x1”, “x0.2”, and “x0.1” indicate that the original data were multiplied by these
factors to avoid overlapping

57
4.3 Calculating the Pressure Drop due to Extension
The channels for determining extensional properties are the hyperbolically convergent
channels in Figure 3-1. Using a thin hyperbolic channel for extensional flows of melts may be
novel but such channels have been utilized in microfluidics, where the cross section can only be
rectangular and the aspect ratio can be large [Whitesides and Strook (2001)]. In a channel
similar to that in Figure 3-1, Oliveira et al. (2007) studied flow of a Newtonian fluid, both
experimentally and numerically, at Reynolds numbers up to 20, in order to evaluate the channel‟s
usefulness as an extensional rheometer. They reported that the velocity gradient in the y
direction was negligible when the aspect ratio (B/H) was high, and that the extensional rate along
the centreline of the channel was approximately constant. However, they questioned whether
extensional stresses could be extracted from the measurement of pressure drop because the shear
stresses are so large. All the same, we anticipated that extensional stresses in our melt would be
large enough to be deduced, enabling a determination of the fluid‟s extensional viscosity.
Detailed procedures are presented below.
When viscoelastic fluid flows through the converging Hele-Shaw channel, part of the
pressure drop between the second and the third transducers, designated ∆𝑃𝑐𝑜𝑛𝑣𝑒𝑟𝑔𝑒𝑛𝑡 in Figure 3-
1, depends on the elastic normal stresses. The precise dependence is found by integrating the
momentum equation in the convergent section.
For steady isothermal flow of an incompressible fluid, the inertialess momentum
equations in the x and z directions (Figure 3-1) are
𝜕𝑃
𝜕𝑥+
𝜕𝜏𝑥𝑥
𝜕𝑥+
𝜕𝜏𝑦𝑥
𝜕𝑦+
𝜕𝜏𝑧𝑥
𝜕𝑧= 0 (4-3)
𝜕𝑃
𝜕𝑧+
𝜕𝜏𝑥𝑧
𝜕𝑥+
𝜕𝜏𝑦𝑧
𝜕𝑦+
𝜕𝜏𝑧𝑧
𝜕𝑧= 0 (4-4)
[Bird et al. (1987)]. The convection terms are omitted because Reynolds numbers in the channel
are of order 10-4
, and the equation in the y direction is not needed because our analysis focuses
on the centre plane, 𝑦 = 0, in the convergent section. When Equation (4-3) is integrated along
the centreline from the upstream location (0, 0, 0) to the downstream location (L2, 0, 0), the result
is

58
𝑃 0,0,0 − 𝑃 𝐿2, 0,0 = 𝜏𝑥𝑥 𝐿2, 0,0 − 𝜏𝑥𝑥 0,0,0 + 𝜕𝜏𝑦𝑥
𝜕𝑦+
𝜕𝜏𝑧𝑥
𝜕𝑧 𝑑𝑥
𝐿2
0 (4-5)
The upstream pressure transducer is located at the wall at 𝑥 = −𝐿1. The pressure which is
sensed there, 𝑃𝑤 −𝐿1 = 𝑃 −𝐿1, 0,𝐻
2 , is related to 𝑃 0,0,0 by first integrating Equation (4-4)
in the z direction at 𝑥 = −𝐿1 from 𝑧 = 𝐻/2 to 𝑧 = 0, and then by integrating Equation (4-3)
along the centreline from 𝑥 = −𝐿1 to 𝑥 = 0. The result is
𝑃 0,0,0 = 𝑃 −𝐿1, 0,0 − 𝜕𝜏𝑧𝑥
𝜕𝑧 𝑑𝑥 =
0
−𝐿1 𝑃𝑤 −𝐿1 + 𝜏𝑧𝑧 −𝐿1, 0,
𝐻
2 −
𝐿1
𝐿0∙ ∆𝑃𝑠𝑒𝑎𝑟
(4-6)
where the term 𝜏𝑧𝑧 −𝐿1, 0,𝐻
2 is the normal stress at the wall due to shearing, which can be
determined from the N1 measurement in Figure 3-4(a). In deriving Equation (4-6), the terms 𝜕𝜏𝑥𝑥
𝜕𝑥
and 𝜕𝜏𝑦𝑥
𝜕𝑦 in Equation (4-3) and
𝜕𝜏𝑥𝑧
𝜕𝑥 and
𝜕𝜏𝑦𝑧
𝜕𝑦 in Equation (4-4) can be neglected because the x-
derivatives are zero along the straight channel between 𝑥 = −𝐿1 and 𝑥 = 0, and the y-derivatives
vanish along the centreline due to symmetry. The downstream centreline pressure 𝑃 𝐿2, 0,0 in
Equation (4-5) is related to the pressure sensed in the reservoir (𝑃𝑟𝑒𝑠𝑣 = 𝑃𝑤 𝑥 > 𝐿2 ) and to the
exit pressure ∆𝑃𝑒𝑥𝑖𝑡 by
𝑃 𝐿2, 0,0 = 𝑃𝑟𝑒𝑠𝑣 + ∆𝑃𝑒𝑥𝑖𝑡 (4-7)
The exit pressure can be determined from N1, as described in Section 3.2.2 B.
Combining Equations (4-5) to (4-7) and omitting the normal stress term 𝜏𝑧𝑧 in Equation
(4-6) because its value is no more than a few percent of 𝑃𝑤 −𝐿1 , we obtain a relationship
between the measured pressure drop over the convergent channel ∆𝑃𝑐𝑜𝑛𝑣𝑒𝑟𝑔𝑒𝑛𝑡 = 𝑃𝑤 −𝐿1 −
𝑃𝑟𝑒𝑠𝑣 and the pressure drop due to extension ∆𝑃𝑒 = 𝜏𝑥𝑥 𝐿2, 0,0 − 𝜏𝑥𝑥 0,0,0 in the convergent
channel. The latter is the increase in the extensional stress along the channel, to the maximum at
the exit centreline, where 𝑦 = 𝑧 = 0 and 𝑥 = 𝐿2. The relationship between ∆𝑃𝑒 and ∆𝑃𝑐𝑜𝑛𝑣𝑒𝑟𝑔𝑒𝑛𝑡
takes into account the pressure drop due to shear over the length L1 by proportionality:
∆𝑃𝑒 = ∆𝑃𝑐𝑜𝑛𝑣𝑒𝑟𝑔𝑒𝑛𝑡 −𝐿1
𝐿0∙ ∆𝑃𝑠𝑒𝑎𝑟 −
𝜕𝜏𝑦𝑥
𝜕𝑦+
𝜕𝜏𝑧𝑥
𝜕𝑧 𝑑𝑥
𝐿2
0− ∆𝑃𝑒𝑥𝑖𝑡 (4-8)

59
In order to evaluate the third term on the right side of Equation (4-8), which is the
pressure drop due to shearing in the convergent channel (∆𝑃𝑠), the following assumptions are
made regarding the velocity distribution and constitutive properties: (1) the flow is fully-
developed everywhere in the converging channel because of the low Reynolds numbers; (2) the
velocity distribution depends on shear stresses only, and not on extensional stresses; (3) the shear
viscosity is described by the power law (𝜂 = 𝑚 ∙ 𝛾 𝑛−1), which Figure 3-5 and 3-6 show is
acceptable at the high channel shear rates (except at the highest temperature, 227oC).
The pressure drop due to shearing in the convergent channel is calculated from the
following equation, which takes into account shearing on both the curved and flat walls.
∆𝑃𝑠 = 𝜕𝜏𝑦𝑥
𝜕𝑦+
𝜕𝜏𝑧𝑥
𝜕𝑧 𝑑𝑥
𝐿2
0=
21+𝑛 ∙𝑚
𝐻
𝐿2
0∙
2+1
𝑛 ∙𝑄
𝐵 𝑥 ∙𝐻2
𝑛
∙1
𝑘∙ 𝑑𝑥 =
21+𝑛 ∙𝑚
𝐻∙
2+1
𝑛 ∙𝑄
𝐻2
𝑛
∙
𝐿21
𝐵1−
1
𝐵0
∙ 𝑡𝑛
1−0.536∙𝐻∙𝑡
1/𝐵1
1/𝐵0∙ 𝑑𝑡 (4-9)
Equation (4-9) incorporates the correction factor 𝑘 =𝑑𝑝 /𝑑𝑥𝐻𝑆
𝑑𝑝 /𝑑𝑥 , where the subscript “HS”
denotes Hel-Shaw flow, i.e., it indicates that the shearing caused by the two curved walls
contributes nothing to the pressure gradient. The denominator in 𝑘 is the pressure gradient for
shearing on all four walls, accounting for the finite aspect ratio of the channel. The value of k
approaches 1 for a wide rectangular channel (𝐻/𝐵 ≪ 1). Values of k were found for a power-law
fluid from numerical studies in the literature [Syrjälä (1995) and Kostic (1993)] and from an in-
house finite element program with a Newton-type algorithm for viscosity iteration. The values
are plotted in Figure 4-3, showing how k depends on the power-law index n and on H/B. For our
polystyrene, n is 0.158, and for our hyperbolic channels, 𝐻/𝐵 = 0.03 to 0.68. The plot reveals
that the relevant dependence on n is minimal and that the data are nearly linear over the relevant
H/B range. Thus the straight line 𝑘 = 1 − 0.536 ∙ 𝐻/𝐵, which closely fits the data, is used in the
denominator of the integral of Equation (4-9).
Values of ∆𝑃𝑒 were calculated from Equation (4-8), based on (a) the measurements
of ∆𝑃𝑐𝑜𝑛𝑣𝑒𝑟𝑔𝑒𝑛𝑡 , (b) the measured pressure drop between the first two transducers, (c) Equation
(4-9) for the third-term integral, and (d) Equation (3-4) for the exit pressure. The values of the
two pressure drops obtained for the 0.94 mm channel are presented in Figure 4-4, where the flow

60
0.0 0.2 0.4 0.6 0.8 1.0
0.4
0.5
0.6
0.7
0.8
0.9
1.0
H/B range for
0.94 mm insert
Pre
ssu
re g
rad
ien
t ra
tio
k
H/B
power law index n=1.0
n=0.5
n=0.2
n=0.1
H/B range for 1.96 mm insert
Figure 4-3 Ratio of pressure gradient neglecting the aspect ratio of a rectangular channel over
that considering the aspect ratio, 𝑘 =𝑑𝑝 /𝑑𝑥𝐻𝑆
𝑑𝑝 /𝑑𝑥, with values obtained from the literature and from
running an in-house code.

61
100
101
102
103
To
tal p
ressu
re d
rop
an
d p
ressu
re d
rop
rela
ted
to
exte
nsio
n (
psi)
Flow rate (cc/min)
PS
0.94 mm Hele-Shaw
channel
Pconvergent
164oC
172oC
190oC
Pe
164oC
172oC
190oC
Figure 4-4 The total pressure drop and the pressure drop related to extension in the 0.94 mm
channel (see Equation 4-8 for definitions of ∆𝑃𝑐𝑜𝑛𝑣𝑒𝑟𝑔𝑒 𝑛𝑡 and ∆𝑃𝑒)

62
rate is in units of cc/min, the units of measurement. The figure shows the pressure drop due to
extension is a significant fraction of the total pressure drop, and that ∆𝑃𝑒 increases more rapidly
than ∆𝑃𝑐𝑜𝑛𝑣𝑒𝑟𝑔𝑒𝑛𝑡 with flow rate. This latter behaviour is expected because Equation (4-9) shows
that the pressure drop due to shearing is proportional to 𝑄𝑛 , while the pressure drop due to
extension is proportional to the product of 𝑄 and the extensional viscosity, as will be seen
shortly. The large values of ∆𝑃𝑒 in Figure 4-4, attributed to the extreme shear thinning and the
high elasticity of the fluid, are contrary to the speculation of Oliveira et al. (2007) that a thin
planar hyperbolic channel may not be useful for determining the extensional viscosity.
4.4 The Extensional Rate and Total Strain
In order to relate the EVF data to the extensional measurements in the convergent
channel, it is necessary to know the extensional rate and strain in the channel. If shearing on the
curved walls is neglected, the extensional rate along the centreline is constant and found by
differentiating Equation 3-1, i.e.,
𝜀 𝐻𝑆 = 𝑑𝑣𝐻𝑆
𝑑𝑥 =
2𝑛+1 ∙𝑄
𝑛+1 ∙𝐻∙
1
𝐵1−
1
𝐵0
𝐿2 (4-10)
where the subscript “HS” continues to indicate an infinitely-wide channel or Hele-Shaw type
flow, where 𝑣𝐻𝑆 is the centreline velocity, and n is the power-law index. The Hencky strain 𝜀𝐻 in
this case is 𝜀𝐻,𝐻𝑆 = 𝑙𝑛 𝐵0
𝐵1 .
The actual centreline extensional rate is higher than that in Equation (4-10) because
shearing on the curved walls increases the centreline velocity. The higher extensional rates were
found through the velocity ratio, 𝑣/𝑣𝐻𝑆 , where the numerator accounts for the finite aspect ratio
and the denominator pertains to an infinite aspect ratio. This ratio of velocities is plotted in
Figure 4-5, where values were again found from literature sources and our in-house finite-
element code, like the values in Figure 4-3. Figure 4-5 indicates that, for 𝑛 = 0.16, the parameter
in the Carreau-Yasuda equation for our polystyrene melt, the actual centreline velocities were 12
to 18% higher than those determined from Equation (4-10). Data for 𝑛 = 0.5 and 1.0 are also
included in the plot to illustrate the influence of this parameter.

63
0.0 0.2 0.4 0.6 0.8 1.0
0.8
0.9
1.0
1.1
1.2
1.3
1.4
1.5
Ce
nte
rlin
e v
elo
city r
atio
v /
vH
S
H/B
power-law n=1.0
n=0.5
n=0.2
n=0.1
H/B range for
0.94 mm insert
H/B range for 1.96 mm insert
Figure 4-5 Ratio of centreline velocity for a finite aspect ratio over that for an infinite aspect
ratio, used as a correction factor and determined from literature sources and from an in-house
numerical code

64
The curves in Figure 4-5 which apply to our case – namely, 𝑛 = 0.16 and 𝐻/𝐵 =
0.03 𝑡𝑜 0.68 − were used to calculate the actual centreline extensional rate, 𝜀 =𝑑𝑣
𝑑𝑥. Thus the
actual Hencky strain 𝜀𝐻 is
𝜀𝐻 = 𝜀 𝑡
0∙ 𝑑𝑡 =
𝜀
𝑣
𝐿2
0∙ 𝑑𝑥 = 𝑙𝑛
𝑣 𝑥=𝐿2
𝑣 𝑥=0 (4-11)
Following the adjustment in the centreline velocity, the values of Hencky strain were
12% to 18% above those based on simple Hele-Shaw flow, i.e., above 𝑙𝑛 𝐵0
𝐵1 = 2.3. These
corrections for extensional rate and strain were applied to all flow rates and temperatures.
4.5 Comparing Extensional Viscosities
The calculations of ∆𝑃𝑒 , 𝜀𝐻, and 𝜀 in the two previous sections enable us to compute the
extensional viscosity based on the channel data, and then compare channel results to EVF data.
In principle, a comparison can be made only for flows with similar histories – namely, for flows
having the same constant extensional rates and similar strains − because extensional viscosity
depends on both variables. In the EVF, all of the fluid is subjected to a constant extensional rate;
in the channel, the core of the flow is subjected to an extensional rate which is almost constant.
Some extensional rates are common to both flows, and thus extensional rates can be matched up.
As for the strain, the fixed channel strain lies within the range of EVF measurements. Therefore,
the EVF data at the known channel strain and various extensional rates can be related to the
channel results at the same strain and similar extensional rates.
Relating the results will be in terms of the extensional viscosity, and so the primary
purpose of this section is to show how extensional viscosity is determined from channel
measurements. The two extensional viscosities, though, are different. That is, the EVF provides
measurements of the uniaxial extensional viscosity 𝜂𝐸 , while the channel data provides estimates
of the planar extensional viscosity 𝜂𝑃 [Dealy (1984)]. The two viscosities have different values
at the same extensional rate, but the results should indicate whether channel measurements can
be used to determine the extensional viscosity of a fluid which cannot be tested in an EVF − a
fluid, say, which is evaporative or a fluid requiring a high pressure, such as a foamed plastic.

65
Calculation of the planar extensional viscosity from channel measurements is much less
straightforward than the calculation of the shear viscosity. To start with, the term „planar‟ must
be explained because, for truly planar flow, shearing on the curved walls must be negligible and
H/B must be much greater than unity. In the present case, shearing on the curved walls is small
compared to that on flat walls because W/B is much above unity everywhere. As for H/B, it is of
order 1/10, and not 𝑂 10 . However, because of the extreme shear thinning (𝑛 = 0.16), the
velocity in the z direction is close to uniform over a good fraction of the z-direction depth, and so
the flow in the central region is close to planar. Hence the relevant extensional viscosity is
planar, but the value obtained will be approximate because the flow is not truly planar.
In Section 4.3, it was shown that the pressure drop due to extension ∆𝑃𝑒 in the Hele-Shaw
channel equals the difference in 𝜏𝑥𝑥 between a downstream location and an upstream location
(∆𝑃𝑒 = 𝜏𝑥𝑥 𝐿2, 0,0 − 𝜏𝑥𝑥 0,0,0 ). Extensional viscosity is based on the first normal stress
difference 𝜏𝑥𝑥 − 𝜏𝑦𝑦 ; since only 𝜏𝑥𝑥 is available from ∆𝑃𝑒 , 𝜏𝑦𝑦 is neglected for the moment.
Using the centreline extensional rate at the channel exit, as determined in Section 4.4, the
channel extensional viscosity is calculated from the following Equation (4-12)
𝜂𝑃 =𝜏𝑥𝑥 −𝜏𝑦𝑦
𝜀 ≈
∆𝑃𝑒
𝜀 =
𝜏𝑥𝑥 𝐿2 ,0,0
𝜀 (4-12)
where 𝜏𝑥𝑥 0,0,0 is considered zero because the channel is straight before that location.
Values of the extensional viscosity 𝜂𝑃 𝜀 , 𝜀𝐻 determined this way from Equation (4-12)
are compared with values of 𝜂𝐸 𝜀 , 𝜀𝐻 from EVF measurements in Figure 4-6. Here 𝜀 and 𝜀𝐻 are
the channel centreline extensional rate and strain, as determined previously in Section 4.4. The
data from the two channels should be close, having been determined in the same way. The plot
shows reasonable agreement between the two channels at the two lowest temperatures, when the
pressure differences were highest and therefore the measurements were most accurate. At all
three temperatures, 𝜂𝑃 is higher than 𝜂𝐸 . The only prior comparison of these two viscosities
appears to be in the paper by Laun and Schuch (1989). They determined 𝜂𝑃 properly by
stretching an inflated hollow cylinder of an LDPE melt. For a maximum strain rate of 0.08 s-1
,
they found that values of the normalized planar extensional viscosity (𝜂𝑃 divided by the
Newtonian limit of 4) were lower than values of the normalized uniaxial extensional viscosity
(𝜂𝐸). Because the strain rates in our experiments were much higher, elastic effects were much

66
0.1 1 10
105
106
Po
r
E (
Pa
.s)
Extensional rate (s-1)
Hele-Shaw channel
H = 0.94 mm
164oC
172oC
190oC
H = 1.96 mm
164oC
172oC
190oC
predicted from EVF
164oC
172oC
190oC
Figure 4-6 Comparison of PS planar extensional viscosity 𝜂𝑃 𝜀 , 𝜀𝐻 from two Hele-Shaw
channels with uniaxial extensional viscosity 𝜂𝐸 𝜀 , 𝜀𝐻 from EVF measurement; Here 𝜀 and 𝜀𝐻
are the channel centerline extensional rate and strain, as determined in Section 4.4

67
stronger, and therefore it is expected that the planar extensional viscosity of our polystyrene melt
should be less than the uniaxial extensional viscosity, not more as shown in Figure 4-7.
A relationship between the two properties was worked out by Jones et al. (1987) for a
generalized Newtonian fluid. More specifically, they argued that planar values 𝜂𝑃 𝜀 should
equal uniaxial values calculated as 𝜂𝐸 2∙𝜀
3 ∙
4
3. We found that the Jones et al. relationship brings
our two sets of data closer together, but the applicability of this near-Newtonian model to our
highly elastic polystyrene melt is questionable and thus values are not presented.
In Figure 4-6, the curves are extension thinning. Because the fluid is shear thinning,
Trouton ratios are of interest and thus these ratios are presented in Figure 4-7. The values are
calculated as 𝜂𝑃 𝜀
𝜂 2∙𝛾 or
𝜂𝐸 𝜀
𝜂 3∙𝛾 , based on the 𝜂 𝛾 data in Figure 3-5. The ratios show the expected
behaviour of increasing with extensional rate, and the values are all much higher than 4 or 3, the
planar and axisymmetric values for Newtonian fluids, respectively. In fact, since the ratios are of
order 10 and higher, the graph demonstrates the importance of extensional effects in a
converging flow.
The only prior attempt to compare channel and rheometrical values of extensional
viscosity appears to be that by Gotsis and Oriozola (1998). They defined apparent extensional
viscosity as the measured pressure drop due to extension divided by the average extensional rate
over the entry region. In their conical channel, the extensional rate increased as r3, where r is the
distance from the apex, and r varied by a factor of 6 or 12. Hence the extensional rate was far
from constant and an average value does not seem appropriate. They also argued that these
apparent values from the conical channel should equal rheometrical values of uniaxial
extensional viscosity averaged over the strain. The appropriate value of the extensional viscosity,
though, should be that at the exit of the channel, as calculated here, and not an average value.
Still, they found agreement between channel and rheometrical values to within ±30%. Our
discrepancies are larger although our approach appears more valid.
In calculating the values in Figure 4-6 and 4-7, two assumptions were made: (a) 𝜏𝑦𝑦 was
ignored in the core of the channel; and (b) the velocity distribution in the channel depends on
shearing alone. Because the stress 𝜏𝑦𝑦 cannot be found experimentally, a simple way of

68
0.1 1 10
0
20
40
60
80
100
Tro
uto
n r
atio
Extensional rate (s-1)
Hele-Shaw channel
H = 1.96 mm
164oC
172oC
190oC
from EVF
164oC
172oC
190oC
Figure 4-7 Trouton ratio of the PS calculated from the 1.96 mm Hele-Shaw channel and from
EVF measurement. Comparison of 𝜂𝑃 𝜀
𝜂 2∙𝛾 with
𝜂𝐸 𝜀
𝜂 3∙𝛾

69
estimating it is to apply the upper-convected Maxwell model, which has the fewest material
constants for a highly elastic fluid like our PS melt
𝝉 + 𝜆∇𝝉
= 2𝜂0𝑫 (4-13)
where 𝝉 is the stress tensor, 𝑫 is the deformation tensor, and λ and η0 the relaxation time and the
constant shear viscosity, respectively. Values of 𝜏𝑦𝑦 /𝜏𝑥𝑥 for planar extensional flow were
calculated as
𝜏𝑦𝑦
𝜏𝑥𝑥 = −
𝜏𝑦𝑦
𝜏𝑥𝑥=
1−2𝜆𝜀
1+2𝜆𝜀 ∙
1−𝑒−𝑡 1+2𝜆𝜀 /𝜆
1−𝑒−𝑡 1−2𝜆𝜀 /𝜆 (4-14)
A plot of 𝜏𝑦𝑦 /𝜏𝑥𝑥 versus 𝜆𝜀 produces a single curve independent of λ and η0, as shown in
Figure 4-8. The plot clearly shows that 𝜏𝑦𝑦 becomes negligible when the „strength‟ of the
extensional flow, indicated by 𝜆𝜀 , is of order unity and higher. Hence it is not unreasonable to
neglect this stress in 𝜏𝑥𝑥 − 𝜏𝑦𝑦 for determining the extensional viscosity.
The error associated with assuming wholly extensional flow in the core is more difficult
to evaluate. As noted previously, the viscosities from the two channels in Figure 4-6 are expected
to be closer at the same temperature and extensional rate. The disagreement is thought to result
from the interaction between shearing and extension in the channel flows. In the thickness (z)
direction, the flow changes from pure shearing at the walls to approximately pure extension
along the centreline. In between the flow is mixed, and there is little guidance in the literature
regarding the stress field in such flows. Fuller and Leal (1980 and 1981) measured birefringence
of dilute and moderately-concentrated polymer solutions under various flow conditions in a four-
roll mill. They found that the birefringence, which is proportional to the viscoelastic stress
according to the stress-optical relation [Macosko (1994)], is almost uniquely determined by the
extensional flow component. Assuming this holds for melts as well, the total stress in a mixed
flow is not simply the addition of shear and extensional stresses calculated from the
corresponding viscosities. In the same way, the total pressure drop in a channel is not likely the
sum of the pressure drops due to shearing and extension, which has been assumed in calculating
the channel extensional viscosities.

70
0.01 0.1 1 10 100
0.01
0.1
1
yy/
xx
For H=2.4 and any value
of and 0
Figure 4-8 Plot of 𝜏𝑦𝑦 /𝜏𝑥𝑥 in planar extensional flow, calculated using the upper-convected
Maxwell model

71
Despite the above considerations, our analysis of the planar hyperbolic convergent flow
has been as rigorous as possible. The sources of error are clearly identified in our case. With the
melt alone presented, the road is now clear for determining the extensional viscosity of a foamed
plastic, a material whose extensional properties cannot be found using an EVF.
4.6 Extensional Flow Resistance of the Solution
Since the results in Section 4.5 with PS show that flow in a hyperbolic channel can
provide a useful estimate of extensional viscosity, the technique is now applied to our PS/CO2
solution, to learn the effect of CO2 on this property. The planar extensional viscosity of the PS +
5% CO2 solution was calculated from Hele-Shaw channel measurements at several temperatures
(130oC, 140
oC, and 150
oC), using Equation (4-12), and the values are presented in Figure 4-9.
For comparison, the extensional viscosities of the PS are given, but at three different
temperatures (164oC, 172
oC, and 190
oC). Again, comparisons could not be made at the same
temperatures because either the melt or solution failed to generate reliable extensional stresses.
Figure 4-9 shows that the solution produced the similar extensional viscosity values at a much
lower temperature; hence extensional viscosity values at the same temperature would be much
lower for the solution than for the PS.
The previous studies of the apparent planar extensional viscosity, of a PBS/CO2 solution
by Ladin et al. (2001) and of a PP/CO2 solution by Xue & Tzoganakis (2003), indicate that
viscosity reductions by a 5% CO2 concentration were approximately 30% to 50% for PBS at
140oC, and 50% to 70% for PP at 230
oC. The reductions were similar to those for shear viscosity
under the same conditions. Although the extensional viscosity reduction in our case cannot be
found because the temperature ranges for the melt and solution are different, Figure 4-9 suggests
that the reduction for our PS/5% CO2 solution is higher than 80% because the extensional
viscosity curve for the melt alone at 172oC almost overlaps the solution curve at 130
oC, while the
solution curve at 172oC is some distance below the solution curve at 150
oC. In fact the ratio of
the two viscosities at the same temperature appears to be about 10:1. This reduction in the
extensional viscosity is higher than the 50% to 60% reduction of shear viscosity calculated from
Figure 3-7. The larger difference in the extensional viscosity may be expected, though, because

72
100
101
105
106
PS only
0.94 mm Hele-Shaw
164oC
172oC
190oC
PS+5% CO2
0.94 mm Hele-Shaw
130oC
140oC
150oC
P (
Pa.s
)
Extensional rate (s-1)
Figure 4-9 Planar extensional viscosity of PS and PS/CO2 solution from the 0.94 mm Hele-Shaw
channel

73
the CO2 increases the free volume of PS, an effect equivalent to an increase of temperature
[Utracki and Simha (2001); Ferry (1980)]. Because the melt is more Newtonian like at an
increased temperature, the PS/CO2 solution should also be more Newtonian like than the PS
alone, resulting in the more significant reduction of the extensional viscosity of the solution. This
analogy between the influences of temperature and CO2 concentration on the rheological
properties of the PS is illustrated in Figure 3-7(a) and Figure 4-9 where we notice that, for both
the shear and the extensional viscosities, the PS values at 140oC overlap the solution values at
190oC.
Trouton ratios are compared in Figure 4-10. The extensional viscosities are from Figure
4-9, and the shear viscosities of PS/CO2 at corresponding shear rates were found from the data in
Figure 3-7 using time-temperature superposition. As in the previous figure, the solution produced
the same Trouton ratios at much lower temperatures, suggesting that, at the same temperature,
the solution is a less elastic fluid than the PS alone. All values in Figure 4-10 are higher than 4,
the value for Newtonian fluids, and increase with strain rate for all temperatures. The PS values
in Figure 4-10 are for the 0.94 mm channel and similar PS data were found for the 1.96 mm
channel in Figure 4-7. Both graphs show ratios well above 4 and not tending to that limit at low
extensional rates, in contrast to the EVF data in Figure 4-7. Since flow in the upstream straight
channel contained significant shearing, the abnormally high Trouton ratios may have been
caused by pre-shearing, an effect known to increase extensional stresses in a converging channel
[James et al. (1987); Yao and McKinley (2008)].

74
1 100
20
40
60
80
100
120
140
160 from 0.94 mm
Hele-Shaw channel
PS only
164oC
172oC
190oC
PS + 5% CO2
130oC
140oC
150oC
Tro
uto
n r
atio
Extensional rate (s-1)
Figure 4-10 Trouton ratios 𝜂𝑃 𝜀
𝜂 2∙𝛾 of the PS and the PS/CO2 solution calculated from the 0.94 mm
Hele-Shaw channel data at several temperatures.

75
Chapter 5 Influence of Rheological Properties on the Low-Density
Microcellular Foaming of Polylactic Acid
This chapter investigates the relationship between rheological properties of a polymer,
especially extensional property, and cell morphology from foam processing, characterized by
cell density, open-cell content, cell size uniformity, and expansion ratio. Because most previous
investigations of such relationship focused on polypropylene, a different polymer, polylactic acid
(PLA), is used in this study. This biodegradable polymer has the potential to replace traditional
non-biodegradable polymers in foaming and other applications. Establishing a relationship
between rheological properties and cell morphology is important for PLA, because the foams
may be used in different applications requiring different cell density, cell opening, and expansion
ratios.
Section 5.1 reviews previous efforts to develop foaming technology for PLA,
summarizing challenges and proposing solutions. Sections 5.2 and 5.3 present details of the
foaming experiment and physical properties of the PLAs used, especially their rheological
properties. Section 5.4 discusses the results from foaming experiments, in particular the
influence of material rheological properties and processing conditions on cell morphology. In
Section 5.5, flow-induced crystallization of semi-crystalline PLA is studied. And finally, Section
5.6 investigates experimentally the influence of crystallization on cell morphology from
extrusion foam processing.
5.1 Introduction
Polylactic acid (PLA), or polylactide, is a thermoplastic, aliphatic polyester derived from
renewable resources such as corn starch and sugarcanes, which can be fermented to produce
lactic acid monomer. The monomer is converted to lactide, from which high molecular weight
PLA is synthesized through ring-opening polymerization [Drumright et al. (2000)]. Due to its
biodegradability and biocompatibility, PLA has been used in biomedical applications such as
sutures [Frazza and Schmitt (1971)], tissue engineering scaffolds [Langer and Vacanti (1993);
Mikos et al. (1993)], and drug delivery devices [Johansen et al. (2000)]. During the past decade,

76
this once exclusively biomedical material has found numerous low-cost applications such as food
containers, grocery bags, and controlled release matrices for fertilizers and pesticides, because of
mass production by companies like NatureWorks LLC [Sawyer (2003)]. The foaming industry
has also expressed interest in this material, because PLA foams can potentially replace
polystyrene (PS) and polyurethane (PU) foams, which are widely used, but are either non-
biodegradable (PS) or non-recyclable (PU) [Lee et al. (2007)]. In particular, PLA foaming with
supercritical-CO2 is considered a 100% “green” technology because, unlike organic solvents,
CO2 can be removed completely after foaming [Mooney et al. (1996)].
Early efforts to produce PLA foams involved batch foaming in a chamber using various
blowing agents and solvents [Mooney et al. (1996); Maquet et al. (2000); Di et al. (2005); Ema
et al. (2006); Wang et al. (2007)]. This process is of little commercial value, however, because it
can only produce high-density foams, and productivity is extremely low. Recently, efforts have
been made to produce PLA foams from extrusion, especially low-density foams using CO2 as the
blowing agent, because the foams may be used as packaging and insulation materials. Lee et al.
(2008) and Reignier et al. (2007) studied comprehensively the CO2-foaming behaviour of
commercially available linear PLAs during extrusion. They were both able to achieve high
expansion ratios (over 20 times) using a capillary die and a high CO2 content (e.g., 9% by
weight), but the foams showed high open-cell content, poor mechanical properties, and shrank to
60% to 80% of their initial volumes after left in the atmosphere for 48 hours. Pilla et al. (2008)
studied the influence of epoxy-functionalized linear chain extender (CE), which connects chain
ends and hence increases viscosity, on the foaming behaviour of a linear PLA. They found that
expansion ratio increased with CE content, but the maximum expansion ratio was only 4 times.
The open-cell content, on the other hand, appeared unrelated to the CE content. The mechanical
and insulation properties of the low-density PLA foams produced in these studies are in general
inferior to foams of polystyrene and polyolefins, because of inferior cell morphologies.
In summary, development of low-density CO2-foaming process for PLA has suffered
several challenges. First, the low melt strength of commercially available PLAs, resulting from a
linear molecule and a relatively low molecular weight, gives rise to significant cell coalescence
and cell wall opening. Secondly, the faster permeation of CO2 through PLA, compared to
conventional polymers [Bao et al. (2006)], and the high open-cell content of the low-density
foams, cause the foams to shrink after processing [Reiginer et al. (2007)]. Thirdly, only limited

77
data are available of the solubility and diffusivity of CO2 in PLA and the rheological properties
of PLA/CO2 solution, making it difficult to optimize foaming process for better control of cell
nucleation and growth. And finally, the temperature window for producing low-density PLA
foams is very narrow, requiring high tolerance for process control.
The above challenges may be solved by optimizing the molecular structure of PLA and
thereby its physical properties, especially its rheological properties. As already discussed in
Section 2.3 using the cell model, when two neighbouring cells grow during foaming, the melt
between them is subjected to approximate biaxial stretching, and the cell wall will rupture if the
melt has reached its strain to break. If rupture occurs during the early stage of foaming, i.e., when
the melt is barely cooled, adjacent cells will merge into one cell, and the cell number density will
be reduced in the final foams. If rupture occurs when the melt is partially cooled, the ruptured
cell wall will maintain and cell opening is resulted. Increasing the melt viscosity and the strain to
break will prevent the cells from growing too fast and increase the maximum strain the melt can
endure. It should be mentioned that high cell number density may increase the chance of cell
opening, because the average cell wall thickness will be reduced compared to that of lower cell
number density.
The melt strength and strain to break of linear PLA may be increased by introducing long
chain branches into the molecules and also by controlling processing conditions. Increasing the
melt strength also suppresses permeation of gas through the polymer, and widens the temperature
window for producing low-density foams. The present study therefore investigates the low-
density, CO2 extrusion foaming behaviour of both linear and branched PLAs with different
molecular weight, molecular weight distribution, and, in the case of branched PLAs, branching
topology. The production of low-density foams involves higher extensional rates and higher
Hencky strains compared to the production of high-density foams. As a result, cell morphologies
are expected to be more sensitive to the rheological properties of the melt. Details of the study
are presented below.

78
5.2 Experimental
The same tandem system described in Section 3.1.2 was used. As shown in Figure 5-1, a
capillary die replaced the thin rectangular die in Figure 3-2 at the exit of the heat exchanger. Two
capillary dies were used, the flow channel of each begins with a reservoir of 10 mm in diameter
and 50 mm in length, followed by a small capillary of 1 mm in diameter and either 6 mm or 10
mm in length. The small capillaries provide enough resistances for the reservoir pressure to stay
above the solubility pressure during processing. The reservoir and the capillary are connected by
a cone with a total angle of 120o, which suppresses the formation of vortices at the entry. The
CO2 flow rate was controlled by the syringe gas pump in Figure 5-1, and the first extruder, the
gear pump, and the second extruder were all synchronized such that pressure was above the
solubility pressure everywhere in the system. Mass flow rate was determined by collecting a
sample at the die exit and weighing it, and foamed samples were collected by hand. For all
experiments, flow data and samples were not collected until a steady state had been reached,
typically within 20 minutes.
5.3 Properties of the Polymers
5.3.1 General Physical Properties
Four grades of polylactic acids were supplied by NatureWorks LLC. They will be
referred to as the linear PLA, the half-long chain branched (LCB) PLA, the LCB PLA, and the
LCB PLA with lubricant. According to the manufacturer, the linear PLA is a linear and low
crystallinity polymer (Ingeo 2002D), while the other three grades are branched polymers with
higher crystallinity prepared from melt blending of a linear polymer (Ingeo 8051D) with an
epoxy-based multi-functional oligomeric chain extender (Joncryl ADR-4368C, BASF Inc.). The
structures of the linear PLA and the chain extender are shown in Figure 5-2 (a) and (b),
respectively. According to literature [Villalobos et al. (2006); Bikiaris and Karayannidis (1995)],
the main reaction between the two is esterification of carboxyl end groups on PLA with epoxy
group on the chain extender, resulting in star-branched polymer. The functionality of the chain
extender, the number of epoxy groups per molecule, has a broad distribution, which maximizes
the elasticity of the branched polymer, and the average epoxy content is 285 g/mol. The weight

79
Figure 5-1 Schematic of the tandem extrusion system for foam extrusion using a capillary die;
the system setup is similar to that in Naguib et al. (2002)
reservoir

80
(a)
(b)
Figure 5-2 (a) Schematic of high molecular weight PLA molecule; (b) General structure of the
styrene-acrylic multi-functional oligomeric chain extenders; where R1 – R5 are H, CH3, a higher
alkyl group, or combinations of them; R6 is an alkyl group, and x, y, and z are each between 1
and 20; reproduced from Villalobos et al. (2006)

81
percentage of chain extender is 0.7% for preparing the two LCB PLAs and 0.35% for preparing
the half-LCB PLA. Assuming the chain extender has fully reacted with the carboxyl end groups,
the two LCB PLAs should have approximately two times the branching points as the half-LCB
PLA. Lubricant was added to one of the LCB PLAs to improve its processability and to delay the
onset of melt fracture during extrusion [Kulikov et al. (2007)]. For all three branched PLAs,
0.4%wt of talc was added as nucleating agent. It is well known that PLA has two stereoisomers,
PLLA and PDLA, and copolymer or blend of the two at different molar fractions show different
phase behaviour, including melting point and crystallization kinetics [Bastioli (2005)]. All four
PLAs have a PDLA molar content of 4.2%, but the crystallization kinetics of the linear PLA is
much slower than the branched ones, as will be presented below. This is mainly because of the
lack of talc, which facilitates heterogeneous nucleation, in the linear PLA.
Molecular weight distribution of all four PLAs are determined from size-exclusion
chromatography (SEC) by the manufacturer and shown in Table 5-1. The table indicates that
LCB PLAs have slightly more high-molecular-weight component than the half-LCB PLA, and
all three branched PLAs have significantly more high-molecular-weight component and wider
molecular weight distribution than the linear PLA. Also shown in Table 5-1 are the glass
transition temperature 𝑇𝑔 , the melting temperature 𝑇𝑚 , the isothermal crystallinity 𝜒𝑖𝑠𝑜 , and the
crystallinity from a cooling rate of -1 oC/min, 𝜒−1 , for the four PLAs, all determined on a
differential scanning calorimeter (DSC Q2000, TA Instruments). The melting temperature 𝑇𝑚
corresponds to the tip of the melting peak, while the isothermal and the -1 oC/min crystallinity
are determined by first increasing the sample temperature to well above 𝑇𝑚 , then either cooling it
to 100oC and letting it fully crystallize or cooling it to below 𝑇𝑔 at a rate of -1
oC/min, and finally
re-heating the sample to determine crystallinity. The data in Table 5-1 confirms that the linear
PLA has significantly lower crystallinity and slower crystallization kinetics compared to the
branched PLAs. The isothermal crystallinity is the maximum crystallinity attainable under static
conditions.

82
Table 5-1 Properties of the four PLAs
𝑀𝑛
(g/mol)
𝑀𝑊/𝑀𝑛 𝑇𝑔
(OC)
𝑇𝑚
(OC)
𝜒𝑖𝑠𝑜
(%)
𝜒−1
(%)
Linear PLA 132,000 1.4 57 N/A 7 0.04
Half-LCB PLA 215,000 2.5 57 151 29.1 30
LCB PLA 232,000 2.7 57 148 27.4 23.9
LCB PLA + lub. 232,000 2.7 57 148 27.2 27.7
For all characterization and processing experiments, the PLAs were dried at 60oC for 8
hours prior to use. This drying stage is necessary to prevent hydrolysis (degradation) in the
molten state. Solubility of CO2 in PLA, required for pressure control during extrusion, was
determined by Li et al. (2006). The solubility pressure for 9% CO2 in PLA at 180oC, for
example, is 19 MPa, or 2800 psi. The solid density of all three PLAs is 1.25 𝑔/𝑐𝑚3.
5.3.2 Rheological Properties
A. Shear Properties
Oscillatory shear data were determined on an ARES rheometer (TA Instruments Inc.)
using 25-mm parallel disks setup and a 0.8-mm gap. Complex viscosities at 180oC are presented
in Figure 5-3, where the viscosities of the branched PLAs are higher than that of the linear PLA
because of their higher molecular weights. The branching structure influences the complex
viscosity. In fact, in Figure 5-3 the viscosity of the half-LCB PLA is more similar to the linear
PLA than it is to the LCB PLAs, although all three branched PLAs have similar molecular
weight distributions.
The linear viscoelastic properties, 𝐺 ′ and 𝐺" , were determined at 180𝑜𝐶 , an arbitrary
processing temperature, for all three PLAs. The relaxation time determined from the crossover
point is 0.02 s for the linear PLA, 0.04 s for the half-LCB PLA, and 0.2 s for the two LCB PLAs.

83
0.1 1 10 100
103
104
Co
mp
lex v
isco
sity
* (P
a.s
)
Frequency (Hz)
180oC
LCB PLA
LCB PLA + Lub.
half-LCB PLA
linear PLA
Figure 5-3 Complex viscosities of the four PLAs at 180oC

84
This indicates that the linear viscoelastic properties of the half-LCB PLA are also more similar to
the linear PLA than they are to the LCB PLAs.
B. Extensional Properties
Measurements of the uniaxial extensional viscosities were made using the Extensional
Viscosity Fixture attached to the ARES rheometer, as described in Section 4.2. To prevent
sagging of the sample because of too low zero-shear viscosity, the linear PLA was characterized
at 140oC. The three branched PLAs, on the other hand, were characterized at 160
oC to avoid
crystallization during measurement. Values of the uniaxial extensional viscosities are presented
in Figure 5-4 at several extensional rates. The linear PLA exhibits little strain hardening, and its
extensional viscosity approaches a steady-state value for the two higher extensional rates.
Necking of the sample, indicated by a decaying viscosity, is found at the two lower extensional
rates. The Hencky strain where necking occurs, the strain to break, is 0.2 for the lowest
extensional rate, and it increases with the extensional rate. This increase is attributed to less
relaxation of the chains during extension, and, according to molecular theory [McKinley and
Hassager (1999)], the strain to break approaches a maximum in the limit of rapid extension when
the chains do not relax at all. The increase of strain to break with extensional rate is beneficial to
foaming because cell growth normally induces high extensional rates in the melt [Guo et al.
(2006)].
The uniaxial extensional viscosities of the three branched PLAs exhibit significant strain
hardening at all extensional rates, and contrary to the shear data in Section 5.3.2 A, the
extensional viscosities of the half-LCB PLA are more similar to those of the LCB PLAs than
they are to the linear PLA, indicating, possibly, that the side chains affect the extensional
properties more significantly than the shear properties [Auhl et al. (2004)]. Because of the
Hencky strain limit with the EVF, strain to break cannot be determined for the branched PLAs.
Nevertheless, experiments by other authors (e.g. Auhl et al. (2004)) and predictions from the
molecular theory suggest that it increases with the length and density of side chains and also with
a widening of molecular weight distribution of the polymer. A higher strain to break for the
branched PLAs will be beneficial to the processing of low-density foams.

85
(a) (b)
0.01 0.1 110
3
104
105
106
LCB PLA
160oC
0.1s-1 0.5s
-1
1.0s-1 3.0s
-1
E
+(P
a.s
)
H
0.01 0.1 110
3
104
105
106
LCB PLA + lub.
160oC
0.1s-1 0.5s
-1
1.0s-1 3.0s
-1
E
+(P
a.s
)
H
(c) (d)
Figure 5-4 Transient uniaxial extensional viscosities of: (a) the linear PLA at 140oC; (b) the
half-LCB PLA at 160oC; (c) the LCB PLA at 160
oC; (d) the LCB PLA with lubricant at 160
oC
0.01 0.1 110
3
104
105
106
linear PLA
140oC
0.1s-1 0.5s
-1
1.0s-1 3.0s
-1
E
+ (
Pa
.s)
H
0.01 0.1 110
3
104
105
106
E
+ (
Pa
.s)
H
half-LCB PLA
160oC
0.1s-1 0.5s
-1
1.0s-1 3.0s
-1

86
In order to investigate the influence of branching topology on foaming, two blends of the
LCB PLA (without lubricant) and the linear PLA, at weight ratios of 10% - 90% and 20% - 80%,
were prepared using a twin-screw compounder. The uniaxial extensional viscosities of these
blends were determined at 140oC, and they are compared to the extensional viscosities of the
linear PLA in Figure 5-5. Clearly, as the amount of long-chain-branched component increases,
the blends become more strain hardening and more viscous. Foaming experiments using these
blends will be presented shortly.
5.4 Results and Discussions
5.4.1 Processing Strategies
For each PLA or blend, foaming experiments were conducted in the following way:
beginning with the highest processing temperature (usually 170oC in the die), 5% CO2 by weight
was injected and a flow rate was chosen such that, at steady state, the capillary die pressure was
above the solubility pressure. After foams were collected at the die exit, the die temperature and
the heat exchanger temperature were lowered together, and foamed sample was not collected at
the new temperature until the system has reached a steady state for at least 5 minutes. The
temperature was then further lowered until the die pressure was too high (e.g., above 4500 psi),
when the CO2 content was increased to 7% by weight. As a result, experiment could be
continued at lower temperatures because of increased plasticizing effect of CO2, and when the
die pressure was too high again, the CO2 content was increased to 9% by weight, and the
temperature was further decreased until the experiment had to stop.
The capillary die pressures, measured at the exit of the heat exchanger, are shown for the
LCB PLA in Figure 5-6. Die pressures for the other PLAs and blends follow a similar trend. The
die pressures suggest that the plasticizing effect of each additional 2% CO2 by weight is
approximately equivalent to a temperature increase of 10oC. The flow rate ranged between 11
and 14 g/min, depending on the polymer and the processing conditions. Except for the two LCB
PLAs, which were extruded from the 6-mm die, all the other PLAs and blends were extruded
from the 10-mm die.

87
(a)
0.01 0.1 110
3
104
105
106
E
+ (
Pa
.s)
H
140oC
0.1s-1
0.5s-1
1.0s-1
3.0s-1
0.01 0.1 110
3
104
105
106
E
+ (
Pa
.s)
H
140oC
0.1s-1
0.5s-1
1.0s-1
3.0s-1
(b) (c)
Figure 5-5 Transient uniaxial extensional viscosities of: (a) the linear PLA at 140oC; (b) blend of
10% LCB PLA and 90% linear PLA at 160oC; (c) blend of 20% LCB PLA and 80% linear PLA
at 160oC
0.01 0.1 110
3
104
105
106
linear PLA
140oC
0.1s-1 0.5s
-1
1.0s-1 3.0s
-1
E
+ (
Pa
.s)
H

88
120 130 140 150 160 170
2000
2500
3000
3500
4000
4500
5000
5500
Die
Pre
ssure
(psi)
Die temperature (oC)
LCB PLA
5% CO2
7% CO2
9% CO2
Figure 5-6 Exit die pressure as a function of CO2 concentration by weight and die temperature
for the long-chain-branched (LCB) PLA

89
5.4.2 Cell Densities
The foamed samples were dipped in liquid nitrogen and snapped to reveal the cells on the
cross section. The cells were then observed on a scanning electron microscope (SEM), and the
cell density 𝑁𝑐𝑒𝑙𝑙 was calculated using the following equation
𝑁𝑐𝑒𝑙𝑙 = 𝑛
𝐴
3/2
∙𝜌𝑃
𝜌𝑓 (5-1)
where n is the number of cells on an SEM image, A is the area of the image, and 𝜌𝑃 and 𝜌𝑓 are
the densities of the unfoamed and foamed PLA, respectively. The cell densities are shown for the
linear, the half-LCB, and the LCB (without lubricant) PLAs in Figure 5-7. At the same
temperature and CO2 content, cell densities for the LCB PLA appeared higher than those for the
half-LCB PLA, which are in turn higher than those for the linear PLA. The higher cell densities
for the branched PLAs may result from the presence of nucleating agent, less cell coalescence as
the melt strength increases with the number of branching points, or even the nucleating effect of
crystal precursors in the branched PLAs extruded at lower temperatures.
For any given PLA, the cell density increases with the CO2 content, but is not very
sensitive to the change of temperature. According to classical nucleation theory (see Equations
(2-5) to (2-8) in Chapter 2), the nucleation rates for both homogeneous and heterogeneous
nucleation are determined by the oversaturation of BA (∆𝑃 in Equation (2-5)), which, in this
case, is a function of pressure drop rate in the die. The pressure drop rate is calculated as the die
pressure divided by the average residence time of melt in the capillary. It varies mildly
between 500 𝑀𝑃𝑎/𝑠 and 1 𝐺𝑃𝑎/𝑠 as a function of temperature, and nucleation rates are
therefore expected to be similar over this range [Xu et al. (2003)]. In contrast to temperature,
higher CO2 content increases the chance of forming nuclei larger than the critical radius, giving
rise to higher nucleation rates, and therefore higher cell density.
5.4.3 Expansion Ratios
Expansion ratio is defined as the ratio of foam density to the density of unfoamed
polymer. In general, the expansion ratios of a thermoplastic polymer at higher processing

90
110 120 130 140 150 160 170 18010
5
106
107
108
109
Ce
ll d
en
sity (
ce
lls/c
m3)
Die temperature (oC)
LCB PLA
9% CO2
7% CO2
5% CO2
Half-LCB PLA
9% CO2
7% CO2
5% CO2
Linear PLA
7% CO2
5% CO2
Figure 5-7 Cell densities of the linear, the half-LCB, and the LCB (without lubricant) PLAs
from foam extrusion as a function of processing temperature

91
temperatures are low because low melt strength gives rise to significant cell coalescence,
creating channels for the BA to escape to the environment [Naguib et al. (2002)]. The escaping
process is accelerated by high diffusivity of the BA at these temperatures. The expansion ratio
increases as the temperature is lowered, and it reaches a maximum when the melt strength and
the BA diffusivity are well balanced. Below the optimal temperature, expansion ratio decreases
again because the melt is too stiff to be stretched. The expansion ratio usually increases with BA
concentration, although a too high concentration causes undissolved gas pockets in the foams. In
this section, we present expansion ratios of the PLA foams obtained from bulk density
measurement. The cell morphology of these foams will be presented in the next section.
The expansion ratios of all four grades of PLAs are shown in Figure 5-8(a), where they
increase with CO2 concentration and decrease with processing temperature without exception.
For the linear and the half-branched PLAs, expansion ratios are very low (< 2 times) except with
9% CO2 and at the lowest temperature. The dotted line for the linear PLA indicates a range over
which the foams are reticulated due to cell rupture, as will be shown in Section 5.4.4. In contrast,
expansion ratios of the two LCB PLAs are much higher, and ultra low-density foams with
expansion ratios over 40 were produced at temperatures below 117oC using 9% CO2. For very
high expansion ratio foams, it is of interest to calculate the theoretical expansion ratio, and
thereby to learn the foaming efficiency of the CO2. This theoretical ratio assumes no escape of
the BA to the environment, and is calculated as [Naguib et al. (2002)]
𝑉𝑡 = 1 + 𝑤𝑡%𝐵𝐴 ∙𝜈𝐵𝐴
𝜈𝑃= 1 + 𝑤𝑡%𝐵𝐴 ∙
𝑅𝑔 ∙𝑇/ 𝑃∙𝑀𝑊 ,𝐵𝐴
𝜈𝑃 (5-2)
where 𝑤𝑡%𝐵𝐴 is the weight percentage of the BA, 𝜈𝑃 is the specific volume of the polymer, 𝜈𝐵𝐴
is the specific volume of the BA calculated from the ideal gas law, and 𝑀𝑤 ,𝐵𝐴 is the molar mass
of the BA. From this equation, the maximum expansion ratio is 65 times for 9% CO2 at 115oC.
Considering shrinkage of the BA due to cooling while the cells were still growing, the foams
produced at 115oC have almost reached the full potential of the blowing agent!
Expansion ratios of the PLA blends, for 9% CO2 only, are compared to those of the base
PLAs in Figure 5-8(b). The expansion ratios increase with the amount of LCB PLA added.
Interestingly, expansion ratios of the blend with 10% fully-branched PLA already show
significant improvement over those of the linear PLA. This is consistent with findings in the
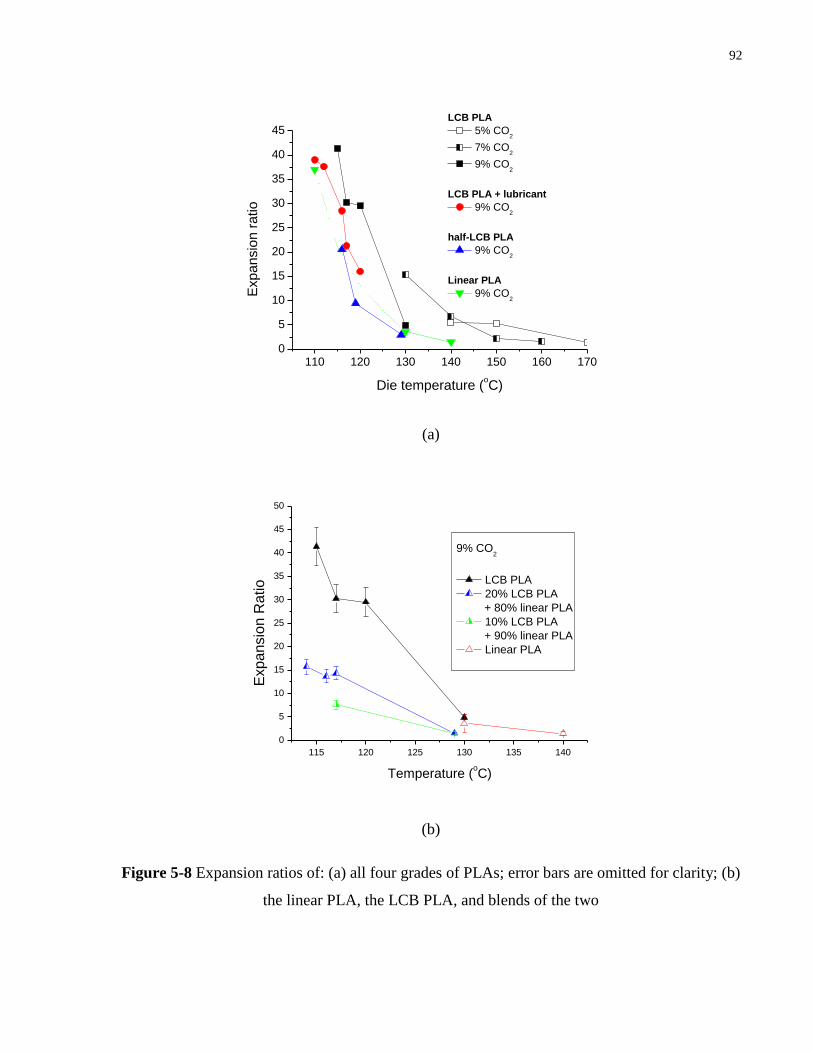
92
110 120 130 140 150 160 1700
5
10
15
20
25
30
35
40
45LCB PLA
5% CO2
7% CO2
9% CO2
LCB PLA + lubricant
9% CO2
half-LCB PLA
9% CO2
Linear PLA
9% CO2
Expansio
n r
atio
Die temperature (oC)
(a)
115 120 125 130 135 140
0
5
10
15
20
25
30
35
40
45
50
Expansio
n R
atio
Temperature (oC)
9% CO2
LCB PLA
20% LCB PLA
+ 80% linear PLA
10% LCB PLA
+ 90% linear PLA
Linear PLA
(b)
Figure 5-8 Expansion ratios of: (a) all four grades of PLAs; error bars are omitted for clarity; (b)
the linear PLA, the LCB PLA, and blends of the two

93
literature [Spitael & Macosko (2004); Stange & Mϋnstedt (2006)] that expansion ratios of linear
PP may be improved by adding a small amount of long-chain-branched PP.
5.4.4 Cell Morphologies from SEM
Figure 5-9 presents cell morphologies of the PLAs and the blends, taken from the centre
of the extruded filament and observed on a scanning electron microscope (SEM). The
temperatures correspond to the highest expansion ratios at the given CO2 concentration. For the
linear and the half-LCB PLAs, the foams with 5% CO2 show isolated cells (Figure 5-9 (a) and
(d)) resulting from cell coalescence at high temperature. Cells for the LCB PLA with 5% CO2
are better grown (Figure 5-9 (g)), but the cell walls appear thick because of a low expansion
ratio. The foams are better expanded at 7% CO2 (Figure 5-9 (b), (e), and (h)), and then at 9%
CO2, foams with the linear PLA show complete open-cell structure even at the lowest
temperature (Figure 5-9 (c)). Foams with the half-LCB PLA also show open-cell structure
(Figure 5-9 (i)), although the cell shapes are better maintained compared to linear PLA foamed at
the same temperature, and foams with the two LCB PLAs at 9% CO2 show closed cells (Figure
5-9 (i) and (j)). Foams with the 10% blend also show open-cell structure (Figure 5-9 (k)) similar
to the half-LCB PLA, but foams with the 20% blend (Figure 5-9 (l)) show closed cells similar to
the LCB PLAs, possibly because of the lower expansion ratio of the 20% blend in Figure 5-9 (l)
and the lower processing temperature compared to the half-LCB PLA in Figure 5-9 (f).
Figure 5-10 presents SEM images of the extruded filaments using 9% CO2 and at the
lowest temperature, for the LCB PLA (Figure 5-10 (a)) and the half-LCB PLA (Figure 5-10 (b)).
The cells on the outer edge show lower cell density and higher closed-cell content compared to
those in the core. The result occurs because melt on the outer circle suffers from shearing in the
die and a consequent loss of BA to the environment.
From the results in Figure 5-8 and 5-9, it can be concluded that cell morphology and the
expansion ratios of foams are closely related. If an open-cell structure is induced, BA will
quickly diffuse out from the melt, and the foams will not expand. If a closed-cell structure is
induced, gas will diffuse into individual cells and blow them up. Loss of BA to the environment
is reduced compared to open-cell structure because of resistance from the cell walls. For the

94
(a) (b) (c)
(d) (e) (f)
(g) (h) (i)
(j) (k) (l)
Figure 5-9 SEM images of the cellular structures; the temperatures correspond to the highest
expansion ratios at the given CO2 concentration: (a) linear PLA, 5% CO2, 140oC; (b) linear PLA,
7% CO2, 130oC; (c) linear PLA, 9% CO2, 110
oC; (d) Half-LCB PLA, 5% CO2, 140
oC; (e) Half-
LCB PLA, 7% CO2, 130oC; (f) Half-LCB PLA, 9% CO2, 116
oC; (g) LCB PLA, 5% CO2, 140
oC;
(h) LCB PLA, 7% CO2, 130oC; (i) LCB PLA, 9% CO2, 115
oC; (j) LCB PLA + lubricant, 9%
CO2, 110oC; (k) 10% LCB + 90% linear PLA, 9% CO2, 117
oC; (l) 20% LCB PLA + 80% linear
PLA, 9% CO2, 114oC

95
(a)
(b)
Figure 5-10 Cross sections of the extruded filament: (a) LCB PLA with 9% CO2 at 115oC; (b)
half-LCB PLA with 9% CO2 at 116oC; Notice the open-cell structure in the core of the half-LCB
PLA filament

96
linear and the half-LCB PLAs, open-cell structures are induced in the core of the filament, and
volume expansion is not caused by expansion of the cells in the core, but by expansion of the
outer part of the filament. The foams in this case have poor mechanical properties because of
reduced connectivity among cells in the core. For the closed-cell foams produced with the LCB
PLAs, then, foam expansion is driven by the growth of individual cells, and the expansion ratio
is determined by the gas pressure inside the cells and the melt strength.
Cell morphology is also closely related to the rheological properties of the polymers. As
discussed in Section 2.3 and 5.1, low-density foaming involves significant extension of the melt.
If the melt has adequate viscosity and strain to break, cells will grow at a reasonable rate, and
significant strain can be induced without rupturing the cell wall, resulting in closed-cell low-
density foams. If the melt viscosity is low, cell wall may rupture due to overstretching, and open
cell is resulted. Molecular branching increase the extensional viscosity and the strain to break,
and this is why open-cell content is significantly reduced as the number of branching points is
increased in the melt (e.g., for the LCB PLAs).
5.5 Influence of Processing Conditions on PLA Crystallization
In Section 5.5, we see that material rheological properties, in particular the melt viscosity
and the strain to break, have a strong influence on the foaming behaviours of PLA. Since the
PLAs used in this study, especially the LCB PLAs, are semi-crystalline, crystallization may
affect cell growth. The crystallinity of foams with the LCB PLA and the half-LCB PLA was
determined on DSC, and the results are presented in Figure 5-11. Crystallinity of the foamed
polymer generally increases with CO2 content and decreases with temperature. Interestingly, the
increase of crystallinity matches the increase of expansion ratios presented in Figure 5-8(a). In
the literature, it is well-known that PLA has very slow crystallization kinetics compared to
polyolefins [Takada et al. (2004)], and that extruded PLA usually show little crystallinity. The
crystallinity developed in PLA foams must have been induced by the unique processing
conditions associated with foam processing. This section therefore investigates the influence of
processing conditions on the crystallization of PLA.
Crystallization of PLA occurs when it is cooled from a molten state to below its melting

97
110 120 130 140 150 160 1700
5
10
15
20
Cry
sta
llin
ity
(%
)
Die temperature (oC)
LCB PLA
5% CO2
7% CO2
9% CO2
Half-LCB PLA
9% CO2
Figure 5-11 Crystallinity of the foams as a function of CO2 content and temperature, for the
LCB PLA (without lubricant) and the half-LCB PLA

98
temperature. During foam extrusion, PLA is cooled to below its melting temperature in the heat
exchanger (see Figure 5-1), and it stays in the die isothermally, for about 30 seconds, before it is
exposed to the atmosphere and cooled to below its glass transition temperature, when
crystallization stops. Possible mechanisms that accelerate PLA crystallization during foam
processing include the presence of CO2, shearing in the flow channels, and extensional flows
induced by cell growth. According to literature (e.g., Yu et al. (2008)), the presence of CO2
lowers the crystallization temperature of PLA, but whether it accelerates crystallization depends
on the temperature. Shearing and extension are well-known to increase the kinetics of
crystallization, sometimes by several orders of magnitude, because the polymer chains are
oriented by the flow [Schultz (2001)]. To investigate this effect, a series of experiments were
conducted by shearing the LCB PLA prior to crystallization: A ring-shaped sample was placed
between a cone and a plate on the ARES rheometer. It was heated to above 𝑇𝑚 and given 10
minutes to melt. Shearing was then imposed at a shear rate of 50 s-1
for 20 seconds, following
which the sample was cooled to a temperature below 𝑇𝑚 to crystallize isothermally. The storage
modulus was measured using very low strain, and the modulus was found to increase as the melt
crystallizes. The time needed to attain 50% of the steady state crystallinity, the crystallization
half time 𝑡1/2 , is shown in Figure 5-12, in comparison with 𝑡1/2 of PLAs not subjected to
shearing. Clearly, shearing accelerated crystallization significantly, and the associated 𝑡1/2 is
comparable to the residence time in the die after cooling by the heat exchanger. The mechanism
of crystallization is therefore clarified.
From the same experiment, 𝐺 ′ was determined as a function of crystallinity and the
results are plotted in Figure 5-13. The modulus increased by one order of magnitude for a 15%
crystallinity, the value found in the ultra low-density foams of LCB PLA. It is therefore expected
that crystallization increased the melt strength during cell growth. In the literature, crystallization
during foam extrusion is often assumed to suppress the expansion ratio, because it stiffens the
melt [Naguib et al. (2002)]. If the crystallinity is properly controlled, however, crystal structures
may increase the melt strength favorably and suppress diffusion of BA through the melt
[Hedenqvist and Gedde (1996)]. Foams with crystal structures also show better mechanical
properties and dimensional stability compared to amorphous foams [Klempner & Sendijarevic
(2004)]. Crystallization-induced gelation is also superior to that induced by cross-linking agents,
which are sometimes used in foam extrusion of low-melt-strength polymers, but introduces

99
90 100 110 120 130
0
5
10
15
Cry
sta
llization h
alf t
ime t
1/2 (
min
)
Isothermal crystallization temperature (oC)
LCB PLA
without shearing
after shearing at 160oC
shear rate = 50 s-1
tshear
= 20 s
Figure 5-12 Crystallization half time for the LCB PLA with and without shearing; the
crystallinity at these half times is approximately 15%

100
0 5 10 15 20 25 30 35
1
10
100
G' c
rysta
llin
e/G
' am
orp
ho
us
Crystallinity (%)
Figure 5-13 Ratio of the storage modulus of crystalline PLA to that of amorphous PLA as a
function of crystallinity; the material is LCB PLA without lubricant

101
permanent linkage between the chains and causes non-recyclability. In comparison,
crystallization is controlled by processing conditions and geometry of the die channel, and does
not impose any additional costs on the manufacturing process. Given all these potential
advantages, an experimental study was conducted to control crystallization during foam
processing and thereby to compare the resultant cell morphology. The results are presented in the
next section.
5.6 Controlling PLA Crystallization and Its Influence on Foaming
Crystallization of PLA during foam processing was controlled by varying the length of
the reservoir in the capillary die, as is already shown in Section 5.2, and thereby controlling the
isothermal residence time prior to cell nucleation and growth. Two capillary dies were designed.
Both dies have a capillary of 1 mm in diameter, but the capillary lengths are 6 mm and 10 mm,
respectively. The 6 mm die has a long reservoir corresponding to a residence time of
approximately 90 seconds prior to cell nucleation, while the 10 mm die has negligible reservoir,
corresponding to a residence time of approximately 0 seconds. Foaming experiments were
conducted using LCB PLA, 9% CO2, and following the same strategy as already described in
Section 5.2.
Expansion ratios of the foams as a function of processing temperature are presented for
the two dies in Figure 5-14. It is clearly seen that the die with a longer residence time induced
higher crystallinity, and high-expansion ratio foams could be produced over a much wider
temperature window compared to the short die. Below 115oC, the expansion starts to decrease
because of too high melt strength of the polymer. Foams produced from the short die, however,
show much lower crystallinity at the same temperature, and the expansion ratio keeps increasing
until the experiment had to be stopped because of too high die pressure, indicating that melt
strength is not high enough to induce the maximum expansion ratio.
SEM images of the cell structure are presented in Figure 5-15. Again, the influence of
crystallization is clearly seen. Foams with the highest crystallinity, those produced from the long
die at 112oC (Figure 5-15 (a)), show close-cell structure, while those produced from the long die
at a higher temperature (Figure 5-15 (b)) or those from the short die (Figure 5-15 (c) and (d))

102
110 115 120 125 130 1350
5
10
15
20
25
30
35
40
Exp
an
sio
n r
atio
Die temperature (oC)
LCB PLA
9% CO2
crystallization time = 0
crystallization time
= 1.5 minutes
Figure 5-14 Expansion ratios of foams produced after different time for crystallization. The
material is LCB PLA and crystallinity of the foam skin, determined on DSC, is shown for several
conditions
χ =3%
χ =18%
χ =15%
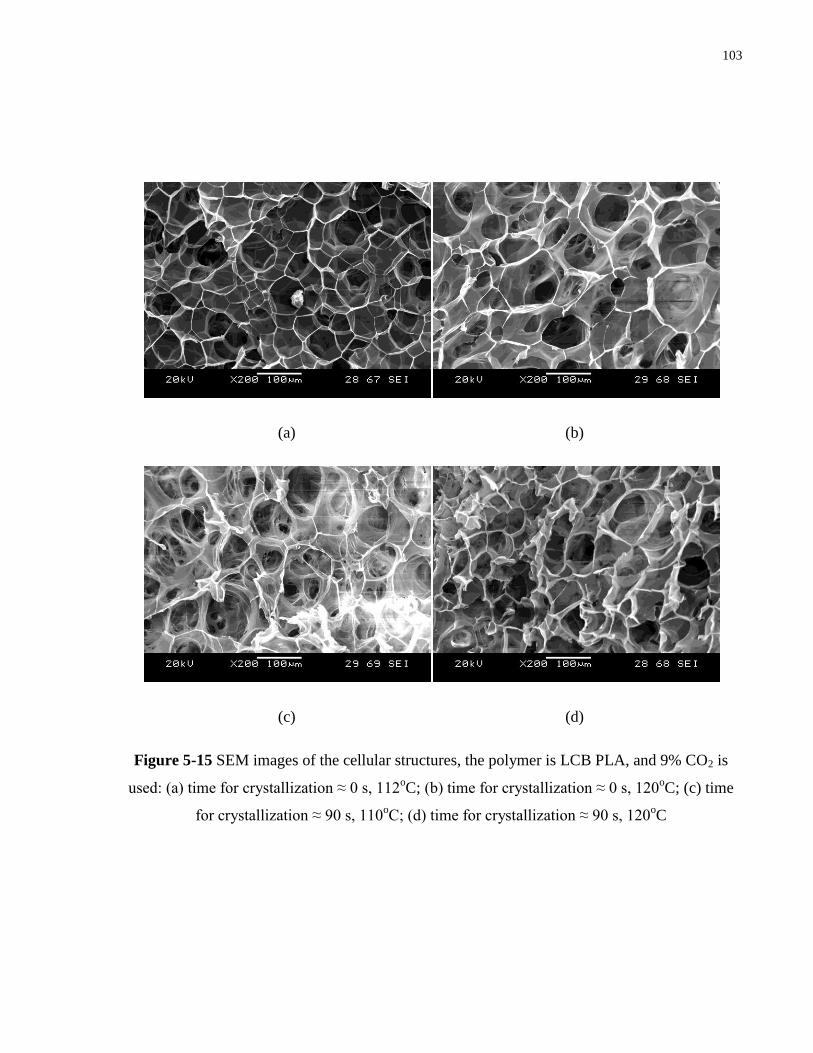
103
(a) (b)
(c) (d)
Figure 5-15 SEM images of the cellular structures, the polymer is LCB PLA, and 9% CO2 is
used: (a) time for crystallization ≈ 0 s, 112oC; (b) time for crystallization ≈ 0 s, 120
oC; (c) time
for crystallization ≈ 90 s, 110oC; (d) time for crystallization ≈ 90 s, 120
oC

104
show more open cells. For the short die, open cell content increases with the expansion ratio,
which is evidence that crystallization almost did not occur in this case. Foams with higher
crystallinity also have better surface finish and better mechanical properties.

105
Chapter 6 Conclusions
As stated in Chapter 1 of this thesis, the production of microcellular foams involves
subjecting a polymer/BA mixture to a series of well-defined kinematic motions, such that the
main stages of processing are precisely controlled. In spite of the rapid progress in developing
microcellular technology for commercial polymers during the past two decades, many challenges
still remain. The work presented in this thesis contributes to understanding the rheological
properties, especially the extensional properties, of polymer melts and polymer/BA solutions and
to understanding the relationship between material rheological properties and cell morphology
from processing. The polymers and the experimental techniques have been chosen so that the
physical processes of interest become dominant and can be investigated quantitatively. Among
the major accomplishments of this thesis are:
1. Design and construction of a rheological die for characterizing the shear and planar
extensional properties of polymer melts and polymer/BA solutions from pressure drop
measurement. The flow channel consists of a thin straight rectangular channel with a high
aspect ratio, for determining shear properties, followed by a thin hyperbolically
convergent rectangular channel, for determining extensional properties once shearing is
accounted for. This die design has several advantages over previous designs (e.g., Wang
and Park (2006)), which have contributed to the reliability of measured data: first,
pressure transducers can be flush-mounted on the channel wall to eliminate errors;
secondly, the flow channel can be easily machined to a high precision and its dimensions
allow the flow to be treated as a motion 2D; and finally, temperature can be well
controlled throughout the die.
2. Determination of the shear properties of a polymer melt and a polymer/CO2 solution
utilizing the rheological die, and comparison of data with those in the literature and those
determined on commercial rheometers. The viscosity of the melt was determined over
shear rates between 10-2
s-1
and 104 s
-1, and the data agree excellently with data using the
rheometers. The viscosity of the solution was determined over two decades of shear rate,
and the influence of CO2 on melt viscosity was found to follow a WLF-type equation.
106
3. Identified necessary conditions that enable fluid extensional properties to be determined
from a hyperbolically convergent channel. In previous studies using such channels, the
authors found that shearing is dominant and extensional information could not be
extracted. The results in this thesis demonstrate that, if the fluid is very elastic and very
shear-thinning, an approximately extensional flow is induced over a good fraction of the
hyperbolic channel, and planar extensional behaviour of the fluid can be characterized.
4. Determination of the planar extensional viscosity of a polymer melt and a polymer/CO2
solution from the rheological die, comparison of data with uniaxial extensional viscosity
determined on a shear-free rheometer, and investigation of the difference between the
two sets of data. Planar extensional viscosity was determined from pressure drop
measurements in the convergent channel after deducting the calculated pressure drop due
to shearing. Unlike previous entry flow analyses, which considered the extensional
viscosity as a function of extensional rate alone, the analysis in this thesis made a more
realistic assumption that extensional viscosity depends on both extensional rate and
strain. Extensional viscosity of the melt alone determined from the channel and that from
the shear-free rheometer compare reasonably, with possible error sources clearly
identified in the thesis. A comparison of the shear and extensional viscosities of the
polymer/CO2 solution indicates that the influence of CO2 on fluid rheological properties
is similar to an increase of temperature, because both increase the free volume of the
melt.
5. Characterized the thermal and rheological properties of biodegradable polymers with
different molecular structures, and investigated the influence of molecular branching on
the polymers‟ low-density, microcellular extrusion foaming behaviour. These polymers
have the potential to replace traditional non-biodegradable polymers in foaming
applications. With this polymer, the number of branches is well controlled, and it was
found that rheological properties, especially extensional properties, provide the most
sensitive probe to branching topology. Foaming experiments with these biodegradable
polymers indicate that long chain branching increases the cell density of foams either by
increasing the nucleation density or by suppressing cell coalescence during the early
stage of foaming. It was also found that long chain branching also increases melt

107
viscosity and strain to break, allowing the production of low-density foams with closed
cells.
6. Characterized the crystallization behaviour of both linear and branched biodegradable
polymers, and investigated the influence of CO2- and flow-induced crystallization on cell
morphology from low-density, microcellular extrusion foam processing. The influence of
crystallization on cell morphology has not been studied in the literature because, for most
commercial polymers, the crystallization kinetics is either too fast, such as polyolefins, or
too slow, such as polycarbonate, making it very difficult to control the degree of
crystallinity during processing. The biodegradable polymers used in this thesis, polylactic
acids, were synthesized to have mild, controllable crystallization kinetics. The kinetics
was characterized under well-controlled thermal and flow conditions relevant to
processing, and the information was used to design foaming experiments that produced
foams with controlled crystallinity. It was found that flow-induced crystallization
increases the melt strength and suppresses the permeation of CO2 through the melt,
thereby significantly reducing open-cell content in the foams. Because part of the
crystallinity was induced by cell growth, the melt did not become too stiff before they
reach their extensional limit, resulting in the production of high-expansion-ratio foams
with closed cells and good mechanical properties. For the first time, it was shown that
foams produced from crystallized melt also show better surface finish and is free from
post-processing volume shrinkage.
Many questions remain, of course, and in continuing this project in the future, the
following topics may be interesting from both theoretical and practical points of view:
1. Determining the actual velocity distribution over the hyperbolically convergent
rectangular channel for a highly-elastic fluid. In this thesis, it is assumed that velocity
distribution depends on the shear properties alone, and that no secondary flow is present.
These assumptions are reasonable considering that the channel is so thin and stress
gradient in secondary flow directions is small compared to the stress gradient generated
in the primary flow direction. Nevertheless, acceleration of flow by the convergent
profile and development of excessive extensional stress along a streamline may affect the
velocity distribution, possibly making the velocity profile in the channel thickness

108
direction “blunter” than the calculated profile in this thesis. The velocity distribution, at
least over the mid-plane of the channel, may be determined by particle imaging
velocimetry (PIV) technique.
2. Calculating stress and velocity distribution over the convergent channel using proper
constitutive models for viscoelastic fluids. From the literature (e.g., Larson (1988)), we
know that no constitutive equation is capable of describing all types of extensional
properties for a polymer melt using only one set of parameters. Nevertheless, the free
parameters may be determined using shear and uniaxial extensional viscosities
determined on commercial rheometers and then the stress distribution in the thickness
direction may be calculated for the center plane of the hyperbolic channel. Such
calculations will yield information about the stress-strain relationship for a viscoelastic
fluid in a mixed flow and allowing theory and experimental results to be compared.
3. Predicting pressure drop over complicated die channels and injection mold cavities using
rheological properties determined from commercial or in-house techniques. A full-scale
simulation using constitutive equations involving multiple relaxation times is time
consuming and subject to error. The technique used in this thesis for calculating pressure
drops allows for simple, albeit approximate, calculation to be carried out. This involves
assuming that the velocity distribution depends on shearing alone, and that the pressure
drop due to shearing and extension can be determined independently by integrating the
stress along a streamline. The usefulness and reliability of this technique for calculating
general flow channels needs to be examined.
4. Studying the development of crystal structure during foam processing. For a crystalline
polymer such as PLA, it is useful to control the crystal morphology, including crystal
size, shape, and orientation, so that they are favorable for developing desired cell
morphology and for further processing. One example of further processing concerns the
production of expanded-PLA foams. This involves cutting the extruded PLA foam
filament into small beads, and then joining these beads in a mold under elevated
temperature and pressure, usually using hot steam, to produce a foamed product of any
shape. The crystal structure on the surface of the foam beads is critical to the bonding

109
strength between beads, and hence the mechanical properties of the entire foamed
product.
5. Finally, once the foaming behaviour of the PLA alone has been clarified, it is important
to investigate the behaviour of blends of PLA with other polymers. These blends
typically show phase behaviour and rheological properties between those of the two
components, and their foaming behaviour will depend on factors such as the domain
morphology, the interface compatibility, and solubility of blowing agent in the two
components. Foams produced from these blends may have different physical properties
than foams produced from either of the components, and may be used in a variety of
applications.

110
Bibliography
1. Amon, M., C. D. Denson, “Study of the dynamics of foam growth: analysis of the growth of
closely spaced spherical bubbles,” Polym. Eng. Sci. 24, 1026-1034 (1984)
2. Amon, M., C. D. Denson, “Study of the dynamics of foam growth: simplified analysis and
experimental results for bulk density in structural foam molding,” Polym. Eng. Sci. 26, 255-
267 (1986)
3. Areerat, S., T. Nagata and M. Ohshima, “Measurement and prediction of LDPE/CO2 solution
viscosity,” Polym. Eng. Sci. 42, 2234-2245 (2002)
4. Auhl, D., J. Stange, H. Münstedt, et al., “Long-chain branched polypropylenes by electron
beam irradiation and their rheological properties,” Macromolecules 37, 9465-9472 (2004)
5. Baldwin, D. F., D. Tate, C. B. Park, S. W. Cha and N. P. Suh, “Microcellular plastics
processing technology (1),” Journal of Japan Society of Polymer Processing (SEIKEI-
KAKOU) 6, 187-194 (1994a)
6. Baldwin, D. F., D. Tate, C. B. Park, S. W. Cha and N. P. Suh, “Microcellular plastics
processing technology (2),” Journal of Japan Society of Polymer Processing (SEIKEI-
KAKOU) 6, 245-256 (1994b)
7. Bao, L., J. R. Dorgan, D. Knauss, S. Hait, N. S. Oliveira and I. M. Maruccho, “Gas
permeation properties of poly(lactic acid) revisited,” J. Membrane Sci. 285, 166-172 (2006)
8. Barlow, E. J. and W. E. Langlois, “Diffusion of gas from a liquid into an expanding bubble,”
IBM J., 329-337 (1962)
9. Bastioli, C. Eds., Handbook of biodegradable polymers, Rapra Technology Ltd., Shawbury,
UK (2005)
10. Batchelor, G. K., An introduction to fluid dynamics, Cambridge University Press, Cambridge
(2000)
11. Bikiaris, D. N. and G. P. Karayannidis, “Chain extension of polyesters PET and PBT with
N,N‟-Bis(glycidyl ester) Pyromellitimides. I,” J. Polym. Sci.: Part A: Polym. Chem. 33,
1705-1714 (1995)
12. Binding, D. M., “An approximate analysis for contraction and converging flows,” J. Non-
Newtonian Fluid Mech. 27, 173-189 (1988)
13. Bird, R. B., R. C. Armstrong and O. Hassager, Dynamics of Polymeric Liquids, Vol. 1 –
Fluid Mechanics, John Wiley & Son, New York, (1987)
14. Boger, D. V., “Viscoelastic flows through contractions,” Ann. Rev. Fluid Mech. 19, 157-182
(1987)
15. Carraher, C. E., Polymer Chemistry, Sixth ed., Marcel Dekker, New York (2003)
16. Chatraei, S. M., C. W. Macosko and H. H. Winter, “Lubricated squeezing flow: a new biaxial
extensional rheometer,” J. Rheol. 25, 433-443 (1981)
17. Cogswell, F. N., “Converging flow of polymer melts in extrusion dies,” Polym. Eng. Sci. 12,
64-73 (1972)

111
18. Colton, J. S. and N. P. Suh, “The nucleation of microcellular thermoplastic foam with
additives: part I: theoretical considerations,” Polym. Eng. Sci. 27, 485-492 (1987)
19. Davies, J. M., J. F. Hutton, and K. Walters, “Theory for normal stresses in slits and
capillaries,” J. Phys. D: Appl. Phys. 6, 2259-2266 (1973)
20. Dealy, J. M., “Official nomenclature for material functions describing the response of a
viscoelastic fluid to various shearing and extensional deformations,” J. Rheol., 28, 282-295
(1984)
21. Di, Y., S. Iannace, E. D. Maio and L. Nicolais, “Poly(lactic acid)/organoclay
nanocomposites: thermal, rheological properties and foam processing,” J. Polym. Sci. Part B:
Polym. Phys. 43, 689-698 (2005)
22. Drumright, R. E., P. R. Gruber and D. E. Henton, “Polylactic acid technology,” Adv. Mater.
12, 1841-1846 (2000)
23. Elkovitch, M. D., D. L. Tomasko and L. J. Lee, “Supercritical carbon dioxide assisted
blending of polystyrene and poly(methyl methacrylate),” Polym. Eng. Sci. 39, 2075-2084
(1999)
24. Elkovitch, M. D., D. L. Tomasko and L. J. Lee, “Effect of supercritical carbon dioxide on
morphology development during polymer blending,” Polym. Eng. Sci. 40, 1850-1861 (2000)
25. Elkovitch, M. D., D. L. Tomasko and L. J. Lee, “Effect of supercritical carbon dioxide on
PMMA/rubber and polystyrene/rubber blending: viscosity ratio and phase inversion,” Polym.
Eng. Sci. 41, 2108-2125 (2001)
26. Ema, Y., M. Ikeya and M. Okamoto, “Foam processing and cellular structure of polylactide-
based nanocomposites,” Polymer 47, 5350-5359 (2006)
27. Feigl, K., F. X. Tanner, B. J. Edwards and J. R. Collier, “A numerical study of the
measurement of elongational viscosity of polymeric fluids in a semihyperbolically
converging die,” J. Non-Newtonian Fluid Mech. 115, 191-215 (2003)
28. Ferry, J. D., Viscoelastic Properties of Polymers, John Wiley & Sons, New York (1980)
29. Frazza, E. J. and E. E. Schmitt, “A new absorbable suture,” J. Biomed. Mater. Res. 5, 43-58
(1971)
30. Fuller, G. G. and L. G. Leal, “Flow birefringence of dilute polymer solutions in two-
dimensional flows,” Rheol. Acta 19, 580-600 (1980)
31. Fuller, G. G. and L. G. Leal, “Flow birefringence of concentrated polymer solutions in two-
dimensional flows,” J. Polym. Sci.: Polym. Phys. Edition 19, 557-587 (1981)
32. Gendron, R., L. E. Daigneault and L. M. Caron, “Rheological behavior of
polystyrene/blowing agent mixtures,” SPE ANTEC Tech Papers, 1118-1122 (1996)
33. Gendron, R. and L. E. Daigneault, “Rheological behavior of mixtures of various polymer
melts with CO2,” SPE ANTEC Tech Papers, 1096-1100 (1997)
34. Gendron, R. and A. Correa, “The use of on-line rheometry to characterize polymer melts
containing physical blowing agents,” Cell. Polym. 17, 93-113 (1998)
35. Gerhardt, L. J., C. W. Manke and E. Gulari, “Rheology of polydimethysiloxane swollen with
supercritical carbon dioxide,” J. Polym. Sci., Part B: Polym. Phys. 35, 523-534 (1997)

112
36. Gerhardt, L. J., A. Garg, C. W. Manke and E. Gulari, “Concentration-dependent viscoelastic
scaling models for polydimethysiloxane melts with dissolved carbon dioxide,” J. Polym. Sci.:
Part B: Polym. Phys. 37, 1911-1918 (1998)
37. Gotsis, A. D. and A. Odriozola, “The relevance of entry flow measurements for the
estimation of extensional viscosity of polymer melts,” Rheol. Acta 37, 430-437 (1998)
38. Guo, Q, J. Wang, C. B. Park and M. Oshima, “A microcellular foaming simulation system
with a high-pressure drop rate,” Ind. & Eng. Chem. Res. 45, 6153-6161 (2006)
39. Han, C. D. and C. Y. Ma, “Rheological properties of mixtures of molten polymer and
fluorocarbon blowing agent. I. Mixtures of low-density polyethylene and fluorocarbon
blowing agent,” J. Appl. Polym. Sci. 28, 831-850 (1983a)
40. Han, C. D. and C. Y. Ma, “Rheological properties of mixtures of molten polymer and
fluorocarbon blowing agent. II. Mixtures of polystyrene and fluorocarbon blowing agent,” J.
Appl. Polym. Sci. 28, 851-860 (1983b)
41. Hedenqvist, M. and U. W. Gedde, “Diffusion of small-molecule penetrants in semicrystalline
polymers,” Prog. Polym. Sci. 21, 299-333 (1996)
42. James, D. F., B. D. McLean and J. H. Saringer, “Presheared extensional flow of dilute
polymer solutions,” J. Rheol. 31, 453-481 (1987)
43. Johansen, P., Y. Men, H. P. Merkle and B. Gander, “Revisiting PLA/PGLA microspheres: an
analysis of their potential in parenteral vaccination,” Eur. J. Pharm. Biopharm. 50, 129-146
(2000)
44. Jones, D. M., K. Walters and P. R. Williams, “On the extensional viscosity of mobile
polymer solutions,” Rheol. Acta 26, 20-30 (1987)
45. Kim, H. C., A. Pendse and J. R. Collier, “Polymer melt lubricated elongational flow,” J.
Rheol. 38, 831-845 (1994)
46. Klempner, D. and V. Sendijarevic, editors, Handbook of Polymeric Foams and Foam
Technology, Hancer, Munich (2004)
47. Kostic M., “Influence of viscosity function simplification on non-Newtonian velocity and
shear-rate profiles in rectangular ducts,” Int. Comm. Heat Mass Transfer 20, 515-525 (1993)
48. Kulikov, O., K. Hornung and M. Wagner, “Silanols cured by borates as lubricants in
extrusion of LLDPE. Impact of elasticity of the lubricant on sliding friction,” Rheol. Acta 46,
741-754 (2007)
49. Kwag, C., C. W. Manke and E. Gulari, “Rheology of molten polystyrene with dissolved
supercritical and near-critical gases,” J. Polym. Sci.: Part B: Polym. Phys. 37, 2771-2781
(1999)
50. Kwag, C., C. W. Manke and E. Gulari, “Effects of dissolved gas on viscoelastic scaling and
glass transition temperature of polystyrene melts,” Ind. Eng. Chem. Res. 40, 3048-3052
(2001)
51. Ladin, D., C. B. Park, S. S. Park, H. E. Naguib and S. W. Cha, “Study of shear and
extensional viscosities of biodegradable PBS/CO2 solutions,” J. Cellular Plastics 37, 109-148
(2001)
52. Langer, R. and J. P. Vacanti, “Tissue engineering,” Science 260, 920-926 (1993)

113
53. Larson, R. G., Constitutive equations for polymer melts and solutions, Butterworth
Publishers (1988)
54. Laun, H. M., “Polymer melt rheology with a slit die,” Rheol. Acta 22, 171-185 (1983)
55. Laun, H. M. and H. Schuch, “Transient elongational viscosities and drawability of polymer
melts,” J. Rheol. 33, 119-175 (1989)
56. Lee, M., C. B. Park and C. Tzoganakis, “Measurements and modeling of PS/supercritical
CO2 solution viscosities,” Polym. Eng. Sci. 39, 99-109 (1999)
57. Lee, M., C. Tzoganakis and C. B. Park, “Effects of supercritical CO2 on the viscosity and
morphology of polymer blends,” Adv. Polym. Technol. 19, 300-311 (2000)
58. Lee, P. C., J. Wang and C. B. Park, “Extruded open-cell foams using two semicrystalline
polymers with different crystallization temperatures,” Ind. Eng. Chem. Res. 45, 175-181
(2006)
59. Lee, S.-T. and N. S. Ramesh, Polymeric Foams – Mechanisms and Materials, CRC Press,
Florida (2004)
60. Lee, S.-T., C. B. Park and N. S. Ramesh, Polymeric Foams – Science and Technology, CRC
Press, Florida (2007)
61. Lee, S. T., L. Kareko and J. Jun, “Study of thermoplastic PLA foam extrusion,” J. Cellular
Plastics 44, 293-305 (2008)
62. Leung, S. N., C. B. Park, D. Xu, H. Li and R. G. Fenton, “Computer simulation of bubble-
growth phenomena in foaming,“ Ind. Eng. Chem. Res. 45, 7823-7831 (2006)
63. Li, Y. G., “Development of a novel apparatus for the PVT visualization and measurement of
polymer/gas solutions,” Ph.D. Thesis, University of Toronto, Canada (2008)
64. Li, G., J. Wang, C. B. Park, P. Moulinie and R. Simha, ”Comparison of the SS-based and SL-
based estimation of gas solubility,” SPE ANTEC Tech. Papers, Paper #421 (2004)
65. Li, G., H. Li, L. S. Turng, S. Gong and C. Zhang, “Measurement of gas solubility and
diffusivity in polylactide,” Fluid Phase Equili. 246, 158-166 (2006)
66. Macosko, C. W., Rheology – Principles, Measurements, and Applications, VCH Publishers,
New York (1994)
67. Maquet, V., S. Blacher, R. Pirard, J. – P. Pirard and R. Jerome, “Characterization of
Polylactide Foams by Image Analysis and Impedance Spectroscopy,” Langmuir 16, 10463-
10470 (2000)
68. McKinley, G. H. and O. Hassager, “The Considère condition and rapid stretching of linear
and branched polymer melts,” J. Rheol. 43, 1195-1212 (1999)
69. Meissner, J., “Polymer melt elongation – methods, results, and recent developments,” Polym.
Eng. Sci. 27, 537-546 (1987)
70. Meissner, J. and J. Hostettler, “A new elongational rheometer for polymer melts and other
highly viscoelastic liquids,” Rheol. Acta 33, 1-21 (1994)
71. Michaeli, W., J. Lorenz, R. van Hoorn and H. Schumacher, “Assessment of the foamability
of polymers on the basis of their biaxial stress/strain behaviour,” Proceedings of the Blowing
Agent and Foaming Processes (2004)

114
72. Mikos, A. G., G. Sarakinos, S. M. Leite, J. P. Vacanti and R. Langer, “Laminated three-
dimensional biodegradable foams for use in tissue engineering,” Biomaterials 14, 323-330
(1993)
73. Mooney, D. J., D. F. Baldwin, N. P. Suh, J. P. Vacanti and R. Langer, “Novel approach to
fabricate porous sponges of poly(D,L-lactic-co-glycolic acid) without the use of organic
solvents,” Biomaterials 17, 1417-1422 (1996)
74. Münstedt, H, “Dependence of the elongational behavior of polystyrene melts on molecular
weight and molecular weight distribution,” J. Rheol. 24, 847-867 (1980)
75. Naguib, H. E., C. B. Park, U. Panzer and N. Reichelt, “Strategies for achieving ultra low-
density PP foams,” Polym. Eng. Sci. 42, 1481-1492 (2002)
76. Oliveira, M. S. N., M. A. Alves, F. T. Pinho and G. H. McKinley, “Viscous flow through
microfabricated hyperbolic contractions,” Exp. Fluids 43, 437-451 (2007)
77. Ouchi, S., Y. Masubuchi and H. Shikuma, “The effect of CO2 pressure on viscoelasticity of
LDPE,” Inter. Polym. Processing 5, 173-177 (2008)
78. Papanastasiou, A. C., L. E. Scriven and C. W. Macosko, “Bubble growth and collapse in
viscoelastic liquids analyzed,” J. Non-Newt. Fluid Mech. 14, 53-75 (1984)
79. Park, C. B. and N. P. Suh, “Filamentary extrusion of microcellular polymers using a rapid
decompressive element,” Polym. Eng. Sci. 36, 34-48 (1996)
80. Park, C. B. and L. K. Cheung, “A study of cell nucleation in the extrusion of polypropylene
foams,” Polym. Eng. Sci. 37, 1-10 (1997)
81. Park, C. B., A. H. Behravesh and R. D. Venter, “Low-density, microcellular foam processing
in extrusion using CO2,” Polym. Eng. Sci. 38, 1812-1823 (1998)
82. Park, C. B., “Continuous production of high-density and low-density microcellular plastics in
extrusion,” in Foam Extrusion, edited by S. T. Lee, pp. 263-305, Technomic Publishing
Company, Lancaster, Pennsylvania (2002)
83. Park, H. E. and J. M. Dealy, “Effects of pressure and supercritical fluids on the viscosity of
polyethylene,” Macromolecules 39, 5438-5452 (2006)
84. Pilla, S., S. G. Kim, G. K. Auer, S. Gong and C. Park, “Microcellular extrusion of polylactide
with chain-extender,” SPE ANTEC Tech. Papers, 1908-1912 (2008)
85. Ramesh, N. S., D. H. Rasmussen and G. A. Campbell, “The heterogeneous nucleation of
microcellular foams assisted by the survival of microvoids in polymers containing low glass
transition particles. part I: mathematical modeling and numerical simulation,” Polym. Eng.
Sci. 34, 1685-1697 (1994a)
86. Ramesh, N. S., D. H. Rasmussen and G. A. Campbell, “The heterogeneous nucleation of
microcellular foams assisted by the survival of microvoids in polymers containing low glass
transition particles. part II: experimental results and discussion,” Polym. Eng. Sci. 34, 1698-
1706 (1994b)
87. Reignier, J., R. Gendron and M. F. Champagne, “Extrusion foaming of poly(lactic acid)
blown with CO2: toward 100% green materials,” Cellular Polymers 26, 83-115 (2007)

115
88. Royer, J. R., Y. J. Gay, J. M. Desimone and S. A. Khan, “High-pressure rheology of
polystyrene melts plasticized with CO2: experimental measurement and predictive scaling
relationships,” J. Polym. Sci.: Part B: Polym. Phys. 38, 3168-3180 (2000)
89. Royer, J. R., J. M. Desimone and S. A. Khan, “High-pressure rheology and viscoelastic
scaling predictions of polymer melts containing liquid and supercritical carbon dioxide,” J.
Polym. Sci.: Part B: Polym. Phys. 39, 3055-3066 (2001)
90. Royer, J. R., Y. J. Gay, M. Adam, J. M. Desimone and S. A. Khan, “Polymer melt rheology
with high-pressure CO2 using a novel magnetically levitated sphere rheometer,” Polymer 43,
2375-2383 (2002)
91. Sawyer, D. J., “Bioprocessing – no longer a field of dreams,” Macromol. Symp. 201, 271-
281 (2003)
92. Schultz, J. M., Polymer crystallization: the development of crystalline order in thermoplastic
polymers, Oxford University Press, Washington D. C. (2001)
93. Sentmanat, M. L., “Dual windup extensional rheometer,” U.S. Patent No. 6,578,413 (2003)
94. Sentmanat, M. L., “Miniature universal testing platform: from extensional melt rheology to
solid-state deformation behavior,” Rheol. Acta 43, 657-669 (2004)
95. Sentmanat, M., B. N. Wang and G. H. McKinley, “Measuring the transient extensional
rheology of polyethylene melts using the SER universal testing platform,” J. Rheol. 49, 585-
606 (2005)
96. Spitael, P. and C. W. Macosko, “Strain hardening in polypropylenes and its role in extrusion
foaming,” Polym. Eng. Sci. 44, 2090-2100 (2004)
97. Spitael, P., C. W. Macosko and R. B. McClurg, “Block copolymer micelles for nucleation of
microcellular thermoplastic foams,” Macromolecules 37, 6874-6882 (2004)
98. Stange, J. and H. Münstedt, “Rheological properties and foaming behavior of polypropylenes
with different molecular structures,” J. Rheol. 50, 907-923 (2006)
99. Street, J. R., “The rheology of phase growth in elastic liquids,” Trans. Soc. Rheol. 12, 103-
131 (1968)
100. Suh, K. W., C. P. Park, M. J. Maurer, M. H. Tusim, R. D. Genova, R. Broos and D. P.
Sophiea, “Lightweight cellular plastics,” Adv. Mater. 12, 1779-1789 (2000)
101. Syrjälä, S., “Finite-element analysis of fully developed laminar flow of power-law non-
Newtonian fluid in a rectangular duct,” Int. Comm. Heat Mass Transfer 22, 549-558 (1995)
102. Tadmor, Z. and I. Klein, Engineering Principles of Plasticating Extrusion, Van Nostrand
Reinhold, New York (1970)
103. Takada, M., S. Hasegawa and M. Ohshima, “Crystallization kinetics of Poly(L-lactide) in
contact with pressurized CO2,” Polym. Eng. Sci. 44, 186-196 (2004)
104. Taki, K., K. Tabata, S. Kihara and M. Ohshima, “Bubble coalescence in foaming process
of polymers,” Polym. Eng. Sci. 46, 680-690 (2006)
105. The Freedonia Group, Foamed Plastics, Industry Study #1436 (2001)
106. Throne, J. L., Thermoplastic Foams, Sherwood Publishers, Ohio (1996)

116
107. Tomasko, D. L., H. Li, D. Liu, X. Han, M. J. Wingert, L. J. Lee and K. W. Koelling, “A
review of CO2 applications in the processing of polymers,” Ind. Eng. Chem. Res. 42, 6431-
6456 (2003)
108. Tremblay, B., “Estimation of the elongational viscosity of polyethylene blends at high
deformation rates,” J. Non-Newt. Fluid Mech. 33, 137-164 (1989)
109. Utracki, L. A. and R. Simha, “Free volume and viscosity of polymer-compressed gas
mixtures during extrusion foaming,” J. Polym. Sci.: Part B: Polym. Phys. 39, 342-362 (2001)
110. Villalobos, M., A. Awojulu, T. Greeley, G. Turco and G. Deeter, “Oligomeric chain
extenders for economic reprocessing and recycling of condensation plastics,” Energy 31,
3227-3234 (2006)
111. Wang, X., V. Kumar and W. Li, “Low density sub-critical CO2 blown solid-state PLA
foams”, Cellular Polymers 26, 11-35 (2007)
112. Wang, J. and C. B. Park, “Pressure profile in annular die using PP/CO2 solution
viscosity,” SPE ANTEC Tech. Papers, 896-902 (2006)
113. Whitesides, G. M. and A. D. Stroock, “Flexible methods for microfluidics,” Phys. Today
54, 42-48 (2001)
114. William, M. L., R. F. Landel and J. D. Ferry, “The temperature dependence of relaxation
mechanisms in amorphous polymers and other glass-forming liquids,“ J. Amer. Chem.
Soc.77, 3701-3707 (1955)
115. Wingert, M. J., S. Shukla, K. W. Koelling, D. L. Tomasko and L. J. Lee, “Shear viscosity
of CO2-plasticized polystyrene under high static pressure,” Ind. & Eng. Chem. Res., to
appear
116. Wissinger, R. G. and M. E., Paulaitis, “Swelling and sorption in polymer-CO2 mixtures at
elevated pressures,” J. Polym. Sci.: Part B: Polym. Phys. 25, 2497-2510 (1987)
117. Xu, X., C. B. Park, D. Xu and R. Pop-Iliev, “Effects of die geometry on cell nucleation of
PS foams blown with CO2,” Polym. Eng. Sci. 43, 1378-1390 (2003)
118. Xue A. and C. Tzoganakis, “Rheological properties of polystyrene/supercritical CO2
solution from an extrusion slit die,” J. Polym. Eng. 23, 1-22 (2003)
119. Yao, M. and G. H. McKinley, “Shear history effects on extensional flow of non-
Newtonian fluids in filament stretching rheometers,” XVth International Congress on
Rheology, Paper #CF53, Monterey, California (2008)
120. Yu, L., H. Liu, K. Dean and L. Chen, “Cold crystallization and postmelting
crystallization of PLA plasticized by compressed carbon dioxide,” J. Polym. Sci.: Part B.:
Polym. Phys. 46, 2630-2636 (2008)
121. Zhu, Z., D. Xu, C. B. Park and R. G. Fenton, “Finite element analysis of cell coarsening
in plastic foaming,” J. Cellular Plastics 41, 475-486 (2005)

117
Appendix
CAD Drawing of the Rheological Die