Embed Size (px)
Citation preview
ORIGINAL ARTICLE
Rheology of concrete: a study case based upon the useof the concrete equivalent mortar
F. J. Rubio-Hernandez • J. F. Velazquez-Navarro •
L. M. Ordonez-Belloc
Received: 8 February 2012 / Accepted: 13 July 2012 / Published online: 31 July 2012
� RILEM 2012
Abstract A deeper and wider knowledge of the
rheology of concrete could be obtained if a variety of
absolute rheological parameters were measured.
Although a valuable rheological classification can be
induced from concrete rheometers, they do not give
the same absolute values of the rheological parame-
ters. Moreover, rheological tests with concrete require
a large volume of material. The aim of this work is to
use the concrete equivalent mortar (CEM) method
(Schwartzentruber and Catherine, Mater Struct
33:475–482, 2000) to get concrete rheological infor-
mation with an absolute rheometer. Additionally some
graph tools that resume the results from several
rheological tests are suggested for the design of
concretes. CEM have been formulated to test concrete
formulations with an absolute rheometer. Steady flow
measurements of a CEM corresponding to a self-
compacting concrete (SCC) clearly reveal character-
istic non-linear viscoplastic behavior which it is not
shown by conventional tests used to characterize
concretes. The thixotropic behavior of a concrete is
well-established using three different rheological tests
that can be made with an absolute rheometer testing its
corresponding CEM. These tests reveal aspects of the
strength and kinetics of the micro-structure that are not
observable when thixotropy of concrete is semiquan-
tified with conventional methods. Only with a CEM is
possible to make oscillatory shear tests. In this way the
viscoelastic behavior of the concrete can be charac-
terized. Results of practical interest are so obtained.
For example, the necessity of vibration at rest
application to the fresh concrete can be established
from frequency sweep tests of CEM in the linear
viscoelastic region. The correlation between rheolog-
ical behaviors of a concrete and its corresponding
CEM has been supported. Steady flow and thixotropy
rheographs of CEM are suggested as tools for an easy
and fast determination of adequate formulation for
specific applications.
Keywords Rheology � Fresh concrete � Concrete
equivalent mortar � Rheographs
1 Introduction
1.1 State of the art
The flow behavior of fresh concrete is a matter of
interest both for its influence on the placing of the
F. J. Rubio-Hernandez (&)
Department of Applied Physics II, University of Malaga,
Malaga, Spain
e-mail: [email protected]
J. F. Velazquez-Navarro
Department of Mechanics Engineering and Fluid
Mechanics, University of Malaga, Malaga, Spain
L. M. Ordonez-Belloc
Technological Institute of Construction, AIDICO,
Paterna, Spain
Materials and Structures (2013) 46:587–605
DOI 10.1617/s11527-012-9915-1
material and for its mechanical response back when it
reaches the hardened state. Conventional techniques
(Abrams cone, L-box, etc.) can only provide semi-
quantitative knowledge of the steady flow behavior of
concrete. They have demonstrated that concrete is a
viscoplastic material that, for the case of conventional
concrete, follows the linear model due to Bingham
[1, 2]. This result has been extensively confirmed using
different concrete formulations [3–5]. The Bingham
viscoplastic behavior is described as follows. When the
shear stress (s) is higher than a threshold value (sB)
named yield stress, the material flows, i.e. ceases to
behave elastically, and Bingham linear flow model
(Eq. 1) predicts the relation between the shear stress
and the shear rate _cð Þ applied to the material,
s ¼ sB þ gp _c; s [ sB ð1Þ
In this equation gp is the plastic viscosity. Both
parameters of the model, sB and gp, have useful
practical meanings. In this way it is possible to
compare the performance of different concrete formu-
lations. The yield stress is related to the flow ability of
the material. The lower the yield stress the material will
flow more easily through very complicated formworks.
Additionally, the yield stress of the fluid phase (cement
paste or mortar) is the key parameter of the concrete
stability or rest segregation [6–8]. The plastic viscosity
is mainly related to the dynamic segregation resistance
of the material induced by flow [9]. For high-perfor-
mance concretes, it frequently constitutes the critical
parameter that controls pump ability, and ease of
finishing. With the development of new high-perfor-
mance concretes it has shown that the viscoplastic
response of these materials is more complex, i.e. it is
not necessarily linear [10–12]. This fact invalidates the
use of the Bingham model to characterize the steady
flow behavior. Fortunately there are a variety of non-
linear viscoplastic models that can be used for the
analysis of the steady rheological behavior of materi-
als. The most commonly used non-linear model is the
Herschel–Bulkley model,
s ¼ sHB þ K _cn; s[ sHB ð2ÞThis model has three rheological parameters, the
yield stress, sHB, the consistency index, K, and the flow
behavior index, n, which indicates shear-thinning if
n \ 1 shear-thickening if n [ 1, and the Bingham
model if n = 1. Although this model has been applied
to the concrete test results, it has two major
disadvantages: overestimate the yield stress value
[13] because the slope of the flow curve tends to zero at
very low shear rates, and it is difficult to interpret the
physical meaning of the parameter K, because the
dimension of this parameter is variable due to its
n-dependency(Pasn). It has been pointed out [13] that
the three following conditions must be accomplished
by a viscoplastic model: it must supply a positive yield
stress, it must have a positive linear term in the shear
rate to avoid a zero slope at low shear rates, and,
finally, all its parameters must have fixed dimensions
which traduces in a physical meaning of the param-
eters. A model that accomplishes with all those is
known as the modified Bingham model (Eq. 3) which
can be regarded as an extension of the Bingham model
with a second order term or, alternatively, as a second
order Taylor development of the Herschel–Bulkley
equation, justified by the fact that rarely n [ 2,
s ¼ sMB þ gp _cþ c _c2; s[ sMB ð3Þ
In this equation sMS is the yield stress, and c is the
second order coefficient. Comparing the second order
Taylor development of the Herschel–Bulkley equation
around a random point, a, with Eq. (3), a theoretical
relation between the quotient c/gp (modified Bingham)
and n (Herschel–Bulkley) is obtained [13],
c
gp
¼ 1
2a
n� 1
2� n
� �ð4Þ
The experimental confirmation of this relation has
been observed [13] resulting a = 7.5 s-1. Therefore
the non-linear behavior can be quantified with the
parameter c/gp. Shear-thinning is indicated if c/gp \ 0,
shear-thickening if c/gp [ 0 and the Bingham model if
c/gp = 0.
Studies on other rheological parameters than yield
stress and plastic viscosity of concrete are scarce. The
main reason is the geometric limitation imposed by the
size of coarse particles which makes not possible using
absolute rheometers. For example, despite its evident
practical utility [7, 14], studies on the transient
rheological behavior of concrete and its temporal
evolution during the induction period (thixotropy) are
scarce [15]. The practical utility of the transient
rheological behavior study of concrete can be illus-
trated, for example, considering that a low thixotropic
formulation, i.e., one that after being sheared, quickly
regains its initial viscosity (see later author’s opinion
588 Materials and Structures (2013) 46:587–605
about nomenclature of thixotropic concretes), it would
be useful to build high walls. This is because, being so
consistent, the pressure on the formworks [14, 16–19]
will be less and, when removed, the structure does not
collapse. If the same formulation is however intended
to produce multi-layered slabs, its high consistency
will prevent its mix with other layers, resulting in
undesirable cold joints [19]. Other interesting rheo-
logical study useful for concrete applications refers to
viscoelasticity. The scarce studies which have been
found on the viscoelastic rheological response of the
fresh cementitious materials refer only to cement
pastes [20–22]. None relationship between the values
of rheological parameters measured (loss and storage
modulus) and some practice property or application of
the material has been suggested.
1.2 Multi-scale theory and concrete equivalent
mortar
One of the main challenges facing the Rheology of
concrete refers to the possibility of obtaining, in the
most simple and convenient way, a relationship
between composition and performance of a given
formulation. Absolute rheometers are adequate to
accomplish with this objective because a variety of
rheological parameters (obtained with steady, transient
and viscoelastic studies) can be measured with small
amounts of material. Therefore, it is mandatory to face
the serious difficulty that results of the relatively large
size of coarse aggregate that form part of the concrete.
Multi-scale theory [23–26] allows, at present, to
propose a first solution to the problem. The basic
principle of the theory is to admit that the material
properties can be predicted from knowledge of both the
properties of the matrix and its inclusions. Applied to
mortar, the multi-scale theory leads to identify the
cement paste (cement, water and additives) with the
matrix and the fine aggregate with the inclusions. Thus,
the rheology of the mortar can be predicted from the
rheology of cement paste and the shape, size and
volume fraction of fine aggregate. In the case of
concrete, we would identify the mortar with the matrix
and coarse aggregate with the inclusions. Therefore the
rheology of the concrete can be predicted from the
rheology of the mortar and the nature and quantity of
the coarse aggregate. Although this scheme is attrac-
tive from an experimental point of view, it should be
taken with caution. It is not appropriate to predict the
rheology of the concrete from the rheology of cement
paste considering the fine sand and coarse aggregate as
inclusions, because as it was noted [5, 27] the rheology
of both materials differs in several aspects. To be
clearer, while in the cement paste we have a solid
concentration of about 50 %, in the concrete becomes
80 %. Moreover, whereas the rheology of cement paste
is governed primarily by colloidal forces, the rheology
of concrete is dominated by more complex processes
like friction between the aggregates and the ratio of the
aggregate solid volume fraction over the packing
volume fraction [15, 28]. Therefore, should not be
surprising to observe that today is considered the study
of the rheology of cement paste as only a way to check
what additives are suitable for a particular formulation,
or to simply compare the performance of different
formulations as a starting point for a more thorough
investigation [26] despite experiments and multi-scale
analysis have shown that the concrete rheology is
mostly governed by the cement paste behavior and the
aggregate solid volume fraction over the packing
volume fraction of the aggregates [28]. According to
what has been stated, it is obviously crucial to define
the role played by the mortar for the prediction of the
rheological behavior of concrete.
Schwartzentruber and Catherine [29] proposed the
use of the so named concrete equivalent mortar (CEM)
to study the rheology of fresh concrete with the
assumption that the rheological properties of the CEM
should be correlated with those of the corresponding
concrete. For the CEM design is considered that all
friction phenomena take place at the cement paste/
aggregate interface. Therefore the total specific area of
the aggregates is a fundamental variable to understand
the level of workability of the concrete [30]. When the
composition of the CEM is calculated the main
following relations concerning the original concrete
composition should keep:
(a) the same kind and dosage of cement and mineral
additives,
(b) the same ratio effective water-cement,
(c) similar percentages of additives and method of
addition to the mix and, finally,
(d) the use of fine aggregate amount necessary to
achieve the same total surface area of coarse
aggregate replaced.
Other geometric features like angularity of the fine
and coarse aggregates affect the rheological properties
Materials and Structures (2013) 46:587–605 589
of concrete. However, at this level of substitution of
coarse by fines this is not taken into account.
It is interesting to note that the substitution of gravel
by fine aggregates leads to a reduction of the grading
curve and an increase of the average inter-granular
distance. As the size of sand particles is smaller than
gravel, the total amount of aggregate needed to make the
CEM is less than that contained in the concrete. As a
result, the chemical inertness of the mortar is less than
that of concrete, which is advantageous, since the
induction period of the CEM will be greater and,
therefore, the lifetime of the samples will be also greater,
making more feasible the rheometric work [30].
There are several experimental studies that have
supported the CEM method [29, 31, 32]. They have
concluded that there is a certain correlation between
the rheological behavior of the CEM and the concrete.
In view of the great information we can get from the
use of absolute rheometers and considering that the
CEM is liable to be studied with this type of
rheometers and it looks to be a valid substitute of
concrete for rheological studies, the rheology of the
CEM has been analyzed in this work.
1.3 Purpose of this work
The aim of this research work is to contribute to get
experimental procedures that permit to accomplish
complete rheological studies of concretes by means of
the study of the CEM rheology. Additionally, two
rheograph tools made from the knowledge of the
rheological parameters of several CEMs and the knowl-
edge of the corresponding concrete type are presented
and discussed. These rheographs, when full developed,
presumably should serve to identify a concrete type from
the position of the corresponding CEM in the phase space
of the rheograph. The potential significance of these
outcomes is that eventually the procedures and rheo-
graphs developed with the use of CEM should be
standardized and incorporated into technical regulations.
2 Experimental
2.1 Materials
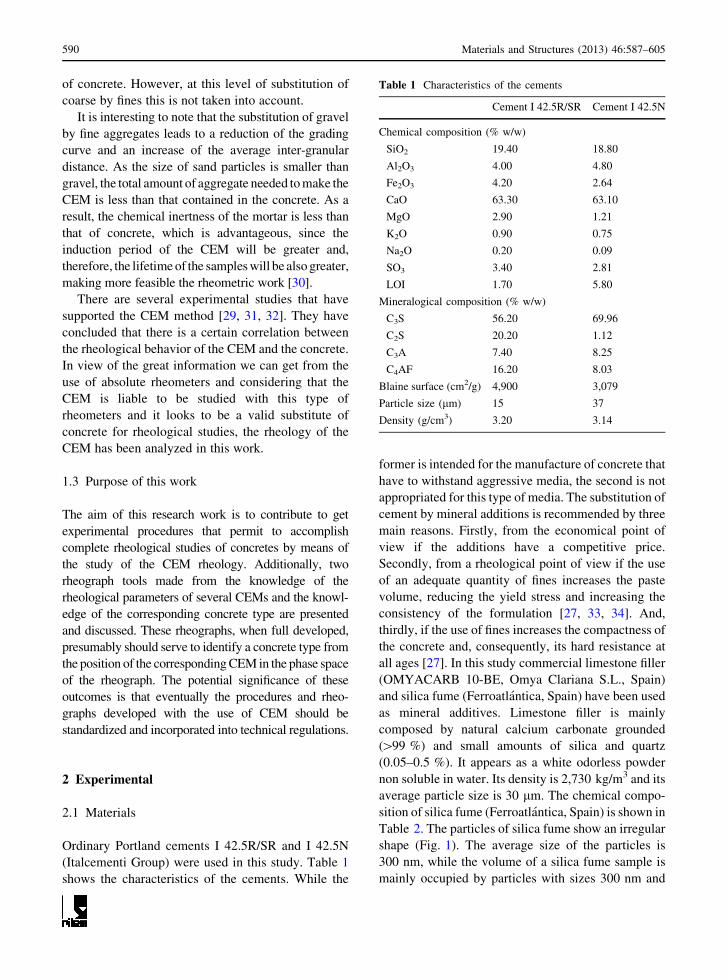
Ordinary Portland cements I 42.5R/SR and I 42.5N
(Italcementi Group) were used in this study. Table 1
shows the characteristics of the cements. While the
former is intended for the manufacture of concrete that
have to withstand aggressive media, the second is not
appropriated for this type of media. The substitution of
cement by mineral additions is recommended by three
main reasons. Firstly, from the economical point of
view if the additions have a competitive price.
Secondly, from a rheological point of view if the use
of an adequate quantity of fines increases the paste
volume, reducing the yield stress and increasing the
consistency of the formulation [27, 33, 34]. And,
thirdly, if the use of fines increases the compactness of
the concrete and, consequently, its hard resistance at
all ages [27]. In this study commercial limestone filler
(OMYACARB 10-BE, Omya Clariana S.L., Spain)
and silica fume (Ferroatlantica, Spain) have been used
as mineral additives. Limestone filler is mainly
composed by natural calcium carbonate grounded
([99 %) and small amounts of silica and quartz
(0.05–0.5 %). It appears as a white odorless powder
non soluble in water. Its density is 2,730 kg/m3 and its
average particle size is 30 lm. The chemical compo-
sition of silica fume (Ferroatlantica, Spain) is shown in
Table 2. The particles of silica fume show an irregular
shape (Fig. 1). The average size of the particles is
300 nm, while the volume of a silica fume sample is
mainly occupied by particles with sizes 300 nm and
Table 1 Characteristics of the cements
Cement I 42.5R/SR Cement I 42.5N
Chemical composition (% w/w)
SiO2 19.40 18.80
Al2O3 4.00 4.80
Fe2O3 4.20 2.64
CaO 63.30 63.10
MgO 2.90 1.21
K2O 0.90 0.75
Na2O 0.20 0.09
SO3 3.40 2.81
LOI 1.70 5.80
Mineralogical composition (% w/w)
C3S 56.20 69.96
C2S 20.20 1.12
C3A 7.40 8.25
C4AF 16.20 8.03
Blaine surface (cm2/g) 4,900 3,079
Particle size (lm) 15 37
Density (g/cm3) 3.20 3.14
590 Materials and Structures (2013) 46:587–605
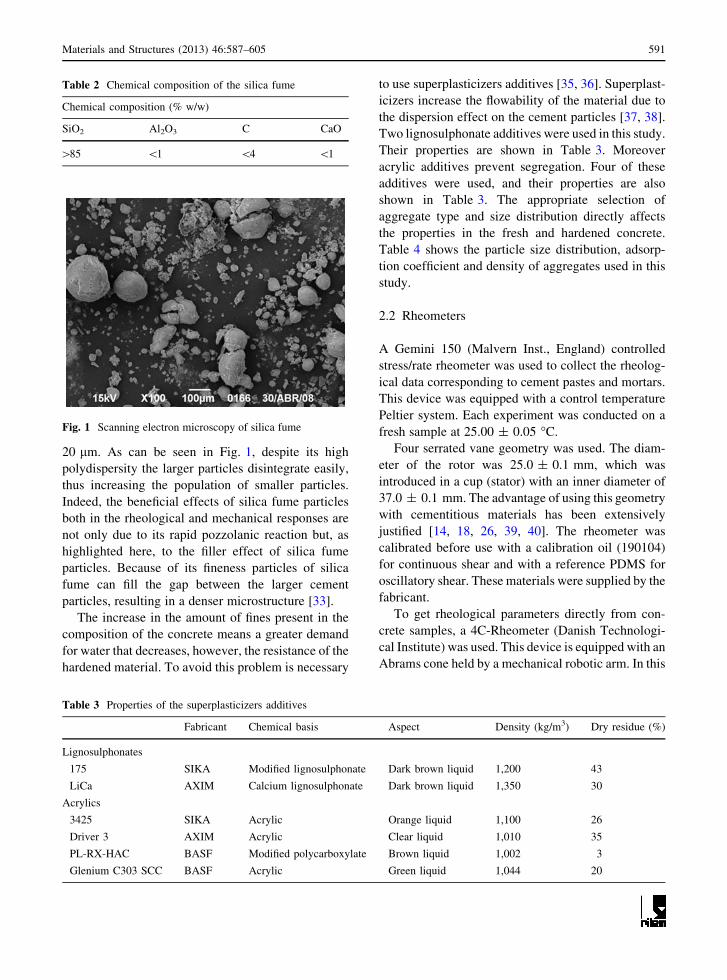
20 lm. As can be seen in Fig. 1, despite its high
polydispersity the larger particles disintegrate easily,
thus increasing the population of smaller particles.
Indeed, the beneficial effects of silica fume particles
both in the rheological and mechanical responses are
not only due to its rapid pozzolanic reaction but, as
highlighted here, to the filler effect of silica fume
particles. Because of its fineness particles of silica
fume can fill the gap between the larger cement
particles, resulting in a denser microstructure [33].
The increase in the amount of fines present in the
composition of the concrete means a greater demand
for water that decreases, however, the resistance of the
hardened material. To avoid this problem is necessary
to use superplasticizers additives [35, 36]. Superplast-
icizers increase the flowability of the material due to
the dispersion effect on the cement particles [37, 38].
Two lignosulphonate additives were used in this study.
Their properties are shown in Table 3. Moreover
acrylic additives prevent segregation. Four of these
additives were used, and their properties are also
shown in Table 3. The appropriate selection of
aggregate type and size distribution directly affects
the properties in the fresh and hardened concrete.
Table 4 shows the particle size distribution, adsorp-
tion coefficient and density of aggregates used in this
study.
2.2 Rheometers
A Gemini 150 (Malvern Inst., England) controlled
stress/rate rheometer was used to collect the rheolog-
ical data corresponding to cement pastes and mortars.
This device was equipped with a control temperature
Peltier system. Each experiment was conducted on a
fresh sample at 25.00 ± 0.05 �C.
Four serrated vane geometry was used. The diam-
eter of the rotor was 25.0 ± 0.1 mm, which was
introduced in a cup (stator) with an inner diameter of
37.0 ± 0.1 mm. The advantage of using this geometry
with cementitious materials has been extensively
justified [14, 18, 26, 39, 40]. The rheometer was
calibrated before use with a calibration oil (190104)
for continuous shear and with a reference PDMS for
oscillatory shear. These materials were supplied by the
fabricant.
To get rheological parameters directly from con-
crete samples, a 4C-Rheometer (Danish Technologi-
cal Institute) was used. This device is equipped with an
Abrams cone held by a mechanical robotic arm. In this
Table 2 Chemical composition of the silica fume
Chemical composition (% w/w)
SiO2 Al2O3 C CaO
[85 \1 \4 \1
Fig. 1 Scanning electron microscopy of silica fume
Table 3 Properties of the superplasticizers additives
Fabricant Chemical basis Aspect Density (kg/m3) Dry residue (%)
Lignosulphonates
175 SIKA Modified lignosulphonate Dark brown liquid 1,200 43
LiCa AXIM Calcium lignosulphonate Dark brown liquid 1,350 30
Acrylics
3425 SIKA Acrylic Orange liquid 1,100 26
Driver 3 AXIM Acrylic Clear liquid 1,010 35
PL-RX-HAC BASF Modified polycarboxylate Brown liquid 1,002 3
Glenium C303 SCC BASF Acrylic Green liquid 1,044 20
Materials and Structures (2013) 46:587–605 591
way the cone always rises to the same height and at the
same speed, giving the test fine reproducibility. Right
in the middle of the cone has a digital video camera to
record the time evolution of the size of the spread that
forms when the cone rises and allows the free flow
material. From this information, the device software
calculates the values of yield stress and plastic
viscosity of the sample [41].
2.3 Protocols
Due to the physical composition of concrete and its
chemical evolution just after the contact between
cement and water, it is necessary to develop a suitable
experimental protocol which minimizes the impact of
hydration on the rheological behavior of cementitious
materials. The objective is to obtain accurate and
reproducible results.
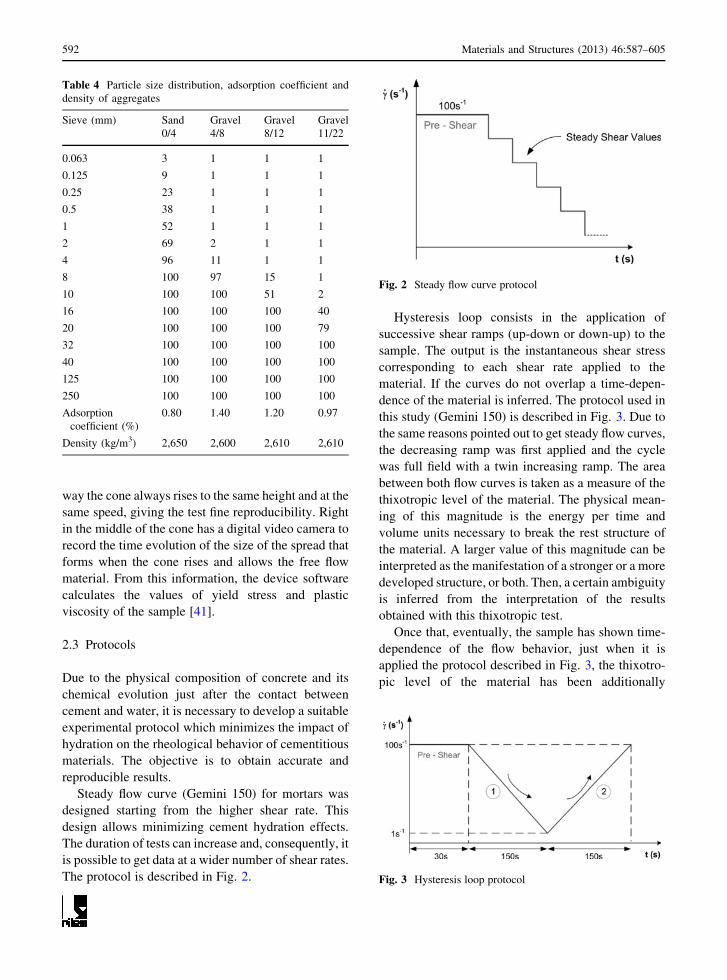
Steady flow curve (Gemini 150) for mortars was
designed starting from the higher shear rate. This
design allows minimizing cement hydration effects.
The duration of tests can increase and, consequently, it
is possible to get data at a wider number of shear rates.
The protocol is described in Fig. 2.
Hysteresis loop consists in the application of
successive shear ramps (up-down or down-up) to the
sample. The output is the instantaneous shear stress
corresponding to each shear rate applied to the
material. If the curves do not overlap a time-depen-
dence of the material is inferred. The protocol used in
this study (Gemini 150) is described in Fig. 3. Due to
the same reasons pointed out to get steady flow curves,
the decreasing ramp was first applied and the cycle
was full field with a twin increasing ramp. The area
between both flow curves is taken as a measure of the
thixotropic level of the material. The physical mean-
ing of this magnitude is the energy per time and
volume units necessary to break the rest structure of
the material. A larger value of this magnitude can be
interpreted as the manifestation of a stronger or a more
developed structure, or both. Then, a certain ambiguity
is inferred from the interpretation of the results
obtained with this thixotropic test.
Once that, eventually, the sample has shown time-
dependence of the flow behavior, just when it is
applied the protocol described in Fig. 3, the thixotro-
pic level of the material has been additionally
Table 4 Particle size distribution, adsorption coefficient and
density of aggregates
Sieve (mm) Sand
0/4
Gravel
4/8
Gravel
8/12
Gravel
11/22
0.063 3 1 1 1
0.125 9 1 1 1
0.25 23 1 1 1
0.5 38 1 1 1
1 52 1 1 1
2 69 2 1 1
4 96 11 1 1
8 100 97 15 1
10 100 100 51 2
16 100 100 100 40
20 100 100 100 79
32 100 100 100 100
40 100 100 100 100
125 100 100 100 100
250 100 100 100 100
Adsorption
coefficient (%)
0.80 1.40 1.20 0.97
Density (kg/m3) 2,650 2,600 2,610 2,610
Fig. 2 Steady flow curve protocol
Fig. 3 Hysteresis loop protocol
592 Materials and Structures (2013) 46:587–605
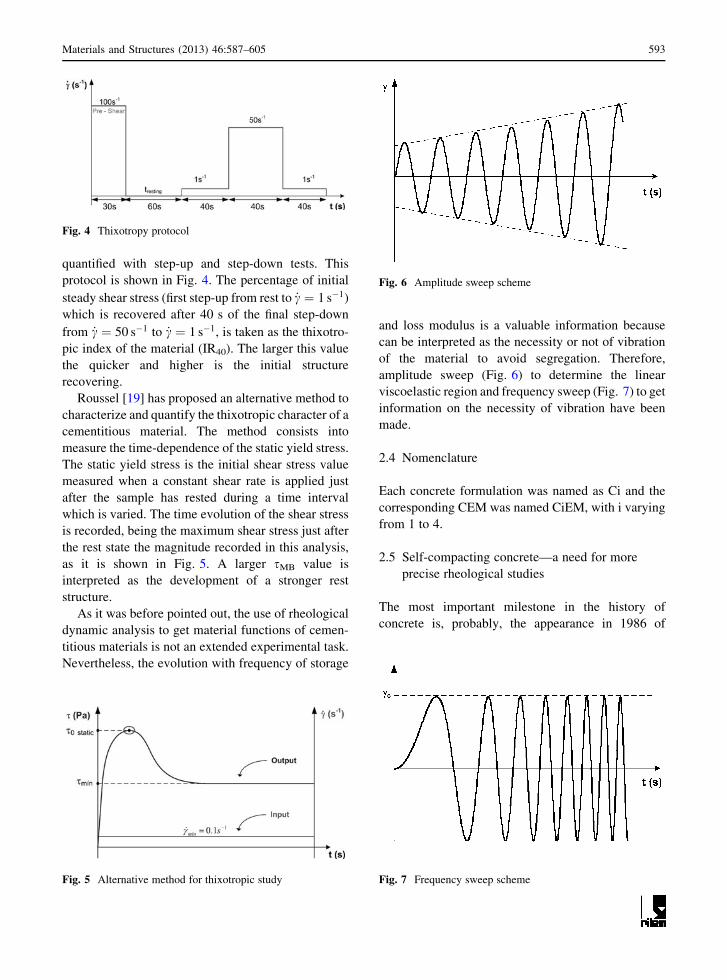
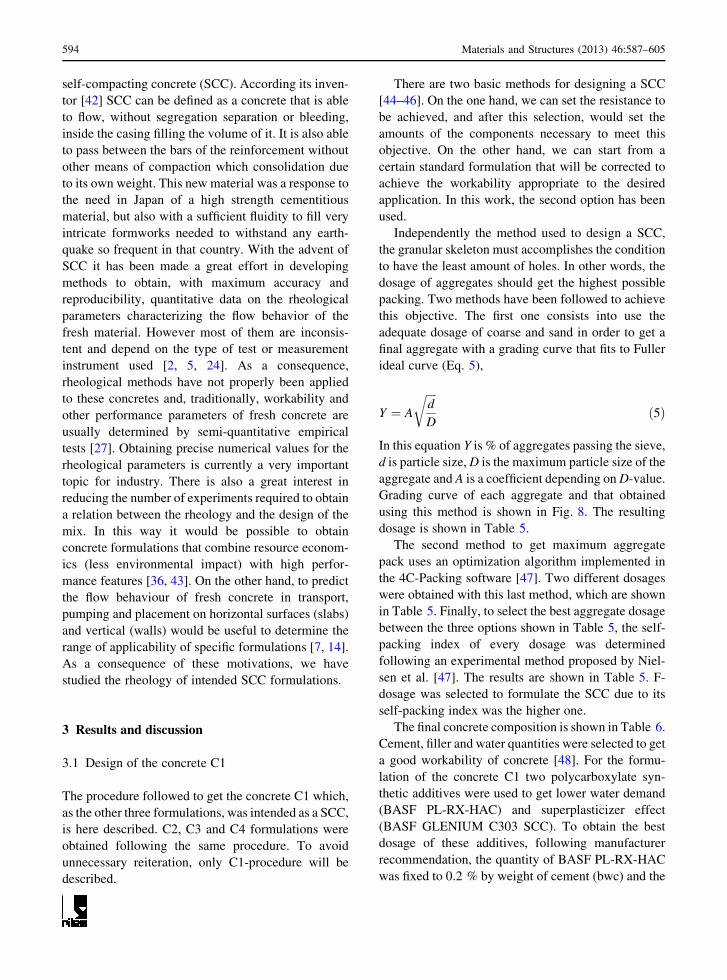
quantified with step-up and step-down tests. This
protocol is shown in Fig. 4. The percentage of initial
steady shear stress (first step-up from rest to _c ¼ 1 s�1)
which is recovered after 40 s of the final step-down
from _c ¼ 50 s�1 to _c ¼ 1 s�1, is taken as the thixotro-
pic index of the material (IR40). The larger this value
the quicker and higher is the initial structure
recovering.
Roussel [19] has proposed an alternative method to
characterize and quantify the thixotropic character of a
cementitious material. The method consists into
measure the time-dependence of the static yield stress.
The static yield stress is the initial shear stress value
measured when a constant shear rate is applied just
after the sample has rested during a time interval
which is varied. The time evolution of the shear stress
is recorded, being the maximum shear stress just after
the rest state the magnitude recorded in this analysis,
as it is shown in Fig. 5. A larger sMB value is
interpreted as the development of a stronger rest
structure.
As it was before pointed out, the use of rheological
dynamic analysis to get material functions of cemen-
titious materials is not an extended experimental task.
Nevertheless, the evolution with frequency of storage
and loss modulus is a valuable information because
can be interpreted as the necessity or not of vibration
of the material to avoid segregation. Therefore,
amplitude sweep (Fig. 6) to determine the linear
viscoelastic region and frequency sweep (Fig. 7) to get
information on the necessity of vibration have been
made.
2.4 Nomenclature
Each concrete formulation was named as Ci and the
corresponding CEM was named CiEM, with i varying
from 1 to 4.
2.5 Self-compacting concrete—a need for more
precise rheological studies
The most important milestone in the history of
concrete is, probably, the appearance in 1986 of
Fig. 4 Thixotropy protocol
Fig. 5 Alternative method for thixotropic study
Fig. 6 Amplitude sweep scheme
Fig. 7 Frequency sweep scheme
Materials and Structures (2013) 46:587–605 593
self-compacting concrete (SCC). According its inven-
tor [42] SCC can be defined as a concrete that is able
to flow, without segregation separation or bleeding,
inside the casing filling the volume of it. It is also able
to pass between the bars of the reinforcement without
other means of compaction which consolidation due
to its own weight. This new material was a response to
the need in Japan of a high strength cementitious
material, but also with a sufficient fluidity to fill very
intricate formworks needed to withstand any earth-
quake so frequent in that country. With the advent of
SCC it has been made a great effort in developing
methods to obtain, with maximum accuracy and
reproducibility, quantitative data on the rheological
parameters characterizing the flow behavior of the
fresh material. However most of them are inconsis-
tent and depend on the type of test or measurement
instrument used [2, 5, 24]. As a consequence,
rheological methods have not properly been applied
to these concretes and, traditionally, workability and
other performance parameters of fresh concrete are
usually determined by semi-quantitative empirical
tests [27]. Obtaining precise numerical values for the
rheological parameters is currently a very important
topic for industry. There is also a great interest in
reducing the number of experiments required to obtain
a relation between the rheology and the design of the
mix. In this way it would be possible to obtain
concrete formulations that combine resource econom-
ics (less environmental impact) with high perfor-
mance features [36, 43]. On the other hand, to predict
the flow behaviour of fresh concrete in transport,
pumping and placement on horizontal surfaces (slabs)
and vertical (walls) would be useful to determine the
range of applicability of specific formulations [7, 14].
As a consequence of these motivations, we have
studied the rheology of intended SCC formulations.
3 Results and discussion
3.1 Design of the concrete C1
The procedure followed to get the concrete C1 which,
as the other three formulations, was intended as a SCC,
is here described. C2, C3 and C4 formulations were
obtained following the same procedure. To avoid
unnecessary reiteration, only C1-procedure will be
described.
There are two basic methods for designing a SCC
[44–46]. On the one hand, we can set the resistance to
be achieved, and after this selection, would set the
amounts of the components necessary to meet this
objective. On the other hand, we can start from a
certain standard formulation that will be corrected to
achieve the workability appropriate to the desired
application. In this work, the second option has been
used.
Independently the method used to design a SCC,
the granular skeleton must accomplishes the condition
to have the least amount of holes. In other words, the
dosage of aggregates should get the highest possible
packing. Two methods have been followed to achieve
this objective. The first one consists into use the
adequate dosage of coarse and sand in order to get a
final aggregate with a grading curve that fits to Fuller
ideal curve (Eq. 5),
Y ¼ A
ffiffiffiffid
D
rð5Þ
In this equation Y is % of aggregates passing the sieve,
d is particle size, D is the maximum particle size of the
aggregate and A is a coefficient depending on D-value.
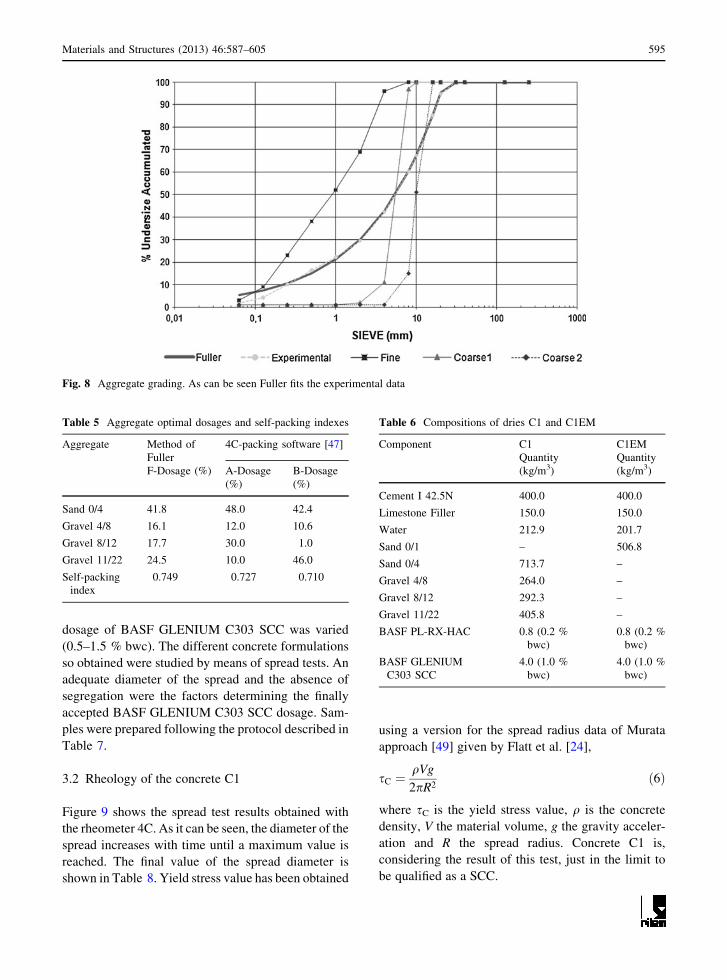
Grading curve of each aggregate and that obtained
using this method is shown in Fig. 8. The resulting
dosage is shown in Table 5.
The second method to get maximum aggregate
pack uses an optimization algorithm implemented in
the 4C-Packing software [47]. Two different dosages
were obtained with this last method, which are shown
in Table 5. Finally, to select the best aggregate dosage
between the three options shown in Table 5, the self-
packing index of every dosage was determined
following an experimental method proposed by Niel-
sen et al. [47]. The results are shown in Table 5. F-
dosage was selected to formulate the SCC due to its
self-packing index was the higher one.
The final concrete composition is shown in Table 6.
Cement, filler and water quantities were selected to get
a good workability of concrete [48]. For the formu-
lation of the concrete C1 two polycarboxylate syn-
thetic additives were used to get lower water demand
(BASF PL-RX-HAC) and superplasticizer effect
(BASF GLENIUM C303 SCC). To obtain the best
dosage of these additives, following manufacturer
recommendation, the quantity of BASF PL-RX-HAC
was fixed to 0.2 % by weight of cement (bwc) and the
594 Materials and Structures (2013) 46:587–605
dosage of BASF GLENIUM C303 SCC was varied
(0.5–1.5 % bwc). The different concrete formulations
so obtained were studied by means of spread tests. An
adequate diameter of the spread and the absence of
segregation were the factors determining the finally
accepted BASF GLENIUM C303 SCC dosage. Sam-
ples were prepared following the protocol described in
Table 7.
3.2 Rheology of the concrete C1
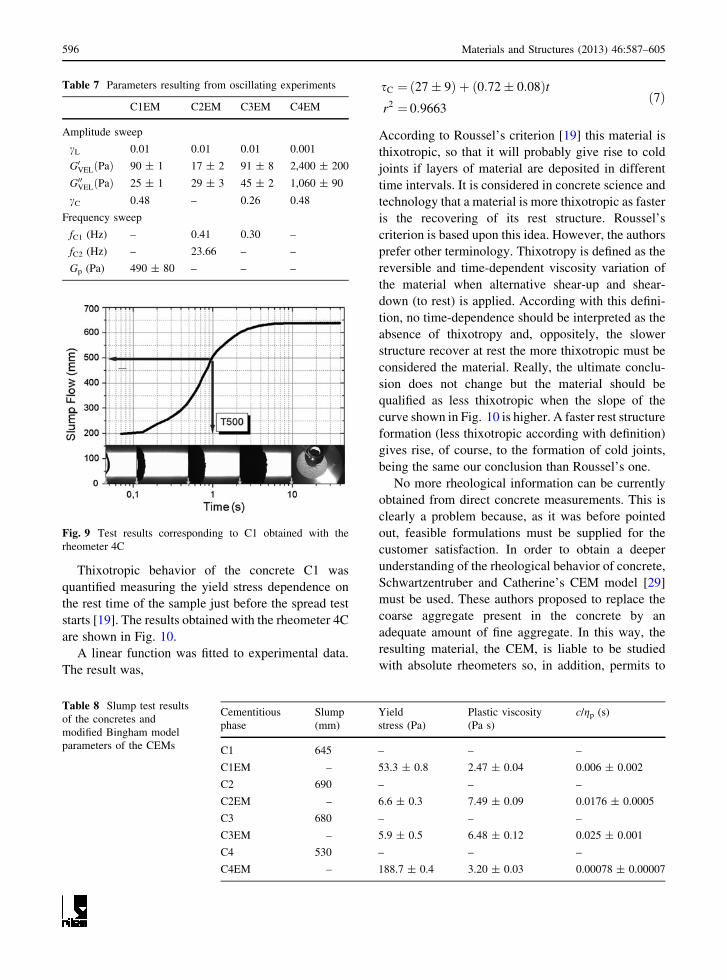
Figure 9 shows the spread test results obtained with
the rheometer 4C. As it can be seen, the diameter of the
spread increases with time until a maximum value is
reached. The final value of the spread diameter is
shown in Table 8. Yield stress value has been obtained
using a version for the spread radius data of Murata
approach [49] given by Flatt et al. [24],
sC ¼qVg
2pR2ð6Þ
where sC is the yield stress value, q is the concrete
density, V the material volume, g the gravity acceler-
ation and R the spread radius. Concrete C1 is,
considering the result of this test, just in the limit to
be qualified as a SCC.
Fig. 8 Aggregate grading. As can be seen Fuller fits the experimental data
Table 5 Aggregate optimal dosages and self-packing indexes
Aggregate Method of
Fuller
4C-packing software [47]
F-Dosage (%) A-Dosage
(%)
B-Dosage
(%)
Sand 0/4 41.8 48.0 42.4
Gravel 4/8 16.1 12.0 10.6
Gravel 8/12 17.7 30.0 1.0
Gravel 11/22 24.5 10.0 46.0
Self-packing
index
0.749 0.727 0.710
Table 6 Compositions of dries C1 and C1EM
Component C1 C1EM
Quantity
(kg/m3)
Quantity
(kg/m3)
Cement I 42.5N 400.0 400.0
Limestone Filler 150.0 150.0
Water 212.9 201.7
Sand 0/1 – 506.8
Sand 0/4 713.7 –
Gravel 4/8 264.0 –
Gravel 8/12 292.3 –
Gravel 11/22 405.8 –
BASF PL-RX-HAC 0.8 (0.2 %
bwc)
0.8 (0.2 %
bwc)
BASF GLENIUM
C303 SCC
4.0 (1.0 %
bwc)
4.0 (1.0 %
bwc)
Materials and Structures (2013) 46:587–605 595
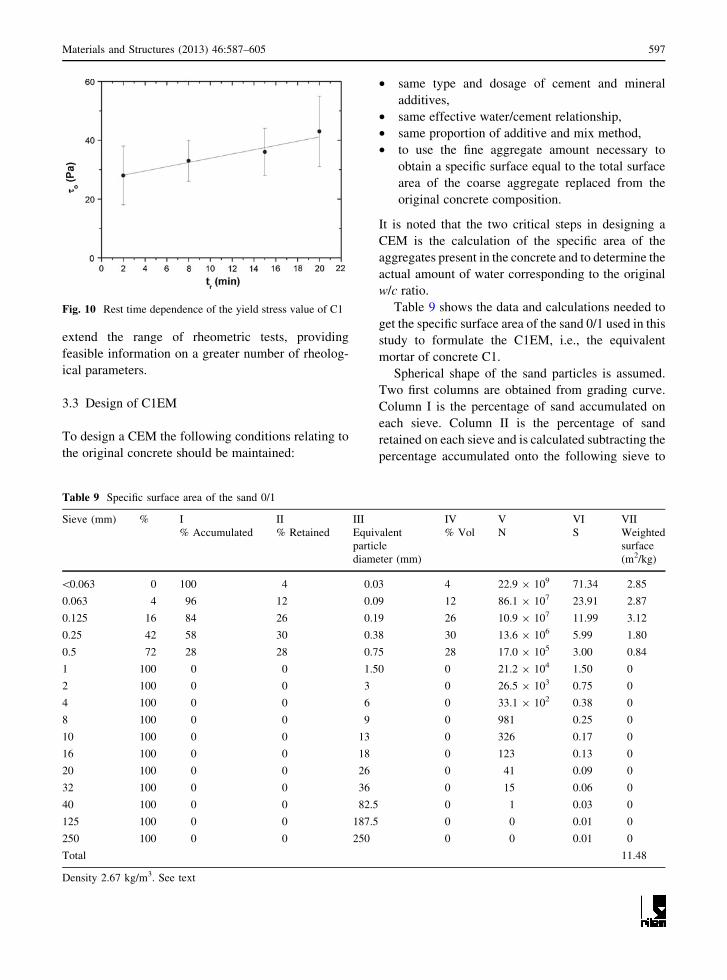
Thixotropic behavior of the concrete C1 was
quantified measuring the yield stress dependence on
the rest time of the sample just before the spread test
starts [19]. The results obtained with the rheometer 4C
are shown in Fig. 10.
A linear function was fitted to experimental data.
The result was,
sC ¼ 27� 9ð Þ þ 0:72� 0:08ð Þtr2 ¼ 0:9663
ð7Þ
According to Roussel’s criterion [19] this material is
thixotropic, so that it will probably give rise to cold
joints if layers of material are deposited in different
time intervals. It is considered in concrete science and
technology that a material is more thixotropic as faster
is the recovering of its rest structure. Roussel’s
criterion is based upon this idea. However, the authors
prefer other terminology. Thixotropy is defined as the
reversible and time-dependent viscosity variation of
the material when alternative shear-up and shear-
down (to rest) is applied. According with this defini-
tion, no time-dependence should be interpreted as the
absence of thixotropy and, oppositely, the slower
structure recover at rest the more thixotropic must be
considered the material. Really, the ultimate conclu-
sion does not change but the material should be
qualified as less thixotropic when the slope of the
curve shown in Fig. 10 is higher. A faster rest structure
formation (less thixotropic according with definition)
gives rise, of course, to the formation of cold joints,
being the same our conclusion than Roussel’s one.
No more rheological information can be currently
obtained from direct concrete measurements. This is
clearly a problem because, as it was before pointed
out, feasible formulations must be supplied for the
customer satisfaction. In order to obtain a deeper
understanding of the rheological behavior of concrete,
Schwartzentruber and Catherine’s CEM model [29]
must be used. These authors proposed to replace the
coarse aggregate present in the concrete by an
adequate amount of fine aggregate. In this way, the
resulting material, the CEM, is liable to be studied
with absolute rheometers so, in addition, permits to
Table 7 Parameters resulting from oscillating experiments
C1EM C2EM C3EM C4EM
Amplitude sweep
cL 0.01 0.01 0.01 0.001
G0VELðPaÞ 90 ± 1 17 ± 2 91 ± 8 2,400 ± 200
G00VELðPaÞ 25 ± 1 29 ± 3 45 ± 2 1,060 ± 90
cC 0.48 – 0.26 0.48
Frequency sweep
fC1 (Hz) – 0.41 0.30 –
fC2 (Hz) – 23.66 – –
Gp (Pa) 490 ± 80 – – –
Fig. 9 Test results corresponding to C1 obtained with the
rheometer 4C
Table 8 Slump test results
of the concretes and
modified Bingham model
parameters of the CEMs
Cementitious
phase
Slump
(mm)
Yield
stress (Pa)
Plastic viscosity
(Pa s)
c/gp (s)
C1 645 – – –
C1EM – 53.3 ± 0.8 2.47 ± 0.04 0.006 ± 0.002
C2 690 – – –
C2EM – 6.6 ± 0.3 7.49 ± 0.09 0.0176 ± 0.0005
C3 680 – – –
C3EM – 5.9 ± 0.5 6.48 ± 0.12 0.025 ± 0.001
C4 530 – – –
C4EM – 188.7 ± 0.4 3.20 ± 0.03 0.00078 ± 0.00007
596 Materials and Structures (2013) 46:587–605
extend the range of rheometric tests, providing
feasible information on a greater number of rheolog-
ical parameters.
3.3 Design of C1EM
To design a CEM the following conditions relating to
the original concrete should be maintained:
• same type and dosage of cement and mineral
additives,
• same effective water/cement relationship,
• same proportion of additive and mix method,
• to use the fine aggregate amount necessary to
obtain a specific surface equal to the total surface
area of the coarse aggregate replaced from the
original concrete composition.
It is noted that the two critical steps in designing a
CEM is the calculation of the specific area of the
aggregates present in the concrete and to determine the
actual amount of water corresponding to the original
w/c ratio.
Table 9 shows the data and calculations needed to
get the specific surface area of the sand 0/1 used in this
study to formulate the C1EM, i.e., the equivalent
mortar of concrete C1.
Spherical shape of the sand particles is assumed.
Two first columns are obtained from grading curve.
Column I is the percentage of sand accumulated on
each sieve. Column II is the percentage of sand
retained on each sieve and is calculated subtracting the
percentage accumulated onto the following sieve to
Fig. 10 Rest time dependence of the yield stress value of C1
Table 9 Specific surface area of the sand 0/1
Sieve (mm) % I II III IV V VI VII
% Accumulated % Retained Equivalent
particle
diameter (mm)
% Vol N S Weighted
surface
(m2/kg)
\0.063 0 100 4 0.03 4 22.9 9 109 71.34 2.85
0.063 4 96 12 0.09 12 86.1 9 107 23.91 2.87
0.125 16 84 26 0.19 26 10.9 9 107 11.99 3.12
0.25 42 58 30 0.38 30 13.6 9 106 5.99 1.80
0.5 72 28 28 0.75 28 17.0 9 105 3.00 0.84
1 100 0 0 1.50 0 21.2 9 104 1.50 0
2 100 0 0 3 0 26.5 9 103 0.75 0
4 100 0 0 6 0 33.1 9 102 0.38 0
8 100 0 0 9 0 981 0.25 0
10 100 0 0 13 0 326 0.17 0
16 100 0 0 18 0 123 0.13 0
20 100 0 0 26 0 41 0.09 0
32 100 0 0 36 0 15 0.06 0
40 100 0 0 82.5 0 1 0.03 0
125 100 0 0 187.5 0 0 0.01 0
250 100 0 0 250 0 0 0.01 0
Total 11.48
Density 2.67 kg/m3. See text
Materials and Structures (2013) 46:587–605 597
the value shown in column I. Column III is the
equivalent particle diameter (D) of the sieve. It is the
average of the consecutive two sieve sizes (the first
and last one are exceptions, they are calculated as
0.063/2 and 250 mm, respectively). Column IV is the
volume percentage occupied by particles of diameter
shown in column III. Its value coincides with that
shown in column II. Column V is the number of
particles per kg of sand. It is calculated from Eq. (8),
N ¼ Total volume
Particle Volume¼
1Sand density
43p Equivalent particle diameter
2
� �3
ð8Þ
Column VI is the specific surface corresponding
to each particle size. Its value is obtained from
Eq. (9),
S ¼ NpD2 ð9Þ
Column VII is the weighted surface in m2/kg for each
particle size. It is obtained multiplying columns IV
and VI and dividing by 100. The specific surface is the
sum of the elements of column VII. Finally, the mass
of sand 0/1 that substitutes all aggregates in the C1EM
will be calculated by using Eq. (10),
M0=1 ¼M0=4S0=4 þM4=8S4=8þM8=12S8=12 þM11=22S11=22
S0=1
ð10Þ
The result obtained with Eq. (10) corresponds to wet
sand. The dry sand mass must be obtained with Eq.
(11),
Mdry0=1 ¼M0=1
1þ Absorption coefficient100
ð11Þ
To determine the actual amount of water correspond-
ing to the original w/c ratio we proceed as follows. To
the initial amount of water obtained from w/c ratio, the
water absorbed by the aggregate must be added, and
the amount of water provided by the additives must be
subtracted. Equation (12) is used to get the actual
amount of water,
Mwater ¼ Mwaterw=cþMwater absorbed by aggregates
�Mwater in additives ð12Þ
Each term in Eq. (12) is calculated as follows,
Mwaterw=c ¼ w
cMcement ð13Þ
Mwater absorbed by aggregates ¼ Mdry 0=1
Absorption coefficient
100
ð14Þ
Mwater in additives ¼MPL�RX�HAC
1�Dry residue
100
þMGLENIUM C303 SCC
1�Dry residue
100
ð15Þ
The final composition of the C1EM is shown in
Table 6 and the mixing protocol of the different
components is shown in Table 10.
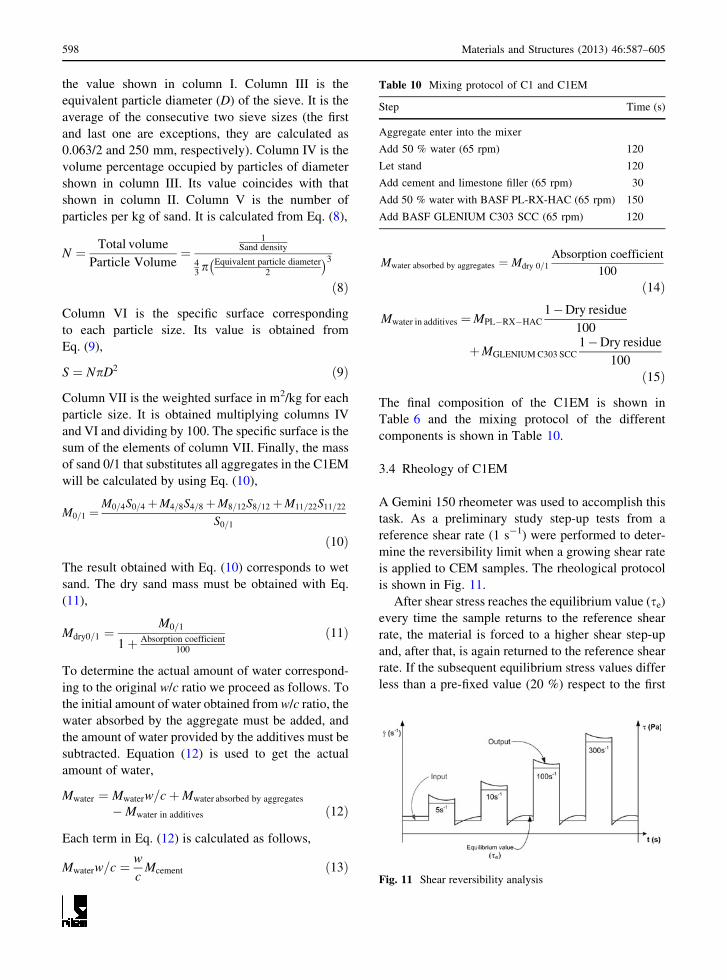
3.4 Rheology of C1EM
A Gemini 150 rheometer was used to accomplish this
task. As a preliminary study step-up tests from a
reference shear rate (1 s-1) were performed to deter-
mine the reversibility limit when a growing shear rate
is applied to CEM samples. The rheological protocol
is shown in Fig. 11.
After shear stress reaches the equilibrium value (se)
every time the sample returns to the reference shear
rate, the material is forced to a higher shear step-up
and, after that, is again returned to the reference shear
rate. If the subsequent equilibrium stress values differ
less than a pre-fixed value (20 %) respect to the first
Table 10 Mixing protocol of C1 and C1EM
Step Time (s)
Aggregate enter into the mixer
Add 50 % water (65 rpm) 120
Let stand 120
Add cement and limestone filler (65 rpm) 30
Add 50 % water with BASF PL-RX-HAC (65 rpm) 150
Add BASF GLENIUM C303 SCC (65 rpm) 120
Fig. 11 Shear reversibility analysis
598 Materials and Structures (2013) 46:587–605
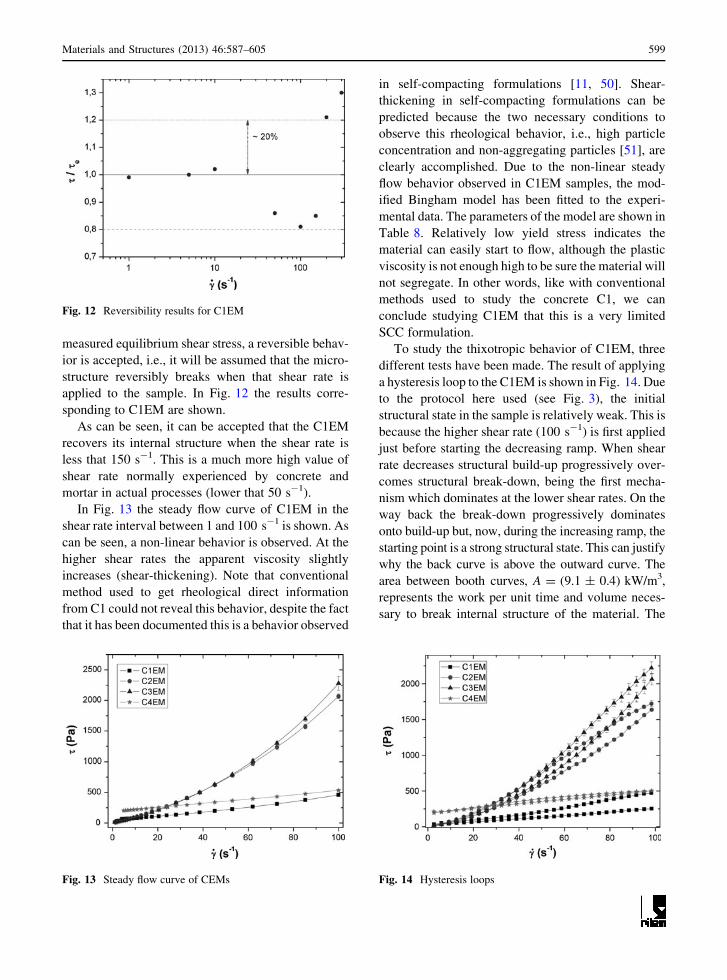
measured equilibrium shear stress, a reversible behav-
ior is accepted, i.e., it will be assumed that the micro-
structure reversibly breaks when that shear rate is
applied to the sample. In Fig. 12 the results corre-
sponding to C1EM are shown.
As can be seen, it can be accepted that the C1EM
recovers its internal structure when the shear rate is
less that 150 s-1. This is a much more high value of
shear rate normally experienced by concrete and
mortar in actual processes (lower that 50 s-1).
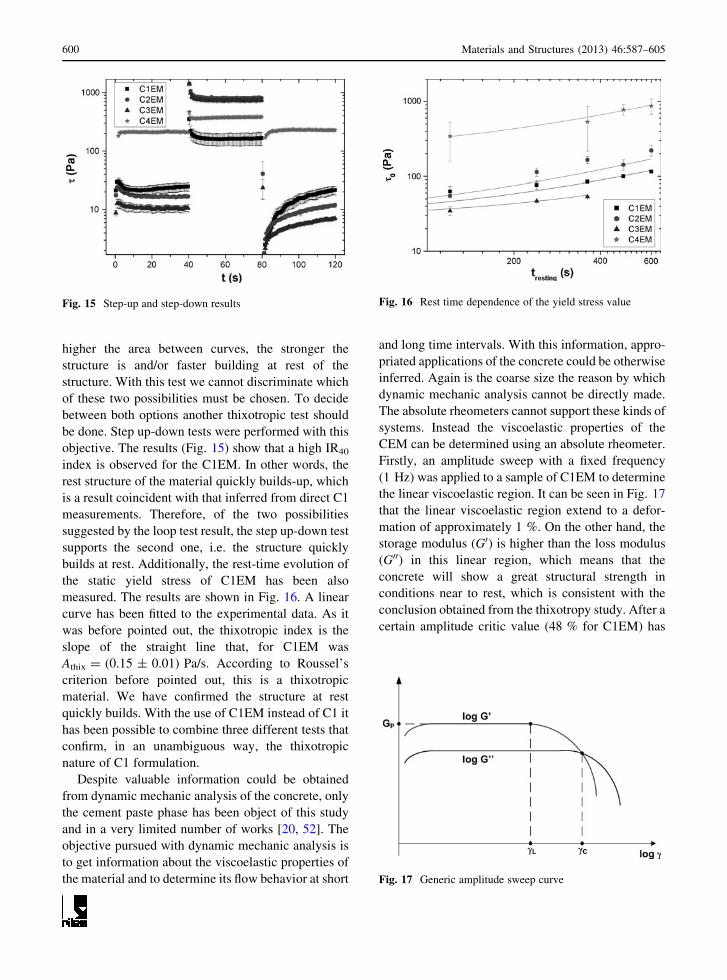
In Fig. 13 the steady flow curve of C1EM in the
shear rate interval between 1 and 100 s-1 is shown. As
can be seen, a non-linear behavior is observed. At the
higher shear rates the apparent viscosity slightly
increases (shear-thickening). Note that conventional
method used to get rheological direct information
from C1 could not reveal this behavior, despite the fact
that it has been documented this is a behavior observed
in self-compacting formulations [11, 50]. Shear-
thickening in self-compacting formulations can be
predicted because the two necessary conditions to
observe this rheological behavior, i.e., high particle
concentration and non-aggregating particles [51], are
clearly accomplished. Due to the non-linear steady
flow behavior observed in C1EM samples, the mod-
ified Bingham model has been fitted to the experi-
mental data. The parameters of the model are shown in
Table 8. Relatively low yield stress indicates the
material can easily start to flow, although the plastic
viscosity is not enough high to be sure the material will
not segregate. In other words, like with conventional
methods used to study the concrete C1, we can
conclude studying C1EM that this is a very limited
SCC formulation.
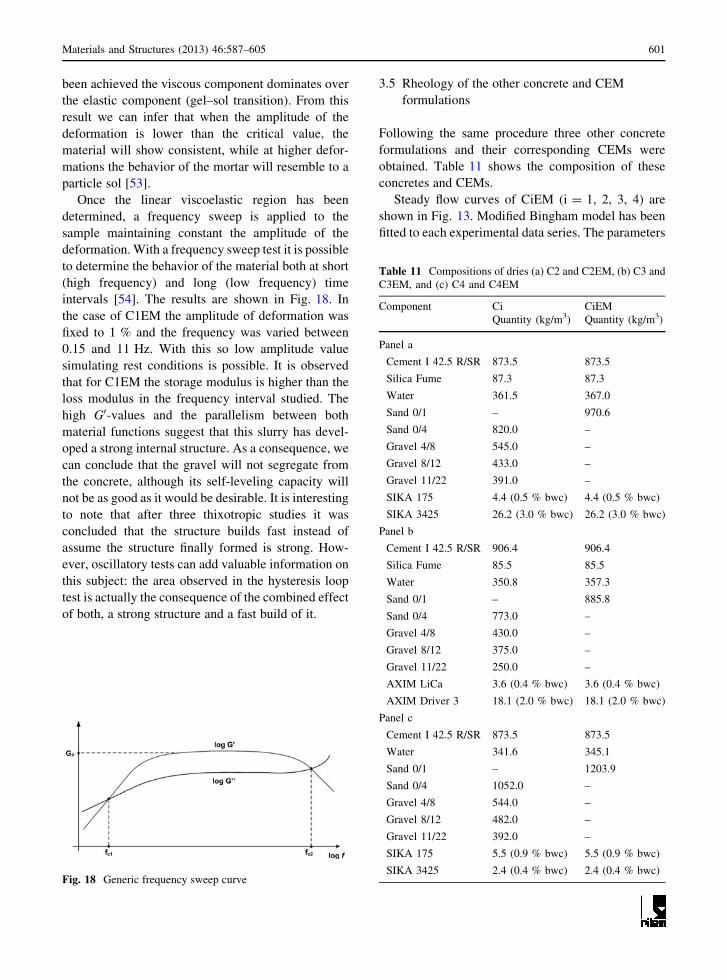
To study the thixotropic behavior of C1EM, three
different tests have been made. The result of applying
a hysteresis loop to the C1EM is shown in Fig. 14. Due
to the protocol here used (see Fig. 3), the initial
structural state in the sample is relatively weak. This is
because the higher shear rate (100 s-1) is first applied
just before starting the decreasing ramp. When shear
rate decreases structural build-up progressively over-
comes structural break-down, being the first mecha-
nism which dominates at the lower shear rates. On the
way back the break-down progressively dominates
onto build-up but, now, during the increasing ramp, the
starting point is a strong structural state. This can justify
why the back curve is above the outward curve. The
area between booth curves, A = (9.1 ± 0.4) kW/m3,
represents the work per unit time and volume neces-
sary to break internal structure of the material. The
Fig. 12 Reversibility results for C1EM
Fig. 13 Steady flow curve of CEMs Fig. 14 Hysteresis loops
Materials and Structures (2013) 46:587–605 599
higher the area between curves, the stronger the
structure is and/or faster building at rest of the
structure. With this test we cannot discriminate which
of these two possibilities must be chosen. To decide
between both options another thixotropic test should
be done. Step up-down tests were performed with this
objective. The results (Fig. 15) show that a high IR40
index is observed for the C1EM. In other words, the
rest structure of the material quickly builds-up, which
is a result coincident with that inferred from direct C1
measurements. Therefore, of the two possibilities
suggested by the loop test result, the step up-down test
supports the second one, i.e. the structure quickly
builds at rest. Additionally, the rest-time evolution of
the static yield stress of C1EM has been also
measured. The results are shown in Fig. 16. A linear
curve has been fitted to the experimental data. As it
was before pointed out, the thixotropic index is the
slope of the straight line that, for C1EM was
Athix = (0.15 ± 0.01) Pa/s. According to Roussel’s
criterion before pointed out, this is a thixotropic
material. We have confirmed the structure at rest
quickly builds. With the use of C1EM instead of C1 it
has been possible to combine three different tests that
confirm, in an unambiguous way, the thixotropic
nature of C1 formulation.
Despite valuable information could be obtained
from dynamic mechanic analysis of the concrete, only
the cement paste phase has been object of this study
and in a very limited number of works [20, 52]. The
objective pursued with dynamic mechanic analysis is
to get information about the viscoelastic properties of
the material and to determine its flow behavior at short
and long time intervals. With this information, appro-
priated applications of the concrete could be otherwise
inferred. Again is the coarse size the reason by which
dynamic mechanic analysis cannot be directly made.
The absolute rheometers cannot support these kinds of
systems. Instead the viscoelastic properties of the
CEM can be determined using an absolute rheometer.
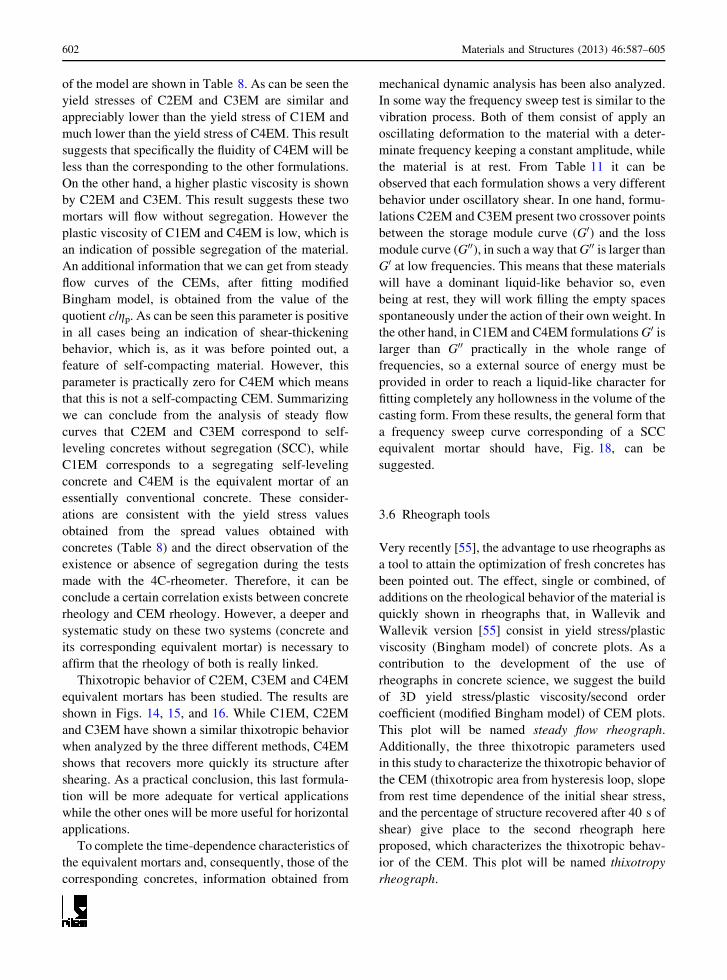
Firstly, an amplitude sweep with a fixed frequency
(1 Hz) was applied to a sample of C1EM to determine
the linear viscoelastic region. It can be seen in Fig. 17
that the linear viscoelastic region extend to a defor-
mation of approximately 1 %. On the other hand, the
storage modulus (G0) is higher than the loss modulus
(G00) in this linear region, which means that the
concrete will show a great structural strength in
conditions near to rest, which is consistent with the
conclusion obtained from the thixotropy study. After a
certain amplitude critic value (48 % for C1EM) has
Fig. 15 Step-up and step-down results Fig. 16 Rest time dependence of the yield stress value
Fig. 17 Generic amplitude sweep curve
600 Materials and Structures (2013) 46:587–605
been achieved the viscous component dominates over
the elastic component (gel–sol transition). From this
result we can infer that when the amplitude of the
deformation is lower than the critical value, the
material will show consistent, while at higher defor-
mations the behavior of the mortar will resemble to a
particle sol [53].
Once the linear viscoelastic region has been
determined, a frequency sweep is applied to the
sample maintaining constant the amplitude of the
deformation. With a frequency sweep test it is possible
to determine the behavior of the material both at short
(high frequency) and long (low frequency) time
intervals [54]. The results are shown in Fig. 18. In
the case of C1EM the amplitude of deformation was
fixed to 1 % and the frequency was varied between
0.15 and 11 Hz. With this so low amplitude value
simulating rest conditions is possible. It is observed
that for C1EM the storage modulus is higher than the
loss modulus in the frequency interval studied. The
high G0-values and the parallelism between both
material functions suggest that this slurry has devel-
oped a strong internal structure. As a consequence, we
can conclude that the gravel will not segregate from
the concrete, although its self-leveling capacity will
not be as good as it would be desirable. It is interesting
to note that after three thixotropic studies it was
concluded that the structure builds fast instead of
assume the structure finally formed is strong. How-
ever, oscillatory tests can add valuable information on
this subject: the area observed in the hysteresis loop
test is actually the consequence of the combined effect
of both, a strong structure and a fast build of it.
3.5 Rheology of the other concrete and CEM
formulations
Following the same procedure three other concrete
formulations and their corresponding CEMs were
obtained. Table 11 shows the composition of these
concretes and CEMs.
Steady flow curves of CiEM (i = 1, 2, 3, 4) are
shown in Fig. 13. Modified Bingham model has been
fitted to each experimental data series. The parameters
Fig. 18 Generic frequency sweep curve
Table 11 Compositions of dries (a) C2 and C2EM, (b) C3 and
C3EM, and (c) C4 and C4EM
Component Ci CiEM
Quantity (kg/m3) Quantity (kg/m3)
Panel a
Cement I 42.5 R/SR 873.5 873.5
Silica Fume 87.3 87.3
Water 361.5 367.0
Sand 0/1 – 970.6
Sand 0/4 820.0 –
Gravel 4/8 545.0 –
Gravel 8/12 433.0 –
Gravel 11/22 391.0 –
SIKA 175 4.4 (0.5 % bwc) 4.4 (0.5 % bwc)
SIKA 3425 26.2 (3.0 % bwc) 26.2 (3.0 % bwc)
Panel b
Cement I 42.5 R/SR 906.4 906.4
Silica Fume 85.5 85.5
Water 350.8 357.3
Sand 0/1 – 885.8
Sand 0/4 773.0 –
Gravel 4/8 430.0 –
Gravel 8/12 375.0 –
Gravel 11/22 250.0 –
AXIM LiCa 3.6 (0.4 % bwc) 3.6 (0.4 % bwc)
AXIM Driver 3 18.1 (2.0 % bwc) 18.1 (2.0 % bwc)
Panel c
Cement I 42.5 R/SR 873.5 873.5
Water 341.6 345.1
Sand 0/1 – 1203.9
Sand 0/4 1052.0 –
Gravel 4/8 544.0 –
Gravel 8/12 482.0 –
Gravel 11/22 392.0 –
SIKA 175 5.5 (0.9 % bwc) 5.5 (0.9 % bwc)
SIKA 3425 2.4 (0.4 % bwc) 2.4 (0.4 % bwc)
Materials and Structures (2013) 46:587–605 601
of the model are shown in Table 8. As can be seen the
yield stresses of C2EM and C3EM are similar and
appreciably lower than the yield stress of C1EM and
much lower than the yield stress of C4EM. This result
suggests that specifically the fluidity of C4EM will be
less than the corresponding to the other formulations.
On the other hand, a higher plastic viscosity is shown
by C2EM and C3EM. This result suggests these two
mortars will flow without segregation. However the
plastic viscosity of C1EM and C4EM is low, which is
an indication of possible segregation of the material.
An additional information that we can get from steady
flow curves of the CEMs, after fitting modified
Bingham model, is obtained from the value of the
quotient c/gp. As can be seen this parameter is positive
in all cases being an indication of shear-thickening
behavior, which is, as it was before pointed out, a
feature of self-compacting material. However, this
parameter is practically zero for C4EM which means
that this is not a self-compacting CEM. Summarizing
we can conclude from the analysis of steady flow
curves that C2EM and C3EM correspond to self-
leveling concretes without segregation (SCC), while
C1EM corresponds to a segregating self-leveling
concrete and C4EM is the equivalent mortar of an
essentially conventional concrete. These consider-
ations are consistent with the yield stress values
obtained from the spread values obtained with
concretes (Table 8) and the direct observation of the
existence or absence of segregation during the tests
made with the 4C-rheometer. Therefore, it can be
conclude a certain correlation exists between concrete
rheology and CEM rheology. However, a deeper and
systematic study on these two systems (concrete and
its corresponding equivalent mortar) is necessary to
affirm that the rheology of both is really linked.
Thixotropic behavior of C2EM, C3EM and C4EM
equivalent mortars has been studied. The results are
shown in Figs. 14, 15, and 16. While C1EM, C2EM
and C3EM have shown a similar thixotropic behavior
when analyzed by the three different methods, C4EM
shows that recovers more quickly its structure after
shearing. As a practical conclusion, this last formula-
tion will be more adequate for vertical applications
while the other ones will be more useful for horizontal
applications.
To complete the time-dependence characteristics of
the equivalent mortars and, consequently, those of the
corresponding concretes, information obtained from
mechanical dynamic analysis has been also analyzed.
In some way the frequency sweep test is similar to the
vibration process. Both of them consist of apply an
oscillating deformation to the material with a deter-
minate frequency keeping a constant amplitude, while
the material is at rest. From Table 11 it can be
observed that each formulation shows a very different
behavior under oscillatory shear. In one hand, formu-
lations C2EM and C3EM present two crossover points
between the storage module curve (G0) and the loss
module curve (G00), in such a way that G00 is larger than
G0 at low frequencies. This means that these materials
will have a dominant liquid-like behavior so, even
being at rest, they will work filling the empty spaces
spontaneously under the action of their own weight. In
the other hand, in C1EM and C4EM formulations G0 islarger than G00 practically in the whole range of
frequencies, so a external source of energy must be
provided in order to reach a liquid-like character for
fitting completely any hollowness in the volume of the
casting form. From these results, the general form that
a frequency sweep curve corresponding of a SCC
equivalent mortar should have, Fig. 18, can be
suggested.
3.6 Rheograph tools
Very recently [55], the advantage to use rheographs as
a tool to attain the optimization of fresh concretes has
been pointed out. The effect, single or combined, of
additions on the rheological behavior of the material is
quickly shown in rheographs that, in Wallevik and
Wallevik version [55] consist in yield stress/plastic
viscosity (Bingham model) of concrete plots. As a
contribution to the development of the use of
rheographs in concrete science, we suggest the build
of 3D yield stress/plastic viscosity/second order
coefficient (modified Bingham model) of CEM plots.
This plot will be named steady flow rheograph.
Additionally, the three thixotropic parameters used
in this study to characterize the thixotropic behavior of
the CEM (thixotropic area from hysteresis loop, slope
from rest time dependence of the initial shear stress,
and the percentage of structure recovered after 40 s of
shear) give place to the second rheograph here
proposed, which characterizes the thixotropic behav-
ior of the CEM. This plot will be named thixotropy
rheograph.
602 Materials and Structures (2013) 46:587–605
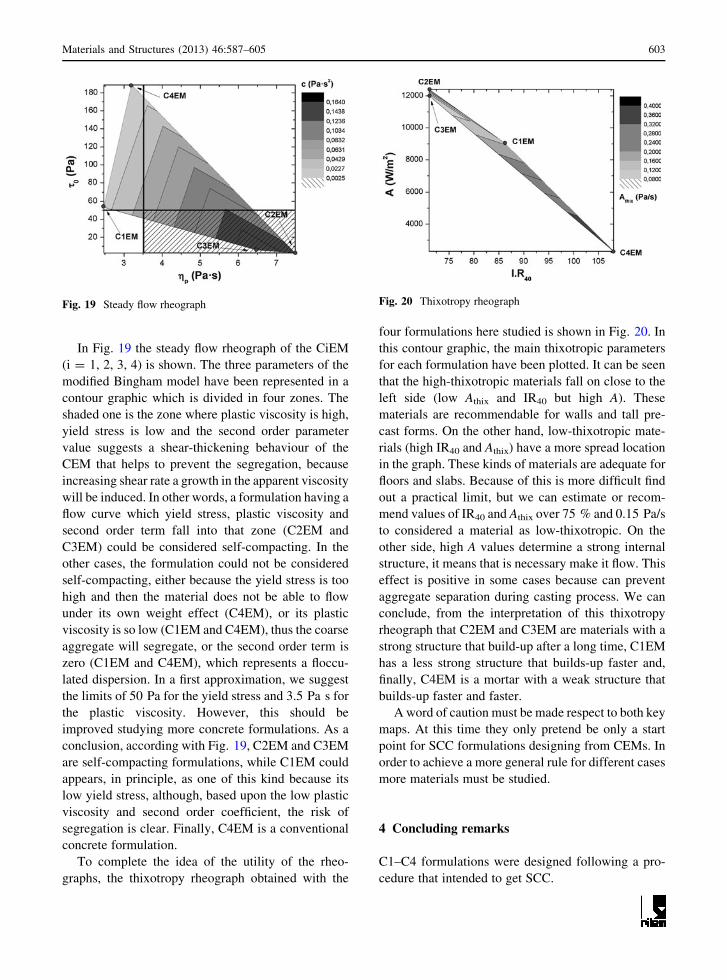
In Fig. 19 the steady flow rheograph of the CiEM
(i = 1, 2, 3, 4) is shown. The three parameters of the
modified Bingham model have been represented in a
contour graphic which is divided in four zones. The
shaded one is the zone where plastic viscosity is high,
yield stress is low and the second order parameter
value suggests a shear-thickening behaviour of the
CEM that helps to prevent the segregation, because
increasing shear rate a growth in the apparent viscosity
will be induced. In other words, a formulation having a
flow curve which yield stress, plastic viscosity and
second order term fall into that zone (C2EM and
C3EM) could be considered self-compacting. In the
other cases, the formulation could not be considered
self-compacting, either because the yield stress is too
high and then the material does not be able to flow
under its own weight effect (C4EM), or its plastic
viscosity is so low (C1EM and C4EM), thus the coarse
aggregate will segregate, or the second order term is
zero (C1EM and C4EM), which represents a floccu-
lated dispersion. In a first approximation, we suggest
the limits of 50 Pa for the yield stress and 3.5 Pa s for
the plastic viscosity. However, this should be
improved studying more concrete formulations. As a
conclusion, according with Fig. 19, C2EM and C3EM
are self-compacting formulations, while C1EM could
appears, in principle, as one of this kind because its
low yield stress, although, based upon the low plastic
viscosity and second order coefficient, the risk of
segregation is clear. Finally, C4EM is a conventional
concrete formulation.
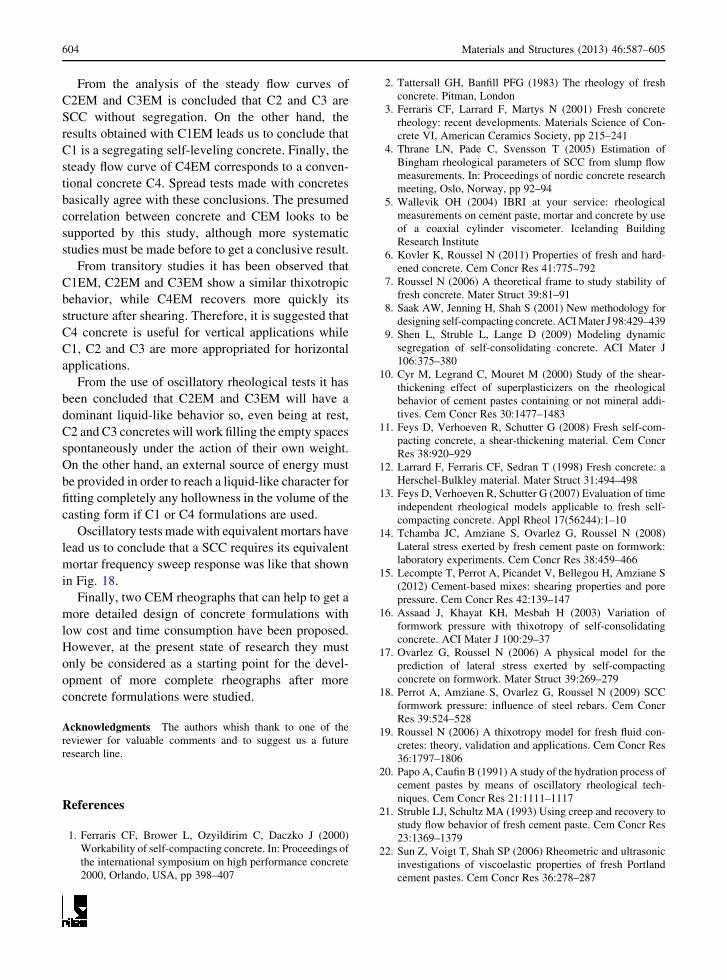
To complete the idea of the utility of the rheo-
graphs, the thixotropy rheograph obtained with the
four formulations here studied is shown in Fig. 20. In
this contour graphic, the main thixotropic parameters
for each formulation have been plotted. It can be seen
that the high-thixotropic materials fall on close to the
left side (low Athix and IR40 but high A). These
materials are recommendable for walls and tall pre-
cast forms. On the other hand, low-thixotropic mate-
rials (high IR40 and Athix) have a more spread location
in the graph. These kinds of materials are adequate for
floors and slabs. Because of this is more difficult find
out a practical limit, but we can estimate or recom-
mend values of IR40 and Athix over 75 % and 0.15 Pa/s
to considered a material as low-thixotropic. On the
other side, high A values determine a strong internal
structure, it means that is necessary make it flow. This
effect is positive in some cases because can prevent
aggregate separation during casting process. We can
conclude, from the interpretation of this thixotropy
rheograph that C2EM and C3EM are materials with a
strong structure that build-up after a long time, C1EM
has a less strong structure that builds-up faster and,
finally, C4EM is a mortar with a weak structure that
builds-up faster and faster.
A word of caution must be made respect to both key
maps. At this time they only pretend be only a start
point for SCC formulations designing from CEMs. In
order to achieve a more general rule for different cases
more materials must be studied.
4 Concluding remarks
C1–C4 formulations were designed following a pro-
cedure that intended to get SCC.
Fig. 19 Steady flow rheograph Fig. 20 Thixotropy rheograph
Materials and Structures (2013) 46:587–605 603
From the analysis of the steady flow curves of
C2EM and C3EM is concluded that C2 and C3 are
SCC without segregation. On the other hand, the
results obtained with C1EM leads us to conclude that
C1 is a segregating self-leveling concrete. Finally, the
steady flow curve of C4EM corresponds to a conven-
tional concrete C4. Spread tests made with concretes
basically agree with these conclusions. The presumed
correlation between concrete and CEM looks to be
supported by this study, although more systematic
studies must be made before to get a conclusive result.
From transitory studies it has been observed that
C1EM, C2EM and C3EM show a similar thixotropic
behavior, while C4EM recovers more quickly its
structure after shearing. Therefore, it is suggested that
C4 concrete is useful for vertical applications while
C1, C2 and C3 are more appropriated for horizontal
applications.
From the use of oscillatory rheological tests it has
been concluded that C2EM and C3EM will have a
dominant liquid-like behavior so, even being at rest,
C2 and C3 concretes will work filling the empty spaces
spontaneously under the action of their own weight.
On the other hand, an external source of energy must
be provided in order to reach a liquid-like character for
fitting completely any hollowness in the volume of the
casting form if C1 or C4 formulations are used.
Oscillatory tests made with equivalent mortars have
lead us to conclude that a SCC requires its equivalent
mortar frequency sweep response was like that shown
in Fig. 18.
Finally, two CEM rheographs that can help to get a
more detailed design of concrete formulations with
low cost and time consumption have been proposed.
However, at the present state of research they must
only be considered as a starting point for the devel-
opment of more complete rheographs after more
concrete formulations were studied.
Acknowledgments The authors whish thank to one of the
reviewer for valuable comments and to suggest us a future
research line.
References
1. Ferraris CF, Brower L, Ozyildirim C, Daczko J (2000)
Workability of self-compacting concrete. In: Proceedings of
the international symposium on high performance concrete
2000, Orlando, USA, pp 398–407
2. Tattersall GH, Banfill PFG (1983) The rheology of fresh
concrete. Pitman, London
3. Ferraris CF, Larrard F, Martys N (2001) Fresh concrete
rheology: recent developments. Materials Science of Con-
crete VI, American Ceramics Society, pp 215–241
4. Thrane LN, Pade C, Svensson T (2005) Estimation of
Bingham rheological parameters of SCC from slump flow
measurements. In: Proceedings of nordic concrete research
meeting, Oslo, Norway, pp 92–94
5. Wallevik OH (2004) IBRI at your service: rheological
measurements on cement paste, mortar and concrete by use
of a coaxial cylinder viscometer. Icelanding Building
Research Institute
6. Kovler K, Roussel N (2011) Properties of fresh and hard-
ened concrete. Cem Concr Res 41:775–792
7. Roussel N (2006) A theoretical frame to study stability of
fresh concrete. Mater Struct 39:81–91
8. Saak AW, Jenning H, Shah S (2001) New methodology for
designing self-compacting concrete. ACI Mater J 98:429–439
9. Shen L, Struble L, Lange D (2009) Modeling dynamic
segregation of self-consolidating concrete. ACI Mater J
106:375–380
10. Cyr M, Legrand C, Mouret M (2000) Study of the shear-
thickening effect of superplasticizers on the rheological
behavior of cement pastes containing or not mineral addi-
tives. Cem Concr Res 30:1477–1483
11. Feys D, Verhoeven R, Schutter G (2008) Fresh self-com-
pacting concrete, a shear-thickening material. Cem Concr
Res 38:920–929
12. Larrard F, Ferraris CF, Sedran T (1998) Fresh concrete: a
Herschel-Bulkley material. Mater Struct 31:494–498
13. Feys D, Verhoeven R, Schutter G (2007) Evaluation of time
independent rheological models applicable to fresh self-
compacting concrete. Appl Rheol 17(56244):1–10
14. Tchamba JC, Amziane S, Ovarlez G, Roussel N (2008)
Lateral stress exerted by fresh cement paste on formwork:
laboratory experiments. Cem Concr Res 38:459–466
15. Lecompte T, Perrot A, Picandet V, Bellegou H, Amziane S
(2012) Cement-based mixes: shearing properties and pore
pressure. Cem Concr Res 42:139–147
16. Assaad J, Khayat KH, Mesbah H (2003) Variation of
formwork pressure with thixotropy of self-consolidating
concrete. ACI Mater J 100:29–37
17. Ovarlez G, Roussel N (2006) A physical model for the
prediction of lateral stress exerted by self-compacting
concrete on formwork. Mater Struct 39:269–279
18. Perrot A, Amziane S, Ovarlez G, Roussel N (2009) SCC
formwork pressure: influence of steel rebars. Cem Concr
Res 39:524–528
19. Roussel N (2006) A thixotropy model for fresh fluid con-
cretes: theory, validation and applications. Cem Concr Res
36:1797–1806
20. Papo A, Caufin B (1991) A study of the hydration process of
cement pastes by means of oscillatory rheological tech-
niques. Cem Concr Res 21:1111–1117
21. Struble LJ, Schultz MA (1993) Using creep and recovery to
study flow behavior of fresh cement paste. Cem Concr Res
23:1369–1379
22. Sun Z, Voigt T, Shah SP (2006) Rheometric and ultrasonic
investigations of viscoelastic properties of fresh Portland
cement pastes. Cem Concr Res 36:278–287
604 Materials and Structures (2013) 46:587–605
23. Ferraris CF, Obla KH, Hill R (2001) The influence of
mineral admixtures on the rheology of cement paste and
concrete. Cem Concr Res 31:245–255
24. Flatt RJ, Larosa D, Roussel N (2006) Linking yield stress
measurements: spread test versus Viskomat. Cem Concr
Res 36:99–109
25. Larrard F, Sedran T (2002) Mixture-propotioning of high-
performance concrete. Cem Concr Res 32:1699–1704
26. Mahaut F, Mokeddem S, Chateau X, Roussel N, Ovarlez G
(2008) Effect of coarse particle volume fraction on the yield
stress and thixotropy of cementitious materials. Cem Concr
Res 38:1276–1285
27. Newman J (2002) Advanced concrete technology set.
Elsevier, Amsterdam
28. Yammine J, Chaouche M, Guerinet M, Moranville M,
Roussel N (2008) From ordinary rheology concrete to
self-compacting concrete: a transition between frictional
to hydrodynamic interactions. Cem Concr Res 38:890–
896
29. Schwartzentruber A, Catherine C (2000) Method of the
concrete equivalent mortar (CEM). A new tool to design
concrete containing admixtures. Mater Struct 33:475–482
30. Arnaud L, Dierkens M (2007) Setting and hardening of
cement based materials: which differences between mortars
and concretes. Advances in construction materials. Part VI.
Springer, Berlin
31. Assaad JJ, Harb J, Chakar E (2009) Relationships between
key ASTM test methods determined on concrete and con-
crete-equivalent-mortar mixtures. J ASTM Int 6
32. Tahir KE, Khayat KH, Yahia A (2009) Correlating rheology
of self-consolidating concrete to corresponding concrete-
equivalent mortar. ACI Mater J A 106:154–160
33. Rubio-Hernandez FJ, Cerezo-Aizpun I, Velazquez-Navarro
JF (2011) Mineral additives geometry influence in cement
pastes flow. Adv Cem Res 23:55–60
34. Westerholm M, Lagerblad B, Silfwerbrand J, Forssberg E
(2008) Influence of fine aggregate characteristics on the
rheological properties of mortars. Cem Concr Compos
30:274–282
35. Aıticin JC (2000) Cements of yesterday and today. Concrete
of tomorrow. Cem Concr Res 30:1349–1359
36. Flatt RJ, Martys NS, Bergstrom L (2004) The rheology of
cementitious materials. Mater Res Soc 29:314–318
37. Ramachandran VS (1995) Concrete admixtures handbook.
Noyes Publications, New York
38. Rubio-Hernandez FJ, Moreno-Lechado S, Velazquez-Nav-
arro JF (2011) Experimental study on the influence of two
different additives onto the flow behavior of a fresh cement
paste. Adv Cem Res 23:255–263
39. Estelle P, Lanos C (2008) Shear flow curve in mixing sys-
tems—a simplified approach. Chem Eng Sci 63:5887–5890
40. Roussel N, Ovarlez G, Garrault S, Brumaud C (2012) The
origins of thixotropy of fresh cement pastes. Cem Concr Res
42:148–157
41. Thrane LN, Pade C, Nielsen CV (2010) Determination of
rheology of self-consolidating concrete using the 4C-Rhe-
ometer and how to make use of the results. J ASTM Int. doi:
10.1520/JAI102003
42. Okamura H, Ouchi M (2003) Self-compacting concrete.
J Adv Concr Technol 1:5–15
43. Banfill PFG (1994) Rheological methods for assessing the
flow properties of mortar and related materials. Constr Build
Mater 8:43–50
44. Aıtcin JC (1998) Concreto de alto desempeno, Ciencia y
Tecnologıa. Taylor & Francis
45. Khayat KH, Ghezal A (1999) Utility of statistical models in
proportioning self-compacting concrete. In: Proceedings of
the RILEM international symposium on self-compacting
concrete, Stockholm, Sweden, pp 345–359
46. Okamura H, Ozawa K (1995) Mix design for self-com-
pacting concrete. Concrete Library of Japanese Society of
Civil Engineers, June 25, pp 107–120
47. Nielsen T, Mathiesen D, Glavind M (2001) User manual for
4C-packing software. DTI
48. Gomes PCC, Gettu R, Agullo L, Bernard C (2002) Diseno
de hormigones autocompactables de alta resistencia. Pro-
cedimiento para su dosificacion y metodos de cara-
cterizacion. Cemento-Hormigon 832:30–42
49. Murata J (1984) Flow and deformation of fresh concrete.
Mater Construct 17:117–129
50. Feys D, Verhoeven R, Schutter G (2009) Why is fresh self-
compacting concrete shear thickening? Cem Concr Res
39:510–523
51. Barnes HA (1989) Shear-thickening (‘‘dilatancy’’) in sus-
pensions of non-aggregating solid particles dispersed in
Newtonian liquids. J Rheol 32:329–366
52. Schultz MA, Struble LJ (1993) Use of oscillatory shear to
study flow behavior of fresh cement paste. Cem Concr Res
23:273–282
53. Lootens D, Hebraud P, Lecolier E, Van Damme H (2004)
Gelation and shear-thickening in cement slurries. Oil Gas
Sci Technol 59:31–40
54. Metzger TG (2002) The rheology handbook. For the uses of
rotational and oscillatory rheometers. Vincentz Network
GmbH, Hannover
55. Wallevik OH, Wallevik JE (2011) Rheology as a tool in
concrete science: the use of rheographs and workability
boxes. Cem Concr Res 41:1279–1288
Materials and Structures (2013) 46:587–605 605