Embed Size (px)
Citation preview

Pharmaceutical Technology DivisionDepartment of Pharmacy
University of HelsinkiFinland
Rheological properties and the state of water of
microcrystalline cellulose and silicified microcrystalline
cellulose wet masses
by
Pirjo Luukkonen
Academic Dissertation
To be presented, with the permission ofthe Faculty of Science of the University of Helsinki,
for public criticism in Auditorium 1 at Viikki Infocentre (Viikinkaari 11A)on June 16th, 2001, at 12 noon
Helsinki 2001

Supervisors: Professor Jouko YliruusiDivision of Pharmaceutical TechnologyDepartment of PharmacyUniversity of HelsinkiFinland
Docent Leena HellénOrion PharmaFinland
Reviewers: Docent Anne JuppoAstraZeneca R&D MölndalSweden
Dr. Kirsti SaarnivaaraOrion PharmaFinland
Opponent: Professor Hans LeuenbergerDepartment of Pharmaceutical TechnologyUniversity of BaselSwitzerland
© Pirjo Luukkonen 2001ISBN 952-10-0022-8ISBN 952-10-0023-6 (pdf, http://ethesis.helsinki.fi/)ISSN 1239-9469
YliopistopainoHelsinki 2001Finland

To my parents, Laura and Seppo

ABSTRACT
Luukkonen, P., 2001. Rheological properties and the state of water of microcrystalline cellulose and
silicified microcrystalline cellulose wet masses.
Dissertationes Biocentri Viikki Universitatis Helsingiensis 9/2001, 58 pp.
ISBN 952-10-0022-8 ISBN 952-10-0023-6 (pdf) ISSN 1239-9469
The aim of the present study was to investigate the rheological properties and thestate of water of microcrystalline cellulose (MCC) and silicified microcrystalline cellulose(SMCC) wet masses. Furthermore, the purpose was to understand the solid-waterinteractions and to compare the characterisation methods available for wet powdermasses.
The rheological properties of wet cellulose masses were studied at six differentwater contents (0.8-1.5 g g-1) by using mixer torque rheometer (MTR), powder rheometer(PR) and capillary rheometer. The state of water in the SMCC wet masses was studied atwide water range (0.05-1.5 g g-1) by using near infrared (NIR) spectroscopy anddifferential scanning calorimetry (DSC) measurements (thermoporosimetry). In addition,the physical properties of dry cellulose powders were characterised.
The wet masses exhibited similar behaviour in the rheometers based on thetorque measurements (MTR and PR). The cohesiveness of the wet masses and, thus, thetorque values increased with the increasing water content until the wet mass wasoverwetted. The capillary rheometer, instead, measured the standard rheologicalproperties of the materials. The rheological properties of MCC and SMCC wet masseswere slightly different and changed with the water content. Even though the SMCCgrade proved to be more elastic than the MCC grades, the cellulose wet masses could notbe differentiated with capillary rheometer as clearly as with the torque measurements.
NIR spectroscopy could be used to study the liquid retention capacity ofdifferent materials. The method was also able to distinguish the hydrate water from theother energetic states of water. The results could be correlated to the maximum torquevalues obtained in the MTR measurements, which indicates that the NIR spectroscopycould be used for the end-point detection in the real time processes. Thermoporosimetrywas able to differentiate four distinct fractions of water in MCC/SMCC wet masses.Furthermore, with this method it was possible to determine the pore structure of wetcellulose samples. The pore volume results were consistent with the NIR spectroscopyresults, which indicates that the changes in the state of water can be seen in a similarmanner with both the methods. Consequently, the methods used in this study gavetogether extensive information about the properties and behaviour of the wet cellulosemasses.
i
TABLE OF CONTENTSTable of contents _____________________________________________________ i
Acknowledgements __________________________________________________ iv
List of original publications ___________________________________________ vi
List of abbreviations ________________________________________________ vii
1. Introduction ___________________________________________ 1
2. Theory________________________________________________ 3
2.1 Water-solid interactions _________________________________________3
2.1.1 Structure of water _______________________________________________________3
2.1.2 Water sorption by solids __________________________________________________3
2.1.3 Wet agglomeration ______________________________________________________5
2.2 Special characteristics of cellulose with water________________________8
2.2.1 Structure of cellulose_____________________________________________________8
2.2.2 Water sorption by cellulose ________________________________________________9
2.2.3 Swelling______________________________________________________________11
2.2.4 Hornification__________________________________________________________11
2.2.5 Behaviour of MCC/SMCC in extrusion-spheronisation__________________________12
2.3 Wet mass characterisation_______________________________________ 13
2.3.1 Torque methods _______________________________________________________13
2.3.2 Rheological methods ____________________________________________________15
2.3.3 Thermal methods ______________________________________________________18
2.3.4 Molecular methods _____________________________________________________19
3. Aims of the study ______________________________________ 22
4. Experimental _________________________________________ 23
4.1 Materials _____________________________________________________23

ii
4.2 Characterisation of cellulose powders (I) __________________________23
4.3 Preparation of wet masses_______________________________________24
4.4 Mixer torque rheometry (I, II, IV) ________________________________24
4.5 Powder rheometry (II)__________________________________________24
4.6 Capillary rheometry (III)________________________________________25
4.7 Near infrared spectroscopy (IV)__________________________________25
4.8 Thermoporosimetry and solute exclusion (V)_______________________25
4.8.1 Isothermal step melting procedure _________________________________________26
4.8.2 Total bound water (TBW) measurements ____________________________________26
4.8.3 Solute exclusion technique________________________________________________26
5. Results and discussion _________________________________ 28
5.1 Torque measurements (I, II) ____________________________________28
5.1.1 Mixing kinetics ________________________________________________________28
5.1.2 Effect of mixing time ___________________________________________________29
5.1.3 Effect of shear forces ___________________________________________________30
5.1.4 Evaluation of methods __________________________________________________31
5.2 Rheological properties obtained by capillary rheometry (III) __________ 31
5.2.1 Flow curves___________________________________________________________31
5.2.2 Rheological models _____________________________________________________31
5.2.3 Elastic properties_______________________________________________________32
5.2.4 Evaluation of capillary rheometry __________________________________________32
5.3 Near infrared spectroscopy (IV)__________________________________33
5.3.1 Absorbance spectra _____________________________________________________33
5.3.2 Second derivative spectra ________________________________________________35
5.3.3 Evaluation of NIR spectroscopy ___________________________________________36
5.4 Thermoporosimetry (V) ________________________________________36

iii
5.4.1 Different water fractions in SMCC wet masses ________________________________36
5.4.2 Effect of granulation ____________________________________________________37
5.4.3 Evaluation of thermoporosimetry __________________________________________38
5.5 The difference between cellulose grades ___________________________39
5.5.1 SMCC vs. MCC grades __________________________________________________39
5.5.2 MCC grades __________________________________________________________42
5.6 Comparison of different methods_________________________________43
5.6.1 Capillary rheometry vs. MTR______________________________________________43
5.6.2 NIR vs. MTR _________________________________________________________44
5.6.3 Thermoporosimetry vs. NIR ______________________________________________45
5.6.4 Applicability of methods _________________________________________________46
6. Conclusions __________________________________________ 47
References

iv
ACKNOWLEDGEMENTS
This study was carried out at the Pharmaceutical Technology Division, Department of
Pharmacy, University of Helsinki, during the years 1997-2001.
I express my warmest gratitude to Professor Jouko Yliruusi for his support and
encouragement during these years. His enthusiasm for physical and molecular pharmacy
made the completion of this study possible. Furthermore, I want to thank him for letting
me do things in my own way. I am grateful also to my second supervisor, Docent Leena
Hellén, for her warm support, never-ending optimism and positive way of thinking
during all stages of this work.
I am most grateful to Professor Mike Newton, University of London, for giving
me the opportunity to visit his laboratory, which is world-famous in extrusion studies. It
was a privilege to study rheology under his kind guidance. I wish to thank also Dr.
Fridrun Podczeck for the discussions in the field of statistics and data analysis and for
supervising me during the powder rheometer studies.
I am deeply grateful to Ass.Prof. Torben Schæfer, The Royal Danish School of
Pharmacy, for his time and guidance during the mixer torque rheometer studies. His long
experience in the field of granulation combined with his accurate and abundant
comments on the manuscripts taught me a great deal of scientific thinking and writing.
I express my sincerest appreciation to Docent Anne Juppo and Dr. Kirsti
Saarnivaara, the reviewers of this thesis, for their constructive comments and suggestions
for improvement of the manuscript.
Special thanks belong to my dear colleague Dr. Jukka Rantanen for introducing
me the fascinating world of NIR spectroscopy. His never-failing support, encouragement
and friendship have been invaluable during these years.
I express my appreciation to Dr. Thad Maloney, Professor Hannu Paulapuro and
Leena Nolvi (Laboratory of Paper Technology, Helsinki University of Technology) for
their co-operation in the field of thermoporosimetry.
Docent Jukka-Pekka Mannermaa is greatly acknowledged for his support in those
moments when I needed it most.

v
My warm thanks are due to Professor Jouni Hirvonen for revising the language
of the manuscript. Jaakko Herttua is acknowledged for the illustration of the rheometers.
Tero Närvänen is thanked for the specific surface analyses. Lasse Kervinen is
greatly acknowledged for the pleasant discussion during this work. Orion Pharma is
acknowledged for the loan of the FT-NIR instrument.
One important reason why this thesis could be completed was the constant
support of my colleagues at the division. I am most grateful to the whole staff of
Pharmaceutical Technology Division for providing the most pleasant and convenient
environment in which to work (and to party!). I wish to thank especially Karin Krogars,
Amie Kaukonen, Niklas Laitinen and Anna Jørgensen for their friendship and for sharing
the moments of joy and despair with me.
I express my gratitude also to M.Sc. thesis students Flemming Jørgensen and
Krista Mäkelä for their co-operation and friendship.
I am most grateful for the closest friends and relatives here in Finland and abroad
for all the support and understanding during these years.
Finally, my warmest thanks belong to my beloved parents and brother Pekka, for
their unfailing encouragement and loving support.
The financial support from the Finnish Cultural Foundation, the Finnish
Pharmaceutical Society and NorFa are gratefully acknowledged.
Helsinki, May 2001

vi
List of original publications
This thesis is based on the following original papers, which are referred to in the text by
the Roman numerals I-V.
I Luukkonen, P., Schæfer, T., Hellén, L., Juppo, A.M. and Yliruusi, J., 1999.
Rheological characterization of microcrystalline cellulose and silicified
microcrystalline cellulose wet masses using a mixer torque rheometer, Int.J.Pharm.
188 181-192.
II Luukkonen, P., Schæfer, T., Podczeck, F., Newton, J.M., Hellén, L. and Yliruusi,
J., 2001. Characterization of microcrystalline cellulose and silicified
microcrystalline cellulose wet masses using a powder rheometer. Eur.J.Pharm.Sci.
13 143-149.
III Luukkonen, P., Newton, J.M., Podczeck, F. and Yliruusi, J., 2001. Use of a
capillary rheometer to evaluate the rheological properties of microcrystalline
cellulose and silicified microcrystalline cellulose wet masses. Int.J.Pharm. 216 147-
157.
IV Luukkonen, P., Rantanen, J., Mäkelä, K., Räsänen, E., Tenhunen, J. and Yliruusi,
J., 2001. Characterization of silicified microcrystalline cellulose and α-lactose
monohydrate wet masses using near infrared spectroscopy. Pharm.Dev.Technol. 6 1-
9.
V Luukkonen, P., Maloney, T., Rantanen, J., Paulapuro, H. and Yliruusi, J., 2001.
Microcrystalline cellulose-water interaction – a novel approach using
thermoporosimetry. Submitted for publication.

vii
List of abbreviations
BJH Barrett, Joyner, Halenda
CSD colloidal silicon dioxide
DSC differential scanning calorimetry
FBW freezing bound water
FSP fiber saturation point
FT-NIR Fourier transform near infrared
FT-NMR Fourier transform nuclear magnetic resonance
IR infrared
MCC microcrystalline cellulose
MTR mixer torque rheometer
NaCMC sodium carboxymethylcellulose
NFW nonfreezing water
NIR near infrared
NMR nuclear magnetic resonance
PCA principal component analysis
PITs processing-induced transformations
PR powder rheometer
PSD pore size distribution
SMCC silicified microcrystalline cellulose
TBW total bound water
TFW total freezing water
Tg glass transition temperature
TS tensile strength
WRV water retention value
ZTL zero torque limit

1
1. INTRODUCTION
Granulation studies have traditionally focused on the investigations of raw materials and
dry granules. However, it is well known that moisture affects both the physical and
chemical properties of pharmaceutical solids. Depending on the material properties water
can be adsorbed to solid surfaces, absorbed into amorphous solids, condensed into
micropores or it can form crystal hydrates or dissolve the solid (Zografi, 1988). The first
methods to characterise wet mass and to detect the end-point of granulation were torque
and power consumption measurements (Leuenberger et al., 1979; Bier et al., 1979).
However, these methods do not give direct information about the state of the wet mass.
In order to increase the degree of safety and quality of drug manufacturing processes, the
fundamental understanding of processing-induced transformations (PITs) is needed
(Morris et al., 2001). Recently, techniques based on the characterisation of the wet mass
at a molecular level, such as near infrared (NIR) spectroscopy, have been introduced for
in-process control.
Cellulose has a porous structure with both crystalline and amorphous regions.
The interaction of microcrystalline cellulose (MCC) with water is complicated and several
theories have been proposed on how water is bound to cellulose (Froix and Nelson,
1975; Zografi et al., 1984; Fielden et al., 1988; Blair et al., 1990). In the interaction with
water microcrystalline cellulose particles swell, and during drying the cellulose particles
shrink (Kleinebudde, 1994a-b). Microcrystalline cellulose is widely used as an excipient in
drug manufacturing processes, e.g. in direct compression and wet granulation. In
addition, MCC is an essential excipient in extrusion-spheronisation to achieve the
required rheological properties of the wet mass. The properties of microcrystalline
cellulose have been tried to improve by co-processing MCC with colloidal silicon
dioxide. Silicified microcrystalline cellulose (SMCC) should have better compaction
properties and it should be more resistant to wet granulation than conventional MCC
grades (Sherwood and Becker, 1998). Cellulose is essential in paper making process as
well, and the properties of cellulose fibers have been widely studied in the field of pulp
and paper research. In this study some of the theories and techniques used in pulp and
paper research have been applied to the study of MCC and silicified microcrystalline
cellulose (SMCC).

2
In order to understand the behaviour of the wet powder mass in different unit
operations, it is important to understand solid-water interactions and the state of water in
solids. This is especially important if the properties of the powder mass change during
wetting and drying, as is the case with microcrystalline cellulose. Most of the earlier
studies with MCC and SMCC have been made using relatively low moisture contents,
which do not include the moisture contents used in wet granulation and extrusion-
spheronisation. Until now there has been a limited number of methods to study the
properties of the wet masses and the methods have not been compared.

3
2. THEORY
2.1 Water-solid interactions
2.1.1 Structure of water
The water molecule consists of an atom of oxygen, which is covalently bound to two
atoms of hydrogen. In addition to these covalent bonds the oxygen atom has two lone
electron pairs. It has been found that a specific attraction exists between the
electronegative atoms (oxygen) and hydrogen atoms, particularly when the latter are
themselves chemically bonded directly to the electronegative atoms. The fact that water
can act both as a donor and as an acceptor of hydrogen atoms creates a great potential
for hydrogen bonding. The manner of hydrogen bonding in water is co-operative (Frank
and Wen, 1957). This means that the presence of one hydrogen bond facilitates the
formation of additional bonds.
It was earlier believed that there are no hydrogen bonds between water molecules
in the water vapour (Choppin and Downey, 1972). However, Dyke et al. (1977) showed
that dimers (H2O)2 exist in the vapour phase with a linear structure in the hydrogen bond.
Recently even water clusters have been found in water vapour (Jeffrey, 1997). The length
of the hydrogen bond (~2.95 Å) in the water vapour is longer than the observed
distances in liquid water (~2.85 Å) and in ice (~2.74 Å), which indicates that the
hydrogen bonds are weaker in water vapour.
2.1.2 Water sorption by solids
The physical and chemical properties of pharmaceutical solids are dependent on the
presence of moisture. Residual water may have significant effects on glass transition
temperature, stability, powder flow, compaction, and dissolution rate (Oksanen and
Zografi, 1990). The residual water may exist due to a prolonged exposure to water
vapour or as a result of processing that involves the use of water. The effects of moisture
depend on the amount of water sorbed and desorbed.
In order to understand the effects water can have on the properties of solids, the
state of water in solids, and the different mechanisms of water sorption in different
materials should be understood. Interactions include adsorption to solid surfaces,
absorption into amorphous solids, formation of crystal hydrates, condensation into

4
micropores and dissolution of solid in sorbed water (Zografi, 1988). The mechanism of
water sorption is greatly affected by the crystallinity of the solid material. In addition to
crystallinity, water-solubility, porous structure and the ability to form crystal hydrates
determine the mechanism of water sorption into the solid.
The most common interaction of water with surfaces is hydrogen bonding
through the oxygen atom (Thiel and Madey, 1987). Water molecules initially adsorbed on
the surfaces usually form a monomolecular layer. However, hydrogen bonded water
clusters may form even before the monomolecular layer is completed (Thiel and Madey,
1987; Zografi, 1988). This is due to the hydrogen bonding between two or more water
molecules, which is often energetically competitive with the molecule-substrate bond.
Furthermore, Pizzi et al. (1987a,b) and Berthold (1996) proposed that different polar
groups determine the magnitude of water an adsorption site would attract. According to
this theory, certain adsorption sites can adsorb one, two and, in some cases, more water
molecules before the other sites adsorb their first water molecule.
The adsorption of water to nonhydrating crystalline solids depends on the
polarity of the surfaces and is proportional to the surface area (Kontny and Zografi,
1995). The amount of moisture sorbed by amorphous solids is typically much greater
than that sorbed by crystalline substances. Similarly to crystalline solids, water is first
adsorbed to the surfaces of material. As more water molecules adhere to the surface,
moisture transfers into the amorphous material (Young and Nelson, 1967a,b). The
greater the chemical affinity of water for the solid, the greater the total amount that can
be absorbed. As soon as water penetrates into the amorphous solid structure, it acts as a
plasticizer and reduces the glass transition temperature, Tg (Froix and Goedde, 1976;
Zografi, 1988). Water replaces crosslinking hydrogen bonds between the neighbouring
polar groups of the solid, and thus loosens the structure of the solid.
Solids that form crystal hydrates adsorb initially small amounts of water to their
external surface. Crystal hydrates may be formed either in amorphous or crystalline
solids. In the case of a crystalline solid water molecules are able to penetrate into the
crystal lattice in a well-defined molecular position within the unit cell, and to form
hydrogen bonds to certain groups with a specific stoichiometry (Byrn et al., 1999). The
strength of the water-solid interaction depends on the level of hydrogen bonding
possible within the lattice (Zografi, 1988; Jeffrey, 1997; Byrn et al., 1999). In some cases

5
(e.g. caffeine and theophylline), where hydrogen bonding is relatively weak, water
molecules form hydrates mainly due to their space-filling role.
Water sorption onto porous solids differs from water uptake onto the surfaces of
flat materials. This is generally attributed to the increased attractive forces between
adsorbate molecules that occur as surfaces become highly curved such as in a pore or
capillary (Kontny and Zografi, 1995). At first, water is adsorbed onto the surface of the
pore wall, after which it is condensed and fills the core of the pore. This phenomenon is
referred to as capillary condensation and is described by the Kelvin equation [Eq. 1]
presented originally by Thomson (1871):
rRTV
PP mr γ2ln0
−= [1]
where rP is the vapour pressure in a pore radius r, 0P is the vapour pressure on flat
surfaces, γ is the surface tension of the adsorbed film, mV is the molar volume of the
liquid, R is the gas constant, and T is the temperature.
Crystalline, non-hydrate forming, water-soluble solids have a tendency to
deliquesce, i.e. to dissolve in their own sorbed water. At low moisture contents water is
adsorbed to the surface of the solid. As moisture content reaches the critical relative
humidity, the solid begins to dissolve in the sorbed film of water (Van Campen et al.,
1983; Kontny and Zografi, 1995). Deliquescence arises because of the high water
solubility of the solid and the significant effect it has on the colligative properties of
water. The process of water uptake will continue until the entire solid has dissolved.
2.1.3 Wet agglomeration
The mechanisms of bonding in the wet state depend on capillary and interfacial forces
between the particles. Once sufficient amount of liquid is added, the granulation shifts
from an immobile surface liquid state to a mobile liquid film state. Newitt and Conway-
Jones (1958) defined this theory of granulation in three different states (pendular,
funicular and capillary), into which Barlow (1968) added the fourth state (droplet) (Fig.
1a-d). Each of the four states represents a progressive increase in the moisture content,
with a corresponding change in capillary forces until the droplet state is reached.
At low moisture content water is held in the granule as discrete lens-shaped rings
at the points of contact of the particles (Fig. 1a). Particles are held together by surface

6
tension at the solid-liquid-air interface and the hydrostatic suction pressure of the liquid
bridge. At somewhat higher moisture content the rings coalesce and there is a continuous
network of liquid interspersed with air (Fig. 1b). With further increase in the water
content all the pore spaces in the granule are completely filled, and concave menisci
develop at the surface of the agglomerate (Fig. 1c). The cohesiveness of the wet mass
increases with increasing moisture content. The droplet state (Fig. 1d) occurs when the
liquid completely surrounds the granule, resulting in an external liquid phase, with an
internal solid phase (Barlow, 1968). In the droplet state, only surface tension holds the
drop together and there are no longer any internal interfacial forces.
Figure 1. Liquid saturation model. a) pendular b) funicular c) capillary and d)droplet state according to Newitt and Conway-Jones (1958) and Barlow (1968).
The tensile strength in the pendular state is about one-third of that in the
capillary state, and the tensile strength of agglomerate in the funicular state takes an
intermediate value between that of the capillary and pendular states (Rumpf, 1958). The
tensile strength of agglomerates may be estimated by the following equation [Eq. 2]:
θγε
ε cos1d
SCTS −= [2]
where TS is the mean tensile strength, S is the liquid saturation, C is a constant
depending on the particle shape, ε is the porosity of the agglomerate, γ is the surface
tension of the binder liquid, d is the diameter of particles, and θ is the contact angle of
the binder liquid to the solid.
The liquid saturation depends on the amount of liquid and the intragranular
porosity according to the equation [Eq. 3] (Kristensen et al., 1984):
( ) ρε
ε−= 1HS [3]
a) b) c) d)

7
in which H is the ratio of the mass of liquid to the mass of solid particles, ε is the
intragranular porosity and ρ is the particle density. The equation presumes that the
liquid density is unity.
Intragranular porosity is defined according to equation [Eq. 4]:
s
b
ρρε −= 1 [4]
where bρ is the apparent or bulk density of the packing and sρ is the true density of
solid particle.
According to Sastry and Fuerstenau (1973) the granule growth mechanisms
include the nucleation of fine powder to form initial primary granules, the coalescence of
existing granules, the layering of raw material onto the previously formed nuclei or
granules and the material transfer by abrasion. Many researchers have observed that the
rate of granule growth is strongly dependent upon the liquid content of the granulating
mass (Newitt and Conway-Jones, 1958; Kristensen and Schæfer, 1987). This is attributed
either to the increased granule plasticity or to the surface moisture leading to a greater
probability that the granules will stick together in collision. When one or more of the
components are soluble in water, the total volume of the liquid or solution phase rather
than the moisture content controls the granulation behaviour (Sherrington, 1968).
In pharmacy the wet granulation is used primarily for the preparation of materials
for tabletting. The amount of liquid required for an uncritical granulation process
depends on a large number of factors, such as material properties, liquid characteristics
and the mode of action of the equipment (Capes, 1980; Kristensen and Schæfer, 1987).
Since the consolidation of moist agglomerates is a basic mechanism involved in the
granule growth, equipment with high shear forces require less water than equipment with
low shear forces (Kristensen and Schæfer, 1987). Newitt and Conway-Jones (1958) noted
that the critical moisture content required for granulation correlated with 90% of the
moisture required to saturate the voidage in the powder mass.
Extrusion-spheronisation process is a special case of wet granulation, which
requires more water as compared to traditional granulation. The specific requirements for
wet masses will be discussed in chapter 2.2.5. The amount of water required for
successful extrusion-spheronisation has been traditionally determined by trial and error.
However, the level of water at the capillary state should be comparable with that found

8
for the optimum production of pellets during spheronisation (Miyake et al., 1973; Rowe
and Sadeghnejad, 1987).
2.2 Special characteristics of cellulose with water
2.2.1 Structure of cellulose
Two major sources of cellulose fibers are cotton seed hair and wood. Cotton is almost
pure cellulose, while wood contains cellulose (40-50%), hemicelluloses (20-30%) and
lignin (20-30%). The role of cellulose is to reinforce the wood fiber. Lignin adds strength
to the structure and hemicelluloses bind the cellulose and lignin together. In the pulping
process the cellulose fibers are separated and part of the lignin and the hemicelluloses are
dissolved. ”Dissolving pulp” is the trade name for pure cellulose fibers, which are used in
chemical processes.
The cellulose polymers are built up of cellobiose units, which are linked together
by ß-(1-4) glucosidic bonds (Fig. 2). The cellobiose units (A) form larger unit cells (B),
which form crystallites (C). Crystallites with crystalline and amorphous regions are
combined into microfibrils (D) and fibrils (E), which finally form cellulose fibers (not
shown).
Figure 2. The structure of cellulose.
Microcrystalline cellulose is manufactured from dissolving pulp by acid
hydrolysis. After washing with water the suspension is spray dried into microcrystalline
powder. The manufacturing process shortens the cellulose chains and removes the
dissolving parts of cellulose fibers, i.e. hemicelluloses and lignin. During the process the
cellulose fibers (length 1-3 mm) are reduced to smaller particles, which diameter
(normally 50-100 µm) can be defined in the spray drying process.
HO
O
OH
OH
O
HO
OH
O
AA B C D E

9
Milling of dissolving pulp produces powdered cellulose. The degree of
polymerisation is much greater in powdered cellulose (~500) than in microcrystalline
cellulose (~220). In addition, the degree of crystallinity of powdered cellulose (15-45%) is
smaller compared to that of microcrystalline cellulose (65-75%). This means that the
cellulose chains are much longer in powdered cellulose and the structure of powdered
cellulose contains more amorphous regions than that of MCC.
Silicified microcrystalline cellulose (SMCC) is produced by co-processing
colloidal silicon dioxide (CSD) together with MCC, i.e. CSD is added to the MCC slurry
before spray drying.
Colloidal grades of MCC are produced by co-processing MCC with the
hydrophilic sodium carboxymethylcellulose (NaCMC). Colloidal grades of MCC vary in
terms of the amount of NaCMC added, the viscosity of NaCMC and the drying method
used during manufacturing.
2.2.2 Water sorption by cellulose
Hydrogen bonds within and between cellulose chains give the cellulose molecule a stiff
and rigid nature. In the initial stage of cellulose-water interaction, water molecules are
adsorbed on the cellulose surfaces and bound to the free hydroxylgroups of cellulose
chains by hydrogen bonds. The heat of adsorption provides a source of energy for the
breaking of lateral bonds between the polysaccharide molecules (Emerton, 1980).
Consequently, water is able to replace the crosslinking hydrogen bonds between cellulose
chains, and thus to loosen the structure of cellulose (Fig. 3). At high relative humidities,
capillary condensation occurs and the porous cellulose fibers can hold appreciable
amounts of water in submicroscopic pores, cracks and crevices between fibrils. To some
extent water is held also in pores and gaps between the fibers (Weise, 1997). In addition
to the water adsorption to the surfaces, water is also absorbed into the amorphous parts
of cellulose.
Water in wood pulps has been categorised according to the thermodynamic
properties to nonfreezing, freezing bound and free water (Nakamura et al., 1981;
Hatakeyama et al., 1983; Maloney, 2000). Nonfreezing water is a type of bound water,
which does not show any first order transition down to –170ºC. Nonfreezing water
consist of the surface water, which is hydrogen bonded to the cellulose, and the further
layers of water molecules, which are still significantly influenced by the cellulose surface

10
(Li, 1991). Freezing bound water is located in submicroscopic pores, cracks and crevices
between fibrils due to the capillary condensation. Water with thermodynamic properties
similar to those of pure water is called free water. Water can be both inside and outside
fibers, since the methods based on thermodynamic properties cannot differentiate the
location of water.
There is still not a well-accepted thermodynamic theory to explain why some of
the water in hydrated systems does not freeze. However, it has been shown that there is a
correlation between the number and type of available hydration sites and the quantity of
nonfreezing water (Nakamura et al., 1981; Berthold, 1996). NMR measurements have
shown that vicinal water (water near a surface) is in a high state of motion and in this
respect, the term bound may be misleading (Li, 1991).
Figure 3. a) Hydrogen bonding between two adjacent cellulose molecules, b)Hydrogen bonding of two cellulose molecules through a monolayer of watermolecules and c) Irregular hydrogen bonding of two cellulose molecules,resulting from sorption of multilayers of water molecules (Emerton, 1980).
b)
a)
c)

11
2.2.3 Swelling
In the interaction with water new pores are generated as the cellulose particles swell. In
the pulp fiber literature, swelling is usually defined as the amount of water contained in
the saturated fiber cell wall. Liquids that are able to penetrate into the crystalline regions
induce intracrystalline swelling of cellulose (Zeronian, 1985). Since water does not
penetrate well-defined crystalline zones, it can cause only intercrystalline swelling of
cellulose. The most popular techniques to measure the swelling of pulp fibers have been
water retention value (WRV) and solute exclusion technique (Stone et al., 1968; Scallan
and Carles, 1972; Weise, 1997; Maloney, 2000). WRV determines the moisture content of
pulp fiber after centrifugation. Solute exclusion technique measures the fiber saturation
point (FSP), i.e. the total amount of water inside the cellulose particles. High molecular
weight dextran solution, which cannot penetrate cellulose particles, is added to the wet
cellulose mass. Water outside the cellulose particles is able to dilute the dextran solution,
and the method is based on the measurement of the concentration change of dextran
solution.
In the paper making process swelling of pulp fibers can be increased by beating,
which cuts cellulose fibers and causes morphological changes. Consequently, the lamellar
structure of fibrils inside the cellulose fibers is loosened, which increases the water
penetration into the cellulose structure (Stone et al., 1968; Emerton, 1980; Li, 1991;
Maloney et al., 1998).
2.2.4 Hornification
Most of the pores, which have been formed in the interaction with water, will collapse
during dewatering of cellulose. Urquhart (1924) suggested that the number of polar
hydroxyl groups of cellulose fibers is decreased during rewetting because some of them
have formed hydrogen bonds between themselves. Jayme (1944) named this
phenomenon as hornification, and defined it as a decrease in water retention value. The
closure of capillaries progresses as if closing a zipper, which might not be reopened by
newly intruding water. Despite its original definition, hornification is commonly used as a
descriptive term for the physical and chemical changes that occur in pulp fibers during
drying, principally shrinkage and formation of internal hydrogen bonds (Weise, 1998).
The phenomenon is seen also in pharmaceutical wet granulation as a remarkable increase
in the density of the granules (Chatrath, 1992; Sherwood and Becker, 1998; Habib et al.,
1999).

12
2.2.5 Behaviour of MCC/SMCC in extrusion-spheronisation
MCC is an essential excipient in extrusion-spheronisation to achieve the required
rheological characteristics of the wet mass. The wet mass must be brittle enough to cut
into small pieces in the spheronizer but on the other hand it should be sufficiently plastic
to enable the moulding of the extrudate into a sphere (Fielden and Newton, 1992).
Fielden et al. (1988) and Ek and Newton (1998) suggested that microcrystalline cellulose
can be described as a molecular sponge, since MCC is able to trap a large volume of
water within its porous structure and retain it despite the application of high pressures.
During extrusion the sponges are compressed until water is squeezed out and lubricate
the particle flow through the extruder.
Kleinebudde (1997) proposed that MCC particles are broken down into smaller
particles by shear forces acting on the particles during granulation and extrusion. The
new model was named as the crystallite-gel model. According to this model finally single
crystallites of colloidal size prevail, and these single particles, in the presence of water, are
able to form a gel and immobilise water. Recently, Kleinebudde et al. (2000) postulated
that the sponge model is more appropriate for the cellulose type a with high degree of
polymerisation (powdered cellulose), whereas the gel model is more applicable to
cellulose types with a lower degree of polymerisation (MCC and SMCC).
Extrusion-spheronisation consists of three different stages; i.e. granulation,
extrusion and spheronisation. Every step in the process of extrusion-spheronisation
affects the properties of the resulting pellets (Schmidt and Kleinebudde, 1999). However,
only few authors have reported studies concerning the impact of the granulation step.
When comparing planetary and high-shear mixers, Baert et al. (1991) and Vervaet (1997)
found out that granulation in the high-shear mixer and increased granulation times
resulted in higher extrusion forces for the same composition. Furthermore, Schmidt and
Kleinebudde (1999) found out that higher shear forces during granulation resulted in a
higher water content necessary for a successful pelletisation. Since the results were in
contrast to conventional granulation, they explained their results with the crystallite-gel-
model. According to the model, high shear forces during granulation and extrusion
should result in a more delicate network, which requires more water to obtain the same
plasticity as compared to a coarser network of the gel.

13
2.3 Wet mass characterisation
2.3.1 Torque methods
The first attempts to follow the granulation process were made by measuring
either the power consumption or torque of a planetary mixer (Lindberg et al., 1974;
Travers et al., 1975). A few years later Leuenberger and his colleagues compared both
methods by measuring the torque and electrical power consumption simultaneously
(Leuenberger et al., 1979; Bier et al., 1979). They found out that both the variables
changed as a result of a change in the cohesive force or in the tensile strength of the wet
agglomerates. The authors were able to connect the torque curve to the liquid saturation
and to the increased particle size of the wet powder mass, i.e. they were able to use the
torque curve to the end-point detection of the granulation process (Fig. 4). According to
Leuenberger et al. (1981) and Imanidis (1986), granules for tabletting can be produced in
the third phase (S3-S4). Recently, the torque measurements have been used to control the
end-point of a wet pelletisation process in a rotary processor by Kristensen et al.
(2000a,b).
Figure 4. Torque curve connected to the liquid saturation (Imanidis, 1986).
A π-value derived from a power consumption/torque curve [Eq. 5] has been
used to normalise the uncritical amount of liquid for granulation (Imanidis, 1986; Usteri
and Leuenberger, 1989) and for extrusion-spheronisation (Nürnberg and Wunderlich,
1999a-b).
( ) ( )252 SSSS −−=π [5]
0
100
200
300
400
0 5 10 15 20 min
Phase VPhase IVPhase III
Phase II
S2 S3 S4 S5
Torque

14
where S is the amount of granulating liquid, 2S is the amount of granulating liquid
necessary (which corresponds to a moisture equilibrium at approx. 100% relative
humidity) and 5S is the complete saturation of interparticulate void space before a slurry
is formed.
In addition to the instrumentation of different granulators, various equipment
have been introduced for the evaluation of wet massing behaviour of materials. Alleva
(1984) used a granulation rheology apparatus and Staniforth et al. (1988) a modified shear
cell to study the cohesiveness of wet MCC masses. Malamataris and Kiortsis (1997)
introduced a wet-kneading rheometer to study the funicular phase of liquid saturation.
The mixer torque rheometer (MTR) has been used to study the source variation of MCC
grades (Rowe and Sadeghnejad, 1987; Parker and Rowe, 1991), binder-substrate
interactions (Parker et al., 1990; Parker et al., 1991), and the mixing kinetics of water and
MCC (Hancock et al., 1992). Recently the torque measurements have been used for
scale-up and process control (Landín et al., 1996; Faure et al., 1999) and for the
evaluation of the optimum water level for extrusion-spheronisation (Souto et al., 1998;
Chatlapalli and Rohera, 1998; Luukkonen et al., 1999).
The mixer torque rheometer has two intermeshing
paddles, and the sample is compressed and expanded
between contrarotating blades with a changing gap (Fig. 5).
The reaction of the mixing bowl is continually recorded via
a torque arm fixed to the main body of the mixer and
linked to a calibrated dynamometer. The MTR measures
two different torque parameters, the amplitude of the
oscillations (torque range) and the mean torque increase from the baseline (mean torque).
The mean torque describes the mean resistance of the mass to mixing and the torque
range reflects the rheological heterogeneity of the mass. In the MTR experiments the
material exhibits an increase in torque with increasing water content as the consistency of
the wet mass rises to a maximum, whereafter it decreases as the material becomes
overwetted. Alleva (1984) and Rowe and Sadeghnejad (1987) have suggested that this
behaviour is consistent with the different states of liquid saturation defined by Newitt
and Conway-Jones (1958).
The newest equipment to measure the wet mass consistency is a powder
rheometer, which should be able to measure both the dry and wet powder masses. The
Figure 5. Mixertorque rheometer.

15
equipment consists of a cylindrical measuring vessel (50 x 140 mm) and a rotor blade
which descends into the cylinder in a helical path (Fig. 6). The helical path is defined as
the spiral movement of the impeller blade tips during downward or upward movement
of the rotating impeller. By changing the impeller direction of rotation and the helical
path, the impeller blade causes either compaction or slicing of the powder bed. The
equipment enables the user to choose a combination of
rotor path settings and blade tip velocities. The apparatus
allows the measurement both of the force exerted by the
powder on the blade and the resistance of the powder to
movement (torque). Each property is recorded as a
function of the height of the blade in the powder bed.
Powder rheometer has been used so far only to
study the capsule filling properties of MCC and
granulated powdered cellulose (Podczeck, 1999a-b;
Podczeck and Newton, 2000). The authors found out
that the powder rheometer was able to identify
similarities and differences in the flow, shear and packing
properties of dry powders.
2.3.2 Rheological methods
The rheological properties of an extrudate depend on the properties of the material and
the liquid content of the wet mass (Fielden and Newton, 1992). If the wet mass is too
dry, the plasticity of the extrudate is insufficient and the extrudate does not round in the
spheronisation. On the other hand, if the wet mass is too wet the pellets will agglomerate
during spheronisation. To design an optimal formulation for extrusion-spheronisation, it
is necessary to characterise the mechanical and rheological properties of the wet mass (Li
et al., 2000). Since the wet mass undergoing extrusion and spheronisation experiences
different kinds of stresses, it is apparent that the rheological or mechanical properties of
the wet mass may address the requirements of both the processes (Shah et al., 1995).
However, there is a lack of understanding of these processes and of the requisite
properties of materials and formulations. Only few studies have considered the
rheological properties of wet masses that make them suitable for extrusion-
spheronisation.
Figure 6.Powder rheometer.

16
According to Ovenston and Benbow (1968), the parameters necessary to
characterise the flow of a material through a die during extrusion can be measured
directly only using a capillary rheometer. The ease of extrusion depends on the excess of
the liquid present over that what is required to fill the interparticle space between the
particles (Benbow and Bridgwater, 1993). Powders which have a broad particle size
distribution, pack closely requiring less liquid to fill the spaces between particles than
powders having a narrow particle size distribution (Benbow et al., 1987; Chen et al.,
2000). In addition to particle size and size distribution, particle shape and the state of
surface exert significant influence on the extrusion behaviour of pastes (Chen et al.,
2000).
The extrusion of pastes can result in the phenomenon of liquid migration, which
causes changes in fluid content within the wet mass. Water movement in the material
and its liquid retention potential has been studied using pressure membrane technique
(Fielden et al., 1992; Knight, 1993; Boutell, 1995) and centrifugation (Tomer and
Newton, 1999a; Tomer et al., 2001). Water movement during extrusion has been
followed by measuring the moisture content of extrudate fractions (Harrison, 1982; Baert
et al., 1992; Knight, 1993; Tomer and Newton, 1999b). Moisture distribution of
extrudate plugs can be determined also by magnetic resonance imaging (MRI) (Tomer et
al., 1999a;b).
Ram extruder and compresso-rheometer have been used to screen the materials
for successful extrusion-spheronisation (Harrison et al., 1985; Delalonde et al., 1997;
Tuleu and Chaumeil, 1998; Delalonde et al.,
2000). When a ram extruder has been used as
a capillary rheometer, information can also be
obtained about the elastic behaviour of wet
masses (Chohan and Newton, 1996). Shah et
al. (1995) combined rheograms (yield values),
tensile strengths and yield loci with data from
extrusion to define a rheological window
within which both the extrusion and
spheronisation could be successfully carried
out. Li et al. (2000) introduced a triaxial
compression test for pharmaceutical wet
Load cell
Piston
Barrel
Wet mass
Die
Extrudate
Figure 7. Ram extruder.

17
masses. They were able to determine stress-strain curves, pore water pressure, shear
strength and cohesion together with an angle of internal friction for the wet powder
masses.
The ram extruder consists of a barrel, a die and a piston (Fig. 7). Wet mass is
packed into the barrel and compressed by hand pressure, after which the ram extruder is
driven downwards by a mechanical press. The air is expelled during the compression
stage, and in the beginning of extrusion the system consists of liquid and solid particles
only. The resistance to movement involves two components; the convergent flow from
the wide barrel to the narrow die and the flow through the die.
When different ram velocities and dies with different lengths are used, ram
extruder works as a capillary rheometer. The die wall shear stresses can be derived from
the plots proposed by Bagley (1957) according to equation [Eq. 6]:
LPRw 2∆=τ [6]
in which wτ is wall shear stress, L is the die length, R is the die radius and P∆ is the
pressure difference between the ends of the die.
The pressure drop along the barrel can be estimated by determining the values of
piston pressure against the length to radius ratio of the die, and extrapolating to a zero
value. A finite pressure loss at the zero die length can thus be estimated and this is
equivalent to the drop of pressure along the barrel. Thus, the equation [6] can be
modified as:
( ) LRPPw 20−=τ [7]
where P is the piston pressure and 0P is the upstream pressure loss.
The die wall shear rates are calculated according to equation [Eq. 8]:
3
4RQ
A πγ = [8]
where Q is the volumetric flow rate and R is the radius of the die.
The die wall shear stresses can then be plotted against the die wall shear rates to
construct a flow curve, which provides a representation of the rheological properties of a
given material.

18
2.3.3 Thermal methods
Differential scanning calorimetry (DSC) has been traditionally used to measure the
nonfreezing water in starch, cellulose and pulp fibers (Mousseri et al., 1974, Nelson,
1977; Nakamura et al., 1981; Hatakeyama et al., 1983). The amount of nonfreezing water
is calculated by subtracting the total freezing water in the sample (determined from the
measured heat) from the total water in the sample (determined gravimetrically). The
freezing bound water is much more difficult to quantify than the nonfreezing water,
because the DSC melting peak overlaps with that of the bulk water (Nakamura et al.,
1981; Yamauchi and Murakami, 1991; Maloney, 2000). However, the water held in the
capillaries of porous materials has a depressed melting point. This is due to the higher
pressure of water in the cavities with a curved interface. The depression of melting
temperature of a material has been used to measure the pore size distribution by
thermoporosimetry. Generally, thermoporosimetry has been applied to systems where
the pores are sufficiently small, so that separate bulk and pore water peaks are formed in
the melting endotherms (Ishikiriyama and Todoki, 1995). For water saturated pulp fibers,
the melting temperature of the water in the cell wall is depressed only slightly below that
of the bulk water, so the pore and bulk water peaks overlap making the analysis difficult.
In order to measure the
pore size distribution of pulp
fibers with DSC, Maloney et al.
(1998) developed an isothermal
step melting procedure. The
principle of the isothermal melting
technique is to raise the tempera-
ture in a frozen sample to a
present value, where it is held
constant until the melting
transition is completed (Fig. 8).
The melting of the sample is then
repeated at a slightly higher
temperature. The heat absorbed at
each temperature is measured by
Time
Tem
pera
ture
Conventional DSC ProgramStep Program
t∆
isott ∆∆=β
isot∆
Figure 8. Comparison of dynamic andisothermal step program. β is the rate of thedynamic segment, T∆ is the temperatureincrement of the steps and isoT∆ is theduration of the isothermal segment (Maloney,1999).

19
integrating the endotherm. The melting heat is assumed to correlate directly with the
amount of melted water and, consequently, the pore size distribution is calculated from
the melting temperature depression of the imbibed water.
The relationship between pore diameter (D) and the melting temperature
depression is described by the Gibbs-Thomson equation [Eq. 9]
TH
TvDf
lsm
∆−=
γ04 [9]
where mv is the molar volume of ice, 0T is the melting temperature of water at a normal
pressure, lsγ is the surface energy at the ice-water interface (12.1 mJ/m2), fH is the
specific heat of melting of bulk water (334 J g-1) and T∆ is the melting temperature
depression (°C).
2.3.4 Molecular methods
Bugay and Williams (1995) stated that one stage of the characterisation of pharmaceutical
solids must be at a molecular level. Suitable methods for this purpose are the various
forms of molecular spectroscopy techniques such as infrared, Raman, and nuclear
magnetic resonance (NMR). Infrared and Raman analyses provide a complete vibrational
motion analyses of the molecule, whereas NMR provides insight into the local
environment of each NMR active atom.
The basic idea of the NMR method is that the molecular dynamics of liquid
molecules in the vicinity of a solid surface is perturbed and, therefore, the relaxation
times for the liquid molecules near the surface are different from that of the bulk liquid.
NMR has been used to study the state of water in cellulose samples (Froix and Nelson,
1975; Froix and Goedde, 1976; Peemoeller and Sharp, 1985), the pore structure of
porous cellulose beads (Ek, 1995) and the pore size distribution of pulp cellulose fibers
(Li, 1991; Maloney et al., 1997).
In Raman spectroscopy, the sample is irradiated with monochromatic laser
radiation, and the inelastic scattering of the source energy is used to obtain a vibrational
spectrum of the analyte. A vibrational mode is infrared-active when there is a change in
the molecular dipole moment during the vibration, whereas the vibrational mode is
Raman-active when there is a change in polarisability during the vibration. The Raman
spectrum of water is one broad, weak band at 3500 cm-1, which does not disturb Raman

20
measurements. Due to this Raman spectroscopy has not been used to study the state of
water in wet masses, but rather the changes occurring in the molecular structure of a
material. These studies include pseudopolymorphic transitions during storage (Taylor and
Langkilde, 2000) and wet granulation (Jørgensen et al., 2001).
Water absorbs mid-IR light strongly and, thus, aqueous samples may be
measured only as thin films. Absorption bands in the near infrared (NIR) region arise
from overtones or combinations of overtones originating in the fundamental mid-IR
region. Overtone bands in the NIR region are typically 10-1000 times less intense than
their corresponding fundamental absorption bands. On the contrary to mid-IR
spectroscopy, near infrared spectra may be obtained noninvasively from samples inside
glass containers or remotely using fiber-optics. In addition, NIR spectroscopy is
particularly well suited to the study of water in carbohydrates, because the specificity of
NIR stretching vibrations involving -CH or -OH groups is high.
The near-infrared spectroscopy absorption spectrum of pure water consists of
five bands with the maxima at 760, 970, 1190, 1450 and 1940 nm (Curcio and Petty,
1951). The OH stretching frequency in the IR region represents the strength of the
hydrogen bonds. Thus, the frequencies and intensities of water bands alter also in the
NIR region with the changes in the strength of hydrogen bonds and hydration (Fornés
and Chaussidon, 1978; Iwamoto et al., 1987; Osborne et al., 1993). Non-hydrogen-
bonded -OH groups have higher stretch frequencies and, hence, a lower wavelength than
the hydrogen-bonded -OH groups. The most intense absorption bands of water are
found around 1450 and 1940 nm (Curcio and Petty, 1951; Osborne et al., 1993). Since
the first overtones of carbohydrates (i.e. cellulose and lactose) and the -OH groups of
water overlap on the same wavelengths (around 1450 nm), the combination band
(around 1940 nm) provides a better selectivity for water and, hence, is the most
important absorption band in the NIR region (Osborne et al., 1993).
NIR spectroscopy has been used previously in the study of the different states of
water in foods (Iwamoto et al., 1987; Osborne et al., 1993) and in cellulose (Delwiche et
al., 1991; Berthold et al., 1998; Buckton et al., 1999; Svedas, 2000). Recently, NIR
spectroscopy has been used to study the pseudopolymorphic transformations (Buckton
et al., 1998; Lane and Buckton, 2000; Räsänen et al., 2001). In wet granulation processes
the NIR methods have been used for on-line moisture detection and end-point
determination (Watano et al., 1990; White, 1994; Frake et al., 1997; Rantanen et al., 1998,

21
Rantanen et al., 2000a,b; Morris et al., 2000). In addition, an effort has been made to use
NIR and water absorbing potential of a material to predict the suitable amount of water
for wet granulation (Watano et al., 1996; Miwa et al., 2000).
NIR spectroscopy is particularly suitable for multivariate data analysis, and
together they form a powerful tool for analysing various materials with widely divergent
properties (Antti, 1999). By using principal component analysis (PCA), the number of
variables is reduced from over a thousand wavelengths to a few principal components
describing the variation in the spectra. Berthold et al. (1998) used NIR spectroscopy in
combination with PCA to study the interactions between water molecules and
carboxymethylated cellulose. The same combination has been used to characterise
different pulpwood samples (Antti, 1999).

22
3. AIMS OF THE STUDY
The aim of the present study was to investigate the rheological properties and the state of
water of microcrystalline cellulose (MCC) and silicified microcrystalline cellulose (SMCC)
wet masses. Furthermore, the purpose was to understand the solid-water interactions and
to compare the characterisation methods available for wet powder masses. The specific
aims were:
1. to investigate the rheological properties of SMCC wet masses in comparison to
the standard grades of MCC using a mixer torque rheometer (MTR) and to
correlate the results with the physical properties of the materials
2. to evaluate the powder rheometer in studying MCC and SMCC wet powder
masses and to make comparisons with the MTR
3. to study the influence of MCC type and water content on the rheological
properties of the wet powder masses using capillary rheometer and to compare
the results with the results obtained by MTR
4. to investigate the energetic state of water in different materials using near infrared
(NIR) spectroscopy and to evaluate NIR spectroscopy in comparison with MTR
5. to study the state of water and the effect of wet massing on different water
fractions of MCC/SMCC wet masses using thermoporosimetry together with
solute exclusion technique and to make comparisons with NIR spectroscopy.

23
4. EXPERIMENTAL
4.1 Materials
Three different grades of microcrystalline cellulose (MCC) were studied: Avicel PH 101
manufactured by FMC Co. (Cork, Ireland) and Emcocel 50 and Prosolv 50 from
Penwest Pharmaceuticals Co. (Nastola, Finland). Prosolv 50 is silicified microcrystalline
cellulose (SMCC) with a 2% w/w silicon dioxide concentration.
In addition, α-lactose monohydrate (Pharmatose 200 M, DMV, Veghel, The
Netherlands), 1:1 mixture of SMCC and α-lactose monohydrate and glass ballotini (40
µm, Jencons Ltd., England) were used in NIR and MTR measurements (IV).
4.2 Characterisation of cellulose powders (I)
The particle size and size distribution were studied using a laser light diffractometer
(Malvern 2600c, Malvern Instruments Ltd., UK) equipped with dry powder feeder.
The specific surface area of each sample was determined in a Coulter SA 3100
apparatus (Coulter, Miami, FL). The samples were first degassed under vacuum at 40ºC
for 24 h. The pore volume size distributions were calculated from the nitrogen
adsorption isotherms by the BJH model (Barrett et al., 1951).
The flowability was determined by an automatic flowability recorder (constructed
at Orion Corporation, Finland, i.e., a non-commercial equipment). The angle of repose
was determined by measuring the angle of the powder pile.
The poured and tapped densities of the materials were determined according to
the test of apparent volume (Ph.Eur. 2nd Ed.). True density measurements were made
using a helium pycnometer (type Accupyc 1330, Micromeritics, Dunstable, UK).
The swelling volume was determined using a method described by Podczeck and
Révész (1993). 500 mg ± 0.5 mg of each material was placed in a 20 ml graduated test
tube with 10.0 ml of distilled water. The solids were suspended by vigorous shaking and
allowed to settle down until the volume was constant. The swelling volume was noted
and the relative increase in swelling was calculated on the basis of the poured bulk
volume.
All the tests mentioned above were made in triplicate.

24
Contact angles were determined using Optical Contact Angle Meter (CAM 200,
KSV Instruments Ltd, Finland). The results present the mean of 20 replicates.
4.3 Preparation of wet masses
The materials were granulated in a planetary mixer (Kenwood Chef Classic, KM 400, UK
(II, V); Hobart, London, UK (II, III); Stephan UMC 5 Electronic, Stephan, Germany
(IV)). Glass ballotini (IV) and ungranulated cellulose wet masses (V) were prepared by
adding the water to the dry powder in a mortar. The wet masses were allowed to
equilibrate overnight in plastic bags before experiments.
4.4 Mixer torque rheometry (I, II, IV)
The rheological profiles of the wet masses were monitored using a mixer torque
rheometer (Model MTR, Caleva Ltd, Dorset, England). Dry powder was mixed in the
rheometer for 3 minutes to obtain the baseline response, which was afterwards deducted
from the torque responses. The quantity of dry powder was selected so that the mixing
blades were covered (IV, Table 1.). Water was added in a single addition and the mixture
was wet massed at 52 rpm for 12 minutes. Curve fittings (three parameter log normal)
were made by SigmaPlot 4.0 (SPSS Inc., Chicago, USA).
When measuring wet granules the rheometer was initially run empty at 52 rpm
for 15 sec in order to generate a baseline value (II). Thirty-five grams of wet powder
mass was then added to the bowl, and the rheometer was run for 30 sec, after which data
was recorded for 30 sec. In order to study the effect of mixing time, wet powder masses
were mixed further for 2.5 minutes. All the wet massing experiments were performed in
triplicate and a mean torque value and a standard deviation were calculated.
4.5 Powder rheometry (II)
An automated powder rheometer (Wet and Dry Powder Rheometer FingerPrint,
Freeman Technology, Malvern, UK) was used to study the wet massing behaviour of
Prosolv 50. A downward compaction and an upward slicing were used with the helical
rotor angle of 3°. The blade tip velocity was 100 mm s-1. Water was added to 35 g of dry
powder during the first 6 minutes of mixing using a Gilson pump (Miniplus 3, Model
M312, Villiers, France). Mixing of the wet powder mass was continued up to 15 minutes
(30 cycles).

25
When measuring wet granules a blade tip velocity of 40 mm s-1 was used and wet
powder masses were mixed for 12.5 minutes (10 cycles). The wet mass column height
was kept at 95-100 mm, which corresponds to 50-60 g of wet granules depending on the
moisture content. Experiments were performed in triplicate, and an equipment
dependent software was used to derive the coefficients of the functions for each
individual traverse.
4.6 Capillary rheometry (III)
The wet masses were extruded using a ram extruder designed by Ovenston and Benbow
(1968). When different ram velocities and dies with different lengths are used, ram
extruder can be used as a capillary rheometer. The barrel (diameter 2.54 cm) was fitted
with a hardened steel die of 1.5 mm diameter with different lengths (3-12 mm). The ram
extruder was driven downwards by a mechanical press (Lloyds MX-50, Southampton,
UK) using five different ram speeds (400, 200, 100, 50 and 25 mm min-1) with one filling
of the barrel. Extrusions were made in triplicate. The non-linear curve fittings of
mathematical models (Casson, Herschel-Bulkley and Power law) were made using the
program SigmaPlot 5.0 (SPSS Inc., Chicago, USA).
4.7 Near infrared spectroscopy (IV)
NIR spectra were measured using an FT-NIR spectrometer (Bühler NIRVIS, Uzwil,
Switzerland) with a fiber-optic probe. Diffuse reflectance spectra were measured over the
range of 1000-2500 nm (500 data points), each spectrum being the average of four scans.
The probe was gently placed into the wet powder mass. Each moisture level was
measured five times and the average of these spectra was used. The spectral treatment
(absorbances and second derivatives) was performed with NIRCAL v. 2.0. The second
derivative was calculated using the 9-point Savitzky-Golay algorithm. Two points’
baseline correction was performed with Matlab 5.3 (The MathWorks Inc., Natick, MA,
USA).
4.8 Thermoporosimetry and solute exclusion (V)
DSC measurements were carried out on a Mettler 821e DSC (Mettler Toledo,
Switzerland) equipped with an intracooler. The samples of approximately 3.5 mg were
weighed into non-hermetically sealed aluminium pans. The weight of the samples was
checked before and after the DSC measurements to ensure that the pan was well sealed.

26
The water content of the samples was determined by drying the samples for 24 h at
105°C.
4.8.1 Isothermal step melting procedure
In the beginning of the measurement the sample was cooled at 10°C min-1 from +25°C
to -45°C and then heated to -35°C, where it was hold for 2 minutes. The isothermal step
melting procedure was run at 1°C min-1 to set points shown in Table 1 (V). The duration
of isothermal segments varied from 2 min at -33°C to 22 min at -0.2°C depending on the
time the sample needed to complete the melting. In order to determine the total freezing
water (TFW), the sample was dynamically cooled at the end of the measurement to -45°C
at 10°C min-1 and then heated to +25°C at 5°C min-1. The results are the mean of four
measurements and the statistical differences were analysed with Student’s t-test.
4.8.2 Total bound water (TBW) measurements
The principle of the total bound water measurement is to raise dynamically the
temperature of a frozen sample slightly below 0°C, where it is held constant until the
melting transition is completed. With this method the pore size distribution can not be
determined, but the total amount of water with depressed melting temperature can be
measured.
TBW measurements were started from +3°C by cooling the sample first to -30°C
and then heating it to -0.2°C at 5°C min-1. The temperature was kept at -0.2°C for 12
minutes to ensure that the sample had enough time to complete the melting. The sample
was then cooled to -30°C and the amount of tbwH was calculated by integrating this
freezing peak (V,Eq. 4). In the end of the measurement the sample was heated to +25°C
to determine the tH (V, Eq. 2). The measurements for SMCC wet granules were
performed in duplicate and the average is reported. The results for ungranulated and
granulated cellulose samples are the mean of four measurements.
4.8.3 Solute exclusion technique
For the fiber saturation point (FSP) measurements, 2 g of the wet sample was dispersed
with water to obtain a 20% dispersion. Thirty-five millilitres of a 2% solution of 2 x 10⁶
Dalton dextran polymer (T2000 from Amersham Pharmacia Biotech AB, Uppsala,
Sweden) was added to the dispersion and stirred for 1 hour. After stirring most of the
solution outside the particles was removed by centrifugation, after which the solution

27
was filtered. The concentration of dextran solution was determined using a polarimeter
(Autopol IV, Rudolph, USA).

28
5. RESULTS AND DISCUSSION
5.1 Torque measurements (I, II)
5.1.1 Mixing kinetics
When a binder liquid is added to a dry material, it is gradually distributed throughout the
powder bed by the mixing process. In mixer torque rheometer (MTR) measurements
water was added as a single bolus in the beginning of the experiment, whereas in powder
rheometer (PR) measurements water was added gradually during the first 6 minutes of
mixing. In addition, in PR measurements water was added onto the top of the powder
bed, and it was first mixed to the upper part of the powder bed. When mixing was
continued, water was distributed further through the powder bed. Provided that the
powder mass is homogenous, the torque is expected to increase as the blade height
becomes lower, i.e. as the rotor approaches the bottom of the vessel. After 10 minutes of
mixing the torque increased evenly at each water content, i.e. water was equally
distributed throughout the wet powder masses (II, Figs. 1a-c).
Due to the differences in liquid addition, water distribution through the powder
bed was slightly slower in PR as compared to MTR. However, when comparing the
torque curves of Prosolv, it can be seen that the mixing kinetics was similar in both the
rheometers. At low liquid amounts (0.8-1.2 g g-1), all the torque curves were descending
after few minutes of mixing (Fig. 9a and I, Fig. 5a). At higher amounts of liquid (1.3-1.5 g
g-1), the curves turned into ascending ones (Fig. 9b and I, Fig. 5b).
Figure 9. Mixing kinetics of Prosolv in a powder rheometer.
The results are consistent with Carstensen et al. (1976), who studied the mixing
kinetics of water using a planetary mixer. They found out that in the initial stages, part of
Mixing time (min)
0 2 4 6 8 10 12 14 16
Torq
ue (m
Nm
)
0
100
200
300
400
500
1.3 g g-1
1.4 g g-1
1.5 g g-1
b)
Mixing time (min)
0 2 4 6 8 10 12 14 16
Torq
ue (m
Nm
)
0
100
200
300
400
500
0.8 g g-1
1.1 g g-1
1.2 g g-1
a)
29
the mixture is excessively wetted and forms large aggregates. The powder which is not
associated with these aggregates, remains dry. Similarly, Alleva (1984) observed an initial
force peak at the low to intermediate liquid contents, and attributed this to the uneven
distribution of the granulating liquid and the formation of large unstable agglomerates.
On the surface of the particles the system exhibits an increased resistance because of
agglomerates, and an increased autoadhesion due to the presence of excess liquid.
5.1.2 Effect of mixing time
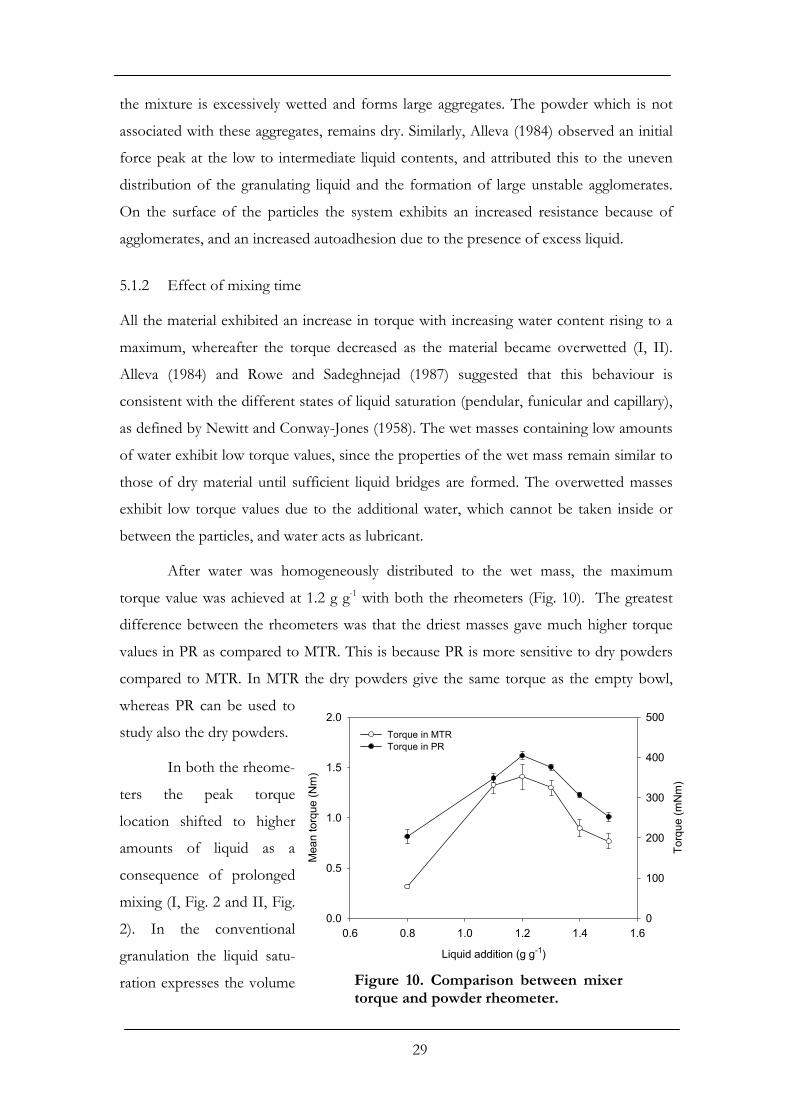
All the material exhibited an increase in torque with increasing water content rising to a
maximum, whereafter the torque decreased as the material became overwetted (I, II).
Alleva (1984) and Rowe and Sadeghnejad (1987) suggested that this behaviour is
consistent with the different states of liquid saturation (pendular, funicular and capillary),
as defined by Newitt and Conway-Jones (1958). The wet masses containing low amounts
of water exhibit low torque values, since the properties of the wet mass remain similar to
those of dry material until sufficient liquid bridges are formed. The overwetted masses
exhibit low torque values due to the additional water, which cannot be taken inside or
between the particles, and water acts as lubricant.
After water was homogeneously distributed to the wet mass, the maximum
torque value was achieved at 1.2 g g-1 with both the rheometers (Fig. 10). The greatest
difference between the rheometers was that the driest masses gave much higher torque
values in PR as compared to MTR. This is because PR is more sensitive to dry powders
compared to MTR. In MTR the dry powders give the same torque as the empty bowl,
whereas PR can be used to
study also the dry powders.
In both the rheome-
ters the peak torque
location shifted to higher
amounts of liquid as a
consequence of prolonged
mixing (I, Fig. 2 and II, Fig.
2). In the conventional
granulation the liquid satu-
ration expresses the volume
Liquid addition (g g-1)
0.6 0.8 1.0 1.2 1.4 1.6
Mea
n to
rque
(Nm
)
0.0
0.5
1.0
1.5
2.0
Torq
ue (m
Nm
)
0
100
200
300
400
500Torque in MTRTorque in PR
Figure 10. Comparison between mixertorque and powder rheometer.

30
of liquid relative to the volume of voids and pores between the particles in an
agglomerate. The transition between different states of liquid saturation is usually
induced by increasing the level of binder liquid, but an identical effect can be obtained
also by consolidating the agglomerates by further mixing (Newitt and Conway-Jones,
1958; Kristensen and Schæfer, 1987). However, the liquid saturation model has been
developed for non-porous and spherical sand particles, which do not have the same
ability as MCC/SMCC to swell and absorb large amounts of water into the internal
structure. In the case of MCC/SMCC, prolonged mixing will cause an increased
absorption of water, and consequently the liquid saturation of about 100% occurs at a
higher amount of liquid (I).
5.1.3 Effect of shear forces
The torque values of wet granules behaved differently in PR than the torque values after
liquid addition to the dry powder (II). The torque values of wet granules were also lower
than the values after liquid addition. It is possible that the different velocities used in
liquid addition and wet granules measurements caused the observed differences between
the torque values. However, it has been shown previously that MCC is able to
immobilise more water during granulation if high shear forces are used as compared to
low shear forces (Schmidt and Kleinebudde, 1999). Consequently, another explanation to
different torque values could be that more water is able to go into the internal structure
of microcrystalline cellulose during granulation in a planetary mixer than during water
addition experiments in the powder rheometer. Therefore, most of the liquid in the
system is present within the granules, not on the surface. This causes the lower
interparticular contacts and lower torque values.
In MTR experiments the values of the peak torque of wet masses were attained at
the same water contents both in the liquid addition and wet granule experiments (II).
This was not the case in powder rheometer experiments. However, it is notable that
different planetary mixers were used in these experiments. It is possible that the shear
forces applied to the wet powder mass were higher in the planetary mixer (Hobart) used
in PR studies as compared to the planetary mixer (Kenwood) used in MTR studies. It
seems that after granulation water is more strongly bound into the internal structure of
microcrystalline cellulose either because of higher shear forces or longer equilibrium time
as compared to the liquid addition studies.
31
5.1.4 Evaluation of methods
The mixing kinetics and the effect of mixing time proved to be similar with both the
rheometers. The fact that also dry powder masses can be studied in the powder
rheometer, which makes it more useful as compared to the mixer torque rheometer.
However, before the powder rheometer can be properly utilised in wet powder mass
studies, the problem of torque overload requires resolution.
5.2 Rheological properties obtained by capillary rheometry(III)
5.2.1 Flow curves
The steady state extrusion pressure increased with the increasing length to radius (L/R)
ratio of the die and also with the increasing ram speed (III). In general, the shear stresses
decreased with the increasing water content with all the cellulose grades (III, Fig. 2). The
results are consistent with the previous findings by Harrison et al. (1985) and Raines et al.
(1989). The derived flow curves showed a shear thinning behaviour , which indicates that
the materials realign or reorientate themselves or there is an appreciable water movement
so that there is less resistance to flow at higher shear rates (III). The water contents used
affected the rheological properties of cellulose grades slightly differently, which indicates
that the cellulose grades reacted with water in a different way.
5.2.2 Rheological models
The majority of mathematical models used in rheology express a non-linear relationship
between shear stress and shear rate. Parameters derived from the rheological models
have been used to determine the variations between different materials. From the
different rheological models evaluated, it was not possible to indicate, which model
described the rheological properties of each cellulose grade at each water level the best
(III, Table 1). The residuals were shear rate dependent, which revealed that the models
did not perfectly agree with the physical properties of the wet masses. An interesting
finding was that the yield stress of the Casson model showed an identical behaviour with
the Power Law viscosity constant (III, Figs. 3a-b). Since no measurements were made at
low shear rates, the existence of real yield stresses remained unclear.

32
5.2.3 Elastic properties
The elastic properties of wet masses increased with the increasing water content and
decreased with the increasing shear stresses (III, Figs. 5a-c). The SMCC grade proved to
be more elastic than the MCC grades at each moisture content. Thus, the elastic
properties of MCC and SMCC wet masses were different and changed with water
content. Consequently, it is not possible to achieve similar rheological properties between
the different grades of cellulose by altering the water content of the wet mass.
It has been suggested that there appears to be an optimal elasticity for the
formation of satisfactory spheres in the spheronisation stage (Chohan and Newton,
1996). Wet powder masses with high elasticity or low plasticity may resist the
spheronisation by restoring the original shape. Chohan and Newton (1996) and El Saleh
et al. (2000) found out that relatively inelastic materials, such as the colloidal grades of
MCC, tend not to round during the spheronisation. However, the silicification of MCC
did not affect its behaviour during pellet production (El Saleh et al., 2000). Since the
elasticity of colloidal grades were of the same magnitude as those reported for Avicel,
Emcocel and Prosolv in this study, there has to be also some other properties than
elasticity, which affect moulding of material during spheronisation.
5.2.4 Evaluation of capillary rheometry
Even though it is possible to use capillary rheometer at different speeds with a single
barrel of wet mass, the measurements are time-consuming. In addition, the equilibrium
time of the wet mass and the material of the die (hardened vs. stainless steel) affect the
results (Raines, 1990). It is also notable that capillary rheometer does not give any
information about the properties of wet granules but the rheological properties of the
material. This is because the wet granules are densified during the compression stage of
extrusion, and the possible differences in liquid saturation are diminished. In order to
compare different materials and describe the rheological properties precisely, one should
find a rheological model, which describes the material well. This was not achieved in this
study. The reason why the rheological models did not fit to the flow curves of
MCC/SMCC masses is probably the complex structure of cellulose compared to e.g.
melted polymers.

33
5.3 Near infrared spectroscopy (IV)
5.3.1 Absorbance spectra
The NIR spectra of dry
cellulose and lactose showed
similar features, since carbo-
hydrates mainly include CH
and OH bonds (Fig. 11). The
major absorption band of
water in the NIR region is at
around 1940 nm (Curcio and
Petty, 1951; Osborne et al.,
1993). The water of SMCC
was seen as a wide band,
whereas the hydrate water of
lactose was seen as a narrow
water band. The shape of the
water band depends on the
changes in the frequencies
due to hydrogen bonding
occurring within the environ-
ment where the water is
located (Osborne et al.,
1993). The broad band for
adsorbed water of SMCC
indicates a spread of energies
of interaction, whereas the
mono-hydrate water band is
typical to a more uniform
interaction. The absorbance
spectrum of the 1:1 mixture
was a combination of the
SMCC and lactose spectra.
1000 1200 1400 1600 1800 2000 2200 2400-0.05
0
0.05
0.1
0.15
0.2
0.25
0.3
0.35
0.4
Wavelength (nm)
Abso
rban
ce, l
og10
(1/R
)
SMCC Lactose 1:1 mixture Glass ballotini
a)
1350 1375 1400 1425 1450 1475 1500
-1.5
-1
-0.5
0
0.5
1
x 10-3
Wavelength (nm)
2nd
deriv
ative
of l
og10
(1/R
)
SMCC Lactose 1:1 mixture Glass ballotini
Monohydrate
b)
1825 1850 1875 1900 1925 1950 1975 2000
-8
-6
-4
-2
0
2
4x 10⁻³
Wavelength (nm)
2nd
deriv
ative
of l
og10
(1/R
)
SMCC Lactose 1:1 mixture Glass ballotini
Monohydrate
c)
Figure 11. a) NIR absorbance spectra, b)Second derivative spectra of the overtonewater band and c) Second derivative spectra ofthe combination water band of dry materials.

34
Glass ballotini showed no absorbance, since it is an inorganic material.
The water bands at 1450 and 1930 nm were increased with the increasing
moisture content for all materials (IV, Figs. 2a-d). Since the physical changes in the
samples affect the NIR spectrum, an upward displacement of the absorbance spectra
baseline was observed with an increasing moisture content as well. When particle size
increases, the radiation will penetrate deeper into the sample and a decrease in the back
reflected light is seen as an increase in the apparent absorbance (log(1/R)). Similarly, the
presence of water affects the overall spectrum, since the scattering depends on the ratio
of the refractive index of the particles, as compared that of the surrounding medium
(Osborne et al., 1993). This means that the NIR spectroscopy is a surface method, i.e.
NIR probe analyses the amount and the state of water on the surface of the particles.
Due to the porous structure of cellulose, SMCC is capable of absorbing large
amounts of water into the internal structure. The water in the cellulose samples has been
attributed to the bulk water between fibers and to the water in pores within the fiber (Li
et al., 1992). In addition to the water in the pores and at the surfaces, water is also
absorbed into the amorphous parts of cellulose. In the case of non-porous material, such
as glass ballotini, water can only be adsorbed onto the surface of particles. Due to the
different refractive properties of the wet masses, the upward displacement of the
absorbance spectra baseline was the greatest with glass ballotini and α-lactose
monohydrate, even though the moisture contents were much lower as compared to
SMCC (IV, Figs. 2b, 2d). The baseline corrected heights of the water bands (moisture
curves) at 1933 nm for all the four materials are shown in Fig. 12. The moisture curves of
glass ballotini and α-lactose
monohydrate rose up very fast
and almost linearly. As SMCC is
capable of holding large
amounts of water in the internal
structure, the same amount of
moisture resulted in higher water
bands with other materials at
moisture levels from 0.1 ml g-1
and up.0 0.2 0.4 0.6 0.8 1 1.2 1.4 1.6
0
0.1
0.2
0.3
0.4
0.5
0.6
0.7
0.8
0.9
1
Moisture content (ml g-1)
Bas
elin
e co
rrect
ed a
bsor
banc
e
SMCC 1:1 mixture Lactose Glass ballotini
Figure 12. Effect of moisture content on theheight of the baseline corrected water bands at1933 nm.

35
5.3.2 Second derivative spectra
A common method of correcting the baseline of the spectra is to use the second
derivative. The minimum in the second derivative spectra is related to the maximum in
the absorbance spectra. The tightly bound water of SMCC was seen at 1425 and 1920
nm, whereas the hydrate water of α-lactose was seen at higher wavelengths (1450 and
1933 nm) (Fig. 11). The absorption maximum of water band is dependent on the
hydrogen bonding environment of the water (Osborne et al., 1993). Since the hydrate
water includes more hydrogen bonds than the water of cellulose, it is shown at higher
wavelengths. The second derivative spectra of the 1:1 mixture were capable of separating
the tightly bound and monohydrate water bands, which overlapped in the absorbance
spectrum (Fig. 11). The sharp monohydrate bands of the 1:1 mixture were seen at the
same wavelengths (1450 and 1933 nm) as with the lactose.
With increasing mois-
ture content the water bands of
SMCC increased in size and
shifted gradually from 1920 nm
to 1903 nm (IV, Fig. 6a). The
shift of the second derivative
band maximum is shown also
in Figure 13. This shift to
lower wavelengths indicates an
increase in the median inter-
action energy of the water -OH
bond, since non-hydrogen-
bonded -OH groups have higher stretch frequencies and, hence, a lower wavelength than
the hydrogen-bonded -OH groups. The second derivative spectra of α-lactose
monohydrate were capable of distinguishing the hydrate water from added water (IV,
Fig. 6b). Added water resulted in a separate band at a lower wavelength (1903 nm) in
comparison with the structured monohydrate band at 1933 nm. The water band of the
1:1 mixture was seen at a slightly lower wavelength (1910 nm) than that of pure SMCC
(1920 nm) and, consequently, a smaller shift from 1910 nm to 1903 nm was observed
(IV, Fig. 6c). This is due to the closeness of the monohydrate and cellulose water bands.
The sharp monohydrate band at 1933 nm remained unchanged after water addition. In
Figure 13. The location of maximumsecond derivative band height.
0 0.2 0.4 0.6 0.8 1 1.2 1.4 1.6-7
-6
-5
-4
-3
-2
-1
0
1 x 10⁻³
Moisture content (g g-1)
2nd
deriv
ative
ban
d he
ight
1920 nm1910 nm1900 nm
36
the case of glass ballotini, the water bands were seen directly at 1903 nm (IV, Fig. 6d).
The intensity of the water bands increased with the increasing water content, while no
shift in the wavelength could be observed.
5.3.3 Evaluation of NIR spectroscopy
The second derivative spectra should be very useful in detecting pseudopolymorphic
changes, since it is capable of distinguishing the hydrate water from the other energetic
states of water (IV). In fact, NIR spectroscopy has been used to study the
pseudopolymorphic transformations of lactose and theophylline (Buckton et al., 1999;
Räsänen et al., 2001). Rantanen et al. (2000b) observed that the water band of
theophylline increased non-linearly due to the pseudopolymorphic changes during the
granulation. Comparison of the ratio of the second derivative spectra at two wavelengths
enables the detection of low levels of one polymorphic form in the presence of another
(Luner et al., 2000; Seyer et al., 2000).
The upward displacement of baseline and the relative height of water bands were
the greatest with materials that had a poor liquid retention capacity (IV). Consequently,
the energetic state of water in the wet mass depends on the physical and chemical
properties of the material. This enables the study of the liquid retention capacity of
different materials using NIR. The results agree with Watano et al. (1996) and Miwa et al.
(2000). The authors used NIR and water absorbing potential of materials to predict the
suitable amount of water for wet granulation. However, these results were in contrast to
the results obtained from fluidised bed granulation process (Rantanen et al., 2001). Due
to the low shear forces during the fluid bed granulation, less water is able to penetrate
into the internal structure of microcrystalline cellulose as compared to granulation in
planetary mixers. Thus, when evaluating solid-water interactions with NIR, the effect of
shear forces on the state of water should be considered.
5.4 Thermoporosimetry (V)
5.4.1 Different water fractions in SMCC wet masses
At low moisture contents (0.05-0.2 g g-1) all the water was bound on the surface of
cellulose, i.e. water was nonfreezing (Fig. 14). The amount of nonfreezing water
increased with the increasing moisture content up to 0.26 g g-1. The results are consistent
with the amounts of nonfreezing water found for starches and pulp samples (Mousseri et

37
al., 1974; Nelson, 1977; Hatakeyama et al., 1983). There is still not a well-accepted
thermodynamic theory to explain why some of the water in the hydrated systems does
not freeze. However, it has been shown that there is a correlation between the number
and type of available hydration sites and the quantity of nonfreezing water (Nakamura et
al., 1981; Berthold, 1996). Nonfreezing water is often divided to the tightly bound
monolayer water and to the intermediately bound multilayer water, which corresponds to
about three water layers next to the surface (Zografi and Kontny, 1986; Li, 1991;
Delwiche et al., 1991).
The sum of nonfreezing water (NFW) and freezing bound water (FBW) is
referred to as the total bound water (TBW), which shows the amount of water in the
pore range of 1-216 nm (Fig. 14). The amount of TBW increased with the increasing
moisture content and reached a plateau at 1.1 g g-1. Free water, which cannot be detected
by DSC alone, is located in larger pores (> 216 nm). It is probable that the pores of the
wettest granules are larger than
216 nm and they cannot be
separated from the free water with
thermoporosimetry. Fiber satura-
tion point (FSP) measures the
total amount of water inside the
cellulose particles, i.e. swelling of
the particles. When the moisture
content of the sample exceeds the
FSP, the additional water is
retained between the particles as
bulk water.
5.4.2 Effect of granulation
Granulation had no effect on the amount of nonfreezing water, since it was the
same for the ungranulated and granulated wet masses (V, Table 2). With the
ungranulated wet masses the amounts of NFW and FBW were almost equal, and only a
very small amount of water was in the larger pores as free water. The FSP values of
ungranulated wet masses were between 0.41 and 0.46 g g-1 and, hence, most of the added
water was as bulk water outside of the particles. With the granulated wet masses the
amount of FBW was twice as much as the amount of NFW and free water. In general,
Moisture content (g g-1)
0.0 0.2 0.4 0.6 0.8 1.0 1.2 1.4 1.6 1.8
Pore
wat
er (g
g-1
)
0.0
0.2
0.4
0.6
0.8
1.0
1.2
1.4
NFW
TBW
Nonfreezing water
Freezing bound water
Free water
Bulk water
FSP
Figure 14. Different water fractions ofSMCC wet granules.

38
the granulated wet masses contained no bulk water, since the FSP values of wet granules
were very close to the moisture content of wet granules. Consequently, all of the water
was inside the particles. Most of the water was in the small pores (TBW) and smaller part
in the larger pores (free water). The differences between water fractions of ungranulated
and granulated wet masses were also statistically significant (V, Table 3).
Granulation seemed to have the same effect on the microcrystalline cellulose as
beating has on cellulose fibers in the papermaking process. Beating is known to cut the
cellulose fibers and cause the morphological changes. The primary effect of beating on
the cellulose is to open larger pores in the cell wall, and hence increase the swelling of the
pulp fibers (Stone et al., 1968). Consequently, the lamellar structure of fibrils inside the
cellulose fibers is loosened which increases the water penetration into the cell (Emerton,
1980; Li, 1991). It is expected that the granulation process works in the same way; bonds
between microfibrils are loosened and the particles swell.
As Froix and Nelson (1975) stated, the amount of water contained in a cellulose
system is a direct function of the microstructure of that system. Thus one should not
expect to obtain identical results with the different samples without normalisation of
water accessibility into the structure. Mixing time and shear forces applied to the wet
mass during granulation affects the location of water in the MCC/SMCC wet mass, i.e.
the water fraction inside/outside the particles. This means that one should not compare
samples without taking account whether the wet mass is granulated or not, and which
granulation method has been used.
5.4.3 Evaluation of thermoporosimetry
The pore structure of dry microcrystalline cellulose powder has been traditionally
determined either by using nitrogen adsorption or mercury porosimetry where the
sample is evacuated before the measurements (Nakai et al., 1977; Hollenbeck et al., 1978;
Zografi et al., 1984). The pore size range obtained by thermoporosimetry (1-216 nm) is
quite close to that obtained by nitrogen adsorption (0.3-300 nm). When the pore size
distribution of dry cellulose samples were measured by nitrogen adsorption, almost all of
the pores were under 100 nm (I). The result is consistent with Westermarck et al. (1999).
However, when the pore size distribution of wet cellulose samples was measured by
thermoporosimetry, the pore size of the samples increased with the increasing water
content. In general, there were more water in the pore range of 100-216 nm as compared
to smaller pores.

39
In the interaction with water the cellulose particles swell generating new pores,
but during drying most of the pores collapse. Consequently, in order to measure the
pores of wet MCC, the pore structure should be measured with the techniques directly
applicable to the water saturated particles. In this study the pore size distribution of wet
MCC/SMCC powder masses was measured using thermoporosimetry. In addition,
thermoporosimetry was able to differentiate the freezing bound water from the free/bulk
water, which normally overlap in the melting endotherms. Both the step melting
procedure and the TBW method proved to be suitable for that purpose.
Freezing the sample is an essential part of the thermoporosimetry. However,
crystallisation of water within the cell wall may affect the structure of the sample and,
hence, the measured pore size distribution. In fact, Maloney et al. (1998) noted
considerable hysteresis if the freezing/melting cycle was repeated several times. With the
above methods hysteresis can be minimised since the sample is frozen and melted only
twice. While thermoporosimetry has been shown to be in good agreement with the other
pore measurement techniques for porous glasses, this has not been shown for the pulp
fibers (Maloney, 1999). Thus it is likely that the relationship between the pore size and
the melting temperature in the pulp fibers is more complicated than described by the
Gibbs-Thomson equation (Maloney et al., 1998). An other disadvantage of the method is
that the pore range, which can be measured is fairly narrow (1-216 nm). In addition, the
sample sizes used are so small that it is quite difficult to get a representative sample from
the wet powder mass. However, even though it may be difficult to ascertain the actual
size of the pores of MCC/SMCC wet masses with thermoporosimetry, the method can
be used to measure the different water fractions in wet powder masses and to make
relative comparisons between the different samples.
5.5 The difference between cellulose grades
5.5.1 SMCC vs. MCC grades
The mean diameter of all cellulose particles varied from 58.6 to 59.7 µm, and there were
no significant differences between the particle size distributions of cellulose grades either
(I). The SEM figures showed that also the shape of the particles was similar between the
different grades (not shown).
The specific surface area of the SMCC grade was around five times greater than
those of the MCC grades (I). The result was associated with the large specific surface area

40
of colloidal silicon dioxide. In addition, the SMCC grade showed better flowability and
greater bulk and tapped densities than the MCC grades. The differences in the densities
are probably caused by the improved flowing and packing characteristics of the SMCC
grade.
The relative increase in swelling was greater for Prosolv as compared to Avicel
and Emcocel (I). The same phenomenon could be seen also in the contact angle
measurements. Prosolv tablets swelled very fast and the measurement had to be ended
much before those of the MCC grades. In addition, the contact angle of Prosolv was
significantly lower than those of Avicel and Emcocel (Fig. 15). During swelling the
cellulose particles absorb water into the internal structure, which means that there is less
water between the cellulose particles. This caused lower liquid saturation and,
consequently, lower torque values in the MTR experiments (I) and higher shear stresses
in the capillary rheometer (III) at the lowest moisture content studied (0.8 ml g-1).
Water is essential in the
paper making process, since the
cellulose fibers do not form
hydrogen bonds to the
neighbouring cellulose fibers
without water. During drying
cellulose-water hydrogen bonds
between fibers are replaced by
cellulose-cellulose hydrogen
bonds, which give paper its
strength. Some of these hydrogen
bonds might not open again when
cellulose is reintroduced to water. The phenomenon is called hornification in the pulp
and paper literature according to which term quasi-hornification has been used in
pharmacy (Staniforth and Chatrath, 1996). Even though the greater swelling of Prosolv
had quite small influence at higher water contents, it might have practical meaning in the
traditional granulations, which are performed at around the lowest moisture content used
in this study (0.8 ml g-1)(I-II). If Prosolv is able to absorb more water into the internal
structure, there is less water between the cellulose particles, which might reduce the
hydrogen bond formation between the cellulose particles. In fact, SMCC has been
claimed to be more resistant to the wet granulation than the conventional MCC grades,
Figure 15. Contact angles of differentcellulose grades as a function of time.
Time (s)
0.0 0.2 0.4 0.6 0.8 1.0
Con
tact
ang
le (°
)
0
5
10
15
20
25
30
35
Avicel PH 101Emcocel 50Prosolv 50

41
since SMCC maintains compaction properties after wetting and drying (Sherwood and
Becker, 1998). In addition, Sherwood and Becker (1998) and Habib et al. (1999) found
out that the decrease in the granule porosity was more pronounced for the MCC grades
as compared to the SMCC grade. Habib et al. (1999) observed that the decrease in
granule porosity was more pronounced for both the materials after 0.8 g g-1. The authors
attributed the effect of high water levels to the greater intragranular interaction between
the neighbouring MCC/SMCC particles. Consequently, the results are consistent with
the swelling results obtained in this study.
Li et al. (2000) suggested that the physical reason for the difference between the
MCC and SMCC wet masses may be caused by the presence of silicate particles that
strengthen the interparticulate interactions. However, more probable reason for the
differences seen in their study is the greater swelling of SMCC grade, since the moisture
level used was close to our lowest moisture content (1.0 g g-1). Strong interparticulate
interactions has been suggested to cause also the stronger tensile strength of SMCC
tablets in the direct compression (Edge et al., 2000). The mechanism behind this
behaviour is still unknown, but it is presumable caused by the large specific surface area
of SMCC, which increases the contact points between the particles.
The different surface properties of dry SMCC as compared to MCC grades are
well documented, i.e. the better flowability and the large specific surface area. According
to the results obtained in this study the surface properties of the SMCC grade are
different also in the wet stage. With the powder rheometer the water addition
experiments could be done only with Prosolv, because an overload occurred with Avicel
and Emcocel at those water contents, which caused the highest measurable torque values
to be exceeded (II). In the capillary rheometer studies the SMCC grade proved to be
more elastic than the MCC grades at each moisture content (III). Consequently, it seems
that the wet SMCC flows better as compared to the MCC grades.
Although the silicification process affected the swelling properties, and
furthermore, the mixing kinetics of microcrystalline cellulose, the source of the
microcrystalline cellulose had a stronger influence than silicification on the liquid
requirement at the peak torque (I). The silicification does not induce gross changes in the
shape or texture of the microcrystalline cellulose particles (Tobyn et al., 1998) and,
consequently, the large specific surface area had no influence on the liquid requirement
during the torque experiments. The results are consistent with Zografi (1988) who stated

42
that in case the material is capable of absorbing water into the solid structure, water
uptake is independent of the specific surface area.
5.5.2 MCC grades
The properties of the MCC grades were almost identical when the dry powders were
studied. The particle size and size distribution, density, flowability and specific surface
area of Avicel and Emcocel were similar (I). In addition, the relative increase in swelling
and the contact angles were alike.
Emcocel wet masses exhibited higher torque values at a lower water content than
Avicel masses (I, II). This indicated that Emcocel masses achieved the liquid saturation
of about 100% at a lower liquid amount than Avicel masses. This means that Emcocel
masses were not able to hold as much water in the internal structure as Avicel. When the
different water fractions were measured using thermoporosimetry, it was noticed that the
amount of freezing bound water (FBW) was slightly lower with Emcocel as compared to
Avicel and Prosolv. Thermoporosimetry is able to measure only the relatively small pores
(1-216 nm), which means that the FBW is located in this pore range. The smaller amount
of FBW indicates that Emcocel has less small pores, and thus a greater amount of larger
pores as compared to Avicel and Prosolv. Thus, the different pore structure of wet
cellulose masses might be one explanation for the differences seen in the torque
measurements.
Consequently, the difference between the MCC grades was seen only when wet
massing was included to the characterisation, which indicates that their interaction with
water is different. The results agree with those obtained by Raines (1990) and Newton et
al. (1992). Raines (1990) observed that the various grades of MCC have different
rheological properties when mixed with water and lactose. Newton et al. (1992) showed
that in the formulation of spherical particles by extrusion-spheronisation it is not possible
to interchange the brands of MCC without changing the water content. Thus grades,
which are considered equivalent, do not function always in an equivalent manner.
Several authors have studied the differences between the regular microcrystalline
cellulose grades, Avicel PH 101 and Emcocel (Staniforth et al., 1988; Raines, 1990;
Newton et al., 1992; Landín et al., 1993a,b; Kleinebudde, 1997). Major causes of the
intermanufacturer variability among microcrystalline celluloses have been associated to
the variability of the source of pulp and of the manufacturing process (Landín et al.,

43
1993a,b). Wu et al. (2001) studied the effects of the manufacturing factors on the
properties and functionality’s of the MCC products. They observed that the most
important factor in the manufacturing was the temperature, whereas the molecular mass
and particle morphology had the greatest effect on the material properties.
It is notable that only one batch of each cellulose grade was investigated in this
study. Consequently, one should not make general conclusions about the properties of
different cellulose grades, but rather notice that there exist some differences between the
cellulose grades and probably between the different batches. The material can be
different also in the different stages of the manufacturing process.
5.6 Comparison of different methods
5.6.1 Capillary rheometry vs. MTR
Some authors have reported that the data generated by the MTR compare favourably
with those measured by the capillary rheometry (Landín et al., 1995; Rowe, 1995; Rowe,
1996). Rowe (1995) observed that with the increasing water content both the yield stress
and kinematic viscosity constant increased. However, in the capillary rheometer studies
the viscosity constant (k) decreases when the water content is increased. Consequently,
their results were in contrast to the results obtained in this (III) and the other studies by
the capillary rheometer (Raines et al., 1989; Harrison et al., 1985; Fielden et al., 1992). In
the MTR experiments material exhibits an increase in the torque with the increasing
cohesiveness/tensile strength of the wet mass. When material becomes overwetted, only
the surface tension holds the wet mass together. Consequently, the cohesiveness and the
torque values decrease. This indicates that the MTR is able to measure only the liquid
saturation of the wet mass, not the classical rheological parameters, such as yield stress or
viscosity constants (III). The source of this difference is presumably to be found in the
different measuring systems included. In the case of the capillary rheometer, the resistant
to movement involves two components; the convergent flow from the wide barrel to the
narrow capillary and the flow through the capillary. In the capillary rheometer the air is
expelled during the compression stage, and the possible differences in the liquid
saturation are diminished. Thus, the material is in a very different state in these two
systems and one would not expect an identical behaviour.
MTR has been traditionally used in the wet granulation studies, whereas the
information obtained by the capillary rheometer has been related to the extrusion.

44
However, correlation of the rheological parameters to the extrusion properties is
difficult. It is particularly difficult if some other than ram extruder is used in the
production of pellets. If the shear forces and the principal of action between extruders
are different, for example radial screen vs. ram extruder, the capillary rheometer does not
necessarily give information about the extrusion properties of the material. Since the
possible differences in the pore structure of wet cellulose masses are diminished during
the compression stage of extrusion, the different grades of cellulose cannot be
differentiated as clearly as e.g. with the torque measurements. In fact, in the case of the
radial screen extruder, the peak torque in MTR measurements can be used to predict the
optimum water content for extrusion-spheronisation (Luukkonen et al., 1999).
5.6.2 NIR vs. MTR
In the case of non-porous material, such as glass ballotini, water can only be adsorbed
onto the surface of particles. With these materials the peak torque values were attained at
very low water contents (0.03-0.14 ml g-1). When half of the α-lactose monohydrate mass
was replaced with SMCC, the torque values were considerably higher and the peak torque
values were achieved at higher water contents (0.60-0.65 ml g-1). The peak torque values
of SMCC were attained at the highest water contents (1.1-1.3 ml g-1), which shows that
the water content required to achieve the capillary state is strongly related to the amount
of SMCC in the wet powder mass. The results can be explained by the porous and partly
amorphous structure of SMCC as compared to the other materials. If water is adsorb
only onto the surface of the particles, the voids between the particles are filled very fast.
After this water acts as a lubricant and the cohesiveness between the particles decrease
and, thus, the torque values decrease.
In the NIR spectroscopy the upward displacement of the baseline and the
relative height of the water bands were greatest with the materials that had a poor liquid
retention capacity. With increasing moisture content changes in the physical properties of
the samples resulted in an apparent increase in log (1/R) throughout the whole NIR
spectrum. The plateau stage of baseline corrected water band heights could be correlated
to the maximum cohesiveness of the wet mass in MTR measurements (IV).
Even though NIR spectroscopy and MTR are dissimilar methods, the results
obtained by these methods do show some similarity (IV). It has been shown previously
that the ability of MCC to hold water in the internal structure depends on the shear
forces applied to the wet mass (Baert et al., 1992). This could partly explain the observed

45
differences between these two methods, since unlike MTR, NIR measurements do not
involve mixing of the wet mass. The results suggest that NIR spectroscopy could be used
for the end-point detection in the real time process measurements.
5.6.3 Thermoporosimetry vs. NIR
At low moisture contents (0.05-0.15 g g-1) all the water was nonfreezing (Fig. 14) and the
maximum second derivative band was at 1920 nm (Fig. 13). At moisture contents from
0.2 to 0.5 g g-1 part of the water was freezing bound water and the second derivative
maximum in NIR spectrum was at 1910 nm. Since non-hydrogen-bonded -OH groups
are obtained at lower wavelengths than hydrogen-bonded -OH groups, water was not
that tightly bound to the cellulose as compared to the lowest moisture contents. When
more water was added to the wet mass, the amount of freezing bound water increased
and the second derivative maximum shifted to even lower wavelength (1900 nm). At
high moisture contents (1.0-1.4 g g-1) the freezing bound water and the second derivative
maximum (1900 nm) achieved a steady state. It is notable that even though the maximum
band height shifted to lower wavelengths, the heights of 1920 and 1910 nm water bands
increased up to 0.8 g g-1 and to 1.0 g g-1, respectively.
These two methods can be evaluated also by comparing the baseline corrected
absorbance band heights of NIR spectroscopy to the amount of freezing bound water
(Fig. 16). Both the band height in the NIR experiments and the amount of TBW in
thermoporosimetry measurements increased with the increasing moisture content up to
1.0 g g-1 after which they achieved quite similar plateau level. These results indicate that
the changes in the state of
water in SMCC wet masses
can be seen in a similar
manner with both the
methods.
The plateau stage of
SMCC water band heights
observed in the NIR
measurements was corre-
lated to the maximum
cohesiveness of the wet
Moisture content (g g-1)
0.0 0.2 0.4 0.6 0.8 1.0 1.2 1.4 1.6 1.8
Base
line
corre
cted
abs
orba
nce
0.0
0.2
0.4
0.6
0.8
1.0
Pore
wat
er (g
g-1
)
0.0
0.2
0.4
0.6
0.8
1.0
Total bound water (TBW)Height of water band in NIR
Figure 16. Comparison of NIRspectroscopy and thermoporosimetry.

46
mass in the MTR measurements (IV). The maximum torque values have been previously
connected to the maximum cohesiveness of the wet mass (Leuenberger et al., 1979), to
the capillary state of the liquid saturation (Alleva, 1984; Rowe and Sadeghnejad, 1987)
and to the optimum water content in extrusion-spheronisation (Miyake et al., 1973;
Souto et al., 1998; Luukkonen et al., 1999).
5.6.4 Applicability of methods
Torque measurements and NIR spectroscopy are suitable for all the materials and, above
all, they would be suitable also for the monitoring of real time processes. Since NIR
spectroscopy is able to detect both the physical and chemical information from the
sample, it is a more tempting choice for the process control. The torque measurements
are fast to perform and, consequently, they would be suitable for the product
development. The torque measurements are also able to predict the water amount
needed for extrusion-spheronisation, at least for the radial screen extruder. The capillary
rheometry can be used for studying the rheological properties of material and for
screening of materials suitable for extrusion-spheronisation. However, the method is
slow and the correlation of the rheological parameters to the extrusion properties is
difficult. Thermoporosimetry combined with the solute exclusion technique is able to
explain why the wet masses behave differently in the torque measurements. Both
thermoporosimetry and solute exclusion technique demand sample collection and are too
slow for the process control, but the methods can be used for the characterisation of new
materials. Disadvantage of thermoporosimetry and solute exclusion technique is that they
are not suitable for the water-soluble materials. Consequently, the methods used in this
study support each other and together they give extensive information about the
properties and behaviour of the wet cellulose masses.

47
6. CONCLUSIONS
SMCC grade exhibited improved flowability and increased specific surface area as
compared to the MCC grades. The differences between the MCC grades were seen only
when wet massing was included to the characterisation. Although the silicification
process affected the swelling properties, and furthermore, the mixing kinetics of
microcrystalline cellulose, the source of the microcrystalline cellulose had a stronger
influence than silicification on the liquid requirement at the peak torque.
The mixing kinetics and the effect of mixing time proved to be similar with the
mixer torque and powder rheometer. The fact that also the dry powders can be studied in
the powder rheometer makes it more useful as compared to the mixer torque rheometer.
However, before the powder rheometer can be properly utilised in the wet powder mass
studies, the problem of torque overload requires resolution.
The rheological properties of MCC and SMCC wet masses obtained by capillary
rheometer were different and changed with the water content. The SMCC grade proved
to be more elastic than the MCC grades at each moisture content. Correlation of the
rheological parameters to the extrusion properties was difficult. The possible differences
in the liquid saturation were diminished during extrusion. Thus, the different grades of
cellulose could not be differentiated as clearly as with the torque measurements.
The energetic state of water in the wet mass depended on the physical and
chemical properties of the material, which enabled the study of the liquid retention
capacity of different materials using near infrared spectroscopy. The second derivative
spectrum was capable of distinguishing the hydrate water from the other energetic states
of water. The plateau stage of baseline corrected water band heights could be correlated
to the maximum cohesiveness of the wet mass in the MTR measurements. The results
suggest that the NIR spectroscopy could be used for the end-point detection in the real
time processes.
Thermoporosimetry was able to differentiate the freezing bound water from the
free/bulk water, which normally overlap in the melting endotherms and, consequently,
four distinct fractions of water could be detected in the MCC/SMCC wet masses. Both
the step melting procedure and the total bound water (TBW) method proved to be
suitable for that purpose. The pore volume results were consistent with the NIR
spectroscopy results, which indicates that the changes in the state of water in the
cellulose wet masses can be seen in a similar manner with both the methods.

48
REFERENCES
Alleva, D.S., 1984. The wet granulation process: Kinetics and mechanisms of granule formation.Doctoral Thesis, Philadelphia College of Pharmacy & Science, USA.
Antti, H., 1999. Multivariate characterization of wood related materials. Doctoral Thesis,University of Umeå, Sweden.
Baert, L., Fanara, D., de Baets, P. and Remon, J.P., 1991. Instrumentation of a gravityfeed extruder and the influence of the composition of binary and ternary mixtures on theextrusion forces. J.Pharm.Pharmacol. 43 745-749.
Baert, L., Remon, J.P., Knight, P. and Newton, J.M., 1992. A comparison between theextrusion forces and sphere quality of a gravity feed extruder and a ram extruder.Int.J.Pharm. 86 187-192.
Bagley, E.B., 1957. End corrections in the capillary flow of polyethylene. J.Appl.Phys. 28624-627.
Barlow, C.G., 1968. Granulation of powders. Chem.Eng.(Lond.) 220 CE196-201.
Barrett, E.P., Joyner, L.G. and Halenda, P.P., 1951. The determination of pore volumeand area distributions in porous substances. I. Computations from nitrogen isotherms.J.Amer.Chem.Soc. 73 373-380.
Benbow, J.J. and Bridgwater, J., 1993. Paste Flow and Extrusion. Clarendon Press, Oxford,153 pp.
Benbow, J.J., Oxley, E. and Bridgwater, J., 1987. The extrusion mechanics of pastes – theinfluence of paste formulation on extrusion parameters. Chem.Eng.Sci. 42 2151-2162.
Berthold, J., 1996. Water adsorption and uptake in the fibre cell wall as affected by polar groups andstructure. Doctoral Thesis, Royal Institute of Technology, Stockholm, Sweden.
Berthold, J., Olsson, R. and Salmen, L., 1998. Water sorption on hydroxyl and carboxylicacid groups in carboxymethyl cellulose (CMC) studied with NIR-spectroscopy. Cellulose 5281-298.
Bier, H.P., Leuenberger, H. and Sucker, H., 1979. Determination of the uncriticalquantity of granulating liquid by power measurements on planetary mixers. Pharm.Ind. 41375-380.
Blair, T., Buckton, G., Beezer, A. and Bloomfield, S., 1990. The interaction of varioustypes of microcrystalline cellulose and starch with water. Int.J.Pharm. 63 251-257.
Boutell, S.L., 1995. Factors influencing the preparation of spherical granules byextrusion/spheronisation. Doctoral Thesis, University of London, UK.
Buckton, G., Yonemochi, E., Hammond, J. and Moffat, A., 1998. The use of near infra-red spectroscopy to detect changes in the form of amorphous and crystalline lactose.Int.J.Pharm. 168 231-241.
49
Buckton, G., Yonemochi, E., Yoon, W.L. and Moffat, A.C., 1999. Water sorption andnear IR spectroscopy to study the differences between microcrystalline cellulose andsilicified microcrystalline cellulose before and after wet granulation. Int.J.Pharm. 181 41-47.
Bugay, D. and Williams, A., 1995. Vibrational spectroscopy. In Physical characterization ofpharmaceutical solids. Brittain, H. (Ed.), Marcel Dekker Inc., New York, pp. 59-91.
Byrn, S., Pfeiffer, R. and Stowell, J., 1999. Solid-state chemistry of drugs. 2nd Ed., SSCI Inc.,USA, 576 pp.
Capes, C.E., 1980. Particle size enlargement. In: Handbook of Powder Technology, Vol 1,Williams, J.C. and Allen, T. (Eds.), Elsevier, Amsterdam, pp. 23-31.
Carstensen, J.T., Lai, T., Flickner, D., Huber, H.E. and Zoglio, M.A., 1976. Physicalaspects of wet granulations I: Distribution kinetics of water. J.Pharm.Sci. 65 992-997.
Chatlapalli, R. and Rohera, B.D., 1998. Rheological characterization of diltiazemHCl/cellulose wet masses using a mixer torque rheometer. Int.J.Pharm. 175 47-59.
Chatrath, M., 1992. The effect of wet granulation on the physico-mechanical properties ofmicrocrystalline cellulose. Doctoral Thesis, University of Bath, UK.
Chen, Z., Ikeda, K., Murakami, T. and Takeda, T., 2000. Drainage phenomenon ofpastes during extrusion. J.Mat.Sci. 35 2517-2523.
Chohan, R.K. and Newton, J.M., 1996. Analysis of extrusion of some wet powder massesused in extrusion/spheronisation. Int.J.Pharm. 131 201-207.
Choppin, G. and Downey, J., 1972. Near infrared studies of the structure of water. IV.Water in relatively nonpolar solvents. J.Chem.Phys. 56 5899-5904.
Curcio, J.A. and Petty, C.C., 1951. The near infrared absorption spectrum of liquid water,J.Optic. Soc.Am. 41 302-304.
Delalonde, M., Bataille, B., Baylac, G, Maurice, J. and Sabatier, R., 1997. Definition ofindices for the mechanical design of wet powders – application to the study of a naturalpolymer, microcrystalline cellulose. Int.J.Pharm. 146 159-165.
Delalonde, M., Bataille, B., Baylac, G. and Jacob, M., 2000. Rheological study of wetpowder masses: application to a pharmaceutical grade of microcrystalline cellulose.S.T.P.Pharma Sciences. 10 205-209.
Delwiche, S., Pitt, R. and Norris, K., 1991. Examination of starch-water and cellulose-water interactions with near infrared (NIR) diffuse reflectance spectroscopy.Starch/Stärke 43 422-427.
Dyke, T., Mack, K. and Muenter, J.S., 1977. The structure of water dimer from molecularbeam electric resonance spectroscopy. J.Chem.Phys. 66 498-510.
Edge, S., Potter, U., Steele, F., Tobyn, M., Chen, A. and Staniforth, J., 1999. The locationof silicon dioxide in silicified microcrystalline cellulose. Pharm.Pharmacol.Commun. 5 371-376.

50
Edge, S., Steele, F., Chen, A., Tobyn, M. and Staniforth, J., 2000. The mechanicalproperties of compacts of microcrystalline cellulose and silicified microcrystallinecellulose. Int.J.Pharm. 200 67-72.
Ek, R. and Newton, J.M., 1998. Microcrystalline cellulose as a sponge as an alternativeconcept to the crystallite-gel model for extrusion and spheronization. Pharm.Res. 15 509-510.
Ek, R., 1995. Characterisation of powder cellulose, microcrystalline cellulose and porous cellulose beads.Doctoral Thesis, University of Uppsala, Sweden.
El Saleh, F., Jumaa, M., Hassan, I. and Kleinebudde, P., 2000. Influence of cellulose typeon the properties of extruded pellets. II. Production and properties of pellets. S.T.P.Pharma Sciences 10 379-385.
Emerton, H.W., 1980. The preparation of pulp fibers for papermaking. In Handbook ofPaper Science, Vol 1, The Raw Materials and Processing of Papermaking, Rance, H.F.(Ed.), Elsevier Scientific Publishing Company, The Netherlands, pp. 139-164.
Faure, A., Grimsey, I., Rowe, R., York, P. and Cliff, M., 1999. Process control in a highshear mixer-granulator using wet mass consistency: The effect of formulation variables.J.Pharm.Sci. 88 191-195.
Fielden, K.E. and Newton, J.M., 1992. Extrusion and Extruders. In: Encyclopedia ofPharmaceutical Technology. Swarbrick J. and Boylan J.C., (Eds.), Vol. 5, Marcel Dekker, Inc.,New York, 395-442.
Fielden, K.E., Newton, J.M. and Rowe, R.C., 1992. The influence of lactose particle sizeon spheronization of extrudate processed by a ram extruder. Int.J.Pharm. 81 205-224.
Fielden, K.E., Newton, J.M., O’Brien, P. and Rowe, R.C., 1988. Thermal studies on theinteraction of water and microcrystalline cellulose. J.Pharm.Pharmacol. 40 674-678.
Fornés, V. and Chaussidon, J., 1978. An interpretation of the evolution with temperatureof the ν2 + ν3 combination band in water. J.Chem.Phys. 68 4667-4671.
Frake, P., Greenhalgh, D., Grierson, S.M., Hempenstall, J.M. and Rudd, D.R., 1997.Process control and end-point determination of a fluid bed granulation by application ofnear infra-red spectroscopy. Int.J.Pharm. 151 75-80.
Frank, H. and Wen, W-Y., 1957. Structural aspects of ion-solvent interaction in aqueoussolutions: A suggested picture of water structure. Discuss.Faraday Soc. 24 133-140.
Froix, M. and Goedde, A., 1976. The effect of temperature on the cellulose/waterinteraction from NMR relaxation times. Macromol. 9 428-430.
Froix, M. and Nelson, R., 1975. The interaction of water with cellulose from nuclearmagnetic resonance relaxation times, Macromol. 8 726-730.
Habib, Y., Abramowitz, R., Jerzewski, R., Jain, N. and Shreeram, A., 1999. Is silicifiedwet-granulated microcrystalline cellulose better than orginal wet-granulatedmicrocrystalline cellulose? Pharm.Dev.Technol. 4 431-437.

51
Hancock, B.C., York, P. and Rowe, R.C., 1992. Characterization of wet masses using amixer torque rheometer: 2. Mixing kinetics. Int.J.Pharm. 83 147-153.
Harrison, P.J., 1982. Extrusion of wet powder masses. Doctoral Thesis, University of London,UK.
Harrison, P.J., Newton, J.M. and Rowe, R.C., 1985. The characterization of wet powdermasses suitable for extrusion/spheronization. J.Pharm.Pharmacol. 37 686-691.
Hatakeyama, H., Hatakeyama, T. and Nakamura, K., 1983. Relationship betweenhydrogen bonding and water in cellulose. J.Appl.Polym.Sci. Appl.Polym.Symp. 37 979-991.
Hollenbeck, G., Peck, G. and Kildsig, D., 1978. Application of immersional calorimetryto investigation of solid-liquid interactions: Microcrystalline cellulose – water system.J.Pharm.Sci. 67 1599-1606.
Imanidis, G., 1986. Untersuchungen über die Agglomerierkinetik und die elektrischeLeistungsaufnahme beim Granulierprozess im Schnellmischer. Doctoral Thesis, University ofBasel, Switzerland.
Ishikiriyama, K. and Todoki, M., 1995. Pore size distribution measurements of silica gelsby means of differential scanning calorimetry. II. Thermoporosimetry. J.Colloid InterfaceSci. 171 103-111.
Iwamoto, M., Uozumi, J. and Nishinari, K., 1987. Preliminary investigation of the state of waterin foods by near infrared spectoscopy. Int. NIR/NIT conference, Budapest, Hungary, 3-12.
Jayme, G., 1944. Mikro-Quellungsmessungen an Zellstoffen. Der Papier-Fabrikant/Wochenblatt für Papierfabrikation 6 187-194.
Jeffrey, G., 1997. An introduction to hydrogen bonding. Oxford University Press, New York,303 pp.
Jørgensen, A., Rantanen, J., Karjalainen, M., Räsänen, E. and Yliruusi, J., 2001. CCD-Raman spectroscopy in monitoring pseudopolymorphic transitions during wet granulation. 4th
International Symposium on Solid oral dosage forms, May 13-15, Malmö, Sweden, 11.
Kleinebudde, P., 1994a. Shrinking and swelling properties of pellets containingmicrocrystalline cellulose and low substituted hydroxypropylcellulose: I. Shrinkingproperties. Int.J.Pharm. 109 209-219.
Kleinebudde, P., 1994b. Shrinking and swelling properties of pellets containingmicrocrystalline cellulose and low substituted hydroxypropylcellulose: II. Swellingproperties. Int.J.Pharm. 109 221-227.
Kleinebudde, P., Schröder, M., Schultz, P., Müller, B., Waaler, T. and Nymo, L., 1999.Importance of the fraction of microcrystalline cellulose and spheronization speed on theproperties of extruded pellets made from binary mixtures. Pharm.Dev.Technol. 4 397-404.
Kleinebudde, P., 1997. The crystallite-gel-model for microcrystalline cellulose in wet-granulation, extrusion and spheronization. Pharm.Res. 14 804-809.

52
Kleinebudde, P., Jumaa, M. and El Saleh, F., 2000. Influence of degree of polymerizationon behaviour of cellulose during homogenization and extrusion/spheronisation. AAPSPharmsci 2 (3) article 21 (http://www.pharmsci.org/)
Knight, P., 1993. Evaluation of binding agents for the preparation of spherical granules byextrusion/spheronisation. Doctoral Thesis, University of London, UK.
Kontny, M. and Zografi, G., 1995. Sorption of water by solids. In Physical characterization ofpharmaceutical solids. Brittain, H. (Ed.), Marcel Dekker Inc., New York, pp. 387-418.
Kristensen, H.G., Holm, P., Jægerskou, A. and Schæfer, T., 1984. Granulation in highspeed mixers. Part 4: Effect of liquid saturation on the agglomeration. Pharm.Ind. 46 763-767.
Kristensen, H.G. and Schæfer, T., 1987. Granulation. A review on pharmaceutical wet-granulation. Drug Dev.Ind.Pharm. 13 803-872.
Kristensen, J., Schæfer, T. and Kleinebudde P., 2000a. Direct pelletization in a rotaryprocessor controlled by torque measurements. I. Influence of process variables.Pharm.Dev.Technol. 5 247-256.
Kristensen, J., Schæfer, T. and Kleinebudde P., 2000b. Direct pelletization in a rotaryprocessor controlled by torque measurements. II. Effects of changes in the content ofmicrocrystalline cellulose. AAPS PharmSci 2(3) article 24 (http://www.pharmsci.org/)
Landín, M., Martínez-Pacheco, R., Gómez-Amoza, J.L., Souto, C., Concheiro, A. andRowe, R.C., 1993a. Effect of country of origin on the properties of microcrystallinecellulose. Int.J.Pharm. 91 123-131.
Landín, M., Martínez-Pacheco, R., Gómez-Amoza, J.L., Souto, C., Concheiro, A. andRowe, R.C., 1993b. Effect of batch variation and source of pulp on the properties ofmicrocrystalline cellulose. Int.J.Pharm. 91 133-141.
Landín, M., Rowe, R.C. and York, P., 1995. Characterization of wet powder masses witha mixer torque rheometer. 3. Nonlinear effects of shaft speed and sample weight.J.Pharm.Sci. 84 557-560.
Landín, M., York, P., Cliff, M.J., Rowe, R.C. and Wigmore, A.J., 1996. Scale-up of apharmaceutical granulation in fixed bowl mixer-granulators. Int.J.Pharm. 133 127-131.
Lane, R. and Buckton, G., 2000. The novel combination of dynamic vapour sorptiongravimetric analysis and near infra-red spectroscopy as a hyphenated technique.Int.J.Pharm. 207 49-56.
Leuenberger, H., Bier, H.-P. and Sucker, H., 1979. Theory of the granulation-liquidrequirement in the conventional granulation process. Pharm.Tech.Int. 3 61-68.
Leuenberger, H., Bier, H.-P. and Sucker, H., 1981. Determination of the liquidrequirement for a conventional granulation process. Ger.Chem.Eng. 4 13-18.
Li, J.-X., Zhou, Y., Wu xiao, Y., Odidi, I. and Odidi, A., 2000. Characterization of wetmasses of pharmaceutical powders by triaxial compression test. J.Pharm.Sci. 89 178-190.

53
Li, T.-Q., 1991. Interactions between water and cellulose fibers, Application of NMR techniques.Doctoral Thesis, Royal Institute of Technology, Stockholm, Sweden.
Li, T.-Q., Henriksson, O., Klasen, T. and Ödberg, L., 1992. Water diffusion in woodpulp cellulose fibers studied by means of the pulsed gradient spin-echo method. J.ColloidInterface Sci. 154 305-315.
Lindberg, N.-O., Leander, L., Wenngren, L., Helgesen, H. and Reenstierna, R., 1974.Granulation in a change can mixer. Acta Pharm. Suec. 11 603.
Luner, P., Majuru, S., Seyer, J. and Kemper, M., 2000. Quantifying crystalline formcomposition in binary powder mixtures using near-infrared reflectance spectroscopy.Pharm.Dev.Technol. 5 231-246.
Luukkonen, P., Schæfer, T., Mäkelä, K., Södergård, U., Hellén, L. and Yliruusi, J., 1999.Evaluation of the optimum water level for pelletisation using a mixer torque rheometer. AAPSPharmSci, 1148, AAPS Annual Meeting and Exposition, November 14-18, 1999, NewOrleans, USA.
Malamataris, S. and Kiortsis, S., 1997. Wettability parameters and deformationalbehaviour of powder-liquid mixes in the funicular agglomeration phase. Int.J.Pharm. 1549-17.
Maloney, T.C., 1999. Thermoporosimetry by isothermal step melting. ISWPC Pre-Symposium,Seoul, 245-253.
Maloney, T.C., 2000. On the pore structure and dewatering properties of the pulp fiber cell wall.Doctoral Thesis, Helsinki University of Technology, Finland.
Maloney, T.C., Paulapuro, H. and Stenius, P., 1998. Hydration and swelling of pulp fibersmeasured with differential scanning calorimetry. Nord.Pulp Pap.Res.J. 13 31-36.
Maloney, T.C., Li, T., Weise, U. and Paulapuro, H., 1997. Intra- and interfibre poreclosure in wet pressing. Appita J. 50 301-306.
Miwa, A., Yajima, T. and Itai, S., 2000. Prediction of suitable amount of water additionfor wet granulation. Int.J.Pharm. 195 81-92.
Miyake, Y., Shinoda, A., Uesugi, K., Furukawa, M. and Nasu, T., 1973. The influence ofamount of water on granulating efficiency and physical properties of spherical granulesprepared by extrusion-spheronization processing. Yakuzaigaku 33 167-171.
Morris, K., Stowell, J., Byrn, S., Placette A., Davis, T. and Peck G., 2000. Acceleratedfluid bed drying using NIR monitoring and phenomenological modeling. DrugDev.Ind.Pharm. 26 985-988.
Morris, K., Griesser, U., Eckhardt, C. and Stowell, J., 2001. Theoretical approaches tophysical transformations of active pharmaceutical ingredients during manufacturingprocesses. Advanced Drug Delivery Rewievs 48 91-114.
Mousseri, J., Steinberg, M.P., Nelson, A.I. and Wei, L.S., 1974. Bound water capacity ofcorn starch and its derivatives by NMR. J.Food Sci. 39 114-116.

54
Nakai, Y., Fukuoka, E., Nakajima, S. and Hasegawa, J., 1977. Crystallinity and physicalcharacteristics of microcrystalline cellulose. Chem.Pharm.Bull. 25 96-101.
Nakamura, K., Hatakeyama, T. and Hatakeyama, H., 1981. Studies on bound water ofcellulose by differential scanning calorimetry. J.Text.Inst. 72 607-613.
Nelson, R., 1977. The determination of moisture transitions in cellulosic materials usingdifferential scanning calorimetry. J.Appl.Polym.Sci, 21 645-654.
Newitt, D.M. and Conway-Jones, J.M., 1958. A contribution to the theory and practise ofgranulation. Trans.Inst.Chem.Eng. 36 422-442.
Newton, J.M., Chow, A.K. and Jeewa, K.B., 1992. The effect of excipient source onspherical granules made by extrusion/spheronisation. Pharm.Tech.Int. Oct, 52-58.
Nürnberg, E. and Wunderlich, J., 1999a. Manufacturing pellets by extrusion andspheronization. The importance of the π saturation value of water of lyoextrusion usingdifferent types of extruder. Part I. Pharm.Tech.Europe 11(2) 41-47.
Nürnberg, E. and Wunderlich, J., 1999b. Manufacturing pellets by extrusion andspheronization. The importance of the π saturation value of water of lyoextrusion usingdifferent types of extruder. Part II. Pharm.Tech.Europe 11(3) 30-34.
Oksanen, C. and Zografi, G., 1990. The relationship between the glass transitiontemperature and water vapor absorption by poly(vinylpyrrolidone). Pharm.Res. 7 654-657.
Osborne, B.G., Fearn, T. and Hindle, P.H., 1993. Practical NIR spectroscopy with applicationsin food and beverage analysis. Longman, Scientific and Technical, Harlow. 227 pp.
Ovenston, A. and Benbow, J.J., 1968. Effects of die geometry on the extrusion of clay-like material. Trans.Br.Ceram.Soc. 67 543-567.
Parker, M.D. and Rowe, R.C. 1991. Source variation in the wet massing (granulation) ofsome microcrystalline celluloses. Powder Technol. 65 273-281.
Parker, M.D., York, P. and Rowe, R.C., 1990. Binder-substrate interactions in wetgranulation. 1: The effect of binder characteristics. Int.J.Pharm. 64 207-216.
Parker, M.D., York, P. and Rowe, R.C., 1991. Binder-substrate interactions in wetgranulation. 2: The effect of binder molecular weight. Int.J.Pharm. 72 243-249.
Peemoeller, H. and Sharp, A.R., 1985. NMR study of cellulose-water systems: Waterproton spin-lattice relaxation in the rotating reference frame. Polymer 26 859-864.
Pizzi, A., Eaton, N.J. and Bariska, M., 1987a. Theoretical water sorption energies byconformational analysis. Part 1: Crystalline Cellulose 1. Wood Sci.Technol. 21 235-248.
Pizzi, A., Eaton, N.J. and Bariska, M., 1987b. Theoretical water sorption energies byconformational analysis. Part 2: Amorphous cellulose and the sorption isotherm. WoodSci.Technol. 21 317-327.
Podczeck, F., 1999a. Rheological studies of the physical properties of powders used incapsule filling. Part I. Pharm.Technol.Eur. 11(9) 16-24.

55
Podczeck, F., 1999b. Rheological studies of the physical properties of powders used incapsule filling. Part II. Pharm.Technol.Eur. 11(10) 34-42.
Podczeck, F. and Révész, P., 1993. Evaluation of the properties of microcrystalline andmicrofine cellulose powders. Int.J.Pharm. 91 183-193.
Podczeck, F. and Newton, J.M., 2000. Powder and capsule filling properties of lubricatedgranulated cellulose powder. Eur.J.Pharm.Biopharm. 50 373-377.
Raines, C.L., 1990. The extrusion of various formulations of microcrystalline cellulose. DoctoralThesis, University of London, UK.
Raines, C.L., Newton, J.M. and Rowe, R.C., 1989. Extrusion of microcrystalline celluloseformulations. In Proceedings of the Annual Meeting of the British Society of Rheology, Carter, R.E.(Ed.), Elsevier Applied Science, London, UK, pp. 248-257.
Rantanen, J., Antikainen, O., Mannermaa, J-P. and Yliruusi, J., 2000a. Use of near-infrared reflectance method for measurement of moisture content during granulation.Pharm.Dev.Technol. 5 209-217.
Rantanen, J., Jørgensen, A., Räsänen, E., Luukkonen, P., Airaksinen, S., Raiman, J.,Hänninen, K., Antikainen, O. and Yliruusi, J., 2001. An insight into fluidised bedgranulation process with in-line NIR moisture measurement. Submitted for publication.
Rantanen, J., Känsäkoski, M., Suhonen, J., Tenhunen J., Lehtonen, S., Rajalahti, T.,Mannermaa, J-P. and Yliruusi, J., 2000b. Next generation fluidized bed granulatorautomation, AAPS PharmSciTech 1(2), http://www.pharmscitech.com/
Rantanen, J., Lehtola, S., Rämet, P., Mannermaa, J-P. and Yliruusi, J., 1998. On-linemonitoring of moisture content in an instrumented fluidized bed granulator with a multi-channel NIR moisture sensor. Powder Technol. 99 163-170.
Rowe, R.C. and Sadeghnejad, G.R., 1987. The rheology of microcrystalline cellulosepowder/water mixes – measurement using a mixer torque rheometer. Int.J.Pharm. 38 227-229.
Rowe, R.C., 1995. The rheological properties of lactose/microcrystalline cellulose/watermixes: Measurement using mixer torque rheometry. Pharm.Sci. 1 547-549.
Rowe, R.C., 1996. Characterization of wet powder masses using a mixer torquerheometer. 4. Effect of blade orientation. Int.J.Pharm. 133 133-138.
Rumpf, H., 1958. Grundlagen und Methoden des Granulierens. 1.Teil: Begriffe,Anwendung und Eigenschaften der Granulate. Chem.Ing.Techn. 30 144-158.
Räsänen, E., Rantanen, J., Jørgensen, A., Karjalainen, M., Paakkari, T. and Yliruusi, J.,2001. Novel identification of pseudopolymorphic changes of theophylline during wetgranulation using near infrared spectroscopy. J.Pharm.Sci. 90 389-396.
Sastry, K.V.S. and Fuerstenau, D.W., 1973. Mechanisms of agglomerate growth in greenpelletization. Powder Technol. 7 97-105.

56
Scallan, A.M. and Carles, J.E., 1972. The correlation of water retention value with fibersaturation point. Svensk Papperstidn. 75 699-703.
Schmidt, C. and Kleinebudde, P., 1999. Influence of the granulation step on pelletsprepared by extrusion/spheronization. Chem.Pharm.Bull. 47 405-412.
Seyer, J., Luner, P. and Kemper, M., 2000. Application of diffuse reflectance near-infrared spectroscopy for determination of crystallinity. J.Pharm.Sci. 89 1305-1316.
Shah, R., Kabadi, M., Pope, D. and Augsburger, L., 1995. Physico-mechanicalcharacterization of the extrusion-spheronization process. Part II: Rheologicaldeterminants for successful extrusion and spheronization. Pharm.Res. 12 496-507.
Sherrington, P.J., 1968. The granulation of sand as an aid to understanding fertilizer granulation.Aggregation, manufacture of granules, pellets and tablets. Instn.Chem.Eng.Symp. CE201-CE215.
Sherwood, B. and Becker, J., 1998. A new class of high-functionality excipients: Silicifiedmicrocrystalline cellulose. Pharm.Technol. 22 78-88.
Souto, C., Alvarez, R., Duro, R., Concheiro, A., Gomez-Amoza, J. L. and Martínez-Pacheco, R., 1998. Versatility of mixer torque rheometry predictions in extrusion-spheronization.Proc. 2nd World Meeting APGI/APV, 447-448.
Staniforth, J., Baichwal, A., Hart, J. and Heng, P., 1988. Effect of addition of water onthe rheological and mechanical properties of microcrystalline celluloses. Int.J.Pharm. 41231-236.
Staniforth, J.N. and Chatrath, M., 1996. Towards a new class of high functionality tabletbinders, I: Quasi-hornification of microcrystalline cellulose and loss of functionality.Pharm.Res. 13 S208.
Stone, J.E., Scallan, A.M., and Abrahamson, B., 1968. Influence of beating on cell wallswelling and internal fibrillation. Svensk Papperstidn. 19 687-694.
Svedas, V., 2000. Transformation of the near-infrared bands of cellulose surfacehydroxyls under the influence of adsorbed water molecules. Applied Spectrocopy 54 420-425.
Taylor, L. and Langkilde, F., 2000. Evaluation of solid-state forms present in tablets byraman spectroscopy. J.Pharm.Sci. 89 1342-1353.
Thiel, P.A. and Madey, T.E., 1987. The interaction of water with solid surfaces:fundamental aspects. Surface Science Reports 7 211-385.
Thomson, W., 1871. On the equilibrium of vapour at a curved surface of liquid. Phil.Mag.42 448-452.
Tobyn, M.J., McCarthy, G., Staniforth, J. and Edge, S., 1998. Physicochemicalcomparison between microcrystalline cellulose and silicified microcrystalline cellulose.Int.J.Pharm. 169 183-194.
Tomer, G. and Newton, J.M., 1999a. A centrifuge technique for the evaluation of theextent of water movement in wet powder masses. Int.J.Pharm. 188 31-38.

57
Tomer, G. and Newton, J.M., 1999b. Water movement evaluation during extrusion ofwet powder masses by collecting extrudate fractions. Int.J.Pharm. 182 71-77.
Tomer, G., Newton, J.M. and Kinchesh, P., 1999a. Magnetic resonance imaging (MRI) asa method to investigate movement of water during the extrusion of pastes. Pharm.Res. 16666-671.
Tomer, G., Mantle, M.D., Gladden, L.F. and Newton, J.M., 1999b. Measuring waterdistribution in extrudates using magnetic resonance imaging. Int.J.Pharm. 189 19-29.
Tomer, G., Patel, H., Podczeck, F. and Newton, J.M., 2001. Measuring the waterretention capacities (MRC) of different microcrystalline cellulose grades. Eur.J.Pharm.Sci.12 321-325.
Travers, D.N., Rogerson, A.G. and Jones, T.M., 1975. A torque arm mixer for studyingwet massing. J.Pharm.Pharmacol. 27 Suppl. 3P.
Tuleu, C. and Chaumeil, J.C., 1998. Small-scale characterization of wet powder massessuitable for extrusion-spheronization. Drug Dev.Ind.Pharm. 24 423-429.
Urquhart, A., 1924. The mechanism of the adsorption of water by cotton. J.Text.Inst. 20T125-132.
Usteri, M. and Leuenberger, H., 1989. Agglomeration of binary mixtures in a high-speedmixer. Int.J.Pharm. 55 135-141.
Van Campen, I., Amidon, G.I. and Zografi, G., 1983. Moisture sorption kinetics forwater-soluble substances I: Theoretical considerations of heat transport control.J.Pharm.Sci. 72 1381-1388.
Watano, S., Takashima, H., Sato, Y., Miyanami, K. and Terashita, K., 1996. IR absorptioncharacteristics of an IR moisture sensor and mechanism of water transfer in fluidized bedgranulation. Advanced Powder Technol. 7 279-289.
Watano, S., Terashita, K. and Miyanami, K., 1990. Development and application ofinfrared moisture sensor to complex granulation. Bull.Univ.Osaka Pref. Series A 39 187-197.
Weise, U., 1997. Characterization and mechanism of changes in wood pulp fibers caused by waterremoval. Doctoral Thesis, Helsinki University of Technology, Finland.
Weise, U., 1998. Hornification - mechanisms and terminology. Paper and Timber 80 110-115.
Westermarck, S., Juppo, A.M., Kervinen, L. and Yliruusi, J., 1999. Microcrystallinecellulose and its microstructure in pharmaceutical processing. Eur.J.Pharm.Biopharm. 48199-206.
Vervaet, C., 1997. Influence of process and formulation parameters on the quality of pellets made byextrusion/spheronisation. Doctoral Thesis, Gent University, Belgium.
White, J., 1994. On-line moisture detection for a microwave vacuum dryer. Pharm.Res. 11728-732.

58
Wu, J.-S., Ho, H.-O. and Sheu M.-T., 2001. A statistical design to evaluate the influenceof manufacturing factors on the material properties and functionalities ofmicrocrystalline cellulose. Eur.J.Pharm.Sci. 12 417-425.
Yamauchi, T. and Murakami, K., 1991. Differential scanning calorimetry as an aid forinvestigating the wet state of pulp. J.Pulp Pap.Sci. 17 J223-226.
Young, J.H. and Nelson, G.L., 1967a. Research of hysteresis between sorption anddesorption isotherms of wheat. Trans.Am.Soc.Agric.Engs. 10 756-761.
Young, J.H. and Nelson, G.L., 1967b. Theory of hysteresis between sorption anddesorption isotherms in biological materials. Trans.Am.Soc.Agric.Engs. 10 260-263.
Zeronian, S.H., 1985. Intercrystalline swelling of cellulose. In Cellulose Chemistry and ItsApplications, Nevell T.P. and Zeronian S.H. (Eds), Ellis Horwood Limited, Great Britain,pp.138-158.
Zografi, G., Kontny, M.J., Yang, A.Y.S. and Brenner, G.S., 1984. Surface area and watervapor sorption of microcrystalline cellulose. Int.J.Pharm. 18 99-116.
Zografi, G. and Kontny, M., 1986. The interactions of water with cellulose- and starch-derived pharmaceutical excipients. Pharm.Res. 3 187-194.
Zografi, G., 1988. States of water associated with solids. Drug Dev.Ind.Pharm. 14 1905-1926.