Embed Size (px)
Citation preview
I
RHEOLOGICAL BEHAVIOR OF CLAY WATER SLURRY
IN THE PRESENCE OF CATIONIC SURFACTANTS AND
ELECTROLYTES
Thesis submitted
By
MANAS RANJAN DAS
(109CH0108)
In partial fulfillment for the award of the Degree of
BACHELOR OF TECHNOLOGY
IN
CHEMICAL ENGINEERING
Under the guidance of
Dr. SANTANU PARIA
Department of Chemical Engineering
National Institute of Technology, Rourkela
Rourkela-769008, Orissa, India
May, 2013
II
ACKNOWLEDGEMENT
In pursuit of this academic endeavor, I feel that I have been fortunate. Yes, I shall be failing in
my duty if I do not record my profound sense of indebtedness and heartfelt gratitude to my
supervisor Dr. Santanu Paria who guided and inspired me in pursuance of this work. I would like
to make my deepest appreciation and gratitude to him for his invaluable guidance and
constructive criticism and encouragement during the project. His association will remain a
beacon light to me throughout my career.
I owe a depth of gratitude to Prof. R.K. Singh, HOD of chemical engineering department and
also like to thank all the faculties of the department of Chemical engineering for teaching me the
various facts of Chemical engineering.
I also express my thanks to the PhD scholars under Dr S. paria for clearing my doubts and
providing me with information related to the topic of my interest.
I thank to the support, encouragement and good wishes of my parents and family members,
without which I would not have been able to complete my thesis.
Date: 06/05/2013 Manas Ranjan Das
B.Tech. final Year
Chemical Engineering
NIT Rourkela
III
CONTENTS
Page no
Abstract 1
List of figures 2
Nomenclature 4
Chapter 1:
INTRODUCTION 5
1.1 Rheology 5
1.2 Newtonian fluids 6
1.3 Non- Newtonian fluids 6
1.4 Time dependent non-Newtonian fluids 7
1.5 Surfactants 8
1.5.1 Cationic surfactant 8
1.6 Electrolytes 9
1.7 Bentonite Clay 9
Chapter 2
LITERATURE REVIEW 12
2.1 Introduction 12
2.2 Studies on effect of electrolyte 13
2.3 Studies on effect of polymer 15
2.4 Studies on effect of surfactants on bentonite clay suspension 15
2.5 Research objective 18
Chapter 3
EXPERIMENTAL WORK
3.1 Experimental procedure 20
3.1 materials 20
IV
3.2 methods 20
Chapter 4
RESULTS AND DISCUSSION 21
4.1 Measurement of particle size of bentonite clay 21
4.2 Effect of clay concentration 21
4.3 Effect of surfactant 24
4.4 Effect of electrolyte 25
4.5 Effect of surfactant with different electrolyte 26
4.6 Zeta potential of bentonite particle 28
4.6.1 Surfactant medium 28
4.6.2 Aqueous medium 28
Chapter 5
CONCLUSION 30
REFERENCES 31
1
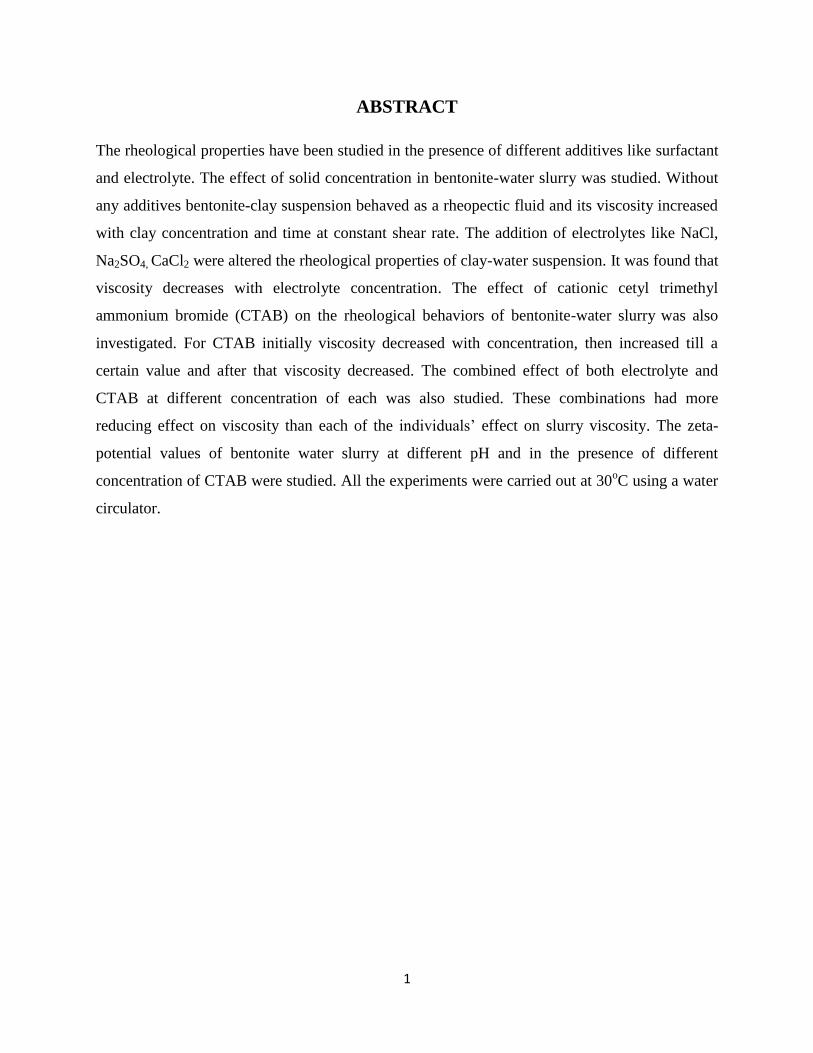
ABSTRACT
The rheological properties have been studied in the presence of different additives like surfactant
and electrolyte. The effect of solid concentration in bentonite-water slurry was studied. Without
any additives bentonite-clay suspension behaved as a rheopectic fluid and its viscosity increased
with clay concentration and time at constant shear rate. The addition of electrolytes like NaCl,
Na2SO4, CaCl2 were altered the rheological properties of clay-water suspension. It was found that
viscosity decreases with electrolyte concentration. The effect of cationic cetyl trimethyl
ammonium bromide (CTAB) on the rheological behaviors of bentonite-water slurry was also
investigated. For CTAB initially viscosity decreased with concentration, then increased till a
certain value and after that viscosity decreased. The combined effect of both electrolyte and
CTAB at different concentration of each was also studied. These combinations had more
reducing effect on viscosity than each of the individuals’ effect on slurry viscosity. The zeta-
potential values of bentonite water slurry at different pH and in the presence of different
concentration of CTAB were studied. All the experiments were carried out at 30oC using a water
circulator.
2
FIGURES
Figure no…………………………….Title……………………………………………….Page no
Fig 1.1……………….Sliding of two plates over each other…………………………………….4
Fig 1.2……………….Plot of (a) shear rate vs. shear stress (b)shear rate vs……………………5
Viscosity for Newtonian fluid.
Fig 1.3……………….Shear stress vs. shear rate for different types of fluid…………………...6
Fig 1.4……………….Shear rate vs. shear stress graph for time dependent flow………………7
Fig1.5………………. Bentonite structure…………………………………………………….…9
Fig 2.1……………….Hysteresis loops of bentonite suspensions at different ……………..…..12
solid concentrations [22].
Fig 2.2……………….Comparison between the effects of monovalent and divalent…………..13
Electrolytes on the flow curves of bentonite [22].
Fig 2.3……………….Zeta potential values of clay suspensions as a function ………………..15
of surfactant concentration [24].
Fig 2.4……………….The effect of the DTABr on the flow behavior of the……………….….16
Na–bentonite [25].
Fig 2.5……………….Influence of DTABr on hysteresis area [25]……………………………16
Fig 2.6……………….The influence of CTAB and DDAC on the viscosity of 2%.................17
w/w. Ca-bentonite–water system [26].
Fig 4.1……………… Distribution of particle size using Malvern Zeta Size
analyzer…………....21
Fig 4.2……………….Shear rate vs. shear stress & viscosity……………………………….….22
Fig 4.3……………….Concentration of clay vs. viscosity at constant shear rate……………....23
Fig 4.4………………Viscosity vs. shear rate (constant clay concentration)……………….…..23
Fig 4.5………………Viscosity vs. CTAB concentration……………………………………....24
Fig 4.6.……………...Viscosities vs. concentration of (a) NaCl and Na2SO4, (b) CaCl2………25
Fig 4.7………………Viscosity vs. Na2SO4 concentration with different CTAB conc………..26
3
Fig 4.8………………Viscosities vs. CaCl2 concentration with different CTAB conc………..27
Fig4.9……………….Viscosity vs. NaCl conc. with different CTAB………………………...27
Fig 4.10 ……………CTAB conc. vs. zeta potential……………………………………….….28
Fig 4.11 ……………..pH vs. zeta potential……………………………………………………29
4
NOMENCLATURE
A……………………………………………………………………………………………….. area
V…………………………………………………………………………………………….velocity
dx…………………………………………………………………………………... small distance
F……………………………………………………………………………………………… force
σ …………………………………………………………………………………………shear stress
γ…………………………………………………………………………………………..shear rate
η……………………………………………………………………………………………viscosity
ζ……………………………………………………………………………………….zeta potential
5
CHAPTER 1
INTRODUCTION
1.1 RHEOLOGY
Rheology is defined as the study of the deformation and flow of materials. The liquid will flow,
when a force is applied to a liquid, to relieve the strain from this force. The measurement of this
resistance is the viscosity of the system.
Rheometry refers to a set of standard techniques that are used to experimentally determine
rheological properties of materials. A rheometer is an instrument which can apply a torque or
stress (as area is know) on a material and accurately measures its retort with time or in other
way, it can enforce a strain and measures the resulting torque.
Viscosity is the measure of the resistance to flow of a fluid .This resistance is due to friction
between two moving plane of liquid at different velocities. The greater the friction the greater
amount of force needed for the movement which is termed as shear (force per area). Newton first
introduced a basic model for the flow measurement of a liquid between two parallel plates and
this is represented in figure 1.
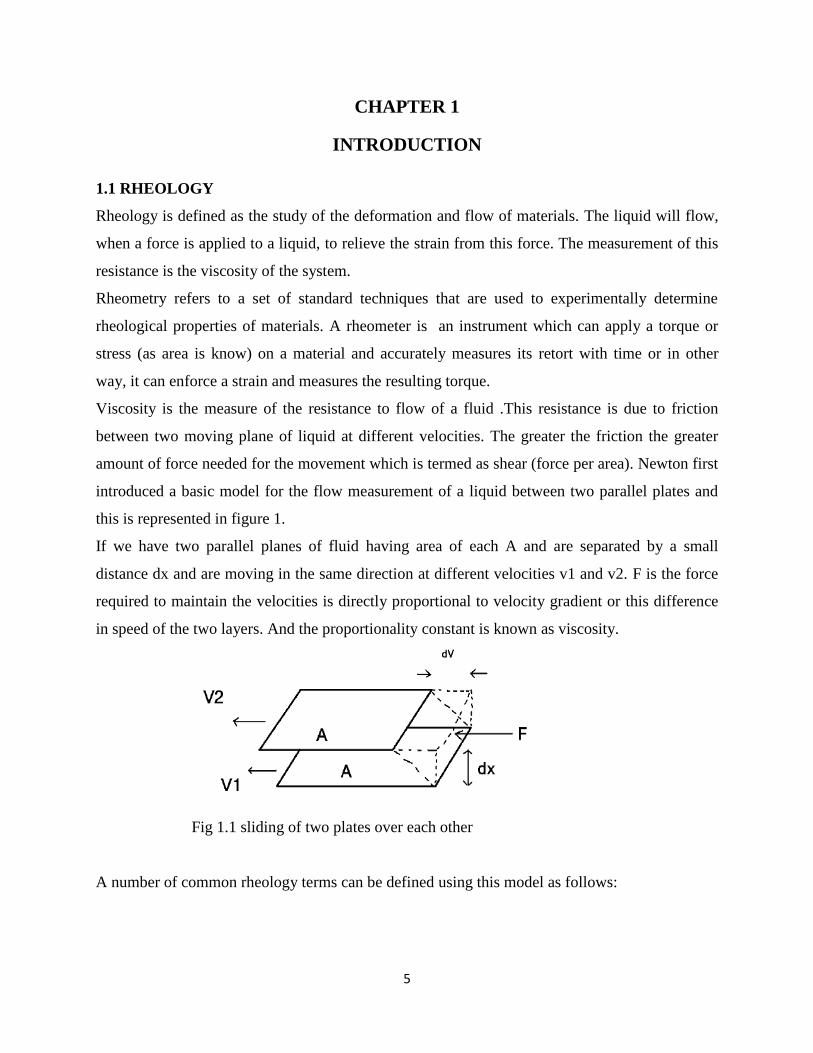
If we have two parallel planes of fluid having area of each A and are separated by a small
distance dx and are moving in the same direction at different velocities v1 and v2. F is the force
required to maintain the velocities is directly proportional to velocity gradient or this difference
in speed of the two layers. And the proportionality constant is known as viscosity.
Fig 1.1 sliding of two plates over each other
A number of common rheology terms can be defined using this model as follows:
6
Shear Stress
The force experienced by the liquid is proportional to the area of the upper plate and is defined as
the shear stress, σ=F/A (Units = Nm-2
or Pascal)
Shear Rate
The velocity gradient or the rate of change of velocity at which one layer passes over an adjacent
layer is the shear rate, γ = dv/dx (Unit = s-1
)
Viscosity
This is expressed mathematically as, η = shear stress/shear rate and is the measurement of the
resistance to flow of a fluid. Pascal.second (Pa.s) is the basic unit of viscosity, but Poise or
centipoises (cp = one hundredth of a Poise) is often used .When quoting viscosities the shear rate
(or measurement method/equipment used) should be stated together with the temperature at
which the measurement was taken.
1.2 NEWTONIAN FLUIDS
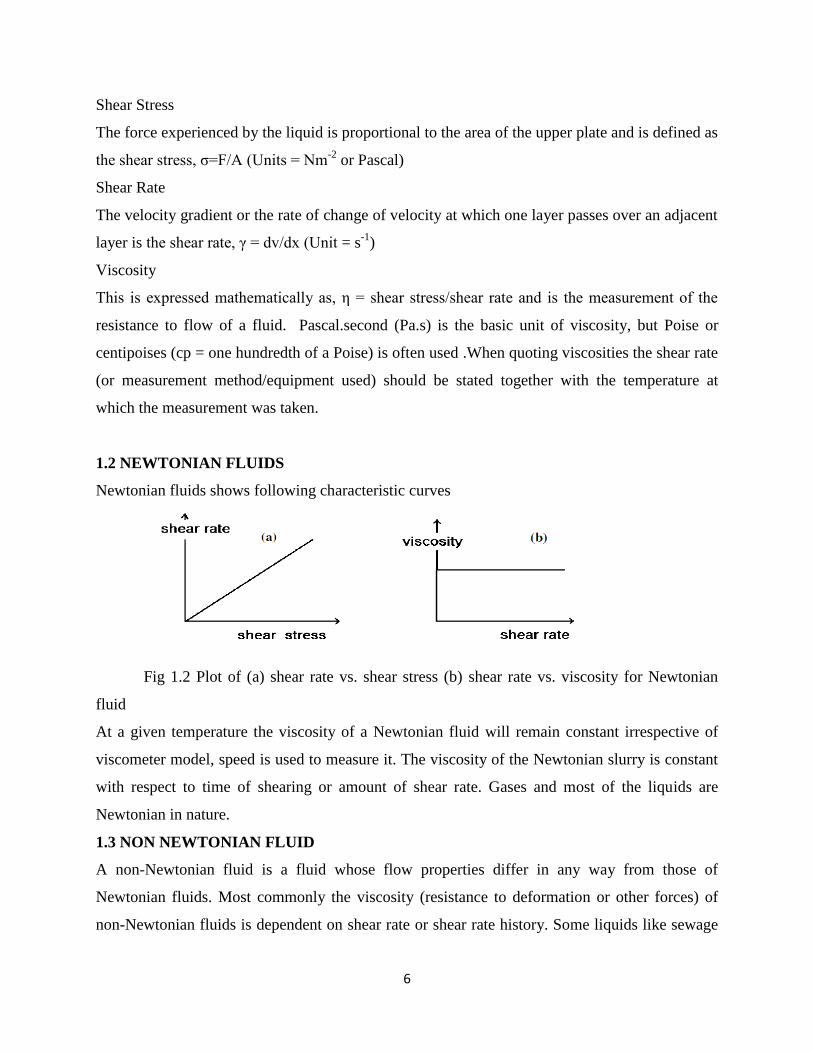
Newtonian fluids shows following characteristic curves
Fig 1.2 Plot of (a) shear rate vs. shear stress (b) shear rate vs. viscosity for Newtonian
fluid
At a given temperature the viscosity of a Newtonian fluid will remain constant irrespective of
viscometer model, speed is used to measure it. The viscosity of the Newtonian slurry is constant
with respect to time of shearing or amount of shear rate. Gases and most of the liquids are
Newtonian in nature.
1.3 NON NEWTONIAN FLUID
A non-Newtonian fluid is a fluid whose flow properties differ in any way from those of
Newtonian fluids. Most commonly the viscosity (resistance to deformation or other forces) of
non-Newtonian fluids is dependent on shear rate or shear rate history. Some liquids like sewage
7
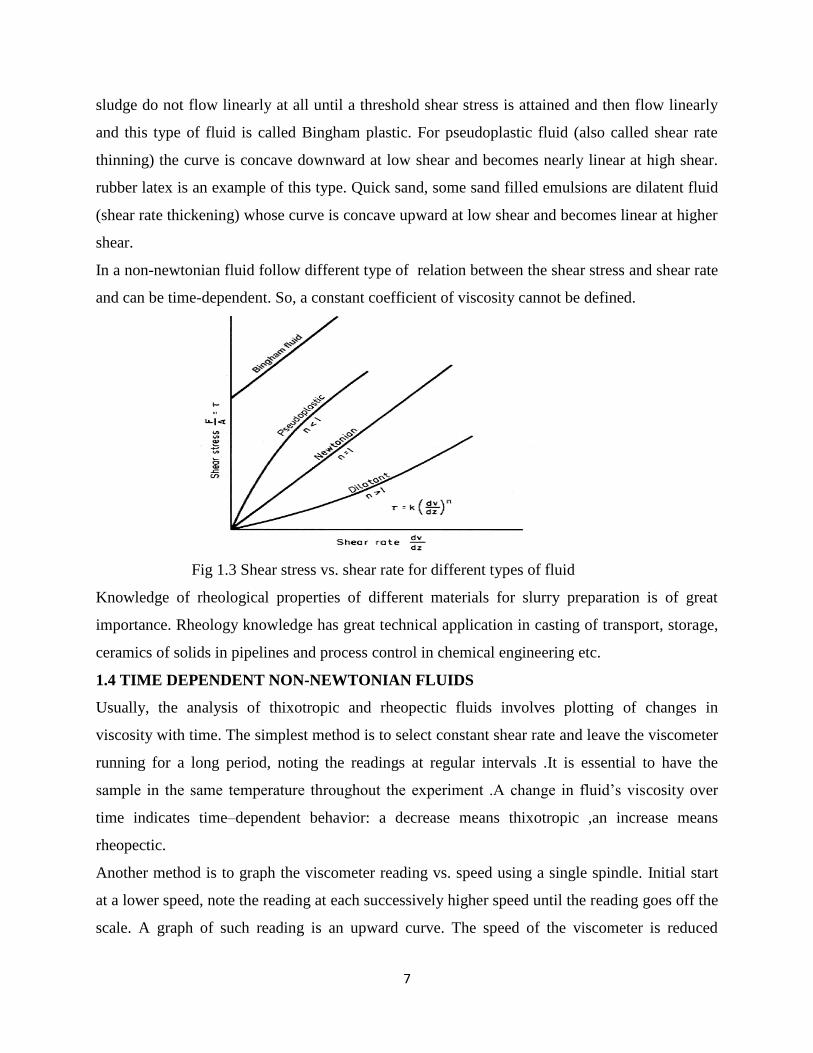
sludge do not flow linearly at all until a threshold shear stress is attained and then flow linearly
and this type of fluid is called Bingham plastic. For pseudoplastic fluid (also called shear rate
thinning) the curve is concave downward at low shear and becomes nearly linear at high shear.
rubber latex is an example of this type. Quick sand, some sand filled emulsions are dilatent fluid
(shear rate thickening) whose curve is concave upward at low shear and becomes linear at higher
shear.
In a non-newtonian fluid follow different type of relation between the shear stress and shear rate
and can be time-dependent. So, a constant coefficient of viscosity cannot be defined.
Fig 1.3 Shear stress vs. shear rate for different types of fluid
Knowledge of rheological properties of different materials for slurry preparation is of great
importance. Rheology knowledge has great technical application in casting of transport, storage,
ceramics of solids in pipelines and process control in chemical engineering etc.
1.4 TIME DEPENDENT NON-NEWTONIAN FLUIDS
Usually, the analysis of thixotropic and rheopectic fluids involves plotting of changes in
viscosity with time. The simplest method is to select constant shear rate and leave the viscometer
running for a long period, noting the readings at regular intervals .It is essential to have the
sample in the same temperature throughout the experiment .A change in fluid’s viscosity over
time indicates time–dependent behavior: a decrease means thixotropic ,an increase means
rheopectic.
Another method is to graph the viscometer reading vs. speed using a single spindle. Initial start
at a lower speed, note the reading at each successively higher speed until the reading goes off the
scale. A graph of such reading is an upward curve. The speed of the viscometer is reduced
8
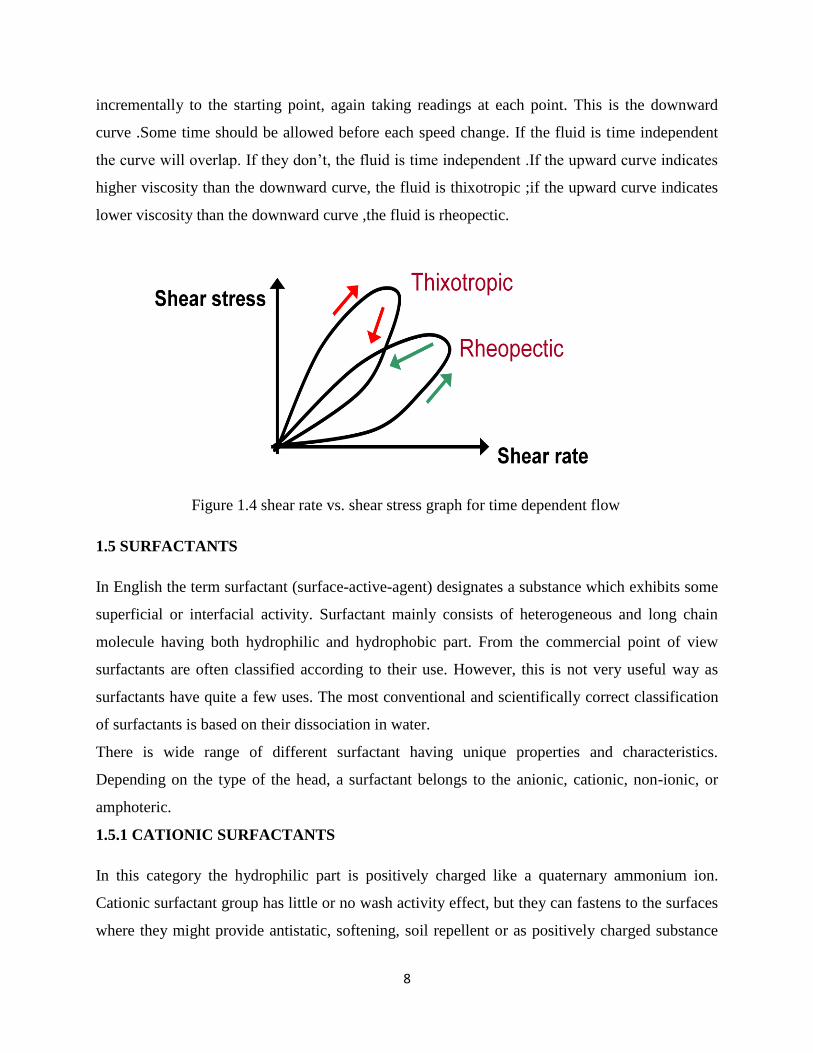
incrementally to the starting point, again taking readings at each point. This is the downward
curve .Some time should be allowed before each speed change. If the fluid is time independent
the curve will overlap. If they don’t, the fluid is time independent .If the upward curve indicates
higher viscosity than the downward curve, the fluid is thixotropic ;if the upward curve indicates
lower viscosity than the downward curve ,the fluid is rheopectic.
Figure 1.4 shear rate vs. shear stress graph for time dependent flow
1.5 SURFACTANTS
In English the term surfactant (surface-active-agent) designates a substance which exhibits some
superficial or interfacial activity. Surfactant mainly consists of heterogeneous and long chain
molecule having both hydrophilic and hydrophobic part. From the commercial point of view
surfactants are often classified according to their use. However, this is not very useful way as
surfactants have quite a few uses. The most conventional and scientifically correct classification
of surfactants is based on their dissociation in water.
There is wide range of different surfactant having unique properties and characteristics.
Depending on the type of the head, a surfactant belongs to the anionic, cationic, non-ionic, or
amphoteric.
1.5.1 CATIONIC SURFACTANTS
In this category the hydrophilic part is positively charged like a quaternary ammonium ion.
Cationic surfactant group has little or no wash activity effect, but they can fastens to the surfaces
where they might provide antistatic, softening, soil repellent or as positively charged substance
9
which is able to adsorb on negatively charged substrates to produce antistatic and hydrophobant
effect, generally have commercial importance as in corrosion inhibition.
The most typical applications are for softeners and antistatic .This helps to reduce the dirt/water
interfacial tension in a very efficient way leading to a more robust dirt removal system. They are
mostly efficient in removing greasy strains .It improves the packing of anionic surfactants at dirt
water interface. In household and bathroom cleaners cationic surfactants used as disinfectant
.The important application of this is fabric softener.
1.6 ELECTROLYTES
Usually particles in polar solvents develop surface charges, mainly due either to dissociation of
chemical groups on the surface, or to chemical binding or physical adsorption of ions from the
electrolyte. This surface charge is balanced by an equal and opposite net charge of ions in the
electrolyte. Commonly, electrolytes are solutions of acids, bases, or salts. Basically 2 types of
electrolyte Monovalent (NaCl) and divalent (CaCl2 and MgCl2) electrolyte have wide
applications.. Furthermore, some gases may act as electrolytes under conditions of high
temperature or low pressure. In a process called solvation Electrolyte solutions are normally
formed when a salt is placed into a solvent such as water and the individual components
dissociate due to the thermodynamic interactions between solvent and solute molecules. For
example, NaCl is placed in water the salt (a solid) dissolves into its component ions, as per the
dissociation reaction
NaCl(s) → Na+
(aq) + Cl−
(aq)
It is also possible for substances to react with water producing ions. molten salts can be
electrolytes as well.
1.7 BENTONITE CLAY
The inorganic fraction of soils consist mainly of silica and various silicates. Clay minerals are
hydrous silicates or alumino silicates and may be defined as those minerals which mainly make
up the colloidal fraction of rock, soils [1].
10
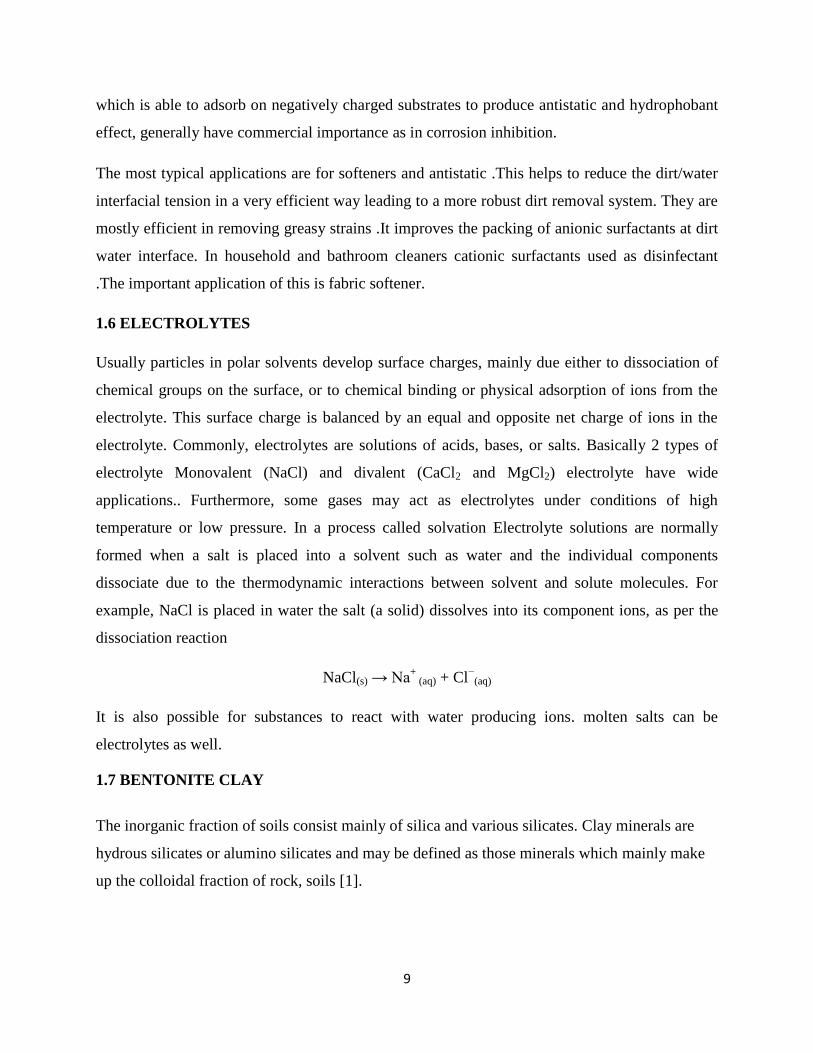
Figure 1.5 Bentonite structure
The main structural framework of the clay minerals is essentially consists of layers comprising
silica and alumina sheets joined together and stacked on top of each other. Two structural units
are involved in the atomic lattices of most clay minerals [2]. One unit is called the octahedral
sheet. Aluminum, iron or magnesium atoms are surrounded by oxygen atoms in octahedral
coordination, so that they are equidistant from six hydroxyls or oxygen (Fig. 1.5). The second
unit is built of silica tetrahedrons and is called the tetrahedral sheet. In each tetrahedron structure,
a silicon atom is equidistant from four oxygen atoms. The silica tetrahedral groups are arranged
to form a hexagonal network, and is repeated indefinitely to form a sheet of bentonite
composition Si, O, (OH), (Fig. 1.5).
In the case of the ‘three-layer minerals’ one octahedral alumina or magnesia sheet is covered (top
and bottom) by two layers of tetrahedral layer of silicate. One unit of clay is arrangement of an
octahedral sheet and two tetrahedral sheets. Most clay minerals consist of unit layers that are
stacked parallel to each other. A schematic representation a unit cell for three-layer clay, such as
montmorillonite is shown in Fig. 1.5. This structure is called the Hofmann structure [3]. The unit
structure repeats itself in a lateral direction.
The faces of bentonite unit sheet are negatively charged and edges are positively charged. So due
electrostatic force of attraction bentonite forms a card house structure due edge-face interaction.
After the clay is hydrated, the three dimensional “house of cards” colloidal structure builds
rapidly at first so viscosity increases. As time goes on, the left over free platelets take a relatively
longer time to settle in appropriate site of card house structure, so viscosity increases at a
11
progressively slower rate. When a given shear is applied most of the structure is disrupted
quickly with subsequent breakdown. Smectite dispersions are therefore thixotropic as they
viscosity increases with time.
Clay mineral crystals surface are mainly negatively charged comes from isomorphous
substitutions of certain atoms in their structure for other atoms of a different valence [4]. In the
tetrahedral sheet, Si4+
may be replaced by trivalent cations (Al3+
or Fe3+
), or divalent cations
(Mg2+
or Fe3+
) may replace Al3+
in the octahedral sheet. Due to this a charge deficiency occurs
and a negative charge is created at the surface of the clay. The negative charge is compensated
by the adsorption of cations on the surface.
In the structure of montmorillonite only a relatively small proportion of the inorganic cations
balancing the negative layer charge and are located at external crystal surfaces. The majority of
these cations are present in the interlayer space between the clay platelets. The thin, negatively
charged sheets are held together by the electrostatic forces between alternate layers of bridging
cations (typically Na+). When dry montmorillonite is placed in a moist atmosphere, it is able to
take up water vapour by adsorbing it in the interlayer region [6]. Swelling is the increase in the
inter platelet spacing, or the degree of expansion of the layers planes. If the cations present in
interlayer region are monovalent (Na+, Li
+), then repulsion between platelet is stronger and the
platelet will tend to separate from each other [7].
12
CHAPTER 2
LITERATURE REVIEW
2.1 INTRODUTION
Bentonite clay is basically hydrous silicate of aluminum. Colour varies from gray to brown.
Bentonites have formed by weathering of volcanic tuff and ash and mainly consists of
montmorillonite [(Al, Mg)2(OH)2(Si, Al)4O10(Ca)x on H2O] and also contain varying amounts of
other minerals like calcium and sodium feldspar [(CaAl2Si2O8),(NaAl3Si2O8)] and quartz (SiO2).
In general, the bentonite is classified into two types: Ca-bentonite, which is non-swelling clay
and can form colloids very quickly in water and Na-bentonite, which has a high swelling
property [8]. Now a days bentonites are used in different types of industry like dyes, ceramics,
paper, in drilling fluids, cement, nanocomposites, polymer composites and Pharmaceuticals [9,
10].
Due to their exceptional rheological properties bentonite suspensions are widely used in
industrial processes. The rheological property of bentonite slurry depends on different factors,
including the type as well as concentration of bentonite, the shape and size of bentonite particles,
the exchangeable ions, and the concentration of the electrolytes in slurry [11].Generally, the flow
of bentonite dispersions is very sensitive to the Na+/Ca+2
ratio.
The rheological property study and measurement of bentonite clay dispersions is an important
route for enlightening the flow characteristics and deformation behaviors of materials which is
very useful in improving the formulation process of various commercial products and can also be
very important in process evaluation, design and quality control. Overall these factors can
notably affect the final properties of the product [12].
Different types of additives have been used in bentonite dispersions to control the rheological
behavior of the dispersions that meet the specification of the desired applications, such as
electrolytes [11, 13, 14, 15], polymers [12] and surfactants [16, 17, 18]. The NaCl electrolyte has
been widely used in bentonite dispersions. A number of investigations were performed to
estimate the effect of NaCl electrolyte on the rheological behavior of bentonite dispersion [19,
20, 21]. Other types of electrolytes do not get much consideration in the literature.
13
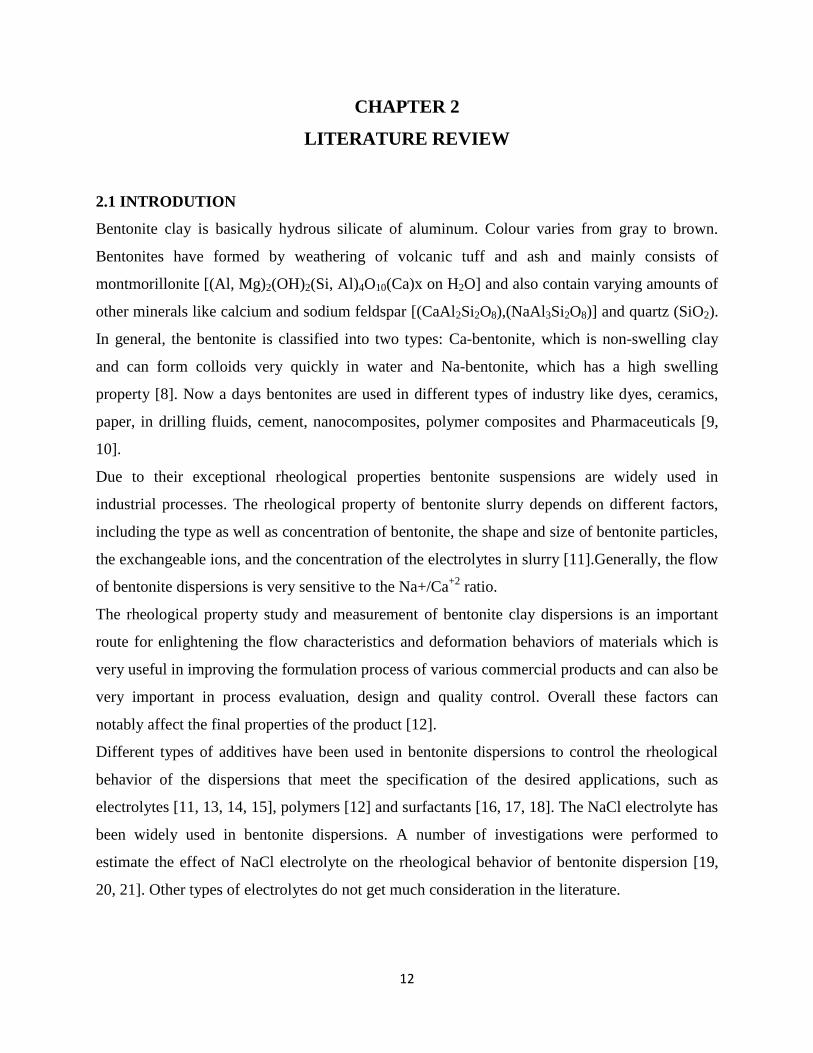
2.2 STUDIES ON EFFECT OF ELECTROLITES
Effect of electrolytes and aging time had been studied rheology of sodium and calcium
bentonite–water dispersions [22]. In his work, the rheological behavior of three types of
bentonites with different Na+/Ca+2
ratios was investigated. The addition of different electrolytes
in a concentration range of 0.02–0.2 M had reduced the viscosity of bentonite water slurry. The
divalent cation electrolyte had more reduction capacity of the viscosity and yield stress of
suspension as compared to the monovalent cation salts.
Figure 2.1 Hysteresis loops of bentonite suspensions at different solid
concentrations [22].
They found that the presence of hysteresis loops i.e. when a difference between the forward and
backward curve exists the suspension would exhibit a thixotropic behavior. The significant
thixotropic behavior was observed in bentonite suspensions at 5.0 wt% clay concentration, and
that thixotropic behavior is increased as solid concentration is increased, as shown in Figure 2.1.
Chemical additives like surface active agents, electrolytes, polymers etc. added in a clay-water
system, interact with clay particles so that the rheological properties will change.
14
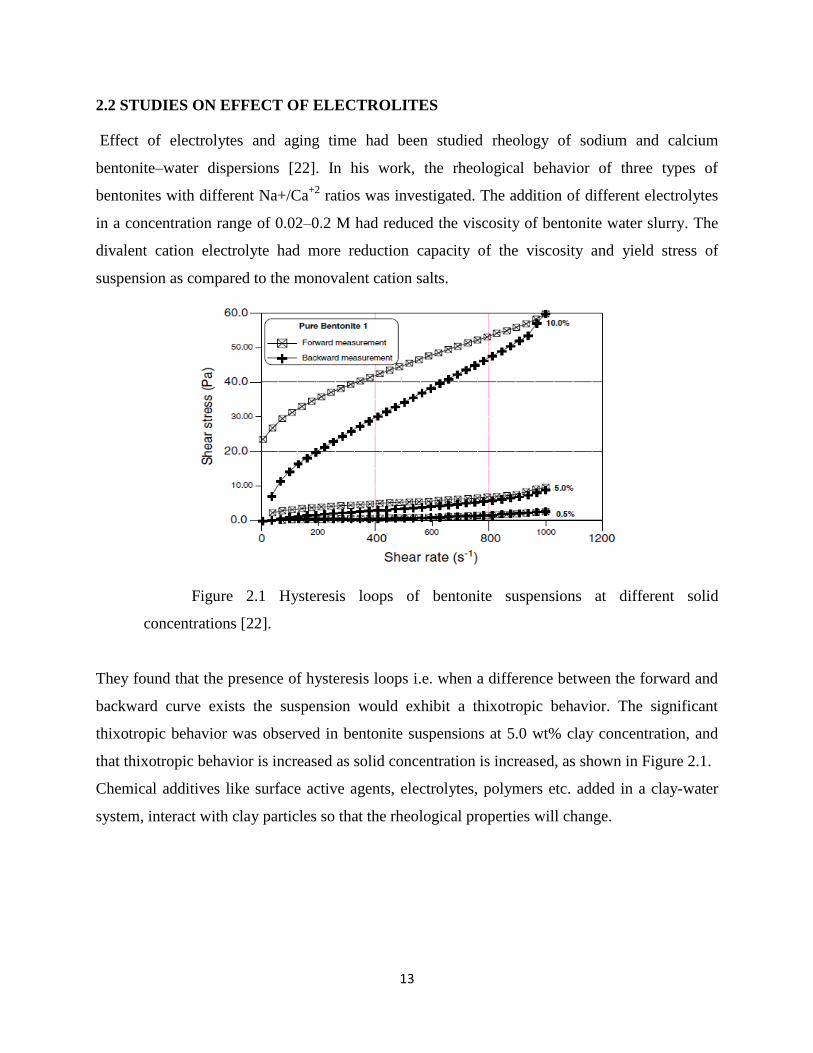
Figure 2.2 Comparison between the effects of monovalent and divalent
electrolytes on the flow curves of bentonite [22].
Basim also had studied, the rheological behavior of bentonite water slurry in different types of
electrolyte at different concentrations; 0.02–0.20 M. The effect of increasing salt concentration
was found to reduce the shear stress as well as viscosity of the suspension at a constant shear
rates. They concluded that the decrease of shear stress is due to the compression of the electric
double layer which may disrupts the network structure of the bentonite particles.
They had found the salts with divalent cations were more likely to change in the rheological
behavior more than the monovalent cations of bentonite dispersion, as illustrated in Fig.2.2
In the case of divalent electrolytes BaCl2⋅2H2O and CaCl2 at low electrolyte concentration all
bentonite dispersions behaved like Newtonian fluid and at high electrolyte concentration
behaved like shear thickening fluid [22].
They had studied viscosity of a dilute Suspension of bentonite in an electrostatically Stable
circumstance. Using Ostwald capillary viscometers the viscosity of the montmorillonite
suspension was measured at 200C .This experiment was carried out by taking different
concentration of NaCl in between 10-4
to 10-2
M.
They had obtained the relative viscosity by
comparing the viscosity of the bentonite water slurry with that of pure electrolyte solution [21].
15
2.3 STUDIES ON EFFECT OF POLYMER
Effect of ethylene glycol polymer (PEG) on electro kinetic and rheological Properties of
bentonite Suspensions were studied. Knowledge of the electro kinetic and rheological properties
of bentonite minerals is vital for the evaluation of the behavior of bentonite under different
environmental conditions. Viscosity and zeta potential were measured as a function of molecular
weights (400, 3000, and 8000) of PEG and their concentrations in the range of 2.5 x10⁻⁵
to 1.25x
10-2
mol/L. Different samples of Calcium and sodium bentonite were treated with different
molecular weights of three different PEG molecules and concentrations. From the rheological
properties they interpreted viscosity values increased with increase in the molecular weight of
PEG [23].
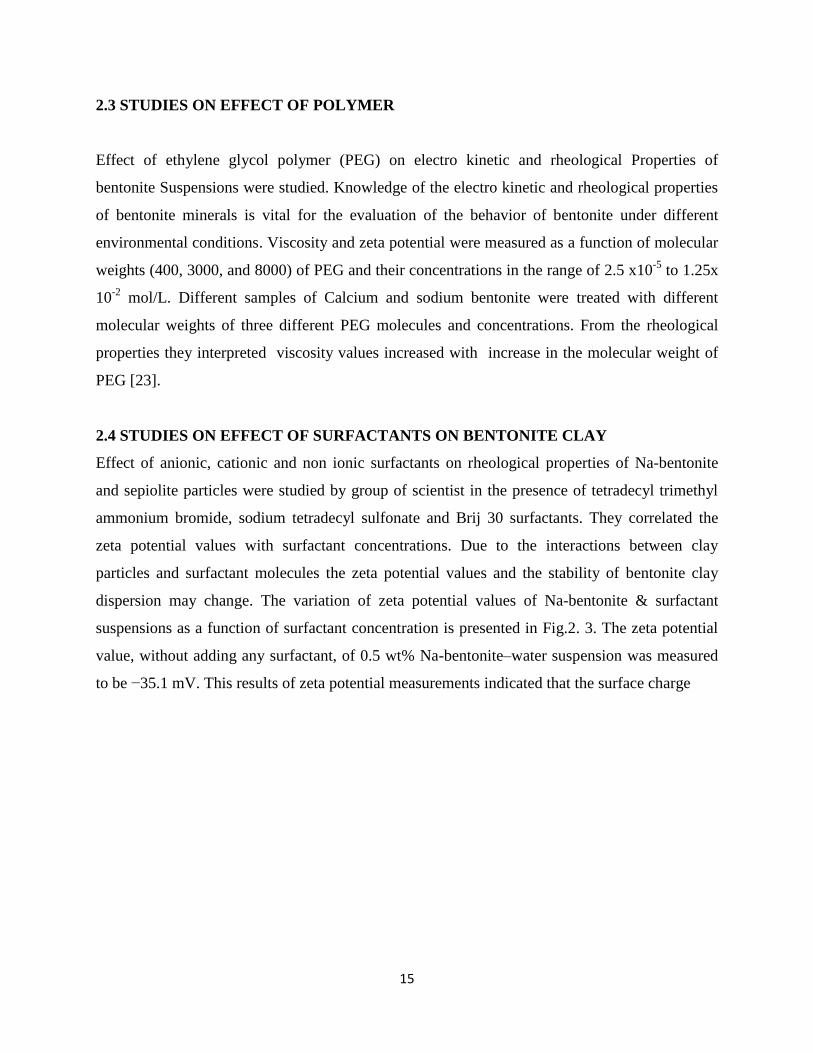
2.4 STUDIES ON EFFECT OF SURFACTANTS ON BENTONITE CLAY
Effect of anionic, cationic and non ionic surfactants on rheological properties of Na-bentonite
and sepiolite particles were studied by group of scientist in the presence of tetradecyl trimethyl
ammonium bromide, sodium tetradecyl sulfonate and Brij 30 surfactants. They correlated the
zeta potential values with surfactant concentrations. Due to the interactions between clay
particles and surfactant molecules the zeta potential values and the stability of bentonite clay
dispersion may change. The variation of zeta potential values of Na-bentonite & surfactant
suspensions as a function of surfactant concentration is presented in Fig.2. 3. The zeta potential
value, without adding any surfactant, of 0.5 wt% Na-bentonite–water suspension was measured
to be −35.1 mV. This results of zeta potential measurements indicated that the surface charge
16
Figure 2.3 Zeta potential values of clay suspensions as a function of surfactant concentration
[24].
of clay particles can be changed by adding surfactant molecules into the clay water suspensions.
They observed that surface charges of Na-bentonite and sepiolite were negative in pure water
which then converted to positive charge due to the addition of cationic surfactant after a certain
concentration [24].
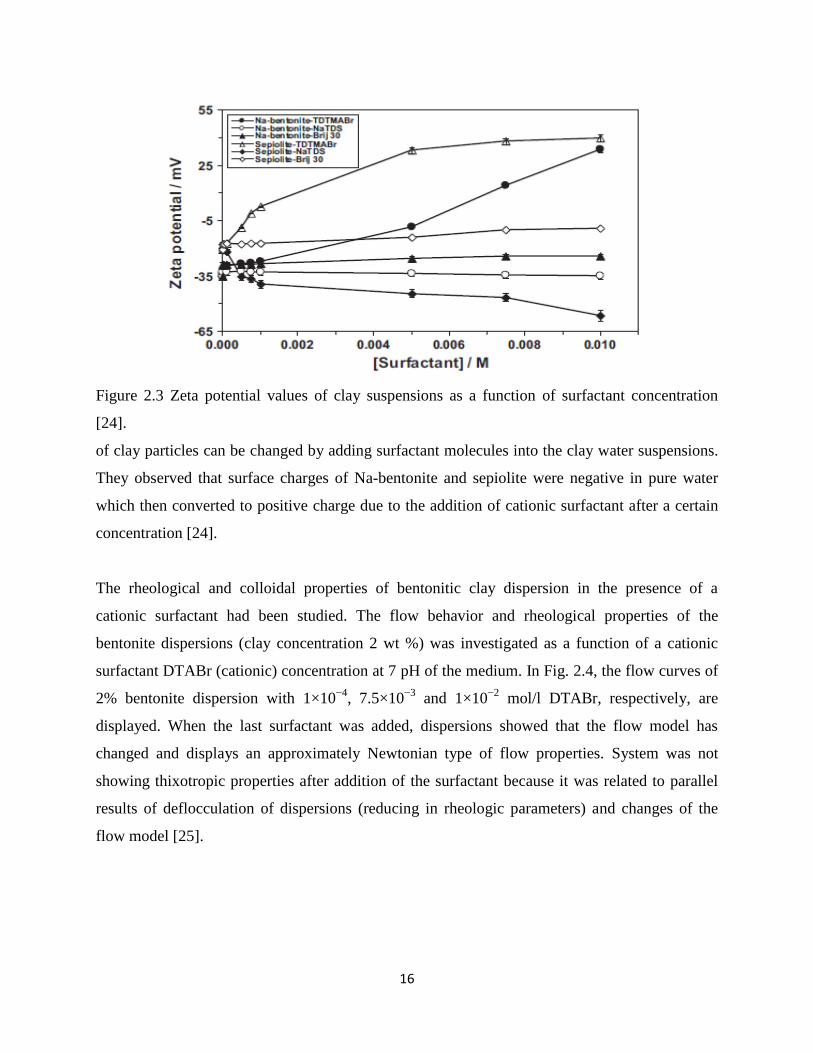
The rheological and colloidal properties of bentonitic clay dispersion in the presence of a
cationic surfactant had been studied. The flow behavior and rheological properties of the
bentonite dispersions (clay concentration 2 wt %) was investigated as a function of a cationic
surfactant DTABr (cationic) concentration at 7 pH of the medium. In Fig. 2.4, the flow curves of
2% bentonite dispersion with 1×10⁻⁴
, 7.5×10⁻³
and 1×10⁻²
mol/l DTABr, respectively, are
displayed. When the last surfactant was added, dispersions showed that the flow model has
changed and displays an approximately Newtonian type of flow properties. System was not
showing thixotropic properties after addition of the surfactant because it was related to parallel
results of deflocculation of dispersions (reducing in rheologic parameters) and changes of the
flow model [25].
17
Figure 2.4 The effect of the DTABr on the flow behavior of the Na–bentonite [25].
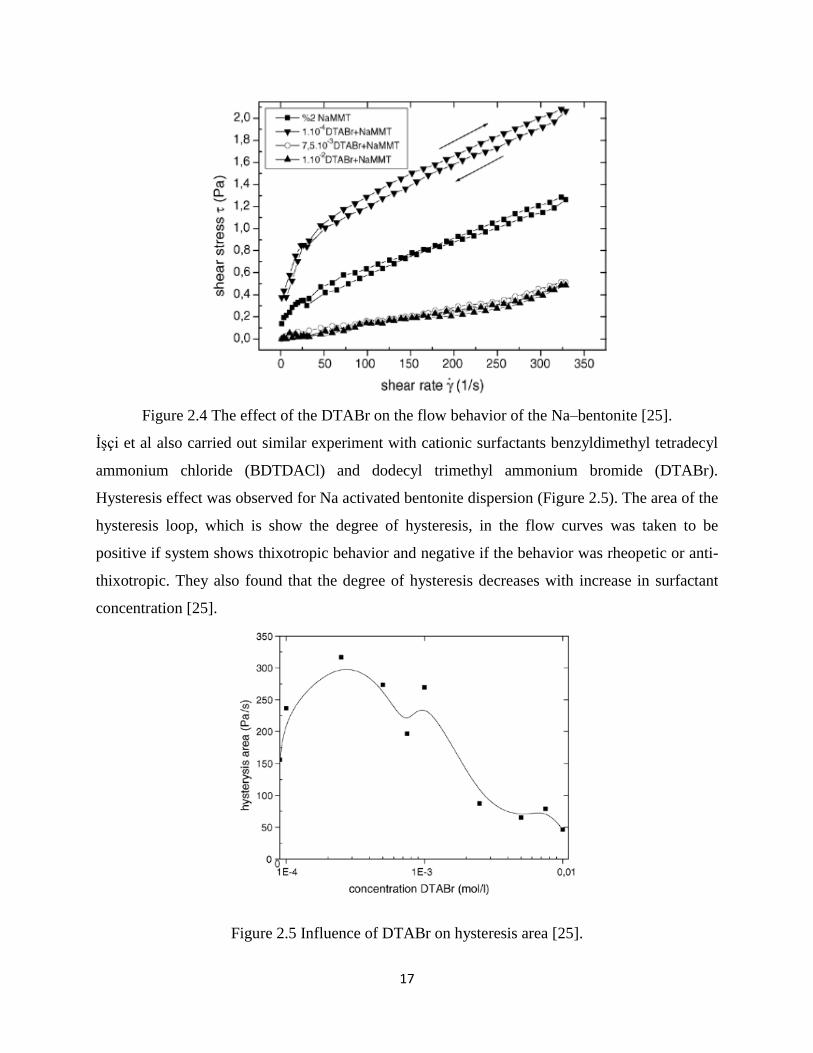
İşçi et al also carried out similar experiment with cationic surfactants benzyldimethyl tetradecyl
ammonium chloride (BDTDACl) and dodecyl trimethyl ammonium bromide (DTABr).
Hysteresis effect was observed for Na activated bentonite dispersion (Figure 2.5). The area of the
hysteresis loop, which is show the degree of hysteresis, in the flow curves was taken to be
positive if system shows thixotropic behavior and negative if the behavior was rheopetic or anti-
thixotropic. They also found that the degree of hysteresis decreases with increase in surfactant
concentration [25].
Figure 2.5 Influence of DTABr on hysteresis area [25].
18
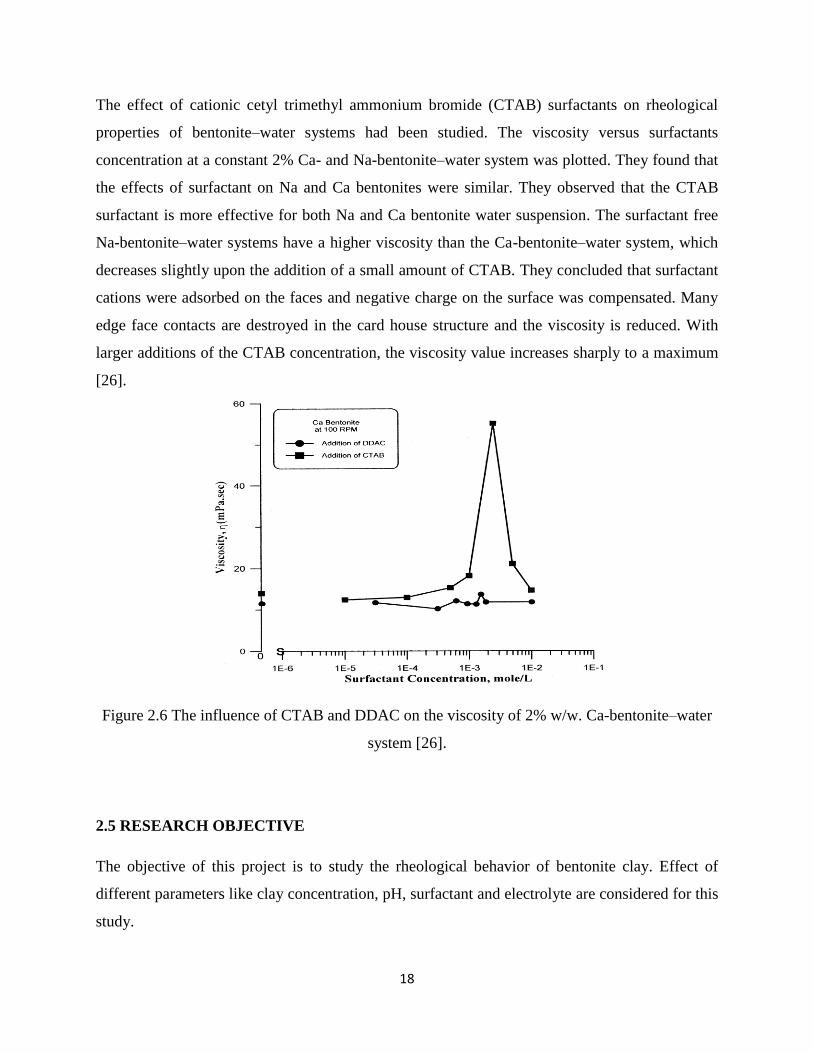
The effect of cationic cetyl trimethyl ammonium bromide (CTAB) surfactants on rheological
properties of bentonite–water systems had been studied. The viscosity versus surfactants
concentration at a constant 2% Ca- and Na-bentonite–water system was plotted. They found that
the effects of surfactant on Na and Ca bentonites were similar. They observed that the CTAB
surfactant is more effective for both Na and Ca bentonite water suspension. The surfactant free
Na-bentonite–water systems have a higher viscosity than the Ca-bentonite–water system, which
decreases slightly upon the addition of a small amount of CTAB. They concluded that surfactant
cations were adsorbed on the faces and negative charge on the surface was compensated. Many
edge face contacts are destroyed in the card house structure and the viscosity is reduced. With
larger additions of the CTAB concentration, the viscosity value increases sharply to a maximum
[26].
Figure 2.6 The influence of CTAB and DDAC on the viscosity of 2% w/w. Ca-bentonite–water
system [26].
2.5 RESEARCH OBJECTIVE
The objective of this project is to study the rheological behavior of bentonite clay. Effect of
different parameters like clay concentration, pH, surfactant and electrolyte are considered for this
study.
19
The specific objectives of this study are
To study the rheological behavior of bentonite clay water slurry for different clay
concentration.
To study the effect of shear rate on the viscosity and shear rate of the cal slurry.
To study the effect of surfactant on the viscosity of the clay slurry.
To study the effect of the electrolyte on the viscosity of the clay slurry.
To study the combined effect of the surfactant and electrolyte on the viscosity of the clay
slurry.
To study the effect of clay concentration and pH on the ζ potential of the clay slurry.
20
CHAPTER 3
MATERIALS AND METHODS
3.1 MATERIALS
Bentonite clay (aluminum silicate hydrate) was purchased from Loba Chemie Pvt. Ltd., India
and cetyltrimethyl ammonium bromide (CTAB) was purchased from Loba Chemie Pvt. Ltd.,
India. Different electrolytes like NaCl, Na2SO4, and CaCl2 were used for this study. For
measurement Ultrapure water of 18.2 M.cm resistivity and pH 6.5–7 was used at 30oC for all
the experiments.
3.2 METHODS
Particle size of bentonite clay was measured using Malvern Zeta Size analyzer, (Nano ZS). For
viscosity measurement a rotational cone and plate BOHLIN VISCO-88 viscometer was used.
There was a conical section in the cone with angle of 5.40C and diameter of cone 30 mm. For all
measurements a constant gap of 0.15mm was maintained between the cone and plate. Using an
external water circulator a constant temp. of 300C was maintained for carrying out all the
measurements. The viscosity of the slurry without additives containing 15%, 20%, 25% ,30% (%
by wt.) were measured at variable shear rates as well as at constant shear rates at 40 sec-1
,60 sec-
1,80 sec
-1. The slurry in presence of desired amount of CTAB surfactant and electrolytes (NaCl,
CaCl2, Na2SO4) were prepared and viscosity of the samples were measured at constant shear
rate 60 sec-1
and at temperature of 30oC. Zeta potential was also measured by using Malvern Zeta
Size analyzer, (Nano ZS). For zeta potential measurement 8 different samples were prepared at
various CTAB concentrations at very low clay concentration of 0.00125%. And also zeta
potential was measured for another 8 samples with different pH with same (very low) clay
concentration.
21
CHAPTER 4
RESULTS AND DISCUSSION
4.1 MEASUREMENT OF PARTICLE SIZE OF BENTONITE CLAY
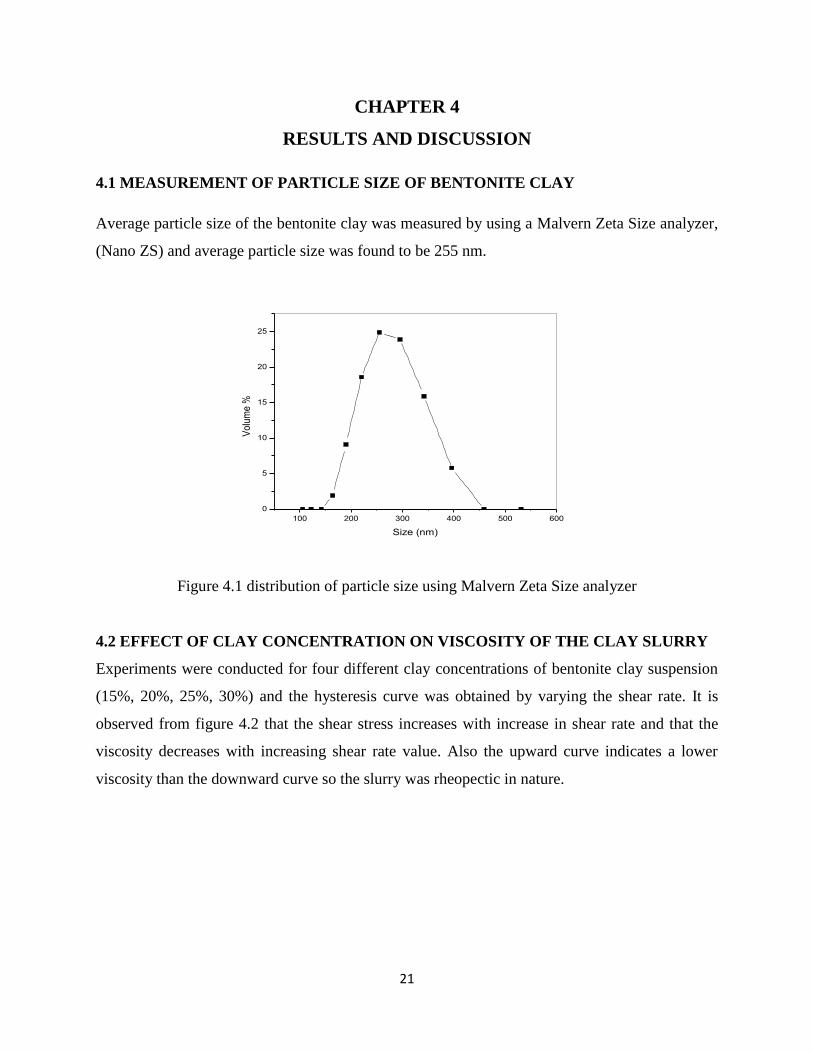
Average particle size of the bentonite clay was measured by using a Malvern Zeta Size analyzer,
(Nano ZS) and average particle size was found to be 255 nm.
100 200 300 400 500 600
0
5
10
15
20
25
Vo
lum
e %
Size (nm)
Figure 4.1 distribution of particle size using Malvern Zeta Size analyzer
4.2 EFFECT OF CLAY CONCENTRATION ON VISCOSITY OF THE CLAY SLURRY
Experiments were conducted for four different clay concentrations of bentonite clay suspension
(15%, 20%, 25%, 30%) and the hysteresis curve was obtained by varying the shear rate. It is
observed from figure 4.2 that the shear stress increases with increase in shear rate and that the
viscosity decreases with increasing shear rate value. Also the upward curve indicates a lower
viscosity than the downward curve so the slurry was rheopectic in nature.
22
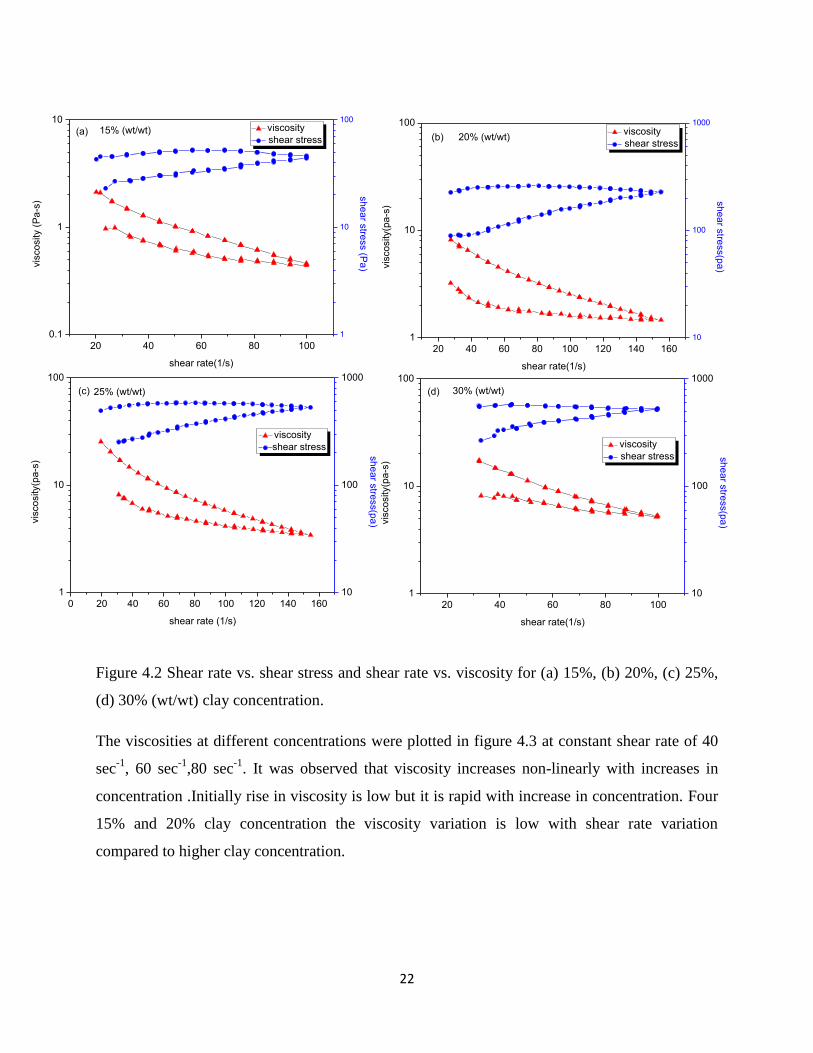
Figure 4.2 Shear rate vs. shear stress and shear rate vs. viscosity for (a) 15%, (b) 20%, (c) 25%,
(d) 30% (wt/wt) clay concentration.
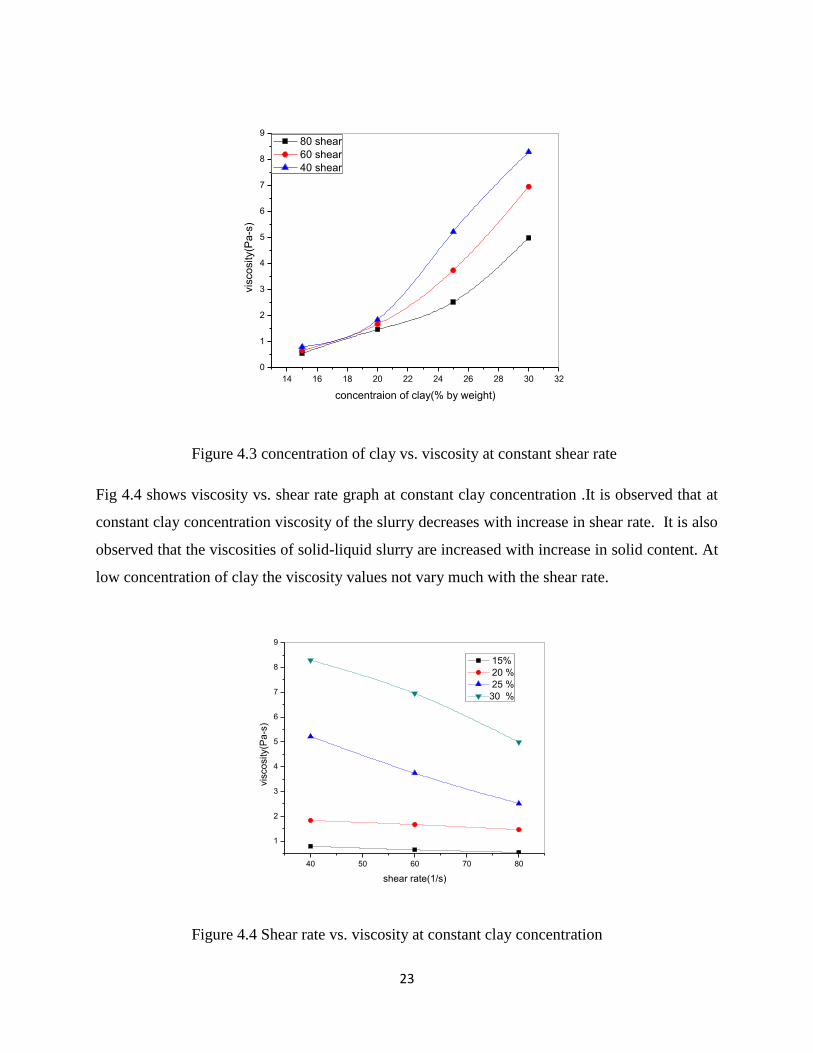
The viscosities at different concentrations were plotted in figure 4.3 at constant shear rate of 40
sec-1
, 60 sec-1
,80 sec-1
. It was observed that viscosity increases non-linearly with increases in
concentration .Initially rise in viscosity is low but it is rapid with increase in concentration. Four
15% and 20% clay concentration the viscosity variation is low with shear rate variation
compared to higher clay concentration.
20 40 60 80 100 120 140 160
1
10
100
viscosity
shear stress
shear rate(1/s)
vis
co
sity(p
a-s
)
(b)
10
100
1000
sh
ea
r stre
ss(p
a)
20% (wt/wt)
20 40 60 80 100
0.1
1
10
viscosity
shear stress
shear rate(1/s)
vis
co
sity (
Pa
-s)
15% (wt/wt)(a)
1
10
100
sh
ea
r stre
ss (P
a)
0 20 40 60 80 100 120 140 160
1
10
100
viscosity
shear stress
shear rate (1/s)
vis
co
sity(p
a-s
)
(c) 25% (wt/wt)
10
100
1000
sh
ea
r stre
ss(p
a)
20 40 60 80 100
1
10
100
viscosity
shear stress
shear rate(1/s)
vis
co
sity(p
a-s
)(d) 30% (wt/wt)
10
100
1000
sh
ea
r stre
ss(p
a)
23
14 16 18 20 22 24 26 28 30 32
0
1
2
3
4
5
6
7
8
9
vis
co
sity(P
a-s
)
concentraion of clay(% by weight)
80 shear
60 shear
40 shear
Figure 4.3 concentration of clay vs. viscosity at constant shear rate
Fig 4.4 shows viscosity vs. shear rate graph at constant clay concentration .It is observed that at
constant clay concentration viscosity of the slurry decreases with increase in shear rate. It is also
observed that the viscosities of solid-liquid slurry are increased with increase in solid content. At
low concentration of clay the viscosity values not vary much with the shear rate.
40 50 60 70 80
1
2
3
4
5
6
7
8
9
vis
co
sity(P
a-s
)
shear rate(1/s)
15%
20 %
25 %
30 %
Figure 4.4 Shear rate vs. viscosity at constant clay concentration
24
4.2 EFFECT OF SURFACT ON THE VISCOSITY OF THE CLAY SLURRY
0 2 4 6 8 10
2
3
4
5
6
7
Vis
co
sity(P
a-s
)
CTAB conc.(mM)
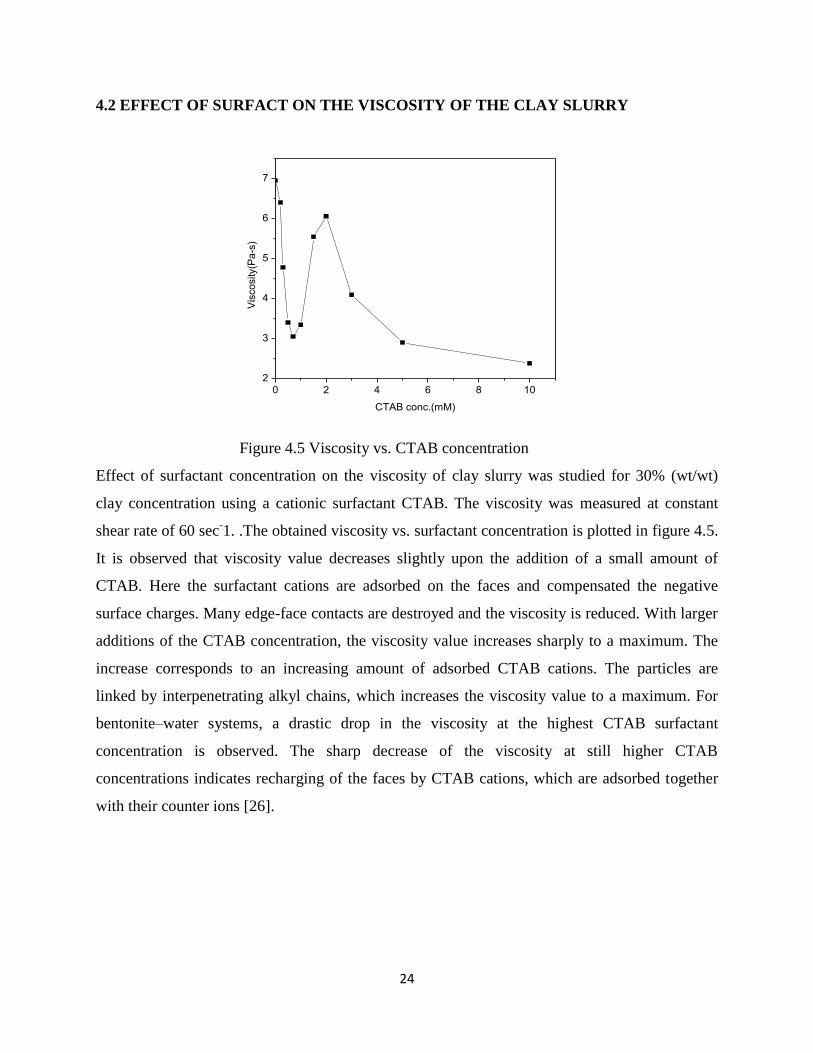
Figure 4.5 Viscosity vs. CTAB concentration
Effect of surfactant concentration on the viscosity of clay slurry was studied for 30% (wt/wt)
clay concentration using a cationic surfactant CTAB. The viscosity was measured at constant
shear rate of 60 sec-1. .The obtained viscosity vs. surfactant concentration is plotted in figure 4.5.
It is observed that viscosity value decreases slightly upon the addition of a small amount of
CTAB. Here the surfactant cations are adsorbed on the faces and compensated the negative
surface charges. Many edge-face contacts are destroyed and the viscosity is reduced. With larger
additions of the CTAB concentration, the viscosity value increases sharply to a maximum. The
increase corresponds to an increasing amount of adsorbed CTAB cations. The particles are
linked by interpenetrating alkyl chains, which increases the viscosity value to a maximum. For
bentonite–water systems, a drastic drop in the viscosity at the highest CTAB surfactant
concentration is observed. The sharp decrease of the viscosity at still higher CTAB
concentrations indicates recharging of the faces by CTAB cations, which are adsorbed together
with their counter ions [26].
25
4.3 EFFECT OF ELECTROLYTE
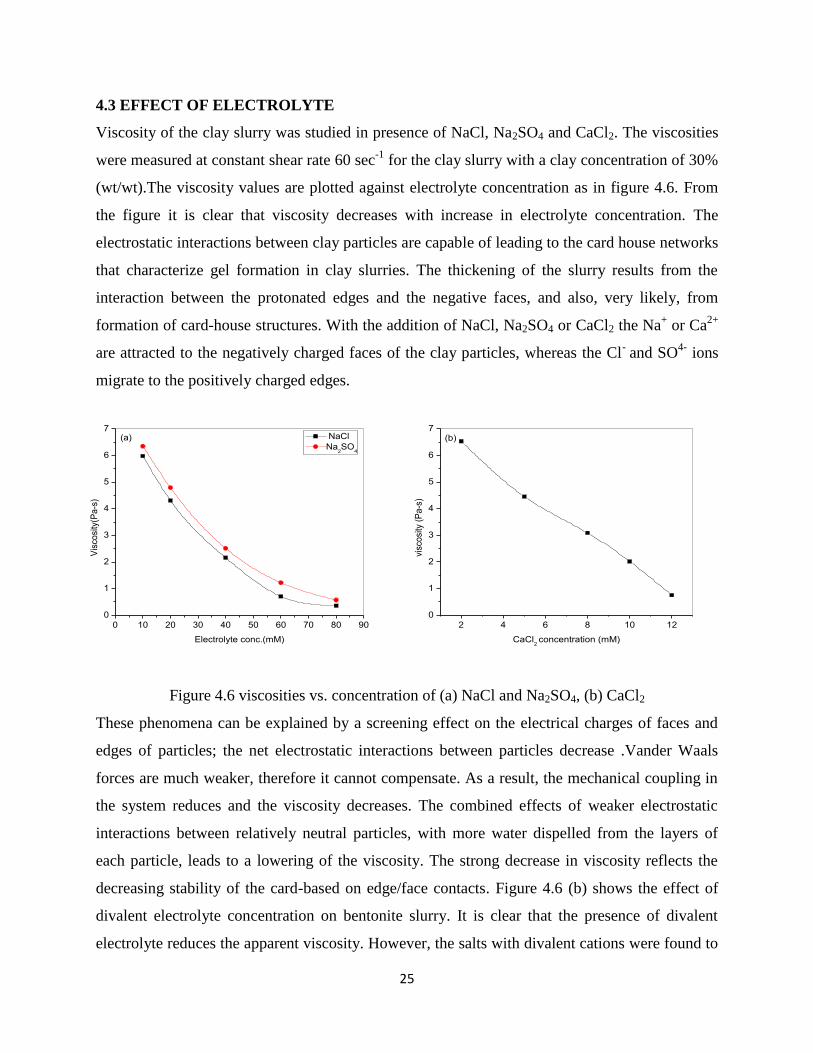
Viscosity of the clay slurry was studied in presence of NaCl, Na2SO4 and CaCl2. The viscosities
were measured at constant shear rate 60 sec-1
for the clay slurry with a clay concentration of 30%
(wt/wt).The viscosity values are plotted against electrolyte concentration as in figure 4.6. From
the figure it is clear that viscosity decreases with increase in electrolyte concentration. The
electrostatic interactions between clay particles are capable of leading to the card house networks
that characterize gel formation in clay slurries. The thickening of the slurry results from the
interaction between the protonated edges and the negative faces, and also, very likely, from
formation of card-house structures. With the addition of NaCl, Na2SO4 or CaCl2 the Na+ or Ca
2+
are attracted to the negatively charged faces of the clay particles, whereas the Cl- and SO
4- ions
migrate to the positively charged edges.
Figure 4.6 viscosities vs. concentration of (a) NaCl and Na2SO4, (b) CaCl2
These phenomena can be explained by a screening effect on the electrical charges of faces and
edges of particles; the net electrostatic interactions between particles decrease .Vander Waals
forces are much weaker, therefore it cannot compensate. As a result, the mechanical coupling in
the system reduces and the viscosity decreases. The combined effects of weaker electrostatic
interactions between relatively neutral particles, with more water dispelled from the layers of
each particle, leads to a lowering of the viscosity. The strong decrease in viscosity reflects the
decreasing stability of the card-based on edge/face contacts. Figure 4.6 (b) shows the effect of
divalent electrolyte concentration on bentonite slurry. It is clear that the presence of divalent
electrolyte reduces the apparent viscosity. However, the salts with divalent cations were found to
0 10 20 30 40 50 60 70 80 90
0
1
2
3
4
5
6
7
Vis
cosi
ty(P
a-s
)
Electrolyte conc.(mM)
NaCl
Na2SO
4
(a)
2 4 6 8 10 12
0
1
2
3
4
5
6
7vi
sco
sity
(P
a-s
)
CaCl2 concentration (mM)
(b)
26
cause more change in the rheological behavior of slurry than the monovalent cations. It is clear
from the graph 4.6 (a) that NaCl has more effect on reducing viscosity of slurry than Na2SO4 at
same concentration. This may be due to the higher mobility of Cl- ion than SO
4- ion in the inter
layer structure of bentonite. So clay surface neutralization effect of NaCl is more compared to
Na2SO4 so viscosity reduction value is more as well.
4.5 EFFECT OF SURFACTANT WITH DIFFERENT ELECTROLYTE
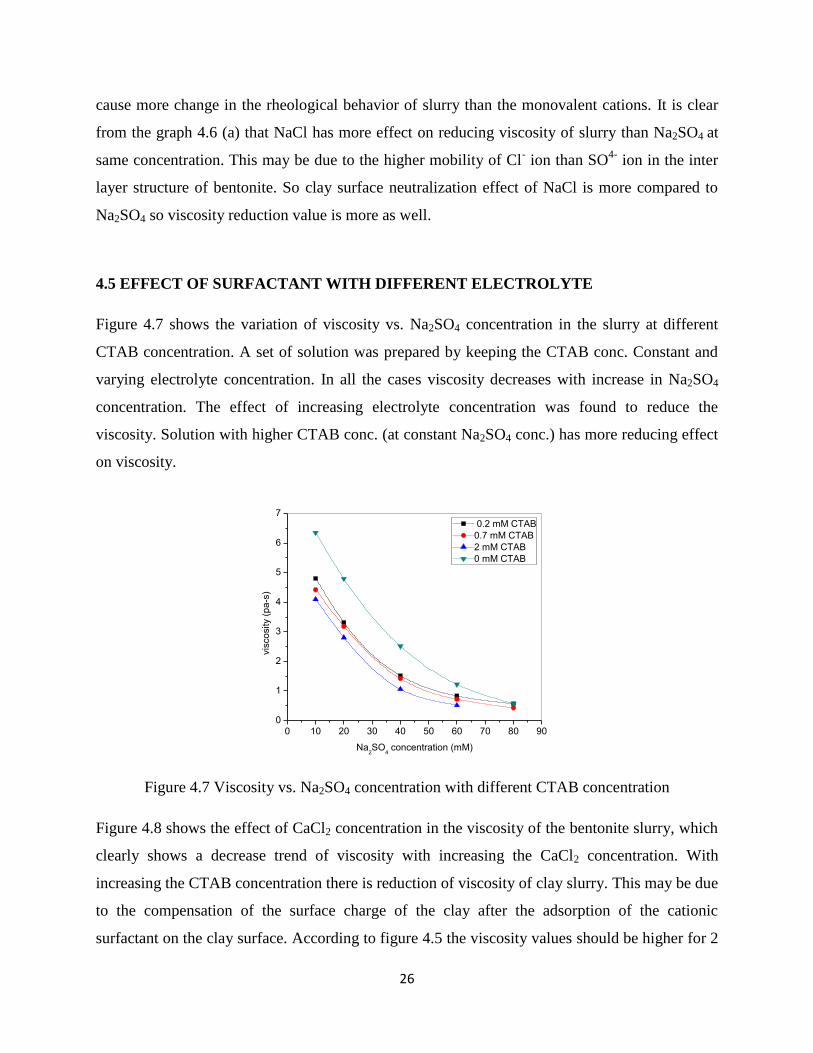
Figure 4.7 shows the variation of viscosity vs. Na2SO4 concentration in the slurry at different
CTAB concentration. A set of solution was prepared by keeping the CTAB conc. Constant and
varying electrolyte concentration. In all the cases viscosity decreases with increase in Na2SO4
concentration. The effect of increasing electrolyte concentration was found to reduce the
viscosity. Solution with higher CTAB conc. (at constant Na2SO4 conc.) has more reducing effect
on viscosity.
0 10 20 30 40 50 60 70 80 90
0
1
2
3
4
5
6
7
vis
co
sity (
pa
-s)
Na2SO
4 concentration (mM)
0.2 mM CTAB
0.7 mM CTAB
2 mM CTAB
0 mM CTAB
Figure 4.7 Viscosity vs. Na2SO4 concentration with different CTAB concentration
Figure 4.8 shows the effect of CaCl2 concentration in the viscosity of the bentonite slurry, which
clearly shows a decrease trend of viscosity with increasing the CaCl2 concentration. With
increasing the CTAB concentration there is reduction of viscosity of clay slurry. This may be due
to the compensation of the surface charge of the clay after the adsorption of the cationic
surfactant on the clay surface. According to figure 4.5 the viscosity values should be higher for 2
27
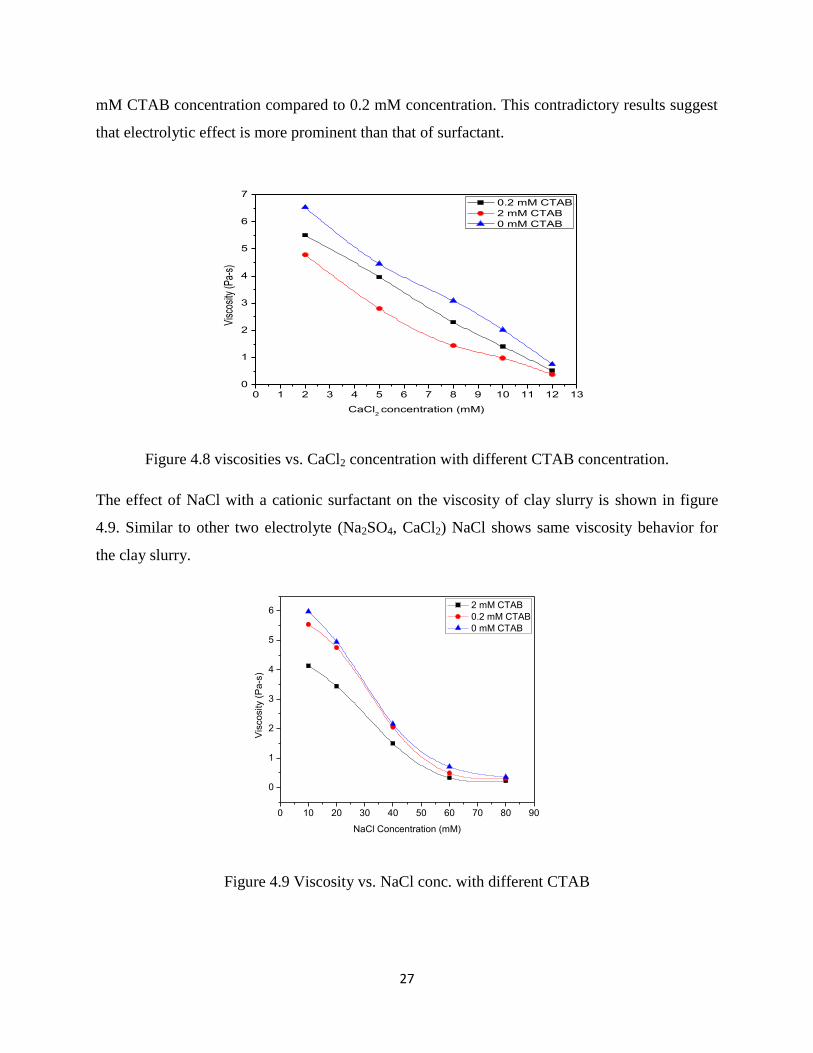
mM CTAB concentration compared to 0.2 mM concentration. This contradictory results suggest
that electrolytic effect is more prominent than that of surfactant.
Figure 4.8 viscosities vs. CaCl2 concentration with different CTAB concentration.
The effect of NaCl with a cationic surfactant on the viscosity of clay slurry is shown in figure
4.9. Similar to other two electrolyte (Na2SO4, CaCl2) NaCl shows same viscosity behavior for
the clay slurry.
Figure 4.9 Viscosity vs. NaCl conc. with different CTAB
0 1 2 3 4 5 6 7 8 9 10 11 12 13
0
1
2
3
4
5
6
7
Vis
cosi
ty (P
a-s)
CaCl2 concentration (mM)
0.2 mM CTAB
2 mM CTAB
0 mM CTAB
0 10 20 30 40 50 60 70 80 90
0
1
2
3
4
5
6
Vis
co
sity (
Pa
-s)
NaCl Concentration (mM)
2 mM CTAB
0.2 mM CTAB
0 mM CTAB
28
4.6 ZETA POTENTIAL OF BENTONITE PARTICLE
4.6.1 SURFACTANT MEDIUM
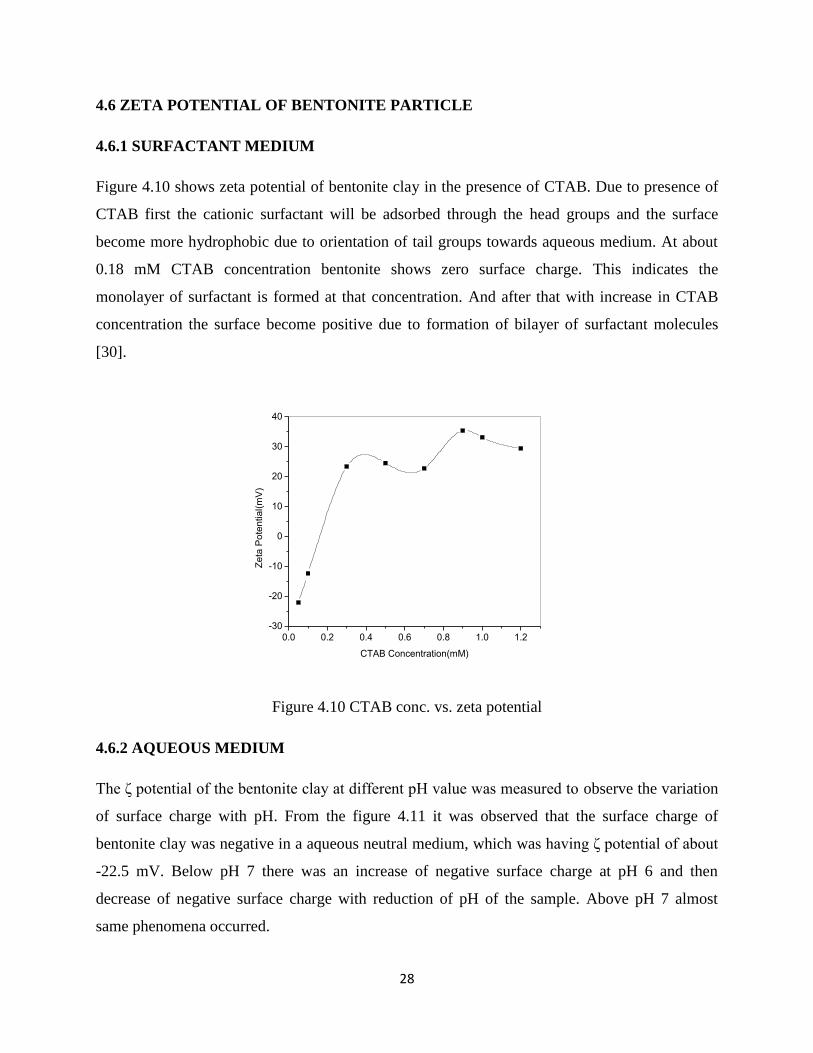
Figure 4.10 shows zeta potential of bentonite clay in the presence of CTAB. Due to presence of
CTAB first the cationic surfactant will be adsorbed through the head groups and the surface
become more hydrophobic due to orientation of tail groups towards aqueous medium. At about
0.18 mM CTAB concentration bentonite shows zero surface charge. This indicates the
monolayer of surfactant is formed at that concentration. And after that with increase in CTAB
concentration the surface become positive due to formation of bilayer of surfactant molecules
[30].
0.0 0.2 0.4 0.6 0.8 1.0 1.2
-30
-20
-10
0
10
20
30
40
Ze
ta P
ote
ntia
l(m
V)
CTAB Concentration(mM)
Figure 4.10 CTAB conc. vs. zeta potential
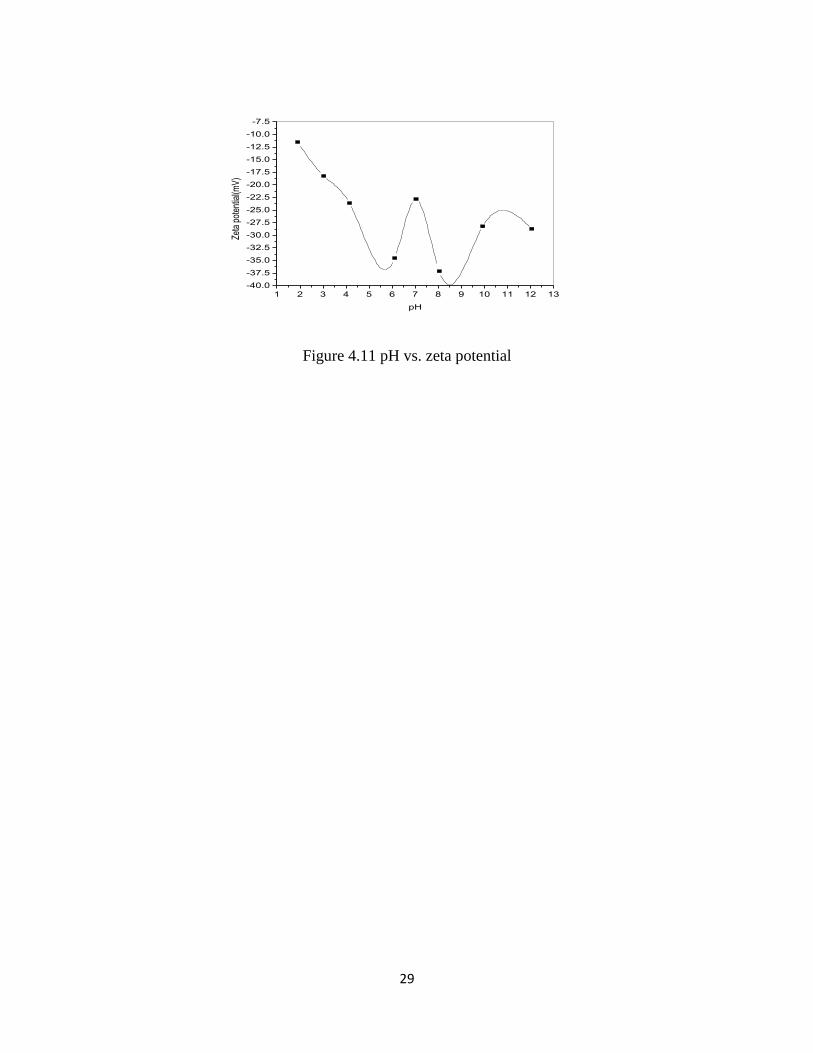
4.6.2 AQUEOUS MEDIUM
The ζ potential of the bentonite clay at different pH value was measured to observe the variation
of surface charge with pH. From the figure 4.11 it was observed that the surface charge of
bentonite clay was negative in a aqueous neutral medium, which was having ζ potential of about
-22.5 mV. Below pH 7 there was an increase of negative surface charge at pH 6 and then
decrease of negative surface charge with reduction of pH of the sample. Above pH 7 almost
same phenomena occurred.
29
1 2 3 4 5 6 7 8 9 10 11 12 13
-40.0
-37.5
-35.0
-32.5
-30.0
-27.5
-25.0
-22.5
-20.0
-17.5
-15.0
-12.5
-10.0
-7.5
Zeta
pot
entia
l(mV
)
pH
Figure 4.11 pH vs. zeta potential
30
CHAPTER 5
CONCLUSION
It was observed that the bentonite-water slurry viscosity increased with increasing clay
concentration solid content. Viscosity increases with time so this bentonite-water slurry is
rheopectic fluid in nature. At constant clay concentration viscosity of the slurry decreases with
increase in shear rate. In the presence of cationic surfactant CTAB viscosity initially decreases
below CMC, then viscosity increases to a maximum value and then decreases at a higher CTAB
concentration. The slurry viscosity decreases with increase in electrolyte concentration. Divalent
electrolytes are more effective than monovalent electrolyte. NaCl has more viscosity reducing
power than Na2SO4.This reduction in viscosity is due to change of surface charge due to
adsorption of additive on clay surface. When solution contains both electrolyte and CTAB
surfactant then viscosity of the slurry decreases from the individual viscosity values of either of
two due to cumulative effect of both.
31
REFERENCES
[1] Hunter, R.J., Adv. Colloid Interface. Sci. 17 (1982) 197.
[2] Grim, R.E., Clay Minerology, 2nd ed., McGraw-Hill, NY, 1968, pp. 596.
[3] Hofmann, U., Endell, K., Wilm, D., Kristallogr, Z., Mineralog. Petrogr., Abt.A 86 (1933)
340.
[4] Marshall, C.E., Kristallogr, Z., Mineralog. Petrogr., Abt. A 91 (1935) 433.
[5] H. Van Olphen, An Introduction to Clay Colloid Chemistry, 2nd ed., Interscience, NY, 1977,
pp. 318.
[6] Chen, S., Low, P.F., Cushman, J.H. , Soil Sci. SOC. Am. J. 51 (1987) 1444.
[7] Hunter, R.J., Foundations of Colloid Science, vol. I, Oxford Univ. Press, NY, 1986, pp. 673.
[8] Hassan, M.S., Abdel-Khalek, N.A., Appl. Clay Sci. 13 (1998), 99.
[9] Abu-Jdayil, B., Al-Malah, K., J. Reinforced Plastics Comp. 27 (2008) 1559.
[10] Abu-Jdayil, B., Al-Malah, K., Sawlaha, R., J. Reinforced Plastics Comp. 21 (2002) 1597.
[11] Yildiz, N., Sarikaya, Y., Calimli, A., Appl. Clay Sci. 14 (1999) 319.
[12] Tunc, S., Duman, O., A: Physicochem. Engg. Aspects 317 (2008) 93.
[13] Luckham, P.F., Rossi, S., Adv. Colloid Interface Sci. 82 (1999) 43.
[14] Kelessidis, V.C., Tsamantaki, C., Dalamarinis, P., Appl. Clay Sci. 38 (2007) 86.
[15] Liang, H.N., Long, Z., Zhang, H., Yang, S.H., Clays Clay Minerals 58 (2010) 311.
[16] Gungor, N., Appl. polymer sci.75 (2000) 107.
[17] İşçi, S., Günister, E., Alemdar, A., Ece, Ö.I., Güngör, N., Materials Letters 62 (2008) 81.
[18] Günister, E., Isçi, S., Öztekin, N., Bedia Erim, F., Isık Ece, Ö, Güngör, N., J. of Colloid
Interface Sci. 303 (2006) 137.
[19] Abend, S., Lagaly, G., Applied Clay Sci.16 (2000) 201.
32
[20] Ramos-Tejada, M.M., Arrovo, F.J., Peren, R., Duran, J.D.G., J. Colloid Interface Sci. 235
(2001) 251.
[21] Adachi, Y., Nakaishi, K., and Tamaki, M., J. Colloid interface sci. 198 (1998) 100.
[22] Abu-jdayil, B., International Journal of Mineral Processing 98 (2011) 208.
[23] Ece, Ö. I.; Alemdar, A.; Güngör, N.; Hayashi, S. J. Appl. Polymer Sci.. 86 (2002) 341.
[24] Tunc, S., Duman, O., Kanci, B., Colloids Surfaces A: Physicochem. Eng. Aspects 398
(2012) 37.
[25] İşçi, S., Güner, F., Ece, Ö.I., Güngör, N., Prog. Organic Coatings 54 (2005) 28.
[26] Alemdar, A., Atıcı, O., Gungor,N., Materials Letters 43 (2000). 57.
[27] Bartolo, R.G., Soap, in Encyclopedia of Chemical Technology, 4th ed, J.I. Kroschwitz,
Editor. 1993, Wiley Intersci. p. 297-326.
[28] Ancey, C.,” Introduction to fluid rheoloogy” ,version 1.0 of 4th
July 2005.
[29] McCabe, W L, Smith, J C., Harriott, P., “Unit Operations of Chemical Engineering”, Sixth
edition, (2001) McGraw-Hill Higher Eduation.
[30] Desai, H.,Biswal, N.R., Paria, S. Ind. Eng. Chem. Res. 49 (2010) 5400.