Embed Size (px)
Citation preview

RHB BOND FUND
ANNUAL REPORT 2021
For the financial year ended 30 September 2021

1
GENERAL INFORMATION ABOUT THE FUND
Name, Category and Type
Fund Name - RHB Bond Fund
Fund Category - Bond Fund
Fund Type - Income Fund
Investment Objective, Policy and Strategy
Objective of the Fund
To provide investors with higher than average income returns compared to fixed
deposits over the medium to long term through investments in bonds and other fixed
income securities with minimum risk to capital invested.
Strategy
The Fund will invest in quality fixed income securities which carry a minimum long
term credit rating of BBB and above assigned by Rating Agency of Malaysia Berhad
(“RAM”) or its equivalent. To contain credit risk, the Manager will ensure that the
diversification of credit rating (and duration standing) in the bond portfolio mitigates
the overall risk position of the portfolio.
The asset allocation of the Fund will be as follows:-
Up to 95% of
Net Asset Value
- Investments in bonds and other fixed income securities, of
which at least 60% of Net Asset Value will be invested in
bonds
Minimum of 5% of
Net Asset Value
- Investments in liquid assets
2
Performance Benchmark
Malayan Banking Berhad’s (“Maybank’s”) 12 Months Fixed Deposit Rate.
Permitted Investments
This Fund may invest in debentures traded in or under the rules of an eligible market;
warrants that carry the right in respect of a security traded in or under the rules of an
eligible market; unlisted securities including securities not listed or quoted on a stock
exchange but have been approved by the relevant regulatory authority for such listing
or quotation and are offered directly to the Fund by issuer; deposits with any financial
institutions and market instruments; financial derivatives; collective investment
schemes, structured products; and any other investments permitted by the Securities
Commission Malaysia from time to time.
Distribution Policy
Income (if any) will be distributed during the financial year.

3
MANAGER’S REPORT
MARKET REVIEW
During the period under review, on the local fixed income side, towards the final
quarter of the year 2020, bond market sentiment has skewed weaker since the no
Overnight Policy Rate (“OPR”) cut decision by Bank Negara Malaysia (“BNM”) at
its final meeting of the year on 3 November 2020. Looking ahead, curve steepening
pressure might prevail on supply dynamics point of view. Rising external yields will
inevitably weigh on Ringgit bonds when supply profile remains heavy while demand
faces headwinds. From the start of the year 2021, local bond yields have adjusted
higher on better risk sentiment as well as higher movement in United States Treasury
(“UST”) yields on reflationary trades arising from higher stimulus bill. Local markets
reopened after the lunar New Year break on a rather bearish note. Bonds were under
intense selling pressure amidst thin liquidity while tracking the movement on the
UST, coupled with the relaxation of Employees' Provident Fund ("EPF") withdrawals
through the i-Sinar program which further extended market cautiousness on potential
higher withdrawal that will further distress local yields. Nevertheless, towards the end
of the first quarter of year 2021 (“1Q21”), we started to see demand for the local
government securities emerging following decision of Financial Times Stock
Exchange (“FTSE”) Russell to retain Malaysia in the World Government Bond Index
(“WGBI”). This was positive news for the local bond market and it has lifted
sentiments especially from offshore investors’ perspective given the certainty now
and the risk of exclusion from the WGBI has now been completely removed. Local
government space saw the yields flatten towards the end of the month with the longer-
end bonds being sought after based on attractive valuation as a result of continuous
selling pressures since the start of the year.
In the third quarter of year 2021 (“3Q21”), the Malaysia Government Securities
(“MGS”) market overall was bearish arising from selloff across the yield curve.
Yields rose 12 basis points (“bps”) to 25bps higher for 10 years MGS and below
whereas for the 15-year to 30-year, yields went higher by 18bps and 6.5bps
respectively in the month of September 2021 alone. For the Malaysia Government
Investment Issue (“MGII”) yield curve, it also showed similar moves seen the MGS
space. Up to 10-year, MGII yields moved up by 17bps to 34bps. Beyond 10-years 15-
year and 30-year went up by 5bps and 6.5bps respectively in September 2021. MGII
3Y, 5Y, 7Y, 10Y, 15Y, 20Y and 30Y ended the month at 2.571%, 2.989%, 3.33%,
3.465%, 3.962%, 4.19% and 4.484% respectively.
All in all, overall curve of the 3-, 5-, 7-, 10-, 15-, 20- and 30-year MGS bear-flattened
during the period and closed at 2.45% (September 2020: 2.00%), 2.92% (2.24%),
3.30% (2.42%), 3.38% (2.65%), 3.89% (3.04%), 4.08% (3.37%) and 4.26% (3.84%)
respectively.
4
ECONOMIC OUTLOOK
On the local economic front, Malaysia’s Consumer Prices Index (“CPI”) for August
2021 moderated further from July’s +2.20% year-on-year (“YoY”) to +2.00%YoY,
where it was much lower than consensus of +2.20%. The increase was mainly due to
transport that went up +11.60%YoY where it has been a consistent trend in terms of
transport cost. This pattern of a decline in domestic inflation is consistent with the
overall inflation expectation that BNM envisage for the rest of year 2021 and
forecasted to be within the 2.00% to 3.00%.
On 9 Sep 2021, as expected, BNM maintained the OPR unchanged at +1.75%. In its
statement, it mentioned the balance of risks to the global growth outlook is tilted to
the downside. This is attributed mainly to uncertainty over the path of the pandemic
amid the emergence of variants of concern, and potential risk of heightened financial
market volatility amid adjustments in monetary policy in major economies.
Specifically, for Malaysia’s economy, the re-imposition of nation-wide containment
measures to curb the resurgence in COVID-19 cases had dampened the growth
momentum. The recent gradual relaxations for more economic sectors to operate,
however, along with higher adaptability of firms to the new operating environment
and continued policy support, would partly mitigate the impact and allow the
economy to resume its recovery path. Moving forward, the further easing of
containment measures, rapid progress of the domestic vaccination program and
continued expansion in global demand will support the growth momentum going into
year 2022.
REVIEW OF FUND PERFORMANCE DURING THE YEAR
For the financial year under review, the Fund has registered a return of -2.30%* in
net asset value terms while its benchmark, Maybank 12 Months Fixed Deposit Rate
which recorded a return of 1.85%*.
The Fund did not meet its objective for the year under review, however there could
be a resolution to one of the downgraded sukuks by the end of the year. RHB Bond
Fund declared a 3.75sen dividend on 28 September 2021.
* Source: Lipper Investment Management (“Lipper IM”), 05 October 2021
MARKET OUTLOOK AND STRATEGY GOING FORWARD
On the domestic front, BNM is likely to maintain the current level of OPR for a longer
period given the fact that Malaysia’s growth is still very much affected by the current
pandemic. On a more positive note, first dose/fully vaccinated ratio increased to
73.00%/63.10% of total population and 94.30%/87.60% of adult population end Sep,
getting closer to the 90.00% threshold for fully vaccinated adults for more easing of
restrictions such as interstate travel and tourism. Adolescent vaccination has been
5
progressing speedily and reached 55.70% first dose ratio in just two weeks, although
the fully vaccinated ratio is still low at 3.50%. Nationwide vaccination pace was
around 200-340k doses per day last week. National Intensive Care Unit (“ICU”) bed
utilization declined to 64.10% on 3 Oct (26 Sep: 72.20%) with only Penang (97.00%)
facing stressed capacity. Klang Valley ICU utilization rate dropped to c.67.00% (prior
week: 73.00%). Therefore, fourth quarter of year 2021 (“Q421”) growth should pick
up as more individuals continue to be vaccinated.
In the corporate bond space, we will remain selectively invested with the focus on
high quality credit for portfolio yield preservation and the attractiveness of the current
credit spread for selected issuances. We foresee that bonds/ or Sukuks would continue
to be demanded to boost income as policy rate would continue to stay unchanged for
a period of time; which also mean fixed deposit rates would stay low for the
foreseeable future.

6
PERFORMANCE DATA
Annual Total Returns
Financial Year Ended 30 September
2021
%
2020
%
2019
%
2018
%
2017
%
RHB Bond Fund
- Capital Return (6.30) 2.29 (0.74) (2.47) (2.68)
- Income Return 4.27 4.06 7.43 7.37 7.08
- Total Return (2.30) 6.44 6.64 4.71 4.21
Maybank’s 12 Months
Fixed Deposit Rate 1.85 2.53 3.26 3.27 3.09
Average Annual Returns
1 Year
30.09.2020-
30.09.2021
%
3 Years
30.09.2018-
30.09.2021
%
5 Years
30.09.2016-
30.09.2021
%
10 Years
30.09.2011-
30.09.2021
%
RHB Bond Fund (2.30) 3.51 3.89 5.43
Maybank’s 12 Months
Fixed Deposit Rate 1.85 2.54 2.80 3.00
7
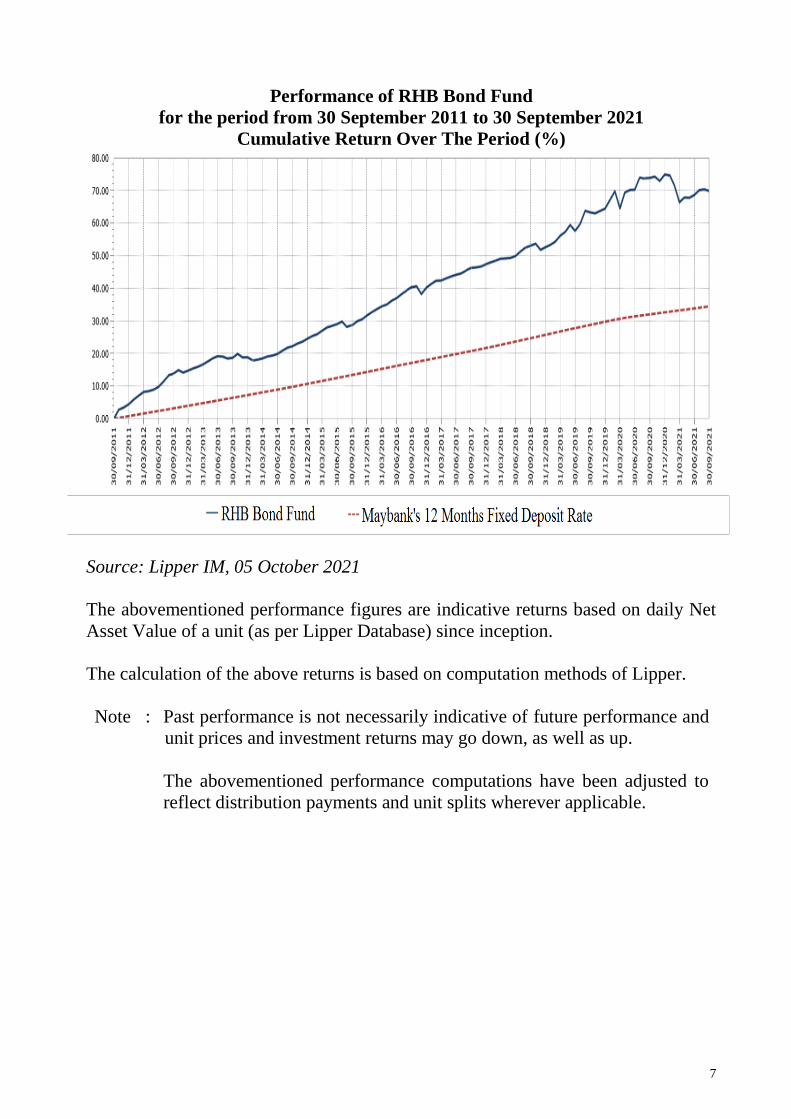
Performance of RHB Bond Fund
for the period from 30 September 2011 to 30 September 2021
Cumulative Return Over The Period (%)
Source: Lipper IM, 05 October 2021
The abovementioned performance figures are indicative returns based on daily Net
Asset Value of a unit (as per Lipper Database) since inception.
The calculation of the above returns is based on computation methods of Lipper.
Note : Past performance is not necessarily indicative of future performance and
unit prices and investment returns may go down, as well as up.
The abovementioned performance computations have been adjusted to
reflect distribution payments and unit splits wherever applicable.
8
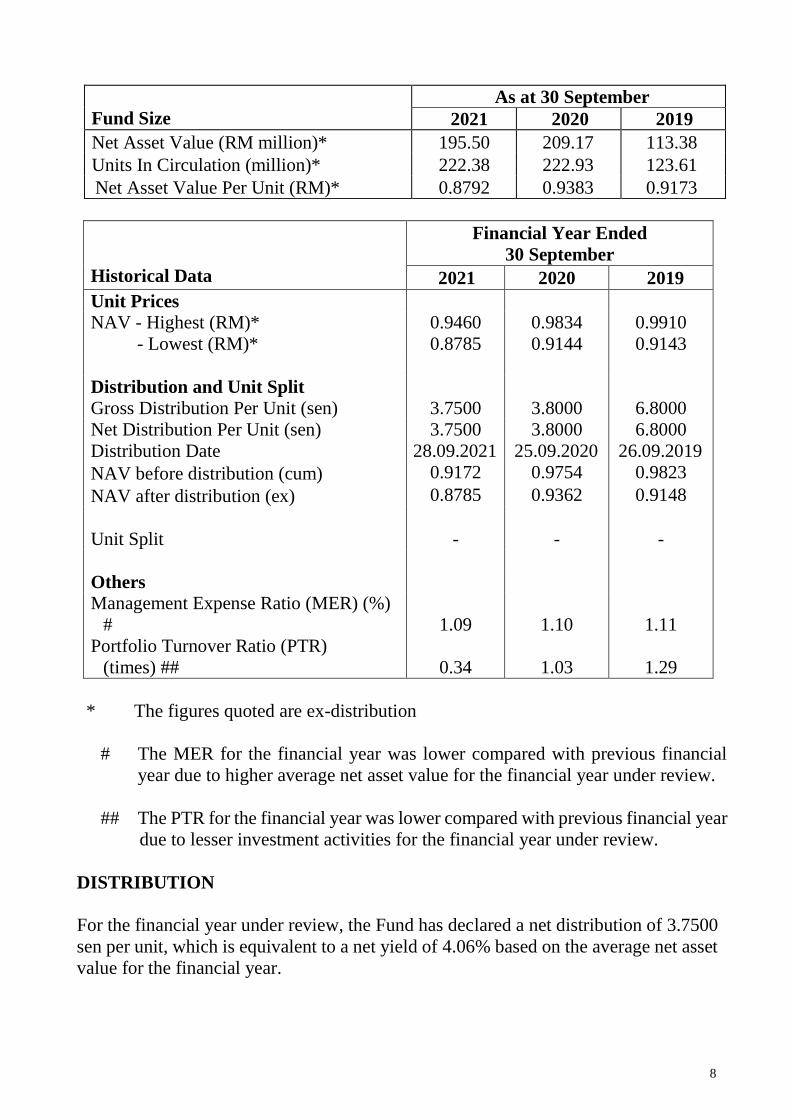
Fund Size
As at 30 September
2021 2020 2019
Net Asset Value (RM million)* 195.50 209.17 113.38
Units In Circulation (million)* 222.38 222.93 123.61
Net Asset Value Per Unit (RM)* 0.8792 0.9383 0.9173
Historical Data
Financial Year Ended
30 September
2021 2020 2019
Unit Prices
NAV - Highest (RM)* 0.9460 0.9834 0.9910
- Lowest (RM)* 0.8785 0.9144 0.9143
Distribution and Unit Split
Gross Distribution Per Unit (sen) 3.7500 3.8000 6.8000
Net Distribution Per Unit (sen) 3.7500 3.8000 6.8000
Distribution Date 28.09.2021 25.09.2020 26.09.2019
NAV before distribution (cum) 0.9172 0.9754 0.9823
NAV after distribution (ex) 0.8785 0.9362 0.9148
Unit Split - - -
Others
Management Expense Ratio (MER) (%)
# 1.09 1.10 1.11
Portfolio Turnover Ratio (PTR)
(times) ## 0.34 1.03 1.29
* The figures quoted are ex-distribution
# The MER for the financial year was lower compared with previous financial
year due to higher average net asset value for the financial year under review.
## The PTR for the financial year was lower compared with previous financial year
due to lesser investment activities for the financial year under review.
DISTRIBUTION
For the financial year under review, the Fund has declared a net distribution of 3.7500
sen per unit, which is equivalent to a net yield of 4.06% based on the average net asset
value for the financial year.

9
PORTFOLIO STRUCTURE
The asset allocations of the Fund as at reporting date were as follows:
As at 30 September
2021 2020 2019
Sectors % % %
Unquoted fixed income securities 89.69 94.44 100.46
Liquid assets and other net current
assets/(liabilities) 10.31 5.56 (0.46)*
100.00 100.00 100.00
The asset allocations have been structured to meet the Fund’s intended objective.
* The excess over 100% of net asset value is mainly attributable to distribution
payable, which has not been paid as at the reporting date.
BREAKDOWN OF UNIT HOLDINGS BY SIZE
Account Holders No. Of Units Held*
Size of Holdings No. % (‘000) %
5,000 and below 245 38.16 466 0.21
5,001 to 10,000 79 12.30 529 0.24
10,001 to 50,000 227 35.36 4,587 2.06
50,001 to 500,000 69 10.75 8,949 4.02
500,001 and above 22 3.43 207,841 93.47
Total 642 100.00 222,372 100.00
* Excluding Manager’s stock
10
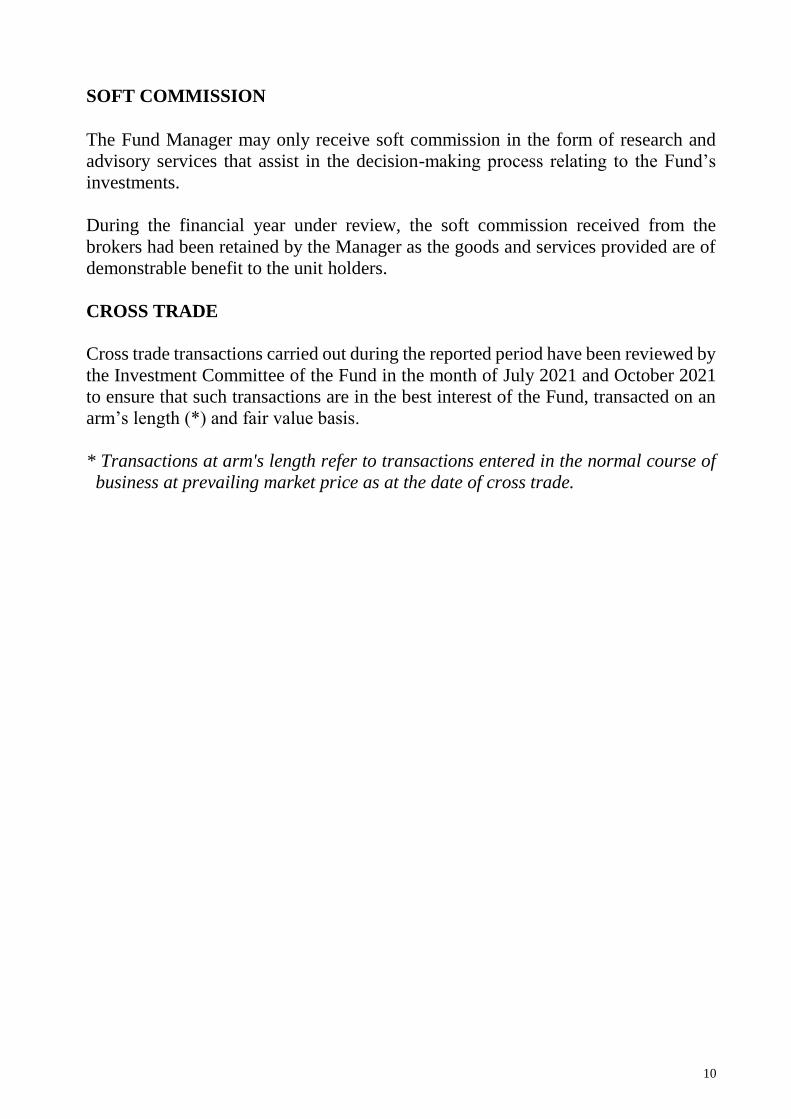
SOFT COMMISSION The Fund Manager may only receive soft commission in the form of research and
advisory services that assist in the decision-making process relating to the Fund’s
investments.
During the financial year under review, the soft commission received from the
brokers had been retained by the Manager as the goods and services provided are of
demonstrable benefit to the unit holders.
CROSS TRADE
Cross trade transactions carried out during the reported period have been reviewed by
the Investment Committee of the Fund in the month of July 2021 and October 2021
to ensure that such transactions are in the best interest of the Fund, transacted on an
arm’s length (*) and fair value basis.
* Transactions at arm's length refer to transactions entered in the normal course of
business at prevailing market price as at the date of cross trade.

11
RHB BOND FUND
STATEMENT OF FINANCIAL POSITION
AS AT 30 SEPTEMBER 2021
Note 2021 2020
RM RM
ASSETS
Bank balances 5 52,069 119,361
Deposits with licensed financial
institutions
5
28,629,672
20,257,132
Investments 6 175,351,158 197,536,870
Amount due from Manager 31,629 1,625,959
TOTAL ASSETS
204,064,528
219,539,322
LIABILITIES
Income distribution payable 8,338,883 8,405,579
Amount due to broker - 1,763,651
Amount due to Manager 25,497 -
Accrued management fee 169,516 174,224
Amount due to Trustee 13,561 13,938
Other payables and accruals 13,075 13,287
TOTAL LIABILITIES
8,560,532
10,370,679
NET ASSET VALUE 195,503,996 209,168,643
EQUITY
Unit holders’ capital 211,038,104 211,559,147
Accumulated losses (15,534,108) (2,390,504)
195,503,996
209,168,643
UNITS IN CIRCULATION (UNITS)
7
222,377,215
222,933,440
NET ASSET VALUE PER UNIT
(EX-DISTRIBUTION) (RM)
0.8792
0.9383
The accompanying notes are an integral part of the financial statements.

12
RHB BOND FUND
STATEMENT OF INCOME AND EXPENSES
FOR THE FINANCIAL YEAR ENDED 30 SEPTEMBER 2021
Note 2021 2020
RM RM
(LOSS)/INCOME
Interest income from deposits with
licensed financial institutions
305,699
264,185
Interest income from investments 9,076,223 6,630,528
Net (loss)/gain on investments 6 (11,835,519) 3,499,388
(2,453,597) 10,394,101
EXPENSES
Management fee 8 (2,159,983) (1,481,771)
Trustee’s fee 9 (172,799) (118,542)
Audit fee (9,275) (9,275)
Tax agent’s fee (3,800) (7,000)
Other expenses (5,267) (12,827)
(2,351,124)
(1,629,415)
Net (loss)/income before taxation (4,804,721) 8,764,686
Taxation 10 - -
Net (loss)/income after taxation
(4,804,721)
8,764,686
Net (loss)/income after taxation is made
up of the following:
Realised amount 7,993,558 8,318,475
Unrealised amount (12,798,279) 446,211
(4,804,721) 8,764,686
The accompanying notes are an integral part of the financial statements.

13
RHB BOND FUND
STATEMENT OF CHANGES IN NET ASSET VALUE
FOR THE FINANCIAL YEAR ENDED 30 SEPTEMBER 2021
Unit holders’
capital
Accumulated
losses
Total net
asset value
RM RM RM
Balance as at 1 October 2019 116,134,571 (2,749,611) 113,384,960
Movement in net asset value:
Net income after taxation - 8,764,686 8,764,686
Creation of units arising from
distributions
6,293,672
-
6,293,672
Creation of units arising from
applications
122,232,575
-
122,232,575
Cancellation of units (33,101,671) - (33,101,671)
Distributions (Note 11) - (8,405,579) (8,405,579)
Balance as at 30 September 2020
211,559,147
(2,390,504)
209,168,643
Balance as at 1 October 2020 211,559,147 (2,390,504) 209,168,643
Movement in net asset value:
Net loss after taxation - (4,804,721) (4,804,721)
Creation of units arising from
distributions
8,129,547
-
8,129,547
Creation of units arising from
applications
51,451,110
-
51,451,110
Cancellation of units (60,101,700) - (60,101,700)
Distributions (Note 11) - (8,338,883) (8,338,883)
Balance as at 30 September 2021
211,038,104
(15,534,108)
195,503,996
The accompanying notes are an integral part of the financial statements.
14
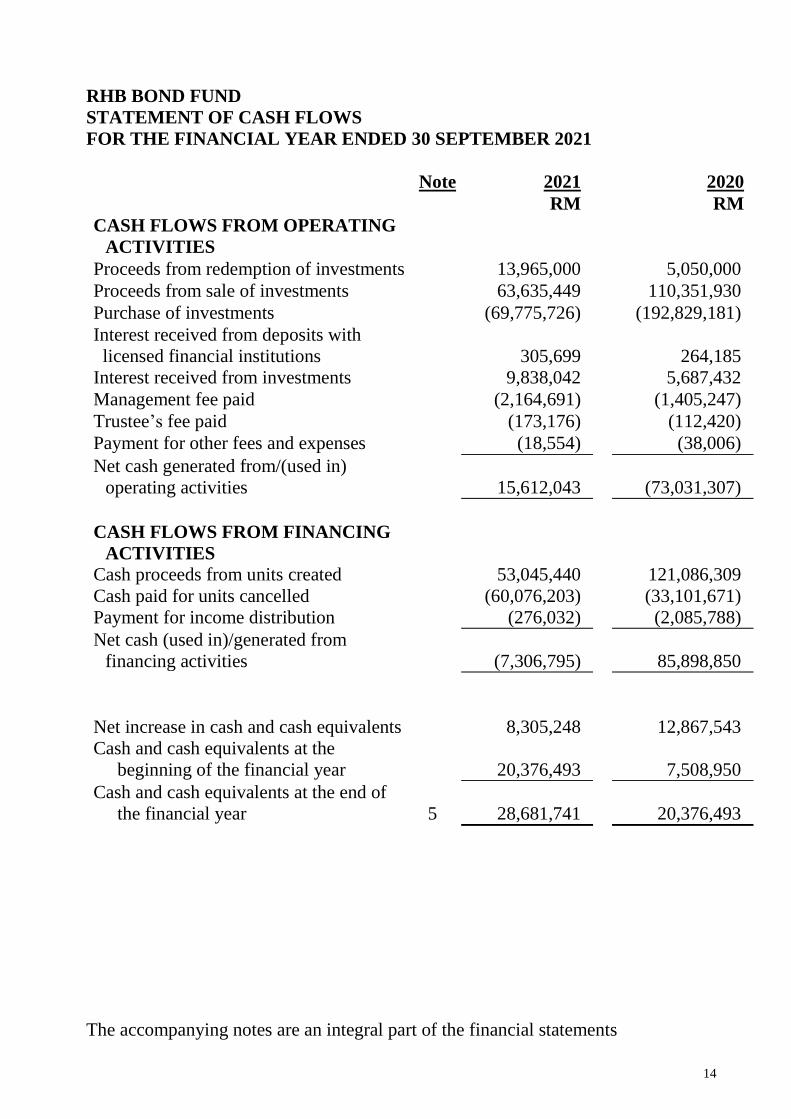
RHB BOND FUND
STATEMENT OF CASH FLOWS
FOR THE FINANCIAL YEAR ENDED 30 SEPTEMBER 2021
Note 2021 2020
RM RM
CASH FLOWS FROM OPERATING
ACTIVITIES
Proceeds from redemption of investments 13,965,000 5,050,000
Proceeds from sale of investments 63,635,449 110,351,930
Purchase of investments (69,775,726) (192,829,181)
Interest received from deposits with
licensed financial institutions
305,699
264,185
Interest received from investments 9,838,042 5,687,432
Management fee paid (2,164,691) (1,405,247)
Trustee’s fee paid (173,176) (112,420)
Payment for other fees and expenses (18,554) (38,006)
Net cash generated from/(used in)
operating activities
15,612,043
(73,031,307)
CASH FLOWS FROM FINANCING
ACTIVITIES
Cash proceeds from units created 53,045,440 121,086,309
Cash paid for units cancelled (60,076,203) (33,101,671)
Payment for income distribution (276,032) (2,085,788)
Net cash (used in)/generated from
financing activities
(7,306,795)
85,898,850
Net increase in cash and cash equivalents
8,305,248
12,867,543
Cash and cash equivalents at the
beginning of the financial year
20,376,493
7,508,950
Cash and cash equivalents at the end of
the financial year
5
28,681,741
20,376,493
The accompanying notes are an integral part of the financial statements
15
RHB BOND FUND
NOTES TO THE FINANCIAL STATEMENTS
FOR THE FINANCIAL YEAR ENDED 30 SEPTEMBER 2021
1. THE FUND, THE MANAGER AND THEIR PRINCIPAL ACTIVITIES
The RHB Bond Fund (hereinafter referred to as “the Fund”) was constituted pursuant
to the execution of a Master deed (conventional funds) dated 12 June 2008 as
amended via its supplemental master deed (conventional funds) dated 25 August
2008, second supplemental master deed (conventional funds) dated 12 December
2008, third supplemental master deed (conventional funds) dated 19 June 2009, fifth
supplemental master deed (conventional funds) dated 26 April 2010, sixth
supplemental master deed (conventional funds) dated 28 June 2010, ninth
supplemental master deed (conventional funds) dated 7 March 2012, tenth
supplemental master deed (conventional funds) dated 13 April 2012, fifteenth
supplemental master deed (conventional funds) dated 30 April 2013, sixteenth
supplemental master deed (conventional funds) dated 24 September 2013,
seventeenth supplemental master deed (conventional funds) dated 2 March 2015,
eighteenth supplemental master deed (conventional funds) dated 20 May 2015 and
nineteenth supplemental master deed (conventional funds) dated 3 August 2015
(collectively referred to as “the Deeds”) between RHB Asset Management Sdn Bhd
(“the Manager”) and HSBC (Malaysia) Trustee Berhad (“the Trustee”).
The Fund was launched on 10 October 1997 and will continue its operations until
terminated according to the conditions provided in the Deeds. The principal activity
of the Fund is to invest in Permitted Investments as defined in the Deeds, which
comprises fixed income securities, derivatives, all types of collective investment
schemes and any other form of investments as may be approved by the relevant
authorities from time to time.
All investments will be subject to the Securities Commission’s (“SC”) Malaysia
Guidelines on Unit Trust Funds, SC requirements, the Deeds, except where
exemptions or variations have been approved by the SC, internal policies and
procedures and objective of the Fund.
The main objective of the Fund is to provide investors with higher than average
income returns compared to fixed deposits over the medium to long term through
investments in bonds and other fixed income securities with minimum risk to capital
invested.
16
1. THE FUND, THE MANAGER AND THEIR PRINCIPAL ACTIVITIES
(CONTINUED)
The Manager, a company incorporated in Malaysia, is a wholly-owned subsidiary of
RHB Investment Bank Berhad, effective 6 January 2003. Its principal activities
include rendering of investment management services, management of unit trust
funds and private retirement schemes and provision of investment advisory services.
These financial statements were authorised for issue by the Manager on 24 November
2021.
2. SUMMARY OF SIGNIFICANT ACCOUNTING POLICIES
2.1 Basis of preparation of the financial statements
The financial statements have been prepared under the historical cost convention, as
modified by the revaluation of financial assets and financial liabilities (including
derivative instruments) at fair value through profit or loss, except those as disclosed
in the summary of significant accounting policies, and in accordance with Malaysian
Financial Reporting Standards (“MFRS”) and International Financial Reporting
Standards (“IFRS”).
The preparation of financial statements in conformity with MFRS and IFRS requires
the use of certain critical accounting estimates and assumptions that affect the
reported amounts of assets and liabilities and disclosure of contingent assets and
liabilities at the date of the financial statements, and the reported amounts of income
and expenses during the financial year. It also requires the Manager to exercise its
judgement in the process of applying the Fund’s accounting policies. Although these
estimates and judgement are based on the Manager’s best knowledge of current
events and actions, actual results may differ.
(a) The Fund has applied the following amendments and interpretations for the
first time for the financial year beginning on 1 October 2020:
The Conceptual Framework for Financial Reporting (“Framework”)
(effective 1 January 2020)
The Framework was revised with the primary purpose to assist the
International Accounting Standards Board (“IASB”) to develop IFRS that
are based on consistent concepts and enable preparers to develop
consistent accounting policies where an issue is not addressed by an IFRS.
17
2. SUMMARY OF SIGNIFICANT ACCOUNTING POLICIES
(CONTINUED)
2.1 Basis of preparation of the financial statements (continued)
(a) The Fund has applied the following amendments and interpretations for the
first time for the financial year beginning on 1 October 2020: (continued)
The Conceptual Framework for Financial Reporting (“Framework”)
(effective 1 January 2020) (continued)
Key changes include:
- increasing the prominence of stewardship in the objective of
financial reporting
- reinstating prudence as a component of neutrality
- defining a reporting entity, which may be a legal entity, or a portion
of an entity
- revising the definitions of an asset and a liability
- removing the probability threshold for recognition and adding
guidance on derecognition
- adding guidance on different measurement basis, and
- stating that profit or loss is the primary performance indicator and
that, in principle, income and expenses in other comprehensive
income should be recycled where this enhances the relevance or
faithful representation of the financial statements.
No changes are made to any of the current accounting standards. However,
entities that rely on the Framework in determining their accounting
policies for transactions, events or conditions that are not otherwise dealt
with under the accounting standards have to apply the revised Framework
from 1 October 2020.
Amendments to MFRS 101 and MFRS 108 ‘Definition of Material’
(effective 1 January 2020) clarify the definition of materiality and use a
consistent definition throughout MFRSs and the Conceptual Framework
for Financial Reporting.
The revised Framework and adoption of the amendments to published
standards did not have any impact on the current year or any prior period and
is not likely to affect future periods.
18
2. SUMMARY OF SIGNIFICANT ACCOUNTING POLICIES
(CONTINUED)
2.1 Basis of preparation of the financial statements (continued)
(b) A number of new standards, amendments to standards and interpretations are
effective for annual periods beginning after 1 October 2020, and have not been
early adopted in preparing these financial statements. None of these are
expected to have a material effect on the financial statements of the Fund.
2.2 Financial assets
Classification
The Fund classifies its financial assets in the following measurement categories:
• those to be measured subsequently at fair value through profit or loss
(“FVTPL”), and
• those to be measured at amortised cost.
The Fund classifies its investments based on both the Fund’s business model for
managing those financial assets and the contractual cash flow characteristics of the
financial assets. The portfolio of financial assets is managed and performance is
evaluated on a fair value basis. The Fund is primarily focused on fair value
information and uses that information to assess the assets’ performance and to make
decisions. The Fund has not taken the option to irrevocably designate any equity
securities as fair value through other comprehensive income. The contractual cash
flows of the Fund’s debt securities are solely principal and interest, however, these
securities are neither held for the purpose of collecting contractual cash flows nor
held both for collecting contractual cash flows and for sale. The collection of
contractual cash flows is only incidental to achieving the Fund’s business model’s
objective. Consequently, all investments are measured at fair value through profit or
loss.
The Fund classifies cash and cash equivalents and amount due from Manager as
financial assets measured at amortised cost as these financial assets are held to collect
contractual cash flows consisting of the amount outstanding.

19
2. SUMMARY OF SIGNIFICANT ACCOUNTING POLICIES
(CONTINUED)
2.2 Financial assets (continued)
Recognition and measurement
Regular purchases and sales of financial assets are recognised on the trade date - the
date on which the Fund commits to purchase or sell the asset. Financial assets and
financial liabilities at fair value through profit or loss are initially recognised at fair
value.
Financial assets are derecognised when the rights to receive cash flows from the
investments have expired or the Fund has transferred substantially all risks and
rewards of ownership.
Subsequent to initial recognition, all financial assets at fair value through profit or
loss are measured at fair value. Gains or losses arising from changes in the fair value
of the ‘financial assets at fair value through profit or loss’ category are presented in
statement of income and expenses in the period in which they arise.
Interest on debt securities at fair value through profit or loss is recognised in the
statement of income and expenses.
Unquoted fixed income securities denominated in Ringgit Malaysia are revalued on
a daily basis based on fair value prices quoted by a bond pricing agency (“BPA”)
registered with SC as per the SC Malaysia Guidelines on Unit Trust Funds.
Where such quotations are not available or where the Manager is of the view that the
price quoted by the BPA for a specific unquoted fixed income security differs from
the market price by more than 20 basis points, the Manager may use the market price,
provided that the Manager:
(i) Records its basis for using a non-BPA price;
(ii) Obtains necessary internal approvals to use the non-BPA price; and
(iii) Keeps an audit trail of all decisions and basis for adopting the market price.
Deposits with licensed financial institutions are stated at cost plus accrued interest
calculated on the effective interest method over the period from the date of placement
to the date of the statement of financial position, which is a reasonable estimate of
fair value due to the short-term nature of the deposits.
Financial assets at amortised cost are subsequently carried at amortised cost using the
effective interest method.

20
2. SUMMARY OF SIGNIFICANT ACCOUNTING POLICIES
(CONTINUED)
2.2 Financial assets (continued)
Impairment of financial assets
The Fund measures credit risk and expected credit losses using probability of default,
exposure at default and loss given default. Management considers both historical
analysis and forward-looking information in determining any expected credit loss.
Management considers the probability of default to be close to zero as these
instruments have a low risk of default and the counterparties have a strong capacity
to meet their contractual obligations in the near term. As a result, no loss allowance
has been recognised based on the 12-month expected credit losses as any such
impairment would be wholly insignificant to the Fund.
Significant increase in credit risk
A significant increase in credit risk is defined by management as any contractual
payment which is more than 30 days past due or a counterparty credit rating which
has fallen below BBB/Baa.
Definition of default and credit-impaired financial assets
Any contractual payment which is more than 90 days past due is considered credit
impaired.
Write-off
The Fund writes off financial assets, in whole or in part, when it has exhausted all
practical recovery efforts and has concluded there is no reasonable expectation of
recovery. The assessment of no reasonable expectation of recovery is based on the
unavailability of debtor’s sources of income or assets to generate sufficient future
cash flows to repay the amount. The Fund may write off financial assets that are still
subject to enforcement activity. Subsequent recoveries of amounts previously written
off will result in impairment gains. There are no write-offs/recoveries during the
financial year.

21
2. SUMMARY OF SIGNIFICANT ACCOUNTING POLICIES
(CONTINUED)
2.3 Financial liabilities
Financial liabilities are classified according to the substance of the contractual
arrangements entered into and the definitions of a financial liability.
Financial liabilities, within the scope of MFRS 9, are recognised in the statement of
financial position when, and only when, the Fund becomes a party to the contractual
provisions of the financial instrument.
The Fund’s financial liabilities which include income distribution payable, amount
due to broker, amount due to Manager, accrued management fee, amount due to
Trustee and other payables and accruals are recognised initially at fair value and
subsequently measured at amortised cost using the effective interest method.
A financial liability is derecognised when the obligation under the liability is
extinguished. Gains and losses are recognised in statement of income and expenses
when the liabilities are derecognised, and through the amortisation process.
2.4 Unit holders’ capital
The unit holders’ contributions to the Fund meet the criteria of the definition of
puttable instruments to be classified as equity instruments under MFRS 132
“Financial Instruments: Presentation”. Those criteria include:
• the units entitle the holder to a proportionate share of the Fund’s net asset value; • the units are the most subordinated class and class features are identical; • there is no contractual obligation to deliver cash or another financial asset other
than the obligation on the Fund to repurchase; and • the total expected cash flows from the units over its life are based substantially
on the statement of income and expenses of the Fund.
The outstanding units are carried at the redemption amount that is payable at each
financial period if unit holders exercise the right to put the units back to the Fund.
Units are created and cancelled at prices based on the Fund’s net asset value per unit
at the time of creation or cancellation. The Fund’s net asset value per unit is calculated
by dividing the net assets attributable to unit holders with the total number of
outstanding units.
22
2. SUMMARY OF SIGNIFICANT ACCOUNTING POLICIES
(CONTINUED)
2.5 Income recognition
Interest income from deposits with licensed financial institutions and unquoted fixed
income securities are recognised on an accrual basis using the effective interest
method.
Interest income is calculated by applying the effective interest rate to the gross
carrying amount of a financial asset except for financial assets that subsequently
become credit-impaired. For credit-impaired financial assets, the effective interest
rate is applied to the net carrying amount of the financial assets (after deduction of
the loss allowance).
Realised gain and loss on sale of unquoted fixed income securities are measured by
the difference between the net disposal proceeds and the carrying amounts of the
investments (adjusted for accretion of discount or amortisation of premium).
Net income or loss is the total of income less expenses.
2.6 Taxation
Current tax expense is determined according to Malaysian tax laws and includes all
taxes based upon the taxable income earned during the financial year.
2.7 Cash and cash equivalents
For the purpose of the statement of cash flows, cash and cash equivalents comprise
bank balances and deposits with licensed financial institutions which are subject to
an insignificant risk of changes in value.

23
2. SUMMARY OF SIGNIFICANT ACCOUNTING POLICIES
(CONTINUED)
2.8 Distribution
Distribution to the Fund’s unit holders is accounted for as a deduction from realised
reserves. A proposed distribution is recognised as a liability in the period in which it
is approved by the Trustee.
2.9 Amount due from/to brokers
Amounts due from/to brokers represent receivables for securities sold and payables
for securities purchased that have been contracted for but not yet settled or delivered
on the date of the statement of financial position respectively. The amount due from
brokers balance is held for collection.
These amounts are recognised initially at fair value and subsequently measured at
amortised cost. At each reporting date, the Fund shall measure the loss allowance on
amounts due from brokers at an amount equal to the lifetime expected credit losses
if the credit risk has increased significantly since initial recognition. If, at the
reporting date, the credit risk has not increased significantly since initial recognition,
the Fund shall measure the loss allowance at an amount equal to 12-month expected
credit losses. Significant financial difficulties of the broker, probability that the
broker will enter bankruptcy or financial reorganisation, and default in payments are
all considered indicators that a loss allowance may be required.
2.10 Presentation and functional currency
Items included in the financial statements of the Fund are measured using the
currency of the primary economic environment in which the Fund operates (the
“functional currency”). The financial statements are presented in Ringgit Malaysia
(“RM”), which is the Fund’s presentation and functional currency.

24
3. FINANCIAL RISK MANAGEMENT OBJECTIVES AND POLICIES
The Fund is exposed to a variety of risks, which include price risk, interest rate risk,
credit risk, liquidity risk and capital risk.
Financial risk management is carried out through internal control processes adopted
by the Manager and adherence to the investment restrictions as stipulated in the SC
Malaysia Guidelines on Unit Trust Funds.
Price risk
Price risk is the risk that the fair value of the investments of the Fund will fluctuate
because of changes in market prices (other than those arising from interest rate risk).
The Fund is exposed to price risk arising from interest rate risk in relation to its
investments of RM175,351,158 (2020: RM197,536,870) in unquoted fixed income
securities. The Fund’s exposure to prise risk arising from interest rate risk and the
related sensitivity analysis are disclosed in “Interest rate risk” below.
Interest rate risk
In general, when interest rates rise, unquoted fixed income securities prices will tend
to fall and vice versa. Therefore, the net asset value of the Fund may also tend to fall
when interest rates rise or are expected to rise. However, investors should be aware
that should the Fund hold an unquoted fixed income security till maturity, such price
fluctuations would dissipate as it approaches maturity, and thus the growth of the net
asset value shall not be affected at maturity. In order to mitigate interest rates
exposure of the Fund, the Manager will manage the duration of the portfolio via
shorter or longer tenured assets depending on the view of the future interest rate trend
of the Manager, which is based on its continuous fundamental research and analysis.
This risk is crucial since bond portfolio management depends on forecasting interest
rate movements. Bonds with longer maturity and lower yield coupon rates are more
susceptible to interest rate movements.
25
3. FINANCIAL RISK MANAGEMENT OBJECTIVES AND POLICIES
(CONTINUED)
Interest rate risk (continued)
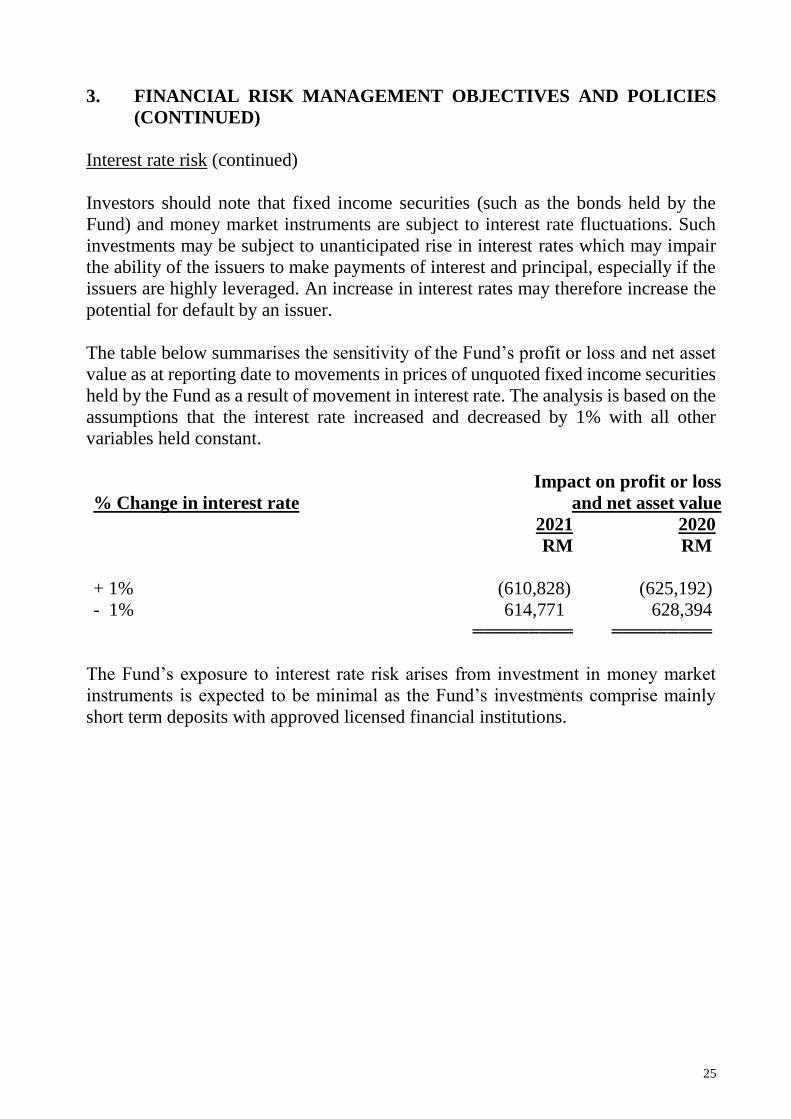
Investors should note that fixed income securities (such as the bonds held by the
Fund) and money market instruments are subject to interest rate fluctuations. Such
investments may be subject to unanticipated rise in interest rates which may impair
the ability of the issuers to make payments of interest and principal, especially if the
issuers are highly leveraged. An increase in interest rates may therefore increase the
potential for default by an issuer.
The table below summarises the sensitivity of the Fund’s profit or loss and net asset
value as at reporting date to movements in prices of unquoted fixed income securities
held by the Fund as a result of movement in interest rate. The analysis is based on the
assumptions that the interest rate increased and decreased by 1% with all other
variables held constant.
% Change in interest rate
Impact on profit or loss
and net asset value 2021 2020
RM RM
+ 1% (610,828) (625,192)
- 1% 614,771 628,394
═════════ ═════════
The Fund’s exposure to interest rate risk arises from investment in money market
instruments is expected to be minimal as the Fund’s investments comprise mainly
short term deposits with approved licensed financial institutions.
26
3. FINANCIAL RISK MANAGEMENT OBJECTIVES AND POLICIES
(CONTINUED)
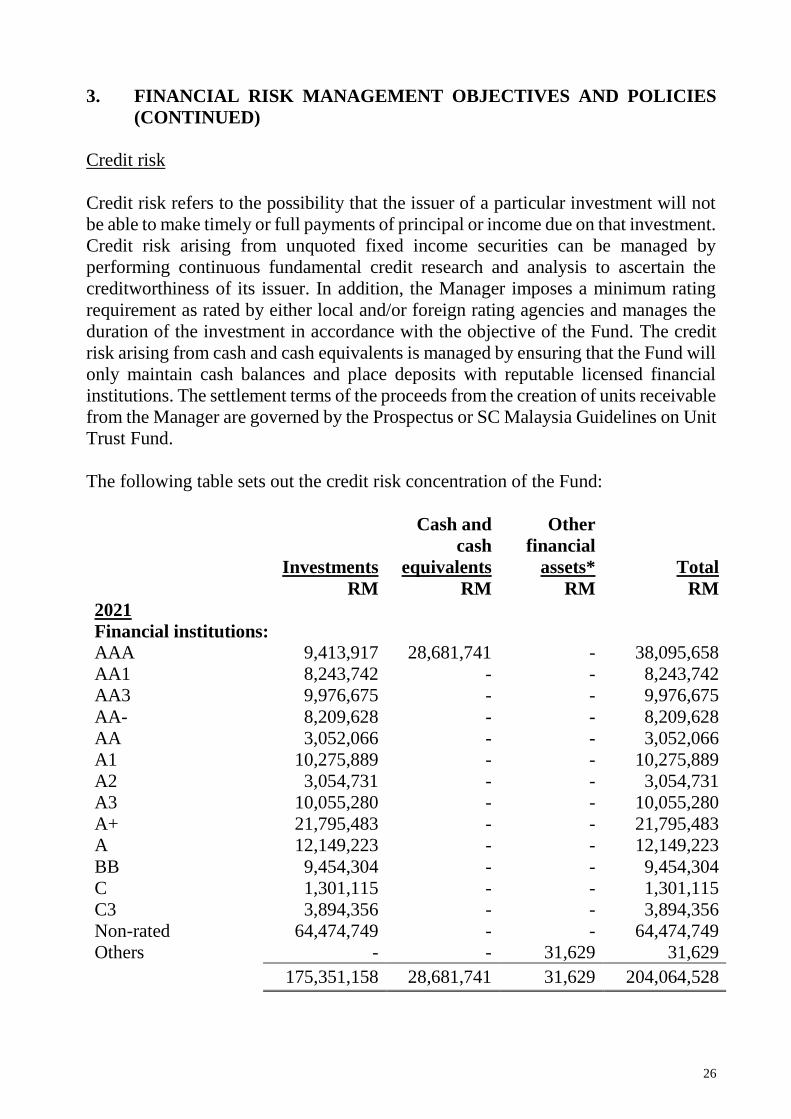
Credit risk
Credit risk refers to the possibility that the issuer of a particular investment will not
be able to make timely or full payments of principal or income due on that investment.
Credit risk arising from unquoted fixed income securities can be managed by
performing continuous fundamental credit research and analysis to ascertain the
creditworthiness of its issuer. In addition, the Manager imposes a minimum rating
requirement as rated by either local and/or foreign rating agencies and manages the
duration of the investment in accordance with the objective of the Fund. The credit
risk arising from cash and cash equivalents is managed by ensuring that the Fund will
only maintain cash balances and place deposits with reputable licensed financial
institutions. The settlement terms of the proceeds from the creation of units receivable
from the Manager are governed by the Prospectus or SC Malaysia Guidelines on Unit
Trust Fund.
The following table sets out the credit risk concentration of the Fund:
Investments
RM
Cash and
cash
equivalents
RM
Other
financial
assets*
RM
Total
RM
2021
Financial institutions:
AAA 9,413,917 28,681,741 - 38,095,658
AA1 8,243,742 - - 8,243,742
AA3 9,976,675 - - 9,976,675
AA- 8,209,628 - - 8,209,628
AA 3,052,066 - - 3,052,066
A1 10,275,889 - - 10,275,889
A2 3,054,731 - - 3,054,731
A3 10,055,280 - - 10,055,280
A+ 21,795,483 - - 21,795,483
A 12,149,223 - - 12,149,223
BB 9,454,304 - - 9,454,304
C 1,301,115 - - 1,301,115
C3 3,894,356 - - 3,894,356
Non-rated 64,474,749 - - 64,474,749
Others - - 31,629 31,629
175,351,158 28,681,741 31,629 204,064,528

27
3. FINANCIAL RISK MANAGEMENT OBJECTIVES AND POLICIES
(CONTINUED)
Credit risk (continued)
The following table sets out the credit risk concentration of the Fund: (continued)
Investments
RM
Cash and
cash
equivalents
RM
Other
financial
assets*
RM
Total
RM
2020
Financial institutions:
AAA 6,550,459 20,376,493 - 26,926,952
AA1 8,919,895 - - 8,919,895
AA2 1,093,129 - - 1,093,129
AA3 14,226,862 - - 14,226,862
AA- 17,348,106 - - 17,348,106
A1 19,331,080 - - 19,331,080
A3 11,703,816 - - 11,703,816
A+ 26,473,229 - - 26,473,229
A 15,410,352 - - 15,410,352
BB1 5,812,488 - - 5,812,488
Non-rated 70,667,454 - - 70,667,454
Others - - 1,625,959 1,625,959
197,536,870 20,376,493 1,625,959 219,539,322
* Comprise amount due from Manager.

28
3. FINANCIAL RISK MANAGEMENT OBJECTIVES AND POLICIES
(CONTINUED)
Liquidity risk
Liquidity risk is the risk that the Fund will encounter difficulty in meeting its financial
obligations.
Liquidity risk exists when particular investments are difficult to sell, possibly
preventing the Fund from selling such illiquid securities at an advantageous time or
price. Unit trust funds with principal investment strategies that involve securities or
securities with substantial market and/or credit risk tend to have the greater exposure
to liquidity risk. As part of its risk management, the Manager will attempt to manage
the liquidity of the Fund through asset allocation and diversification strategies within
the portfolio. The Manager will also conduct constant fundamental research and
analysis to forecast future liquidity of its investments.
The table below summarises the Fund’s financial liabilities into relevant maturity
groupings based on the remaining period from the statement of financial position date
to the contractual maturity date. The amounts in the table are the contractual
undiscounted cash flows.
Between
Less than 1 month
1 month to 1 year
RM RM
2021
Income distribution payable 8,338,883 -
Amount due to Manager 25,497 -
Accrued management fee 169,516 -
Amount due to Trustee 13,561 -
Other payables and accruals - 13,075 ───────── ───────── 8,547,457 13,075 ═════════ ═════════
2020
Income distribution payable 8,405,579 -
Amount due to brokers 1,763,651 -
Accrued management fee 174,224 -
Amount due to Trustee 13,938 -
Other payables and accruals - 13,287 ───────── ───────── 10,357,392 13,287 ═════════ ═════════

29
3. FINANCIAL RISK MANAGEMENT OBJECTIVES AND POLICIES
(CONTINUED)
Capital risk
The capital of the Fund is represented by equity consisting of unit holders’ capital of
RM211,038,104 (2020: RM211,559,147) and accumulated losses of RM15,534,108
(2020: RM2,390,504). The amount of equity can change significantly on a daily basis
as the Fund is subject to daily subscriptions and redemptions at the discretion of unit
holders. The Fund’s objective when managing capital is to safeguard the Fund’s
ability to continue as a going concern in order to provide returns for unit holders and
benefits for other stakeholders and to maintain a strong capital base to support the
development of the investment activities of the Fund.
4. FAIR VALUE ESTIMATION
Fair value is defined as the price that would be received to sell an asset or paid to
transfer a liability in an orderly transaction between market participants at the
measurement date (i.e. an exit price).
The fair value of financial assets traded in an active market (such as publicly traded
derivatives and trading securities) are based on quoted market prices at the close of
trading on the financial year end date.
An active market is a market in which transactions for the assets or liabilities take
place with sufficient frequency and volume to provide pricing information on an
ongoing basis.
The fair value of financial assets that are not traded in an active market is determined
by using valuation techniques. The Fund uses a variety of methods and makes
assumptions that are based on market conditions existing at each financial year end
date. Valuation techniques used for non-standardised financial instruments such as
options, currency swaps and other over-the-counter derivatives, include the use of
comparable recent transactions, reference to other instruments that are substantially
the same, discounted cash flow analysis, option pricing models and other valuation
techniques commonly used by market participants making the maximum use of
market inputs and relying as little as possible on entity-specific inputs.
30
4. FAIR VALUE ESTIMATION (CONTINUED)
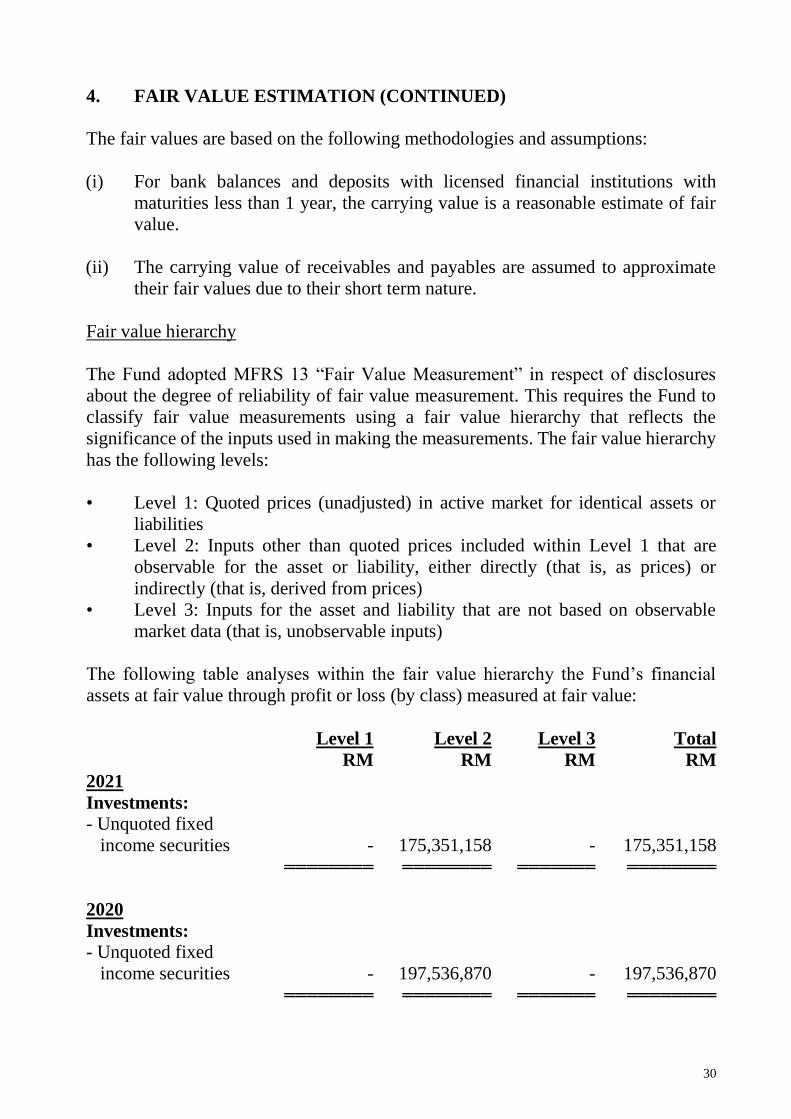
The fair values are based on the following methodologies and assumptions:
(i) For bank balances and deposits with licensed financial institutions with
maturities less than 1 year, the carrying value is a reasonable estimate of fair
value.
(ii) The carrying value of receivables and payables are assumed to approximate
their fair values due to their short term nature.
Fair value hierarchy
The Fund adopted MFRS 13 “Fair Value Measurement” in respect of disclosures
about the degree of reliability of fair value measurement. This requires the Fund to
classify fair value measurements using a fair value hierarchy that reflects the
significance of the inputs used in making the measurements. The fair value hierarchy
has the following levels:
• Level 1: Quoted prices (unadjusted) in active market for identical assets or
liabilities
• Level 2: Inputs other than quoted prices included within Level 1 that are
observable for the asset or liability, either directly (that is, as prices) or
indirectly (that is, derived from prices)
• Level 3: Inputs for the asset and liability that are not based on observable
market data (that is, unobservable inputs)
The following table analyses within the fair value hierarchy the Fund’s financial
assets at fair value through profit or loss (by class) measured at fair value:
Level 1 Level 2 Level 3 Total
RM RM RM RM
2021
Investments:
- Unquoted fixed
income securities - 175,351,158 - 175,351,158 ════════ ════════ ═══════ ════════
2020
Investments:
- Unquoted fixed
income securities - 197,536,870 - 197,536,870 ════════ ════════ ═══════ ════════

31
4. FAIR VALUE ESTIMATION (CONTINUED)
Financial instruments that trade in markets that are considered to be active but are
valued based on quoted market prices, dealer quotations or alternative pricing sources
supported by observable inputs are classified within Level 2. This include unquoted
fixed income securities. As Level 2 instruments include positions that are not traded in
active markets and/or are subject to transfer restrictions, valuations may be adjusted to
reflect illiquidity and/or non-transferability, which are generally based on available
market information. The Fund’s policies on valuation of these financial assets are
stated in Note 2.2.
5. CASH AND CASH EQUIVALENTS
Cash and cash equivalents comprise:
2021 2020
RM RM
Bank balances 52,069 119,361
Deposits with licensed financial
institutions
28,629,672
20,257,132
28,681,741 20,376,493
6. INVESTMENTS
2021 2020
RM RM
Investments:
- Unquoted fixed income securities 175,351,158 197,536,870
2021 2020
RM RM
Net (loss)/gain on investments comprised:
- Net realised gain on sale of investments 1,157,335 3,225,776
- Net unrealised (loss)/gain on changes in fair
value
(12,992,854)
273,612
(11,835,519) 3,499,388
32
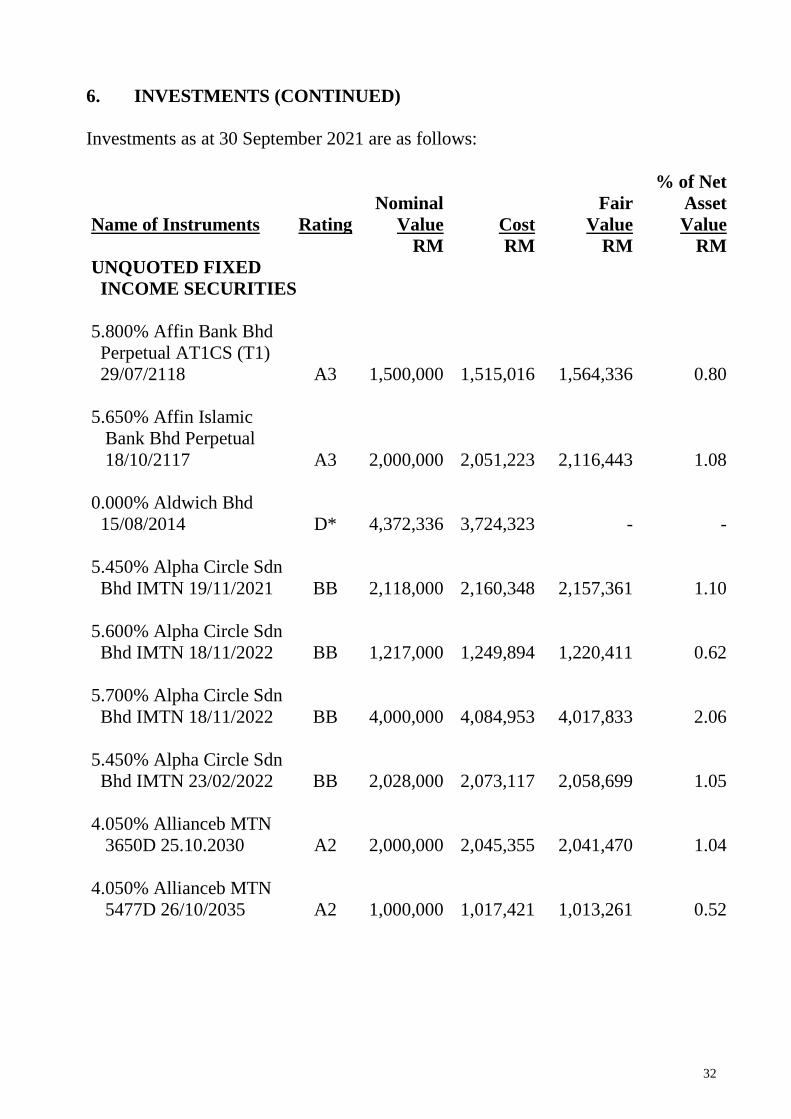
6. INVESTMENTS (CONTINUED)
Investments as at 30 September 2021 are as follows:
Name of Instruments Rating
Nominal
Value Cost
Fair
Value
% of Net
Asset
Value
RM RM RM RM
UNQUOTED FIXED
INCOME SECURITIES
5.800% Affin Bank Bhd
Perpetual AT1CS (T1)
29/07/2118 A3
1,500,000
1,515,016
1,564,336
0.80
5.650% Affin Islamic
Bank Bhd Perpetual
18/10/2117 A3
2,000,000
2,051,223
2,116,443
1.08
0.000% Aldwich Bhd
15/08/2014 D*
4,372,336
3,724,323
-
-
5.450% Alpha Circle Sdn
Bhd IMTN 19/11/2021 BB
2,118,000
2,160,348
2,157,361
1.10
5.600% Alpha Circle Sdn
Bhd IMTN 18/11/2022 BB
1,217,000
1,249,894
1,220,411
0.62
5.700% Alpha Circle Sdn
Bhd IMTN 18/11/2022 BB
4,000,000
4,084,953
4,017,833
2.06
5.450% Alpha Circle Sdn
Bhd IMTN 23/02/2022 BB
2,028,000
2,073,117
2,058,699
1.05
4.050% Allianceb MTN
3650D 25.10.2030 A2
2,000,000
2,045,355
2,041,470
1.04
4.050% Allianceb MTN
5477D 26/10/2035 A2
1,000,000
1,017,421
1,013,261
0.52

33
6. INVESTMENTS (CONTINUED)
Investments as at 30 September 2021 are as follows: (continued)
Name of Instruments Rating
Nominal
Value Cost
Fair
Value
% of Net
Asset
Value
RM RM RM RM
UNQUOTED FIXED
INCOME SECURITIES
(CONTINUED)
5.430% Aquasar IMTN
18/07/2029 AAA
3,000,000
3,403,713
3,373,766
1.73
MEX I Capital Bhd (f.k.a
Bright Focus Bhd –
5.200% (24/01/2024) C3**
1,700,000
1,685,167
1,336,345
0.68
MEX I Capital Bhd (f.k.a
Bright Focus Bhd -
2.500% (24/01/2030) C3**
4,000,000
3,292,137
1,211,916
0.62
MEX I Capital Bhd (f.k.a
Bright Focus Bhd -
2.500% (22/01/2031) C3**
5,000,000
3,700,669
1,346,095
0.69
5.400% CIMB Group
Holdings Bhd Perpetual
Capital Securities (T3)
25/05/2116 A1
1,000,000
1,023,819
1,062,499
0.54
4.000% CIMB Group
Holdings Bhd (Tranche
6) 25/05/2116 A1
2,000,000
2,026,301
1,965,741
1.01
3.420% Danum Capital
Berhad IMTN
(Tranche 5) 21/02/2035 AAA
1,000,000
1,003,654
927,854
0.47
34
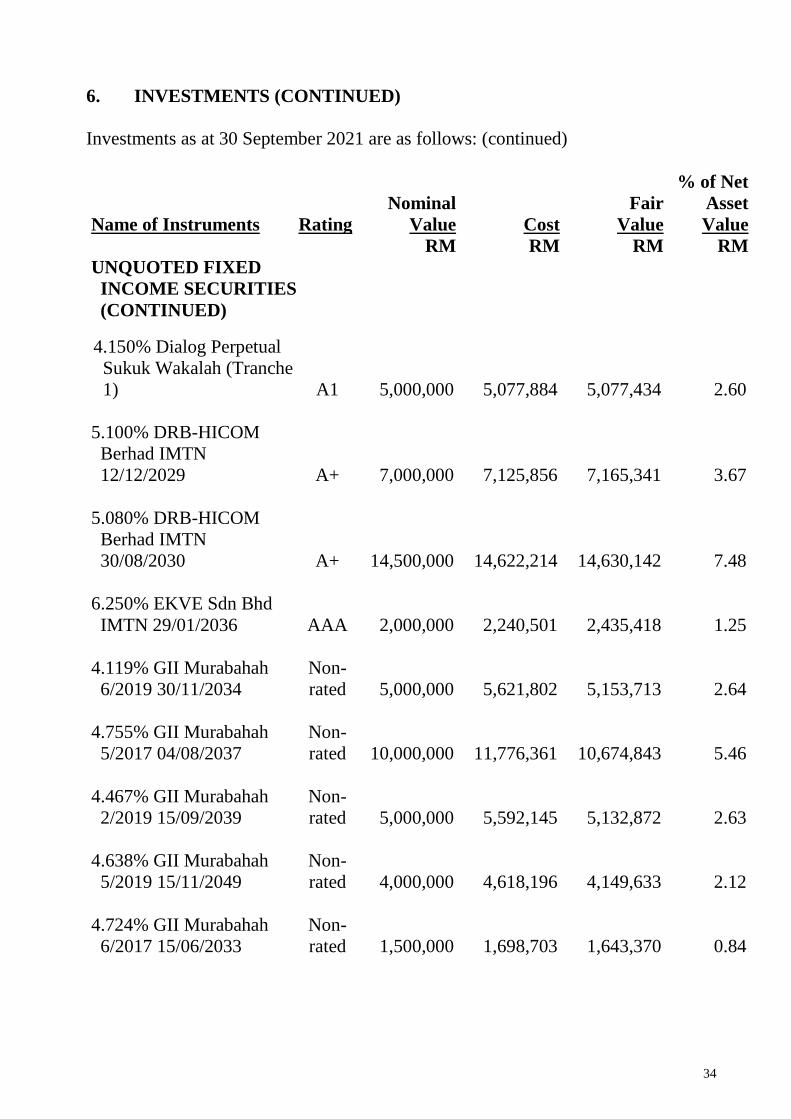
6. INVESTMENTS (CONTINUED)
Investments as at 30 September 2021 are as follows: (continued)
Name of Instruments Rating
Nominal
Value Cost
Fair
Value
% of Net
Asset
Value
RM RM RM RM
UNQUOTED FIXED
INCOME SECURITIES
(CONTINUED)
4.150% Dialog Perpetual
Sukuk Wakalah (Tranche
1) A1
5,000,000
5,077,884
5,077,434
2.60
5.100% DRB-HICOM
Berhad IMTN
12/12/2029 A+
7,000,000
7,125,856
7,165,341
3.67
5.080% DRB-HICOM
Berhad IMTN
30/08/2030 A+
14,500,000
14,622,214
14,630,142
7.48
6.250% EKVE Sdn Bhd
IMTN 29/01/2036 AAA
2,000,000
2,240,501
2,435,418
1.25
4.119% GII Murabahah
6/2019 30/11/2034
Non-
rated
5,000,000
5,621,802
5,153,713
2.64
4.755% GII Murabahah
5/2017 04/08/2037
Non-
rated
10,000,000
11,776,361
10,674,843
5.46
4.467% GII Murabahah
2/2019 15/09/2039
Non-
rated
5,000,000
5,592,145
5,132,872
2.63
4.638% GII Murabahah
5/2019 15/11/2049
Non-
rated
4,000,000
4,618,196
4,149,633
2.12
4.724% GII Murabahah
6/2017 15/06/2033
Non-
rated
1,500,000
1,698,703
1,643,370
0.84

35
6. INVESTMENTS (CONTINUED)
Investments as at 30 September 2021 are as follows: (continued)
Name of Instruments Rating
Nominal
Value Cost
Fair
Value
% of Net
Asset
Value
RM RM RM RM
UNQUOTED FIXED
INCOME SECURITIES
(CONTINUED)
4.820% Hong Leong
Financial Group Bhd
Perpetual Capital
Securities (Tranche 2)
29/03/2024 A1
1,000,000
1,000,264
1,027,204
0.53
5.300% LESB IMTN
(Series 18) 16/07/2038 AA-
2,000,000
2,022,362
1,951,522
1.00
3.885% Malaysian
Government
Securities 2/2019
15/08/2029
Non-
rated
500,000
551,051
519,941
0.27
4.893% Malaysian
Government Securities
08/06/2038
Non-
rated
8,000,000
9,303,838
8,852,913
4.53
5.050% MBSB Bank
IMTN 20/12/2029 A3
3,000,000
3,168,987
3,170,737
1.62
5.250% MBSB Bank
IMTN 19/12/2031 A3
3,000,000
3,044,014
3,203,764
1.64
6.000% MEX II Sdn Bhd
IMTN 29/04/2030 C***
1,800,000
1,841,955
750,533
0.38
6.300% MEX II Sdn Bhd
IMTN 29/04/2033 C***
1,500,000
1,768,201
550,582
0.28

36
6. INVESTMENTS (CONTINUED)
Investments as at 30 September 2021 are as follows: (continued)
Name of Instruments Rating
Nominal
Value Cost
Fair
Value
% of Net
Asset
Value
RM RM RM RM
UNQUOTED FIXED
INCOME SECURITIES
(CONTINUED)
4.000% Press Metal
IMTN 15/08/2025 AA3
5,000,000
5,024,657
5,049,958
2.58
2.632% Malaysian
Government Securities
2/2020 15/04/2031
Non-
rated
7,700,000
7,553,176
7,339,280
3.75
3.478% Malaysian
Government Securities
3/2019 14/06/2024
Non-
rated
2,000,000
2,078,647
2,074,716
1.06
4.642% Malaysian
Government Securities
07/11/2033
Non-
rated
2,500,000
2,937,750
2,724,781
1.39
4.921% Malaysian
Government Securities
06/07/2048
Non-
rated
4,000,000
4,862,785
4,405,616
2.25
3.828% Malaysian
Government Securities
4/2019 05/07/2034
Non-
rated
5,000,000
5,218,491
4,996,146
2.56
3.757% Malaysian
Government Securities
5/2019 22/05/2040
Non-
rated
7,000,000
7,493,987
6,806,925
3.48

37
6. INVESTMENTS (CONTINUED)
Investments as at 30 September 2021 are as follows: (continued)
Name of Instruments Rating
Nominal
Value Cost
Fair
Value
% of Net
Asset
Value
RM RM RM RM
UNQUOTED FIXED
INCOME SECURITIES
(CONTINUED)
5.700% MMC
Corporation IMTN
24/03/2028 AA-
1,000,000
1,098,106
1,090,118
0.56
3.740% PTP IMTN
21/04/2026 (Tranche 7)
06/04/2035 AA-
3,000,000
3,050,106
3,076,086
1.57
4.300% SP Setia IMTN
23/06/2028 AA
3,000,000
3,034,636
3,052,066
1.56
5.500% Sabah
Development Bank Bhd
MTN (Issue No 201)
27/02/2026 AA1
1,500,000
1,572,349
1,567,351
0.80
5.500% Sabah
Development Bank Bhd
MTN (Issue No 204)
24/04/2026 AA1
3,500,000
3,738,361
3,723,189
1.90
4.830% Solar
Management
(Seremban) Sdn Bhd
IMTN 21/10/2033 AA3
2,000,000
2,075,995
1,979,339
1.01
5.130% Solar
Management
(Seremban) Sdn Bhd
IMTN 21/10/2036 AA3
3,000,000
3,125,390
2,947,378
1.51
38
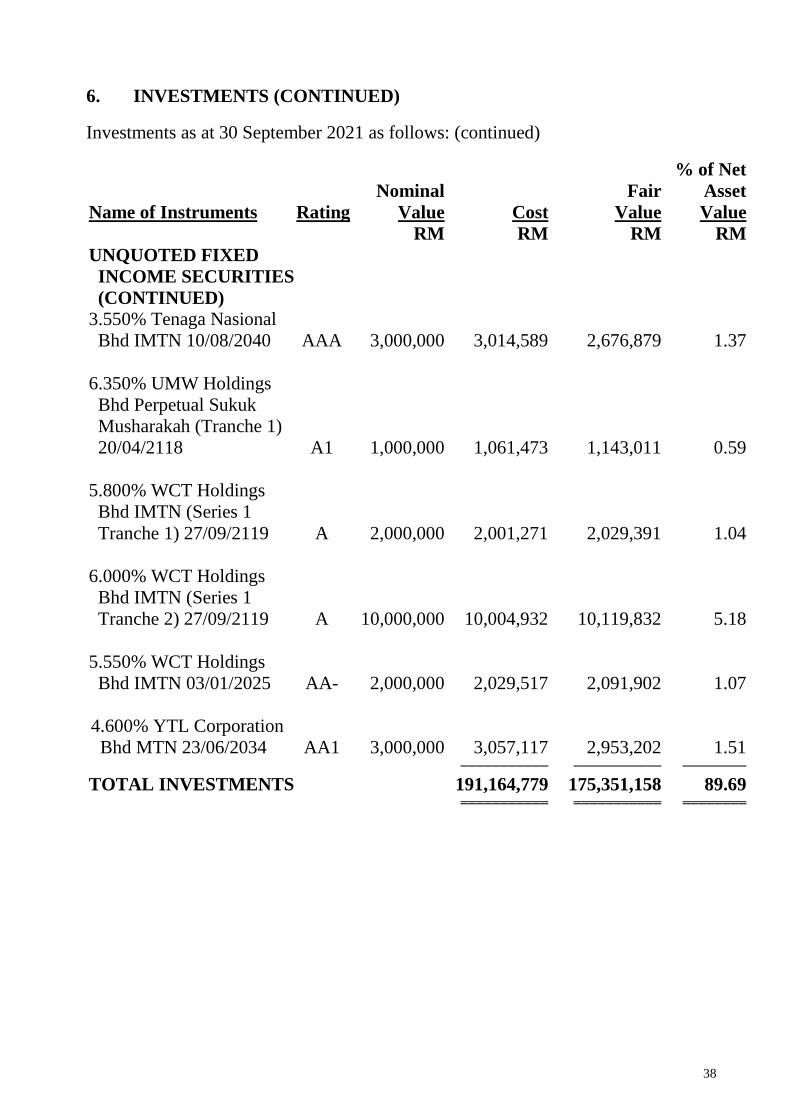
6. INVESTMENTS (CONTINUED)
Investments as at 30 September 2021 as follows: (continued)
Name of Instruments Rating
Nominal
Value Cost
Fair
Value
% of Net
Asset
Value
RM RM RM RM
UNQUOTED FIXED
INCOME SECURITIES
(CONTINUED)
3.550% Tenaga Nasional
Bhd IMTN 10/08/2040 AAA
3,000,000
3,014,589
2,676,879
1.37
6.350% UMW Holdings
Bhd Perpetual Sukuk
Musharakah (Tranche 1)
20/04/2118 A1
1,000,000
1,061,473
1,143,011
0.59
5.800% WCT Holdings
Bhd IMTN (Series 1
Tranche 1) 27/09/2119 A
2,000,000
2,001,271
2,029,391
1.04
6.000% WCT Holdings
Bhd IMTN (Series 1
Tranche 2) 27/09/2119 A
10,000,000
10,004,932
10,119,832
5.18
5.550% WCT Holdings
Bhd IMTN 03/01/2025 AA-
2,000,000
2,029,517
2,091,902
1.07
4.600% YTL Corporation
Bhd MTN 23/06/2034 AA1
3,000,000
3,057,117
2,953,202
1.51 ─────────── ─────────── ────────
TOTAL INVESTMENTS 191,164,779 175,351,158 89.69 ═══════════ ═══════════ ════════

39
6. INVESTMENTS (CONTINUED)
Investments as at 30 September 2020 are as follows:
Name of Instruments Rating
Nominal
Value Cost
Fair
Value
% of Net
Asset
Value
RM RM RM RM
UNQUOTED FIXED
INCOME SECURITIES
5.650% Affin Islamic
Bank Bhd Perpetual
18/10/2117 A3
2,000,000
2,050,912
2,130,552
1.02
5.800% Affin Bank Bhd
Perpetual AT1CS (T1)
29/07/2118 A3
1,500,000
1,515,016
1,574,386
0.75
0.000% Aldwich Bhd
15/08/2014 D*
4,372,336
3,724,323 - -
5.300% Alpha Circle Sdn
Bhd IMTN 20/11/2020 AA-
2,305,000
2,349,515
2,355,531
1.13
5.300% Alpha Circle Sdn
Bhd IMTN 23/02/2021 AA-
860,000
876,722
883,297
0.42
5.450% Alpha Circle Sdn
Bhd IMTN 19/11/2021 AA-
2,118,000
2,160,348
2,206,181
1.06
5.450% Alpha Circle Sdn
Bhd IMTN 23/02/2022 AA-
2,028,000
2,083,770
2,121,653
1.01
5.600% Alpha Circle Sdn
Bhd IMTN 18/11/2022 AA-
1,217,000
1,256,486
1,291,703
0.62
5.700% Alpha Circle Sdn
Bhd IMTN 18/11/2022 AA-
4,000,000
4,084,953
4,256,073
2.03
40
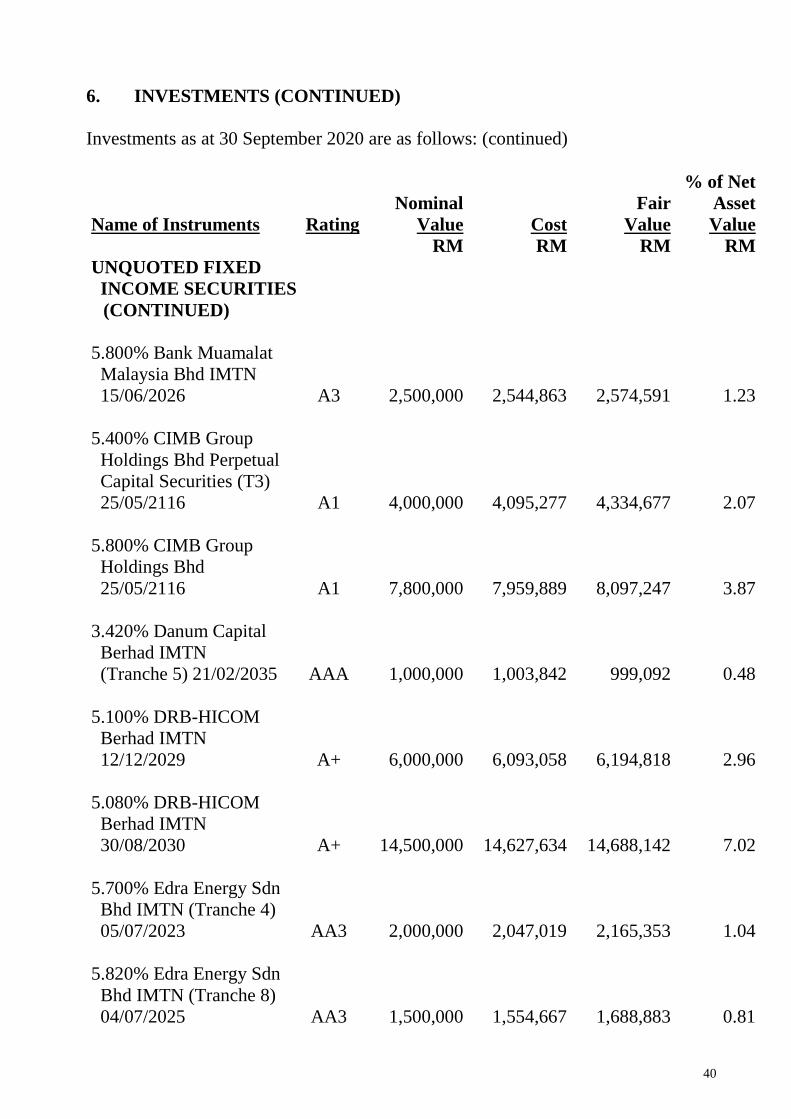
6. INVESTMENTS (CONTINUED)
Investments as at 30 September 2020 are as follows: (continued)
Name of Instruments Rating
Nominal
Value Cost
Fair
Value
% of Net
Asset
Value
RM RM RM RM
UNQUOTED FIXED
INCOME SECURITIES
(CONTINUED)
5.800% Bank Muamalat
Malaysia Bhd IMTN
15/06/2026 A3
2,500,000
2,544,863
2,574,591
1.23
5.400% CIMB Group
Holdings Bhd Perpetual
Capital Securities (T3)
25/05/2116 A1
4,000,000
4,095,277
4,334,677
2.07
5.800% CIMB Group
Holdings Bhd
25/05/2116 A1
7,800,000
7,959,889
8,097,247
3.87
3.420% Danum Capital
Berhad IMTN
(Tranche 5) 21/02/2035 AAA
1,000,000
1,003,842
999,092
0.48
5.100% DRB-HICOM
Berhad IMTN
12/12/2029 A+
6,000,000
6,093,058
6,194,818
2.96
5.080% DRB-HICOM
Berhad IMTN
30/08/2030 A+
14,500,000
14,627,634
14,688,142
7.02
5.700% Edra Energy Sdn
Bhd IMTN (Tranche 4)
05/07/2023 AA3
2,000,000
2,047,019
2,165,353
1.04
5.820% Edra Energy Sdn
Bhd IMTN (Tranche 8)
04/07/2025 AA3
1,500,000
1,554,667
1,688,883
0.81
41
6. INVESTMENTS (CONTINUED)
Investments as at 30 September 2020 are as follows: (continued)
Name of Instruments Rating
Nominal
Value Cost
Fair
Value
% of Net
Asset
Value
RM RM RM RM
UNQUOTED FIXED
INCOME SECURITIES
(CONTINUED)
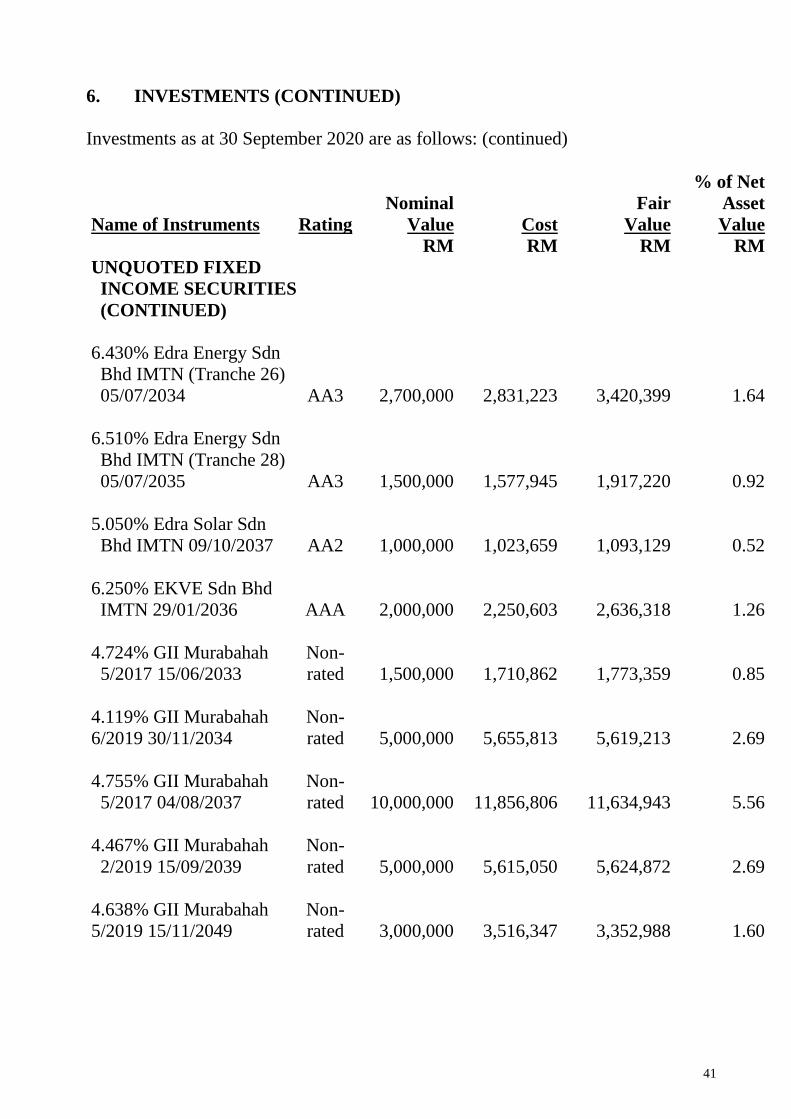
6.430% Edra Energy Sdn
Bhd IMTN (Tranche 26)
05/07/2034 AA3
2,700,000
2,831,223
3,420,399
1.64
6.510% Edra Energy Sdn
Bhd IMTN (Tranche 28)
05/07/2035 AA3
1,500,000
1,577,945
1,917,220
0.92
5.050% Edra Solar Sdn
Bhd IMTN 09/10/2037 AA2
1,000,000
1,023,659
1,093,129
0.52
6.250% EKVE Sdn Bhd
IMTN 29/01/2036 AAA
2,000,000
2,250,603
2,636,318
1.26
4.724% GII Murabahah
5/2017 15/06/2033
Non-
rated
1,500,000
1,710,862
1,773,359
0.85
4.119% GII Murabahah
6/2019 30/11/2034
Non-
rated
5,000,000
5,655,813
5,619,213
2.69
4.755% GII Murabahah
5/2017 04/08/2037
Non-
rated
10,000,000
11,856,806
11,634,943
5.56
4.467% GII Murabahah
2/2019 15/09/2039
Non-
rated
5,000,000
5,615,050
5,624,872
2.69
4.638% GII Murabahah
5/2019 15/11/2049
Non-
rated
3,000,000
3,516,347
3,352,988
1.60
42
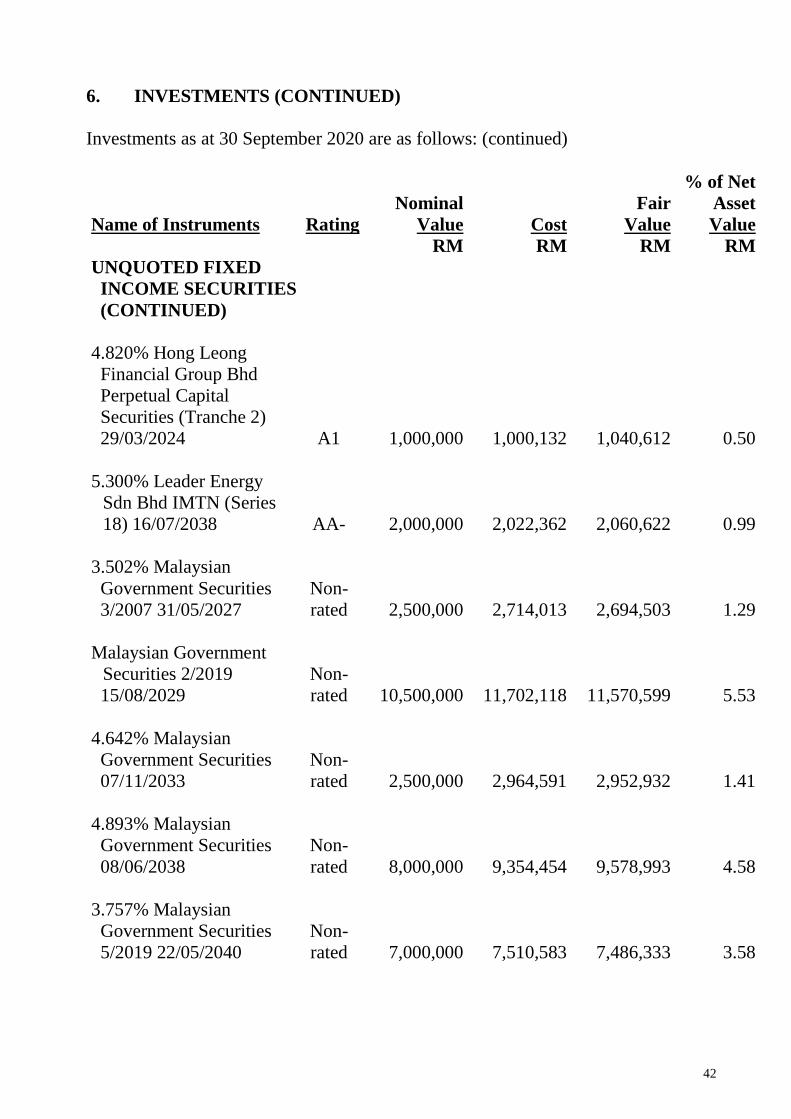
6. INVESTMENTS (CONTINUED)
Investments as at 30 September 2020 are as follows: (continued)
Name of Instruments Rating
Nominal
Value Cost
Fair
Value
% of Net
Asset
Value
RM RM RM RM
UNQUOTED FIXED
INCOME SECURITIES
(CONTINUED)
4.820% Hong Leong
Financial Group Bhd
Perpetual Capital
Securities (Tranche 2)
29/03/2024 A1
1,000,000
1,000,132
1,040,612
0.50
5.300% Leader Energy
Sdn Bhd IMTN (Series
18) 16/07/2038 AA-
2,000,000
2,022,362
2,060,622
0.99
3.502% Malaysian
Government Securities
3/2007 31/05/2027
Non-
rated
2,500,000
2,714,013
2,694,503
1.29
Malaysian Government
Securities 2/2019
15/08/2029
Non-
rated
10,500,000
11,702,118
11,570,599
5.53
4.642% Malaysian
Government Securities
07/11/2033
Non-
rated
2,500,000
2,964,591
2,952,932
1.41
4.893% Malaysian
Government Securities
08/06/2038
Non-
rated
8,000,000
9,354,454
9,578,993
4.58
3.757% Malaysian
Government Securities
5/2019 22/05/2040
Non-
rated
7,000,000
7,510,583
7,486,333
3.58
43
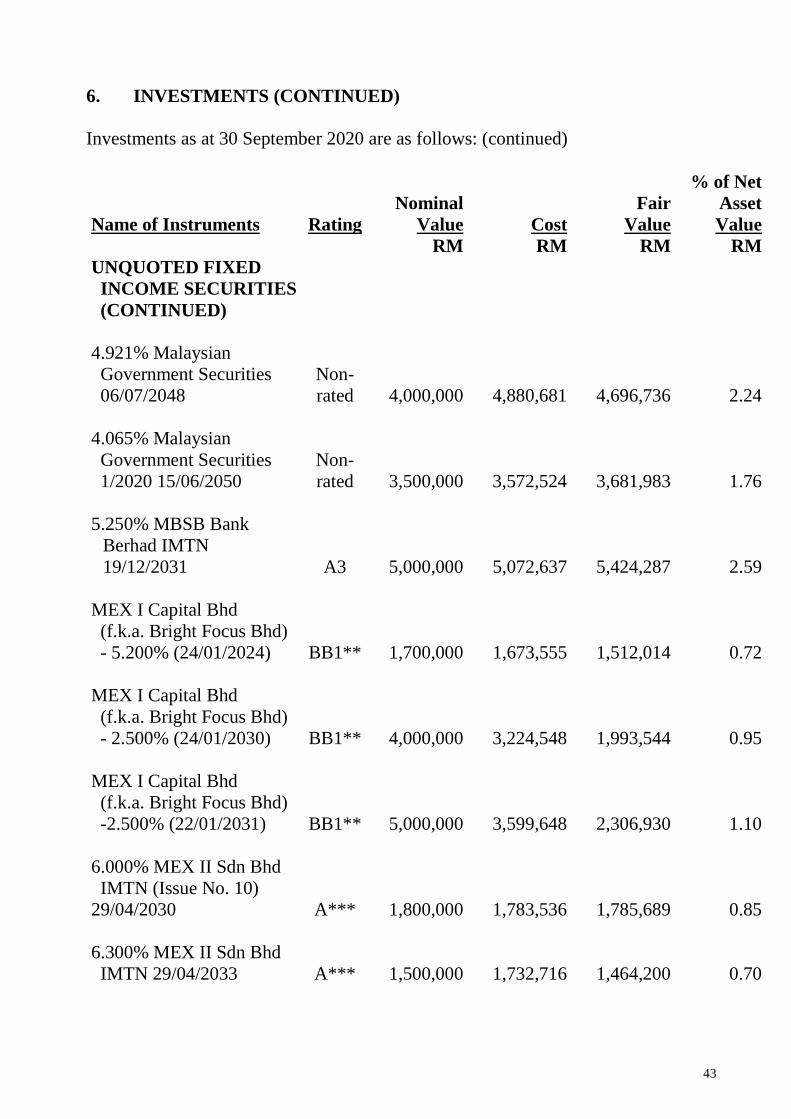
6. INVESTMENTS (CONTINUED)
Investments as at 30 September 2020 are as follows: (continued)
Name of Instruments Rating
Nominal
Value Cost
Fair
Value
% of Net
Asset
Value
RM RM RM RM
UNQUOTED FIXED
INCOME SECURITIES
(CONTINUED)
4.921% Malaysian
Government Securities
06/07/2048
Non-
rated
4,000,000
4,880,681
4,696,736
2.24
4.065% Malaysian
Government Securities
1/2020 15/06/2050
Non-
rated
3,500,000
3,572,524
3,681,983
1.76
5.250% MBSB Bank
Berhad IMTN
19/12/2031 A3 5,000,000 5,072,637 5,424,287 2.59
MEX I Capital Bhd
(f.k.a. Bright Focus Bhd)
- 5.200% (24/01/2024) BB1**
1,700,000
1,673,555
1,512,014
0.72
MEX I Capital Bhd
(f.k.a. Bright Focus Bhd)
- 2.500% (24/01/2030) BB1**
4,000,000
3,224,548
1,993,544
0.95
MEX I Capital Bhd
(f.k.a. Bright Focus Bhd)
-2.500% (22/01/2031) BB1**
5,000,000
3,599,648
2,306,930
1.10
6.000% MEX II Sdn Bhd
IMTN (Issue No. 10)
29/04/2030 A***
1,800,000
1,783,536
1,785,689
0.85
6.300% MEX II Sdn Bhd
IMTN 29/04/2033 A***
1,500,000
1,732,716
1,464,200
0.70
44
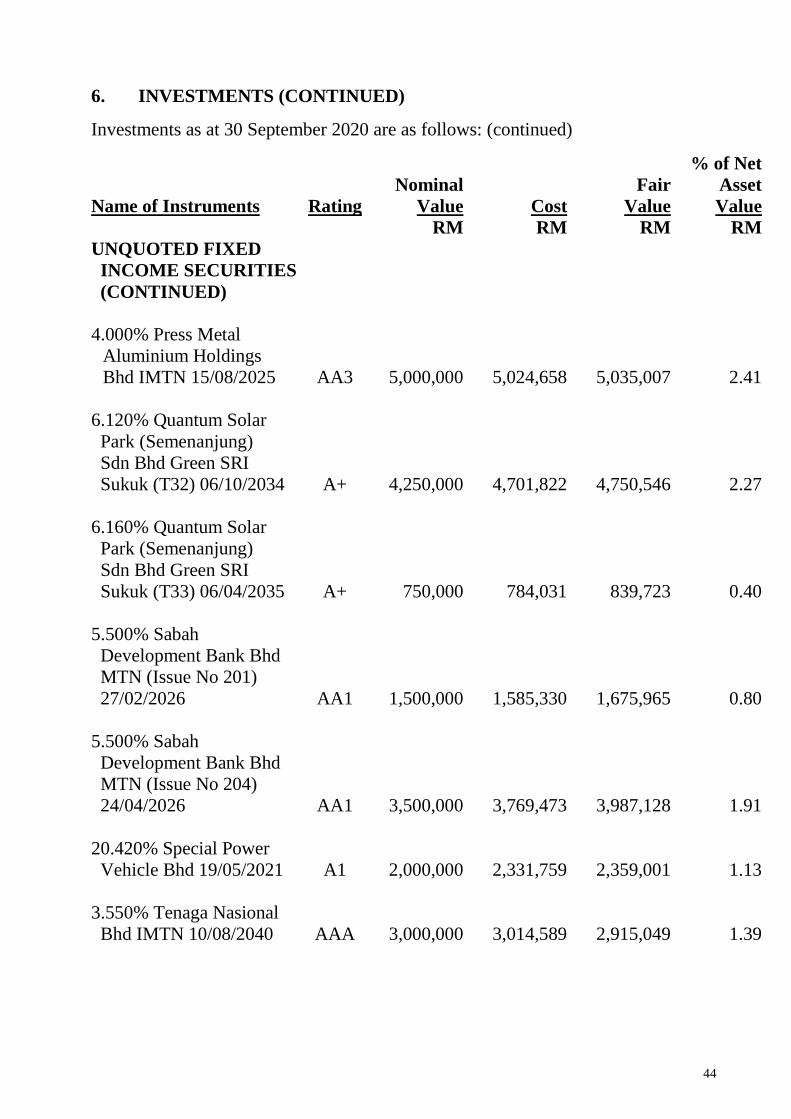
6. INVESTMENTS (CONTINUED)
Investments as at 30 September 2020 are as follows: (continued)
Name of Instruments Rating
Nominal
Value Cost
Fair
Value
% of Net
Asset
Value RM RM RM RM
UNQUOTED FIXED
INCOME SECURITIES
(CONTINUED)
4.000% Press Metal
Aluminium Holdings
Bhd IMTN 15/08/2025 AA3
5,000,000
5,024,658
5,035,007
2.41
6.120% Quantum Solar
Park (Semenanjung)
Sdn Bhd Green SRI
Sukuk (T32) 06/10/2034 A+
4,250,000
4,701,822
4,750,546
2.27
6.160% Quantum Solar
Park (Semenanjung)
Sdn Bhd Green SRI
Sukuk (T33) 06/04/2035 A+
750,000
784,031
839,723
0.40
5.500% Sabah
Development Bank Bhd
MTN (Issue No 201)
27/02/2026 AA1
1,500,000
1,585,330
1,675,965
0.80
5.500% Sabah
Development Bank Bhd
MTN (Issue No 204)
24/04/2026 AA1
3,500,000
3,769,473
3,987,128
1.91
20.420% Special Power
Vehicle Bhd 19/05/2021 A1
2,000,000
2,331,759
2,359,001
1.13
3.550% Tenaga Nasional
Bhd IMTN 10/08/2040 AAA
3,000,000
3,014,589
2,915,049
1.39
45
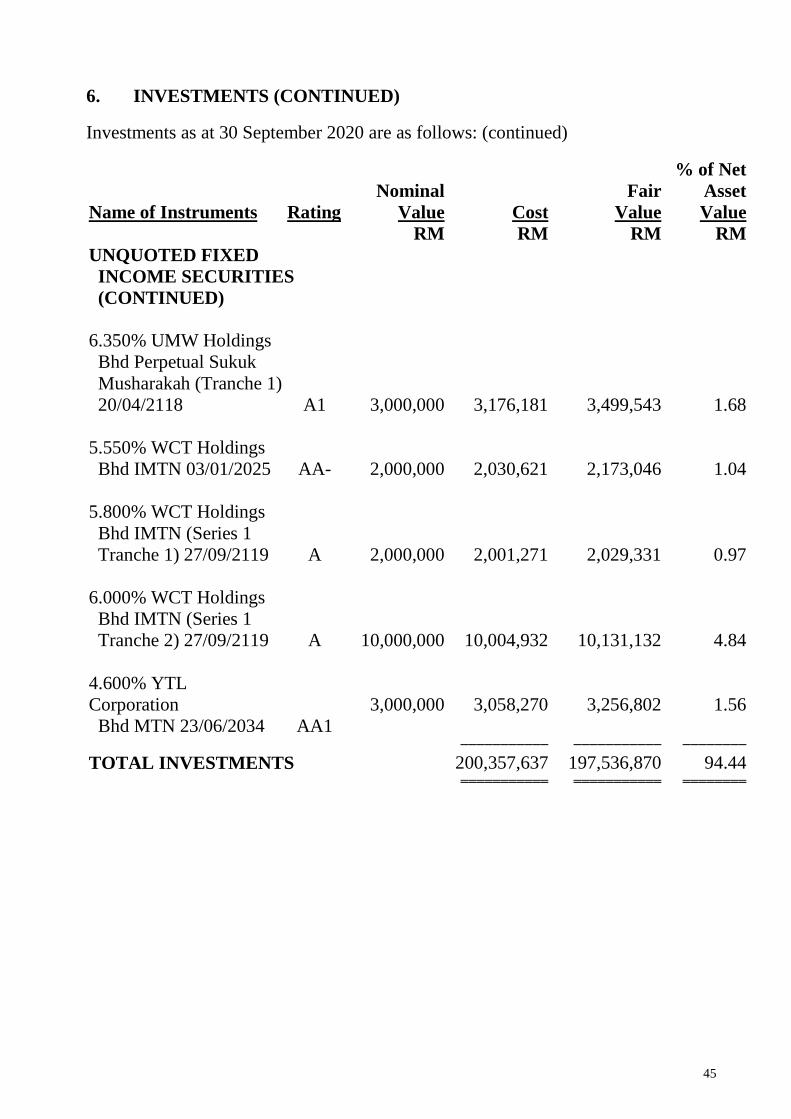
6. INVESTMENTS (CONTINUED)
Investments as at 30 September 2020 are as follows: (continued)
Name of Instruments Rating
Nominal
Value Cost
Fair
Value
% of Net
Asset
Value
RM RM RM RM
UNQUOTED FIXED
INCOME SECURITIES
(CONTINUED)
6.350% UMW Holdings
Bhd Perpetual Sukuk
Musharakah (Tranche 1)
20/04/2118 A1
3,000,000
3,176,181
3,499,543
1.68
5.550% WCT Holdings
Bhd IMTN 03/01/2025 AA-
2,000,000
2,030,621
2,173,046
1.04
5.800% WCT Holdings
Bhd IMTN (Series 1
Tranche 1) 27/09/2119 A
2,000,000
2,001,271
2,029,331
0.97
6.000% WCT Holdings
Bhd IMTN (Series 1
Tranche 2) 27/09/2119 A
10,000,000
10,004,932
10,131,132
4.84
4.600% YTL
Corporation
Bhd MTN 23/06/2034 AA1
3,000,000
3,058,270
3,256,802
1.56
─────────── ─────────── ────────
TOTAL INVESTMENTS 200,357,637 197,536,870 94.44 ═══════════ ═══════════ ════════

46
6. INVESTMENTS (CONTINUED)
* Aldwich Berhad (“Aldwich”) RM246.0 million Class A Senior Bonds and RM47.0
million Class B Senior Bonds
On 31 October 2011, sale of the Aldwich plant was completed and the Fund had
received sales proceeds amounting to RM627,664, which translated into 12.6%
recovery.
A few bondholders (“Plaintiffs”) represented by Messrs Tommy Thomas
subsequently initiated a legal suit against several parties (“Defendants”). The Writ
and Statement of Claim were electronically filed in Court on 5 November 2012 and
extracted from the High Court on 7 November 2012.
On 8 March 2013, Messrs Tommy Thomas attended the first case management
whereby it was conducted before the Trial Judge with carriage of the Suit.
Subsequent case management took place on 22 March 2013, 27 March 2013, 10
April 2013, 20 June 2013, 23 July 2013, 20 August 2013, 18 September 2013, 16
October 2013, 28 October 2013 and 18 November 2013.
On 25 November 2013, the Trial commenced with Plaintiff’s Witness 1 (“PW1”)
appearing in court with Witness Statement filed. The Trial resumed on 18 March
2014 and ended on 4 April 2014. A total of 9 witnesses representing the Plaintiffs
were being cross-examined by the Defendants’ Counsels. The Trial recommenced
on 10 November 2014, with further cross examination on the Plaintiffs’ 8
witnesses, which ended on 13 November 2014. Following the evidence given by
one of the Plaintiffs, a client of the Plaintiff ("Client") has also testified on 12
November 2014 in the Trial, in consequence of 2 of the Defendants’ amendments
to the respective pleadings, that the Plaintiff did not suffer any loss in respect of
the bonds purchased on behalf of the Client. This was followed by the cross
examination of the Expert Witness, Sage 3 Capital Sdn Bhd (“Sage 3”) on 21
January 2015, before it ended with the closure of Plaintiffs’ case on 26 January
2015.
On 27 January 2015, the Defendants opened their respective cases with Defendant
Witness 1 (“DW1”) being called for cross examination. A total of 8 witnesses were
being cross examined during the various sessions – 10 to 12 February 2015, 24
June to 1 July 2015, 13 to 16 July 2015, 28 August 2015 and 2 September 2015.
Subsequently, the cross examination of the Expert Witness for one of the
Defendants took place before the closure of the Defendants case on 4 September
2015.
47
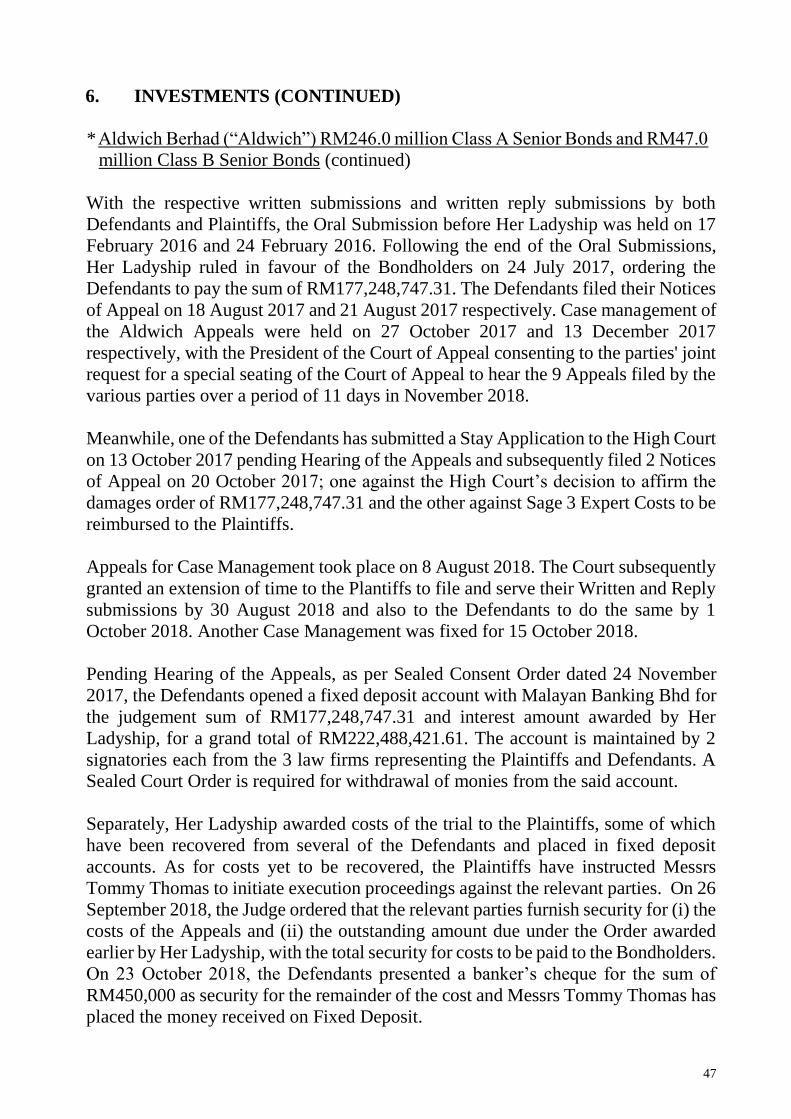
6. INVESTMENTS (CONTINUED)
* Aldwich Berhad (“Aldwich”) RM246.0 million Class A Senior Bonds and RM47.0
million Class B Senior Bonds (continued)
With the respective written submissions and written reply submissions by both
Defendants and Plaintiffs, the Oral Submission before Her Ladyship was held on 17
February 2016 and 24 February 2016. Following the end of the Oral Submissions,
Her Ladyship ruled in favour of the Bondholders on 24 July 2017, ordering the
Defendants to pay the sum of RM177,248,747.31. The Defendants filed their Notices
of Appeal on 18 August 2017 and 21 August 2017 respectively. Case management of
the Aldwich Appeals were held on 27 October 2017 and 13 December 2017
respectively, with the President of the Court of Appeal consenting to the parties' joint
request for a special seating of the Court of Appeal to hear the 9 Appeals filed by the
various parties over a period of 11 days in November 2018.
Meanwhile, one of the Defendants has submitted a Stay Application to the High Court
on 13 October 2017 pending Hearing of the Appeals and subsequently filed 2 Notices
of Appeal on 20 October 2017; one against the High Court’s decision to affirm the
damages order of RM177,248,747.31 and the other against Sage 3 Expert Costs to be
reimbursed to the Plaintiffs.
Appeals for Case Management took place on 8 August 2018. The Court subsequently
granted an extension of time to the Plantiffs to file and serve their Written and Reply
submissions by 30 August 2018 and also to the Defendants to do the same by 1
October 2018. Another Case Management was fixed for 15 October 2018.
Pending Hearing of the Appeals, as per Sealed Consent Order dated 24 November
2017, the Defendants opened a fixed deposit account with Malayan Banking Bhd for
the judgement sum of RM177,248,747.31 and interest amount awarded by Her
Ladyship, for a grand total of RM222,488,421.61. The account is maintained by 2
signatories each from the 3 law firms representing the Plaintiffs and Defendants. A
Sealed Court Order is required for withdrawal of monies from the said account.
Separately, Her Ladyship awarded costs of the trial to the Plaintiffs, some of which
have been recovered from several of the Defendants and placed in fixed deposit
accounts. As for costs yet to be recovered, the Plaintiffs have instructed Messrs
Tommy Thomas to initiate execution proceedings against the relevant parties. On 26
September 2018, the Judge ordered that the relevant parties furnish security for (i) the
costs of the Appeals and (ii) the outstanding amount due under the Order awarded
earlier by Her Ladyship, with the total security for costs to be paid to the Bondholders.
On 23 October 2018, the Defendants presented a banker’s cheque for the sum of
RM450,000 as security for the remainder of the cost and Messrs Tommy Thomas has
placed the money received on Fixed Deposit.

48
6. INVESTMENTS (CONTINUED)
* Aldwich Berhad (“Aldwich”) RM246.0 million Class A Senior Bonds and RM47.0
million Class B Senior Bonds (continued)
On 18 September 2019, the Court of Appeal unanimously dismissed all the
Defendants’ appeals and ordered a total cost of RM713,000 to be paid by the
Defendants to the Plaintiffs. The Defendants were given a month to appeal to the
Federal Court. Several Defendants filed for the appeal within the stipulated
timeframe. Messrs Tommy Thomas attended a Case Management on 19 December
2019 and the leave applications of the Defendants are to be heard together at the
Federal Court on 13 August 2020.
Between 3 and 5 August 2020, Messrs Tommy Thomas exchanged written
submissions for the leave applications with solicitors of the Defendants.
Subsequently, Messrs Tommy Thomas was served with a supplementary affidavit by
the Defendants’ solicitors without being given prior notice. Messrs Tommy Thomas
have thus written to the Chief Justice on 6 and 7 August 2020 with regard to this
matter and the Registrar of the Federal Court has adjourned the Hearing of the leave
applications on 13 August 2020 to a new hearing date on 25 November 2020, which
was later postponed to 21 January 2021.
The Hearing of the Leave Applications (“the Hearing”) took place on 21 January 2021
and the Federal Court subsequently fixed 26 February 2021 for the continuation of
the Hearing but was rescheduled to 12 March 2021 due to the unavailability of one
of the Judges. The Hearing was thereafter rescheduled to 28 June 2021.
Following the imposition of the Full Movement Control Order from 1 June to 28 June
2021, the lawyers for both sides were unable to access their files in the offices, as
such both parties had jointly requested for the Hearing on 28 June 2021 to be
adjourned to a new date. The Federal Court acceded to the request and converted the
Hearing on 28 June 2021 to an e-Review Case Management, and the Hearing has
been rescheduled to 3 September 2021.
The Hearing of the Leave Applications took place on 3 September 2021, whereby
Messrs Tommy Thomas responded, dealing with the leave questions proposed by the
Defendants. The Federal Court then adjourned the Hearing to 25 October 2021 for
the counsel for the applicants to reply to Messrs Tommy Thomas’ oral submissions.
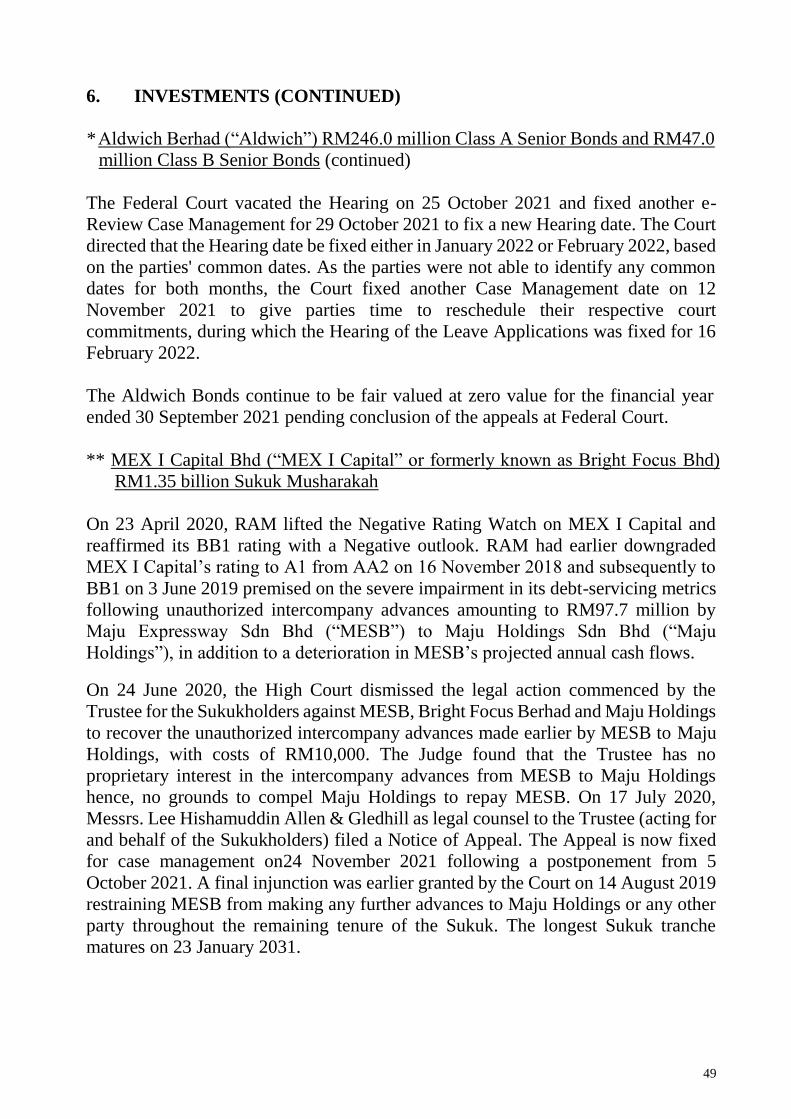
49
6. INVESTMENTS (CONTINUED)
* Aldwich Berhad (“Aldwich”) RM246.0 million Class A Senior Bonds and RM47.0
million Class B Senior Bonds (continued)
The Federal Court vacated the Hearing on 25 October 2021 and fixed another e-
Review Case Management for 29 October 2021 to fix a new Hearing date. The Court
directed that the Hearing date be fixed either in January 2022 or February 2022, based
on the parties' common dates. As the parties were not able to identify any common
dates for both months, the Court fixed another Case Management date on 12
November 2021 to give parties time to reschedule their respective court
commitments, during which the Hearing of the Leave Applications was fixed for 16
February 2022.
The Aldwich Bonds continue to be fair valued at zero value for the financial year
ended 30 September 2021 pending conclusion of the appeals at Federal Court.
** MEX I Capital Bhd (“MEX I Capital” or formerly known as Bright Focus Bhd)
RM1.35 billion Sukuk Musharakah
On 23 April 2020, RAM lifted the Negative Rating Watch on MEX I Capital and
reaffirmed its BB1 rating with a Negative outlook. RAM had earlier downgraded
MEX I Capital’s rating to A1 from AA2 on 16 November 2018 and subsequently to
BB1 on 3 June 2019 premised on the severe impairment in its debt-servicing metrics
following unauthorized intercompany advances amounting to RM97.7 million by
Maju Expressway Sdn Bhd (“MESB”) to Maju Holdings Sdn Bhd (“Maju
Holdings”), in addition to a deterioration in MESB’s projected annual cash flows.
On 24 June 2020, the High Court dismissed the legal action commenced by the
Trustee for the Sukukholders against MESB, Bright Focus Berhad and Maju Holdings
to recover the unauthorized intercompany advances made earlier by MESB to Maju
Holdings, with costs of RM10,000. The Judge found that the Trustee has no
proprietary interest in the intercompany advances from MESB to Maju Holdings
hence, no grounds to compel Maju Holdings to repay MESB. On 17 July 2020,
Messrs. Lee Hishamuddin Allen & Gledhill as legal counsel to the Trustee (acting for
and behalf of the Sukukholders) filed a Notice of Appeal. The Appeal is now fixed
for case management on24 November 2021 following a postponement from 5
October 2021. A final injunction was earlier granted by the Court on 14 August 2019
restraining MESB from making any further advances to Maju Holdings or any other
party throughout the remaining tenure of the Sukuk. The longest Sukuk tranche
matures on 23 January 2031.

50
6 INVESTMENTS (CONTINUED)
** MEX I Capital Bhd (“MEX I Capital” or formerly known as Bright Focus Bhd)
RM1.35 billion Sukuk Musharakah (continued)
On 19 March 2021, RAM further downgraded the rating of MEX I Capital to
C3/Negative, from BB1/Negative, mainly premised on its persistent liquidity
problems and heightened default risk amid sharply lower traffic volumes along the
Maju Expressway due to COVID-19-led restrictions on mobility.
On 15 June 2021, MEX I Capital received a scheduled profit payment of RM8.5
million on the Islamic Medium Term Notes (“IMTN”) issued by MESB under the
existing transaction structure notwithstanding MESB’s default on its IMTN principal
repayment of RM50 million to MEX I Capital on the same date. Sukukholders have
allowed the default at MESB to subsist until the proposed restructuring of the Sukuk.
There is no immediate credit impact on the Sukuk arising from MESB’s default on
the IMTN principal.
On 26 July 2021, MEX I Capital fulfilled its obligation on the Sukuk with full and
timely profit payment of RM25.9 million from monies previously ring-fenced for the
sole benefit of Sukukholders in a reserve account. Pursuant to the recent Sukuk profit
payment, MEX I Capital will need to top up the reserve account by 25 August to meet
the minimum required balance of RM95.9 million ahead of the next immediate
principal and profit payment due in January 2022.
The proposed restructuring was not approved by Sukukholders after failing to obtain
the minimum 75% vote from Sukukholders during the virtual Extraordinary General
Meeting on 19 July 2021. On 13 October 2021, Sukukholders voted again and
subsequently approved the proposed restructuring. The restructuring exercise is
expected to be completed by the end of 2021.
*** MEX II Sdn Bhd (“MEX II”)
RM1.30 billion Sukuk Murabahah Programme
On 18 October 2019, MARC had downgraded the rating of MEX II RM1.3 billion
Sukuk Murabahah Programme from AA- to A whilst maintaining the rating on a
negative outlook premised on rising completion risk and increased uncertainty with
regard to completion and associated tolling date of the 16.8-km Lebuhraya KLIA
(MEX Extension) project. MARC further placed MEX II’s ratings on MARCWatch
Negative on 22 May 2020 due to the lack of construction progress at the Expressway.
On 30 October 2020, MEX II fulfilled its obligation on the Sukuk with a full and
timely profit payment of circa RM39 million from monies previously ring-fenced for
the sole benefit of Sukukholders in a reserve account.
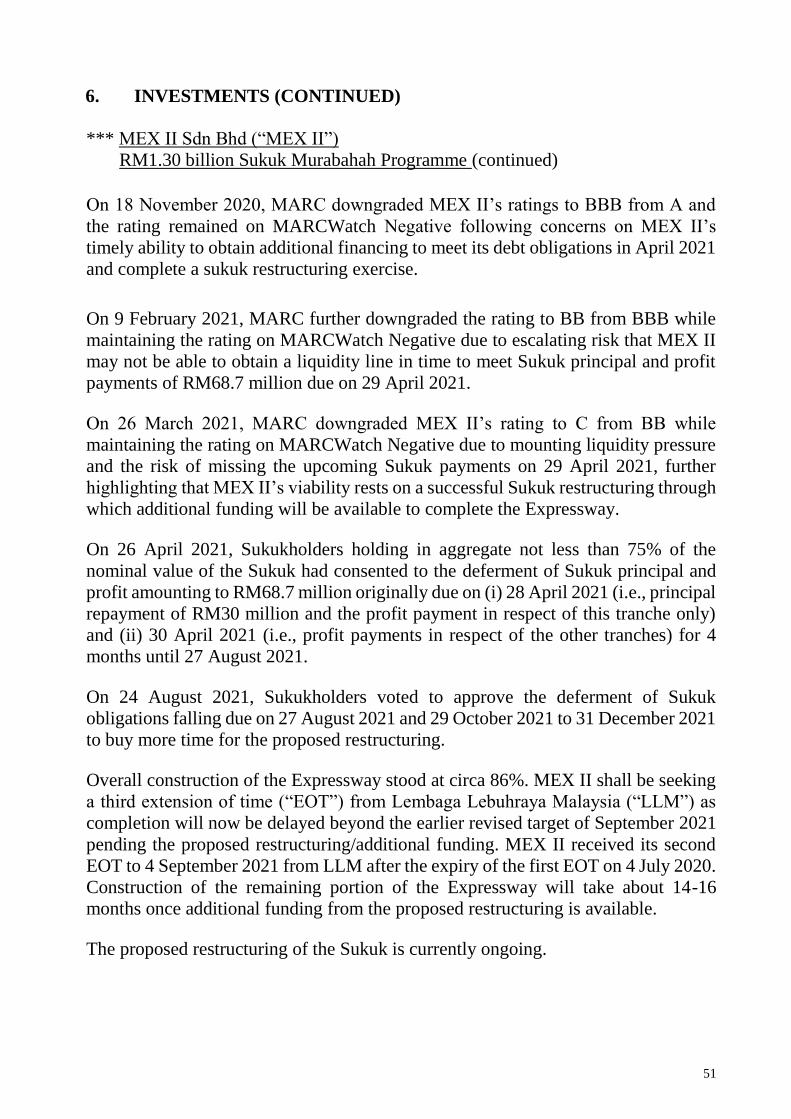
51
6. INVESTMENTS (CONTINUED)
*** MEX II Sdn Bhd (“MEX II”)
RM1.30 billion Sukuk Murabahah Programme (continued)
On 18 November 2020, MARC downgraded MEX II’s ratings to BBB from A and
the rating remained on MARCWatch Negative following concerns on MEX II’s
timely ability to obtain additional financing to meet its debt obligations in April 2021
and complete a sukuk restructuring exercise.
On 9 February 2021, MARC further downgraded the rating to BB from BBB while
maintaining the rating on MARCWatch Negative due to escalating risk that MEX II
may not be able to obtain a liquidity line in time to meet Sukuk principal and profit
payments of RM68.7 million due on 29 April 2021.
On 26 March 2021, MARC downgraded MEX II’s rating to C from BB while
maintaining the rating on MARCWatch Negative due to mounting liquidity pressure
and the risk of missing the upcoming Sukuk payments on 29 April 2021, further
highlighting that MEX II’s viability rests on a successful Sukuk restructuring through
which additional funding will be available to complete the Expressway.
On 26 April 2021, Sukukholders holding in aggregate not less than 75% of the
nominal value of the Sukuk had consented to the deferment of Sukuk principal and
profit amounting to RM68.7 million originally due on (i) 28 April 2021 (i.e., principal
repayment of RM30 million and the profit payment in respect of this tranche only)
and (ii) 30 April 2021 (i.e., profit payments in respect of the other tranches) for 4
months until 27 August 2021.
On 24 August 2021, Sukukholders voted to approve the deferment of Sukuk
obligations falling due on 27 August 2021 and 29 October 2021 to 31 December 2021
to buy more time for the proposed restructuring.
Overall construction of the Expressway stood at circa 86%. MEX II shall be seeking
a third extension of time (“EOT”) from Lembaga Lebuhraya Malaysia (“LLM”) as
completion will now be delayed beyond the earlier revised target of September 2021
pending the proposed restructuring/additional funding. MEX II received its second
EOT to 4 September 2021 from LLM after the expiry of the first EOT on 4 July 2020.
Construction of the remaining portion of the Expressway will take about 14-16
months once additional funding from the proposed restructuring is available.
The proposed restructuring of the Sukuk is currently ongoing.

52
7. UNITS IN CIRCULATION
2021 2020
Units Units
At the beginning of the financial year 222,933,440 123,611,346
Creation of units during the financial year:
Arising from distribution 8,644,775 6,858,094
Arising from applications 55,642,000 128,171,000
Cancellation of units during the
financial year (64,843,000) (35,707,000) ──────── ────────
At the end of the financial year 222,377,215 222,933,440 ════════ ════════
8. MANAGEMENT FEE
In accordance with the Prospectus, the management fee provided in the financial
statements is 1.00% (2020: 1.00%) per annum based on the net asset value of the
Fund, calculated on a daily basis for the financial year.
9. TRUSTEE’S FEE
In accordance with the Prospectus, the Trustee’s fee provided in the financial
statements is 0.08% (2020: 0.08%) per annum based on the net asset value of the
Fund, calculated on a daily basis for the financial year.

53
10. TAXATION
(a) Tax charge for the financial year
2021 2020
RM RM
Current taxation - - ════════ ════════
(b) Numerical reconciliation of income tax expense
The numerical reconciliation between the net (loss)/income before taxation
multiplied by the Malaysian statutory income tax rate and the tax expense of the Fund
is as follows:
2021 2020
RM RM
Net (loss)/income before taxation (4,804,721) 8,764,686
Tax calculated at statutory income tax rate of 24% (1,153,133) 2,103,525
Tax effects of:
- Loss not deductible for tax purposes/(Income
not subject to tax) 588,863 (2,494,584)
- Expenses not deductible for tax purposes 43,255 33,208
- Restriction on tax deductible expenses 521,015 357,851
Tax expense - -
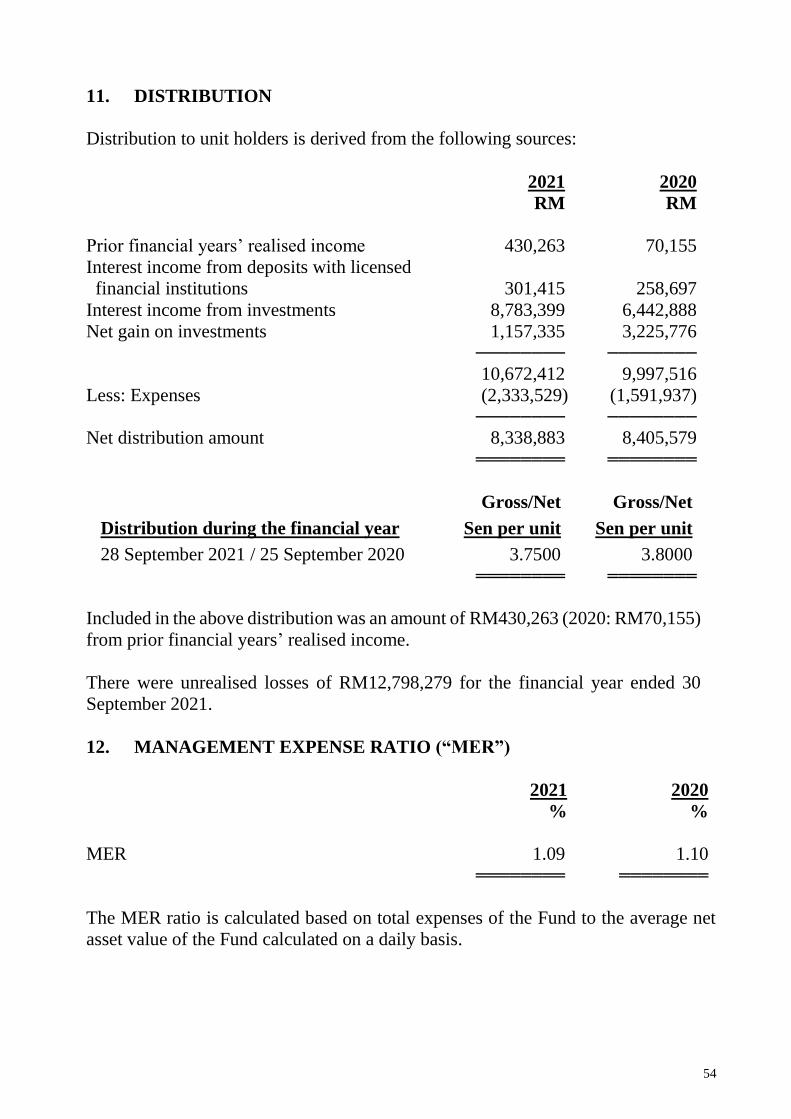
54
11. DISTRIBUTION
Distribution to unit holders is derived from the following sources:
2021 2020
RM RM
Prior financial years’ realised income 430,263 70,155
Interest income from deposits with licensed
financial institutions 301,415 258,697
Interest income from investments 8,783,399 6,442,888
Net gain on investments 1,157,335 3,225,776 ──────── ────────
10,672,412 9,997,516
Less: Expenses (2,333,529) (1,591,937) ──────── ────────
Net distribution amount 8,338,883 8,405,579 ════════ ════════
Gross/Net Gross/Net
Distribution during the financial year Sen per unit Sen per unit
28 September 2021 / 25 September 2020 3.7500 3.8000 ════════ ════════
Included in the above distribution was an amount of RM430,263 (2020: RM70,155)
from prior financial years’ realised income.
There were unrealised losses of RM12,798,279 for the financial year ended 30
September 2021.
12. MANAGEMENT EXPENSE RATIO (“MER”)
2021 2020
% %
MER 1.09 1.10 ════════ ════════
The MER ratio is calculated based on total expenses of the Fund to the average net
asset value of the Fund calculated on a daily basis.

55
13. PORTFOLIO TURNOVER RATIO (“PTR”)
2021 2020
PTR (times) 0.34 1.03 ════════ ════════
The PTR ratio is calculated based on average of acquisition and disposals of the Fund
for the financial year to the average net asset value of the Fund calculated on a daily
basis.
14. UNITS HELD BY THE MANAGER AND PARTIES RELATED TO THE
MANAGER
The number of units held by the Manager and related parties are as follows:
2021 2020
Units RM Units RM
The Manager 5,217 4,587 5,532 5,191
RHB Capital Nominees
(Tempatan) Sdn Bhd 39,933,011 35,109,103 34,595,540 32,460,995
RHB Nominees (Asing)
Sdn Bhd - - 666,797 625,656
RHB Nominees (Tempatan)
Sdn Bhd - - 6,927,517 6,500,089 ══════ ══════ ══════ ══════
The units are held beneficially by the Manager for booking purposes. The Manager is of
the opinion that all transactions with the related parties have been entered into in the
normal course of business at agreed terms between the related parties.
The units held by RHB Capital Nominees (Tempatan) Sdn Bhd, a wholly owned
subsidiary of ultimate holding company of the Manager, RHB Nominees (Asing) Sdn
Bhd and RHB Nominees (Tempatan) Sdn Bhd, both wholly owned subsidiaries of
holding company of the Manager, are under nominees structure.
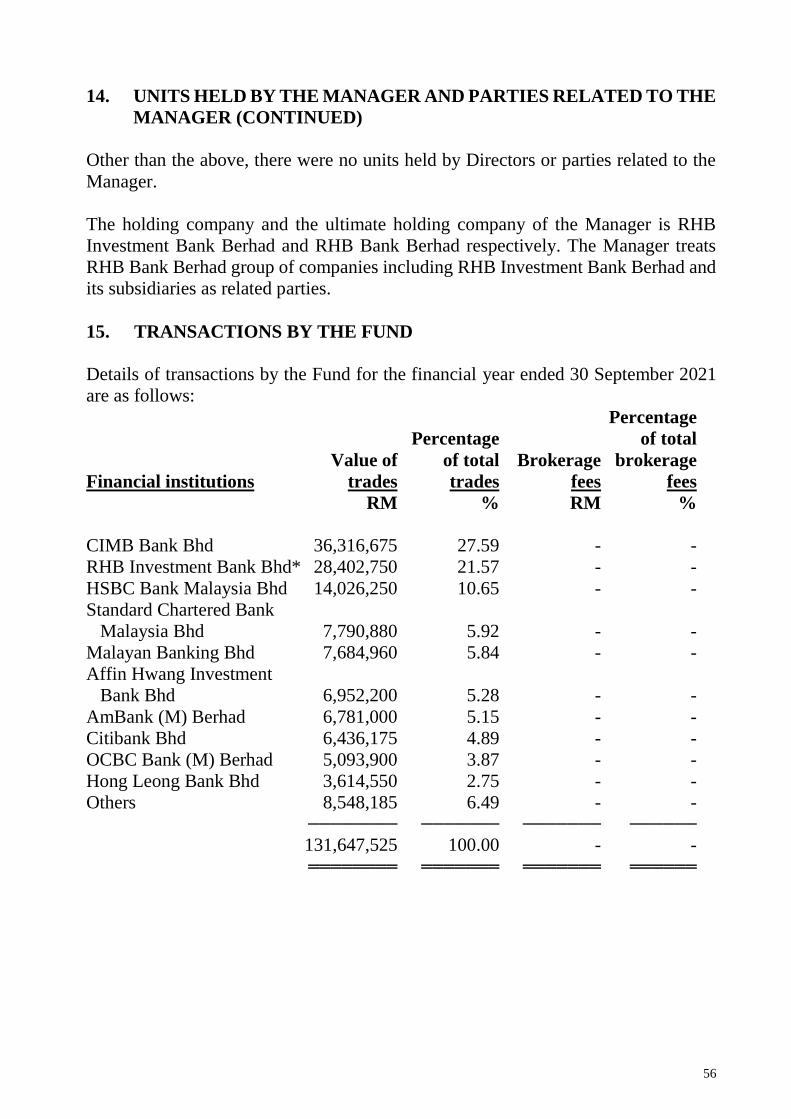
56
14. UNITS HELD BY THE MANAGER AND PARTIES RELATED TO THE
MANAGER (CONTINUED)
Other than the above, there were no units held by Directors or parties related to the
Manager.
The holding company and the ultimate holding company of the Manager is RHB
Investment Bank Berhad and RHB Bank Berhad respectively. The Manager treats
RHB Bank Berhad group of companies including RHB Investment Bank Berhad and
its subsidiaries as related parties.
15. TRANSACTIONS BY THE FUND
Details of transactions by the Fund for the financial year ended 30 September 2021
are as follows:
Percentage
Percentage of total
Value of of total Brokerage brokerage
Financial institutions trades trades fees fees
RM % RM %
CIMB Bank Bhd 36,316,675 27.59 - -
RHB Investment Bank Bhd* 28,402,750 21.57 - -
HSBC Bank Malaysia Bhd 14,026,250 10.65 - -
Standard Chartered Bank
Malaysia Bhd 7,790,880 5.92 - -
Malayan Banking Bhd 7,684,960 5.84 - -
Affin Hwang Investment
Bank Bhd 6,952,200 5.28 - -
AmBank (M) Berhad 6,781,000 5.15 - -
Citibank Bhd 6,436,175 4.89 - -
OCBC Bank (M) Berhad 5,093,900 3.87 - -
Hong Leong Bank Bhd 3,614,550 2.75 - -
Others 8,548,185 6.49 - - ──────── ─────── ─────── ──────
131,647,525 100.00 - - ════════ ═══════ ═══════ ══════
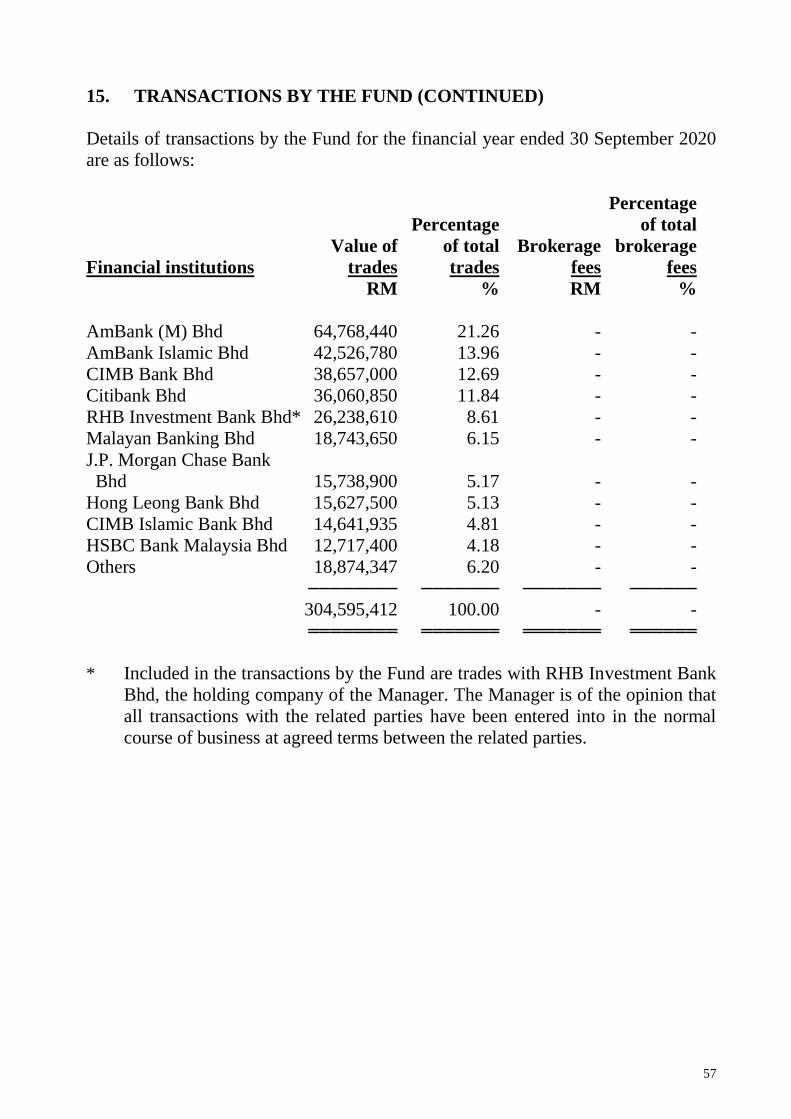
57
15. TRANSACTIONS BY THE FUND (CONTINUED)
Details of transactions by the Fund for the financial year ended 30 September 2020
are as follows:
Percentage
Percentage of total
Value of of total Brokerage brokerage
Financial institutions trades trades fees fees
RM % RM %
AmBank (M) Bhd 64,768,440 21.26 - -
AmBank Islamic Bhd 42,526,780 13.96 - -
CIMB Bank Bhd 38,657,000 12.69 - -
Citibank Bhd 36,060,850 11.84 - -
RHB Investment Bank Bhd* 26,238,610 8.61 - -
Malayan Banking Bhd 18,743,650 6.15 - -
J.P. Morgan Chase Bank
Bhd 15,738,900 5.17 - -
Hong Leong Bank Bhd 15,627,500 5.13 - -
CIMB Islamic Bank Bhd 14,641,935 4.81 - -
HSBC Bank Malaysia Bhd 12,717,400 4.18 - -
Others 18,874,347 6.20 - - ──────── ─────── ─────── ──────
304,595,412 100.00 - - ════════ ═══════ ═══════ ══════
* Included in the transactions by the Fund are trades with RHB Investment Bank
Bhd, the holding company of the Manager. The Manager is of the opinion that
all transactions with the related parties have been entered into in the normal
course of business at agreed terms between the related parties.

58
16. FINANCIAL INSTRUMENTS BY CATEGORIES
2021 2020
RM RM
Financial assets
Financial assets at FVTPL
• Unquoted fixed income securities 175,351,158 197,536,870 ════════ ════════
Financial assets at amortised cost
• Bank balances 52,069 119,361
• Deposits with licensed financial institutions 28,629,672 20,257,132
• Amount due from Manager 31,629 1,625,959 ──────── ────────
28,713,370 22,002,452 ════════ ════════
Financial liabilities
Financial liabilities at amortised cost
• Income distribution payable 8,338,883 8,405,579
• Amount due to broker - 1,763,651
• Amount due to Manager 25,497 -
• Accrued management fee 169,516 174,224
• Amount due to Trustee 13,561 13,938
• Other payables and accruals 13,075 13,287 ──────── ────────
8,560,532 10,370,679 ════════ ════════
17. SIGNIFICANT EVENT DURING THE FINANCIAL YEAR
The worsening of the macro-economic outlook as a result of COVID-19, both
domestically and globally, has impacted the Fund’s performance during the financial
year.
The Manager is monitoring the situation closely and will be managing the portfolio
to achieve the Fund’s objective.

59
STATEMENT BY MANAGER
RHB BOND FUND
We, Chin Yoong Kheong and Datuk Seri Dr Govindan A/L Kunchamboo, two of
the Directors of RHB Asset Management Sdn Bhd, do hereby state that in the opinion
of the Directors of the Manager, the accompanying statement of financial position,
statement of income and expenses, statement of changes in net asset value, statement
of cash flows and the accompanying notes, are drawn up in accordance with
Malaysian Financial Reporting Standards and International Financial Reporting
Standards so as to give a true and fair view of the financial position of the Fund as
at 30 September 2021 and of its financial performance and cash flows for the
financial year then ended and comply with the provisions of the Deeds.
On behalf of the Manager,
Chin Yoong Kheong Datuk Seri Dr Govindan A/L Kunchamboo
Director Director
24 November 2021
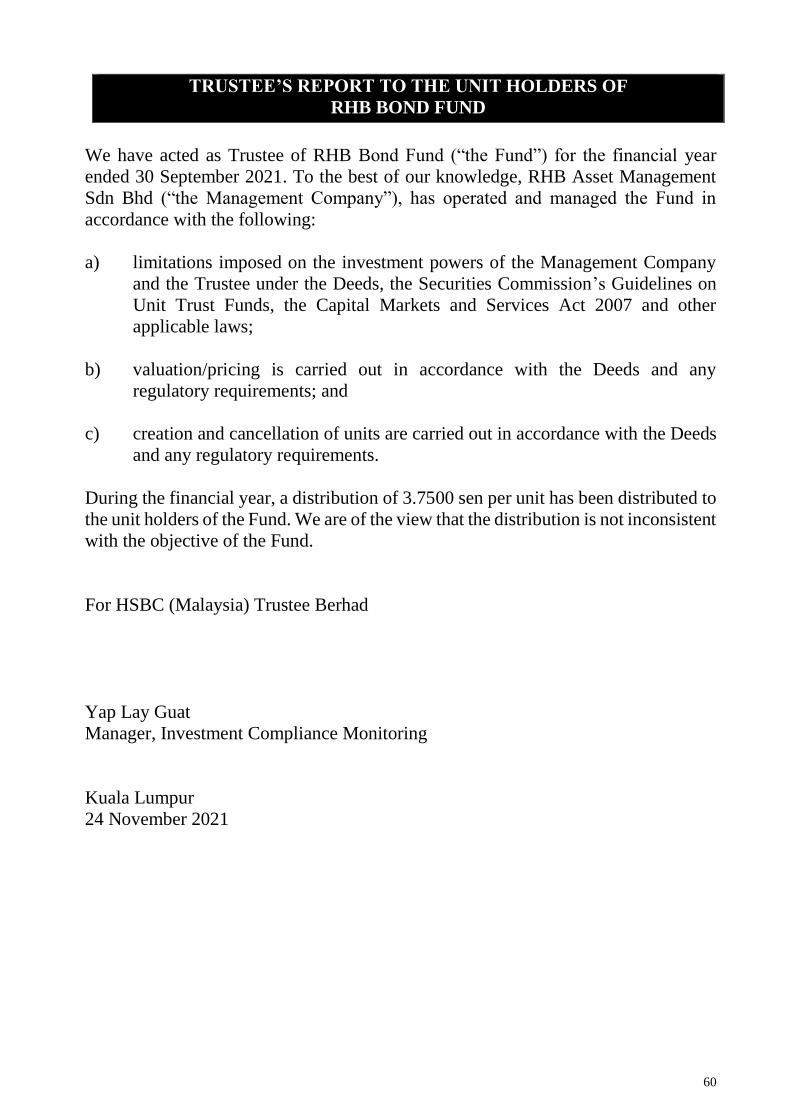
60
TRUSTEE’S REPORT TO THE UNIT HOLDERS OF
RHB BOND FUND
We have acted as Trustee of RHB Bond Fund (“the Fund”) for the financial year
ended 30 September 2021. To the best of our knowledge, RHB Asset Management
Sdn Bhd (“the Management Company”), has operated and managed the Fund in
accordance with the following:
a) limitations imposed on the investment powers of the Management Company
and the Trustee under the Deeds, the Securities Commission’s Guidelines on
Unit Trust Funds, the Capital Markets and Services Act 2007 and other
applicable laws;
b) valuation/pricing is carried out in accordance with the Deeds and any
regulatory requirements; and
c) creation and cancellation of units are carried out in accordance with the Deeds
and any regulatory requirements.
During the financial year, a distribution of 3.7500 sen per unit has been distributed to
the unit holders of the Fund. We are of the view that the distribution is not inconsistent
with the objective of the Fund.
For HSBC (Malaysia) Trustee Berhad
Yap Lay Guat
Manager, Investment Compliance Monitoring
Kuala Lumpur
24 November 2021

61
INDEPENDENT AUDITORS’ REPORT TO THE UNIT HOLDERS OF
RHB BOND FUND
REPORT ON THE AUDIT OF THE FINANCIAL STATEMENTS
Our opinion
In our opinion, the financial statements of RHB Bond Fund (“the Fund”) give a
true and fair view of the financial position of the Fund as at 30 September 2021
and of its financial performance and its cash flows for the financial year then ended
in accordance with Malaysian Financial Reporting Standards and International
Financial Reporting Standards.
What we have audited
We have audited the financial statements of the Fund, which comprise the
statement of financial position as at 30 September 2021, and the statement of
income and expenses, statement of changes in net asset value and statement of cash
flows for the financial year then ended, and notes to the financial statements,
including a summary of significant accounting policies, as set out on pages 11 to
58.
Basis for opinion
We conducted our audit in accordance with approved standards on auditing in
Malaysia and International Standards on Auditing. Our responsibilities under those
standards are further described in the “Auditors’ responsibilities for the audit of
the financial statements” section of our report.
We believe that the audit evidence we have obtained is sufficient and appropriate
to provide a basis for our opinion.
Independence and other ethical responsibilities
We are independent of the Fund in accordance with the By-Laws (on Professional
Ethics, Conduct and Practice) of the Malaysian Institute of Accountants (“By-
Laws”) and the International Ethics Standards Board for Accountants’
International Code of Ethics for Professional Accountants (including International
Independence Standards) (“IESBA Code”), and we have fulfilled our other ethical
responsibilities in accordance with the By-Laws and the IESBA Code.
62
INDEPENDENT AUDITORS’ REPORT TO THE UNIT HOLDERS OF
RHB BOND FUND (CONTINUED)
REPORT ON THE AUDIT OF THE FINANCIAL STATEMENTS
(CONTINUED)
Information other than the financial statements and auditors’ report thereon
The Manager of the Fund is responsible for the other information. The other
information comprises Manager’s Report, but does not include the financial
statements of the Fund and our auditors’ report thereon.
Our opinion on the financial statements of the Fund does not cover the other
information and we do not express any form of assurance conclusion thereon.
In connection with our audit of the financial statements of the Fund, our
responsibility is to read the other information and, in doing so, consider whether
the other information is materially inconsistent with the financial statements of the
Fund or our knowledge obtained in the audit or otherwise appears to be materially
misstated.
If, based on the work we have performed, we conclude that there is a material
misstatement of this other information, we are required to report that fact. We have
nothing to report in this regard.
Responsibilities of the Manager for the financial statements
The Manager of the Fund is responsible for the preparation of the financial
statements of the Fund that give a true and fair view in accordance with Malaysian
Financial Reporting Standards and International Financial Reporting Standards.
The Manager is also responsible for such internal control as the Manager
determines is necessary to enable the preparation of financial statements of the
Fund that are free from material misstatement, whether due to fraud or error.
In preparing the financial statements of the Fund, the Manager is responsible for
assessing the Fund’s ability to continue as a going concern, disclosing, as
applicable, matters related to going concern and using the going concern basis of
accounting unless the Manager either intends to liquidate the Fund or to terminate
the Fund, or has no realistic alternative but to do so.

63
INDEPENDENT AUDITORS’ REPORT TO THE UNIT HOLDERS OF
RHB BOND FUND (CONTINUED)
REPORT ON THE AUDIT OF THE FINANCIAL STATEMENTS
(CONTINUED)
Auditors’ responsibilities for the audit of the financial statements
Our objectives are to obtain reasonable assurance about whether the financial
statements of the Fund as a whole are free from material misstatement, whether
due to fraud or error, and to issue an auditors’ report that includes our opinion.
Reasonable assurance is a high level of assurance, but is not a guarantee that an
audit conducted in accordance with approved standards on auditing in Malaysia
and International Standards on Auditing will always detect a material misstatement
when it exists. Misstatements can arise from fraud or error and are considered
material if, individually or in the aggregate, they could reasonably be expected to
influence the economic decisions of users taken on the basis of these financial
statements.
As part of an audit in accordance with approved standards on auditing in Malaysia
and International Standards on Auditing, we exercise professional judgement and
maintain professional scepticism throughout the audit. We also:
(a) Identify and assess the risks of material misstatement of the financial
statements of the Fund, whether due to fraud or error, design and perform
audit procedures responsive to those risks, and obtain audit evidence that is
sufficient and appropriate to provide a basis for our opinion. The risk of not
detecting a material misstatement resulting from fraud is higher than for one
resulting from error, as fraud may involve collusion, forgery, intentional
omissions, misrepresentations, or the override of internal control.
(b) Obtain an understanding of internal control relevant to the audit in order to
design audit procedures that are appropriate in the circumstances, but not for
the purpose of expressing an opinion on the effectiveness of the Fund’s
internal control.
(c) Evaluate the appropriateness of accounting policies used and the
reasonableness of accounting estimates and related disclosures made by the
Manager.
64
INDEPENDENT AUDITORS’ REPORT TO THE UNIT HOLDERS OF
RHB BOND FUND (CONTINUED)
REPORT ON THE AUDIT OF THE FINANCIAL STATEMENTS
(CONTINUED)
Auditors’ responsibilities for the audit of the financial statements (continued)
(d) Conclude on the appropriateness of the Manager’s use of the going concern
basis of accounting and, based on the audit evidence obtained, whether a
material uncertainty exists related to events or conditions that may cast
significant doubt on the Fund’s ability to continue as a going concern. If we
conclude that a material uncertainty exists, we are required to draw attention
in our auditors’ report to the related disclosures in the financial statements
of the Fund or, if such disclosures are inadequate, to modify our opinion.
Our conclusions are based on the audit evidence obtained up to the date of
our auditors’ report. However, future events or conditions may cause the
Fund to cease to continue as a going concern.
(e) Evaluate the overall presentation, structure and content of the financial
statements of the Fund, including the disclosures, and whether the financial
statements of the Fund represent the underlying transactions and events in a
manner that achieves fair presentation.
We communicate with the Manager regarding, among other matters, the planned
scope and timing of the audit and significant audit findings, including any
significant deficiencies in internal control that we identify during our audit.
OTHER MATTERS
This report is made solely to the unit holders of the Fund and for no other purpose.
We do not assume responsibility to any other person for the content of this report.
PRICEWATERHOUSECOOPERS PLT
(LLP0014401-LCA & AF 1146)
Chartered Accountants
Kuala Lumpur
24 November 2021

65
CORPORATE INFORMATION
MANAGER
RHB Asset Management Sdn Bhd
REGISTERED OFFICE Level 10, Tower One, RHB Centre, Jalan Tun Razak, 50400 Kuala Lumpur
PRINCIPAL AND BUSINESS OFFICE
Level 8, Tower Two & Three, RHB Centre, Jalan Tun Razak, 50400 Kuala Lumpur
Email address: [email protected]
Tel: 03-9205 8000
Fax: 03-9205 8100
Website: www.rhbgroup.com
BOARD OF DIRECTORS
Mr Yap Chee Meng (Independent Non-Executive Chairman)
Mr Chin Yoong Kheong (Senior Independent Non-Executive Director)
Ms Ong Yin Suen (Managing Director / Chief Executive Officer)
YBhg Dato’ Darawati Hussain (Independent Non-Executive Director)
YBhg Datuk Seri Dr Govindan A/L Kunchamboo
(Independent Non-Executive Director)
Encik Mohd Rashid Bin Mohamad (Non-Independent Non-Executive Director)
(Appointed with effect from 11 August 2021)
INVESTMENT COMMITTEE MEMBERS
Mr Yap Chee Meng (Independent Chairman)
YBhg Dato’ Darawati Hussain
Puan Sharifatu Laila Syed Ali
CHIEF EXECUTIVE OFFICER Ms Ong Yin Suen
SECRETARIES
Encik Azman Shah Md Yaman (LS No. 0006901)
Cik Hasnita Sulaiman (MAICSA No. 7060582)
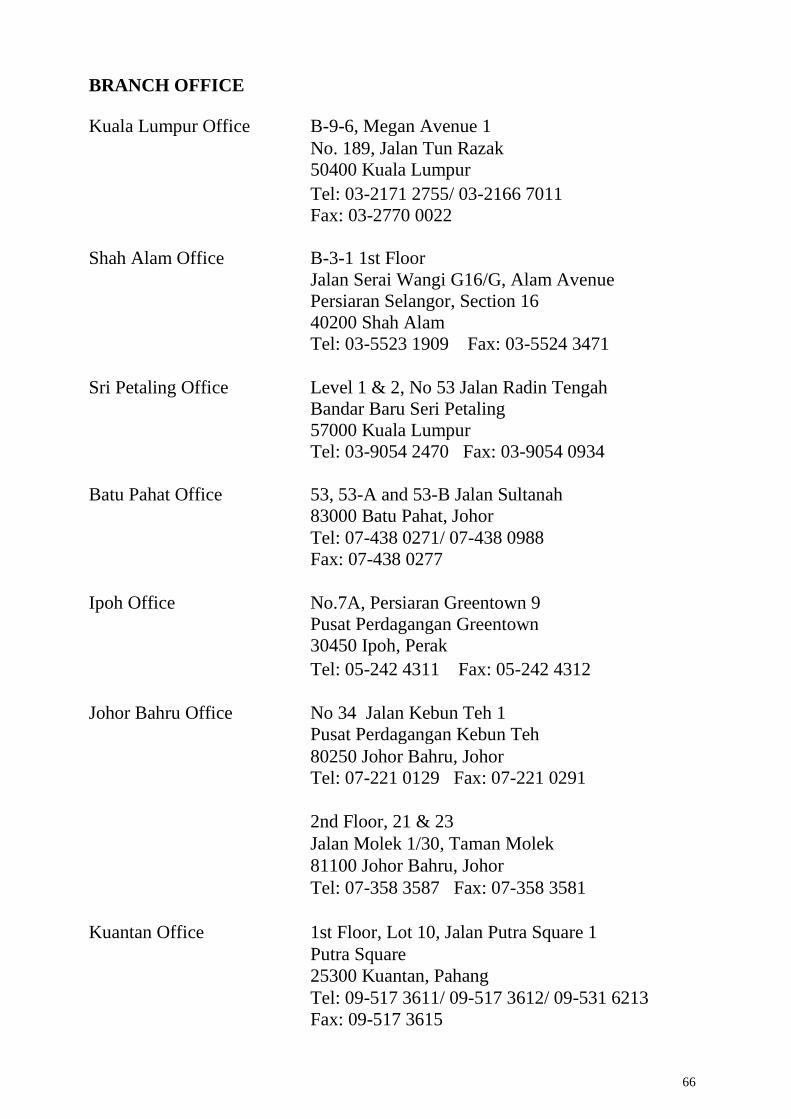
66
BRANCH OFFICE
Kuala Lumpur Office B-9-6, Megan Avenue 1
No. 189, Jalan Tun Razak
50400 Kuala Lumpur
Tel: 03-2171 2755/ 03-2166 7011
Fax: 03-2770 0022
Shah Alam Office B-3-1 1st Floor
Jalan Serai Wangi G16/G, Alam Avenue
Persiaran Selangor, Section 16
40200 Shah Alam
Tel: 03-5523 1909 Fax: 03-5524 3471
Sri Petaling Office Level 1 & 2, No 53 Jalan Radin Tengah
Bandar Baru Seri Petaling
57000 Kuala Lumpur
Tel: 03-9054 2470 Fax: 03-9054 0934
Batu Pahat Office 53, 53-A and 53-B Jalan Sultanah
83000 Batu Pahat, Johor
Tel: 07-438 0271/ 07-438 0988
Fax: 07-438 0277
Ipoh Office No.7A, Persiaran Greentown 9
Pusat Perdagangan Greentown
30450 Ipoh, Perak
Tel: 05-242 4311 Fax: 05-242 4312
Johor Bahru Office No 34 Jalan Kebun Teh 1
Pusat Perdagangan Kebun Teh
80250 Johor Bahru, Johor
Tel: 07-221 0129 Fax: 07-221 0291
2nd Floor, 21 & 23
Jalan Molek 1/30, Taman Molek
81100 Johor Bahru, Johor
Tel: 07-358 3587 Fax: 07-358 3581
Kuantan Office 1st Floor, Lot 10, Jalan Putra Square 1
Putra Square
25300 Kuantan, Pahang
Tel: 09-517 3611/ 09-517 3612/ 09-531 6213
Fax: 09-517 3615

67
Kuching Office Lot 133, Section 20, Sublot 2 & 3
1st Floor, Jalan Tun Ahmad Zaidi Adruce
93200 Kuching, Sarawak
Tel: 082-550 838 Fax: 082-550 508
Yung Kong Abell, Units 1-10
2nd Floor Lot 365
Section 50 Jalan Abell
93100 Kuching, Sarawak
Tel: 082-245 611 Fax: 082-230 326
Kota Bharu Office Ground Floor, No 3486-G
Jalan Sultan Ibrahim
15050 Kota Bharu, Kelantan
Tel: 09-740 6891 Fax: 09-740 6890
Kota Kinabalu Office Lot No. C-02-04, 2nd Floor
Block C, Warisan Square
Jalan Tun Fuad Stephens
88000 Kota Kinabalu, Sabah
Tel: 088-528 686/ 088-528 692
Fax: 088-528 685
Melaka Office 581B, Taman Melaka Raya
75000 Melaka
Tel: 06-284 4211/ 06-281 4110
Fax: 06-292 2212
Penang Office 3rd Floor, 44 Lebuh Pantai
10300 Georgetown, Penang
Tel: 04-264 5639 Fax: 04-264 5640
Prai Office No. 38, First Floor
Jalan Todak 2
Seberang Jaya
13700 Perai, Penang
Tel: 04-386 6670 Fax: 04-386 6528

68
TRUSTEE HSBC (Malaysia) Trustee Berhad
BANKER RHB Bank Berhad
AUDITORS PricewaterhouseCoopers PLT
TAX ADVISER PricewaterhouseCoopers Taxation Services Sdn Bhd
DISTRIBUTORS RHB Asset Management Sdn Bhd
RHB Bank Berhad
RHB Investment Bank Berhad
AmInvestment Bank Berhad
Areca Capital Sdn Bhd
CIMB Bank Berhad
CIMB Private Banking
Genexus Advisory Sdn Bhd
HSBC Bank Malaysia Berhad
iFAST Capital Sdn Bhd
Kenanga Investors Berhad
OCBC Bank (Malaysia) Berhad
Phillip Mutual Berhad
Standard Chartered Bank Malaysia Berhad
Standard Financial Adviser Sdn Bhd
UOB Kay Hian Securities (M) Sdn Bhd
United Overseas Bank (Malaysia) Berhad

69