Embed Size (px)
Citation preview

1
Pursuant to Chapter 38 of the Rules Governing the Listing of Securities on The Stock Exchange of Hong Kong Limited, the Securities and Futures Commission regulates Hong Kong Exchanges and Clearing Limited in relation to the listing of its shares on The Stock Exchange of Hong Kong Limited. The Securities and Futures Commission takes no responsibility for the contents of this announcement, makes no representation as to its accuracy or completeness, and expressly disclaims any liability whatsoever for any loss howsoever arising from or in reliance upon the whole or any part of the contents of this announcement.
(Financial figures in this announcement are expressed in Hong Kong dollar unless otherwise stated)
2017 INTERIM RESULTS, INTERIM DIVIDEND AND CLOSURE OF REGISTER OF MEMBERS
The Board is pleased to submit the unaudited consolidated results of the Group for the six months ended 30 June 2017.
FINANCIAL HIGHLIGHTS
Revenue and other income for the six months ended 30 June 2017 (1H 2017) was 10 per cent higher than the same period in 2016 (1H 2016). Key highlights for the period include: - An increase in Stock Exchange listing fees from more listed companies and an increase in newly listed DWs and
CBBCs; - A significant increase in net investment income from Corporate Funds and Margin Funds; - A one-off receipt of $55 million post-liquidation interest from the Lehman liquidators; and - A marginal reduction in Trading and Clearing fees, where a healthy increase in Cash Market turnover was offset by
declines in derivatives volumes, including commodities.
Operating expenses increased by 1 per cent against 1H 2016. Excluding a one-off insurance recovery of $23 million relating to legal expenses in respect of the warehouse litigation in the US, operating expenses increased by 3 per cent compared to the prior period.
The EBITDA margin of 72 per cent for 1H 2017 was 2 per cent higher than 1H 2016 reflecting both revenue growth and prudent cost management.
Profit attributable to shareholders rose by 17 per cent to $3,493 million.
Six months ended
30 Jun 2017
Six months ended
30 Jun 2016
Change
KEY MARKET STATISTICS ADT of equity products traded on the Stock Exchange ($bn) 61.4 48.3 27%
ADT of DWs, CBBCs and warrants traded on the Stock Exchange ($bn) 14.6 19.2 (24%)
2 ADT traded on the Stock Exchange ($bn) 76.0 67.5 13% Average daily number of derivatives contracts
traded on the Futures Exchange 424,546 488,566 (13%) Average daily number of stock options contracts
traded on the Stock Exchange
354,969
292,861
21%
Average daily volume of metals contracts traded on the LME (lots)
597,542
635,111
(6%)
* For the purposes of this announcement, EBITDA is defined as earnings before interest expenses and other finance costs, taxation,
depreciation and amortisation. It excludes the Group’s share of results of the joint venture.
Six months ended
30 Jun 2017 $m
Six months ended
30 Jun 2016 $m
Change
Revenue and other income 6,203 5,630 10%
Operating expenses 1,711 1,688 1%
EBITDA* 4,492 3,942 14%
Profit attributable to shareholders 3,493 2,985 17%
Basic earnings per share $2.86 $2.47 16%
Interim dividend per share $2.55 $2.21 15%
(Incorporated in Hong Kong with limited liability)
(Stock Code: 388)

2
CHAIRMAN’S STATEMENT The global financial markets started the year strong, driven by positive sentiment on improved global economic growth and stronger-than-expected economic performance in Mainland China. Nonetheless, uncertainty over the pace of the US Federal Reserve’s interest rate increases and balance sheet normalisation, Brexit talks and geopolitical tensions across the world, have continued to cloud global economic prospects and increase market vulnerability. Against this mixed backdrop, the Hong Kong securities market saw active trading in the first half of 2017, with an increase in average daily turnover of 13 per cent from the same period last year. Our IPO market also recorded growth in the number of new listings and funds raised by 80 per cent and 26 per cent respectively. Although the average daily number of derivatives contracts traded on the Futures Exchange decreased by 13 per cent, trading of our RMB Currency Futures stayed strong, with average daily volume up 37 per cent. Stock Options trading was strong as well, rising 21 per cent. In London, the average daily volume of metals contracts traded on the LME fell by 6 per cent amid continued weakness in the global metals market. For the six months ended 30 June 2017, the Group recorded consolidated revenue and other income of $6,203 million and a profit attributable to shareholders of $3,493 million, up 10 per cent and 17 per cent respectively from the corresponding period of 2016. The Board declared an interim dividend of $2.55 per share, which is 90 per cent of the profit attributable to shareholders. We are pleased to see that our mutual market access programme continues to contribute to China’s capital market development and consolidate Hong Kong’s gateway position connecting China and the rest of the world. With the successful launch of Bond Connect on 3 July 2017, another milestone was reached by providing international investors with access to the Mainland bond market via Hong Kong. MSCI’s recent decision to add Mainland A shares to its benchmark emerging markets index was an acknowledgement of the important role of Stock Connects in the opening up of the Mainland stock markets. In order to diversify our business and support Hong Kong becoming China’s offshore risk management centre, we continue to expand our capabilities in fixed income, currency and commodities. We introduced our first RMB Currency Options on 20 March 2017 and physically settled CNH and USD Gold Futures contracts on 10 July 2017 to provide investors with more options for trading and risk management. The LME also rolled out its own USD-traded Gold Futures contract on 10 July 2017 alongside a USD-traded Silver Futures contract through LMEprecious to capture the increasing demand for precious metals trading. Preparations are underway for the Qianhai Mercantile Exchange, which has a long term target to support Mainland China’s real economy and its pricing power in the global commodities market. As an exchange operator, we are committed to continuing improvement of our market quality as well as competitiveness in response to the evolving market environment. In Hong Kong, we launched a market consultation in June to seek views on the proposed New Board to attract listings of new economy companies and on our GEM reform. We also published a consultation paper in June on proposed after-hours trading (T+1 session) enhancements. To further enhance our securities market, we implemented Phase 2 of the Closing Auction Session on 24 July 2017. In London, we issued a discussion paper in April on the LME’s market structure with a view towards improving the accessibility and efficiency of its trading, and we are now analysing the market feedback. Details of our progress in various initiatives are set out in the Business Review section of this announcement. In tackling the challenges and opportunities ahead, we will continue to work closely with our regulators and other stakeholders. We are committed to providing a quality and diversified market which can help transform Hong Kong into China’s global wealth management centre. CHOW Chung Kong Chairman

3
MANAGEMENT DISCUSSION AND ANALYSIS
BUSINESS REVIEW
Fig. 1 – Market activity and Group Revenue
Market sentiment continued to improve in Q21 2017 with Cash Market headline ADT rising to $77.8 billion, 5 per cent above Q1 2017. The positive momentum on Stock Connects also continued, with Northbound and Southbound ADT being 47 per cent and 15 per cent higher than Q1 2017. However, market volatility continued to decline reaching lows last seen in 20142, which adversely impacted derivatives volumes. While the average daily number of HKFE contracts traded in Q2 2017 was slightly up against Q1 2017, it was 16 per cent below Q1 2016 when market volatility was approximately twice as high as Q2 20172. Revenue and other income overall was 4 per cent higher than Q1 2017. This arose from seasonal increases in depository, custody and nominee services fees, partially offset by a one-off receipt of $55 million post liquidation interest from Lehman’s liquidators in Q1 2017, and net investment income in Q2 2017 being $41 million lower. For 1H 2017, revenue and other income rose by 10 per cent against 1H 2016, mainly due to a significant increase in net investment income of $466 million and a one-off receipt of $55 million post liquidation interest from Lehman’s liquidators. Excluding these items, revenue increased by 1 per cent with higher volumes in the Cash Market being offset by lower volumes in HKFE and the LME. Operating expenses for 1H 2017 increased by 1 per cent against 1H 2016. After adjusting for a one-off insurance recovery of $23 million of legal costs, relating to the warehouse litigation in the US (which for the LME and HKEX defendants has now been concluded), operating expenses increased by 3 per cent compared to 1H 2016. This increase primarily reflected increases in staff costs and premises expenses, which were partly offset by savings in IT costs. Having regard to persistent global economic uncertainties, the Group continues to maintain a prudent approach to cost management.
1 Q1 = first quarter, Q2 = second quarter, Q3 = third quarter, Q4 = fourth quarter, 1H = first half, 2H = second half 2 Reference based on VHSI (the HSI volatility Index)

4
569 714
109
114 371
398
200
238 33
48
270 291
1,012 1,221
1,282
1,512
Trading fees Trading tariff Stock Exchange listing fees
Market data fees Other revenue
1H 2016 1H 2017 1H 2016 1H 2017 1H 2016 1H 2017
Business Update and Analysis of Results by Operating Segment
Six months ended
30 Jun 2017
Six months ended
30 Jun 2016
Change
Revenue
and other income
$m
EBITDA $m
Revenue and other
income $m
EBITDA $m
Revenue and other
income %
EBITDA %
Results by segment:
Cash 1,512 1,221 1,282 1,012 18% 21%
Equity and Financial Derivatives 952 730 1,065 836 (11%) (13%)
Commodities 721 440 804 513 (10%) (14%)
Clearing 2,308 1,930 2,122 1,770 9% 9%
Platform and Infrastructure 279 204 264 190 6% 7%
Corporate Items 431 (33) 93 (379) 363% (91%)
6,203 4,492 5,630 3,942 10% 14%
Cash Segment
Analysis of Results Trading fees and trading tariff increased by 22 per cent compared to 1H 2016, below the 27 per cent growth in ADT. This was primarily because of an increase in average transaction size, which dampened the increase in trading tariff income, and the significant growth in Southbound Trading, where we share half of the trading fee with the Mainland exchanges, exceeding the growth of Northbound Trading. Stock Exchange listing fees rose by $27 million, reflecting a $21 million increase in annual listing fees from a higher number of listed companies and a $6 million increase in initial listing fees due to more newly listed companies than in 1H 2016. Market data fees increased by 19 per cent as a result of higher allocated revenue following an increase in the volume of cash equities traded, alongside decreases in the volumes of DWs, CBBCs and warrants traded. Operating expenses rose by 8 per cent due to additional headcount for strategic projects.
1H 2017 vs 1H 2016 ($m)
1 Excludes DWs, CBBCs and warrants which are included under
the Equity and Financial Derivatives segment
Revenue1
+18%
Operating expenses
+8%
EBITDA
+21%
81% 79%
5
Business Update
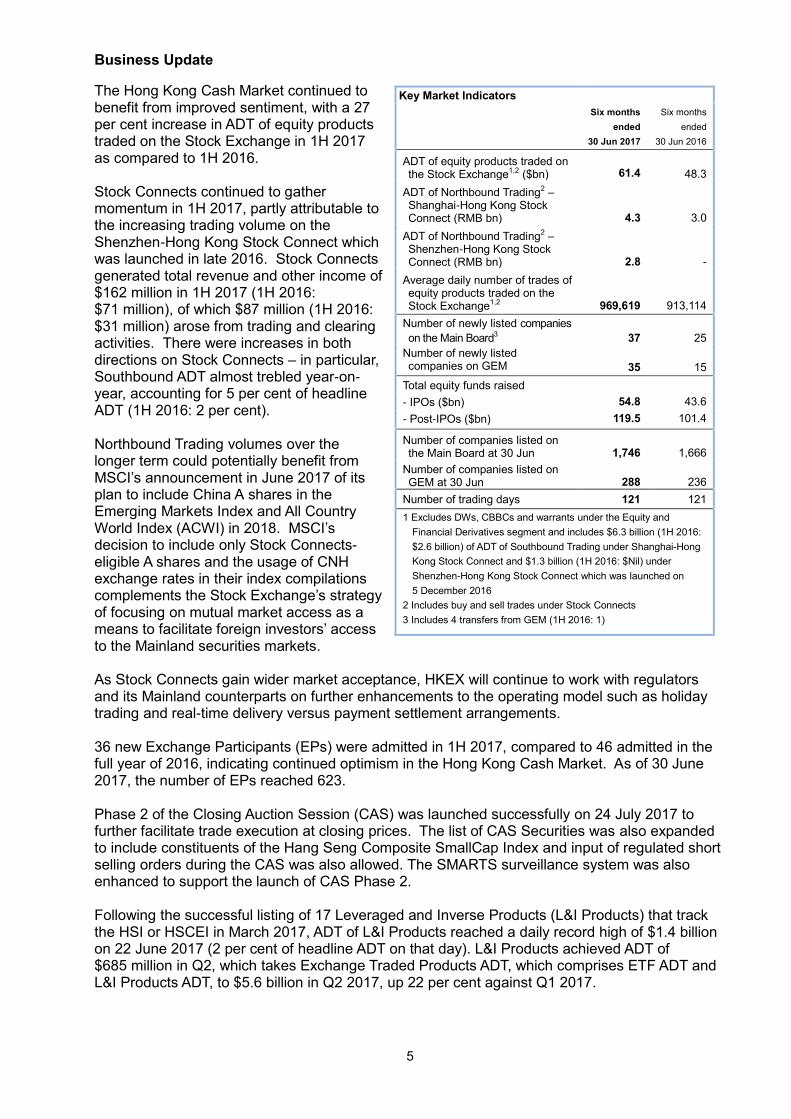
The Hong Kong Cash Market continued to benefit from improved sentiment, with a 27 per cent increase in ADT of equity products traded on the Stock Exchange in 1H 2017 as compared to 1H 2016. Stock Connects continued to gather momentum in 1H 2017, partly attributable to the increasing trading volume on the Shenzhen-Hong Kong Stock Connect which was launched in late 2016. Stock Connects generated total revenue and other income of $162 million in 1H 2017 (1H 2016: $71 million), of which $87 million (1H 2016: $31 million) arose from trading and clearing activities. There were increases in both directions on Stock Connects – in particular, Southbound ADT almost trebled year-on-year, accounting for 5 per cent of headline ADT (1H 2016: 2 per cent). Northbound Trading volumes over the longer term could potentially benefit from MSCI’s announcement in June 2017 of its plan to include China A shares in the Emerging Markets Index and All Country World Index (ACWI) in 2018. MSCI’s decision to include only Stock Connects-eligible A shares and the usage of CNH exchange rates in their index compilations complements the Stock Exchange’s strategy of focusing on mutual market access as a means to facilitate foreign investors’ access to the Mainland securities markets. As Stock Connects gain wider market acceptance, HKEX will continue to work with regulators and its Mainland counterparts on further enhancements to the operating model such as holiday trading and real-time delivery versus payment settlement arrangements. 36 new Exchange Participants (EPs) were admitted in 1H 2017, compared to 46 admitted in the full year of 2016, indicating continued optimism in the Hong Kong Cash Market. As of 30 June 2017, the number of EPs reached 623. Phase 2 of the Closing Auction Session (CAS) was launched successfully on 24 July 2017 to further facilitate trade execution at closing prices. The list of CAS Securities was also expanded to include constituents of the Hang Seng Composite SmallCap Index and input of regulated short selling orders during the CAS was also allowed. The SMARTS surveillance system was also enhanced to support the launch of CAS Phase 2. Following the successful listing of 17 Leveraged and Inverse Products (L&I Products) that track the HSI or HSCEI in March 2017, ADT of L&I Products reached a daily record high of $1.4 billion on 22 June 2017 (2 per cent of headline ADT on that day). L&I Products achieved ADT of $685 million in Q2, which takes Exchange Traded Products ADT, which comprises ETF ADT and L&I Products ADT, to $5.6 billion in Q2 2017, up 22 per cent against Q1 2017.
Key Market Indicators
Six months
ended
30 Jun 2017
Six months
ended
30 Jun 2016
ADT of equity products traded on the Stock Exchange1,2 ($bn)
61.4
48.3
ADT of Northbound Trading2 – Shanghai-Hong Kong Stock Connect (RMB bn)
4.3
3.0
ADT of Northbound Trading2 –Shenzhen-Hong Kong Stock Connect (RMB bn)
2.8
-
Average daily number of trades of equity products traded on the Stock Exchange1,2
969,619
913,114
Number of newly listed companies
on the Main Board3
37
25
Number of newly listed companies on GEM
35
15
Total equity funds raised
- IPOs ($bn) 54.8 43.6
- Post-IPOs ($bn) 119.5 101.4
Number of companies listed on the Main Board at 30 Jun
1,746
1,666
Number of companies listed on GEM at 30 Jun
288
236
Number of trading days 121 121
1 Excludes DWs, CBBCs and warrants under the Equity and
Financial Derivatives segment and includes $6.3 billion (1H 2016:
$2.6 billion) of ADT of Southbound Trading under Shanghai-Hong
Kong Stock Connect and $1.3 billion (1H 2016: $Nil) under
Shenzhen-Hong Kong Stock Connect which was launched on
5 December 2016
2 Includes buy and sell trades under Stock Connects
3 Includes 4 transfers from GEM (1H 2016: 1)

6
In Q2 2017, HKEX launched the Asia ETF Forum, a series of roadshows in Hong Kong, South Korea and Taiwan targeting institutional and intermediary investors with a goal of promoting HKEX’s exchange traded products. In Q3 2017, the Asia ETF Forum will be conducted in Singapore and China. HKEX continues its efforts to increase the visibility and penetration of Hong Kong securities market data in the Mainland. In July 2017, a market data feed which includes Stock Connects turnover statistics and the Northbound Trading daily quota balance was launched as a complimentary service to information vendors. As part of HKEX’s continuing efforts to enhance its surveillance and monitoring work, SEHK introduced an Annual Attestation and Inspection Programme for EPs. The programme comprises: (i) attestation of compliance by EPs; and (ii) on-site inspection of selected EPs. The programme aims to further enhance HKEX’s monitoring and surveillance efforts to ensure EPs maintain strict adherence to our rules. HKEX remains committed to bringing quality issuers to list in Hong Kong, with an increased focus on high quality “new economy” companies. Kicking off the series of HKEX initiatives to promote Hong Kong as a global technology investment hub, HKEX and the Hong Kong Science and Technology Parks Corporation jointly organised the “Road to IPO” Conference for “new economy” companies on 2 June 2017. Over 300 attendees from “new economy” potential issuers and over 100 intermediaries participated, with positive feedback received. On 18 July 2017, HKEX expanded its efforts to the Mainland, jointly hosting a similar event in Beijing with Zhongguancun, the Mainland’s first national science and technology park. Over 100 representatives from key financial intermediaries in Hong Kong joined the seminar for in-depth discussions with over 300 representatives from Zhongguancun enterprises. With respect to promoting HKEX as the preferred listing venue for Mainland China and international enterprises, HKEX organised 11 large-scale IPO events and conducted over 40 major seminars across Mainland China and globally in 1H 2017. Following the success of the first Corporate Access Day held in Shenzhen in January 2017, HKEX organised a second event in Shanghai in June 2017. Over 150 analysts from 30 Mainland research houses, 140 Mainland buy-side institutional investors and 80 representatives from Hong Kong listed companies attended the event. In the interest of maintaining the reputation and efficiency of the Cash Market, the Stock Exchange continues to provide guidance and interpretations to the market on a wide variety of topics. These have included “Reasons for rejection and return of new listing applications”, “Whether certain proposed acquisitions would constitute a reverse takeover”, “New country guide on “Israel” for listing of overseas companies”, publishing the first Enforcement Newsletter and launching a new series of “director training webcasts”. In June 2017, the Stock Exchange launched a consultation to seek public feedback on a package of proposals to broaden capital market access in Hong Kong and strengthen Hong Kong’s listing regime through two separate papers: (i) the New Board Concept Paper; and (ii) the Consultation Paper on the Review of GEM and Changes to the GEM and Main Board Listing Rules. The New Board concept paper is intended to complement and supplement HKEX’s existing framework and attract “new economy” companies to Hong Kong, thereby offering investors a more diverse range of exposures. The Stock Exchange invites market feedback on the proposals contained in the two papers. The public comment period for both papers will end in August 2017.

7
279 219
462
396
50
45
160
195
109
90
5
7
229 222
836 730
1,065
952
Trading fees and trading tariffof DWs, CBBCs and warrants
Trading fees of derivatives contractstraded on the Futures Exchange
Trading tariff of stock optionscontracts
Stock Exchange listing fees
Market data fees Other revenue
1H 2016 1H 2017 1H 2016 1H 2017 1H 2016 1H 2017
2
1,2
Equity and Financial Derivatives Segment
Analysis of Results The trading of derivatives fell compared to 1H 2016 as a result of significant declines in market volatility, which in Q2 fell to levels not seen since 2014. Trading fees and trading tariff of DWs, CBBCs and warrants declined by 22 per cent, compared to 1H 2016, reflecting the 24 per cent decrease in ADT. Trading fees of derivatives contracts traded on the Futures Exchange declined by 14 per cent compared to 1H 2016 due to a 13 per cent decrease in ADV of derivatives contracts traded. Stock Exchange listing fees rose by 22 per cent primarily reflecting an increase in the number of newly listed DWs and CBBCs. Operating expenses decreased by 3 per cent as a result of internal cost allocations that reflect the relative volumes of cash equities and equity derivatives. Business Update ADV of derivatives contracts traded on the Futures Exchange in 1H 2017 dropped by 13 per cent against 1H 2016 due to reduced market volatility. Nevertheless, the ADV grew 2 per cent in Q2 2017 against Q1 2017. ADV of stock options contracts traded in 1H 2017 increased 21 per cent year-on-year, driven by increased trading in stock options of large blue-chip stocks, reflecting the increased volumes seen on the equity Cash Market. Open interest in futures and options set a new record of 14,768,896 contracts on 28 June 2017. In addition, the following record single day volumes and open interests were achieved during 1H 2017:
1H 2017 vs 1H 2016 ($m)
1 Excludes London Metal Mini Futures contracts which are included under the Commodities segment
2 Excludes trading fees and trading tariff allocated to the Clearing segment (Derivatives contracts traded on the Futures Exchange – 1H 2017: $103 million; 1H 2016: $118 million; stock options contracts – 1H 2017: $28 million; 1H 2016: $24 million)
.
1 2 3
Key Market Indicators
Key Market Indicators
Six months
ended
30 Jun 2017
Six months
ended
30 Jun 2016
ADT of DWs, CBBCs and
warrants traded on the Stock
Exchange ($bn)
14.6
19.2
Average daily number of trades of
DWs, CBBCs and warrants
traded on the Stock Exchange
168,934
198,809
ADV of derivatives contracts
traded on the Futures
Exchange1
424,535
488,438
ADV of stock options contracts
traded on the Stock Exchange
354,969
292,861
Number of newly listed DWs 3,034 2,321
Number of newly listed CBBCs 4,732 4,406
ADV of contracts traded
during AHFT1
26,280
40,729
Number of trading days 121 121
At
30 Jun 2017
At
30 Jun 2016
Open interest of futures and options contracts1
11,315,220
8,571,036
1 Excludes London Metal Mini Futures contracts which are
included under the Commodities segment
Revenue
-11%
77% 78%
Operating expenses
-3%
EBITDA
-13%
8
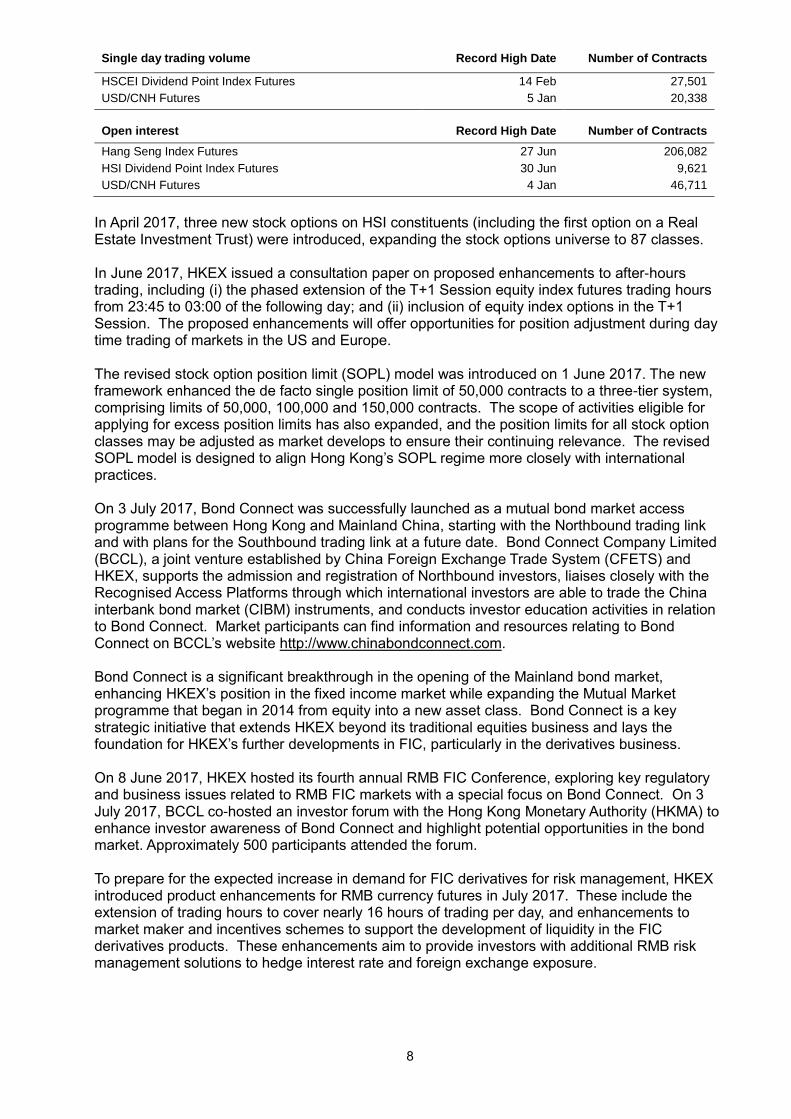
Single day trading volume Record High Date Number of Contracts
HSCEI Dividend Point Index Futures 14 Feb 27,501
USD/CNH Futures 5 Jan 20,338
Open interest
Record High Date
Number of Contracts
Hang Seng Index Futures 27 Jun 206,082
HSI Dividend Point Index Futures 30 Jun 9,621
USD/CNH Futures 4 Jan 46,711
In April 2017, three new stock options on HSI constituents (including the first option on a Real Estate Investment Trust) were introduced, expanding the stock options universe to 87 classes. In June 2017, HKEX issued a consultation paper on proposed enhancements to after-hours trading, including (i) the phased extension of the T+1 Session equity index futures trading hours from 23:45 to 03:00 of the following day; and (ii) inclusion of equity index options in the T+1 Session. The proposed enhancements will offer opportunities for position adjustment during day time trading of markets in the US and Europe. The revised stock option position limit (SOPL) model was introduced on 1 June 2017. The new framework enhanced the de facto single position limit of 50,000 contracts to a three-tier system, comprising limits of 50,000, 100,000 and 150,000 contracts. The scope of activities eligible for applying for excess position limits has also expanded, and the position limits for all stock option classes may be adjusted as market develops to ensure their continuing relevance. The revised SOPL model is designed to align Hong Kong’s SOPL regime more closely with international practices. On 3 July 2017, Bond Connect was successfully launched as a mutual bond market access programme between Hong Kong and Mainland China, starting with the Northbound trading link and with plans for the Southbound trading link at a future date. Bond Connect Company Limited (BCCL), a joint venture established by China Foreign Exchange Trade System (CFETS) and HKEX, supports the admission and registration of Northbound investors, liaises closely with the Recognised Access Platforms through which international investors are able to trade the China interbank bond market (CIBM) instruments, and conducts investor education activities in relation to Bond Connect. Market participants can find information and resources relating to Bond Connect on BCCL’s website http://www.chinabondconnect.com. Bond Connect is a significant breakthrough in the opening of the Mainland bond market, enhancing HKEX’s position in the fixed income market while expanding the Mutual Market programme that began in 2014 from equity into a new asset class. Bond Connect is a key strategic initiative that extends HKEX beyond its traditional equities business and lays the foundation for HKEX’s further developments in FIC, particularly in the derivatives business. On 8 June 2017, HKEX hosted its fourth annual RMB FIC Conference, exploring key regulatory and business issues related to RMB FIC markets with a special focus on Bond Connect. On 3 July 2017, BCCL co-hosted an investor forum with the Hong Kong Monetary Authority (HKMA) to enhance investor awareness of Bond Connect and highlight potential opportunities in the bond market. Approximately 500 participants attended the forum. To prepare for the expected increase in demand for FIC derivatives for risk management, HKEX introduced product enhancements for RMB currency futures in July 2017. These include the extension of trading hours to cover nearly 16 hours of trading per day, and enhancements to market maker and incentives schemes to support the development of liquidity in the FIC derivatives products. These enhancements aim to provide investors with additional RMB risk management solutions to hedge interest rate and foreign exchange exposure.
9
644 561
95
91
65
69
291 281
513 440
804
721
Trading fees and trading tariff Market data fees
Other revenue
1H 2016 1H 2017 1H 2016 1H 2017 1H 2016 1H 2017
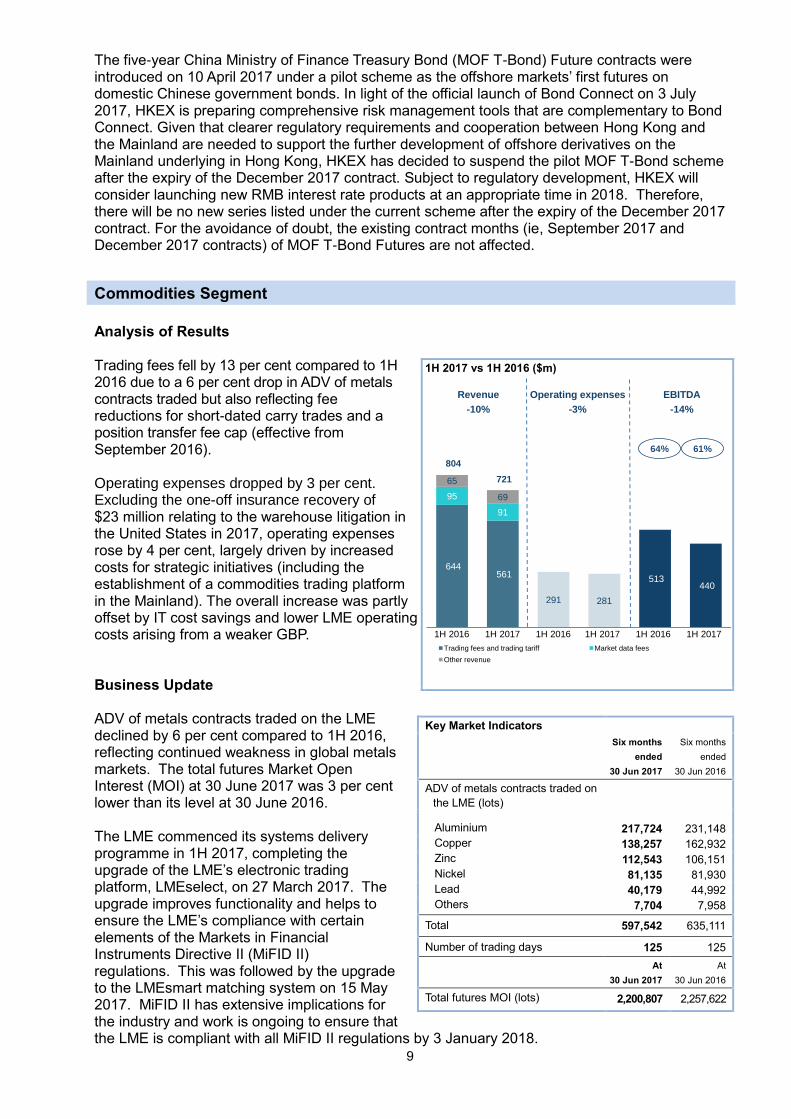
The five-year China Ministry of Finance Treasury Bond (MOF T-Bond) Future contracts were introduced on 10 April 2017 under a pilot scheme as the offshore markets’ first futures on domestic Chinese government bonds. In light of the official launch of Bond Connect on 3 July 2017, HKEX is preparing comprehensive risk management tools that are complementary to Bond Connect. Given that clearer regulatory requirements and cooperation between Hong Kong and the Mainland are needed to support the further development of offshore derivatives on the Mainland underlying in Hong Kong, HKEX has decided to suspend the pilot MOF T-Bond scheme after the expiry of the December 2017 contract. Subject to regulatory development, HKEX will consider launching new RMB interest rate products at an appropriate time in 2018. Therefore, there will be no new series listed under the current scheme after the expiry of the December 2017 contract. For the avoidance of doubt, the existing contract months (ie, September 2017 and December 2017 contracts) of MOF T-Bond Futures are not affected.
Commodities Segment
Analysis of Results Trading fees fell by 13 per cent compared to 1H 2016 due to a 6 per cent drop in ADV of metals contracts traded but also reflecting fee reductions for short-dated carry trades and a position transfer fee cap (effective from September 2016). Operating expenses dropped by 3 per cent. Excluding the one-off insurance recovery of $23 million relating to the warehouse litigation in the United States in 2017, operating expenses rose by 4 per cent, largely driven by increased costs for strategic initiatives (including the establishment of a commodities trading platform in the Mainland). The overall increase was partly offset by IT cost savings and lower LME operating costs arising from a weaker GBP. Business Update ADV of metals contracts traded on the LME declined by 6 per cent compared to 1H 2016, reflecting continued weakness in global metals markets. The total futures Market Open Interest (MOI) at 30 June 2017 was 3 per cent lower than its level at 30 June 2016. The LME commenced its systems delivery programme in 1H 2017, completing the upgrade of the LME’s electronic trading platform, LMEselect, on 27 March 2017. The upgrade improves functionality and helps to ensure the LME’s compliance with certain elements of the Markets in Financial Instruments Directive II (MiFID II) regulations. This was followed by the upgrade to the LMEsmart matching system on 15 May 2017. MiFID II has extensive implications for the industry and work is ongoing to ensure that the LME is compliant with all MiFID II regulations by 3 January 2018.
1H 2017 vs 1H 2016 ($m)
Key Market Indicators
Six months
ended
30 Jun 2017
Six months
ended
30 Jun 2016
ADV of metals contracts traded on
the LME (lots)
Aluminium 217,724 231,148
Copper 138,257 162,932
Zinc 112,543 106,151
Nickel 81,135 81,930
Lead 40,179 44,992
Others 7,704 7,958
Total 597,542 635,111
Number of trading days 125 125
At
30 Jun 2017
At
30 Jun 2016
Total futures MOI (lots)
2,200,807 2,257,622
Revenue
-10%
61% 64%
Operating expenses
-3%
EBITDA
-14%
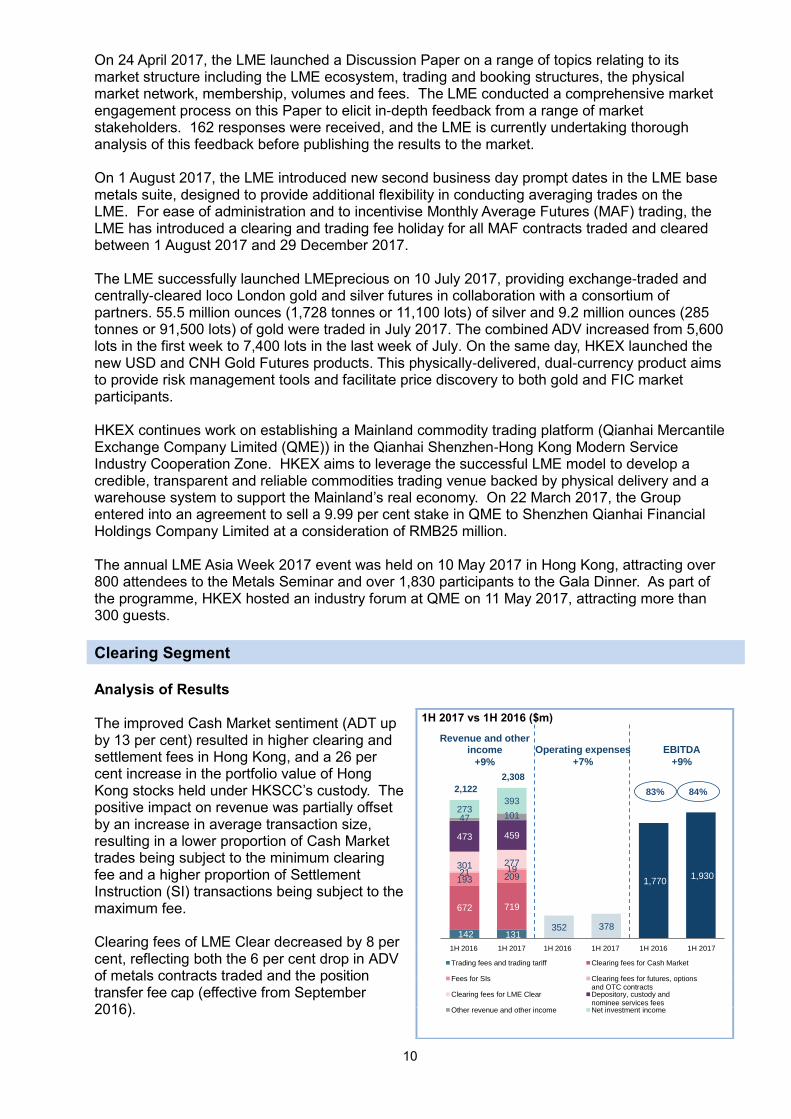
10
142 131
672 719
193 209 21 19 301 277
473 459
47 101 273
393
352 378
1,770 1,930
2,122
2,308
Trading fees and trading tariff Clearing fees for Cash Market
Fees for SIs Clearing fees for futures, optionsand OTC contracts
Clearing fees for LME Clear Depository, custody andnominee services fees
Other revenue and other income Net investment income
1H 2016 1H 2017 1H 2016 1H 2017 1H 2016 1H 2017
On 24 April 2017, the LME launched a Discussion Paper on a range of topics relating to its market structure including the LME ecosystem, trading and booking structures, the physical market network, membership, volumes and fees. The LME conducted a comprehensive market engagement process on this Paper to elicit in-depth feedback from a range of market stakeholders. 162 responses were received, and the LME is currently undertaking thorough analysis of this feedback before publishing the results to the market. On 1 August 2017, the LME introduced new second business day prompt dates in the LME base metals suite, designed to provide additional flexibility in conducting averaging trades on the LME. For ease of administration and to incentivise Monthly Average Futures (MAF) trading, the LME has introduced a clearing and trading fee holiday for all MAF contracts traded and cleared between 1 August 2017 and 29 December 2017. The LME successfully launched LMEprecious on 10 July 2017, providing exchange-traded and centrally-cleared loco London gold and silver futures in collaboration with a consortium of partners. 55.5 million ounces (1,728 tonnes or 11,100 lots) of silver and 9.2 million ounces (285 tonnes or 91,500 lots) of gold were traded in July 2017. The combined ADV increased from 5,600 lots in the first week to 7,400 lots in the last week of July. On the same day, HKEX launched the new USD and CNH Gold Futures products. This physically-delivered, dual-currency product aims to provide risk management tools and facilitate price discovery to both gold and FIC market participants. HKEX continues work on establishing a Mainland commodity trading platform (Qianhai Mercantile Exchange Company Limited (QME)) in the Qianhai Shenzhen-Hong Kong Modern Service Industry Cooperation Zone. HKEX aims to leverage the successful LME model to develop a credible, transparent and reliable commodities trading venue backed by physical delivery and a warehouse system to support the Mainland’s real economy. On 22 March 2017, the Group entered into an agreement to sell a 9.99 per cent stake in QME to Shenzhen Qianhai Financial Holdings Company Limited at a consideration of RMB25 million. The annual LME Asia Week 2017 event was held on 10 May 2017 in Hong Kong, attracting over 800 attendees to the Metals Seminar and over 1,830 participants to the Gala Dinner. As part of the programme, HKEX hosted an industry forum at QME on 11 May 2017, attracting more than 300 guests.
Clearing Segment
Analysis of Results The improved Cash Market sentiment (ADT up by 13 per cent) resulted in higher clearing and settlement fees in Hong Kong, and a 26 per cent increase in the portfolio value of Hong Kong stocks held under HKSCC’s custody. The positive impact on revenue was partially offset by an increase in average transaction size, resulting in a lower proportion of Cash Market trades being subject to the minimum clearing fee and a higher proportion of Settlement Instruction (SI) transactions being subject to the maximum fee. Clearing fees of LME Clear decreased by 8 per cent, reflecting both the 6 per cent drop in ADV of metals contracts traded and the position transfer fee cap (effective from September 2016).
1H 2017 vs 1H 2016 ($m)
Revenue and other income
+9%
84% 83%
Operating expenses
+7%
EBITDA
+9%

11
The 9 per cent increase in revenue and other income was attributable to a one-off post-liquidation interest payment of $55 million from the liquidators of Lehman, and a $120 million increase in net investment income from Margin Funds and Clearing House Funds (see the analysis below):
Six months ended 30 Jun 2017 Six months ended 30 Jun 2016
Margin
Funds
$m
Clearing
House
Funds
$m
Total
$m
Margin
Funds
$m
Clearing
House
Funds
$m
Total
$m
Net investment income from:
- Cash and bank deposits 363 11 374 253 10 263
- Debt securities 19 - 19 8 - 8
- Exchange gains - - - 2 - 2
Total net investment income
382 11 393 263 10 273
Average fund size ($bn)
129.7 10.2 139.9 117.2 7.6 124.8
Annualised net investment return
0.59% 0.21% 0.56% 0.45% 0.28% 0.44%
The increase in net investment income of Margin Funds in 1H 2017 arose from higher interest income on cash and bank deposits, attributable to both higher interest rates and higher average Margin Fund size for HKCC. The increase in funds arose from a combination of higher open interests and increased margin requirements per contract.
Operating expenses increased by 7 per cent, mainly as a result of increased staff costs, premises costs and bank charges. Business Update The portfolio value held under Southbound and Northbound Trading of Stock Connects continued to increase and reached $594 billion at 30 June 2017 (30 June 2016: $211 billion) and RMB347 billion (30 June 2016: RMB138 billion) respectively. As a result, Stock Connect related depository, custody and nominee services fee income rose by 160 per cent to $26 million in 1H 2017 (1H 2016: $10 million). The newly launched USD and CNH Gold Futures contracts are the first physically delivered commodities contracts cleared by HKCC. HKCC has appointed Brink’s Hong Kong Limited as the Approved Depository to conduct the physical delivery of gold. At the date of launch, eight HKCC Clearing Participants (CPs) became eligible “Physical Delivery Participants” to conduct physical delivery of gold. HKCC introduced further margining efficiencies for CPs in derivatives products by offering margin offset between HSI and HSCEI futures and options from Q1 2017. This follows the introduction of margin offset between USD/CNH currency futures and CNH/USD currency futures in 2016, further reducing costs for CPs. OTC Clear launched client clearing services and accepted non-cash collateral in Q1 2017. In Q2 2017, clearing was extended to HKD Basis Swaps and non-deliverable interest rate swaps denominated in five Asian currencies. In 1H 2017, OTC Clear cleared US$8.5 billion notional value, focusing on USD/CNH Cross Currency Swaps (CCS), CNY non-deliverable interest rate swaps and HKD interest rate swaps. The total cumulative outstanding notional value at 30 June 2017 exceeded US$13 billion (30 June 2016: US$3.4 billion).
Key Market Indicators
Six months
ended
30 Jun 2017
Six months
ended
30 Jun 2016
ADT traded on the Stock Exchange ($bn)
76.0
67.5 Average daily number of Stock
Exchange trades
1,138,553
1,111,923
Average daily value of SIs ($bn) 204.1 177.6 Average daily number of SIs 87,781 83,391

12
200 206
62 71
2 2
74 75
190 204
264 279
Network fees Hosting services fees Other revenue - others
1H 2016 1H 2017 1H 2016 1H 2017 1H 2016 1H 2017
In Q2 2017, LME Clear delivered an upgrade to its clearing system, LMEmercury, which included the ability to provide clearing services for LMEprecious. LME Clear has also invested in its systems in order to deliver a MiFID II compliant clearing model and to meet the requirements of the Bank of England’s new reporting regime. MiFID II has extensive implications for the industry and work is ongoing to ensure that LME Clear is compliant with all MiFID II regulations by 3 January 2018.
Platform and Infrastructure Segment
Analysis of Results Network fees rose by 3 per cent as more Exchange Participants migrated from the obsolete Open Gateway to the HKEX Orion Central Gateway. Hosting services fees increased by 15 per cent due to organic growth from subscription from new customers and increased usage of existing customers. Business Update During 1H 2017, all major trading, clearing, settlement, and market data dissemination systems for the Cash, Derivatives and Commodities Markets continued to perform reliably. On 27 March 2017 and 18 April 2017, the LME experienced software incidents, the second of which temporarily delayed the clearing processes for a number of trades. These matters have been fully resolved. Implementation of the Orion Trading Platform – Securities Market platform, which replaces the current Third Generation Automatic Order Matching and Execution System (AMS/3.8), remains on track. A market communication programme commenced in Q1 2017 with the publication of an Information Paper and briefing sessions for EPs. Functional and technical user acceptance tests are in progress and are targeted to finish in Q3 2017. The new system is planned to be introduced in Q4 2017, and will allow HKEX to support new functionalities and increased trading capacity for the next decade. China Connect Central Gateway was successfully introduced on 17 July 2017 to facilitate Northbound Trading for China Connect Exchange Participants (CCEPs). The new gateway benefits CCEPs by reducing their infrastructure costs and also aligning trading processes with standard protocols. At the end of June 2017, 104 EPs were using HKEX’s Hosting Services. These EPs generated, in aggregate, approximately 50 per cent of the Cash Market turnover and 57 per cent of the trading volume of the Derivatives Market.
1H 2017 vs 1H 2016 ($m)
Revenue
+6%
73% 72%
Operating expenses
+1%
EBITDA
+7%

13
Corporate Items “Corporate Items” is not a business segment but
comprises central income (including net
investment income of Corporate Funds), the
cost of central support functions that provide
services to all operating segments and other
costs not directly related to any operating
segments.
1H 2017 operating expenses decreased by 2
per cent over 1H 2016 mainly due to cost
savings in certain support functions.
Net investment income of Corporate Funds increased by $346 million compared to 1H 2016
principally due to fair value gains on collective investment schemes (see Financial Review
section for further details), of which $226 million came from funds invested in equities portfolios
and $101 million came from funds invested in fixed income and multi-asset class portfolios. As
the valuations of investments reflect movements in market prices, fair value gains or losses may
fluctuate or reverse until the investments are sold or mature.
The increase in average fund size of 18 per cent arose from retention of cash generated by the
Group over the past 12 months.
The analysis of net investment income of Corporate Funds is as follows:
Six months ended
30 Jun 2017
Six months ended
30 Jun 2016 $m $m
Net investment income from:
- Collective investment schemes1
327 -
- Cash and bank deposits 69 41
- Equity securities - (16)
- Debt securities - 80
- Exchange gains/(losses) 32 (23)
Total net investment income
428 82
Average fund size ($bn)
19.9 16.8
Annualised net investment return
4.31% 0.97% .
1 See Financial Review section for further details
Expenses, Other Costs and Taxation Operating Expenses
1H 2017 vs 1H 2016
Six months
ended
30 Jun 2017
Six months
ended
30 Jun 2016
$m $m
Revenue and other income
Net investment income 428 82
Others 3 11
Total 431 93
Operating expenses 464 472
Six months ended
30 Jun 2017 $m
Six months ended
30 Jun 2016 $m Change
Staff costs and related expenses 1,073 1,016 6%
IT and computer maintenance expenses 210 251 (16%)
Premises expenses 176 162 9%
Product marketing and promotion expenses 20 21 (5%)
Legal and professional fees 18 46 (61%)
Other operating expenses 214 192 11%
Total 1,711 1,688 1%

14
Staff costs and related expenses increased by $57 million or 6 per cent mainly due to annual payroll adjustments and increased headcount for strategic initiatives. IT and computer maintenance expenses dropped by $41 million or 16 per cent, attributable to lower IT costs of the LME Group as a result of cost savings from renewal of IT maintenance contracts and depreciation of GBP. Premises expenses increased by $14 million or 9 per cent due to the new offices taken up in Hong Kong and the Mainland. Legal and professional fees decreased by $28 million or 61 per cent, attributable to a one-off insurance recovery of $23 million relating to the warehouse litigation in the United States. Other operating expenses increased by $22 million or 11 per cent due to higher travelling expenses for strategic initiatives (in particular the development of the commodities trading platform in the Mainland), and higher bank charges for the clearing houses. Depreciation and Amortisation
Six months
ended 30 Jun 2017
$m
Six months ended
30 Jun 2016 $m Change
Depreciation and amortisation 362 382 (5%)
Depreciation and amortisation dropped by $20 million or 5 per cent as certain assets became fully amortised. Finance Costs
Six months
ended 30 Jun 2017
$m
Six months ended
30 Jun 2016 $m Change
Finance costs 65 43 51%
The increase in finance costs was due to higher interest rates and higher exchange losses resulting from the stronger USD during 1H 2017.
Taxation
Six months ended
30 Jun 2017 $m
Six months ended
30 Jun 2016 $m Change
Taxation 582 540 8%
Taxation increased due to higher profit before taxation, but was partly offset by higher non-taxable investment income in 1H 2017.

15
FINANCIAL REVIEW
Financial Assets and Financial Liabilities by Funds
At 30 Jun 2017
$m
At
31 Dec 2016 $m
Change Financial assets
Cash and cash equivalents 117,761 115,723 2%
Financial assets measured at fair value through profit or loss 54,604 70,066 (22%)
Financial assets measured at amortised cost 30,035 29,167 3%
Total 202,400 214,956 (6%)
The Group’s financial assets comprised financial assets of Corporate Funds, Margin Funds, Clearing House Funds, base metals derivatives contracts, and cash prepayments for A shares traded under Stock Connects, as follows:
At 30 Jun 2017
$m
At
31 Dec 2016 $m Change
235%111%
Financial assets
Corporate Funds1 20,801 17,670 18%
Margin Funds2 124,978 125,803 (1%)
Clearing House Funds 10,886 9,602 13%
Base metals derivatives contracts cleared through LME Clear 45,210 61,618 (27%)
Cash prepayments for A shares 525 263 100%
Total 202,400 214,956 (6%)
1 The amounts at 31 December 2016 exclude a prepayment of $600 million for collective investment schemes but include
$300 million of investments purchased for collective investment schemes not yet settled.
2 Excludes Settlement Reserve Fund and Settlement Guarantee Fund paid to ChinaClear and margin receivable from CPs of
$1,221 million (31 December 2016: $1,043 million), which are included in accounts receivable, prepayments and other deposits
At
30 Jun 2017 $m
At
31 Dec 2016 $m Change
Financial liabilities
Base metals derivatives contracts cleared through LME Clear 45,210 61,618 (27%)
Other financial liabilities at fair value through profit or loss - 9 (100%)
Margin deposits, Mainland security and settlement deposits, and cash collateral from CPs
126,199
126,846
(1%)
CPs’ contributions to Clearing House Funds 9,872 8,656 14%
Total 181,281 197,129 (8%)
The increase in financial assets and financial liabilities of Clearing House Funds at 30 June 2017 compared to 31 December 2016 was mainly attributable to higher contributions required from CPs in response to changes in risk exposures. After adjusting for prepayments and unsettled investments in collective investment schemes (footnote 1 above), Corporate Funds increased by $2,831 million during 1H 2017 due to the retention of cash generated by the business over the past 6 months partly offset by the cash element of the 2016 final dividend payment.

16
A portion of the Corporate Funds is invested in a portfolio of 15 (31 December 2016: 11) collective investment schemes which is designed to enhance returns and mitigate portfolio volatility and asset class concentration risk. At 30 June 2017, the fair value of the Group’s collective investment schemes by strategy employed was as follows:
At 30 Jun 2017
$m
At
31 Dec 2016 $m Change
235%111% Low Volatility Equities 2,024 1,798 13%
Credit 627 602 4%
Absolute Return 1,205 904 33%
Multi-Asset Fixed Income 1,241 601 106%
US Government Bonds and Mortgage-backed Securities 1,242 1,206 3%
Total 6,339 5,111 24%
The increase in investment in collective investment schemes was due to additional investment in 2017 and the fair value gain generated by the schemes during 1H 2017. Working Capital, Financial Resources and Gearing Working capital rose by $2,258 million or 13 per cent to $19,380 million at 30 June 2017 (31 December 2016: $17,122 million). The increase was primarily due to the profit of $3,493 million generated during 1H 2017, partly offset by the 2016 final dividend, net of scrip dividend, of $1,144 million in June 2017. At 30 June 2017, the Group had the following outstanding borrowings:
At 30 Jun 2017 At 31 Dec 2016
Carrying value
$m
Maturity
Carrying value
$m
Maturity
USD floating rate bank borrowings
1,597
Jul 2020 & Jul 2021
1,586
Jul 2020 & Jul 2021
2 USD fixed rate notes with average coupon of 2.8 per cent
1,530
Dec 2018 & Jan 2019
1,519
Dec 2018 & Jan 2019
Written put options to non-controlling interests
323
N/A
317
N/A
3,450 3,422
At 30 June 2017, the Group had a gross gearing ratio (ie, gross debt divided by adjusted capital) of 10 per cent (31 December 2016: 11 per cent), and a net gearing ratio (ie, net debt divided by adjusted capital) of zero per cent (31 December 2016: zero per cent). For this purpose, gross debt is defined as total borrowings and net debt is defined as total borrowings less cash and cash equivalents of Corporate Funds (and will be zero when the amount of cash and cash equivalents of Corporate Funds is greater than total borrowings), and adjusted capital as all components of equity attributable to shareholders other than designated reserves. Apart from the borrowings used to fund the acquisition of the LME Group, banking facilities have been put in place for contingency purposes. At 30 June 2017, the Group’s total available banking facilities for its daily operations amounted to $18,960 million (31 December 2016: $18,947 million), which included $11,951 million (31 December 2016: $11,938 million) of committed banking facilities and $7,000 million (31 December 2016: $7,000 million) of repurchase facilities.

17
The Group has also put in place foreign exchange facilities for its daily clearing operations and for the RMB Trading Support Facility to support the trading of RMB stocks listed on the Stock Exchange. At 30 June 2017, the total amount of the facilities was RMB21,500 million (31 December 2016: RMB21,500 million). In addition, the Group has arranged contingency banking facilities amounting to RMB13,000 million (31 December 2016: RMB13,000 million) for settling payment obligations to ChinaClear should there be events that disrupt normal settlement arrangements for Stock Connects, eg, natural disasters or extreme weather conditions in Hong Kong. At 30 June 2017, 83 per cent (31 December 2016: 85 per cent) of the Group’s cash and cash equivalents were denominated in HKD or USD. Capital Expenditure and Commitments
During 1H 2017, the Group incurred capital expenditure of $306 million (1H 2016: $266 million)
related to the establishment of a commodities trading platform in Mainland China, the renovation
of new offices, and the development and upgrade of various trading and clearing systems
including enhancement of Stock Connect technology infrastructure.
The Group’s capital expenditure commitments at 30 June 2017, including those authorised by
the Board but not yet contracted for, amounted to $821 million (31 December 2016: $981
million) and were mainly related to the development and enhancement of IT systems including
cash and commodities trading and clearing systems, and trading and clearing systems to
facilitate mutual stock market access between Mainland China and Hong Kong. Significant Investments Held, Material Acquisitions and Disposals of Subsidiaries, and Future Plans for Material Investments or Capital Assets On 22 March 2017, the Group entered into an agreement to sell a 9.99 per cent stake in Qianhai Mercantile Exchange Company Limited (QME) (formerly known as Gangrong Trading Services (Shenzhen) Limited) to Shenzhen Qianhai Financial Holdings Company Limited (QFH) at a consideration of RMB25 million. After the transfer, the Group’s interest in QME dropped to 90.01 per cent. On 26 May 2017 and 1 June 2017, RMB135 million and RMB15 million were further injected by the Group and QFH respectively to QME as its registered capital. Bond Connect Company Limited (BCCL), a joint venture established by China Foreign Exchange Trade System (CFETS) and HKEX, was incorporated on 6 June 2017. The HKEX Board has approved the injection of up to $20 million, for a 40 per cent share in BCCL. Save for those disclosed in this announcement, there were no other significant investments held, nor were there any material acquisitions or disposals of subsidiaries during the period under review. Apart from those disclosed in this announcement, there was no plan authorised by the Board for other material investments or additions of capital assets at the date of this announcement. Pledge of Assets LME Clear receives securities, gold bullion and warrants as collateral for margin posted by its CPs. The total fair value of this collateral was US$1,280 million (HK$9,992 million) at 30 June 2017 (31 December 2016: US$1,781 million (HK$13,808 million)). LME Clear is obliged to return this non-cash collateral upon request when the CPs’ collateral obligations have been substituted with cash collateral or otherwise discharged.

18
LME Clear also holds securities as collateral in respect of its investments in overnight triparty reverse repurchase agreements under which it is obliged to return equivalent securities to the counterparties at maturity of the reverse repurchase agreements. The fair value of this collateral was US$8,306 million (HK$64,840 million) at 30 June 2017 (31 December 2016: US$9,418 million (HK$73,022 million)). The above non-cash collateral, which LME Clear is permitted to sell or repledge in the absence of default by the counterparties, was not recorded on the condensed consolidated statement of financial position of the Group at 30 June 2017. Such non-cash collateral, together with certain financial assets amounting to US$471 million (HK$3,680 million) at 30 June 2017 (31 December 2016: US$430 million (HK$3,334 million)), have been repledged to LME Clear’s investment agent and custodian banks under first floating charge and security arrangements for the settlement and depository services they provide in respect of the collateral and investments held. The floating charge could convert to a fixed charge in the event of contract termination, or default or insolvency of LME Clear. Exposure to Fluctuations in Exchange Rates and Related Hedges The functional currency of the Hong Kong entities is HKD and the functional currency of the LME entities is USD. Foreign currency risks arise mainly from the Group’s investment and bank deposits in currencies other than HKD and USD and its GBP expenditure for the LME entities. Forward foreign exchange contracts and foreign currency bank deposits may be used to hedge the currency exposure of the Group’s non-HKD and non-USD assets and liabilities to mitigate risks arising from fluctuations in exchange rates. Foreign currency margin deposits received by the Group in Hong Kong are mainly hedged by investments in the same currencies, and unhedged investments in USD may not exceed 20 per cent of the Margin Funds. For LME Clear, investments of Margin Funds and Default Fund will generally take place in the currency in which cash was received. The aggregate net open foreign currency positions at 30 June 2017 amounted to HK$3,336 million, of which HK$209 million were non-USD exposures (31 December 2016: HK$2,425 million, of which HK$276 million were non-USD exposures). At 30 June 2017, there were no outstanding forward foreign exchange contracts (31 December 2016: the maximum gross nominal value of outstanding forward foreign exchange contracts was HK$1,529 million). Contingent Liabilities
At 30 June 2017, the Group’s material contingent liabilities were as follows:
(a) The Group had a contingent liability in respect of potential calls to be made by the SFC to replenish all or part of compensation less recoveries paid by the Unified Exchange Compensation Fund established under the Securities Ordinance up to an amount not exceeding $71 million (31 December 2016: $71 million). Up to 30 June 2017, no calls had been made by the SFC in this connection.
(b) The Group had undertaken to indemnify the Collector of Stamp Revenue against any
underpayment of stamp duty by its Participants of up to $200,000 for each Participant. In the unlikely event that all of its 589 trading Participants covered by the indemnity at 30 June 2017 (31 December 2016: 556) defaulted, the maximum contingent liability of the Group under the indemnity would amount to $118 million (31 December 2016: $111 million).
(c) HKEX had given an undertaking in favour of HKSCC to contribute up to $50 million in
the event of HKSCC being wound up while it is a wholly-owned subsidiary of HKEX or within one year after HKSCC ceases to be a wholly-owned subsidiary of HKEX, for payment of the liabilities of HKSCC contracted before HKSCC ceases to be a wholly-owned subsidiary of HKEX, and for the costs of winding up.

19
CHANGES SINCE 31 DECEMBER 2016
There were no other significant changes in the Group’s financial position or from the
information disclosed under Management Discussion and Analysis in the annual report for
the year ended 31 December 2016.
REVIEW OF FINANCIAL STATEMENTS
The Audit Committee has reviewed the Group’s Unaudited Condensed Consolidated Financial
Statements for the six months ended 30 June 2017 in conjunction with HKEX’s external
auditor. Based on this review and discussions with the management, the Audit Committee
was satisfied that the Unaudited Condensed Consolidated Financial Statements were
prepared in accordance with applicable accounting standards and fairly present the Group’s
financial position and results for the six months ended 30 June 2017.
COMPLIANCE WITH CORPORATE GOVERNANCE CODE Throughout the six months ended 30 June 2017, HKEX complied with all code provisions and, where appropriate, adopted the recommended best practices set out in the Corporate Governance Code, with the exceptions of Code Provisions A.4.1 (re-election of non-executive directors) and A.4.2 (retirement by rotation of directors). The Government Appointed Directors, all being Non-executive Directors, are not subject to election or re-election by Shareholders as their appointments are governed by the SFO. HKEX’s Chief Executive in his capacity as a Director is also not subject to retirement by rotation, as his term on the Board is coterminous with his employment with HKEX under HKEX’s Articles of Association.
PURCHASE, SALE OR REDEMPTION OF HKEX’S LISTED SECURITIES During the six months ended 30 June 2017, neither the Company nor any of its subsidiaries purchased, sold or redeemed any HKEX shares, except that the trustee of the Share Award Scheme, pursuant to the terms of the rules and trust deed of the Share Award Scheme, purchased on the Stock Exchange a total of 54,900 HKEX shares at a total consideration of $10 million.
SUSTAINABLE WORKPLACE During the six months ended 30 June 2017, the Group organised 30 in-house courses for employees to enhance their job knowledge, skills and well-being. Moreover, the Group sponsored a total of 71 employees to attend external training. As at 30 June 2017, the Group had 1,784 employees, including 69 temporary staff and 30 interns. HKEX’s remuneration policy has remained unchanged since the date of the 2016 Annual Report. Details of HKEX’s principles and practices related to governance and sustainability are set out in the Corporate Governance and Corporate Social Responsibility sections of the HKEX Group website.

20
CONDENSED CONSOLIDATED INCOME STATEMENT (UNAUDITED)
Note
Six months ended
30 Jun 2017 $m
Six months ended
30 Jun 2016 $m
Trading fees and trading tariff 2,180 2,255
Stock Exchange listing fees 593 531
Clearing and settlement fees 1,224 1,187
Depository, custody and nominee services fees 459 473
Market data fees 419 404
Other revenue 504 406
REVENUE 2 5,379 5,256
Investment income 1,021 410
Interest rebates to Participants (200) (55)
Net investment income 3 821 355
Sundry income 3 19
REVENUE AND OTHER INCOME 6,203 5,630
OPERATING EXPENSES
Staff costs and related expenses (1,073) (1,016)
IT and computer maintenance expenses (210) (251)
Premises expenses (176) (162)
Product marketing and promotion expenses (20) (21)
Legal and professional fees (18) (46)
Other operating expenses (214) (192)
(1,711) (1,688)
EBITDA 4,492 3,942
Depreciation and amortisation (362) (382)
OPERATING PROFIT 4,130 3,560
Finance costs 4 (65) (43)
Share of loss of a joint venture (5) (5)
PROFIT BEFORE TAXATION 2 4,060 3,512
TAXATION 5 (582) (540)
PROFIT FOR THE PERIOD 3,478 2,972
PROFIT/(LOSS) ATTRIBUTABLE TO:
- Shareholders of HKEX 3,493 2,985
- Non-controlling interests (15) (13)
PROFIT FOR THE PERIOD 3,478 2,972
Basic earnings per share 6(a) $2.86 $2.47
Diluted earnings per share 6(b) $2.85 $2.47
21
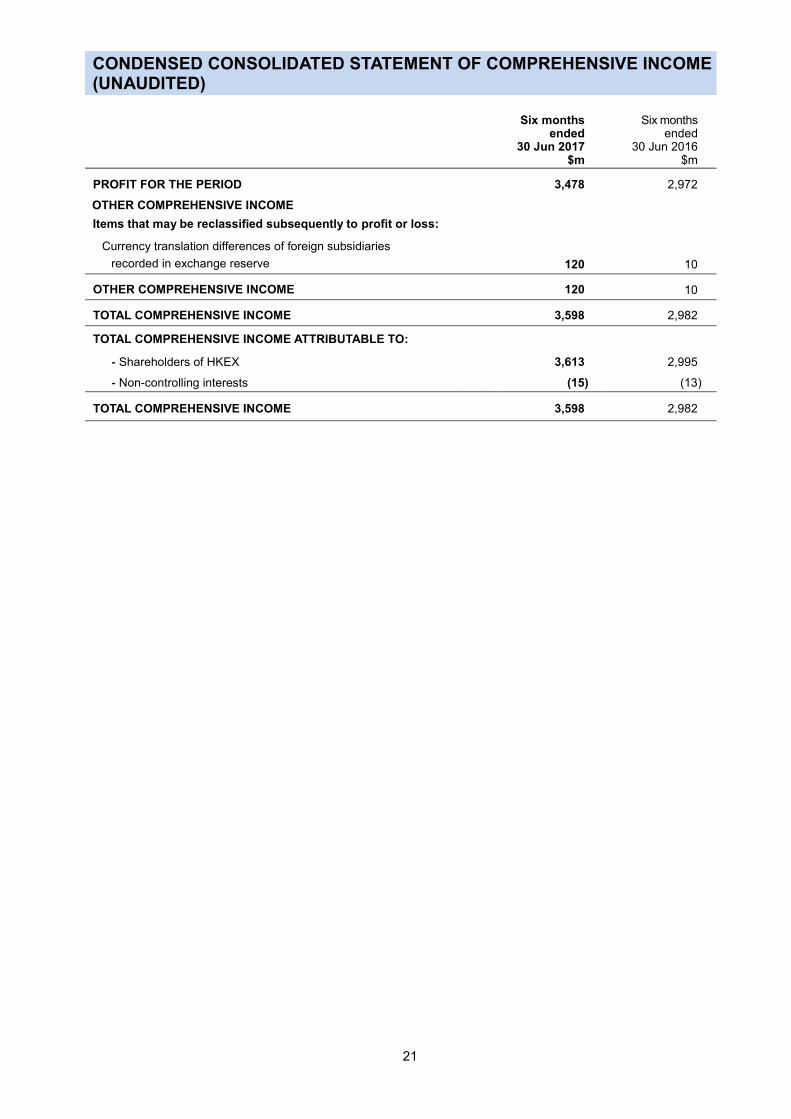
CONDENSED CONSOLIDATED STATEMENT OF COMPREHENSIVE INCOME (UNAUDITED)
Six months ended
30 Jun 2017 $m
Six months ended
30 Jun 2016 $m
PROFIT FOR THE PERIOD 3,478 2,972
OTHER COMPREHENSIVE INCOME
Items that may be reclassified subsequently to profit or loss:
Currency translation differences of foreign subsidiaries
recorded in exchange reserve 120 10
OTHER COMPREHENSIVE INCOME 120 10
TOTAL COMPREHENSIVE INCOME 3,598 2,982
TOTAL COMPREHENSIVE INCOME ATTRIBUTABLE TO:
- Shareholders of HKEX 3,613 2,995
- Non-controlling interests (15) (13)
TOTAL COMPREHENSIVE INCOME 3,598 2,982

22
CONDENSED CONSOLIDATED STATEMENT OF FINANCIAL POSITION (UNAUDITED)
At 30 Jun 2017 At 31 Dec 2016
Note
Current
$m
Non-current
$m
Total
$m
Current
$m
Non-current
$m
Total
$m
ASSETS
Cash and cash equivalents 8 117,761 - 117,761 115,723 - 115,723
Financial assets measured at fair value through profit or loss
8
54,292
312
54,604
70,066
-
70,066
Financial assets measured at amortised cost 8 29,961 74 30,035 29,093 74 29,167
Accounts receivable, prepayments and deposits 8,9 12,456 21 12,477 12,928 21 12,949
Interest in joint ventures - 54 54 - 59 59
Goodwill and other intangible assets - 17,940 17,940 - 17,812 17,812
Fixed assets - 1,438 1,438 - 1,499 1,499
Lease premium for land - 21 21 - 21 21
Deferred tax assets - 24 24 - 22 22
Total assets 214,470 19,884 234,354 227,810 19,508 247,318
LIABILITIES AND EQUITY
Liabilities
Financial liabilities at fair value through profit or loss
45,210
-
-
45,210
61,627
-
61,627
Margin deposits, Mainland security and settlement deposits, and cash collateral from CPs
126,199
-
-
126,199
126,846
-
126,846
Accounts payable, accruals and other liabilities
10
12,483
40
12,523
12,246
30
12,276
Deferred revenue 567 - 567 842 - 842
Taxation payable 621 - 621 356 - 356
Other financial liabilities 54 - 54 37 - 37
CP’s contributions to Clearing House Funds 9,872 - 9,872 8,656 - 8,656
Borrowings 11 - 3,450 3,450 - 3,422 3,422
Provisions 84 81 165 78 81 159
Deferred tax liabilities - 705 705 - 713 713
Total liabilities 195,090 4,276 199,366 210,688 4,246 214,934
Equity
Share capital 23,439 22,085
Shares held for Share Award Scheme (595) (599)
Employee share-based compensation reserve 308 226
Exchange reserve (140) (260)
Designated reserves 824 773
Reserve relating to written put options to non-controlling interests
(293)
(293)
Retained earnings 11,309 10,334
- Equity attributable to shareholders of HKEX 34,852 32,266
Non-controlling interests 136 118
Total equity 34,988 32,384
Total liabilities and equity 234,354 247,318
Net current assets 19,380 17,122
23
NOTES TO THE CONDENSED CONSOLIDATED FINANCIAL STATEMENTS (UNAUDITED)
1. Basis of Preparation and Accounting Policies
These unaudited condensed consolidated financial statements should be read in conjunction with the 2016 annual consolidated financial statements. The accounting policies and methods of computation used in the preparation of these condensed consolidated financial statements are consistent with those used in the annual consolidated financial statements for the year ended 31 December 2016. Amendments to Hong Kong Financial Reporting Standards (HKFRSs) effective for the financial year ending 31 December 2017 do not have any financial impact to the Group. The financial information relating to the year ended 31 December 2016 that is included in this results announcement for the six months ended 30 June 2017 as comparative information does not constitute the statutory annual consolidated financial statements of the Company for that year but is derived from those consolidated financial statements. Further information relating to these statutory financial statements required to be disclosed in accordance with section 436 of the Hong Kong Companies Ordinance (Chapter 622) is as follows: The Company has delivered the consolidated financial statements for the year ended 31 December 2016 to the Registrar of Companies as required by section 662(3) of, and Part 3 of Schedule 6 to, the Hong Kong Companies Ordinance (Chapter 622). The Company’s auditor has reported on those consolidated financial statements. The auditor’s report was unqualified; did not include a reference to any matters to which the auditor drew attention by way of emphasis without qualifying its report; and did not contain a statement under sections 406(2), 407(2) or (3) of the Hong Kong Companies Ordinance (Chapter 622).
2. Operating Segments
The Group determines its operating segments based on the reports that are used to make strategic decisions reviewed by the chief operating decision-maker. The Group has five reportable segments (“Corporate Items” is not a reportable segment). The segments are managed separately as each segment offers different products and services and requires different IT systems and marketing strategies. The operations in each of the Group’s reportable segments are as follows: The Cash segment covers all equity products traded on the Stock Exchange, the Shanghai Stock Exchange and the Shenzhen Stock Exchange through Stock Connects, sales of market data relating to these products and other related activities. The major sources of revenue of the segment are trading fees, trading tariff and listing fees of equity products and market data fees.
The Equity and Financial Derivatives segment refers to derivatives products traded on two exchanges in Hong Kong and other related activities. These include the provision and maintenance of trading platforms for a range of equity and financial derivatives products, such as stock and equity index futures and options, DWs, CBBCs and warrants and sales of market data. The major sources of revenue are trading fees, trading tariff and listing fees of derivatives products and market data fees.

24
The Commodities segment refers to the operations of the LME, which operates an exchange in the UK for the trading of base metals futures and options contracts and the development and operations of the new commodity trading platform in the Mainland. It also covers the Asia Commodities contracts traded on the Futures Exchange. The major sources of revenue of the segment are trading fees of commodities products, commodity market data fees and fees generated from other ancillary operations. The Clearing segment refers to the operations of the five clearing houses, namely HKSCC, SEOCH, HKCC, OTC Clear and LME Clear, which are responsible for clearing, settlement and custodian activities of the exchanges of the Group, and clearing and settlement of over-the-counter derivatives contracts. Its principal sources of revenue are derived from providing clearing, settlement, depository, custody and nominee services and net investment income earned on Margin Funds and Clearing House Funds. The Platform and Infrastructure segment refers to all services in connection with providing users with access to the platform and infrastructure of the Group. Its major sources of revenue are network, terminal user, dataline and software sub-license fees and hosting services fees.
Central income (including net investment income of Corporate Funds) and central costs (costs of central support functions that provide services to all of the operating segments, finance costs and other costs not directly related to any of the operating segments) are included as “Corporate Items”.
The chief operating decision-maker assesses the performance of the operating segments principally based on their EBITDA. An analysis by operating segment of the Group’s EBITDA and profit before taxation for the period is as follows:
Six months ended 30 Jun 2017
Cash
$m
Equity and
Financial
Derivatives
$m
Commodities
$m
Clearing
$m
Platform
and
Infrastructure
$m
Corporate
Items
$m
Group
$m
Revenue from external
customers 1,512 952 721 1,912 279 3 5,379
Net investment income - - - 393 - 428 821
Sundry income - - - 3 - - 3
Revenue and other income 1,512 952 721 2,308 279 431 6,203
Operating expenses (291) (222) (281) (378) (75) (464) (1,711)
3,\
Reportable segment EBITDA 1,221 730 440 1,930 204 (33) 4,492
Depreciation and amortisation (33) (36) (136) (92) (21) (44) (362)
Finance costs - - - - - (65) (65)
Share of loss of a joint venture - (5) - - - - (5)
Reportable segment profit
before taxation 1,188 689 304 1,838 183 (142) 4,060

25
Six months ended 30 Jun 2016
Cash
$m
Equity and
Financial
Derivatives
$m
Commodities
$m
Clearing
$m
Platform
and
Infrastructure
$m
Corporate
Items
$m
Group
$m
Revenue from external
customers 1,282 1,065 804 1,838 264 3 5,256
Net investment income - - - 273 - 82 355
Sundry income - - - 11 - 8 19
Revenue and other income 1,282 1,065 804 2,122 264 93 5,630
Operating expenses (270) (229) (291) (352) (74) (472) (1,688)
3,\
Reportable segment EBITDA 1,012 836 513 1,770 190 (379) 3,942
Depreciation and amortisation (44) (45) (147) (88) (22) (36) (382)
Finance costs - - - - - (43) (43)
Share of loss of a joint venture - (5) - - - - (5)
Reportable segment profit
before taxation 968 786 366 1,682 168 (458) 3,512
3. Net Investment Income
Six months
ended
30 Jun 2017
$m
Six months
ended
30 Jun 2016
$m
Gross interest income from financial assets measured at amortised cost 643 359
Interest rebates to Participants (200) (55)
Net interest income 443 304
Net fair value gains including interest income on financial assets
mandatorily measured at fair value through profit or loss and
financial liabilities at fair value through profit or loss
346
(1(17
68
Others 32 (17)
Net investment income 821 355
4. Finance Costs
Six months
ended
30 Jun 2017
$m
Six months
ended
30 Jun 2016
$m
Interest expenses on borrowings 44 40
Net foreign exchange losses on financing activities 21 3
65 43
26
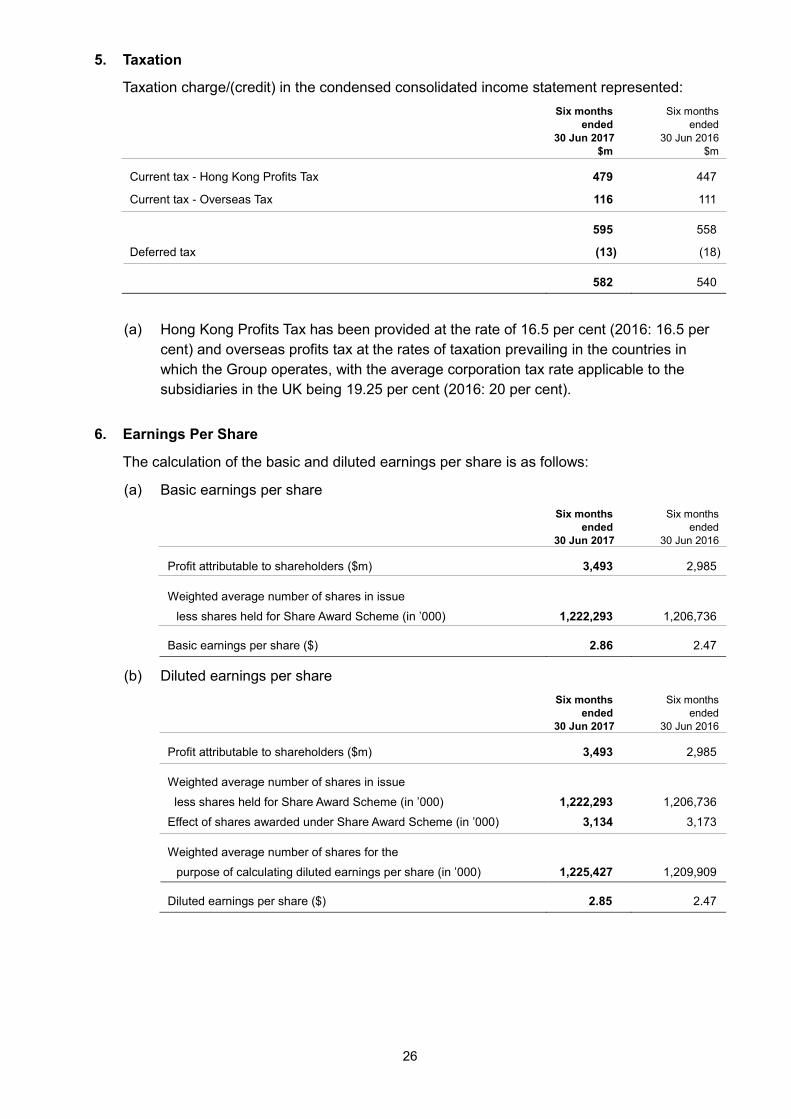
5. Taxation
Taxation charge/(credit) in the condensed consolidated income statement represented:
Six months
ended
30 Jun 2017
$m
Six months
ended
30 Jun 2016
$m
Current tax - Hong Kong Profits Tax 479 447
Current tax - Overseas Tax 116 111
595 558
Deferred tax (13) (18)
582 540
(a) Hong Kong Profits Tax has been provided at the rate of 16.5 per cent (2016: 16.5 per
cent) and overseas profits tax at the rates of taxation prevailing in the countries in
which the Group operates, with the average corporation tax rate applicable to the
subsidiaries in the UK being 19.25 per cent (2016: 20 per cent).
6. Earnings Per Share
The calculation of the basic and diluted earnings per share is as follows:
(a) Basic earnings per share
Six months
ended
30 Jun 2017
Six months
ended
30 Jun 2016
Profit attributable to shareholders ($m) 3,493 2,985
Weighted average number of shares in issue
less shares held for Share Award Scheme (in ’000)
1,222,293
1,206,736
Basic earnings per share ($) 2.86 2.47
(b) Diluted earnings per share
Six months
ended
30 Jun 2017
Six months
ended
30 Jun 2016
Profit attributable to shareholders ($m) 3,493 2,985
Weighted average number of shares in issue
less shares held for Share Award Scheme (in ’000)
1,222,293
1,206,736
Effect of shares awarded under Share Award Scheme (in ’000) 3,134 3,173
Weighted average number of shares for the
purpose of calculating diluted earnings per share (in ’000)
1,225,427
1,209,909
Diluted earnings per share ($) 2.85 2.47

27
7. Dividends
Six months
ended
30 Jun 2017
$m
Six months
ended
30 Jun 2016
$m
Interim dividend declared of $2.55 (2016: $2.21) per share at 30 Jun 3,141 2,690
Less: Dividend for shares held by Share Award Scheme at 30 Jun (8) (7)
3,133 2,683
8. Financial Assets
The financial assets of Clearing House Funds, Margin Funds, base metals derivatives contracts, cash prepayments for A shares and Corporate Funds are allocated into cash and cash equivalents, financial assets measured at fair value through profit or loss, financial assets measured at amortised cost, and accounts receivable and deposits, details of which are as follows:
At
30 Jun 2017
$m
At
31 Dec 2016
$m
Clearing House Funds
Cash and cash equivalents 10,730 9,476
Financial assets measured at amortised cost 156 126
10,886 9,602
Margin Funds
Cash and cash equivalents 93,584 96,698
Financial assets measured at fair value through profit or loss 3,055 3,323
Financial assets measured at amortised cost 28,339 25,782
Accounts receivable and deposits 1,221 1,043
126,199 126,846
Base metals derivatives contracts
Financial assets measured at fair value through profit or loss 45,210 61,618
Cash prepayments for A shares
Cash and cash equivalents 525 263
Corporate Funds
Cash and cash equivalents 12,922 9,286
Financial assets measured at fair value through profit or loss 6,339 5,125
Financial assets measured at amortised cost 1,540 3,259
20,801 17,670
203,621 215,999
The expected maturity dates of the financial assets are analysed as follows:
At 30 Jun 2017 At 31 Dec 2016
Clearing
House
Funds
$m
Margin
Funds
$m
Base
metals
derivatives
contracts
$m
Cash
prepayments
for
A shares
$m
Corporate
Funds
$m
Total
$m
Clearing
House
Funds
$m
Margin
Funds
$m
Base
metals
derivatives
contracts
$m
Cash
prepayments
for
A shares
$m
Corporate
Funds
$m
Total
$m
Within twelve
months
10,886
126,199
45,210
525
20,415
203,235
9,602
126,846
61,618
263
17,596
215,925
Over twelve months - - - - 386 386 - - - - 74 74
10,886 126,199 45,210 525 20,801 203,621 9,602 126,846 61,618 263 17,670 215,999
28
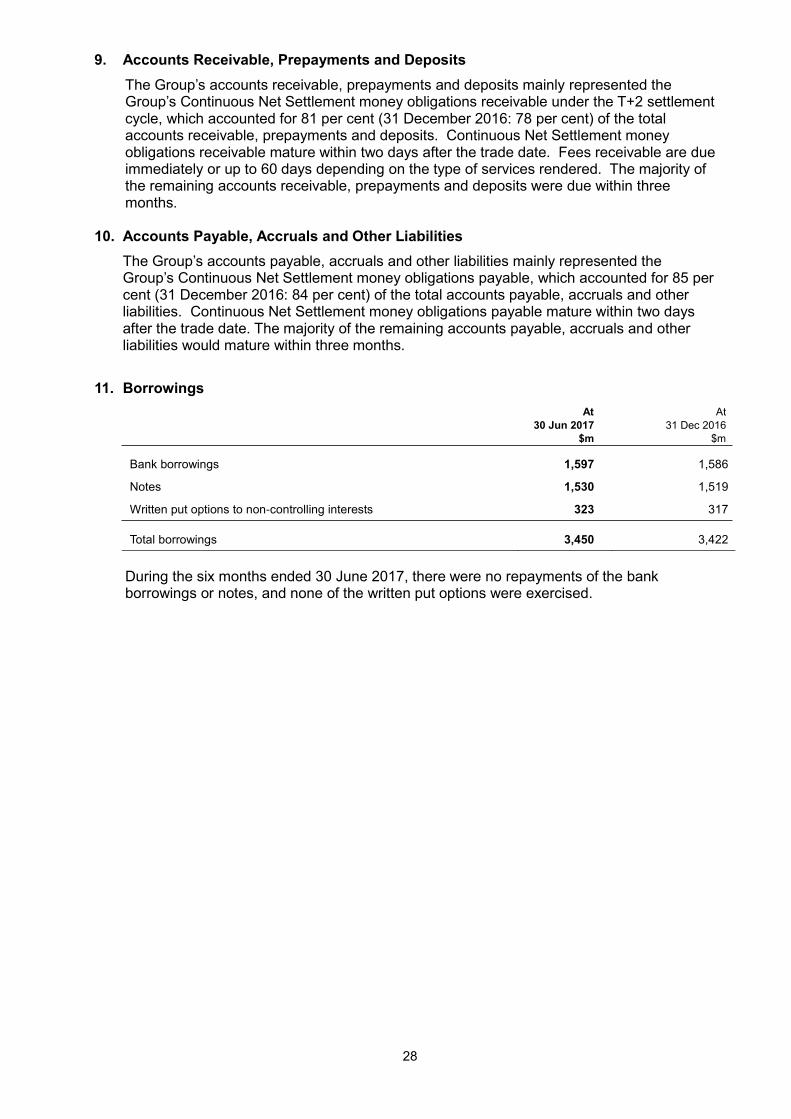
9. Accounts Receivable, Prepayments and Deposits
The Group’s accounts receivable, prepayments and deposits mainly represented the Group’s Continuous Net Settlement money obligations receivable under the T+2 settlement cycle, which accounted for 81 per cent (31 December 2016: 78 per cent) of the total accounts receivable, prepayments and deposits. Continuous Net Settlement money obligations receivable mature within two days after the trade date. Fees receivable are due immediately or up to 60 days depending on the type of services rendered. The majority of the remaining accounts receivable, prepayments and deposits were due within three months.
10. Accounts Payable, Accruals and Other Liabilities
The Group’s accounts payable, accruals and other liabilities mainly represented the Group’s Continuous Net Settlement money obligations payable, which accounted for 85 per cent (31 December 2016: 84 per cent) of the total accounts payable, accruals and other liabilities. Continuous Net Settlement money obligations payable mature within two days after the trade date. The majority of the remaining accounts payable, accruals and other liabilities would mature within three months.
11. Borrowings
At
30 Jun 2017
$m
At
31 Dec 2016
$m
Bank borrowings 1,597 1,586
Notes 1,530 1,519
Written put options to non-controlling interests 323 317
Total borrowings 3,450 3,422
During the six months ended 30 June 2017, there were no repayments of the bank borrowings or notes, and none of the written put options were exercised.

29
INTERIM DIVIDEND AND CLOSURE OF REGISTER OF MEMBERS The Board has declared an interim dividend of $2.55 per share (2016: $2.21 per share) for the year ending 31 December 2017. The interim dividend will be payable in cash with a scrip alternative. While continuing to facilitate the reinvestment of dividends into HKEX shares, having reviewed HKEX’s cash flow needs, the Board has decided to reduce the discount on the subscription price for Shareholders who elect to receive the scrip alternative from 5 per cent to 3 per cent. This will be applicable to interim dividend declared for the year ending 31 December 2017 and all subsequent dividends declared with a scrip alternative until otherwise determined. The scrip dividend alternative is conditional upon the SFC’s granting the listing of, and permission to deal in, new shares of HKEX to be issued pursuant thereto. Details of the scrip dividend alternative will be set out in a circular to Shareholders. Relevant Dates for Interim Dividend Payment Ex-dividend date 22 August 2017 Closure of HKEX’s Register of Members 24 to 25 August 2017 (both dates inclusive) Record date 25 August 2017 Despatch of scrip dividend circular and
election form
On or about 30 August 2017 Announcement of scrip share subscription price On or about 5 September 2017 Despatch of dividend warrants/definitive share certificates
21 September 2017
To qualify for the interim dividend, all properly completed transfer forms accompanied by the relevant share certificates must be lodged for registration with HKEX’s registrar, Hong Kong Registrars Limited, at Shops 1712-1716, 17th Floor, Hopewell Centre, 183 Queen’s Road East, Wan Chai, Hong Kong no later than 4:30 pm on Wednesday, 23 August 2017.
PUBLICATION OF 2017 INTERIM RESULTS AND INTERIM REPORT This announcement is published on the HKEXnews website at www.hkexnews.hk and the HKEX Group website at www.hkexgroup.com/Investor-Relations/Regulatory-Disclosure/Announcements/2017. The 2017 Interim Report will be available on the HKEXnews and HKEX Group websites and despatched to Shareholders on or about Thursday, 24 August 2017. By Order of the Board Hong Kong Exchanges and Clearing Limited Joseph Mau Company Secretary
Hong Kong, 9 August 2017
At the date of this announcement, the Board comprises 12 Independent Non-executive Directors, namely Mr CHOW Chung Kong (Chairman), Mr Apurv BAGRI, Mr CHAN Tze Ching, Ignatius, Mr CHEAH Cheng Hye, Mr Timothy George FRESHWATER, Ms FUNG Yuen Mei, Anita, Mr Rafael GIL-TIENDA, Dr HU Zuliu, Fred, Mrs LEUNG KO May Yee, Margaret, Mr LEUNG Pak Hon, Hugo, Mr John Mackay McCulloch WILLIAMSON, and Mr YIU Kin Wah, Stephen, and one Executive Director, Mr LI Xiaojia, Charles, who is also HKEX’s Chief Executive.
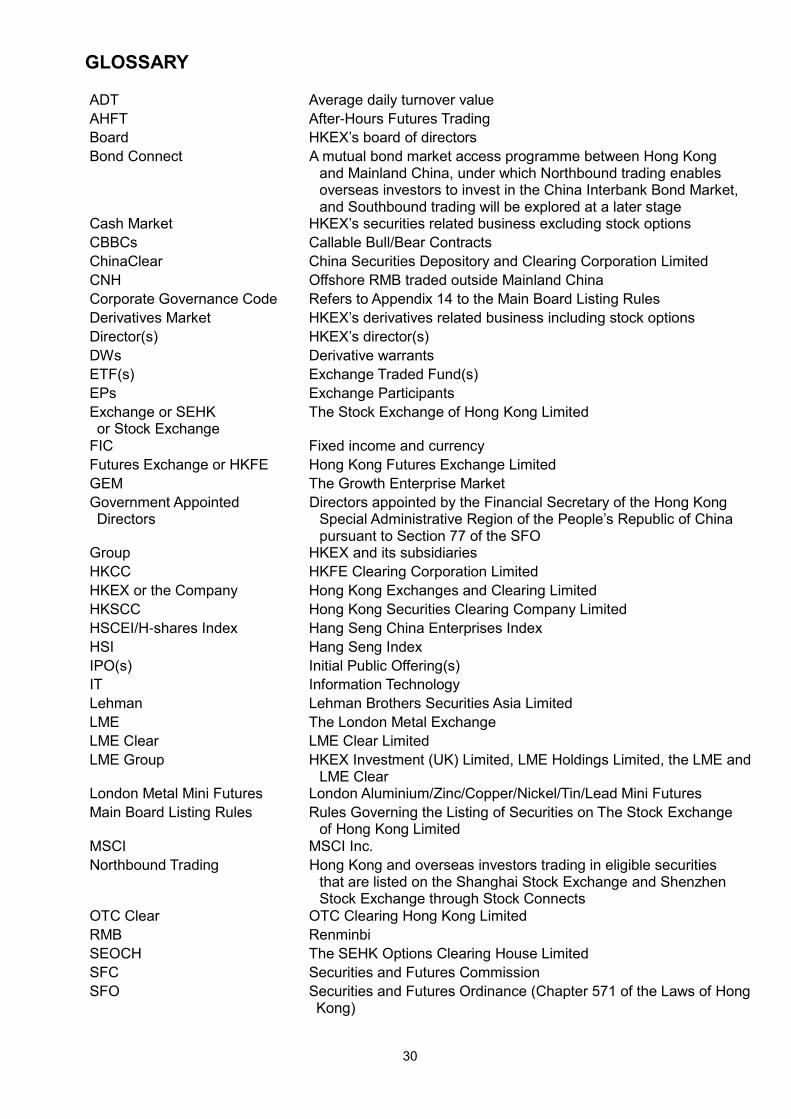
30
GLOSSARY
ADT Average daily turnover value
AHFT After-Hours Futures Trading
Board HKEX’s board of directors
Bond Connect A mutual bond market access programme between Hong Kong and Mainland China, under which Northbound trading enables overseas investors to invest in the China Interbank Bond Market, and Southbound trading will be explored at a later stage
Cash Market HKEX’s securities related business excluding stock options
CBBCs Callable Bull/Bear Contracts
ChinaClear China Securities Depository and Clearing Corporation Limited
CNH Offshore RMB traded outside Mainland China
Corporate Governance Code Refers to Appendix 14 to the Main Board Listing Rules Derivatives Market HKEX’s derivatives related business including stock options
Director(s) HKEX’s director(s)
DWs Derivative warrants
ETF(s) Exchange Traded Fund(s)
EPs Exchange Participants
Exchange or SEHK or Stock Exchange
The Stock Exchange of Hong Kong Limited
FIC Fixed income and currency
Futures Exchange or HKFE Hong Kong Futures Exchange Limited
GEM The Growth Enterprise Market
Government Appointed Directors
Directors appointed by the Financial Secretary of the Hong Kong Special Administrative Region of the People’s Republic of China pursuant to Section 77 of the SFO
Group HKEX and its subsidiaries
HKCC HKFE Clearing Corporation Limited
HKEX or the Company Hong Kong Exchanges and Clearing Limited
HKSCC Hong Kong Securities Clearing Company Limited
HSCEI/H-shares Index Hang Seng China Enterprises Index
HSI Hang Seng Index
IPO(s) Initial Public Offering(s)
IT Information Technology
Lehman Lehman Brothers Securities Asia Limited
LME The London Metal Exchange
LME Clear LME Clear Limited
LME Group HKEX Investment (UK) Limited, LME Holdings Limited, the LME and LME Clear
London Metal Mini Futures London Aluminium/Zinc/Copper/Nickel/Tin/Lead Mini Futures
Main Board Listing Rules Rules Governing the Listing of Securities on The Stock Exchange of Hong Kong Limited
MSCI MSCI Inc.
Northbound Trading Hong Kong and overseas investors trading in eligible securities that are listed on the Shanghai Stock Exchange and Shenzhen Stock Exchange through Stock Connects
OTC Clear OTC Clearing Hong Kong Limited
RMB Renminbi
SEOCH The SEHK Options Clearing House Limited
SFC Securities and Futures Commission
SFO Securities and Futures Ordinance (Chapter 571 of the Laws of Hong Kong)

31
Shanghai-Hong Kong Stock Connect
A mutual market access programme that links the stock markets in Shanghai and Hong Kong, enabling investors in Hong Kong and Mainland China to trade and settle shares listed on the other market via the exchange and clearing house in their home market
Shareholders HKEX’s shareholders
Share Award Scheme The Employees’ Share Award Scheme adopted by the Board on 14 September 2005 which was subsequently amended on 16 August 2006, 13 May 2010, 17 December 2013 and 17 June 2015
Shenzhen-Hong Kong Stock Connect
A mutual market access programme that links the stock markets in Shenzhen and Hong Kong, enabling investors in Hong Kong and Mainland China to trade and settle shares listed on the other market via the exchange and clearing house in their home market
Southbound Trading Mainland investors trading in eligible securities that are listed on the Stock Exchange through Stock Connects
Stock Connects Shanghai-Hong Kong Stock Connect and Shenzhen-Hong Kong Stock Connect
UK United Kingdom
US United States of America
US$/USD United States dollar
$/HK$/HKD Hong Kong dollar
$bn/bn Hong Kong dollar in billion/billion
$m Hong Kong dollar in million
£/GBP Pound sterling