Embed Size (px)
Citation preview

IntroductionWhen imaging is required in cases of low back pain, the first-line imaging technique is still controversial [1]. While magnetic resonance imaging (MRI) is now widely and increasingly used, the distinction between incidental find-ings and current symptom etiology is sometimes difficult [2, 3]. Nevertheless, MRI is undoubtedly considered the best available technique for the study of the interverte-bral disc. However, MRI facilities are not equally available worldwide and particularly in some areas, patients have access to standard radiographs at best [4–8]. This conven-tional approach still plays a role in the evaluation of the bony structures of the lumbar spine and can show us some indirect signs about disc degeneration. These features are associated with low back pain [9, 10].
In 1981, our group described a parallel aspect of the lumbosacral adjacent endplates as being associated with initial stages of L5-S1 disk disorders [11]. Very quickly, two Italian groups verified our findings and reached simi-lar conclusions [12, 13]. To our knowledge, all the stud-ies focused on this specific phenotype are cross-sectional,
which prevents us from drawing any conclusion about causal relationships between a parallel morphology and disc degeneration.
Different imaging techniques like T1r or T2 mapping [14–16] have been used to evaluate the biochemical modi-fications of the discs. T1 mapping has also been proven to be sensitive to water content [17–20]. Becoming increasingly familiar with the T1 mapping technique [20], we aimed at performing a validation trial to determine whether parallel morphology of the L5-S1 intervertebral disc is associated with biochemical differences compared with discs exhibiting the normal morphology, i.e., higher anteriorly than posteriorly on a lateral view.
Material and MethodsParticipantsRecruitment for the study was from medical staff or acquaintances and university students.
Inclusion criteria for volunteers were: good health, absence of any back symptom and age between 18 to 25 years. Exclusion criteria were: medical history of back pain, radiculopathy or neurological deficit, back trauma, previous back surgery or infiltration, osteoarticular or connective tissue disease, body mass index of >25, con-traindication to MRI.
Galley, J and Balagué, F. Revisiting Radiographic L5-S1 Parallelism Using MRI T1 Mapping. Journal of the Belgian Society of Radiology. 2018; 102(1): 59, 1–5. DOI: https://doi.org/10.5334/jbsr.1501
HFR Fribourg, CHCorresponding author: Julien Galley ([email protected])
ORIGINAL ARTICLE
Revisiting Radiographic L5-S1 Parallelism Using MRI T1 MappingJulien Galley and Federico Balagué
Purpose: Thirty years ago, we reported that parallel aspect of the L5-S1 disc on a lateral view of the spine might be considered to be an initial stage of disk degeneration. The current study represents an attempt to increase the validity of parallel sign on conventional radiograph using MR real T1 mapping.Methods: Forty-four young asymptomatic volunteers (mean age 21.6 ± 2.3) underwent lumbar spine MRI, twice the same day, morning and afternoon. Dedicated sequences using the inversion-recovery technique were used to calculate the T1 relaxation time. A region of interest (ROI) representing the nucleus pulposuswasdefinedineachdisk.Thevolunteerswerestratifiedaccordingtothepresenceorabsenceofa parallel morphology of L5-S1. Correlation between endplates angles, sacral slopes and T1 values were then evaluated.Results: L5-S1 space looks parallel for angles <10° (mean value 6.9° ± 1.4°). Sacral slope was lower in par-alleldisks(31.7±4.9°vs.40.1±5.6°),showingasignificantdifferenceof8.4°(p<0.05).TheT1relaxa-tionvaluesshowasignificantdifferencebetweenthetwogroups(p<0.05)withadifferenceof96 msforthemorning(1090.9±33.3msfortheparallelgroupand1186.9±41.2msforthenon-parallel)and121.9 ms for the afternoon (respectively 1004.7 ± 22.2 ms and 1126.6 ± 12.9 ms).Conclusion:ThedifferencebetweenthetwogroupssuggeststhatparallelmorphologyoftheL5-S1diskis associated with lower water content.
Keywords: Magnetic resonance imaging; Musculoskeletal; Spine; Intervertebral disc; T1 mapping

Galley and Balagué: Revisiting Radiographic L5-S1 Parallelism Using MRI T1 MappingArt. 59, page 2 of 5
All participants were asked to have normal daytime activity and to avoid any heavy work (not to bear weight over 10 kg) and any sport during the day of examination.
Written informed consent was obtained from all participants.
ImagingThe methodology details have been reported elsewhere [20]. The examinations were performed between December 2014 and July 2015. All the volunteers were scanned twice the same day (once in the morning at 8 a.m. and once in the late afternoon around 5 p.m.) in a relaxed supine position. MR imaging was performed using a 1.5T MR unit (Optima 360 Advance, GE Healthcare, Waukesha, WI, USA). The standard MR protocol using sagittal T1-weighted fast spin echo and sagittal T2-weighted fast spin echo sequences was performed. Dedicated sequences were then realized for T1 relaxation time measurements, using the inversion recovery technique with different inversion recovery times (from 100 to 2500 ms).
MeasurementsParallelismThe L5-S1 discs were evaluated on MRI sagittal T1 slices. On the sagittal medial plane, the angle made by the two endplates (Figure 1) were measured in each of the 44 vol-unteers. We then evaluated observer ability to classify the disc morphology as parallel or non-parallel at a glance, without measurement. As considered in the previous study, a disc space would appear parallel if the angle made by the two endplates is less than 10°. The inter-observer agreement was assessed with 14 discs. Seven discs meas-ured less than 10° (mean 6.9 ± 1.4) and seven discs more than 10° (mean 16.4 ± 3.3). The images were anonymized and randomly evaluated. The two observers then had to classify them as parallel or non-parallel on the sagittal median slice and para-median (left and right, for a total of 42 images). The observers examined the images twice on the same day to evaluate intra-observer reliability.
Sacral slopeWas defined by the angle made by the line along the superior of endplate of S1 and the horizontal line [21] (Figure 2).
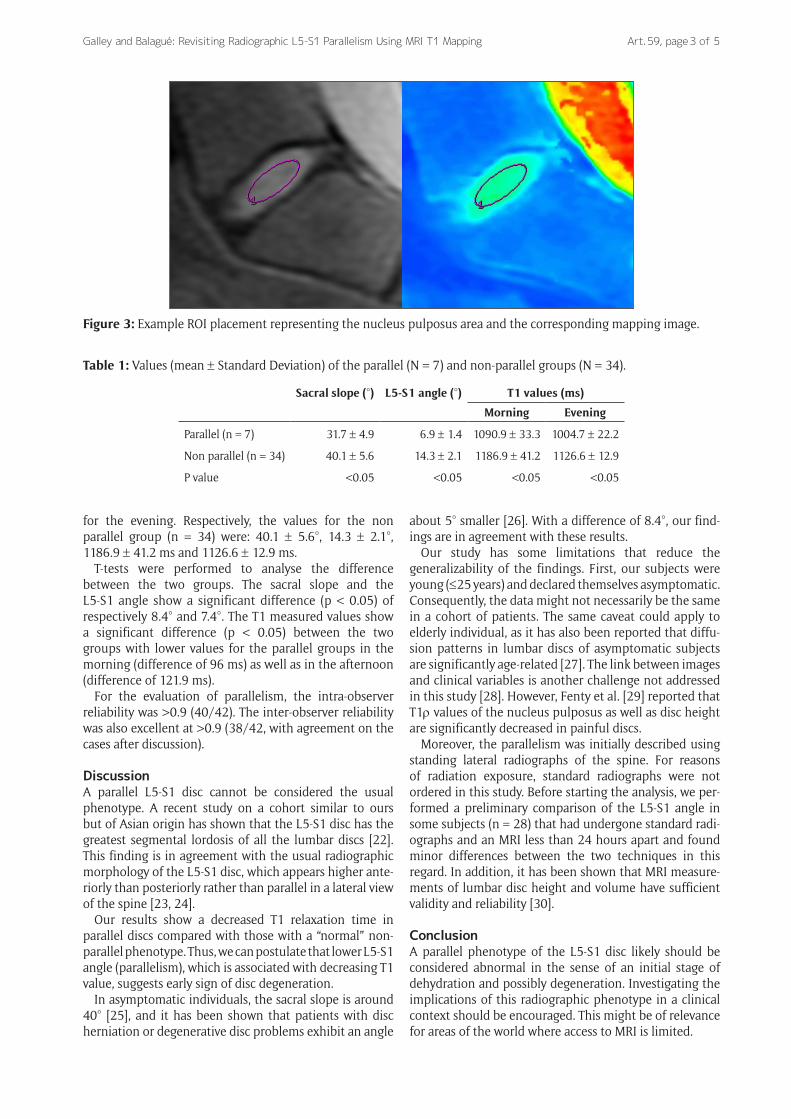
T1 MappingAs in the previous study, we defined a region of inter-est (ROI) representing the nucleus pulposus. Two virtual horizontal lines of the outer border of each endplate were defined. An ovoid ROI between those lines (range 45–75 mm2), less than half of the length of the disc, cen-tered on the middle, was considered to be the nucleus pul-posus area (Figure 3).
Ethical committee approvalThis study was approved by the CT CER (Communauté de travail des Commissions Suisses d’éthique pour la recherche sur l’être humain, Lausanne), which is the regional ethical committee for our hospital.
ResultsForty-four healthy and asymptomatic volunteers were included in this study: mean age 21.6 ± 2.3, age range 18–25 years, 21 females and 23 males.
All the discs were classified according to the Pfirrmann classification. Forty-one were classified grade I or II and three discs grade III. Grades I and II discs were considered representative of non-degenerative discs and used for measurements.
The different measured values are displayed in Table 1. For the parallel group (n = 7), the sacral slope mean value was 31.7 ± 4.9°, the L5-S1 angle 6.9 ± 1.4°, the T1 values 1090.9 ± 33.3 ms for the morning and 1004.7 ± 22.2 ms
Figure 1: Examples of parallel and non-parallel L5-S1 disks.
Figure 2: Example of sacral slope measurement.
Galley and Balagué: Revisiting Radiographic L5-S1 Parallelism Using MRI T1 Mapping Art. 59, page 3 of 5
for the evening. Respectively, the values for the non parallel group (n = 34) were: 40.1 ± 5.6°, 14.3 ± 2.1°, 1186.9 ± 41.2 ms and 1126.6 ± 12.9 ms.
T-tests were performed to analyse the difference between the two groups. The sacral slope and the L5-S1 angle show a significant difference (p < 0.05) of respectively 8.4° and 7.4°. The T1 measured values show a significant difference (p < 0.05) between the two groups with lower values for the parallel groups in the morning (difference of 96 ms) as well as in the afternoon ( difference of 121.9 ms).
For the evaluation of parallelism, the intra-observer reliability was >0.9 (40/42). The inter-observer reliability was also excellent at >0.9 (38/42, with agreement on the cases after discussion).
DiscussionA parallel L5-S1 disc cannot be considered the usual phenotype. A recent study on a cohort similar to ours but of Asian origin has shown that the L5-S1 disc has the greatest segmental lordosis of all the lumbar discs [22]. This finding is in agreement with the usual radiographic morphology of the L5-S1 disc, which appears higher ante-riorly than posteriorly rather than parallel in a lateral view of the spine [23, 24].
Our results show a decreased T1 relaxation time in parallel discs compared with those with a “normal” non-parallel phenotype. Thus, we can postulate that lower L5-S1 angle (parallelism), which is associated with decreasing T1 value, suggests early sign of disc degeneration.
In asymptomatic individuals, the sacral slope is around 40° [25], and it has been shown that patients with disc herniation or degenerative disc problems exhibit an angle
about 5° smaller [26]. With a difference of 8.4°, our find-ings are in agreement with these results.
Our study has some limitations that reduce the generalizability of the findings. First, our subjects were young (≤25 years) and declared themselves asymptomatic. Consequently, the data might not necessarily be the same in a cohort of patients. The same caveat could apply to elderly individual, as it has also been reported that diffu-sion patterns in lumbar discs of asymptomatic subjects are significantly age-related [27]. The link between images and clinical variables is another challenge not addressed in this study [28]. However, Fenty et al. [29] reported that T1r values of the nucleus pulposus as well as disc height are significantly decreased in painful discs.
Moreover, the parallelism was initially described using standing lateral radiographs of the spine. For reasons of radiation exposure, standard radiographs were not ordered in this study. Before starting the analysis, we per-formed a preliminary comparison of the L5-S1 angle in some subjects (n = 28) that had undergone standard radi-ographs and an MRI less than 24 hours apart and found minor differences between the two techniques in this regard. In addition, it has been shown that MRI measure-ments of lumbar disc height and volume have sufficient validity and reliability [30].
ConclusionA parallel phenotype of the L5-S1 disc likely should be considered abnormal in the sense of an initial stage of dehydration and possibly degeneration. Investigating the implications of this radiographic phenotype in a clinical context should be encouraged. This might be of relevance for areas of the world where access to MRI is limited.
Figure 3: Example ROI placement representing the nucleus pulposus area and the corresponding mapping image.
Table 1: Values (mean ± Standard Deviation) of the parallel (N = 7) and non-parallel groups (N = 34).
Sacral slope (°) L5-S1 angle (°) T1 values (ms)
Morning Evening
Parallel (n = 7) 31.7 ± 4.9 6.9 ± 1.4 1090.9 ± 33.3 1004.7 ± 22.2
Non parallel (n = 34) 40.1 ± 5.6 14.3 ± 2.1 1186.9 ± 41.2 1126.6 ± 12.9
P value <0.05 <0.05 <0.05 <0.05

Galley and Balagué: Revisiting Radiographic L5-S1 Parallelism Using MRI T1 MappingArt. 59, page 4 of 5
Competing InterestsThe authors have no competing interests to declare.
References 1. Hansen, BB, Hansen, P, Carrino, JA, Fournier,
G, Rasti, Z and Boesen, M. Imaging in mechanical back pain: Anything new? Best Pract Res Clin Rheu-matol. 2016 Aug; 30(4): 766–85. DOI: https://doi.org/10.1016/j.berh.2016.08.008
2. Avoundjian, T, Gidwani, R, Yao, D, et al. Evaluating two measures of lumbar spine MRI overuse: Admin-istrative data versus chart review. J Am Coll Radiol JACR. 2016 Sep; 13(9): 1057–66. DOI: https://doi.org/10.1016/j.jacr.2016.04.013
3. Mafi, JN, McCarthy, EP, Davis, RB and Landon, BE. Worsening trends in the management and treat-ment of back pain. JAMA Intern Med. 2013 Sep 23; 173(17): 1573–81. DOI: https://doi.org/10.1001/jamainternmed.2013.8992
4. Ademola, AA. An appraisal of the cost benefit of magnetic resonance imaging in Nigeria. Niger Post-grad Med J. 2003 Dec; 10(4): 251–3.
5. Ratib, O, Roduit, N, Nidup, D, De Geer, G, Rosset, A and Geissbuhler, A. PACS for Bhutan: A cost-effective open source architecture for emerging countries. Insights Imaging. 2016 Oct; 7(5): 747–53. DOI: https://doi.org/10.1007/s13244-016-0512-7
6. Kraus, M, Mauch, F, Ammann, B, Cunningham, M and Gebhard, F. Use of magnetic resonance imaging in orthopaedic trauma surgery: Global needs analysis. Unfallchirurg. 2014 Mar; 117(3): 190, 192–6. DOI: https://doi.org/10.1007/s00113-013-2398-x
7. Sambo, LG and Kirigia, JM. Investing in health sys-tems for universal health coverage in Africa. BMC Int Health Hum Rights. 2014 Oct 28; 14: 28. DOI: https://doi.org/10.1186/s12914-014-0028-5
8. Rodríguez, A, Rojas, R and Barrios, FA. Year 2000 status of MRI in Mexico. J Magn Reson Imaging JMRI. 2001 May; 13(5): 813–7. DOI: https://doi.org/10.1002/jmri.1113
9. Patel, ND, Broderick, DF, Burns, J, et al. ACR appropriateness criteria low back pain. J Am Coll Radiol JACR. 2016 Sep; 13(9): 1069–78. DOI: https://doi.org/10.1016/j.jacr.2016.06.008
10. Raastad, J, Reiman, M, Coeytaux, R, Ledbetter, L and Goode, AP. The association between lumbar spine radiographic features and low back pain: A systematic review and meta-analysis. Semin Arthritis Rheum. 2015 Apr; 44(5): 571–85. DOI: https://doi.org/10.1016/j.semarthrit.2014.10.006
11. Radi, I and Balagué, F. The apparent parallelism of L5-S1 as an early radiologic sign of lumbo-sacral disk herniation. Schweiz Med Wochenschr. 1981 Apr 18; 111(16): 561–5.
12. Perricone, G, Bilotta, TW and Fusaro, I. Verifica-tion of a method of radiologic study on the parallel-ism of L5-S1 as an early sign of disk herniation. Chir Organi Mov. 1981 Dec; 67(6): 701–3.
13. Borsotti, C, Dacatra, U and Giancola, R. Parallel-ism of L5-S1 in the radiological diagnosis of lumbar disk hernia. Chir Ital. 1985 Jun; 37(3): 353–7.
14. Zobel, BB, Vadalà, G, Del Vescovo, R, et al. T1r magnetic resonance imaging quantifica-tion of early lumbar intervertebral disc degenera-tion in healthy young adults. Spine. 2012 Jun 15; 37(14): 1224–30. DOI: https://doi.org/10.1097/BRS.0b013e31824b2450
15. Zhang, X, Yang, L, Gao, F, et al. Comparison of T1r and T2* relaxation mapping in patients with differ-ent grades of disc degeneration at 3T MR. Med Sci Monit Int Med J Exp Clin Res. 2015 Jul 4; 21: 1934–41. DOI: https://doi.org/10.12659/MSM.894406
16. Nagashima, M, Abe, H, Amaya, K, et al. A method for quantifying intervertebral disc signal intensity on T2-weighted imaging. Acta Radiol Stockh Swed 1987. 2012 Nov 1; 53(9): 1059–65.
17. Vrenken, H, Geurts, JJG, Knol, DL, et al. Whole-brain T1 mapping in multiple sclerosis: Global changes of normal-appearing gray and white mat-ter. Radiology. 2006 Sep 1; 240(3): 811–20. DOI: https://doi.org/10.1148/radiol.2403050569
18. Guermazi, A, Roemer, FW, Alizai, H, et al. State of the art: MR imaging after knee cartilage repair sur-gery. Radiology. 2015 Sep 24; 277(1): 23–43. DOI: https://doi.org/10.1148/radiol.2015141146
19. Nebelung, S, Sondern, B, Oehrl, S, et al. Func-tional MR imaging mapping of human articular cartilage response to loading. Radiology. 2016 Aug 26; 160053. DOI: https://doi.org/10.1148/radiol.2016160053
20. Galley, J, Maestretti, G, Koch, G and Hoogewoud, H-M. Real T1 relaxation time measurement and diurnal variation analysis of intervertebral discs in a healthy population of 50 volunteers. Eur J Radiol. 2017 Feb 1; 87: 13–9. DOI: https://doi.org/10.1016/j.ejrad.2016.12.001
21. O’Brien, MF, Kuklo, TR, Blanke, KM and Lenke, LG. Radiographic Measurement Manual. Medtronic Sofamor Danek USA.
22. Zhong, W, Driscoll, SJ, Wu, M, et al. In Vivo Morphological Features of Human Lumbar Discs. Medicine (Baltimore) [Internet]. 2014 Dec 2 [cited 2017 Jan 3]; 93(28). Available from: http://www.ncbi.nlm.nih.gov/pmc/articles/PMC4603132/. DOI: https://doi.org/10.1097/MD.0000000000000333
23. van der Houwen, EB, Baron, P, Veldhuizen, AG, Burgerhof, JGM, van Ooijen, PMA and Verkerke, GJ. Geometry of the intervertebral volume and ver-tebral endplates of the human spine. Ann Biomed Eng. 2010 Jan; 38(1): 33–40. DOI: https://doi.org/10.1007/s10439-009-9827-6
24. Cohn, EL, Maurer, EJ, Keats, TE, Dussault, RG and Kaplan, PA. Plain film evaluation of degenerative disk disease at the lumbosacral junction. Skeletal Radiol. 1997 Mar; 26(3): 161–6. DOI: https://doi.org/10.1007/s002560050213

Galley and Balagué: Revisiting Radiographic L5-S1 Parallelism Using MRI T1 Mapping Art. 59, page 5 of 5
25. Mac-Thiong, J-M, Roussouly, P, Berthonnaud, E and Guigui, P. Age- and sex-related variations in sagittal sacropelvic morphology and balance in asymptomatic adults. Eur Spine J Off Publ Eur Spine Soc Eur Spinal Deform Soc Eur Sect Cerv Spine Res Soc. 2011 Sep; 20(Suppl 5): 572–7. DOI: https://doi.org/10.1007/s00586-011-1923-2
26. Barrey, C, Jund, J, Noseda, O and Roussouly, P. Sagittal balance of the pelvis-spine complex and lumbar degenerative diseases. A comparative study about 85 cases. Eur Spine J Off Publ Eur Spine Soc Eur Spinal Deform Soc Eur Sect Cerv Spine Res Soc. 2007 Sep; 16(9): 1459–67. DOI: https://doi.org/10.1007/s00586-006-0294-6
27. Zhang, Z, Chan, Q, Anthony, M-P, et al. Age-related diffusion patterns in human lumbar intervertebral discs: A pilot study in asymptomatic subjects. Magn Reson Imaging. 2012 Feb; 30(2):
181–8. DOI: https://doi.org/10.1016/j.mri.2011 .09.021
28. Chou, R, Fu, R, Carrino, JA and Deyo, RA. Imag-ing strategies for low-back pain: Systematic review and meta-analysis. The Lancet. 2009 Feb 7; 373(9662): 463–72. DOI: https://doi.org/10.1016/S0140-6736(09)60172-0
29. Fenty, M, Crescenzi, R, Fry, B, et al. Novel imag-ing of the intervertebral disk and pain. Glob Spine J. 2013 Jun; 3(3): 127–32. DOI: https://doi.org/10.1055/s-0033-1347930
30. Neubert, A, Fripp, J, Engstrom, C, Gal, Y, Crozier, S and Kingsley, MIC. Validity and reliability of com-puterized measurement of lumbar intervertebral disc height and volume from magnetic resonance images. Spine J Off J North Am Spine Soc. 2014 Nov 1; 14(11): 2773–81. DOI: https://doi.org/10.1016/j.spinee.2014.05.023
How to cite this article: Galley, J and Balagué, F. Revisiting Radiographic L5-S1 Parallelism Using MRI T1 Mapping. Journal of the Belgian Society of Radiology. 2018; 102(1): 59, 1–5. DOI: https://doi.org/10.5334/jbsr.1501
Submitted: 15 January 2018 Accepted: 15 September 2018 Published: 27 September 2018
Copyright: © 2018 The Author(s). This is an open-access article distributed under the terms of the Creative Commons Attribution 4.0 International License (CC-BY 4.0), which permits unrestricted use, distribution, and reproduction in any medium, provided the original author and source are credited. See http://creativecommons.org/licenses/by/4.0/.
OPEN ACCESS Journal of the Belgian Society of Radiology is a peer-reviewed open access journal published by Ubiquity Press.