Embed Size (px)
Citation preview

1
Revised Methodology for Determining the Escalation Factors and Other Parameters to be notified by CERC as per the Amendment
to the Competitive Bidding Guidelines dated 27.3.2009 (July 2009)
In pursuance of Clause 5.6 (vi) of Ministry of Power (MOP) Notification dated
19.1.2005 (as amended from time to time) on “Guidelines for Determination of Tariff by
Bidding Process for procurement of Power by Distribution Licensees”, the CERC notifies
various rates, every six months, for the purpose of bid evaluation and payment. The MOP,
vide Resolution, dated 27.3.2009 issued an amendment to these guidelines and the CERC is
now required to notify various new rates as per the amendment in addition to the rates
notified in the past. The new rates are required for Case 1 Bidding (where the location,
technology, or fuel is not specified by the procurer). The relevant Clause is as under:
“2.23 Sub-clause (vi) of clause 5.6 is replaced by the following:
Following shall be notified and updated by the CERC every six months:
1. Escalation rate for domestic coal. (Separately for evaluation and payment)
2. Escalation rate for domestic gas. (Separately for evaluation and payment)
3. Escalation rates for different escalable sub-components of energy charge for plants
based on imported coal. (Separately for evaluation and payment)
4. Escalation rates for inland transportation charges for coal (Separately for evaluation
and payment)
5. Escalation rates for inland transportation charges for gas (Separately for evaluation
and payment)
6. Escalation rate for different escalable sub-components of energy charge for plants
based on imported gas. (Separately for evaluation and payment)
7. Inflation rate to be applied to indexed capacity charge component.
8. Inflation rate to be applied to indexed energy charge component in cases of captive
fuel source.
9. Discount rate to be used for bid evaluation.
10. Dollar-Rupee exchange variation rate. (For the purpose of evaluation)
11. Escalation for normative transmission charges (For the purpose of evaluation)”

2
The Commission, in its earlier notifications has published the above rates excluding
the rates at Sr.No.1 (for payment), 2, 4, 5, 6, and 11. The rates at Sr.No.4, 5, and 11 are new
additions as per the amendment. The rates to be notified by CERC in addition to the rates
notified in the earlier notifications are as under:
1. Escalation rate for domestic coal. (for payment)
2. Escalation rate for domestic gas. (Separately for evaluation and payment)
3. Escalation rates for inland transportation charges for coal (Separately for evaluation
and payment)
4. Escalation rates for inland transportation charges for gas (Separately for evaluation
and payment)
5. Escalation rate for different escalable sub-components of energy charge for plants
based on imported gas. (Separately for evaluation and payment)
6. Escalation for normative transmission charges (For the purpose of evaluation)
7. Matrix of transmission charges and
8. Matrix of transmission losses
The methodology that was used for computing the rates published in the earlier
notifications (Source: consultant’s report Revised dated 22 November 2006, available at
CERC website) and the methodology used for computing the new rates to be published by
CERC as per the amendment to the MOP guidelines dated 27.3.2009 is similar. The
methodology for computing the new rates and the computation of the rates is as under:
I: ESCALATION RATES FOR BID EVALUATION
The annual inflation rates and escalation rates for bid evaluation have been computed
based on the time series data for latest twelve calendar years. The steps followed while
computing the rates are as under.
Step 1: 3 years moving average data points computed based on year-wise index
Step 2: Annual Escalation factors computed based on 3 years moving average data points
Step 3: Mean escalation rate computed based on annual escalation factors
Step 4: In case of hybrid index, weights of various price indices applied on the computed
mean escalation rates.

3
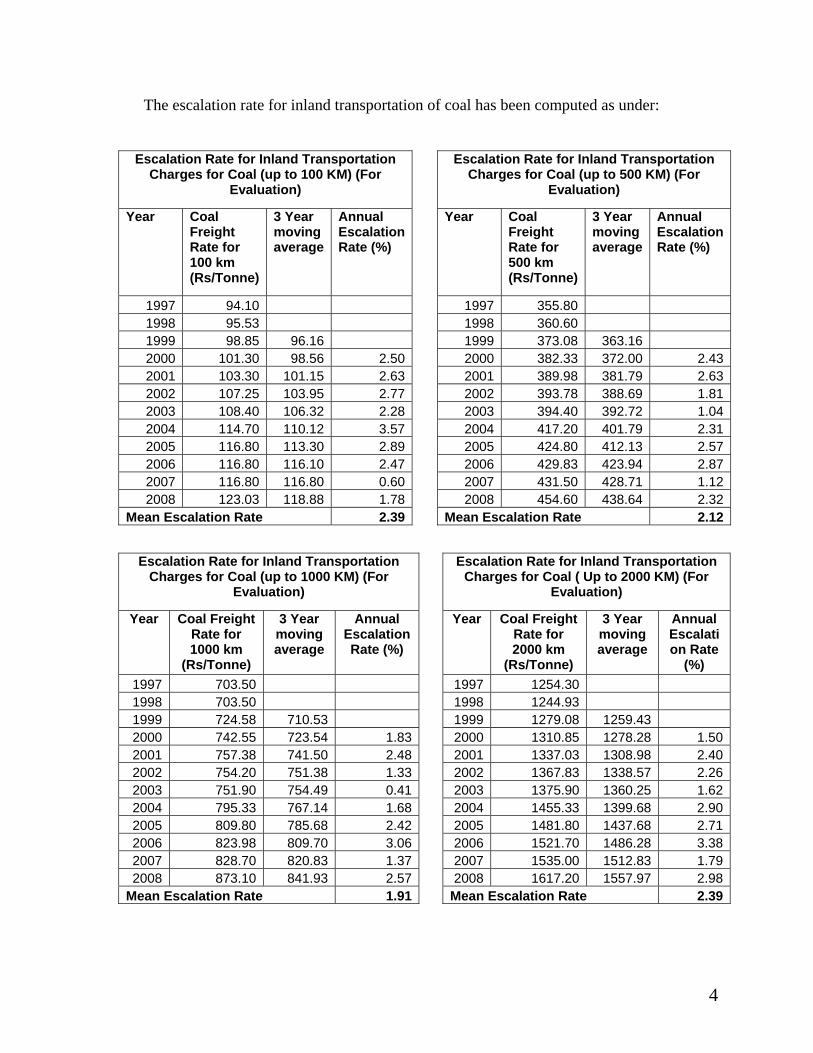
1. Escalation rates for inland transportation charges for coal (For Evaluation)
The transportation of coal to power plants takes place mainly by rail and the Ministry
of Railways notifies freight rates for transportation of coal from time to time. The coal freight
rates are available for different distances from 1 km to 5000 km. The coal freight rates are
sensitive to different distances and are telescopic in nature. The rates are higher when the
distance is more and the rates are lower when the distance is less. Keeping the existing
location of power plants from the distance of coal mines, the escalation rate for inland
transportation charges for coal has been computed for different distances. The data on coal
freight rate for 100 km, 500 km, 1000 km, 2000 km and 3000 km has been used for
computing the escalation rate for inland transportation of coal for distance upto 100 km, upto
500 km, upto 1000 km, upto 2000 km and beyond 2000 km respectively.
Name of the Index: Single index based on freight rates notified by Ministry of Railways
from time to time.
Source/Publisher: GOI, Ministry of Railways (website: www.indianrailways.gov.in)
Description: The escalation rate for inland transportation of coal has been computed based
on the time series data on coal freight rates for the latest 12 years i.e. for the period from
1997 to 2008.
Reasons: Single Index is recommended for the following reasons:
• The coal freight rates are sensitive to different distances and are higher when the
distance is more and are lower when the distance is less.
• To cover different distances for transportation of coal, 5 separate indices used for
computing the escalation rate for inland transportation of coal for 5 different
distances.
• The freight rates are sensitive to different distances. Therefore, the rates applicable to
the upper end of the distance are taken while computing the escalation rates.
4
The escalation rate for inland transportation of coal has been computed as under:
Escalation Rate for Inland Transportation
Charges for Coal (up to 100 KM) (For Evaluation)
Escalation Rate for Inland Transportation Charges for Coal (up to 500 KM) (For
Evaluation)
Year Coal Freight Rate for 100 km (Rs/Tonne)
3 Year moving average
Annual Escalation Rate (%)
Year Coal Freight Rate for 500 km (Rs/Tonne)
3 Year moving average
Annual Escalation Rate (%)
1997 94.10 1997 355.80 1998 95.53 1998 360.60 1999 98.85 96.16 1999 373.08 363.16 2000 101.30 98.56 2.50 2000 382.33 372.00 2.432001 103.30 101.15 2.63 2001 389.98 381.79 2.632002 107.25 103.95 2.77 2002 393.78 388.69 1.812003 108.40 106.32 2.28 2003 394.40 392.72 1.042004 114.70 110.12 3.57 2004 417.20 401.79 2.312005 116.80 113.30 2.89 2005 424.80 412.13 2.572006 116.80 116.10 2.47 2006 429.83 423.94 2.872007 116.80 116.80 0.60 2007 431.50 428.71 1.122008 123.03 118.88 1.78 2008 454.60 438.64 2.32
Mean Escalation Rate 2.39 Mean Escalation Rate 2.12
Escalation Rate for Inland Transportation Charges for Coal (up to 1000 KM) (For
Evaluation)
Escalation Rate for Inland Transportation Charges for Coal ( Up to 2000 KM) (For
Evaluation)
Year Coal Freight Rate for 1000 km
(Rs/Tonne)
3 Year moving average
Annual Escalation Rate (%)
Year Coal Freight Rate for 2000 km
(Rs/Tonne)
3 Year moving average
Annual Escalation Rate
(%) 1997 703.50 1997 1254.30 1998 703.50 1998 1244.93 1999 724.58 710.53 1999 1279.08 1259.43 2000 742.55 723.54 1.83 2000 1310.85 1278.28 1.502001 757.38 741.50 2.48 2001 1337.03 1308.98 2.402002 754.20 751.38 1.33 2002 1367.83 1338.57 2.262003 751.90 754.49 0.41 2003 1375.90 1360.25 1.622004 795.33 767.14 1.68 2004 1455.33 1399.68 2.902005 809.80 785.68 2.42 2005 1481.80 1437.68 2.712006 823.98 809.70 3.06 2006 1521.70 1486.28 3.382007 828.70 820.83 1.37 2007 1535.00 1512.83 1.792008 873.10 841.93 2.57 2008 1617.20 1557.97 2.98
Mean Escalation Rate 1.91 Mean Escalation Rate 2.39

5
Escalation Rate for Inland Transportation Charges for Coal (Beyond 2000 KM) (For Evaluation)
Year Coal Freight Rate for 3000 km (Rs/Tonne)
3 Year moving average
Annual Escalation Rate (%)
1997 1592.90 1998 1580.98 1999 1624.33 1599.40 2000 1664.70 1623.33 1.50 2001 1698.03 1662.35 2.40 2002 1751.03 1704.58 2.54 2003 1765.90 1738.32 1.98 2004 1867.83 1794.92 3.26 2005 1901.80 1845.18 2.80 2006 1948.15 1905.93 3.29 2007 1963.60 1937.85 1.68 2008 2068.83 1993.53 2.87
Mean 2.48
The mean escalation rates computed in the above tables (2.39%, 2.12%, 1.91%,
2.39% and 2.48% respectively applicable for transportation of coal upto 100 km, upto 500
km, upto 1000 km, upto 2000 km and beyond 2000 km) are proposed as annual escalation
rates for inland transportation charges for coal for evaluation.
2. Escalation rate for domestic gas (For Evaluation)
The main producers of natural gas in India are (i) Oil & Natural Gas Corporation Ltd
(ONGC) (ii) Oil India Ltd (OIL) (iii) Joint Ventures (JVs) of Tapti, Panna Mukta and Ravva;
and (iv) Reliance Industries Ltd and others. GAIL (India) Ltd is the main gas supplier.
Prior to 1987, gas prices were fixed by ONGC/OIL. W.e.f. 30.1.1987, the gas price is
being fixed by Government of India (GOI). The price of APM gas of ONGC and OIL was
last revised effective 1.7.2005 and is valid till date. All available APM gas would be supplied
to only the power and fertilizer sector consumers along with the specific end users. The price
is linked to a calorific value of 10000 K.cal/cubic metre. The Ministry of Petroleum and
Natural Gas (MOP&NG) has been regulating the allocation and pricing of gas produced by
ONGC and OIL by issuing administrative orders from time to time. Petroleum and Natural
Gas Regulatory Board (PNGRB) is now regulating the refining, processing, storage,
transportation, marketing and sale of natural gas.

6
Petroleum and Planning Analysis Cell of MOP&NG publishes the statistics relating
to consumer and producer prices of natural gas and transportation charges of natural gas
along HVJ pipeline. Other than HVJ pipeline, GAIL/transporters are permitted to negotiate
transportation charges with the consumers.
Name of the Index: Hybrid index based on 90% weightage to Consumer Price-Off-shore
(Landfall point and On-shore) and 10%Consumer Price (North-Eastern States).
Source/Publisher: GOI, Ministry of Petroleum & Natural Gas (website:
www.petroleum.nic.in) and GAIL (India) Ltd (www.gailonline.com).
Description: The escalation rate for domestic gas has been computed based on the time series
data on consumer price of gas for the latest 12 years i.e. for the period from 1997 to 2008.
Reasons: A hybrid index is recommended for the following reasons:
• There is no single price available for gas
• The weightage has been decided based on the gross production of natural gas in India
during the period 1990-91 to 2007-08. The production of natural gas in the NE
Region is around 10% in the total production of natural gas in India.
• Instead of producer price of natural gas, Consumer price of natural gas has been used
for computing the escalation rate for two reasons: (i) there is a subsidy component
involved between the producer price and consumer price; and (ii) the consumer price
is the price at which the supplier supplies the natural gas to various consumers and
this is exclusive of transportation charges of gas.
The computation of escalation rate for domestic gas can be seen in the following
table.

7
Escalation Rate for Domestic Gas (For Evaluation) Consumer Price-Off-shore (Landfall point and
On-shore) Consumer Price (North-Eastern States)
Year Consumer Price-Off-
shore (Landfall point and On-shore) (Rs./'ooo'
cubic metre)
3 Year moving average
Annual Escalation Rate (%)
Year Consumer Price
(North-Eastern States)
(Rs./'ooo' cubic metre)
3 Year moving average
Annual Escalation Rate (%)
1997 2850 1997 1700 1998 2850 1998 1700 1999 2850 2850.00 1999 1700 1700.00 2000 2850 2850.00 0.00 2000 1700 1700.00 0.00 2001 2850 2850.00 0.00 2001 1700 1700.00 0.00 2002 2850 2850.00 0.00 2002 1700 1700.00 0.00 2003 2850 2850.00 0.00 2003 1700 1700.00 0.00 2004 2850 2850.00 0.00 2004 1700 1700.00 0.00 2005 3025 2908.33 2.05 2005 1810 1736.67 2.16 2006 3200 3025.00 4.01 2006 1920 1810.00 4.22 2007 3200 3141.67 3.86 2007 1920 1883.33 4.05 2008 3200 3200.00 1.86 2008 1920 1920.00 1.95
Mean 1.31 Mean 1.38 Weight Mean
Escalation Rate
Contribution to Index
Mean escalation for consumer price (Off-shore) 0.90 1.31 1.18 Mean escalation for consumer price (North-East) 0.10 1.38 0.14 Annual Escalation Rate for Domestic Gas (%) 1.31
The mean escalation rate computed in the above table (1.31%) is proposed as annual
escalation rate for domestic gas.
Note: In future, the power plants may use other than APM Gas. In such situation, the
price other than APM Gas will also be used for computing the escalation rate.
3. Escalation rates for inland transportation charges for gas (For Evaluation)
The natural gas produced in India and imported natural gas is being transported
mainly by GAIL at the rate prescribed by the MOP&NG/PNGRB. Petroleum and Planning
Analysis Cell of MOP&NG publishes the statistics relating to transportation charges of

8
natural gas along HVJ pipeline. Other than HVJ pipeline, GAIL/transporters are permitted to
negotiate transportation charges with the consumers. The data on transportation charges other
than the HVJ pipeline is not available at present. For this reason the escalation rate for
transportation charges of gas has been computed based on the transportation charges charged
by GAIL along HVJ pipeline.
Name of the Index: Single index based on the transportation charges of gas along HVJ
pipeline charged by GAIL.
Source/Publisher: GOI, Ministry of Petroleum & Natural Gas (website:
www.petroleum.nic.in) and GAIL (India) Ltd (www.gailonline.com).
Description: Escalation Rate for Inland Transportation Charges for Gas has been computed
based on the time series data on transportation charges of gas along HVJ pipeline charged by
GAIL for the latest 12 years i.e. for the period from 1997 to 2008.
Reasons: Single index is recommended for the following reasons:
• GAIL is the main transporter of gas in India and HVJ pipeline is the major pipeline
for transportation of gas.
The escalation rate for transportation of natural gas for evaluation has been computed
as under: Escalation Rate for Inland Transportation Charges for Gas (For
Evaluation)
Year Transportation charges along HVJ pipeline (Rs./'ooo' cubic metre)
3 Year moving average
Annual Escalation Rate (%)
1997 850
1998 850
1999 850 850.00
2000 850 850.00 0.00 2001 850 850.00 0.00 2002 1075 925.00 8.82 2003 1150 1025.00 10.81 2004 1150 1125.00 9.76
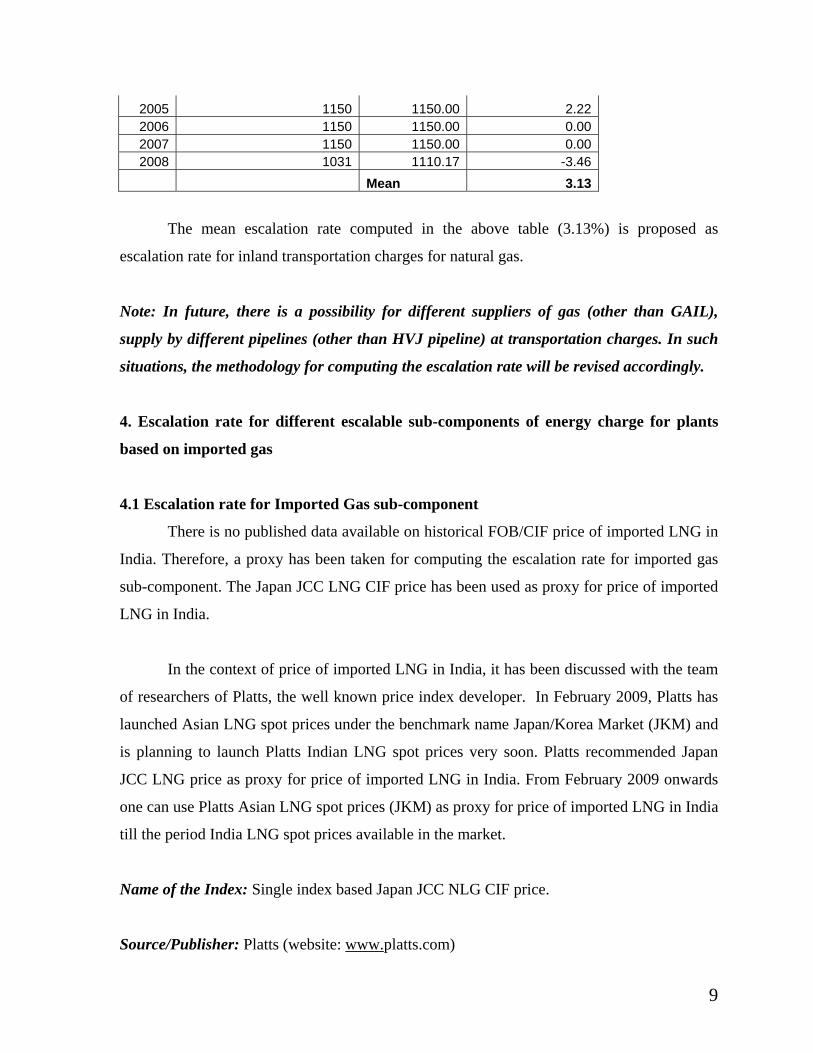
9
2005 1150 1150.00 2.22 2006 1150 1150.00 0.00 2007 1150 1150.00 0.00 2008 1031 1110.17 -3.46
Mean 3.13
The mean escalation rate computed in the above table (3.13%) is proposed as
escalation rate for inland transportation charges for natural gas.
Note: In future, there is a possibility for different suppliers of gas (other than GAIL),
supply by different pipelines (other than HVJ pipeline) at transportation charges. In such
situations, the methodology for computing the escalation rate will be revised accordingly.
4. Escalation rate for different escalable sub-components of energy charge for plants
based on imported gas
4.1 Escalation rate for Imported Gas sub-component
There is no published data available on historical FOB/CIF price of imported LNG in
India. Therefore, a proxy has been taken for computing the escalation rate for imported gas
sub-component. The Japan JCC LNG CIF price has been used as proxy for price of imported
LNG in India.
In the context of price of imported LNG in India, it has been discussed with the team
of researchers of Platts, the well known price index developer. In February 2009, Platts has
launched Asian LNG spot prices under the benchmark name Japan/Korea Market (JKM) and
is planning to launch Platts Indian LNG spot prices very soon. Platts recommended Japan
JCC LNG price as proxy for price of imported LNG in India. From February 2009 onwards
one can use Platts Asian LNG spot prices (JKM) as proxy for price of imported LNG in India
till the period India LNG spot prices available in the market.
Name of the Index: Single index based Japan JCC NLG CIF price.
Source/Publisher: Platts (website: www.platts.com)

10
Description: The escalation rate for imported gas sub-component for evaluation has been
computed based on the time series data on Platts Japan JCC LNG prices for the latest 12
years i.e. for the period from 1997 to 2008.
Reasons: Single index is recommended for the following reasons:
• One can take weighted average index using price indices of futures and related
assessments of NYMEX Henry Hub and UK NBP or JCC Crude Oil price (which is
being used at present) in addition to Platts Japan JCC LNG price. Import of LNG in
Japan is similar to import of LNG in India.
• Japan JCC LNG price is the CIF price which includes transportation through
shipping. Unlike transportation by pipeline in USA and in European countries, the
transportation of LNG in Asian countries is similar to transportation of LNG in India.
• The major exporting countries of LNG are Algeria, Qatar, Indonesia, Malaylsia,
Australia, whereas, the major importers are Japan, South Korea, Taiwan and Western
Europe. India is relatively close to four of the world’s top five countries in terms of
proven gas reserves, viz. Iran, Qatar, Soudi Arabia and Abu Dhabi.
• Platts provides services to various clients including Federal Energy Regulatory
Commission (FERC, USA).
The escalation rate for imported gas sub-component has been computed as under:
Escalation Rate for Imported Gas component (For Evaluation)
Component Index
Data Series Mean Escalation Rate
Weight Contribution to Index(%)
Japan LNG Price Index
12 years (Jan 1997 to Dec 2008)
12.01% 1 12.01%
Escalation Rate 12.01%
The mean escalation rate computed in the above table (12.01%) is proposed as
escalation rate for imported gas sub-component.

11
Note: In future, the index on price of LNG may be required to be revised for two reasons:
(i) the transportation of LNG in India may take place through pipelines; and (ii) historical
Asian LNG spot price/India LNG spot price may be available.
4.2 Escalation rate for transportation of Gas sub-component
There is no published data available on transportation of gas. Therefore, a proxy has
been taken for computing the escalation rate for transportation of gas sub-component. The
Singapore 380 CST Bunker Fuel Price has been used as proxy.
Singapore is a major fuelling point for shipping in the Asian region, and fuel prices in
Singapore are seen as leading indicators. The Singapore 380 CST Bunker Fuel Price
indicates the FOB prices of 380cst bunker fuel (also referred to as IFO 380) ex Singapore
wharf. Clarkson Research Services provides statistical research and analysis for Clarkson
shipping brokers as well as offering research to the wider market commercially. Clarkson
research has a long history of prices available.
Name of the Index: Singapore 380 CST Bunker Fuel Price.
Source/Publisher: Clarkson Research
Description: The escalation rate for transportation of gas sub-component has been computed
based on the time series data on FOB prices of 380cst bunker fuel for the latest 12 years i.e.
for the period from 1997-2008.
Reasons: Single index is recommended for the following reasons:
• Fuel prices form a significant component of total ocean freight costs.
• The main considerations are consumption of bunker fuel used by a ship’s main
engines and a marine diesel oil used to run generators on a vessel while in port.
• Most vessels have unified fuel systems, which allow for use of bunker fuel at sea to
power auxiliary engines, while others use diesel also for this duty.

12
• Various grades and specifications of bunker fuel are available, but shipping brokers
and consultants usually refer to the cheaper and heavier 380cst grade when tracking
bunker fuel prices.
• Clarkson Research is a reputable supplier of shipping data.
• Singapore is a major fuelling point for shipping in the Asian region, and fuel prices in
Singapore are seen as leading indicators.
The escalation rate for transportation of gas sub-component has been computed as
under: Escalation Rate for transportation sub-component (For Evaluation)
Component Index
Data Series Mean Escalation Rate
Weight Contribution to Index(%)
Singapore Bunker Price Index
12 years (Jan 1997 to Dec 2008)
17.95% 1.00 17.95%
Escalation Rate 17.95%
The mean escalation rate computed in the above table (17.95%) is proposed as
escalation rate for transportation of gas for evaluation.
4.3 Escalation Rate for inland handling of Gas sub-component
There is no representative index for inland handling of fuel (gas) because it is
generally handled in many ways. The choice of an appropriate index or indices is difficult. A
hybrid index of Wholesale Price Index (WPI) and Consumer Price Index for industrial
workers (CPI-IW) is used while computing the escalation rate for inland handling of gas sub-
component.
Name of the Index: Hybrid index based on 60% weightage to WPI and 40% weightage to
CPI-IW.
Source/Publisher: GOI, Ministry of Commence and Industry for WPI (website:
www.eaindustry.nic.in) and Labour Bureau for CPI (website: www.labourbureau.nic.in).
13
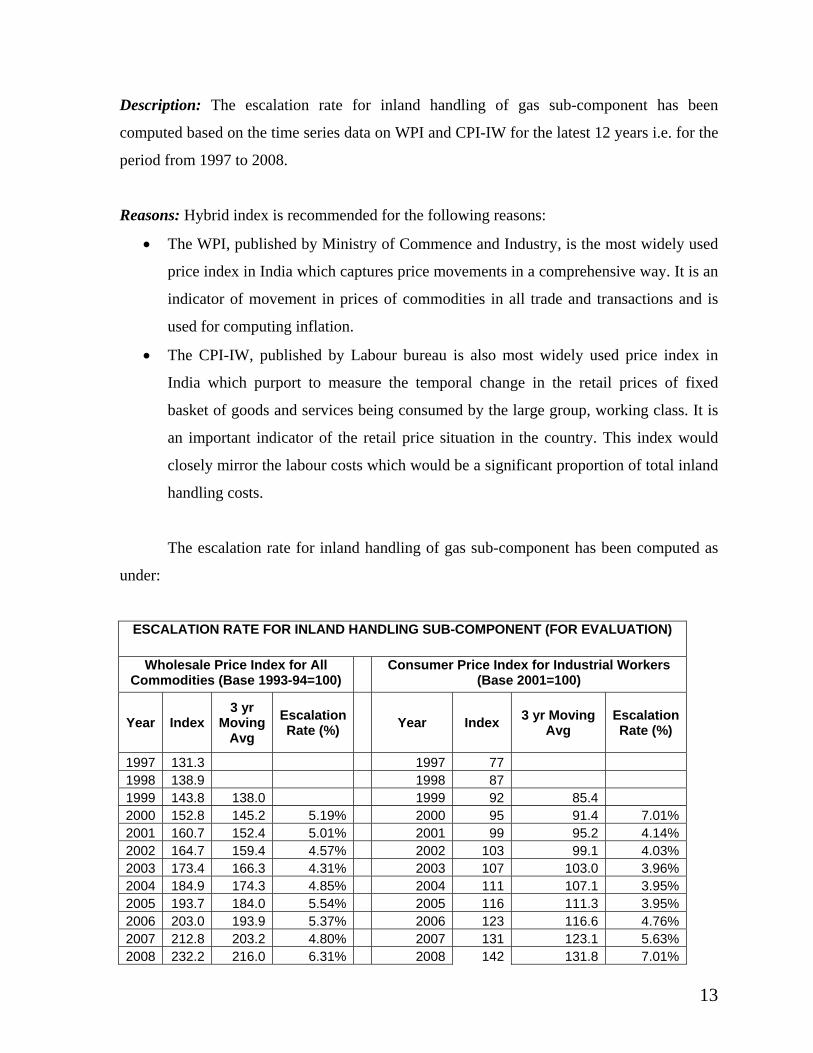
Description: The escalation rate for inland handling of gas sub-component has been
computed based on the time series data on WPI and CPI-IW for the latest 12 years i.e. for the
period from 1997 to 2008.
Reasons: Hybrid index is recommended for the following reasons:
• The WPI, published by Ministry of Commence and Industry, is the most widely used
price index in India which captures price movements in a comprehensive way. It is an
indicator of movement in prices of commodities in all trade and transactions and is
used for computing inflation.
• The CPI-IW, published by Labour bureau is also most widely used price index in
India which purport to measure the temporal change in the retail prices of fixed
basket of goods and services being consumed by the large group, working class. It is
an important indicator of the retail price situation in the country. This index would
closely mirror the labour costs which would be a significant proportion of total inland
handling costs.
The escalation rate for inland handling of gas sub-component has been computed as
under:
ESCALATION RATE FOR INLAND HANDLING SUB-COMPONENT (FOR EVALUATION)
Wholesale Price Index for All Commodities (Base 1993-94=100)
Consumer Price Index for Industrial Workers (Base 2001=100)
Year Index 3 yr
Moving Avg
Escalation Rate (%)
Year Index 3 yr Moving Avg
Escalation Rate (%)
1997 131.3 1997 77 1998 138.9 1998 87 1999 143.8 138.0 1999 92 85.4 2000 152.8 145.2 5.19% 2000 95 91.4 7.01%2001 160.7 152.4 5.01% 2001 99 95.2 4.14%2002 164.7 159.4 4.57% 2002 103 99.1 4.03%2003 173.4 166.3 4.31% 2003 107 103.0 3.96%2004 184.9 174.3 4.85% 2004 111 107.1 3.95%2005 193.7 184.0 5.54% 2005 116 111.3 3.95%2006 203.0 193.9 5.37% 2006 123 116.6 4.76%2007 212.8 203.2 4.80% 2007 131 123.1 5.63%2008 232.2 216.0 6.31% 2008 142 131.8 7.01%

14
Mean 5.11% Mean 4.94% Mean
Escalation Rate
Weight Contribution to Index
Wholesale Price Index for All Commodities 5.11% 0.6 3.06% Consumer Price Index for Industrial Workers 4.94% 0.4 1.98% Escalation Rate 5.04%
The escalation rate computed in the above table (5.04%) has been proposed as
escalation rate for inland handling of gas sub-component.
Note: Re-gasification charges may need to be considered while computing the escalation
rate for Inland handling sub-component of gas. This is mainly for the reason that re-
gasification charges constitutes substantial component of inland handling of gas. As on
date there is no published data available on Re-gasification charges. As and when the re-
gasification charges available the index will be revised.
5. Escalation for normative transmission charges (For Evaluation)
The CERC determines the Annual Transmission charges of each asset of Powergrid
Corporation of India Ltd (PGCIL) by its various orders. Based on the CERC orders, PGCIL
compiles the annual transmission charges of all assets. The transmission charges, as reported
by PGCIL, are inclusive of income tax, incentive and FERV. The data on annual
transmission charges of PGCIL has been used for computing the escalation for normative
transmission charges.
Name of the Index: Single index based on normative transmission charges of PGCIL
Source/Publisher: Powergrid Corporation of India Ltd (website: www.powergridindia.com)
Description: The escalation for normative transmission charges for evaluation has been
computed based on the time series data on transmission charges of PGCIL for the latest 12
years i.e. for the period from 1997 to 2008.

15
Reasons: The single index is recommended for the following reasons:
• PGCIL is the only inter-state transmission entity in India.
• The annual transmission charges of PGCIL allowed by CERC on normative basis.
• The transmission charges are different for different assets of transmission and are
different in different regions. Asset-wise index can be made but not practicable.
• The data on annual transmission charges for all assets has been taken for the purpose
of computing the escalation rate for normative transmission charges.
The escalation for normative transmission charges has been computed as under:
ESCALATION FOR NORMATIVE TRANSMISSION CHARGES (FOR EVALUATION)
Year Normative Transmission
Charges (Rs Crs)
3 Year moving average
Annual Escalation Rate (%)
1997 1168.45 1998 1494.39 1999 1736.38 1466.41 2000 2185.61 1805.46 23.12 2001 2126.87 2016.28 11.68 2002 1983.93 2098.80 4.09 2003 2132.33 2081.04 -0.85 2004 2270.28 2128.84 2.30 2005 2753.16 2385.25 12.04 2006 3162.32 2728.58 14.39 2007 3953.39 3289.62 20.56 2008 4493.38 3869.70 17.63
Mean 11.66
The rate computed in the above table (11.66%) has been proposed as escalation for
normative transmission charges for evaluation.
II: ESCALATION RATES FOR PAYMENT:
The annual escalation rates for payment have been computed based on latest twelve
months data (weekly/monthly). The steps followed while computing the rates are as under.

16
Step 1: Average index values for the appropriate six months period computed
Step 2: A half-yearly escalation rate computed based on the six months index.
Step 3: Annual escalation rate computed by multiplying half-yearly escalation rate by two.
Step 4: In case of hybrid index, weights of various price indices applied on the computed
annual escalation rate.
1. Escalation rate for Domestic coal component (for Payment)
The Wholesale Price Index (WPI) is the most widely used price index in India. It is
the only general index capturing price movements in a comprehensive way. The WPI for
Non-Coking coal is available at disaggregated level and is used for computing the escalation
rate for domestic coal component for payment.
Name of the Index: Single index based on WPI for Non-Coking coal
Source/Publisher: GOI, Ministry of Commence and Industry (website:
www.eaindustry.nic.in)
Description: The escalation rate for domestic coal for payment has been computed based on
the data on WPI for Non-Coking coal for the period from January 2008 to December 2008.
Reasons: Single index is recommended for the following reasons:
• The WPI for Non-coking coal is published by Government of India.
• The index is available on a weekly basis with the shortest possible time lag
The escalation rate for domestic coal has been computed as under.
ESCALATION RATE FOR DOMESTIC COAL (FOR PAYMENT)
Period WPI (Non-Coking Coal) Jan-08 254.0 Feb-08 254.0 Mar-08 254.0 Apr-08 254.0 May-08 254.0
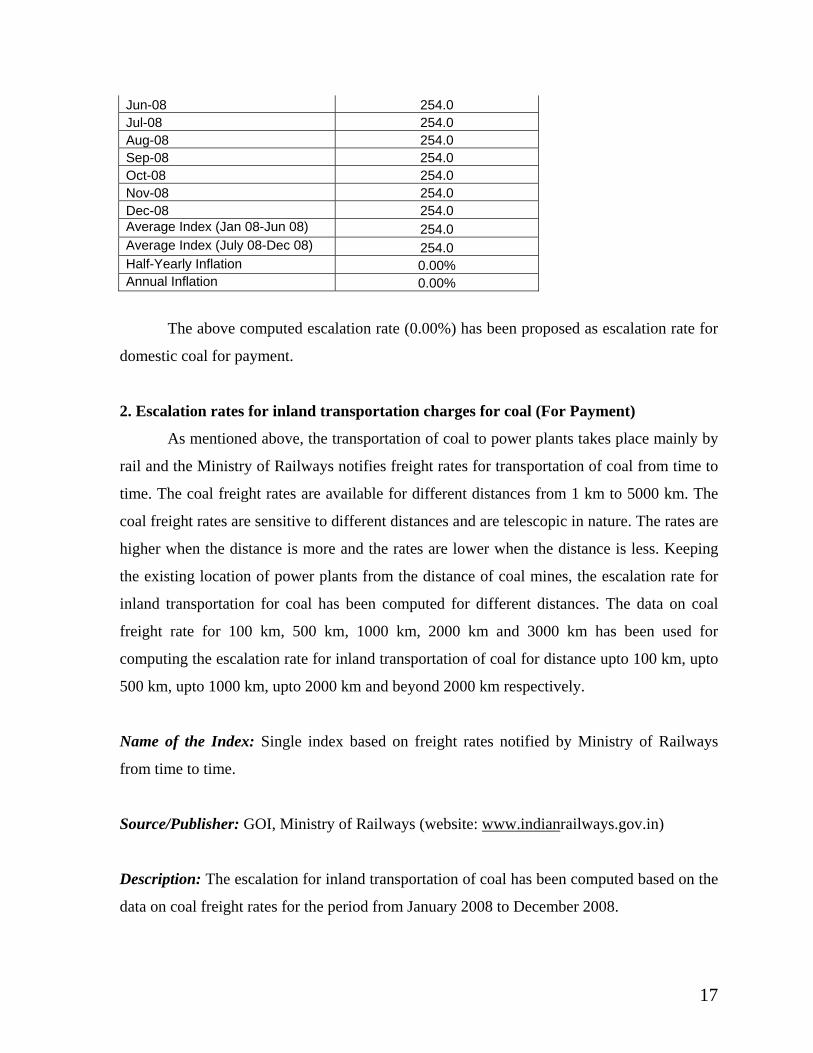
17
Jun-08 254.0 Jul-08 254.0 Aug-08 254.0 Sep-08 254.0 Oct-08 254.0 Nov-08 254.0 Dec-08 254.0 Average Index (Jan 08-Jun 08) 254.0 Average Index (July 08-Dec 08) 254.0 Half-Yearly Inflation 0.00% Annual Inflation 0.00%
The above computed escalation rate (0.00%) has been proposed as escalation rate for
domestic coal for payment.
2. Escalation rates for inland transportation charges for coal (For Payment)
As mentioned above, the transportation of coal to power plants takes place mainly by
rail and the Ministry of Railways notifies freight rates for transportation of coal from time to
time. The coal freight rates are available for different distances from 1 km to 5000 km. The
coal freight rates are sensitive to different distances and are telescopic in nature. The rates are
higher when the distance is more and the rates are lower when the distance is less. Keeping
the existing location of power plants from the distance of coal mines, the escalation rate for
inland transportation for coal has been computed for different distances. The data on coal
freight rate for 100 km, 500 km, 1000 km, 2000 km and 3000 km has been used for
computing the escalation rate for inland transportation of coal for distance upto 100 km, upto
500 km, upto 1000 km, upto 2000 km and beyond 2000 km respectively.
Name of the Index: Single index based on freight rates notified by Ministry of Railways
from time to time.
Source/Publisher: GOI, Ministry of Railways (website: www.indianrailways.gov.in)
Description: The escalation for inland transportation of coal has been computed based on the
data on coal freight rates for the period from January 2008 to December 2008.

18
Reasons: Single Index is recommended for the following reasons:
• The coal freight rates are sensitive to different distances and are higher when the
distance is more and are lower when the distance is less.
• To cover different distances for transportation of coal, 5 separate indices used for
computing the escalation rate for inland transportation of coal for 5 different
distances.
• The freight rates are sensitive to different distances. Therefore, the rates applicable to
the upper end of the distance are taken while computing the escalation rates.
The escalation rate for inland transportation of coal for payment has been computed
as under: Escalation Rate for Inland Transportation of Domestic Coal (For Payment)
Period Coal Freight Index
for 100 km
Coal Freight Index
for 500 km
Coal Freight Index
for 1000 km
Coal Freight Index
for 2000 km
Coal Freight Index
for 3000 km
Jan-08 116.8 431.5 828.7 1535.0 1963.6 Feb-08 116.8 431.5 828.7 1535.0 1963.6 Mar-08 116.8 431.5 828.7 1535.0 1963.6 Apr-08 116.8 431.5 828.7 1535.0 1963.6 May-08 116.8 431.5 828.7 1535.0 1963.6 Jun-08 116.8 431.5 828.7 1535.0 1963.6 Jul-08 116.8 431.5 828.7 1535.0 1963.6 Aug-08 116.8 431.5 828.7 1535.0 1963.6 Sep-08 116.8 431.5 828.7 1535.0 1963.6 Oct-08 116.8 431.5 828.7 1535.0 1963.6 Nov-08 116.8 431.5 828.7 1535.0 1963.6 Dec-08 125.1 462.3 887.9 1644.6 2103.9 Average Index (Jan 08-June 08) 116.80 431.50 828.70 1535.00 1963.60 Average Index (Jul 08-Dec 08) 118.18 436.63 838.57 1553.27 1986.98 Half-Yearly Esclation 1.18% 1.19% 1.19% 1.19% 1.19% Annual Escalation 2.37% 2.38% 2.38% 2.38% 2.38%
The annual escalation rates computed in the above table (2.37, 2.38, 2.38%, 2.38%
and 2.38% respectively applicable upto 100 km, upto 500 km, upto 1000 kms, upto 2000 kms
and beyond 2000 kms) are proposed as annual escalation rates for inland transportation
charges for coal for payment.
19
3. Escalation rate for domestic gas (For Payment)
The main producers of natural gas in India are (i) Oil & Natural Gas Corporation Ltd
(ONGC) (ii) Oil India Ltd (OIL) (iii) Joint Ventures (JVs) of Tapti, Panna Mukta and Ravva;
and (iv) Reliance Industries Ltd and others. GAIL (India) Ltd is the main gas supplier.
Prior to 1987, gas prices were fixed by ONGC/OIL. W.e.f. 30.1.1987, the gas price is
being fixed by Government of India (GOI). The price of APM gas of ONGC and OIL was
last revised effective 1.7.2005 and is valid till date. All available APM gas would be supplied
to only the power and fertilizer sector consumers along with the specific end users. The price
is linked to a calorific value of 10000 K.cal/cubic metre. The Ministry of Petroleum and
Natural Gas (MOP&NG) has been regulating the allocation and pricing of gas produced by
ONGC and OIL by issuing administrative orders from time to time. Petroleum and Natural
Gas Regulatory Board (PNGRB) is now regulating the refining, processing, storage,
transportation, marketing and sale of natural gas.
Petroleum and Planning Analysis Cell of MOP&NG publishes the statistics relating
to consumer and producer prices of natural gas and transportation charges of natural gas
along HVJ pipeline. Other than HVJ pipeline, GAIL/transporters are permitted to negotiate
transportation charges with the consumers.
Name of the Index: Hybrid index based on 90% weightage to Consumer Price-Off-shore
(Landfall point and On-shore) and 10%Consumer Price (North-Eastern States).
Source/Publisher: GOI, Ministry of Petroleum & Natural Gas (website:
www.petroleum.nic.in) and GAIL (India) Ltd (www.gailonline.com).
Description: The escalation rate for domestic gas has been computed based on the data on
consumer price for the period from January 2008 to December 2008.
Reasons: A hybrid index is recommended for the following reasons:

20
• There is no single price available for gas
• The weightage has been decided based on the gross production of natural gas in India
during the period 1990-91 to 2007-08. The production of natural gas in the NE
Region is around 10% in the total production of natural gas in India.
• Instead of producer price of natural gas, Consumer price of natural gas has been used
for computing the escalation rate for two reasons: (i) there is a subsidy component
involved between the producer price and consumer price; and (ii) the consumer price
is the price at which the supplier supplies the natural gas to various consumers and
this is exclusive of transportation charges of gas.
The escalation rate for domestic gas for payment has been computed as under:
ESCALATION RATE FOR DOMESTIC GAS (FOR PAYMENT) Period Consumer
Prices Off-shore (Landfall point and On-shore) (Rs./'ooo' cubic
metre)
Consumer Prices For North-Eastern States (Rs./'ooo'
cubic metre)
2008-01 3200 1920 2008-02 3200 1920 2008-03 3200 1920 2008-04 3200 1920 2008-05 3200 1920 2008-06 3200 1920 2008-07 3200 1920 2008-08 3200 1920 2008-09 3200 1920 2008-10 3200 1920 2008-11 3200 1920 2008-12 3200 1920
Average Index (Jan 08-Jun 08) 3200.0 1920.0 Average Index (July 08-Dec 08) 3200.0 1920.0 Half-Yearly Escalation 0.00% 0.00% Annual Escalation 0.00% 0.00%
Consumer Prices Off-shore
Consumer Prices For North-Eastern
States Capacity Esc Weights 1 0.90 0.10 Half-Yearly Escalation 0.00% 0.00% 0.00% Annual Escalation Rate 0.00% 0.00% 0.00%

21
The annual escalation rate computed in the above table (0.00%) is proposed as
escalation rate for domestic gas for payment.
Note: In future, the power plants may use other than APM Gas. In such situation, the
price other than APM Gas will also be used for computing the escalation rate.
4. Escalation rates for inland transportation charges for gas (For Payment)
The natural gas produced in India and imported natural gas is being transported
mainly by GAIL at the rate prescribed by the MOP&NG/PNGRB. Petroleum and Planning
Analysis Cell of MOP&NG publishes the statistics relating to transportation charges of
natural gas along HVJ pipeline. Other than HVJ pipeline, GAIL/transporters are permitted to
negotiate transportation charges with the consumers. The data on transportation charges other
than the HVJ pipeline is not available at present. For this reason the escalation rate for
transportation charges of gas has been computed based on the transportation charges charged
by GAIL along HVJ pipeline.
Name of the Index: Single index based on the transportation charges of natural gas along
HVJ pipeline charged by GAIL.
Source/Publisher: GOI, Ministry of Petroleum & Natural Gas (website:
www.petroleum.nic.in) and GAIL (India) Ltd (www.gailonline.com).
Description: Escalation Rate for Inland Transportation Charges of Gas has been computed
based on the data on transportation charges of gas along HVJ pipeline charged by GAIL for
the period from January 2008 to December 2008.
Reasons: A Single index is recommended for the following reasons:
• GAIL is the main transporter of gas in India and HVJ pipeline is the major pipeline
for transportation of gas.

22
The escalation rate for transportation of natural gas has been computed as under: ESCALATION RATE FOR INLAND TRANSPORTATION CHARGES
FOR GAS (FOR PAYMENT) Period Transportation charges along HVJ
pipeline (Rs./'ooo' cubic metre)
Jan-08 1150 Feb-08 1150 Mar-08 1150 Apr-08 986 May-08 986 Jun-08 986 Jul-08 986 Aug-08 986 Sep-08 986 Oct-08 1000 Nov-08 1000 Dec-08 1000
Average Index (Jan 08-Jun 08) 1068 Average Index (July 08-Dec 08) 993 Half-Yearly Inflation -7.02% Annual Inflation -14.04%
The annual escalation rate computed in the above table (-14.04%) is proposed as
escalation rate for transportation charges of gas.
Note: In future, there is a possibility for different suppliers of gas (other than GAIL),
supply by different pipelines (other than HVJ pipeline) at transportation charges. In such
situations, the methodology for computing the escalation rate will be revised accordingly.
5. Escalation rate for different escalable sub-components of energy charge for plants
based on imported gas
5.1 Escalation rate for imported gas sub-component (for Payment)
There is no published data available on historical FOB/CIF price of imported LNG in
India. Therefore, a proxy has been taken for computing the escalation rate for imported gas
sub-component. The Japan JCC LNG CIF price has been used as proxy for price of imported
LNG in India.
23
In the context of price of imported LNG in India, it has been discussed with the team
of researchers of Platts (the well known price index developer). In February 2009, Platts has
launched Asian LNG spot prices under the benchmark name Japan/Korea Market (JKM) and
is planning to launch Platts Indian LNG spot prices very soon. Platts recommended Japan
JCC LNG price as proxy for price of imported LNG in India. From February 2009 onwards
one can use Platts Asian LNG spot prices (JKM) as proxy for price of imported LNG in India
till the period India LNG spot prices available in the market.
Name of the Index: Single index based Japan JCC NLG CIF price.
Source/Publisher: Platts (website: www.platts.com)
Description: The escalation rate for imported gas sub-component for payment has been
computed based on Platts Japan JCC LNG price for the period from March 2008 to February
2009.
Reasons: A Single index is recommended for the following reasons:
• One can take weighted average index using price indices of futures and related
assessments of NYMEX Henry Hub and UK NBP or JCC Crude Oil price (which is
being used at present) in addition to Platts Japan JCC LNG spot prices. Import of
LNG in Japan is similar to import of LNG in India.
• Japan JCC LNG price is the CIF price which includes transportation through
shipping. Unlike transportation by pipeline in USA and in European countries, the
transportation of LNG in Asian countries is similar to transportation of LNG in India.
• The major exporting countries of LNG are Algeria, Qatar, Indonesia, Malaylsia,
Australia, whereas, the major importers are Japan, South Korea, Taiwan and Western
Europe. India is relatively close to four of the world’s top five countries in terms of
proven gas reserves, viz. Iran, Qatar, Soudi Arabia and Abu Dhabi.
• Platts provides services to various clients including Federal Energy Regulatory
Commission (FERC, USA).

24
The computation of escalation rate for imported gas can be seen from the following
table. Escalation Rate for Imported Gas component (For Payment)
Component Index
Data Series Escalation Rate
Weight Contribution to Index (%)
Japan LNG Price Index
Monthly data from March 2008 to February 2009
25.67% 1.00 25.67%
Escalation Rate 25.67%
Note: From February 2009 onwards the data on Platts Asian LNG spot prices (JKM) will
be available. For the future notifications the escalation rate for imported gas for payment
will be computed based on Platts Asian LNG spot prices in place of Japan JCC LNG price,
the appropriate proxy for imported LNG in India.
5.2 Escalation rate for transportation of gas sub-component (for Payment)
There is no published data available on transportation of gas. Therefore, a proxy has
been taken for computing the escalation rate for transportation of gas sub-component. The
Singapore 380 CST Bunker Fuel Price has been used as proxy.
Singapore is a major fuelling point for shipping in the Asian region, and fuel prices in
Singapore are seen as leading indicators. The Singapore 380 CST Bunker Fuel Price
indicates the FOB prices of 380cst bunker fuel (also referred to as IFO 380) ex Singapore
wharf. Clarkson Research Services provides statistical research and analysis for Clarkson
shipping brokers as well as offering research to the wider market commercially. Clarkson
research has a long history of prices available.
Name of the Index: Singapore 380 CST Bunker Fuel Price.
Source/Publisher: Clarkson Research

25
Description: The escalation rate for transportation of imported gas sub-component has been
computed based on FOB prices of 380cst bunker fuel for the period from March 2008 to
February 2009.
Reasons: Single index is recommended for the following reasons:
• Fuel prices form a significant component of total ocean freight costs.
• The main considerations are consumption of bunker fuel used by a ship’s main
engines and a marine diesel oil used to run generators on a vessel while in port.
• Most vessels have unified fuel systems, which allow for use of bunker fuel at sea to
power auxiliary engines, while others use diesel also for this duty.
• Various grades and specifications of bunker fuel are available, but shipping brokers
and consultants usually refer to the cheaper and heavier 380cst grade when tracking
bunker fuel prices.
• Clarkson Research is a reputable supplier of shipping data.
• Singapore is a major fuelling point for shipping in the Asian region, and fuel prices in
Singapore are seen as leading indicators.
The escalation rate for transportation of gas sub-component for payment has been
computed as under:
Escalation Rate for transportation sub-component (For Payment)
Component Index
Data Series Escalation Rate Weight Contribution to Index(%)
Singapore Bunker Price Index
Monthly data from March 2008 to February 2009
-89.75% 1.00 -89.75%
Escalation Rate -89.75%
The annual escalation rate computed in the above table (-89.75%) is proposed as
escalation rate for transportation of gas for payment.
5.3. Escalation rate for inland handling of gas sub-component (for Payment)
As mentioned above, the annual escalation rate for payment has been computed based
on latest twelve months data. A hybrid index comprising of the Wholesale Price Index (WPI)
26
and the Consumer Price Index (CPI) has been considered for arriving at the escalation rate
for inland handling sub-component.
Name of the Index: Hybrid index based on 60% weightage to WPI and 40% weightage to
CPI-IW.
Source/Publisher: GOI, Ministry of Commence and Industry (website:
www.eaindustry.nic.in) and Labour Bureau for CPI (website: www.labourbureau.nic.in).
Description: The escalation rate for inland handling of gas sub-component has been
computed based on the data on WPI and CPI-IW for the period from January 2008 to
December 2008.
Reasons: Hybrid index is recommended for the following reasons:
• The WPI, published by Ministry of Commence and Industry, is the most widely used
price index in India which captures price movements in a comprehensive way. It is an
indicator of movement in prices of commodities in all trade and transactions and is
used for computing inflation.
• The CPI-IW, published by Labour bureau is also most widely used price index in
India which purport to measure the temporal change in the retail prices of fixed
basket of goods and services being consumed by the large group, working class. It is
an important indicator of the retail price situation in the country. This index would
closely mirror the labour costs which would be a significant proportion of total inland
handling costs.
The escalation rate for inland handling sub-component has been computed as under:
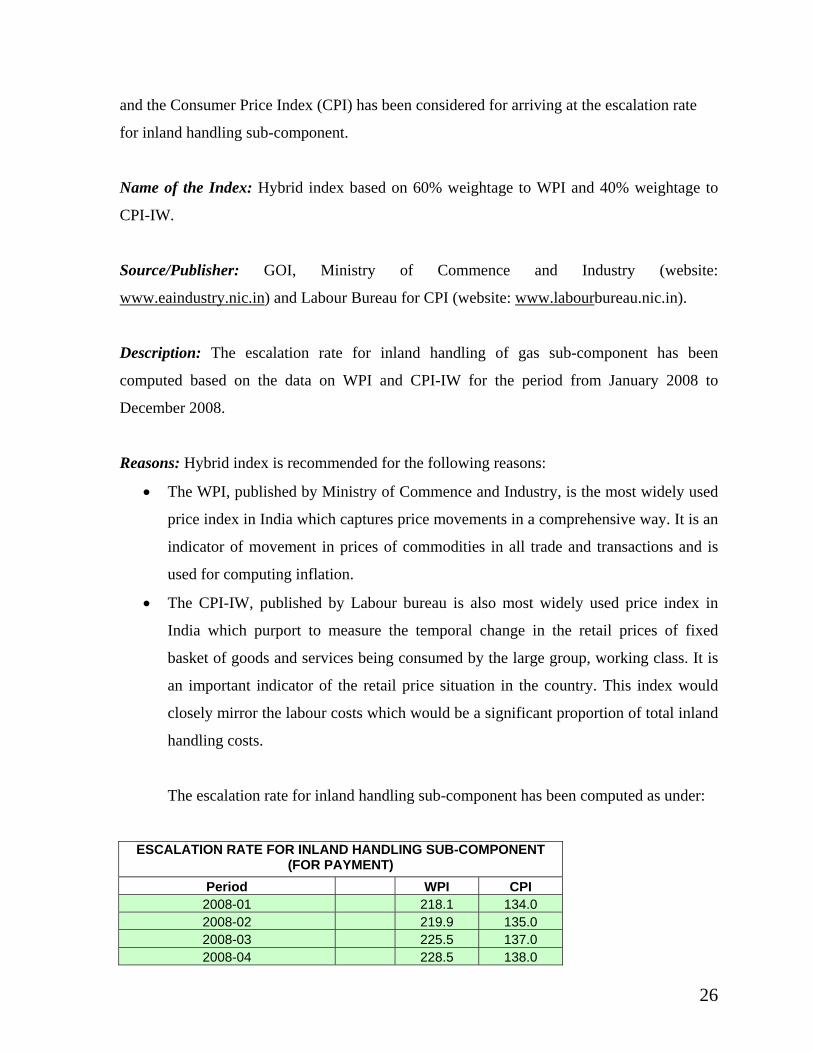
ESCALATION RATE FOR INLAND HANDLING SUB-COMPONENT
(FOR PAYMENT) Period WPI CPI 2008-01 218.1 134.0 2008-02 219.9 135.0 2008-03 225.5 137.0 2008-04 228.5 138.0

27
2008-05 231.1 139.0 2008-06 237.4 140.0 2008-07 240.0 143.0 2008-08 241.2 145.0 2008-09 241.5 146.0 2008-10 239.0 148.0 2008-11 234.2 148.0 2008-12 229.7 147.0
Average Index (Jan 08-Jun 08) 226.8 137.2
Average Index (July 08-Dec 08) 237.6 146.2 Half-Yearly Inflation 4.79% 6.56% Annual Inflation 9.57% 13.12%
WPI
ComponentCPI
ComponentCapacity Esc Weights 1 0.6 0.4 Half-Yearly Inflation 5.50% 2.87% 2.62% Annual Inflation 10.99% 5.74% 5.25%
The annual inflation computed in the above table (10.99%) is proposed as escalation
rate for inland handling charges of gas for payment.
Note: Re-gasification charges may need to be considered while computing the escalation
rate for Inland handling sub-component of gas. This is mainly for the reason that re-
gasification charges constitutes substantial component of inland handling of gas. As on
date there is no published data available on Re-gasification charges. As and when the re-
gasification charges available the index will be revised.
III: MATRIX OF TRANSMISSION CHARGES AND LOSSES
As per the Amendment of the MOP Guidelines, the Commission is also required to
specify/notify the matrix of transmission charges and losses. The Transmission Charges
Matrix and Transmission Loss Matrix has been prepared as per Format 5.10 & 5.11 of the
RFP of Standard Bidding Document of Case-1 as follows.
Transmission charges matrix has been computed based on the data on region-wise
transmission charges collected from PGCIL. The data submitted by PGCIL was based on the

28
region-wise transmission charges and central sector energy. Using the calendar year data for
the latest 5 years, average transmission charges has been computed as under:
TRANSMISSION CHARGES MATRIX
Year Region-wise Transmission Charges (Rs/Unit)
NR WR ER NER SR 2004 0.10 0.09 0.12 0.34 0.19 2005 0.11 0.10 0.12 0.34 0.21 2006 0.12 0.12 0.16 0.33 0.22 2007 0.16 0.14 0.21 0.33 0.22 2008 0.17 0.19 0.21 0.34 0.24
Average 0.13 0.13 0.17 0.34 0.22
The computed average region-wise transmission charges has been proposed as
transmission charges matrix.
Transmission loss matrix has been computed based on the data on region-wise
transmission loss collected from NLDC. Using the calendar year data for the latest 5 years
average transmission loss has been computed as under:
TRANSMISSION LOSS MATRIX
YEAR Region-wise Transmission Losses (%) SR NER ER WR NR
2004 3.16 4.42 2.85 5.43 3.63 2005 3.26 4.28 3.24 5.06 3.46 2006 4.02 3.88 2.99 4.38 3.98 2007 3.85 3.63 3.40 4.19 3.89 2008 4.13 3.68 3.70 5.05 3.99
Average 3.68 3.98 3.24 4.82 3.79
The computed average region-wise transmission losses has been proposed as
transmission loss matrix.
*******


![Generative Fluid Profiles for Interactive Media Arts Projects · Generative Fluid Profiles for Interactive Media Arts Projects ... I.3.7 [Computer Graphics]: Methodology and](https://img.pdfslide.us/doc/110x75/5b5d28297f8b9ad21d8d9358/generative-fluid-profiles-for-interactive-media-arts-projects-generative-fluid.jpg)