Embed Size (px)
Citation preview
REVIEW OF THE LITERATURE
Scope of the Review
The main aim of this literature review is to indicate some of the more recent
advances that have occurred in the areas of rumen metabolism and renal physi-
ology. A comprehensive review of the vast quantities of literature on these fields
is impossible within the space constraints of this thesis. Consequently only those
areas of study in which considerable advances have been made in recent years
and of some relevance to this thesis have been detailed.
The Ruminant
Ruminant animals are from the Order Artiodactyla and the sub-Order Ru-
rninantia . The word ruminant is derived from latin `ruminare' meaning 'to chew
cud'. Ruminants are thus characterised as animals which chew their cud or 'ru-
minate' at periodic intervals.
Ruminants also possess a characteristic gastrointestinal anatomy. There is
an enlarged anterior portion, the reticulorumen, which provides for extensive pre-
gastric fermentation. Microbiota present in the reticulo-rumen possess enzymes
which are capable of hydrolysing 0-1,4 linkages which bind glucose molecules to
form cellulose. Natural ruminant diets are normally very high in cellulose con-
tent. The symbiotic relationship between the microbiota present in the rumen
and the ruminant is essential for normal digestive function.
The Rumen Fermentation
The rumen environment is well adapted to microbial life. It is essentially an
anaerobic ecosystem. The pH range of 5.5 to 7.0 is optimal for a large range of
enzyme systems and the temperature is relatively constant at about 40°C. Food
supply is fairly continuous and ruminal movements provide adequate mixing of
nutrients. Microbiotic waste products are removed via absorption and subsequent
passage out of the forestomachs, thus reducing possible inhibition of microbial
growth by accumulated toxic waste products.
Literature Review Page 2
Carbohydrates
The majority of carbohydrate in natural ruminant feeds is in the form of
polymers associated with plant fibres, mainly cellulose and hemicellulose. The
rate of degradation of plant fibres depends mostly on the stage of maturity of the
plant.
Although the dry matter yield of material may continue to increase with age,
the nutritive value of most forage species decreases with maturity (Phillips et al
1954, Minson et al 1964).
Starch is present in many seeds and tubers and these generally only occur in
quantity in ruminant diets under conditions of artificial feeding eg. feedlotting.
The first step of fermentation of the structural carbohydrates is usually the
hydrolysis of the /3-1,4 linked glucose or xylose units. Generally carbohydrates
are fermented to volatile fatty acids (VFA), methane and CO 2 . Both intracellular
(Leatherwood 1973) and extracellular cellulases (Baldwin and Allison 1983) are
found in rumen bacteria and fungi.
The role of protozoa in cellulose degradation is not clear, however atleast
some species possess endoc.ellulase (Coleman 1978).
Lignin has a very low digestibility and in many studies is regarded as not
being digested at all (Fahey and Jung 1983). Lignin is intimately associated with
structural carbohydrates (Himmelsbach and Barton 1980) and this association
tends to reduce the microbial attack of plant cell walls (Barton and Akin 1977).
Recent studies have revealed that phycoinycetous fungi may help to degrade the
lignified sclerenchyma of plants and enable further bacterial attack and physical
breakdown of plant cell walls (Orpin and Letcher 1979, Bauchop 1981, Akin et al
1983).
The bacterial genera Bacteroides, Rurninococcus, Butyrivibrio and Eubac-
teriurn are the major cellulolytic bacteria found in the rumen.
The major route of hexose fermentation is via the Embden-Meyerhoff path-
way. Pentoses are generally converted to hexoses and trioses via transketolase and
transaldolase enzymes (Baldwin and Allison 1983) however Wallnofer et al (1966)
Literature Review Page 3
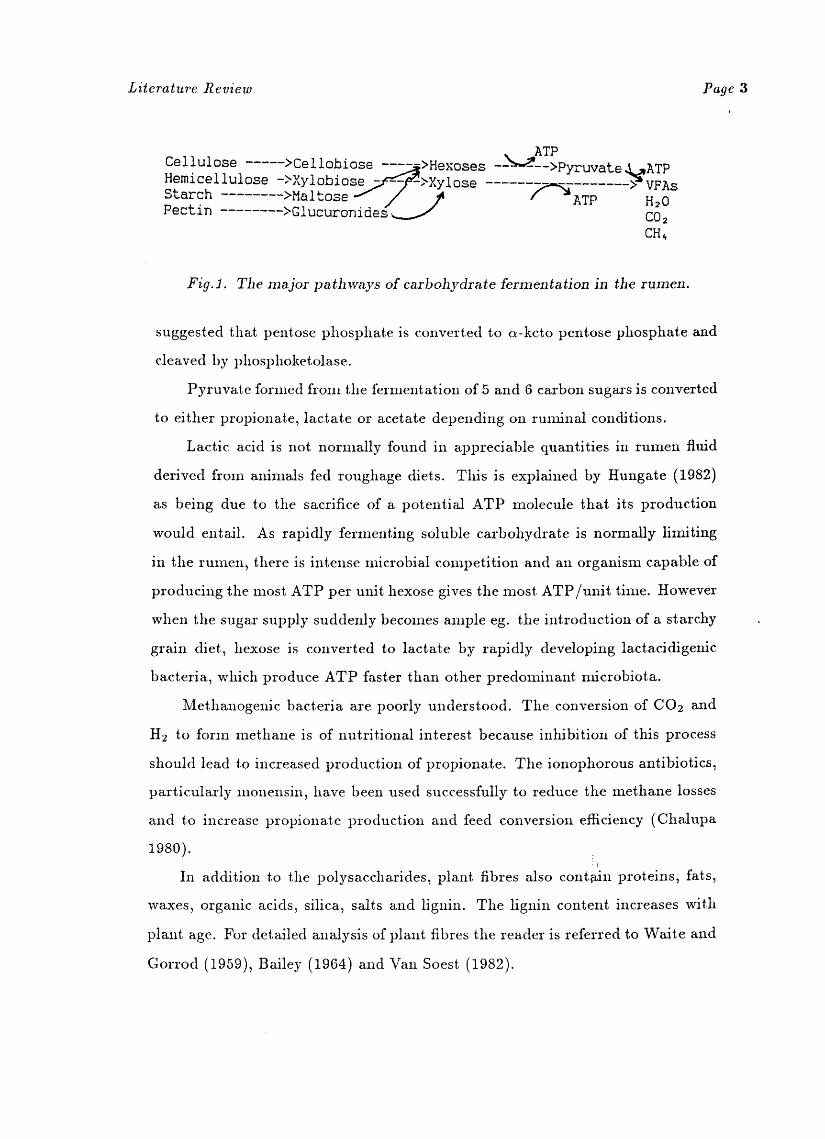
CelluloseHemicelluloseStarch Pectin
ATP >Cellobiose >Hexoses -�s-8-->Pyruvate,:ATP->Xylobiose - ->Xylose > VFAs>Maltose /.'111 ATP H20>Glucuronides14 CO2
CH4
Fig.1. The major pathways of carbohydrate fermentation in the rumen.
suggested that pentose phosphate is converted to a-keto pentose phosphate and
cleaved by phosphoketolase.
Pyruvate formed from the fermentation of 5 and 6 carbon sugars is converted
to either propionate, lactate or acetate depending on ruminal conditions.
Lactic acid is not normally found in appreciable quantities in rumen fluid
derived from animals fed roughage diets. This is explained by Hungate (1982)
as being due to the sacrifice of a potential ATP molecule that its production
would entail. As rapidly fermenting soluble carbohydrate is normally limiting
in the rumen, there is intense microbial competition and an organism capable of
producing the most ATP per unit hexose gives the most ATP/unit time. However
when the sugar supply suddenly becomes ample eg. the introduction of a starchy
grain diet, hexose is converted to lactate by rapidly developing lactacidigenic
bacteria, which produce ATP faster than other predominant microbiota.
Methanogenic bacteria are poorly understood. The conversion of CO 2 and
H2 to form methane is of nutritional interest because inhibition of this process
should lead to increased production of propionate. The ionophorous antibiotics,
particularly monensin, have been used successfully to reduce the methane losses
and to increase propionate production and feed conversion efficiency (Chalupa
1980).
In addition to the polysaccharides, plant fibres also contain proteins, fats,
waxes, organic acids, silica, salts and lignin. The lignin content increases with
plant age. For detailed analysis of plant fibres the reader is referred to Waite and
Gorrod (1959), Bailey (1964) and Van Soest (1982).
Literature Review Page 4
Pasture grasses may vary in lipid content from 5-10 % of the total dry mat-
ter (Scott 1971). The major types of dietary lipids in pasture are mono- and
di- galactosyldiacylglycerols (Weenink 1961). In cereal grains triglycerides pre-
dominate. These are readily hydrolysed in the rumen to form unsaturated fatty
acids, which in turn are hydrogenated to form saturated and monoenoic fatty
acids. Some protozoa and bacteria possess lipases and hydrogenases. Of the bac-
teria Anaerovibrio lipolytica and Butyrivibrio fibrisolvens tend to predominate
(Hungate 1966).
N Metabolism
Much of the protein entering the rumen in the diet is subject to microbial
degradation. The extent of degradation is generally related to the solubility of
the protein in rumen fluid (Wohlt et al 1973).
The proteolytic activity in the rumen is mainly associated with the partic-
ulate fraction of rumen fluid (Blackburn and Hobson 1960) and is due to both
bacteria and protozoa.
The degradation involves two steps. Firstly the protein chain is broken into
peptides and amino acids by proteolysis. The amino acids are then subject to
substantial deamination, such that free amino N levels in rumen fluid are very
low (Allison 1970). The amino acids are generally broken down rather than
incorporated intact into microbial cells (Chalupa 1976).
Although both protozoa and bacteria degrade protein the mechanisms are
somewhat different. Bacteria hydrolyse the protein outside the cell by enzymes
attached to the cell surface (Blackburn and Hobson 1960, Hogan 1976). The
resulting peptides and amino acids are then transported intracellularly and the
peptides hydrolysed further to amino acids and these amino acids are then either
incorporated into bacterial protein or degraded further to VFAs, NH 3 , CO 2 and
CH4 which are then released from the cell (Tamminga 1979).
Protozoa engulf both feed particles and bacteria (Coleman 1975), the protein
from which may then be hydrolysed within the protozoal cell. Protozoa also play
Literature Review Page 5
a role in deamination of amino acids (Coleman 1980).
Most rumen microbes require ammonia for growth and the proteolysis and
deamination of proteins provides the bacteria with NH 3 , keto acids and ATP,
all of which are generally beneficial to microbial growth. Many rumen bacteria
also require intact amino acids for growth (Hungate 1966).
Non protein N also enters the rumen both in the diet and from endogenous
sources (see section on the recycling of N to the reticulorumen). Plants may
contain up to 10% of their total N as nucleic acids, which are degraded in the
rumen to nucleotides, nucleosides and finally to purine and pyrimidine bases
(McAllen and Smith 1973).
Nitrate, which commonly accumulates in plants fertilised with high levels of
N fertilisers during overcast weather, is rapidly reduced to nitrite and then to
NH3 (Lewis 1951) in the rumen.
Urea is quantitatively the most important non protein N substance enter-
ing the rumen, even though its content in plant material is normally very low.
Substantial amounts of endogenous urea enter the rumen, such that sheep may
be maintained on N free diets if urea is administered intravenously (Boda et al
1976).
Urea is hydrolysed rapidly to NH3 and CO 2 by bacterial ureases. Less than
0.5 % of rumen bacteria possess urease (Cook 1976), however bacteria adhering
to the rumen wall are highly ureolytic with about 10 % of species found in this
location possessing urease (Cheng and Costerton 1980).
Consequently sloughing of dead epithelial cells into the rumen fluid accounts
for much of the ureolytic activity of the fluid (Mead and Jones 1981). It has been
suggested that these adherent flora participate in the regulation of urea secretion
across the rumen wall (Cheng and Wallace 1979).
Apart from degrading nitrogenous constituents of the diet and endogenous
secretions the microbiota play a very important role in synthesizing amino acids
and proteins which may be digested when the organisms pass from the rumen
to the lower parts of the digestive tract. Sufficient microbial protein is produced

Literature Review Page 6
in the rumen to allow animals to survive on protein free diets and even produce
milk yields approaching those of normally fed animals (Virtanen 1966).
As mentioned earlier NH 3 is a requirement for many rumen bacteria and
specific amino acids may also be required by some bacteria, but in the mixed
population of the whole rumen, one microorganism may produce the required
amino acid for another. Incorporation of rumen fluid amino acids into bacteria
can be substantial (Nolan 1975). Approximately 80 % of rumen isolates can utilize
NH 3 as their sole N source (Bryant and Robinson 1963). NH 3 entering bacteria
is captured by glutamic and aspartic acids to form the amide groups of glutamine
and asparagine (Boggs 1959), which is followed by the synthesis of alanine and
aspartate. Amino groups are then transferred to other carbon skeletons to form
other amino acids (Smith 1979). To maximise protein production the available
rumen ammonia must be balanced with biologically suitable energy sources.
The yield of microbial dry matter in grams per mole of ATP (Y(ATP))
made available from the energy source is however not necessarily constant. The
Y(ATP) is generally higher for rapidly growing organisms as maintenance costs
are minimal (Isaacson et al 1975). Variations in Y(ATP) of from 10 (Bauchop and
Elsden 1960) to 25 (Isaacson et al 1975) have been recorded. The causes of this
variation in yield are not clear, but alterations in rumen turnover rate (dilution
rate) have dramatic effects, with faster rates having higher yields (Hobson 1965,
Hobson and Summers 1967). Inclusion of fat into the diet has also been shown
to give much higher microbial efficiency (Knight et al 1978). A lack of certain
amino acids, particularly methionine and phenylalanine (Smith 1979), may also
limit Y(ATP).
Baldwin and Allison (1983) suggest that much of the discrepancy in Y(ATP)
can be accounted for by methodological errors. The most likely correct values
for Y(ATP) are within the range of 10-12, whilst some individual microbes may
have values as high as 15-23.
Literature Review Page 7
Nutritive Value of Microbial Protein
Loosli et al (1949) fed sheep a protein free diet with the only source of N being
urea. They showed that all the essential amino acids required by non ruminants
were contained in the rumen microbial biomass. The essential amino acid profile
of microbial protein is not markedly affected by diet and has a relatively high
biological value (Bergen et al 1967,1968). However the yield of microbial protein
may not be sufficient to meet the essential amino acid needs of dairy cattle (Huber
and Kung 1981).
The digestibility and net protein utilisation values for protozoa are higher
than those for bacteria (Owens and Bergen 1983). However the amount of pro-
tozoal protein flowing from the rumen may only be relatively small, due to their
apparent death and degradation in the rumen (Leng 1982).
The Rumen Ammonia Pool
Rumen NH 3 has several sources. It may be derived from the degradation of
dietary protein and non protein N, and from hydrolysis of endogenous N sources
recycled to the rumen, particularly urea. This recycling phenomena will be dis-
cussed in a later section.
The ammonia in the rumen has three possible sinks. 1. Microbial capture, 2.
washout to the lower digestive tract and 3. absorption through the rumen wall.
Absorption of NH3
Ammonia appears to be passively absorbed in the non-ionised form (Smith
1975), therefore the absorption tends to increase as the rumen fluid pH increases.
The amount of absorption is primarily dependent on the non-ionised NH 3 concen-
tration in the rumen fluid (Leng and Nolan 1984). However it has been suggested
that a considerable portion of the absorption occurs in the omasum (Hogan and
Weston 1967, Davidovitch et al 1977).
Most of the NH3 absorbed from the gastrointestinal tract is synthesized to
urea in the liver via the ornitliine cycle. The activity and concentration of the
Literature Review Page 8
enzymes involved in this cycle are increased by feeding high protein diets (Payne
and Morris 1969). The liver has a limited capacity to synthesise urea (Symonds et
al 1981). Recent studies have suggested that pH and bicarbonate concentration of
the body fluids are important regulators of urea synthesis (Atkinson and Camien
1982).
Recycling of N to the Reticulo-rumen
Urea is recycled to the reticulo-rumeii both via saliva and directly across the
rumen wall. The quantitative importance of these two routes has been somewhat
controversial.
Weston and Hogan (1967) estimated that net endogenous urea transfer was
approximately 5 g N/d from the rise in rumen NH 3 following intravenous urea
infusion. They found no further increase in rumen NH 3 once plasma urea level
had reached 180 mgN/L (6.6 mmol/L). Similar data was obtained by Thornton
(1970a) but McIntyre (1971) found that the rumen ammonia levels continued to
increase with intravenous urea input.
Measurement of urea return to the rumen of animals given lucerne hay, us-
ing isotopic methods, gave values of 1.2g N/d (Nolan and Leng 1972) and 1.1g
(Nolan et al 19'76). MacRae et al (1979) found 0.9 g and 1.1 g/d of N was re-
turned for sheep fed Agrostis-Festuea and Heather diets respectively. Obara and
Shimbayashi (1980) have figures of 1.1-1.8g N/d for two rations containing about
35 % low protein hay and 62 % high energy concentrate.
The mechanism of urea recycling across the rumen wall has been obscure.
Gartner (1962) suggested that urea is returned to the rumen by active transport,
but the explanation offered by Cheng and Wallace (1979), suggesting that the
bacterial population adherent to the rumen wall is highly ureolytic and hence
urea is hydrolysed on entry into the rumen, allowing a continual downhill transfer
of urea, appears more plausible.
Non-urea N also enters the rumen with up to 10.8 g N of 'endogenous protein'
input derived mostly from rumen epithelial sloughing (MacRae and Reeds 1979,
Literature Review Page 9
Kennedy and Milligan 1980) and salivary protein (Hogan 1975, Kennedy and
Milligan 1980).
The Urea Pool and Plasma Urea Concentration
The entry rate of urea into the body urea pool is determined mostly by the
N intake of the animal.
Harmeyer and Martens (1980) took data from the literature and found a
highly significant linear relationship between N intake and urea entry rate.
The concentration of urea in plasma is positively related to N intake (Coci-
mano and Leng 1967, Ide 1975), however McIntyre (1970) found that plasma
urea showed a plateauing at about 11 mmol/L (30 ingN/100mL) with higher N
intakes.
The plasma urea concentration thus does not always reflect urea entry rate.
For example, the rise in plasma urea following starvation of sheep is accompanied
by a decline in urea entry rate (Harmeyer et al 1973a, 1973b).
Kennedy and Milligan (1978) showed that a reduction in food intake of 50
% caused no change in Purea but reduced the urea entry rate by 39 %. Clearly
factors other than P urea concentration control the entry rate of urea. However
Purea is a relatively reliable indicator of N utilization of different forages (Egan
and Kellaway 1971).
Increasing the N content of the diet generally increases the urea pool size
and Purea• Harmeyer and Martens (1980) have taken values from the literature
and shown a significant linear relationship between Purea and urea pool size.
The urea space is the volume of fluid which would contain the urea pool
at the P urea urea concentration. The urea space has been shown to be constant at
approximately 80 % of body weight for a variety of dietary regimes (Gaertner
1961), however Cocimano and Leng (1967) showed a wide variation (20-60% BW)
in urea space in animals fed a variety of rations. It appears that urea is excluded
from cell water under some circumstances and included in others. During fasting
urea is transported from muscle to blood probably by an active process (Havassy
Literature Review Page 10
et al 1973). Urea enters human red blood cells by a facilitated diffusion mechanism
(Brahm 1982) and hence has a lower concentration in RBC water than in plasma
water (Rails 1943). However dehydration of sheep increases the RBC water urea
concentration above that of plasma water (Havassy et al 1971). The urea space
is also increased in mice with muscular dystrophy compared to control animals
(Watanabe et al 1981).
Possible Sinks of Plasma Urea
Urea present in the plasma has two major sinks. It is either recycled to the
digestive tract or is excreted in the urine.
Faecal losses of N are normally relatively constant, whilst urinary N losses,
predominantly urea, vary greatly. If the urinary loss of urea could be diverted
to the rumen in animals fed N limiting diets, it is possible that the production
of the animal may increase through greater microbial protein production. This
has been achieved surgically (Gillette 1967) by transplanting one ureter into the
rumen. This procedure reduced the animals requirement for N quite substantially.
Diversion of urea in a practical sense has not yet been achieved. Alteration of
rumen permeability or increasing salivary flow rate chemically are probably the
means by which this may be achieved in the future. Reducing urinary losses of
urea, would make available a higher level of urea for return to the rumen. The
experimental sections of this thesis detail experiments which were predominately
designed to examine which factors determine the excretion of urea in the urine.
Body Fluid Compartments
The total body water of man is normally between 53 and 65 % of the body
weight (Holmes et al 1956). However the value shows great variability in rumi-
nants because of several factors. The gastrointestinal tract of ruminants may
contain relatively large volumes of water, which, although regarded as being out-
side the body proper, is in continuous flux with the extracellular fluid. The body
fat content of sheep also varies greatly, depending on nutritional status and hence
the body water content per unit body weight also varies greatly. Panaretto (1963)
Literature Review Page 11
has shown that as the total body water content increases, fat content decreases
and protein content increases.
The weight of wool carried by the sheep must also be taken into account
when total body water measurements are expressed per unit body weight.
The measurement of total body water in ruminants is carried out using tri-
tiated water as the marker of choice as it equilibrates totally with body water.
Antipyrine often gives volumes of distribution greater than the weight of the an-
imal (Dale et al 1956, Garrett et al 1959), whilst urea may show widely differing
distribution spaces depending on dietary N intake (Cocimano and Leng 1967).
Values obtained for total body water range from 56 to 75 % of body weight
(Macfarlane 1963, Macfarlane et al 1967).
The total body water consists of two major compartments; extracellular fluid
and intracellular fluid. The extracellular fluid is further subdivided into plasma
and interstitial fluid. Many substances have been used for extracellular fluid
volume determination, however the true ECV cannot at present be determined,
rather an estimate based on the distribution space of various markers is used.
The most commonly used markers are as follows, ranked in ascending order of
distribution space Cr'EDTA, inulin, raffinose, sucrose, mannitol, thiosulphate,
radiosulphate, thiocyanate, radiochloride and radiosodium (Ladegaard-Pedersen
and Engell 1972, Pitts 1974).
The intracellular water volume is usually determined by difference between
total body water and ECV.
The plasma composition and volume is directly controlled by the kidneys.
Although it is customary to talk of ECV volume and composition control, it
is the plasma volume and composition which is the critical function and directly
controlled variable by the kidneys. Indeed ECV is only controlled through plasma
changes and the shift of fluids between the interstitial and vascular compartments.
The compliance of the interstitial space is virtually identical to that of the
vascular space and hence provided that the balance of Starling's forces at the
capillary bed are unaltered, changes in plasma and ECV will be mutual (Gauer
Literature Review Page 12
et al 1970).
The Control of the Volume of Extracellular Fluid
In the extracellular fluid, 90 % of the osmotic pressure is due to Na salts,
consequently changes in Na metabolism are probably the prime regulators of the
ECV.
Changes in the absorption and excretion of water are generally secondary
to changes in osmotic pressure and/or Na metabolism. However the control of
ECV and Na metabolism can be separated, for example, in renal disease where
Na loading increases the ECV and FE Na is increased above that of equivalent
Na loading and ECV expansion of normal subjects. This expression of volume
regulation is termed the 'magnification phenomenon' (Bricker et al 1978).
The Effect of Increased Sodium Intake
An increased Na intake results in an increase in Na excretion such that
Na balance becomes restored within a few days. During this restoration period
there is a small positive Na balance, resulting in an isotonic increase in ECV.
Conversely when Na intake is reduced there is a lag phase of a few days with
a small negative Na balance and then a restoration of ECV at a lower level
(Reinhardt and Behrenbeck 1967).
Similarly when mineralocorticoids are chronically administered there is an
increase in ECV with a prompt natriuresis on cessation of the hormone treatment
(Knox et al 1980).
Expansion of the ECV by an intravascular infusion of isotonic fluid results in
a prompt increase in the excretion of Na and water (Knox and Haas 1982). During
water immersion in man there is an increase in blood volume which is associated
with an increase in the excretion of both Na and water (Epstein 1978).
How is the Extracellular Volume Monitored by the Body?
Distension receptors in the carotid sinus, aortic arch and in the atria of the
heart monitor the blood volume and exert a reflex inhibitory tonus via the vagal
Literature Review Page 13
nerves on the release of ADH from the posterior pituitary gland (Gauer et al
1970, Goetz et al 1975).
In addition to a direct effect on ADH release, atrial distension also causes a
sympathetic modulation of renal haemodynamics (Kahl et al 1974).
The control of body water balance depends upon the release of ADH from
the neurohypophysis and also upon the ingestion of water driven by the thirst
mechanism.
Sodium depletion and ECV contraction activate the renin-angiotensin-aldo-
sterone system. Na depletion also elicits a specific appetite for sodium (Denton
1973).
Extracellular fluid Na balance is thus maintained by both neural and hor-
monal factors.
The Release of ADH from the Neurohypophysis
There has been much work examining the factors controlling the release of
ADH. McKinley et al (1978) suggest that there are two major cerebral receptors
that influence the rate of ADH secretion. The first is a classical osmoreceptor and
is located in an area of the brain not associated with a blood-brain-barrier and
the second is a Na detector that monitors cerebrospinal fluid Na concentration.
For a detailed review of the factors controlling ADH release the reader is referred
to Bie (1980).
The kidneys are probably the major organ controlling the composition of
the body fluids. By directly filtering plasma at the renal glomerulus and through
plasma exchange with the interstitial fluid compartments the composition of the
extracellular fluid is closely monitored.
Glomerular Filtration
The notion that the kidney could be likened to a sieve was perceived well
before the classic studies of Bowman and Ludwig in the 19th. century. In fact,
Malpighi wrote in 1666 The ancients conceived of the kidney as a. sieve providing
a. means for separating the urine' (Brenner 1977).
Literature Review Page 14
In mammals about 20-30 % of the large volume of blood plasma entering the
renal glomerulus normally passes through the walls of the capillaries.
Using micropuncture techniques in a mutant strain of rats whose glomeruli
lie close to the cortical surface, the composition of the glomerular filtrate has
been found to be that of a nearly ideal ultrafiltrate, closely resembling plasma
water with respect to low molecular weight solutes. For solutes with molecular
weights greater than 5000, however the transport across the glomerular capillaries
becomes restricted (Pitts 1974).
In mammals the glomerular filter consists of three layers.
1. A thin fenestrated endothelium,
2. a glomerular basement membrane and
3. an epithelial cell layer.
More recently, it has been demonstrated that the glomerulus also has charge
selective properties, such that positively charged molecules are filtered with great-
er facility (Brenner 1978).
The Control of Glomerular Filtration Rate
The glomerular filtration rate of mammals is subject to several controlling
variables.
The rate of ultrafiltrate formation is governed by the same driving forces
governing fluid movement across other capillary membranes.
This may be expressed as
J„ = Kf (AP — LS:7)
= KfR PGc — PT) —Gc — 7rT)]
where „T v is the local rate of ultra,filtration,
IC. 1 is the effective hydraulic permeability of the capillary wall,
AP is the traiiscapillary hydraulic pressure difference,
A7 is the colloid osmotic pressure difference and
GC and T are the glomerular capillary and tubule respectively.
Literature Review Page 15
The protein concentration of the ultrafiltrate is so small that 7r T is considered
as equal to zero.
In 1972 Brenner et al presented data demonstrating that the colloid osmotic
pressure rises along the length of the glomerular capillary (as one would expect
with ultrafiltration occurring) to a value equal to the net hydrostatic pressure
gradient, AP, from capillary to Bowman's space.
ie.
v K f ( AP - 71-GC)
-4 AP — 7rGc = 0
As a result of the fact that equilibrium of pressures was achieved within the
length of the capillary, nephron filtration rate was highly dependent on changes
in plasma flow. This phenomenon is known as 'filtration pressure equilibrium'.
However more recent studies in the hydropenic rat have revealed that there
is no universal agreement on the finding of filtration pressure equilibrium (Blantz
1977). In those studies in which filtration pressure equilibrium was not observed
the findings can be best explained by reductions in the glomerular permeability
coefficient (K / ) in the experimental animals.
The presence or absence of filtration pressure equilibrium markedly influences
the degree to which the respective determinants of GFR can affect the filtration
rate.
A variety of studies have appeared over recent years that have directly as-
sessed the effects of hormonal agents on filtration forces and permeability surface
area properties of the glomerular capillary. Table 1 shows the effects of certain
hormonal agents on Kf.
Probably the most studied of these hormones is angiotensin II. It causes noted
reductions in renal plasma flow because of both afferent and efferent arteriolar
resistance increases and a large reduction in the glomerular permeability coeffi-
cient (K 1 ). Angiotensin II specific receptors within the glomerulus that cause
contraction of mesangial cells have been demonstrated (Ausiello et at 1980). So
Literature Review Page 16
Table 1. The effects of various humoral agents on glomerular function
Hormone Glornerular Effects
Angiotensin II T K1 1ERPF T OP
Prostaglandins E1,12 T K f T ERPF
ADH T Kf +ERPF
Acetylcholine T K f T ERPF
Bradykinin T Kf T ERPF
PTH T Kf
Histamine T K f T ERPF
(adapted from Blantz 1980)
the mechanism of angiotensin reduction of K f may be as follows:
1. Capillary constriction causing decreased surface area,
2. Decreased capillary wall permeability to water and small solutes,
3. Diversion of glomerular flow to shorter capillary segments.
The effects of all the above hormones, except for ADH, can be prevented
by giving saralasin, an angiotensin antagonist, suggesting that most hormones
affecting glomerular permeability act via the action of angiotensin II on Kf.
Tubuloglornerular Feedback
Changes in systemic arterial blood pressure cause little effect on the GFR,
because of the phenomenon known as tubuloglomerular or distal tubular feedback.
It has been known for some time that each distal tubule is closely apposed
to the vascular pole of the glomerulus of the same nephron.
The distal tubular feedback hypothesis proposes that a structure in the dis-
tal tubule, presumably the juxtaglomerular apparatus or macula densa area, is
capable of sensing a physico-chemical component of the fluid emerging from the
ascending loop of Henle and initiating a sequence of events that culminates in
the local adjustment of vascular resistance and glomerular filtration rate. The
negative feedback function subserved by this system requires that increases in
Literature Review Page 17
flow into the distal tubule lead to decreases in GFR.
The precise nature of the intraluminal component in the distal tubular fluid
that is monitored is at present uncertain.
Early studies suggested sodium (Thurau 1964), then in the late 1970s after
the demonstration of active chloride transport from the ascending thick limb of
Henle (Burg and Green 1973), chloride became a strong contender (Schnermann et
al 1976). However during perfusion of tubules with chloride free solutions feedback
responses could still be elicited (Bell et al 1981). One study showed that urea or
mannitol microperfusion can cause decreases in GFR. Some studies suggest that
transmembrane potential may play a role, but the bulk of the evidence still rests
on Na+ and/or delivery.
The mediator which links the macula densa to the glomerulus has also been
a contentious issue. The juxtaglomerular apparatus renin content is directly
related to the NaC1 delivery to the distal tubule, however renin secretion rate is
not related to the distal tubular NaCl concentration (Wright and Briggs 1979).
Atleast one important mechanism regulating renin release operates through
some type of macula densa feedback mechanism. Since the release of renin leads
to the formation of angiotensin II, some investigators have attempted to integrate
the feedback mechanism for the control of GFR with the feedback mechanism for
the control of renin release.
Burghardt and his associates (1982) have proposed that since the endothelial
cells of the glomerular vasculature contain angiotensin converting enzyme, the
release of renin in response to increased delivery of NaC1 would result in the
subsequent local formation of angiotensin II.
Another approach has revealed that the renin concentration in blood taken
from efferent arterioles was lower than in the blood from the renal artery or renal
vein. It was suggested that renin was released into the tissues where it may act
directly on the vascular elements.
Most of the studies on the feedback phenomena support angiotensin II as
the mediating agent. Those studies which don't support angiotensin II were
Literature Review Page 18
only concerned with changes in vasoconstriction and have not allowed for the
glomerular angiotensin II receptors which alter the glomerular permeability.
Nervous Activity and GFR
In normal man and dogs the renal nerves have little influence on the GFR.
Artificial stimulation of the renal nerves produces substantial decreases in GFR
and renal blood flow, with an increase in filtration fraction, indicating partici-
pation of efferent arteriolar constriction. After maintained stimulation for 2-4
days both the GFR and the renal blood flow returned to normal (DiBona 1977).
Sympathetic stimulation using adrenalin produces constriction of the efferent ar-
terioles, with larger amounts causing constriction of both afferent and efferent
vessels.
Wise and Ganong (1972) stimulated 15 points in the medulla oblongata of
dogs with one innervated and one denervated kidney. A substantial decrease in
GFR was noted only in the innervated kidney.
The In,trarenal Distribution of GFR
It is well known that the kidney is not a population of homogeneous nephrons,
but rather consists of various subgroups of nephrons depending on species.
Most of the data obtained on SNGFR is applicable specifically to the su-
perficial cortical nephrons and need not necessarily relate to the whole kidney
population.
It has been demonstrated in both rats and dogs that SNGFR of the outer
cortical nephrons is lower than the inner cortical nephrons (Lameire et al 1977).
Reddy et al (1981) using radioactive microspheres have shown that the outer
cortex of the sheep kidney has a substantially higher blood flow than the inner
cortex, although this difference was attributed to the size and density of glomeruli
in these two regions.
Early work cited by Lameire et al (1977) suggested that a true redistribution
of SNGFR in response to high levels of dietary salt occurs, such that the super-
ficial SNGFR increase and the deeper nephrons decrease. However later studies
Literature Review Page 19
have shown that the redistribution is simply a proportionately greater increase
in superficial SNGFR compared to juxtamedullary SNGFR. Conversely sodium
restriction has the opposite effect.
Proximal Tubule
The proximal tubule may be divided into two segments; a convoluted portion
and a straight portion (pars recta).
The superficial nephrons have longer pars recta and shorter convoluted por-
tions than the deep nephrons (Jacobson and Seldin 1977). Tubular cell mor-
phology also changes along the proximal tubule, such that it may be further
subdivided on cell size, staining characteristics, brush border depth and organelle
diversity (Maunsbach 1964, Maunsbach 1966, Tisher et al 1969).
Because of their greater accessibility the superficial proximal convolutions
have been studied more than the pars recta and/or juxtamedullary nephrons.
The proximal tubules normally reabsorb about 50-60% of the glomerular
filtrate, with the convoluted portions having a much greater net volume reab-
sorption than the pars recta (Schafer et al 1974, Kawamura et al 1975).
The tubular epithelia consists of a simple cuboidal epithelium with an apical
brush border of microvilli. The cells in the pars convoluta interdigitate extensively
whereas the cells in the pars recta interdigitate much less (Foote and Grafilin 1942,
Maunsbach 1973).
The proximal tubular epithelium has a very low electrical resistance and its
permeability to Na+ , K+ and Cl - is much higher than that of the peritubular
cell membranes. The major determinants of the epithelial permeability are the
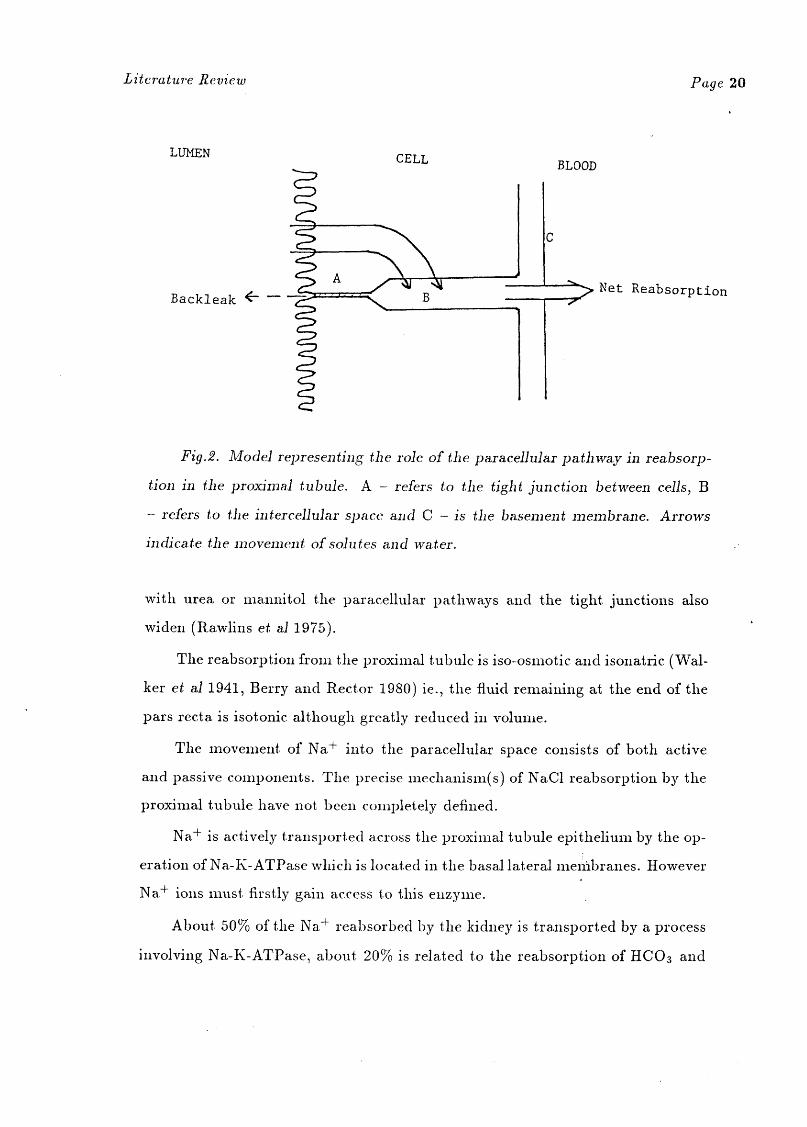
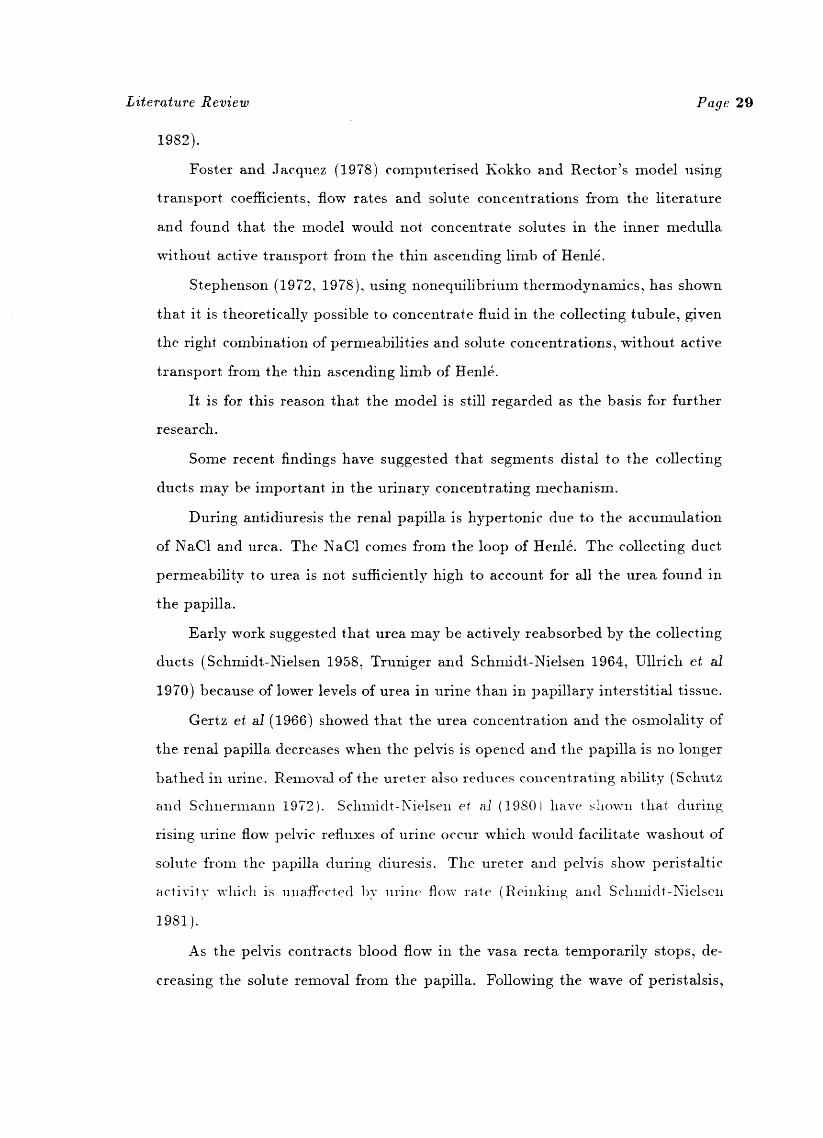
paracellular pathways (Fromter et al 1971); see Fig.2.
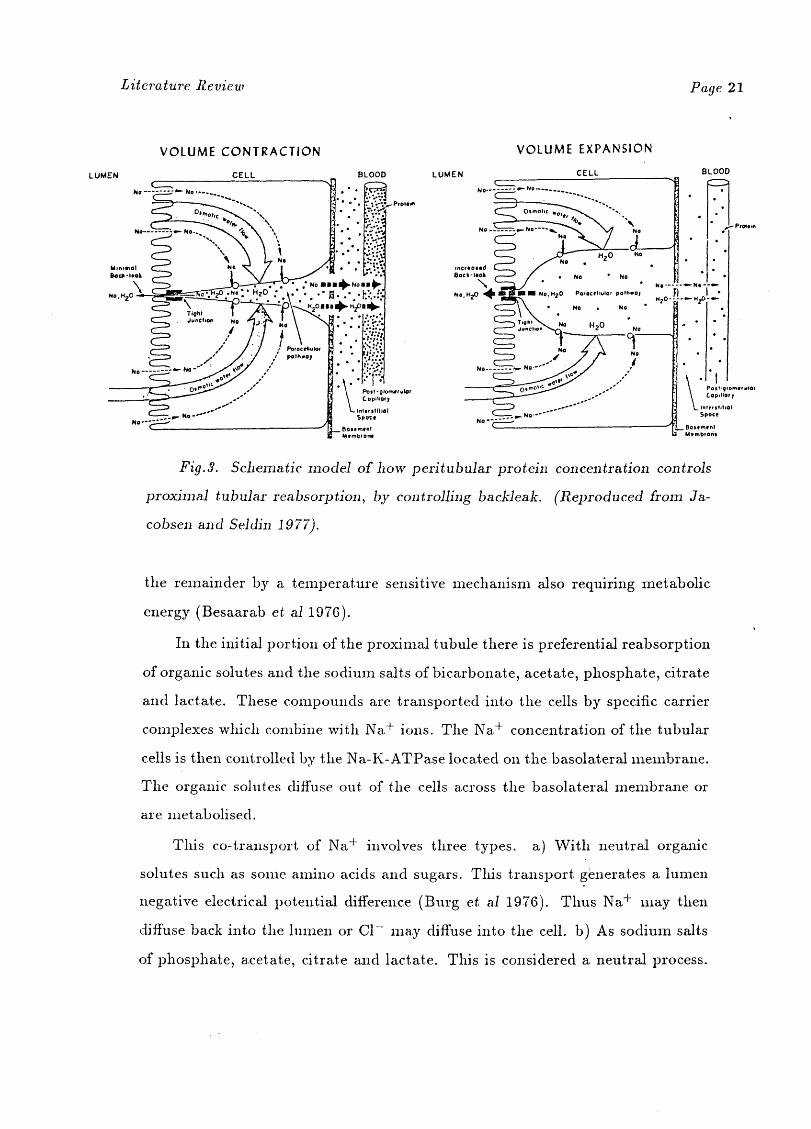
Procedures which alter the ECV generally alter the permeability of the prox-
imal tubule by changing the extent of the paracellular movement of ions. This is
shown in Fig.3.
During ECV expansion the paracellular space is dilated and the tight junc-
tions widened (Bentzel 1972). When the tubular lumen is made hyperosmotic
Literature Review Page 20
LUMEN CELL BLOOD
� Net ReabsorptionBackleak ‹-
Fig.2. Model representing the role of the paracellular pathway in reabsorp-
tion in the proximal tubule. A — refers to the tight junction between cells, B
— refers to the intercellular space and C — is the basement membrane. Arrows
indicate the movement of solutes and water.
with urea or niannitol the paracellular pathways and the tight junctions also
widen (Rawlins et al 1975).
The reabsorption from the proximal tubule is iso-osmotic and isonatric (Wal-
ker et al 1941, Berry and Rector 1980) ie., the fluid remaining at the end of the
pars recta is isotonic although greatly reduced in volume.
The movement of Na+ into the paracellular space consists of both active
and passive components. The precise mechanism(s) of NaC1 reabsorption by the
proximal tubule have not been completely defined.
Na+ is actively transported across the proximal tubule epithelium by the op-
eration of Na-K-ATPase which is located in the basal lateral membranes. However
Na+ ions must firstly gain access to this enzyme.
About 50% of the Na + reabsorbed by the kidney is transported by a process
involving Na-K-ATPase, about 20% is related to the reabsorption of HCO 3 and
Literature Review Page 21
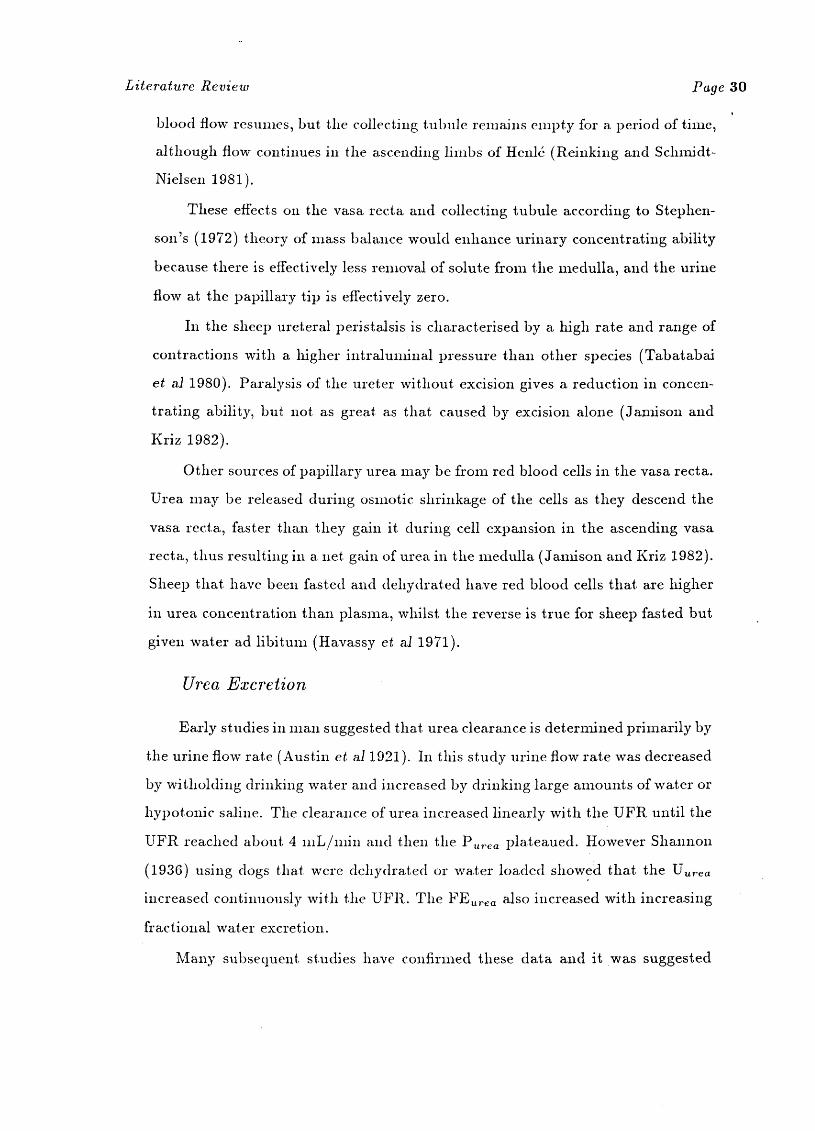
VOLUME CONTRACTION VOLUME EXPANSION
Fig.3. Schematic model of how peritubular protein concentration controls
proximal tubular reabsorption, by controlling backleak. (Reproduced from Ja-
cobsen and Seldin 1977).
the remainder by a temperature sensitive mechanism also requiring metabolic
energy (Besaarab et al 1976).
In the initial portion of the proximal tubule there is preferential reabsorption
of organic solutes and the sodium salts of bicarbonate, acetate, phosphate, citrate
and lactate. These compounds are transported into the cells by specific carrier
complexes which combine with Na+ ions. The Na+ concentration of the tubular
cells is then controlled by the Na-K-ATPase located on the basolateral membrane.
The organic solutes diffuse out of the cells across the basolateral membrane or
are metabolised.
This co-transport of Na+ involves three types. a) With neutral organic
solutes such as some amino acids and sugars. This transport generates a lumen
negative electrical potential difference (Burg et al 1976). Thus Na + may then
diffuse back into the lumen or Cl — may diffuse into the cell. b) As sodium salts
of phosphate, acetate, citrate and lactate. This is considered a neutral process.
Literature Review Page 22
c) The Na+ -H+ antiport. A direct Na 4 -11 4 ion exchange occurs across the brush
border (Murer et al 1976).
The active absorption of organic solutes, including amino acids and sugars,
from the early proximal tubule renders the later sections of this tubule with a
higher concentration of NaC1 than plasma.
In this segment Na+ is absorbed passively across the luminal membrane and
then pumped out through the basolateral membrane by Na-K-ATPase (Kawa-
mura et a/ 1975).
Rector et al (1966) proposed that passive reabsorption of NaC1 occurs in
the rat kidney and subsequent work has shown that about 1/3 of the Na + reab-
sorption is passive, probably of a diffusive nature via the paracellular pathway
(Andreoli et al 1979).
Descending Loop of Henle
The pars recta gradually becomes the thin descending limb of Henle at the
junction of the inner and outer stripe of the outer medulla.
The ultrastructure of the thin limbs of Henle differ markedly from other
segments. The cells are thin and virtually devoid of mitochondria (Jamison and
Kriz 1982).
Short loop epithelia show cellular interdigitation and very shallow intercellu-
lar occluding junctions. Long loops in the outer medulla have a similar epithelium
to the short loops except for the presence of microvilli. In the inner medulla the
long loops exhibit a transition epithelia with no interdigitation and with intercel-
lular tight junctions with long apical-basal lengths (Schwartz and Venkatachalam
1974).
The functional significance of these differences is unknown (Jamison and Kriz
1982).
Not all segments of the descending limb of Henle have been studied, but those
which have are permeable to water and virtually impermeable to Na + and urea
(Kokko 1970). It has been suggested that the permeability to water is pressure
Literature Review Page 23
sensitive (Stoner and Roch-Ramel 1979). However in their study, perfusion reser-
voir height and not luminal pressure was measured. The movement of solutes out
of the descending thin limb is passive and the epithelia appears to be incapable
of active transport.
Ascending Thin Limb of Henle's Loop
The diameters of the ascending thin limb are larger than those of the de-
scending thin limb (Koepsell et al 1972). The epithelium is characterised by very
flat but strikingly interdigitating cells (Schwartz et al 1979, Schiller et al 1980).
The paracellular pathway consists of shallow tight junctions and wide intercel-
lular spaces. There are a few scattered microvilli and as in the descending thin
limb there are few mitochondria. Evidence for active transport in the ascending
thin limb is lacking.
One of the most important questions regarding the role of the ascending
thin limb is whether it actively transports Na -/- and/or Cr. . All attempts to
show active transport from this segment have failed (Kokko 1982).
This segment is impermeable to water (Imai and Kokko 1974, Imai 1977),
highly permeable to Na+ and Cl - and moderately permeable to urea (Imai and
Kokko 1974). Na and urea are transported across this segment by simple diffusion.
However Cl - appears to be transported by two passive mechanisms : simple
diffusion and carrier mediated facilitated diffusion (Imai and Kokko 1976).
Thick Ascending Limb of Henle's Loop
The thick ascending limb of Henle is divided into two parts, cortical and
medullary. The thin ascending limb transforms abruptly into the thick ascending
limb at or near the inner and outer medullary border. The cells are relatively tall
(10p,m) and interdigitating cell processes are filled with large mitochondria. The
cortical thick ascending limb has lower epithelial cells with less interdigitation
and fewer mitochondria (Kaissling and Kriz 1979). There are some microvilli
(Allen and Tisher 1976).
Literature Review Page 24
Fluid that enters the distal tubule is markedly hypoosmotic (Gottschalk and
Mylle 1959). The thick ascending limb's transport characteristics are fundamental
to both the concentration and dilution of urine.
The thick ascending limb of Henle is virtually impermeable to water. The
permeability to Na -4- is relatively high, but decreases cortically. The permeability
to C1 is very low. There is a strong lumen positive potential difference which
is due to the active transport of Cl - from this segment (Burg and Green 1973).
More recent studies have shown that the transport of Cr is electroneutral (see
discussion on sodium excretion, page 37).
There is also much ADH responsive adenyl cyclase in this segment (Imbert
et al 1975). Parathyroid sensitive adenyl cyclase is also present.
Distal Convoluted Tubule
Regardless of the osmolality of the final urine, the fluid entering the distal
tubule is always hypo-osmotic to plasma (Gottschalk and Mylle 1959).
The epithelium consists of heavily interdigitating cells. The apical surface
possesses a dense border of microvilli (Kaissling and Kriz 1979).
The osmotic water permeability of this segment is virtually zero, with or
without ADH (Gross et al 1975), although Ullrich et al (1964) found a four-fold
increase in hydraulic conductivity (Lp) with the addition of ADH in vivo. Because
of this relative impermeability, isotonicity is not regained in some species as the
fluid traverses the tubule (Bennett et al 1967, 1968).
Only about 10% of the filtered load of Na i- is reabsorbed in this segment
(Giebisch and Windhager 1973). The transepithelial voltage becomes progres-
sively lumen negative with distance along the distal convoluted tubule (Wright
1971). This negative voltage drives the passive reabsorption of Cl- in this seg-
ment, although some active Cl- reabsorption probably occurs (Giebisch and
Windhager 1973).
Connecting Tubule
The transition from the distal convoluted tubule to the connecting tubule is
Literature Review Page 25
relatively distinct (Kaissling and Kriz 1979). The tubular cells are simple poly-
gonous structures with no interdigitation. The basal cell membrane has numerous
infoldings through which mitochondria are randomly scattered. There are some
microvilli. There are two cell types; connecting tubule cells and intercalated cells.
In this segment adenyl cyclase is sensitive to parathyroid hormone and iso-
proterenol, whereas the distal convoluted tubule adenyl cyclase is sensitive only
to calcitonin. In both segments the enzyme is insensitive to ADH (Charbardes et
al 1975).
Collecting Tubule
The epithelium shows a gradual change along its course from the cortex
to the papilla. It is composed of two types of cells. The principal cell, with
few microvilli and the intercalated cell with prominent microvilli (Andrews and
Porter 1974, Bulger et al 1975). In the cortex there are about twice as many
principal cells as intercalated cells. In the outer medulla the proportion of these
two cells is about the same, whilst in the inner medulla only principal cells exist
(Kaissling and Kriz 1979). Both of these cells are simple polygonous structures
which show no interdigitation. The tight junctions are deep and impermeable to
lanthanum, except in the inner medulla (Tisher and Yarger 1973).
The principal cells are responsive to ADH (Jamison and Kriz 1982). When
ADH is present, with considerable osmotic water flow, the epithelial cells swell
and bulge into the lumen and the intercellular spaces become markedly widened
(Ganote et al 1968, Grantham et al 1969).
The Renal Pelvis
For many years the pelvis has been regarded merely as an expanded upper
end of the ureter. However Gertz et a/ (1966) showed that the pelvis certainly
has a physiological role atleast in urea excretion.
The renal pelvis of the sheep is characterised by extensions or fornices that
penetrate the outer zone of the outer medulla (Pfeiffer 1968). The pelvic epithe-
lium therefore covers sections of the kidney from the cortex to the medulla.
Literature Review Page 26
This epithelium is characterised by a transition from that of the papillary
collecting duct to that of the stratified squamous epithelium of the ureter. The
epithelium of the pelvis covering the renal parenchyma is 3-4 cell layers thick
and becomes thinner cortically until it becomes a single cell thick. The number
of microvillous lining cells is greater in the inner and outer stripe regions of the
outer medulla. The inner medulla is entirely covered with this cell type (Verani
and Bulger 1982). The presence of microvilli on an epithelium generally suggests
some absorptive function.
Ureter and Bladder
Although generally considered just as urinary conduits, with no physiological
function other than an aqueduct and storage role, the ureters and bladder have
been shown to have some absorptive function.
Levinsky and Berliner (1959) showed that the ureter has some water per-
meability that is not stimulated by ADH. Facilitated diffusion of urea has also
been demonstrated by the ureteral epithelium of sheep (Carruthers et al 1980).
The ureters probably play their major role in absorptive function by causing back
flushing of urine (Reinking and Schmidt-Nielsen 1981) resulting from their inher-
ent peristaltic activity. This peristaltic activity appearsto be particularly active
in sheep (Tabatabai et al 1980). The absorptive function of the bladder of sheep
has been studied by McIntyre and Williams (1969). They found that the bladder
is unlikely to play a physiological role in urea, water or Na homeostasis. However
Shukla and Tripathi (1978) have shown that the permeability of the bladder of
goats to water, urea and glucose is relatively great.
The Renal Concentrating Mechanism
The mechanism whereby urine which is greatly hypertonic to plasma is pro-
duced has been the subject of much research and a comprehensive monograph on
this subject has recently appeared (Jamison and Kriz 1982).
It has long been known that the proportion of the renal medulla compared to
other sections of the kidney is directly related to the concentrating ability of the
Literature Review Page 27
kidney. Thus there is a good correlation between relative medullary thickness and
the maximum urinary osmolality obtainable in a variety of mammals (Schmidt-
Nielsen and Odell 1961). A more recent index, relative medullary area, which
takes into consideration the relative area occupied by the medulla in a mid sagittal
section of the kidney, appears to give a better correlation with maximum urinary
osmolality (Brownfield and Wunder 1976).
Both of these indices are to some extent an index of the relative length and
number of loops of Henle. Early observations by Kuhn and his associates (Kuhn
and Ryffel 1942, Wirz et al 1951) led to the association of the countercurrent
arrangement of the renal tubules in the medulla and the renal concentrating
process.
The active reabsorption of NaC1 from the water impermeable ascending limb
of Henle was thought to create an osmotic gradient which is multiplied by coun-
tercurrent flow. However the fact that the ascending thin limbs of Henle possess
virtually no mitochondria (Schiller et al 1980) would preclude this segment from
active reabsorption.
Because of this problem, Kokko and Rector (1972) proposed a concentrating
mechanism which allows countercurrent multiplication without active transport
in the inner medullary loop of Henle. This study has remained as the basis
for most subsequent modelling attempts and to date has not been substantially
altered.
The Kokko and Rector Model
The key to this model is that the active reabsorption of Cl - by the thick
ascending limb of Nellie provides all the energy to drive the countercurrent mul-
tiplier. This active reabsorption of Cl - and passive reabsorption of Na + (now
thought to be Na+ K+ 2C1- cotransport, see section on sodium excretion, page
37) raises the interstitial salt concentration of the outer medulla.
This hypertonic interstitium abstracts water from the connecting tubule and
the cortical and outer medullary collecting tubules in the presence of ADH. This
Literature Review Page 28
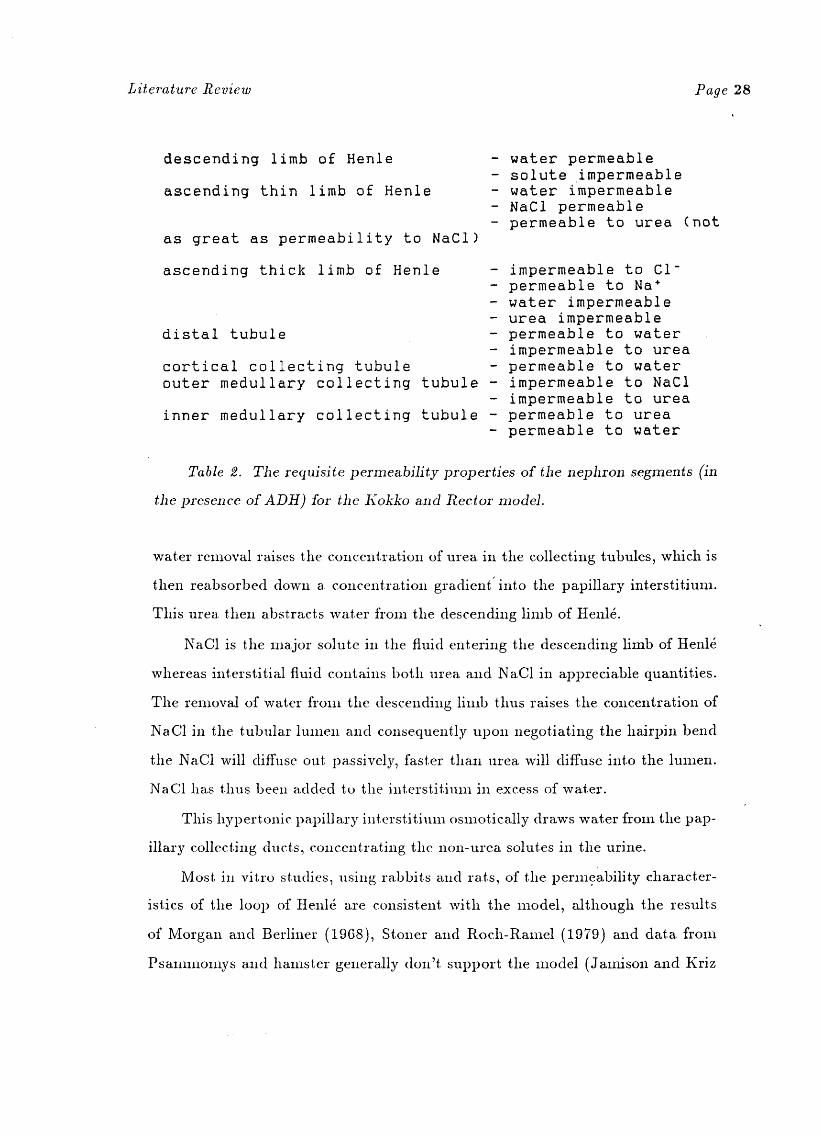
descending limb of Henle
ascending thin limb of Henle
as great as permeability to NaC1)
- water permeable- solute impermeable- water impermeable- NaC1 permeable- permeable to urea (not
inner medullary collecting
- impermeable to C1-- permeable to Na*- water impermeable- urea impermeable- permeable to water- impermeable to urea- permeable to water- impermeable to NaC1- impermeable to urea
tubule - permeable to urea- permeable to water
ascending thick limb of Henle
distal tubule
cortical collecting tubuleouter medullary collecting tubule
Table 2. The requisite permeability properties of the nephron segments (in
the presence of ADH) for the Kokko and Rector model.
water removal raises the concentration of urea in the collecting tubules, which is
then reabsorbed down a concentration gradient ' into the papillary interstitium.
This urea then abstracts water from the descending limb of Henle.
NaC1 is the major solute in the fluid entering the descending limb of Henle
whereas interstitial fluid contains both urea and NaC1 in appreciable quantities.
The removal of water from the descending limb thus raises the concentration of
NaC1 in the tubular lumen and consequently upon negotiating the hairpin bend
the NaC1 will diffuse out passively, faster than urea will diffuse into the lumen.
NaC1 has thus been added to the interstitium in excess of water.
This hypertonic papillary interstitium osmotically draws water from the pap-
illary collecting ducts, concentrating the non-urea solutes in the urine.
Most in vitro studies, using rabbits and rats, of the permeability character-
istics of the loop of Henle are consistent with the model, although the results
of Morgan and Berliner (1968), Stoner and Roch-Ramel (1979) and data from
Psammomys and hamster generally don't support the model (Jamison and Kriz
Literature Review Page 29
1982).
Foster and Jacquez (1978) computerised Kokko and Rector's model using
transport coefficients, flow rates and solute concentrations from the literature
and found that the model would not concentrate solutes in the inner medulla
without active transport from the thin ascending limb of Henle.
Stephenson (1972, 1978), using nonequilibrium thermodynamics, has shown
that it is theoretically possible to concentrate fluid in the collecting tubule, given
the right combination of permeabilities and solute concentrations, without active
transport from the thin ascending limb of Henle.
It is for this reason that the model is still regarded as the basis for further
research.
Some recent findings have suggested that segments distal to the collecting
ducts may be important in the urinary concentrating mechanism.
During antidiuresis the renal papilla is hypertonic due to the accumulation
of NaC1 and urea. The NaC1 comes from the loop of Henle. The collecting duct
permeability to urea is not sufficiently high to account for all the urea found in
the papilla.
Early work suggested that urea may be actively reabsorbed by the collecting
ducts (Schmidt-Nielsen 1958, Truniger and Schmidt-Nielsen 1964, Ullrich et al
1970) because of lower levels of urea in urine than in papillary interstitial tissue.
Gertz et al (1966) showed that the urea concentration and the osmolality of
the renal papilla decreases when the pelvis is opened and the papilla is no longer
bathed in urine. Removal of the ureter also reduces concentrating ability (Schutz
and Schuermann 1972). Schmidt-Nielsen et a.1 (1980) have shown that during
rising urine flow pelvic refluxes of urine occur which would facilitate washout of
solute from the papilla during diuresis. The ureter and pelvis show peristaltic
activity which is unaffected by urine flow rate (Reinking and Schmidt-Nielsen
1981).
As the pelvis contracts blood flow in the vasa recta temporarily stops, de-
creasing the solute removal from the papilla. Following the wave of peristalsis,
Literature Review Page 30
blood flow resumes, but the collecting tubule remains empty for a period of time,
although flow continues in the ascending limbs of Henle (Reinking and Schmidt-
Nielsen 1981).
These effects on the vasa recta and collecting tubule according to Stephen-
son's (1972) theory of mass balance would enhance urinary concentrating ability
because there is effectively less removal of solute from the medulla, and the urine
flow at the papillary tip is effectively zero.
In the sheep ureteral peristalsis is characterised by a high rate and range of
contractions with a higher intraluminal pressure than other species (Tabatabai
et al 1980). Paralysis of the ureter without excision gives a reduction in concen-
trating ability, but not as great as that caused by excision alone (Jamison and
Kriz 1982).
Other sources of papillary urea may be from red blood cells in the vasa recta.
Urea may be released during osmotic shrinkage of the cells as they descend the
vasa recta, faster than they gain it during cell expansion in the ascending vasa
recta, thus resulting in a net gain of urea in the medulla (Jamison and Kriz 1982).
Sheep that have been fasted and dehydrated have red blood cells that are higher
in urea concentration than plasma, whilst the reverse is true for sheep fasted but
given water ad libitum (Havassy et al 1971).
Urea Excretion
Early studies in man suggested that urea clearance is determined primarily by
the urine flow rate (Austin et al 1921). In this study urine flow rate was decreased
by witholding drinking water and increased by drinking large amounts of water or
hypotonic saline. The clearance of urea, increased linearly with the UFR until the
UFR reached about 4 mL/min and then the P„,,, a plateaued. However Shannon
(1936) using dogs that were dehydrated or water loaded showed that the Uurea
increased continuously with the UFR. The FE urea also increased with increasing
fractional water excretion.
Many subsequent studies have confirmed these data and it was suggested
Literature Review Page 31
that urea was thus reabsorbed by passive means only, even when Purea concen-
tration was very high (Mudge et al 1949). Shannon's data were for animals in a
steady state of hydration. He found that when UFR was rising after oral water
loading there was a large increase in FEurea which he termed `exhaltation'. This
phenomenon is caused by the rapid washout of medullary interstitial urea (Ullrich
and Jarausch 1956, Atherton et al 1968). Conversely it has been shown that dur-
ing falling urine flow rates a sudden decrease in FEurea occurs called 'abatement'
(Schmidt-Nielsen et al 1958).
These early experiments led investigators to believe that urea excretion was
simply the net result of glomerular filtration and passive back diffusion of a por-
tion of this filtered urea.
However Read (1925) found extremely low levels of urea in pregnant camel
urine and many years later Schmidt-Nielsen and her associates demonstrated that
several mammalian species, including ruminants, were able to alter urea excretion
independent of changes in GFR or UFR in response to changes in dietary protein
intake (Schmidt-Nielsen 1958). This finding indicated that some control of urea
excretion must reside within the tubules. Later studies demonstrated that several
mammalian species are capable of achieving a concentration of urea in medullary
tissue that is higher than the final urine (Schmidt-Nielsen and Odell 1959, Bray
and Preston 1961, Truniger and Schmidt-Nielsen 1964, Goldberg et al 1967). This
led to the speculation that urea is actively reabsorbed at some site in the kidney
tubules (Schmidt-Nielsen 1958).
Many studies published since the work of Schmidt-Nielsen (1958) have lent
support to the theory of active urea reabsorption.
Firstly it was established that in amphibia active urea secretion occurs (Mar-
shall and Crane 1925, Marshall 1932, Forster 1954, Schmidt-Nielsen and Forster
1954, Lore and Lifson 1958, Schmidt-Nielsen and Shranger 1963) primarily in
the proximal and distal tubules (Long 1970). In elasmobranchs, active reabsorp-
tion of urea occurs (Smith 1936, Schmidt-Nielsen and Rabinowitz 1964, Forster
1970) however the countercurrent arrangement of the proximal and distal tubules
Literature Review Page 32
in elasmobranchs may possibly explain the apparent uphill transport of urea by
passive diffusion (Mudge et al 1973).
Using micropuncture it was demonstrated that in protein deprived rats, the
urea concentration at a given point in the collecting ducts is lower than at the
same level in the vasa recta (Lassiter et al 1966, Ullrich et al 1967). The vasa
recta concentration was assumed to reflect the concentration in the adjacent in-
terstitium.
Renal cortical tissue has also been found to contain a higher urea concen-
tration than the cortical tubular fluid (Roch-Ramel et al 1967, 1968). However
this high urea concentration has been attributed to sequestration of urea in the
cortical tissue, hence rendering it osmotically inactive, rather than accumulation
due to active transport (Roch-Ramel et al 1970).
At similar urine flow rates, the proportion of injected urea that is excreted
is much lower for rats fed low protein diets than those fed normal or high protein
diets (Danielson et al 1970). A similar effect has been shown in sheep (Havassy
et al 1974).
The uphill transport of urea in the dog kidney is inhibited by the inhibition
of glycolysis with iodoacetate, and shows competitive inhibition with acetamide
(Goldberg et al 1967), a urea analogue which can also be concentrated in the
papillary tissue above the urine concentration (Truniger and Schmidt-Nielsen
1964).
A unique pattern of medullary urea accumulation was observed by both
Schmidt-Nielsen and Odell (1959) and Rabinowitz et a/ (1973) in hydropenic
sheep fed low protein diets. The pattern consisted of an increasing intrarenal
tissue concentration from the cortex to the outer portion of the inner medulla,
where the highest urea concentration was observed. The concentration was sub-
stantially higher than that of the final urine. In animals fed high protein diets
the renal tissue concentration increased linearly from cortex toinner medulla.
Etha,crynic acid diuresis completely abolished these tissue gradients, sug-
gesting that active urea reabsorption does not exist when water is not being
Literature Review Page 33
reabsorbed.
No tubular maximum for urea (a necessary condition for proof of active
transport), has been achieved, despite tubular fluid concentrations of urea of up
to 800 mmol/L (Mudge et al 1949, Schmidt-Nielsen 1970).
Active tubular secretion of urea has been demonstrated in the pars recta of
the rabbit nephron (Kawamura and Kokko 1976) and interestingly it has been
suggested that a genetic defect in active tubular urea secretion would explain
the high plasma urea values observed in patients with otherwise normal kidney
function and plasma creatinine (Hsu et al 1978, Hays 1978). A recent study in
sheep has shown fractional urea clearances of greater than 100 % in a large number
of animals, which means that urea excretion cannot be explained by glomerular
filtration alone and that secretion of urea must have occurred (Nawaz and Shah
1984).
The transport of urea across the erythrocyte membrane by facilitated diffu-
sion appears in evolutionary terms to have developed in relation to the adoption
of a terrestrial habitat (Kaplan et al 1974).
The Effect of Antidiuretic Hormone (ADH)
Antidiuretic hormone apart from its well known effects on the permeability
of membranes to water, also increases the permeability of some epithelia to urea
(Andersen and Ussing 1957, Maffly et al 1960, Leaf and Hays 1962).
In 1972 Franki et al reported that ADH opens independent channels for
water and urea in the toad bladder. The ADH sensitive urea transport channels
have since been shown to have a cylindrical radius of 3.5-3.8 Aand are capable
of hydrogen bonding with the molecular species traversing them (Petrucelli and
Eggena 1982).
The only tubular segment in mammals which appears to show a change in
urea permeability with the addition of ADH is the medullary collecting duct
(Morgan et al 1968, Morgan and Berliner 1968). However these results have not
been confirmed during microperfusion studies (Grantham 1978). The effects of
Literature Review Page 34
ADH on urea transport are thus considered secondary to its effects on water
transport. Cross et al (196G) found that ADH decreases the clearance of urea
in diuretic sheep without altering the glomerular filtration rate. The largest
decreases in urea. clearance were seen in those experiments in which there was no
decrease in urine flow rate, suggesting that ADH increases the permeability of
the tubular cell membrane to urea in this species.
Antidiuretic hormone is often infused as a urine flow rate stabilizing agent
to reduce the phenomena of exhaltation and abatement, mentioned earlier, in
renal studies (Ergene and Pickering 1978a, 1978b). This infusion of ADH may
complicate the determination of parameters of urea excretion.
Urea as a Diuretic
Urea has been used widely as a diuretic agent and is now the prescribed ther-
apy for preventing overliydration in the syndrome of inappropriate antidiuretic
hormone secretion (SIADH) (Decaux et a/ 1980).
Urea is classified as an osmotic diuretic, because when its concentration in
glomerular filtrate is sufficiently high it will retard tubular fluid reabsorption, by
virtue of the osmotic pressure it creates in the tubular lumen.
Earlier studies assumed that increased filtered loads of urea resulted in a de-
creased fractional reabsorption of urea from the proximal tubules, hence leaving
a large amount of urea in the tubules to prevent water reabsorption. In 1970
Ka.uker et al using micropuncture techniques, showed that proximal tubular frac-
tional reabsorption of urea increases with increasing filtered load of urea, even
though the UFR was substantially increased. It was therefore concluded that
the osmotic diuretic effect of urea. was located in the distal tubular region as this
segment, is relatively impermeable to urea (Ullrich et al 1970).
It is of interest that during urea diuresis the clearance of free water increases
(Wesson and Anslow 1948, Page and Reem 1952, Zak et al 1954, Maude and
Wesson 1963). This suggests that urea may play a diuretic role, other than that
of an osmotically active non-reabsorba.ble solute.
Literature Review Page 35
Sodium Excretion
Sodium is the most abundant cation in the extracellular fluids. In sheep
under natural feeding conditions the intake, and hence the load of Na presented
to the kidneys can show wide variation.
Na+ is freely filtered at the glomerulus and the bulk of this filtered Na+
is reabsorbed in the proximal tubule and ascending limb of Henle's loop. The
proximal tubule reabsorbs 50-60% of the filtered sodium.
The tubuloglomerular feedback mechanism discussed earlier controls the
GFR according to the amount of Na,C1 reaching the macula densa. However when
there is a spontaneous change in GFR in spite of the feedback mechanism there
will be a difference in the amount of Na + delivered to the proximal tubule. When
this occurs absolute reabsorption from the proximal tubule changes to maintain
a constant proportional reabsorption (Lewy and Windhager 1968, Schnerrman
et al 1968). This phenomenon is known as glomerular-tubular balance and its
mechanism of control has been the subject of much research.
A rise in GFR without, any change in renal plasma flow (increased FF) results
in an increase in peritubular protein concentration which, in turn increases the re-
absorption of Na+ (see Fig.3.). This change in peritubular protein concentration
has been suggested as the mechanism responsible for glomerular-tubular balance
(Brenner and Troy 1971, Brenner et al 1971). However several studies give con-
flicting evidence as to its role in the phenomena (Bartoli et al 1973, Conger et al
1976, Leyssac 1976).
The proximal tubule microvilli appear to be motile and it has been suggested
that increased motility, resulting from an increased GFR stirs the tubular fluid
facilitating permeation by subjecting a. greater amount of the fluid to the surface
of the microvilli and by reducing unstirred layer effects (Trueberg and Rostguard
1969 cited in De Wardener 1978).
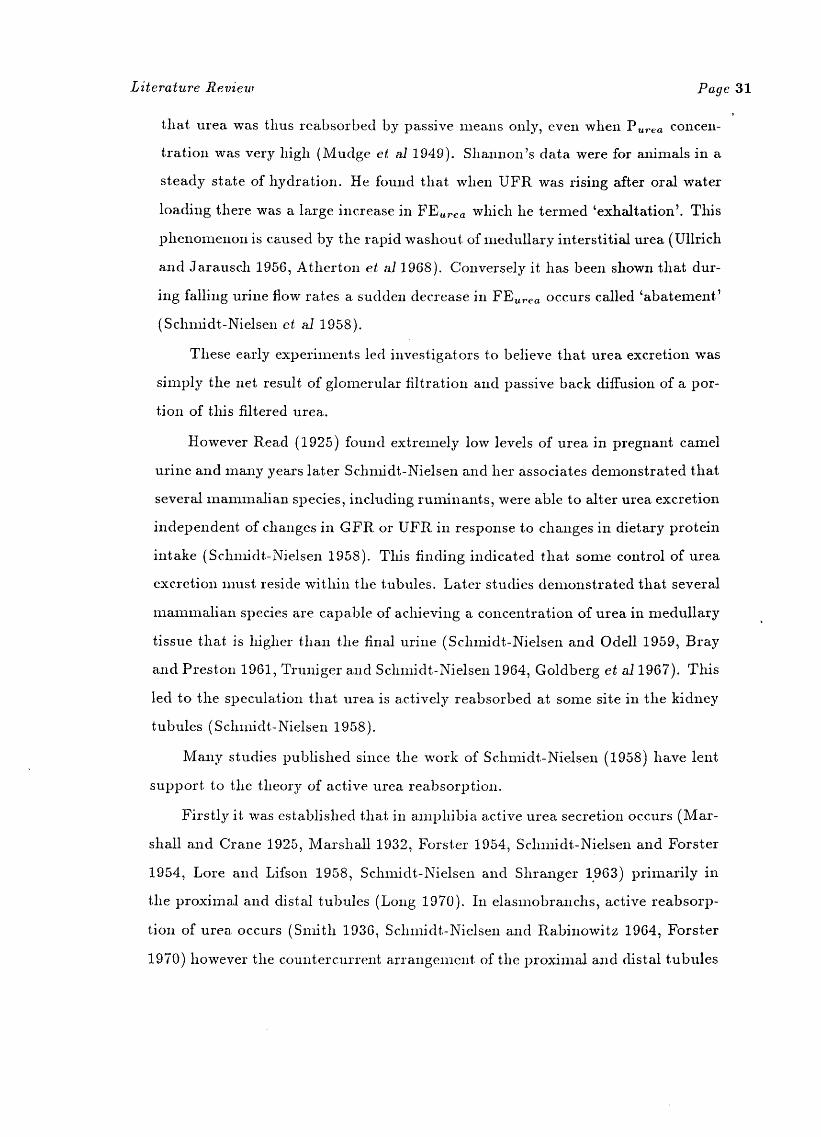
The loop of Henle reabsorbs 15-20% of the filtered NaCl. Early work by Burg
and Green (1973) showed that. Cl - was actively reabsorbed in the thick ascending
limb and that this reabsorption was inhibited by ouabain, an inhibitor of Na-K-
Literature Review Page 36
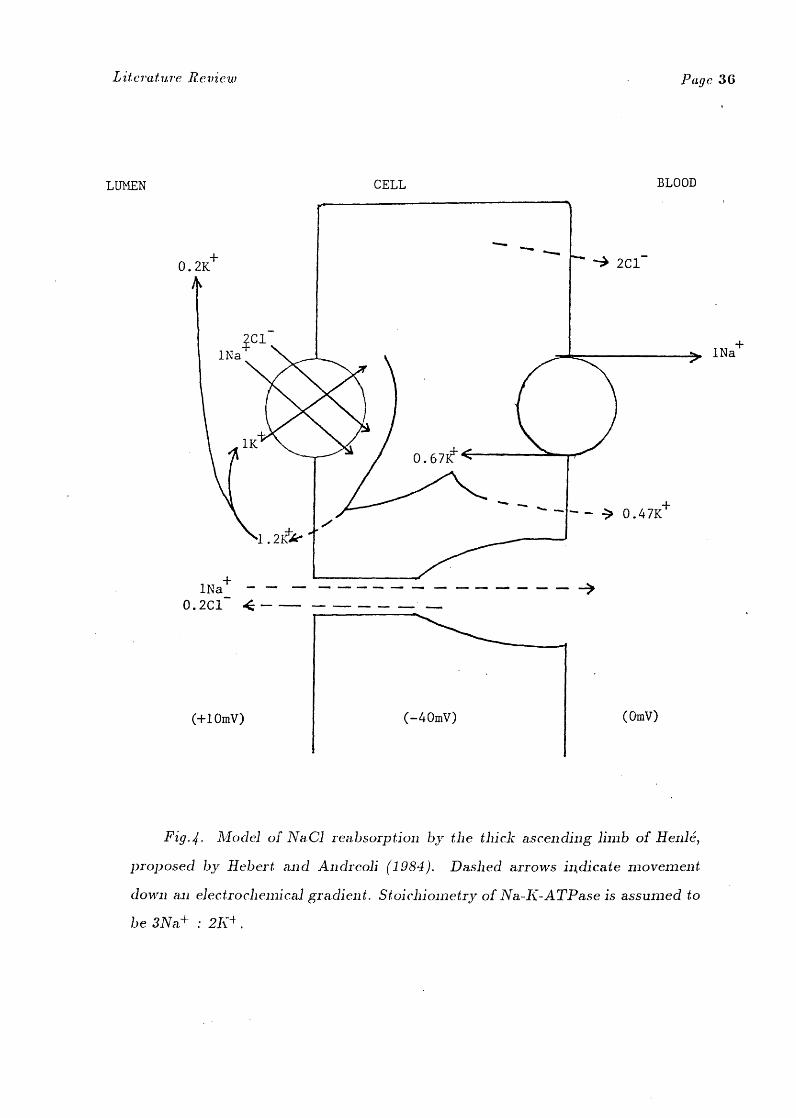
LUMEN CELL BLOOD
2C1-
1Na+
0.2K+
11Na
1K0.67e<
-> 0.47K+
1 .2ek•
1Na+ - —O. 2C1- 4 — ••■■•■■ ••■■■••
vo.
(+10mV) (-40mV) (0mV)
Fig.4. Model of NaC1 reabsorption by the thick ascending limb of Hen16,
proposed by Hebert and Andreoli (1984). Dashed arrows in,dicate movement
down an electrochemical gradient. Stoichiometry of Na-K-ATPase is assumed to
be 3Na+ : 2K4 .
Literature Review Page 37
ATPase. Recent evidence suggests that the reabsorption of C1 by the thick
ascending limb involves a secondary active transport process where luminal Cl+
entry is mediated by an electroneutral (1Na + ,1K+ ,2C11 co-transport mechanism
(Greger 1981, Hebert et al 1981, Hebert and Andreoli 1984). Na+ is then actively
transported out of the tubular cells across the basolateral cell membane by Na-
K-ATPase (see Fig.4.). This produces an electrochemical gradient favouring the
passive removal of from the tubular cell and explains why ouabain inhibits
Cl + reabsorption from this limb (Hebert and Andreoli 1984).
Factors Influencing Na Excretion
Aldosterone
Aldosterone is the major factor regulating Na + excretion in normal animals.
Twenty to sixty minutes after injection of aldosterone Na excretion is reduced and
K excretion enhanced. The hormone exerts its major effects in the distal tubule
and collecting ducts, although it does increase the epithelial leak permeability of
the proximal tubule (Gutsche and Hegal 1980).
Aldosterone is believed to induce new ribonucleic acid formation followed by
the synthesis of enzymes which mediate the action of the hormone (Edelman and
Fanestil 1970). These enzymes have not yet been isolated (Suzuki 1981).
Aldosterone also restores the depressed Na-K-ATPase activity of adrenalec-
tomised rabbits (Horster et al 1980) although the effect is not thought to be the
mechanism of salt retention caused by the hormone (Schwartz et al 1975).
The rate of Na reabsorption by the cortical collecting duct is related to the
potential difference across the segment. A more negative potential is observed
in animals fed low Na, high K diets (Frindt and Burg 1972). Both the potential
difference and the Na reabsorption were correlated with the concentration of
aldosterone present (Gross et al 1975, Schwartz and Burg 1978).
The medullary collecting tubule appears to reabsorb Na by passive mecha-
nisms only (Stokes 1981).
Literature Review Page 38
Prostaglandins
Chronic salt loading decreases and salt restriction increases PGE2 excretion
(Scherer et al 1977, Stahl et al 1979).
The effects of prostaglandins on sodium homeostasis are generally regarded
as being due to modulation of other effectors such as GFR, ADH, and renin
release, rather than a direct effect on Na transport in the tubules. Nevertheless
inhibition of cyclooxygenase with drugs such as indomethacin leads to substantial
Na retention (Weber and Siess 1982).
Antidiuretic Hormone
A large amount of work with toad bladders has shown that ADH is consid-
ered to have a natriferic effect. ADH stimulates Na transport by a primary cyclic
AMP-dependent increase in the permeability of the apical epithelial membrane
(deSousa and Grosso 1981), although a direct effect on the active Na pump has
been shown in the toad bladder (Finn 1971). These effects are noticeable in the
cortical collecting tubule and connecting tubule segments of mammals, although
the effect is transient and only elicited at high doses of ADH. ADH increases NaC1
efflux from the thick ascending limb of Henle (Hall and Varney 1980, Sasaki and
Imai 1980) which aids in the urinary concentrating mechanism. Pharmacolog-
ical doses of ADH given to dehydrated sheep also increase the excretion of Na
(Kinne et al 1961), however this effect is thought to be due to changes in renal
haemodynamics (Yesberg et al 1979).
ADH appears not to play a major role in the control of Na excretion. In fact
Grantham (1974) concluded by stating 'it would appear, with due apology to the
scores of fallen toads, that vasopressin in physiological concentrations probably
has little to do with the regulation of sodium excretion by the mammalian kidney'.
Literature Review Page 39
Natriuretic Hormone
Increasing evidence for the existence of two circulating natriuretic factors has
come after much work, mostly by De Wardener's group in London (De Wardener
1982a, De Wardener 1982b, De Wardener and Clarkson 1982).
One of the natriuretic hormones is probably derived from the hypothalamus
(Alaghband-Zadeh et al 1981). This hormone inhibits Na-K-ATPase apparently
in all tissues of the body (Grantham and Edwards 1984). Inhibition of this
enzyme located on the basolateral membranes of the kidney tubules results in the
natriuresis.
The hormone is found in the plasma and urine of salt loaded and ECV
expanded animals including sheep (Sealey et al 1969).
A second natriuretic factor is derived from the granular structures in the
atria of the heart. This factor does not affect Na-K-ATPase but inhibits the
reabsorption of NaC1 and water in the distal nephron (Briggs et al 1982, Son-
nenberg et al 1982). The hormone probably acts on the luminal rather than the
basolateral epithelium of tubular cells (Sonnenberg et al 1982).
Renal Nerves
Stimulation of renal sympathetic nerve activity causes parallel changes in
tubular Na and water reabsorption mediated by adrenergic nerve terminals in
direct contact with tubular epithelial cells particularly in the proximal tubule
(DiBona 1977). The renal nerves also control No, excretion indirectly by their
effects on GFR, ERPF, renin release and various systemic effects.
Hormonal Effects
The kallikrein-kinin system antagonizes the renin-angiotensin system and
thus causes increased Na excretion when renal kallikrein is released (Mills 1982).
Thyroidectomised animals have a. lower excretion of Na primarily because
of lowered Na-K-ATPase activity which can be corrected by thyroid hormone
administration. This is both an adaptive response to a different Na load and to
a direct effect on Na-K-ATPase activity (Edelmen 1975).
Literature Review Page 40
Calcitonin is strongly natriuretic in most animals including sheep (Barlet
1972). The effect is principally located in the proximal tubule and is mediated
via the adenyl cyclase system. It may be related to the sodium linked amino acid
reabsorption as amino acid excretion is also enhanced by calcitonin administration
(Bijvoet, et al 1971).
Insulin enhances Na reabsorption in the ascending limb of Henle by an mi-
. determined mechanism (Defronzo et al 1975) although Na-K-ATPase is probably
involved (Katz and Lindheimer 1977).
Glucagon is natriuretic but the effect is mostly caused by a rise in GFR
although glucagon sensitive adenyl cycla.se has been found in the renal medulla
of man (Mulvehill et al 1976).
Prolactin is antinatriuretic in most species including sheep (Burstyn et al
1972). The effect is located in the proximal tubule and is probably caused by a
widening of the paracellular spaces in the epithelium (Lucci et al 1974).
Oestrogens generally cause Na retention although the mechanisms are un-
clear and inconsistencies across different species exist (Christy and Shaver 1974,
Katz and Lindheimer 1977). During the reproductive cycle of sheep, sharp in-
creases in Na excretion are noticed during oestrus but this effect is mostly ac-
counted for by a reduction in food and water intake during this period (Michell
1981). Oestrogens are not elevated during pregnancy in sheep except just prior
to parturition (Bedford et al 1972).
Progesterone increases Na excretion in man. This effect is caused mostly
by competitive inhibition of aldosterone (Oparil et al 1975). During pregnancy
in the sheep the blood levels of progesterone are only 2-5 times those found in
the non-pregnant animal (Basset et al 1969, Fylling 1970). This level may be
insufficient to act a.s an inhibitor of aldosterone (Wintour et al 1976).
Regulation of Acid-base Balance by the Kidney
The kidneys play a. major role in the regulation of acid-base balance of mam-
orals.
Literature Review Page 41
The HCO 3 - H2 CO 3 buffer system plays a. key role in the maintenance of
acid-base equilibrium in the body fluids, not because of its buffering action, as
the pKa3 at 6.1 is too distant from the body fluid pH, but because of the effective
excretion of bicarbonate by the kidney and CO 2 by the lungs.
Recent studies (Atkinson and Camien 1982, Halperin and Jungas 1983) have
appeared which challenge the traditional view of the role of ammonia excretion
in acid-base homeostasis. A summary of these views is included in the following
discussion, however until further studies confirm these theories, the role of NH3
as a buffer for secreted II+ ions will remain.
CO 2 and H 2 0 are the only end products of the total oxidation of carbohy-
drates and fats. However, as noted by Atkinson and Caniien (1982), oxidation
of any carboxylate anion at physiological pH produces HCO 3 - not CO 2 (see
equation 1.).
CH 3 -(CH2 ),_ 2COO-(n-1)CO2 ETCO 3 -(1)
Similarly at pH 7.4 oxidation of simple amino acids yields HCO 3 - and NH4+
in equimolar quantities (see equation 2.).
NH3
CH 3 -(CH 2 )„_ 3 - CH-000 --> (n-1)CO 2 HCO3 - + NH4 + (2)
At pH 7.4 NH 3 is rapidly protonated to form NH 4 + . The traditional view
that the excretion of NH 4 + is accomplished by the diffusion of NH 3 through the
tubular lumen membrane where it combines with a secreted proton, to form NH4 +
is not, according to Halperin and Jungas (1983), a means of excreting excess H+
ions.
The metabolism of glutamine in the kidney produces NH 4 + and not NH3
such that the excretion of ammonia can be summarised as in Fig.5.
The increased excretion of ammonia, during acidosis is simply a means of
removing the excess nitrogen produced from protein wasting (Haussinger et al
1984).
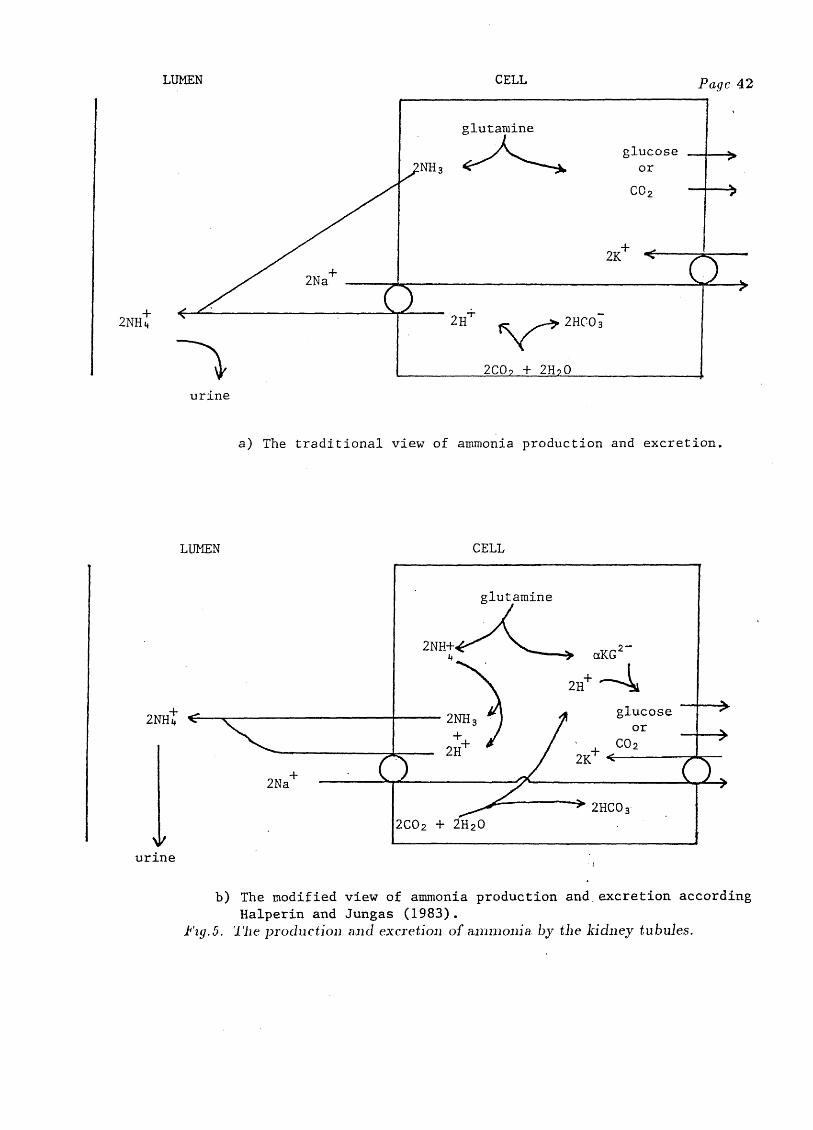
LUMEN CELL Page 42
glutamine
glucoseOr
CO2
2K+
2Na+
2HCO3
urine
a) The traditional view of ammonia production and excretion.
LUMEN CELL
2C0 7 + 2H20
2NH 4 <
glutamine
2NH+4 aKG
2H+
glucose2NH3
or+02
2H
2K+ <C
2Na+
)1` 2HCO32CO2 + 2H20
urine
b) The modified view of ammonia production and excretion accordingHalperin and Jungas (1983).
Pr g.5. The production and excretion of ammonia by the kidney tubules.
Literature Review Page 43
The Renal Handling of Ammonia
Urinary ammonia is derived almost entirely from renal synthesis (Pitts 1973)
in the proximal tubular cells (Good and Burg 1984, Guder and Ross 1984). The
majority of ammonia synthesized is excreted rather than returned to the systemic
blood circulation (Tizianello et a/ 1982).
The traditional view holds that the excretion of ammonia depends largely on
`diffusion trapping', ie. the diffusion of NH 3 through the renal membranes and
its protonation in the acidic environment of the tubular lumen to form NH4+.
The addition of ammonia to the proximal tubular fluid cannot all be ac-
counted for by diffusion trapping as the change in H+ concentration that can
occur in the proximal tubular fluid is atleast an order of magnitude lower than
that which can be achieved for NH 4 + ion concentration (Warnock and Rector
1981, Nagami and Kurokawa 1985).
The brush border of the proximal tubular epithelium contains ammonia
`cleaving' enzymes such as 7-glutamyltransferase (Welbourne and Pass 1982) and
these may produce ammonia from glutamine within the tubules.
NH4 + has an identical ionic radius to K + (Weast and Selby 1966) and hence
the permeability of nephron segments to these two ions are likely to be similar.
For this reason substantial reabsorption of NH 4 + is thought to occur in the thick
ascending limb of Henle, by diffusion down an electrochemical gradient (Good et
al 1984), or alternatively by substitution of NH 4 + for K+ in the Na+-K+-2C1-
transport system (Hebert and Andreoli 1984).
In normal rats, the NH 4 + concentration in the distal tubular fluid was similar
to that of the proximal tubule, despite the absorption of more than half of the
water in the loop of Heide (Sajo et al 1981). There is no loss of ammonia from
the distal tubular fluid in the rat (Hayes et a/ 1964).
There is a very large rise in the NH4 + concentration in' the tubular fluid
between the distal tubule and the final urine, which is due mostly to water ab-
straction from this segment (Hayes et al 1964, Sajo et al 1981).
In acidotic rats there is a large augmentation of NH 4 + secretion in the cortical
Literature Review Page 44
collecting ducts (Sajo et al 1981), whilst in rats fed high protein diets the major
site of ammonium addition is the medullary collecting ducts.
Bicarbonate Reabsorption
Most studies indicate that HCO 3 - reabsorption in the proximal tubule is
mediated by Na+ -H+ exchange rather than by direct reabsorption of HCO3-
(Burg and Green 1977).
H+ originates from the intracellular hydration of CO2 to H2 CO3 which in
turn, dissociates to yield H + and HCO 3 -. The secreted 1-1 + reacts with lumenal
HCO 3 - to yield carbonic acid which then dissociates to form H 2 0 and CO2.
H + + HCO 3H2 CO3 H2 0 4- CO2
The latter reaction is catalysed by the enzyme carbonic anhydrase which is
bound to the lumenal membrane of the proximal tubule (Wistrand and Kinne
1977). The CO 2 diffuses into the proximal tubular cells to start the cycle over
again (see Fig.6.).
Na-K-ATPase located on the basolateral membrane provides the driving force
for the Na+ -H+ exchange.
ECV expansion results in an inhibition of HCO 3 - reabsorption (Purkerson
et al 1969, Kurtzman 1970). The mechanism of this inhibition has not been
resolved (Battle and Kurtzman 1983) but is probably related to natriuretic hor-
mone inhibition of the basolateral membrane Na-K-ATPase which occurs during
ECV expansion (Grantham and Edwards 1984).
Blood pCO 2 is an important factor in determining HCO 3 - reabsorption.
However the pH of the blood is probably the controlling factor as respiratory
and metabolic alkalosis produce a similar depression in HCO 3 - excretion despite
large changes in the blood pCO 2 (Langberg et al 1981).
Acid Excretion
The kidney tubules cannot maintain a H + gradient between lumenal fluid
and blood of more than about 3 pH units, consequently urine pH never falls much
lower than about 4.4.
Literature Review Page 45
LUMEN CELL BLOOD
H 2 0 + CO2---I H + > CO 2 + H20-EL H2CO3 +HCO3
K+
H2CO3
1
ECO 3 + H+
Na+
.
Fig.6. The mechanism of bicarbonate reabsorption in the proximal tubule.
Most of the acid excreted is in a buffered form, either as NH4 + as mentioned
earlier, or as H2PO 4 - . Normally the amount of acid which can be excreted in the
phosphatic form is limited by phosphate excretion The excretion of phosphate
is enhanced during acidosis, which helps provide extra buffer for the excretion of
acid. The sheep normally excretes very little phosphate in the urine, the preferred
route of excretion being via saliva and hence in the faeces (Tomas 1974).
During acidosis in sheep there is a slight increase in renal phosphate excre-
tion (Williams and Pickering 1980, Scott and Buchan 1981). Increased intake of
concentrate diets in sheep also enhances the renal excretion of Pi, probably by
reducing salivary Pi removal together with a phosphaturia of acidosis as these di-
ets tend to produce some degree of acidosis (Godwin and Williams 1982). Sheep
fed roughage diets normally excrete a very alkaline urine (pH 7.9 - 8.4).
Scott and associates have suggested that because ruminants excrete so little
Literature Review Page 46
phosphate in the urine, they rely on NH 3 as a vehicle for eliminating 11 -+ ions
(Scott 1969, Scott 1971, Scott et ad 1971). According to Halperin and Jungas
(1983) (see earlier section), NH4 excretion is not a means of removing H + ions.
However, another chemical buffering mechanism(s) other than ammonia or phos-
phate that could be utilized by sheep kidneys during acidosis is unlikely although
creatinine and hippuric acid may possibly play a small role. Hence the traditional
view of NH 3 as a vehicle for H + ion elimination appears more likely, at least in
sheep.