Embed Size (px)
Citation preview
Review of the Fiscal Year 2017Proposed Budget
Analysis by the Office of the Independent Budget Analyst | Report 16-05
ANDREA TEVLINIndependent Budget Analyst
April 29, 2016

Cover images one and four are of Niki de Saint Phalle’s sculpture, Coming Together, which is located outside of the San Diego Convention Center. Images two and three are from murals located in Chicano Park. Image two, Sueño Serpiente, was designed by Soccoro Gamboa and was painted by Felipe Adame and Roger Lucero in 1978; it was renovated in 1989 by Mario Torero and Mano Lima, and again in 1991 by Felipe Adame and Laurie Manzano. Image three, Luna Del Nuevo Amanecer, was designed and painted by Victor Ochoa and local students.
Table of Contents
Office of the Independent Budget Analyst
April 2016
High Level Review of the Mayor’s
FY 2017 Proposed Budget 1
General Fund Overview 15
Expenditure Overview 15
Revenue Overview 18
Significant Citywide Issues 22
General Fund Reserve 22
Public Liability Fund 24
Workers’ Compensation Fund 25
Long-Term Disability Fund 26
Other Post-Employment Benefits 27
Pension 30
Infrastructure & Financing Issues 32
Performance Measures 38
Climate Action Plan 40
Department Reviews 43
City Attorney 43
City Auditor 45
City Clerk 46
City Comptroller 47
City Council 49
City Treasurer 51
Citywide Program Expenditures 55
Communications 58
Debt Management 60
Department of IT 62
Development Services 69
Economic Development 74
Environmental Services 78
Financial Management 85
Fire-Rescue 86
Human Resources 91
Internal Operations 92
Library 94
Table of Contents
Office of the Independent Budget Analyst
April 2016
Office of the ACOO 98
Office of the Mayor 101
Park & Recreation 102
Performance & Analytics 108
Personnel 111
Planning 113
Police 118
Public Utilities 124
Public Works Department 129
Public Works - Contracting 130
Public Works - E&CP 131
Public Works - General Services 134
Purchasing & Contracting 137
QUALCOMM Stadium 139
Real Estate Assets 141
Risk Management 143
Special Events and Filming 145
Special Promotional Programs 147
Transportation & Storm Water 151
Other Departments 157
Airports
Ethics Commission
Infrastructure/Public Works
Neighborhood Services
Office of the CFO
Office of the COO
Office of Homeland Security
Office of the IBA
PETCO Park
City Agencies 160
High Level Review of the Mayor’s
FY 2017 Proposed Budget
Office of the Independent Budget Analyst
April 2016
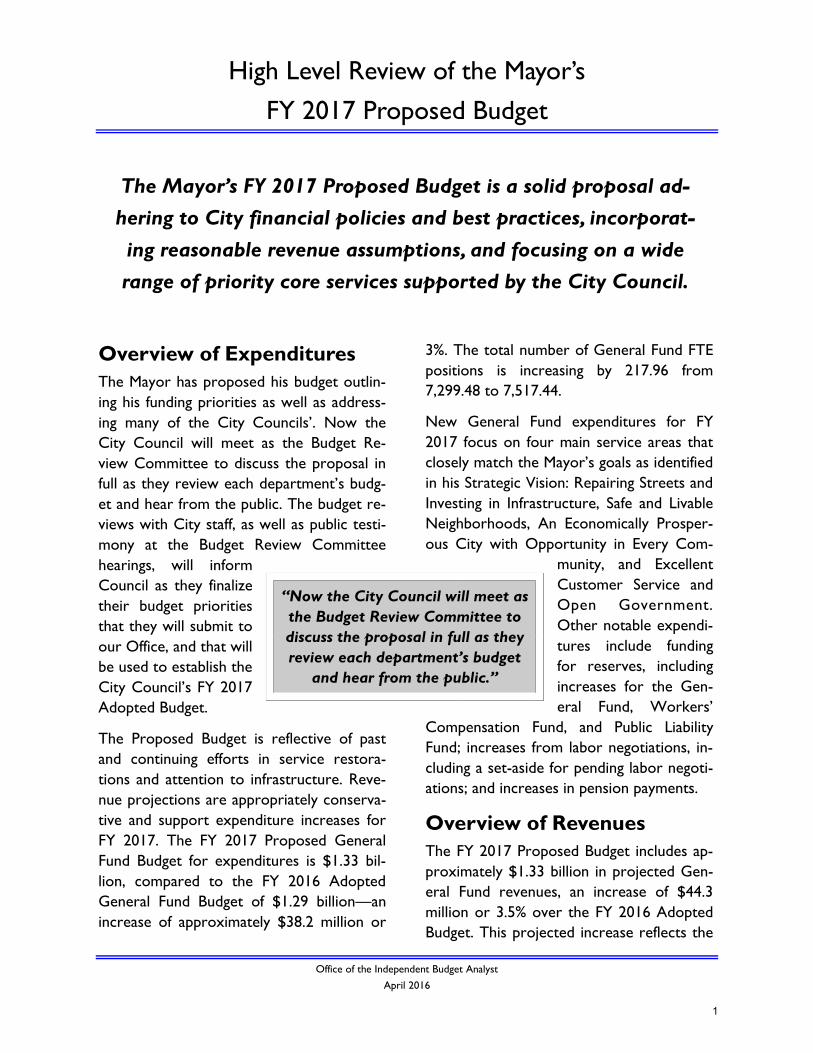
Overview of Expenditures
The Mayor has proposed his budget outlin-
ing his funding priorities as well as address-
ing many of the City Councils’. Now the
City Council will meet as the Budget Re-
view Committee to discuss the proposal in
full as they review each department’s budg-
et and hear from the public. The budget re-
views with City staff, as well as public testi-
mony at the Budget Review Committee
hearings, will inform
Council as they finalize
their budget priorities
that they will submit to
our Office, and that will
be used to establish the
City Council’s FY 2017
Adopted Budget.
The Proposed Budget is reflective of past
and continuing efforts in service restora-
tions and attention to infrastructure. Reve-
nue projections are appropriately conserva-
tive and support expenditure increases for
FY 2017. The FY 2017 Proposed General
Fund Budget for expenditures is $1.33 bil-
lion, compared to the FY 2016 Adopted
General Fund Budget of $1.29 billion—an
increase of approximately $38.2 million or
3%. The total number of General Fund FTE
positions is increasing by 217.96 from
7,299.48 to 7,517.44.
New General Fund expenditures for FY
2017 focus on four main service areas that
closely match the Mayor’s goals as identified
in his Strategic Vision: Repairing Streets and
Investing in Infrastructure, Safe and Livable
Neighborhoods, An Economically Prosper-
ous City with Opportunity in Every Com-
munity, and Excellent
Customer Service and
Open Government.
Other notable expendi-
tures include funding
for reserves, including
increases for the Gen-
eral Fund, Workers’
Compensation Fund, and Public Liability
Fund; increases from labor negotiations, in-
cluding a set-aside for pending labor negoti-
ations; and increases in pension payments.
Overview of Revenues
The FY 2017 Proposed Budget includes ap-
proximately $1.33 billion in projected Gen-
eral Fund revenues, an increase of $44.3
million or 3.5% over the FY 2016 Adopted
Budget. This projected increase reflects the
“Now the City Council will meet as
the Budget Review Committee to
discuss the proposal in full as they
review each department’s budget
and hear from the public.”
The Mayor’s FY 2017 Proposed Budget is a solid proposal ad-
hering to City financial policies and best practices, incorporat-
ing reasonable revenue assumptions, and focusing on a wide
range of priority core services supported by the City Council.
1
High Level Review of the Mayor’s
FY 2017 Proposed Budget
Office of the Independent Budget Analyst
April 2016
stable but slowing economic forecast that
was included in the FY 2017-2021 Five-Year
Financial Outlook (Outlook), with the ex-
ception of a larger than expected decline in
sales tax revenue due to ongoing reductions
in fuel prices.
Four major General Fund revenues: proper-
ty tax, sales tax, transient occupancy tax
(TOT), and franchise fees, account for al-
most three-quarters of the General Fund’s
revenue and total $968.4 million in FY 2017,
an increase of $29.7 million or 3.2% over FY
2016. While growth in major General Fund
revenues remains positive
in FY 2017, the amount of
year-over-year growth is
projected to slow for some
revenues as over-all posi-
tive economic indicators
are tempered somewhat by
fluctuating returns in others. Significant indi-
cators include:
An increase in the county’s median
home price
An increase in the number of home
sales
Decreasing unemployment levels
A recent, slight reduction in consumer
confidence
Our Office believes that the projected ma-
jor General Fund revenues in the FY 2017
Proposed Budget are appropriate, based on
FY 2016 revenue projections and the cur-
rent economic forecast. A more detailed
discussion of each of the major General
Fund revenues is included in the “General
Fund Revenue Overview” section of this
report, while a discussion on the changes in
revenue projections from the Mayor’s most
recent Outlook is included in the “Looking
Ahead to FY 2018” portion of this section.
Strengths of Proposed
Budget
Highest General Fund Reserves in
History
Proposed funding levels for the City’s FY
2017 General Fund Reserves are the highest
in history. In FY 2006, the first year of the
Strong Mayor/Strong Coun-
cil form of government, the
City’s Reserve Policy
(adopted by City Council in
2002) established a General
Fund Reserve minimum of
3% of General Fund reve-
nues. For FY 2017 the General Fund Re-
serves will be funded at 14.75%, with a six-
year funding plan in place to achieve 16.7%
by 2021 that is consistent with Government
Financial Officers’ Association best practic-
es. This increased funding goal was initiated
and recently adopted by City Council as
part of the update to the City’s Reserve
Policy. Recent ratings reports issued by
Fitch (February 4, 2016) and Moody’s
(February 12, 2016) highlighted the City’s
decision to increase its General Fund Re-
serves to 16.7%.
Mayor’s Funding Proposals Closely
Mirror Council Budget Priorities
With its strong focus on addressing core
City services, the FY 2017 Proposed Budget
includes significant funding for 18 of the 21
“Proposed funding levels for
the City’s FY 2017 General
Fund Reserves are the high-
est in history.
2
High Level Review of the Mayor’s
FY 2017 Proposed Budget
Office of the Independent Budget Analyst
April 2016
highest City Council budget priorities as
identified in Resolution R-310237 “City
Council Budget Priorities for FY 2017”. This
resolution was approved by the Council on
February 8, 2016 and transmitted to the
Mayor on February 11, 2016 to provide in-
put and guidance to the Mayor as he devel-
oped the Proposed Budget.
A matrix which compares
the Proposed Budget to
the Council’s 21 top priori-
ties is available on pages 11
to 14, at the end of this
section.
Street Paving Funding Gap Reme-
died for FY 2017
The FY 2017 Proposed Budget closes a
funding gap which we identified during our
review of the Mayor’s FY 2016-2021 Street
Pavement Repair Program in April 2015.
This increase in street
repair funding should
make the goal of an OCI
of 70 by 2025 more
achievable. At that time,
we estimated the street
funding program pro-
posed last year could fall
$206 million short in funding needed for the
first five years to stay reasonably on track
for meeting the ten year goal, including a
shortfall of $18.9 million in FY 2017. An ad-
ditional $19.7 million has now been budget-
ed for street repair in FY 2017 which will
facilitate achieving the OCI of 70 by 2025.
(Note: Our funding projections were based
on an OCI of 54 from 2011 assessments.
Updated OCI data from new street condi-
tion assessments, expected to be released
in May, could alter these projections. In fact,
early indications are that the updated OCI
will exceed 54 which could lower the fund-
ing needed to achieve goals.)
Fire and Police Overtime Right-Sized
The FY 2017 Proposed Budget includes ad-
ditional overtime funding of $3.0 million for
Police and an adjustment to
the way overtime and oth-
er personnel expenditures
are allocated for Fire-
Rescue. These changes bet-
ter align the two budgets
with recent actual annual expenditures.
During the past several budget processes,
we have recommended addressing past ex-
penditure overruns up front when the
budget is developed rather than waiting to
address short-falls at mid-year. In our re-
cent review of the FY 2017- 2021 Five-Year
Financial Outlook we
projected the Police De-
partment would likely
expend an additional $3
to $5 million annually
over the next five years,
and Fire’s overtime
would also increase sig-
nificantly over projections based on past
needs.
Citywide Parks System Master Plan
Will Begin in FY 2017
Funding to begin the long awaited update of
the Citywide Parks System Master Plan has
been included in the Planning Department’s
FY 2017 proposed budget. The last Parks
System Master Plan dates back to 1956.
This effort will entail a three-year work
“This increase in street re-
pair funding should make
the goal of an OCI of 70 by
2025 more achievable.”
“Funding to begin the long await-
ed update of the Citywide Parks
System Master Plan has been in-
cluded in the Planning Depart-
ment’s FY 2017 proposed budget.”
3
High Level Review of the Mayor’s
FY 2017 Proposed Budget
Office of the Independent Budget Analyst
April 2016
program which will result in a comprehen-
sive evaluation of existing parks and a plan
for identifying and providing needed park
facilities throughout the community. While
a Parks Master Plan has been a priority for
many years, it was determined that under-
taking this work in conjunction with the
parks condition assessments, which are cur-
rently underway, would be most beneficial.
Budget Continues Focus on Identify-
ing City’s Deferred Capital Needs
Like cities across the country, this City has
recognized for many years that we face sig-
nificant deferred capital needs. However,
the magnitude of the problem has not been
known. Over the past three years a series
of condition assessments for City facilities,
streets, sidewalks, and parks were funded in
the Adopted Budgets.
Many of these have
been completed, and
others are underway or
will be in the near fu-
ture. Condition assess-
ments are not a one-
time effort and must be
ongoing to ensure information on the con-
dition of our assets and related funding re-
quirements are as current as possible.
The assessments completed to date have
begun to provide the first reliable infor-
mation on the City’s unmet deferred capital
needs. This information resulted in the de-
velopment of the City’s first five-year Capi-
tal Infrastructure Planning Outlook, issued
in November 2014 and updated in Decem-
ber 2015. This plan matches deferred capi-
tal needs, identified through the assess-
ments, with resources available to pay for
them. As a result, the City is gathering, for
the first time, reliable information on fund-
ing gaps that exist for adequately maintain-
ing our valuable community assets. The
Mayor has provided funding once again for
condition assessments in the FY 2017 Pro-
posed Budget and has identified funding for
this purpose in each year of the FY 2017-
2021 Outlook.
Weaknesses of Proposed
Budget
Police Recruitment and Retention
Challenges are Persistent
The FY 2017 Proposed Budget includes
$2.4 million in increased expenditures for
flexible benefits pursuant to the Police Of-
f i cers Assoc ia t ion
(POA) memorandum of
understanding (MOU)
for FY 2016-2020. The
benefit increase is non-
pensionable, as are all
MOU-related compen-
sation increases through
FY 2018, and is available only to Police offic-
ers with eight or more years of service.
The intent of the POA MOU was to en-
hance the Police Department’s recruitment
and retention efforts in order to mitigate
the effect of recent above-normal attrition
and to support the staffing goals outlined in
the Police Department Five-Year Plan. After
close to one year of being in effect, howev-
er, the MOU has not significantly reduced
sworn office attrition, although the Police
Chief points out that the problem would be
“...the City is gathering, for the
first time, reliable information on
funding gaps that exist for ade-
quately maintaining our valuable
community assets.”
4
High Level Review of the Mayor’s
FY 2017 Proposed Budget
Office of the Independent Budget Analyst
April 2016
worse if those benefits were not in place.
Officers continue to leave the Department
at a rate of 13 departures per month in FY
2016, the same as FY
2015. This is a multi-
faceted, complicated,
and serious matter. It
is not known what
further solutions are
being considered, but
at this point the FY
2017 Budget does not include any new initi-
atives or resources aimed at improving po-
lice recruitment and retention beyond what
was negotiated in 2015.
Unmet Needs Could Require New
Resources in Near Future
As discussed in the prior section on budget
strengths, over the past several years the
City has made significant progress toward
assessing the needs of the community in the
area of infrastructure and deferred capital,
as well as in City services and programs.
These assessments are vital to understand-
ing, prioritizing, and identifying funding for a
wide range of community needs. In a rela-
tively short time period, numerous plans
have been developed and, where appropri-
ate, either accepted or adopted by the
Council: multi-year department plans for
Police, and Lifeguards; the Citygate Report
on Fire Standards of Coverage; the Penny
for the Arts Blueprint; the City’s first five-
year Capital Infrastructure Planning Out-
look; community plan updates for Encanto,
and Southeastern; the Bicycle Master Plan;
Stormwater Watershed Asset Management
Plan; Vision Zero Plan; the Climate Action
Plan; and the Library Ordinance. A new
Citywide Parks System Master Plan will
begin next year with funding included in the
FY 2017 Proposed
Budget. As previously
noted, numerous con-
dition assessments of
our capital assets have
also been completed
or are underway.
These plans and as-
sessments are identifying significant needs
and funding requirements above and beyond
what our existing resources will likely be
able to support in the future. While the FY
2017-2021 Financial Outlook released in
November 2015 showed modest surpluses
in the outer years after the Mayor’s Priority
Initiatives were accounted for, many of the
needs identified in the plans and assess-
ments have not yet been addressed. It is
likely that new resources will need to be
considered in the near future if City plans
are to be implemented.
Performance Measures Provided in
the FY 2017 Budget
Over the years the Executive Branch’s ap-
proaches to performance measurement
have changed numerous times. In FY 2012
the Budget and Finance Committee, work-
ing with our Office, adopted a focused list
of 60 performance measures based on areas
of high interest to the community and rele-
vance to the budget. The Committee re-
quested these measures be consistently
tracked and made available to the Council
and the public through the annual budget
documents and ultimately the City’s web-
“These plans and assessments are
identifying significant needs and fund-
ing requirements above and beyond
what our existing resources will likely
be able to support in the future.”
5
High Level Review of the Mayor’s
FY 2017 Proposed Budget
Office of the Independent Budget Analyst
April 2016
site. These measures were refined working
closely with City departments in order to
meet their needs, and most were included
in the budget documents through FY 2016.
For the FY 2017 Proposed Budget, City de-
partments were asked
to update their tactical
plans to ensure con-
sistency with the City’s
Strategic Plan, and at
the same revise their
performance measures
as appropriate for their operation. Fortu-
nately, several large key departments includ-
ing Police, Fire, Environmental Services,
Transportation and Storm Water, and Pub-
lic Utilities retained many of the measures
that have been tracked over time, while
adding some new ones as well. However,
many departments dropped Council-
requested and other measures tracked in
recent years that helped to understand lev-
els of service being provided, and the Pro-
posed Budget does not include this trending
information. While the new measures will
likely be meaningful once established, nearly
all of them are missing data from prior
years (FY 2015 and FY 2016) and have no
historical context or baseline information to
be meaningful for the FY 2017 budget pro-
cess. Additional concerns are discussed in
the Performance Measures Section of this
report.
Comparing Mayor and
Council Priorities
As noted in the discussion on “Strengths”
the Mayor supported funding for 18 of the
21 top Council priorities included in the FY
2017 City Council Budget Priorities Resolu-
tion. The table on pages 11 to 14 at the end
of this section is a “high level review,” indi-
cating whether funding has been provided in
the Proposed Budget. Desired funding lev-
els, specific purposes
and/or locations for the
funding may vary
among the Mayor and
individual members of
City Council. As dis-
played in the table, the
Proposed Budget does not include new
funding for three programs of high Council
Priority:
ADA Improvements
Restoration of Swimming Pool Hours
Penny for the Arts Blueprint Funding
Increases Above Current 6.44%
Looking Ahead to FY 2018 In looking ahead to FY 2018 we identify the
following issues as potentially impacting fi-
nancial projections beyond FY 2017.
Impacts of Potentially Softening
Economy on Revenues
The Proposed Budget for FY 2017 assumes
appropriately modest growth rates for the
City’s four main General Fund revenues.
Each of those revenues is broadly depend-
ent on the overall condition of the econo-
my. Over the last several years, the City has
experienced significant increases in all of its
major General Fund revenues that largely
track the economy’s overall recovery from
the 2008 recession. Economic recovery and
“...the Mayor supported funding for
18 of the 21 top Council priorities
included in the FY 2017 City Council
Budget Priorities Resolution.”
6
High Level Review of the Mayor’s
FY 2017 Proposed Budget
Office of the Independent Budget Analyst
April 2016
associated revenue growth, however, has
begun to slow, as the economy shifts out of
a phase of rapid recov-
ery.
Additionally, future ad-
justments to Federal in-
terest rates, increases in
home prices, and chang-
es to employment rates and consumer con-
fidence levels are likely to continue to im-
pact City revenues. As such, increases in
revenues in FY 2018 and beyond may be
smaller in magnitude than we have seen
during the recovery years that initially fol-
lowed the 2008 recession.
SDCERS Assumption Changes and
Impact on ADC
SDCERS’ actuary, Cheiron, is in the process
of completing an “experience study” for
Board review this coming July, which will be
the basis for Chei-
ron’s recommended
changes in the pen-
sion plan’s actuarial
assumptions. It is an-
ticipated by Cheiron
that there could be a
“meaningful cost in-
crease (2% to 6%)” related to assumptions
regarding mortality. Any Board-approved
assumption changes would be included in
the calculation of the FY 2018 ADC.
Future Investments in Police Re-
cruitment and Retention
Despite significant investments made by the
Mayor and Council in Police recruitment
and retention, the sworn staffing challenges
faced by the Department continue to be a
concern. While the FY 2017 Proposed
Budget continues
funding for expanded
academies and in-
creased compensation
for officers per the
POA MOU, it does
not include any new initiatives aimed at im-
proving Police recruitment and retention. If
staffing trends do not improve in FY 2017,
additional resources and programmatic initi-
atives may be required in FY 2018 and be-
yond. Potential expenditures on future re-
cruitment and retention efforts would be in
addition to the estimated $6.7 million in-
crease in non-pensionable compensation
already planned for FY 2018 pursuant to the
POA MOU.
Bayside Fire Station FY 2018 Oper-
ating Costs
The new Bayside Fire
Station (FS 2), which
broke ground in
March 2016, is antici-
pated to become op-
erational in FY 2018.
At that time, the Fire-
Rescue Department
will require the addition of firefighter posi-
tions and ongoing personnel and non-
personnel expenses to support the fire sta-
tion. The FY 2017-2021 Five-Year Financial
Outlook includes 12.00 FTE positions and
$1.3 million in associated expenditures for
Bayside Fire Station operations beginning in
FY 2018.
“Economic recovery and associated
revenue growth, however, has be-
gun to slow, as the economy shifts
out of a phase of rapid recovery.”
“Despite significant investments made
by the Mayor and Council in Police
recruitment and retention, the sworn
staffing challenges faced by the De-
partment continue to be a concern.”
7
High Level Review of the Mayor’s
FY 2017 Proposed Budget
Office of the Independent Budget Analyst
April 2016
Customer Service System Future
Costs
The FY 2017 Proposed Budget includes
funding and additional positions in the Per-
formance & Analytics (P&A) Department to
support the first phase of a potential multi-
phase “311-like” customer service system.
The approximately $1.1 million investment
adds three positions and $766,000 in non-
personnel expense to the customer service
system that was started in FY 2016 with the
addition to the Department of one Program
Coordinator position. At this time the cus-
tomer service system is planned for a
phased implementation over five years, an
approach that should alter the scope of the
program to grow to match resident needs
and City resources.
Our Office notes that P&A has preliminarily
discussed web-based applications as the fo-
cus of the program, as opposed to creating
a customer call center, and that their esti-
mate for the project is a cost of $3.0 to
$4.0 million over five years. As the scope of
the project is not fully defined at this time,
our Office recommends that updates on the
implementation of a customer service sys-
tem be reported to Council on a regular
basis, and that these updates include imple-
mentation status and ongoing costs, as well
as the expected benefits to City residents.
Future General Fund IAM Costs
IAM is an integrated SAP-based software
solution that will improve the City’s man-
agement of infrastructure assets. The total
cost for the Project over three years is esti-
mated to be $54.2 million, including both
capital and O&M expenses. Approximately
70% of the Project will be funded by Public
Utilities’ enterprise funds with the remain-
ing 30% to be funded by the General Fund
and the Wireless Technology Fund. The
portion of the annual capital and O&M costs
attributable to the General Fund in FY 2018
is expected to be $3.9 million. However,
General Fund capital costs are expected to
be lease-financed over a 7 to 10 year term,
which will reduce the FY 2018 General
Fund contribution to approximately $2.1
million.
Status of Excess Equity
Excess Equity—available reserve balance
above the 14.5% reserve requirement for
FY 2016—can be utilized to support one-
time expenditures including Council-
initiated one-time priorities identified
through the budget review process. Based
on the Mid-Year Report, Excess Equity to-
taled approximately $6.0 million, which
could be an additional resource for the FY
2017 budget.
However, labor negotiations have recently
been completed. If labor contracts are ap-
proved, increases in the estimated costs for
labor contracts that are set aside in the
Proposed Budget would need to be incor-
porated into the May Revise. These poten-
tial increases, any other unforeseen expend-
itures in FY 2016, and any FY 2017 May Re-
vise adjustments that are not supported by
increased revenues or reductions in other
expenditures, could reduce the Excess Equi-
ty estimate.
8
High Level Review of the Mayor’s
FY 2017 Proposed Budget
Office of the Independent Budget Analyst
April 2016
Items Expected in the May
Revise
On April 20, 2016, Financial Management
issued its call to departments for FY 2017
May Revision requests. At this time, we are
aware of the following likely requests:
Office of the City Attorney
The Office of the City Attorney has indicat-
ed that it will request the addition of 1.00
Program Manager for the Community Jus-
tice Initiative and $140,000 in associated
expenditures in the May Revision. A request
to exempt the Program Manager position
from the classified service was approved by
Council in February 2016. The position has
not yet been filled and the Office of the City
Attorney requested but did not receive
funding in the FY 2017 Proposed Budget to
do so.
Citizens’ Review Board on Police
Practices (CRB)
The issue of providing outside counsel for
the CRB has been discussed recently at the
Public Safety & Livable Neighborhoods
Committee and the Rules Committee as
part of the consideration of a broader po-
tential ballot measure proposal regarding
the CRB. At both committee hearings, a
motion was passed unanimously that rec-
ommended that the Mayor include funding
in FY 2017 for independent outside counsel
for the CRB. Our office recommends that
funding for this purpose be added to the
Neighborhood Services Branch budget in
the May Revision at a level deemed appro-
priate by the CRB.
Kinder Morgan
Although funding for the Kinder Morgan
lawsuit has been removed from the Special
Consulting Services budget, the lawsuit is
ongoing and is anticipated to incur expendi-
tures. Appropriate funding is expected to
be included in the May Revise.
Real Estate Assets Department
Real Estate Assets has indicated that it will
make a request of $17,000 for its Doculynx
contract. Doculynx is a company that scans
all of READ's lease and property documents
and stores them in an electronic retrieval
system that is accessible by staff. The De-
partment indicates that this is necessary to
support the its day-to-day operations.
Next Steps in the Process We appreciate the timely responses from
City departments and agencies to our nu-
merous questions over the past two weeks.
The FY 2017 Proposed Budget responsibly
strengthens City programs and services, and
provides a positive message to our resi-
dents about the future of our City.
The release of the Mayor’s Proposed Budg-
et is only the first step in the annual budget
development process. We look forward to
working with the City Council over the
next critical stages of the process when the
Council reviews and considers the IBA’s
analysis of the budget; examines the budget
proposals of all departments and agencies;
listens to feedback from the community at
numerous public hearings; develops the pri-
orities of the legislative branch for possible
inclusion in, or revision to, the FY 2017
Proposed Budget; and makes final decisions
9
High Level Review of the Mayor’s
FY 2017 Proposed Budget
Office of the Independent Budget Analyst
April 2016
when formally adopting the FY 2017 budget.
Key dates for these activities are as follows:
May 4-5, 9-10: Budget Review Committee
hears “IBA Review of the FY 2017 Pro-
posed Budget” and holds public hearings on
City departments, functions, and agency
budget proposals
May 16: City Council holds evening hearing
to receive further input from the public
May 19: Budget Review Committee re-
views the Mayor’s May Revise for consider-
ation in final budget decisions
May 27: City Councilmembers issue final
budget modification priority memoranda to
the Office of the IBA
June 8: Office of the IBA issues final report
on recommended revisions to the Mayor’s
FY 2017 Proposed Budget based on input
from City Council memoranda and analysis
of unresolved issues
June 13: City Council makes final FY 2017
budget decisions and takes action on any FY
2017 budget revisions
July 11: City Council introduces and adopts
the FY 2017 Appropriation Ordinance
10
High Level Review of the Mayor’s
FY 2017 Proposed Budget
Office of the Independent Budget Analyst
April 2016
IN FY 2017
BUDGET* NOTES
Public Safety
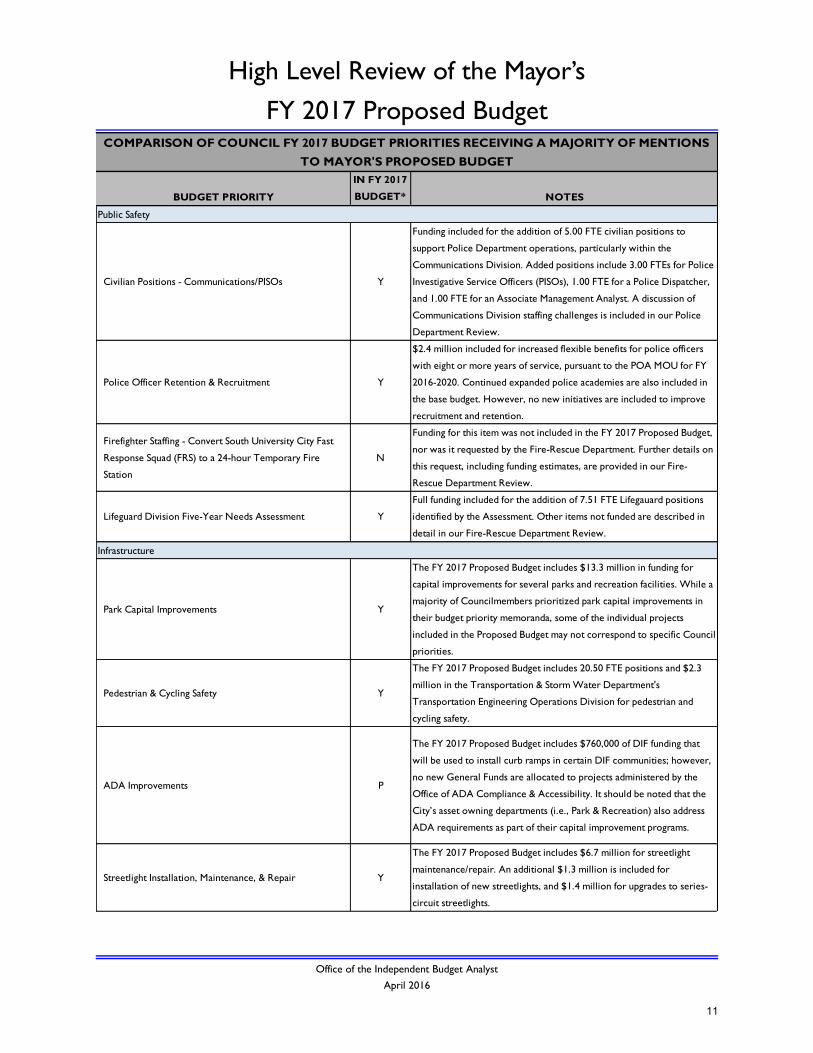
Civilian Positions - Communications/PISOs Y
Funding included for the addition of 5.00 FTE civilian positions to
support Police Department operations, particularly within the
Communications Division. Added positions include 3.00 FTEs for Police
Investigative Service Officers (PISOs), 1.00 FTE for a Police Dispatcher,
and 1.00 FTE for an Associate Management Analyst. A discussion of
Communications Division staffing challenges is included in our Police
Department Review.
Police Officer Retention & Recruitment Y
$2.4 million included for increased flexible benefits for police officers
with eight or more years of service, pursuant to the POA MOU for FY
2016-2020. Continued expanded police academies are also included in
the base budget. However, no new initiatives are included to improve
recruitment and retention.
Firefighter Staffing - Convert South University City Fast
Response Squad (FRS) to a 24-hour Temporary Fire
Station
N
Funding for this item was not included in the FY 2017 Proposed Budget,
nor was it requested by the Fire-Rescue Department. Further details on
this request, including funding estimates, are provided in our Fire-
Rescue Department Review.
Lifeguard Division Five-Year Needs Assessment Y
Full funding included for the addition of 7.51 FTE Lifegauard positions
identified by the Assessment. Other items not funded are described in
detail in our Fire-Rescue Department Review.
Park Capital Improvements Y
The FY 2017 Proposed Budget includes $13.3 million in funding for
capital improvements for several parks and recreation facilities. While a
majority of Councilmembers prioritized park capital improvements in
their budget priority memoranda, some of the individual projects
included in the Proposed Budget may not correspond to specific Council
priorities.
Pedestrian & Cycling Safety Y
The FY 2017 Proposed Budget includes 20.50 FTE positions and $2.3
million in the Transportation & Storm Water Department's
Transportation Engineering Operations Division for pedestrian and
cycling safety.
ADA Improvements P
The FY 2017 Proposed Budget includes $760,000 of DIF funding that
will be used to install curb ramps in certain DIF communities; however,
no new General Funds are allocated to projects administered by the
Office of ADA Compliance & Accessibility. It should be noted that the
City’s asset owning departments (i.e., Park & Recreation) also address
ADA requirements as part of their capital improvement programs.
Streetlight Installation, Maintenance, & Repair Y
The FY 2017 Proposed Budget includes $6.7 million for streetlight
maintenance/repair. An additional $1.3 million is included for
installation of new streetlights, and $1.4 million for upgrades to series-
circuit streetlights.
COMPARISON OF COUNCIL FY 2017 BUDGET PRIORITIES RECEIVING A MAJORITY OF MENTIONS
TO MAYOR'S PROPOSED BUDGET
BUDGET PRIORITY
Infrastructure
11
High Level Review of the Mayor’s
FY 2017 Proposed Budget
Office of the Independent Budget Analyst
April 2016
IN FY 2017
BUDGET* NOTESBUDGET PRIORITY
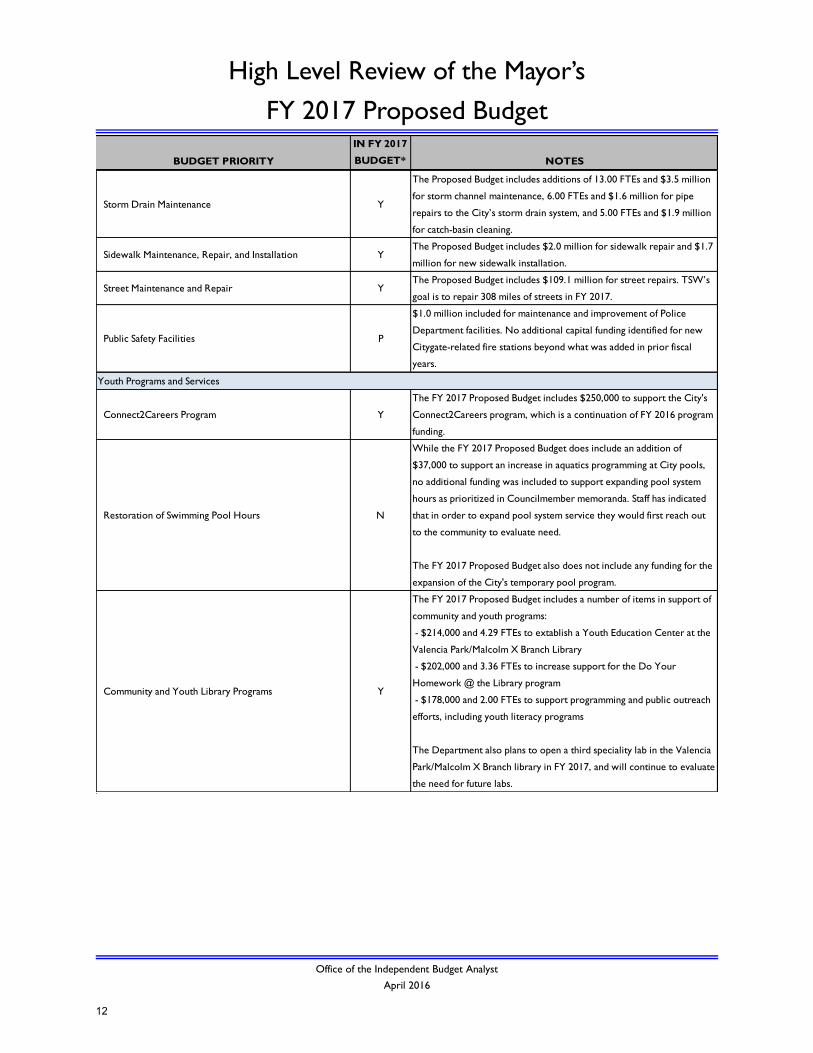
Storm Drain Maintenance Y
The Proposed Budget includes additions of 13.00 FTEs and $3.5 million
for storm channel maintenance, 6.00 FTEs and $1.6 million for pipe
repairs to the City’s storm drain system, and 5.00 FTEs and $1.9 million
for catch-basin cleaning.
Sidewalk Maintenance, Repair, and Installation YThe Proposed Budget includes $2.0 million for sidewalk repair and $1.7
million for new sidewalk installation.
Street Maintenance and Repair YThe Proposed Budget includes $109.1 million for street repairs. TSW’s
goal is to repair 308 miles of streets in FY 2017.
Public Safety Facilities P
$1.0 million included for maintenance and improvement of Police
Department facilities. No additional capital funding identified for new
Citygate-related fire stations beyond what was added in prior fiscal
years.
Youth Programs and Services
Connect2Careers Program Y
The FY 2017 Proposed Budget includes $250,000 to support the City's
Connect2Careers program, which is a continuation of FY 2016 program
funding.
Restoration of Swimming Pool Hours N
While the FY 2017 Proposed Budget does include an addition of
$37,000 to support an increase in aquatics programming at City pools,
no additional funding was included to support expanding pool system
hours as prioritized in Councilmember memoranda. Staff has indicated
that in order to expand pool system service they would first reach out
to the community to evaluate need.
The FY 2017 Proposed Budget also does not include any funding for the
expansion of the City's temporary pool program.
Community and Youth Library Programs Y
The FY 2017 Proposed Budget includes a number of items in support of
community and youth programs:
- $214,000 and 4.29 FTEs to extablish a Youth Education Center at the
Valencia Park/Malcolm X Branch Library
- $202,000 and 3.36 FTEs to increase support for the Do Your
Homework @ the Library program
- $178,000 and 2.00 FTEs to support programming and public outreach
efforts, including youth literacy programs
The Department also plans to open a third speciality lab in the Valencia
Park/Malcolm X Branch library in FY 2017, and will continue to evaluate
the need for future labs.
12
High Level Review of the Mayor’s
FY 2017 Proposed Budget
Office of the Independent Budget Analyst
April 2016
IN FY 2017
BUDGET* NOTESBUDGET PRIORITY
Penny for the Arts
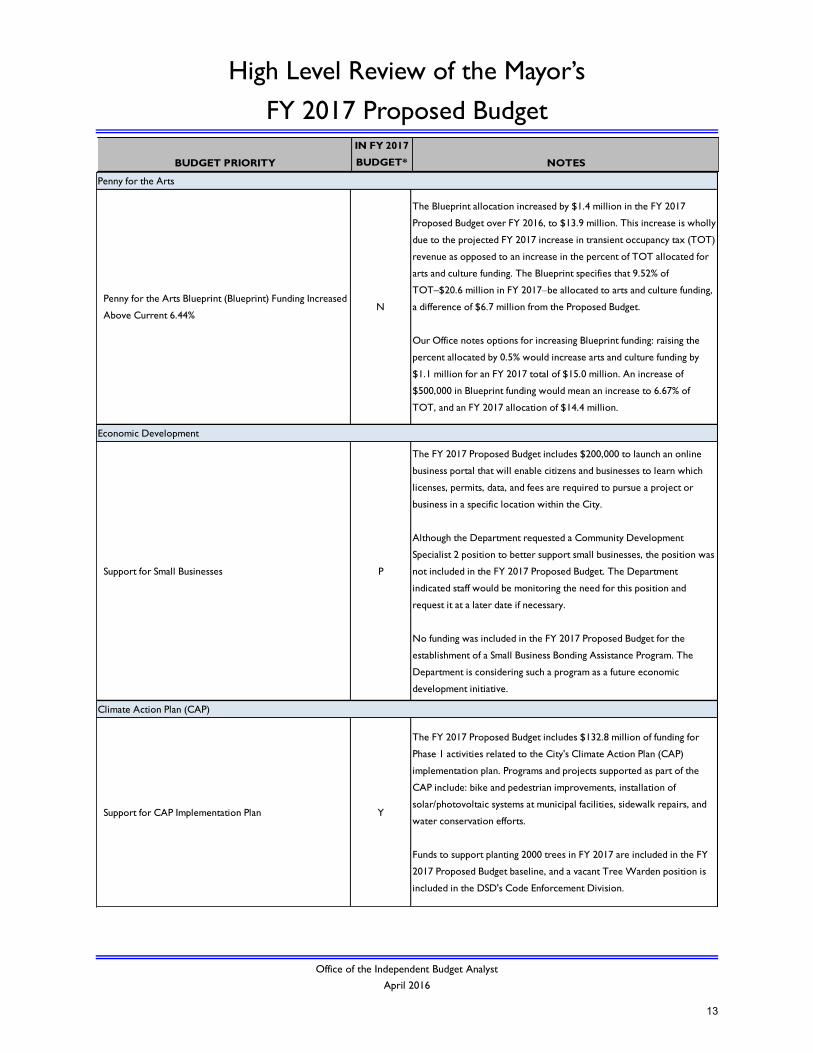
Penny for the Arts Blueprint (Blueprint) Funding Increased
Above Current 6.44%N
The Blueprint allocation increased by $1.4 million in the FY 2017
Proposed Budget over FY 2016, to $13.9 million. This increase is wholly
due to the projected FY 2017 increase in transient occupancy tax (TOT)
revenue as opposed to an increase in the percent of TOT allocated for
arts and culture funding. The Blueprint specifies that 9.52% of
TOT–$20.6 million in FY 2017–be allocated to arts and culture funding,
a difference of $6.7 million from the Proposed Budget.
Our Office notes options for increasing Blueprint funding: raising the
percent allocated by 0.5% would increase arts and culture funding by
$1.1 million for an FY 2017 total of $15.0 million. An increase of
$500,000 in Blueprint funding would mean an increase to 6.67% of
TOT, and an FY 2017 allocation of $14.4 million.
Support for Small Businesses P
The FY 2017 Proposed Budget includes $200,000 to launch an online
business portal that will enable citizens and businesses to learn which
licenses, permits, data, and fees are required to pursue a project or
business in a specific location within the City.
Although the Department requested a Community Development
Specialist 2 position to better support small businesses, the position was
not included in the FY 2017 Proposed Budget. The Department
indicated staff would be monitoring the need for this position and
request it at a later date if necessary.
No funding was included in the FY 2017 Proposed Budget for the
establishment of a Small Business Bonding Assistance Program. The
Department is considering such a program as a future economic
development initiative.
Support for CAP Implementation Plan Y
The FY 2017 Proposed Budget includes $132.8 million of funding for
Phase 1 activities related to the City's Climate Action Plan (CAP)
implementation plan. Programs and projects supported as part of the
CAP include: bike and pedestrian improvements, installation of
solar/photovoltaic systems at municipal facilities, sidewalk repairs, and
water conservation efforts.
Funds to support planting 2000 trees in FY 2017 are included in the FY
2017 Proposed Budget baseline, and a vacant Tree Warden position is
included in the DSD's Code Enforcement Division.
Economic Development
Climate Action Plan (CAP)
13
High Level Review of the Mayor’s
FY 2017 Proposed Budget
Office of the Independent Budget Analyst
April 2016
IN FY 2017
BUDGET* NOTESBUDGET PRIORITY
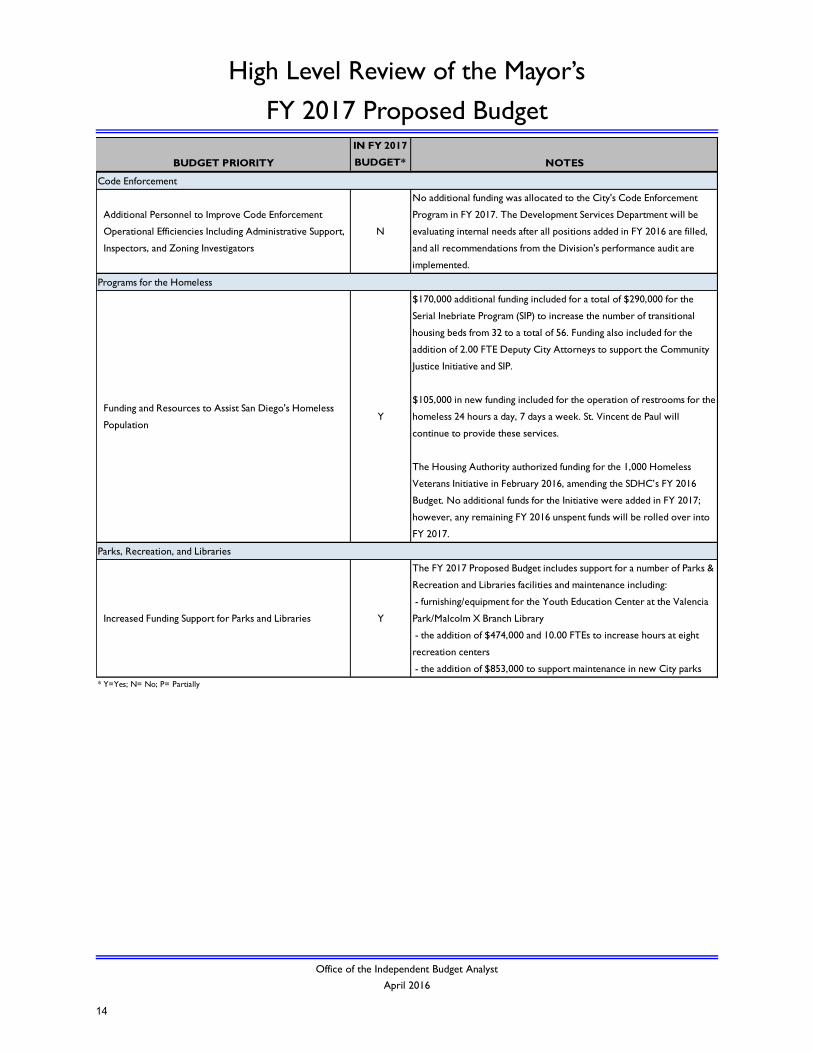
Code Enforcement
Additional Personnel to Improve Code Enforcement
Operational Efficiencies Including Administrative Support,
Inspectors, and Zoning Investigators
N
No additional funding was allocated to the City's Code Enforcement
Program in FY 2017. The Development Services Department will be
evaluating internal needs after all positions added in FY 2016 are filled,
and all recommendations from the Division's performance audit are
implemented.
Funding and Resources to Assist San Diego's Homeless
PopulationY
$170,000 additional funding included for a total of $290,000 for the
Serial Inebriate Program (SIP) to increase the number of transitional
housing beds from 32 to a total of 56. Funding also included for the
addition of 2.00 FTE Deputy City Attorneys to support the Community
Justice Initiative and SIP.
$105,000 in new funding included for the operation of restrooms for the
homeless 24 hours a day, 7 days a week. St. Vincent de Paul will
continue to provide these services.
The Housing Authority authorized funding for the 1,000 Homeless
Veterans Initiative in February 2016, amending the SDHC’s FY 2016
Budget. No additional funds for the Initiative were added in FY 2017;
however, any remaining FY 2016 unspent funds will be rolled over into
FY 2017.
Increased Funding Support for Parks and Libraries Y
The FY 2017 Proposed Budget includes support for a number of Parks &
Recreation and Libraries facilities and maintenance including:
- furnishing/equipment for the Youth Education Center at the Valencia
Park/Malcolm X Branch Library
- the addition of $474,000 and 10.00 FTEs to increase hours at eight
recreation centers
- the addition of $853,000 to support maintenance in new City parks
* Y=Yes; N= No; P= Partially
Programs for the Homeless
Parks, Recreation, and Libraries
14
General Fund Overview: Expenditure
Office of the Independent Budget Analyst
April 2017
Expenditure Overview
Mayor’s FY 2017 Proposed
Adjustments
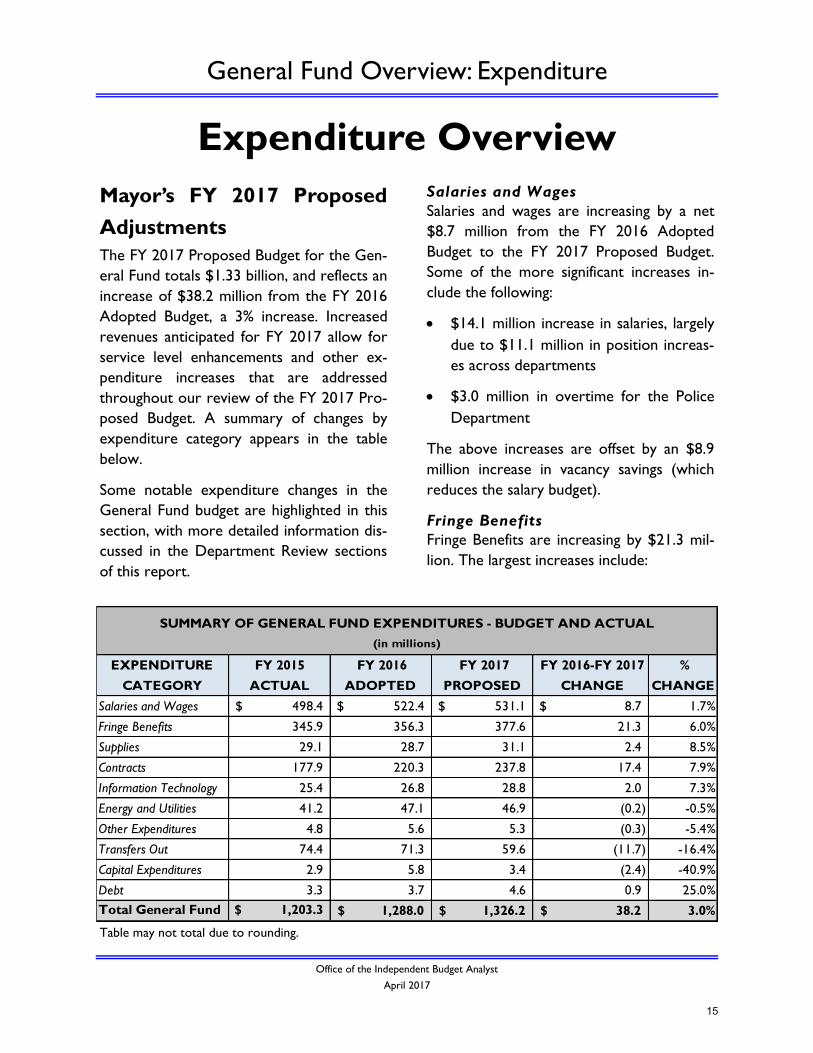
The FY 2017 Proposed Budget for the Gen-
eral Fund totals $1.33 billion, and reflects an
increase of $38.2 million from the FY 2016
Adopted Budget, a 3% increase. Increased
revenues anticipated for FY 2017 allow for
service level enhancements and other ex-
penditure increases that are addressed
throughout our review of the FY 2017 Pro-
posed Budget. A summary of changes by
expenditure category appears in the table
below.
Some notable expenditure changes in the
General Fund budget are highlighted in this
section, with more detailed information dis-
cussed in the Department Review sections
of this report.
Salaries and Wages
Salaries and wages are increasing by a net
$8.7 million from the FY 2016 Adopted
Budget to the FY 2017 Proposed Budget.
Some of the more significant increases in-
clude the following:
$14.1 million increase in salaries, largely
due to $11.1 million in position increas-
es across departments
$3.0 million in overtime for the Police
Department
The above increases are offset by an $8.9
million increase in vacancy savings (which
reduces the salary budget).
Fringe Benefits
Fringe Benefits are increasing by $21.3 mil-
lion. The largest increases include:
Table may not total due to rounding.
EXPENDITURE
CATEGORY
FY 2015
ACTUAL
FY 2016
ADOPTED
FY 2017
PROPOSED
FY 2016-FY 2017
CHANGE
%
CHANGE
Salaries and Wages 498.4$ 522.4$ 531.1$ 8.7$ 1.7%
Fringe Benefits 345.9 356.3 377.6 21.3 6.0%
Supplies 29.1 28.7 31.1 2.4 8.5%
Contracts 177.9 220.3 237.8 17.4 7.9%
Information Technology 25.4 26.8 28.8 2.0 7.3%
Energy and Utilities 41.2 47.1 46.9 (0.2) -0.5%
Other Expenditures 4.8 5.6 5.3 (0.3) -5.4%
Transfers Out 74.4 71.3 59.6 (11.7) -16.4%
Capital Expenditures 2.9 5.8 3.4 (2.4) -40.9%
Debt 3.3 3.7 4.6 0.9 25.0%
Total General Fund $ 1,203.3 1,288.0$ 1,326.2$ 38.2$ 3.0%
SUMMARY OF GENERAL FUND EXPENDITURES - BUDGET AND ACTUAL
(in millions)
15
General Fund Overview: Expenditure
Office of the Independent Budget Analyst
April 2017
$3.3 million increase for the General
Fund contribution to the defined benefit
pension plan. (This is largely due to the
SDCERS Board-approved changes in
economic assumptions in the FY 2015
actuarial valuation, as well as lower in-
vestment returns than expected for FY
2015 (For additional information see the
Pension section of this report under Sig-
nificant Citywide Issues.)
$11.6 million for Flexible Benefits, in-
cluding:
$4.3 million as a set-aside in an-
ticipation of non-pensionable
compensation increases which
could result from labor negotia-
tions that began this past winter
$5.7 million for increases from
prior labor agreements with the
San Diego Police Officer’s Asso-
ciation (POA) and Municipal Em-
ployees Association (MEA) em-
ployees
$2.1 million for position increas-
es across departments
$4.1 million for Workers’ Compensa-
tion, due to estimates for increasing
claims costs and for an increasing re-
serve requirement (See the Workers’
Compensation section, under Significant
Citywide Issues.)
$1.6 million increase for the Supple-
mental Pension Savings Plan (SPSP and
SPSP-H), largely due to the increased
number of positions
Contracts
Contracts show a net increase for the Gen-
eral Fund of $17.4 million. Some of the larg-
er increases are discussed below:
$7.8 million for certain Transportation
and Storm Water (TSW) Contracts in-
creases, including those related to
storm drain channel cleaning and pipe
repair activities (including Fleet Services
vehicle purchases) as well as environ-
mental permitting and catch basin clean-
ing activities
$7.3 million for the Fleet Division’s
“usage” and “assignment” charges
(These are rates charged to City depart-
ments for the maintenance and repair of
City vehicles, as well as for costs for
planned scheduled replacements based
on the useful life of the vehicles.)
$6.6 million increase in the Public Liabil-
ity contribution for claims payouts and
insurance (For additional information
see the Public Liability Funds section of
this report under Significant Citywide
Issues.)
$1.6 million in Citywide Program Ex-
penditures for corporate master lease
rent expenditures
Contracts decreases are partially offsetting
to the increases described above. Some of
the larger decreases include:
$3.6 million decrease in TSW’s SAP sup-
port allocation
$2.2 million decrease in the Information
Technology Fund’s cost allocation to the
General Fund
$2.0 million decrease related to park
improvement projects
16
General Fund Overview: Expenditure
Office of the Independent Budget Analyst
April 2017
Transfers Out
Transfers Out show a net decrease for the
General Fund of $11.7 million. Some of the
larger decreases include:
$7.7 million net decrease in the TSW
budget:
Increases of $3.0 million are related
to streetlight upgrades and sidewalk
repair and replacement
These increases are more than off-
set by the removal of $10.6 million
in FY 2016 budget items that were
identified as one-time expenditures
Other decreases include the removal of
FY 2016 one-time transfers to Capital
Improvements Program (CIP) projects:
$5.1 million for the Police Computer
Aided Dispatch (CAD) system
$5.0 million for the Bayside Fire Sta-
tion
$5.3 million for facilities work
Increases to Transfers Out are partially off-
setting to the decreases described above,
some of which include:
$7.6 million General Fund Reserve con-
tribution increase (For additional infor-
mation see the General Fund Reserve
section of this report under Significant
Citywide Issues.)
$2.8 million Public Liability Reserve con-
tribution increase
Capital Expenditures
The largest change in the Capital Expendi-
tures budget is in TSW, with a decrease of
$1.6 million. This decrease is largely due to
removal of the FY 2016 one-time expendi-
tures for vehicles related to the street
sweeping program.
Salaries and Wages Considerations
An area that we have discussed in prior re-
ports is vacation pay in lieu (pay in lieu of
annual leave), which is budgeted at $5.1 mil-
lion, the same amount as FY 2016.
Over the past five completed fiscal years
(FY 2011 through FY 2015), pay in lieu of
annual leave expenditures have averaged
approximately $7.1 million and been over-
budget. For FY 2016, the Mid-Year projec-
tion for vacation pay in lieu expenditures is
$6.8 million, or $1.7 million over budget.
The Mid-Year projection shows vacancy
savings offsetting other salary and wages
overages, including vacation pay and lieu,
termination pay, and overtime. Since vacan-
cy savings for FY 2017 has been increased
by $8.9 million, there may not be as much
leeway to compensate for these other over-
ages, should they occur in FY 2017 (and de-
pending on how quickly new positions can
be filled).
Most of vacation pay in lieu is budgeted in
three departments: Police, Fire-Rescue and
Park and Recreation. Some other depart-
ments may be comfortable projecting these
expenditures. Although pay in lieu of annual
leave is a difficult expenditure type to fore-
cast, we recommend that the City examine
potential methodologies for estimating pay
in lieu, so that a more accurate budget for
those expenditures can be established.
17
Office of the Independent Budget Analyst
April 2016
General Fund Overview: Revenue
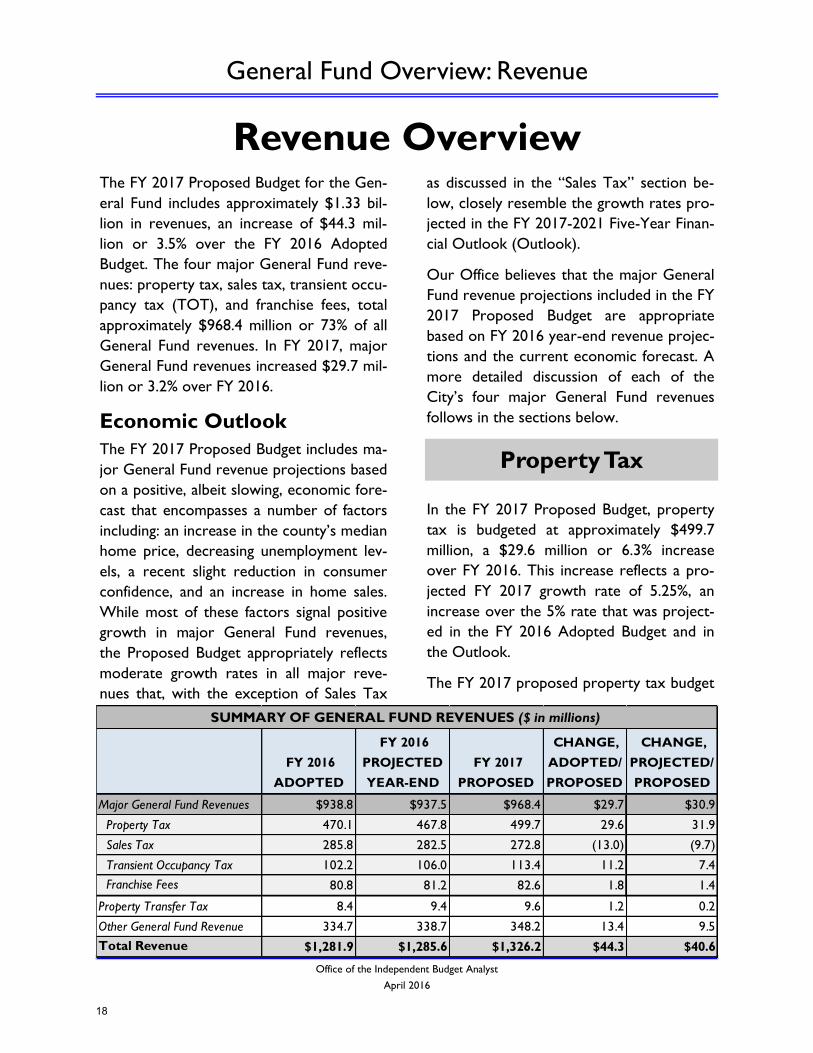
Revenue Overview The FY 2017 Proposed Budget for the Gen-
eral Fund includes approximately $1.33 bil-
lion in revenues, an increase of $44.3 mil-
lion or 3.5% over the FY 2016 Adopted
Budget. The four major General Fund reve-
nues: property tax, sales tax, transient occu-
pancy tax (TOT), and franchise fees, total
approximately $968.4 million or 73% of all
General Fund revenues. In FY 2017, major
General Fund revenues increased $29.7 mil-
lion or 3.2% over FY 2016.
Economic Outlook
The FY 2017 Proposed Budget includes ma-
jor General Fund revenue projections based
on a positive, albeit slowing, economic fore-
cast that encompasses a number of factors
including: an increase in the county’s median
home price, decreasing unemployment lev-
els, a recent slight reduction in consumer
confidence, and an increase in home sales.
While most of these factors signal positive
growth in major General Fund revenues,
the Proposed Budget appropriately reflects
moderate growth rates in all major reve-
nues that, with the exception of Sales Tax
as discussed in the “Sales Tax” section be-
low, closely resemble the growth rates pro-
jected in the FY 2017-2021 Five-Year Finan-
cial Outlook (Outlook).
Our Office believes that the major General
Fund revenue projections included in the FY
2017 Proposed Budget are appropriate
based on FY 2016 year-end revenue projec-
tions and the current economic forecast. A
more detailed discussion of each of the
City’s four major General Fund revenues
follows in the sections below.
In the FY 2017 Proposed Budget, property
tax is budgeted at approximately $499.7
million, a $29.6 million or 6.3% increase
over FY 2016. This increase reflects a pro-
jected FY 2017 growth rate of 5.25%, an
increase over the 5% rate that was project-
ed in the FY 2016 Adopted Budget and in
the Outlook.
The FY 2017 proposed property tax budget
Property Tax
FY 2016
ADOPTED
FY 2016
PROJECTED
YEAR-END
FY 2017
PROPOSED
CHANGE,
ADOPTED/
PROPOSED
CHANGE,
PROJECTED/
PROPOSED
Major General Fund Revenues $938.8 $937.5 $968.4 $29.7 $30.9
Property Tax 470.1 467.8 499.7 29.6 31.9
Sales Tax 285.8 282.5 272.8 (13.0) (9.7)
Transient Occupancy Tax 102.2 106.0 113.4 11.2 7.4
Franchise Fees 80.8 81.2 82.6 1.8 1.4
Property Transfer Tax 8.4 9.4 9.6 1.2 0.2
Other General Fund Revenue 334.7 338.7 348.2 13.4 9.5
Total Revenue $1,281.9 $1,285.6 $1,326.2 $44.3 $40.6
SUMMARY OF GENERAL FUND REVENUES ($ in millions)
18
Office of the Independent Budget Analyst
April 2016
General Fund Overview: Revenue
is a $31.9 million or 6.8% increase over the
year-end property tax projection included
in the Mid-Year Budget Monitoring Report
(Mid-Year), a larger change than the in-
crease of the FY 2017 Proposed Budget
over the FY 2016 Adopted Budget. This
larger difference is due to a projected de-
crease in residual Redevelopment Property
Tax Trust Fund (RPTTF) payments to the
City in FY 2016 as a result of reinstated
recognized obligations on the City’s most
recent Recognized Obligation Payment
Schedule (ROPS), as opposed to a reflection
of a decline in the real estate market.
Therefore, our Office believes that the FY
2017 proposed property tax growth rate is
appropriate as home prices and home sales
in San Diego continue to rise, and as overall
economic indicators remain positive.
Our Office notes that several Councilmem-
bers have expressed interest in dedicating
RPTTF payments to former redevelopment
areas. In the FY 2017 Proposed Budget, re-
sidual RPTTF is projected to be $13.6 mil-
lion and is recognized as unrestricted Gen-
eral Fund revenue, all of which has been ful-
ly allocated to support proposed General
Fund expenditures. If the City Council is
interested in dedicating RPTTF to former
redevelopment areas, a policy could be con-
sidered for future fiscal years. If the policy
were in place for FY 2017, $13.6 million of
proposed budget expenditures would need
to be reduced or supported with any as-yet
unallocated General Fund resources.
Property Transfer Tax
The FY 2017 Proposed Budget includes a
budget of $9.6 million for property transfer
tax, an increase of $1.2 million or 14.7%
over the FY 2016 Adopted Budget. Proper-
ty transfer tax is revenue that the City re-
ceives from the sale of real property. The
FY 2017 Proposed Budget maintains the 3%
growth rate assumed in FY 2016, and is
based on on-going moderate growth in
home sales and prices.
The FY 2017 Proposed Budget for sales tax
revenue is $272.8 million. This represents
an approximately $9.7 million or 3.4% de-
crease from the Mid Year’s projected year-
end sales tax receipts of $282.5 million
which is in turn $3.3 million below the
$285.8 million that was included in the FY
2016 Adopted Budget.
The Proposed Budget assumes that actual
taxable sales will increase by 3.5% through-
out FY 2017. The decrease in total receipts
is due to the end of the Triple-Flip
(additional details are provided below),
which resulted in a one-time increase in
sales tax receipts in FY 2016 of $12.7 mil-
lion.
While growth in taxable sales in FY 2016
has been less than projected, as discussed
below, the proposed growth rate of 3.5% is
consistent with the most recent forecasts
for taxable sales in California from UCLA
Anderson, and with local projections from
HDL Companies, the City’s sales tax con-
sultant. Actual receipts should be moni-
tored closely throughout the year.
Taxable Sales Growth Rate
Sales tax revenue is highly sensitive to eco-
nomic conditions, including job growth,
consumer spending, and business invest-
ment. While the overall economy has con-
tinued to slowly grow, sales tax revenues in
Sales Tax
19
Office of the Independent Budget Analyst
April 2016
General Fund Overview: Revenue
FY 2016 have largely lagged behind, with
annual sales tax growth in the first three
quarters of the year averaging just 0.8%. A
steep decline in fuel prices and associated
sales taxes on that fuel has contributed sig-
nificantly to the slow growth seen in FY
2016, but other categories of taxable
sales—including general consumer goods—
have also shown only small amounts of
growth.
Because the decline in fuel prices has now
impacted taxable sales for a full year, the
proposed year-over-year growth rate of
3.5% is less likely to be impacted by that
decline in FY 2017, as each quarter in FY
2016 to which the FY 2017 growth rate will
be applied has already experienced the re-
duction in fuel prices. As noted above, how-
ever, it will still be important to continually
monitor quarterly sales tax revenue
throughout FY 2017.
End of the Triple-Flip
As we noted in our review of the FY 2016
Proposed Budget, the end of the Triple-Flip
was associated with a one-time increase to
sales tax revenues in FY 2016. The Triple-
Flip required local governments to shift one
-quarter of the Bradley-Burns Sales and Use
Tax to the State in exchange for receiving
an equivalent amount of property tax in an
annual true-up payment. This payment
lagged behind the transfer of sales-tax reve-
nue.
Because the Triple-Flip ended in FY 2016,
the final true-up payment resulted in an ad-
ditional $12.7 million in revenue recognized
that year, and the City began collecting the
full one-cent amount allowed by the Bradley
-Burns sales tax. In FY 2017, the full one-
cent will be collected, and no transfer or
associated true-up payment will occur.
The General Fund is allocated 5.5 cents of
the City’s total 10.5 cent TOT rate per the
San Diego Municipal Code. In FY 2017, the
City’s 10.5 cent allocation is projected to be
approximately $216.5 million, while the
General Fund portion of the TOT totals
$113.4 million, an increase of $11.2 million
or 11% over FY 2016. The FY 2017 Pro-
posed Budget maintains the 6% growth rate
in TOT that was incorporated into the
most recent Outlook and the FY 2016
Adopted Budget.
The 6% growth rate in TOT is also con-
sistent with the Tourism Marketing Dis-
trict’s (TMD) projected rate, and tempers
the increase to 7% growth incorporated
into the Mid-Year Report, or the 8%
growth rate that is expected in the FY 2016
Year-End Budget Monitoring Report that
will be released in May. While no immediate
challenges to the 6% growth rate are pro-
jected for FY 2017, the most recent Out-
look included positive but declining TOT
growth rate projections after FY 2017. Our
Office agrees with those projections, and
will continue to closely monitor TOT over
the upcoming fiscal year.
The FY 2017 Proposed Budget projects
General Fund franchise fees at $82.6 million,
an increase of $1.8 million or 2.2% over the
FY 2016 Adopted Budget.
FY 2016 franchise fees are currently pro-
Franchise Fees
Transient Occupancy Tax
20
Office of the Independent Budget Analyst
April 2016
General Fund Overview: Revenue
jected to be $81.2 million at year-end,
$417,000 above franchise fee revenues in
the FY 2016 Budget. General Fund franchise
fees in the FY 2017 Proposed Budget repre-
sent a 1.7% increase over projected FY
2016 revenues.
Franchise fee revenue is derived primarily
from three sources: 1) a 3% San Diego Gas
& Electric (SDG&E) surcharge on total
gross sales; 2) a 5% surcharge on cable tele-
vision provider subscriptions in the City;
and 3) charges to private refuse haulers
based on tonnage of refuse disposed. Addi-
tional smaller franchise fee revenues are
received from other energy, railroad, and
towing franchises in the City.
SDG&E
The largest source in General Fund fran-
chise fee revenue is the surcharge on
SDG&E, which accounts for $49.2 million,
or 60.0%, of the franchise fees included in
the FY 2017 Proposed Budget. This is 3.7%
above current year-end projections for FY
2016.
Revenues derived from SDG&E are difficult
to forecast due to the City’s inability to re-
view SDG&E’s financial forecasts for elec-
tricity and natural gas rates, and sales vol-
ume, as SDG&E is a publicly traded compa-
ny (under its parent company, Sempra Ener-
gy). Additionally, the annual percent change
in total revenue received from SDG&E has
been volatile, with individual year growths
ranging from -7.4% in 2010 to 21.1% in
2015.
Cable
The second largest portion of franchise fee
revenue is from cable television franchise
fees, which total $18.7 million, or 22.6%, of
franchise fees in the Proposed Budget. This
amount assumes no growth or decline in
cable revenue over projected FY 2016 re-
ceipts.
Growth in cable television franchise fee rev-
enue showed year-over-year declines from
FY 2011 to FY 2014, with negative growth
occurring in FY 2014. While cable revenue
did rise in FY 2015, current FY 2016 projec-
tions show no growth.
Refuse Hauling
Refuse hauler franchise fees and revenue
generated from the Sycamore landfill are
based on total refuse tonnage hauled and
disposed of, respective. Tonnage is directly
tied to growth in the residential housing
market and general economic activity, as
homeowners remodel their homes, pur-
chase new consumer goods, and/or replace
older items that are discarded.
The City’s General Fund refuse hauler fran-
chise fee revenue in the Proposed Budget is
$10.5 million, or 12.7% of franchise fees in
the Proposed Budget. This amount includes
an increase of $850,000 over projected year
-end receipts.
21
Office of the Independent Budget Analyst
April 2016
Significant Citywide Issues: General Fund Reserve
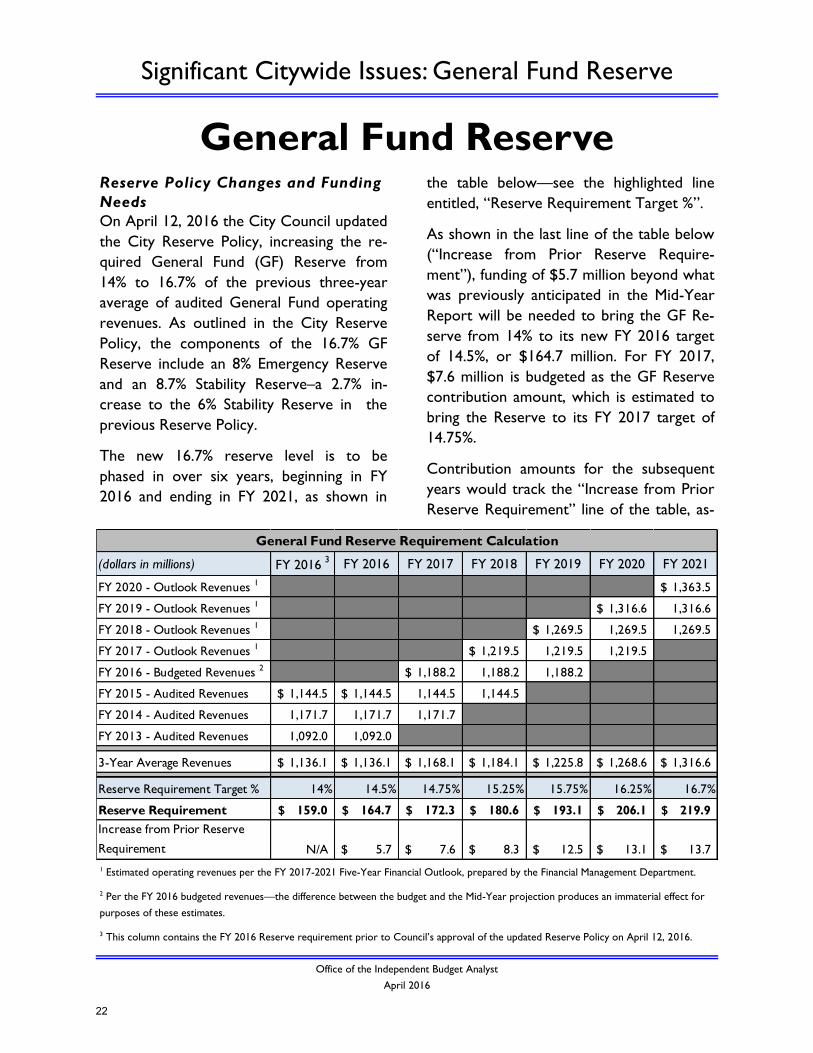
General Fund Reserve Reserve Policy Changes and Funding
Needs
On April 12, 2016 the City Council updated
the City Reserve Policy, increasing the re-
quired General Fund (GF) Reserve from
14% to 16.7% of the previous three-year
average of audited General Fund operating
revenues. As outlined in the City Reserve
Policy, the components of the 16.7% GF
Reserve include an 8% Emergency Reserve
and an 8.7% Stability Reserve–a 2.7% in-
crease to the 6% Stability Reserve in the
previous Reserve Policy.
The new 16.7% reserve level is to be
phased in over six years, beginning in FY
2016 and ending in FY 2021, as shown in
the table below—see the highlighted line
entitled, “Reserve Requirement Target %”.
As shown in the last line of the table below
(“Increase from Prior Reserve Require-
ment”), funding of $5.7 million beyond what
was previously anticipated in the Mid-Year
Report will be needed to bring the GF Re-
serve from 14% to its new FY 2016 target
of 14.5%, or $164.7 million. For FY 2017,
$7.6 million is budgeted as the GF Reserve
contribution amount, which is estimated to
bring the Reserve to its FY 2017 target of
14.75%.
Contribution amounts for the subsequent
years would track the “Increase from Prior
Reserve Requirement” line of the table, as-
1 Estimated operating revenues per the FY 2017-2021 Five-Year Financial Outlook, prepared by the Financial Management Department.
2 Per the FY 2016 budgeted revenues—the difference between the budget and the Mid-Year projection produces an immaterial effect for
purposes of these estimates.
3 This column contains the FY 2016 Reserve requirement prior to Council’s approval of the updated Reserve Policy on April 12, 2016.
(dollars in millions) FY 2016 3 FY 2016 FY 2017 FY 2018 FY 2019 FY 2020 FY 2021
FY 2020 - Outlook Revenues 1
1,363.5$
FY 2019 - Outlook Revenues 1
1,316.6$ 1,316.6
FY 2018 - Outlook Revenues 1
1,269.5$ 1,269.5 1,269.5
FY 2017 - Outlook Revenues 1
1,219.5$ 1,219.5 1,219.5
FY 2016 - Budgeted Revenues 2
1,188.2$ 1,188.2 1,188.2
FY 2015 - Audited Revenues 1,144.5$ 1,144.5$ 1,144.5 1,144.5
FY 2014 - Audited Revenues 1,171.7 1,171.7 1,171.7
FY 2013 - Audited Revenues 1,092.0 1,092.0
3-Year Average Revenues 1,136.1$ 1,136.1$ 1,168.1$ 1,184.1$ 1,225.8$ 1,268.6$ 1,316.6$
Reserve Requirement Target % 14% 14.5% 14.75% 15.25% 15.75% 16.25% 16.7%
Reserve Requirement 159.0$ 164.7$ 172.3$ 180.6$ 193.1$ 206.1$ 219.9$
Increase from Prior Reserve
Requirement N/A 5.7$ 7.6$ 8.3$ 12.5$ 13.1$ 13.7$
General Fund Reserve Requirement Calculation
22
Office of the Independent Budget Analyst
April 2016
Significant Citywide Issues: General Fund Reserve
suming there is no available Excess Equity
and no surpluses or deficits in those future
years. These amounts are based on project-
ed revenues included in the most recent
Five-Year Outlook, which are shown in the
top section of the table on the previous
page. These figures will change with actual
results.
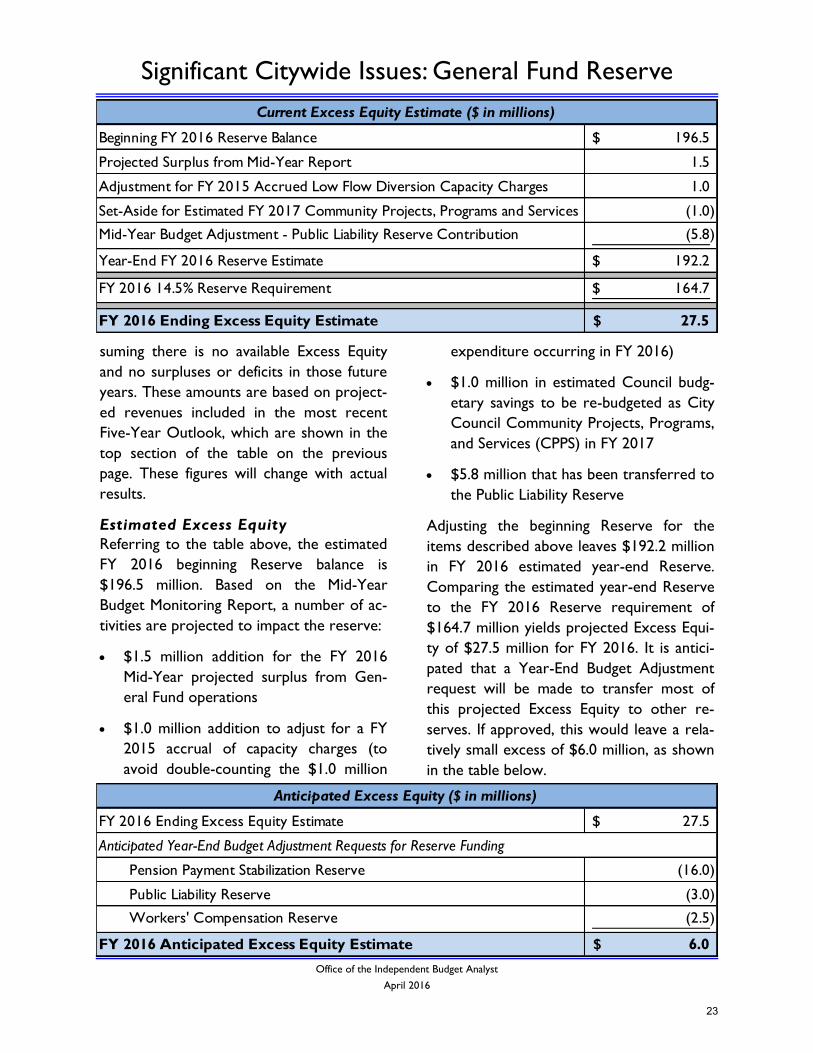
Estimated Excess Equity
Referring to the table above, the estimated
FY 2016 beginning Reserve balance is
$196.5 million. Based on the Mid-Year
Budget Monitoring Report, a number of ac-
tivities are projected to impact the reserve:
$1.5 million addition for the FY 2016
Mid-Year projected surplus from Gen-
eral Fund operations
$1.0 million addition to adjust for a FY
2015 accrual of capacity charges (to
avoid double-counting the $1.0 million
expenditure occurring in FY 2016)
$1.0 million in estimated Council budg-
etary savings to be re-budgeted as City
Council Community Projects, Programs,
and Services (CPPS) in FY 2017
$5.8 million that has been transferred to
the Public Liability Reserve
Adjusting the beginning Reserve for the
items described above leaves $192.2 million
in FY 2016 estimated year-end Reserve.
Comparing the estimated year-end Reserve
to the FY 2016 Reserve requirement of
$164.7 million yields projected Excess Equi-
ty of $27.5 million for FY 2016. It is antici-
pated that a Year-End Budget Adjustment
request will be made to transfer most of
this projected Excess Equity to other re-
serves. If approved, this would leave a rela-
tively small excess of $6.0 million, as shown
in the table below.
196.5$
Projected Surplus from Mid-Year Report 1.5
Adjustment for FY 2015 Accrued Low Flow Diversion Capacity Charges 1.0
Set-Aside for Estimated FY 2017 Community Projects, Programs and Services (1.0)
Mid-Year Budget Adjustment - Public Liability Reserve Contribution (5.8)
192.2$
FY 2016 14.5% Reserve Requirement 164.7$
27.5$
Current Excess Equity Estimate ($ in millions)
Beginning FY 2016 Reserve Balance
Year-End FY 2016 Reserve Estimate
FY 2016 Ending Excess Equity Estimate
Anticipated Excess Equity ($ in millions)
FY 2016 Ending Excess Equity Estimate 27.5$
Anticipated Year-End Budget Adjustment Requests for Reserve Funding
Pension Payment Stabilization Reserve (16.0)
Public Liability Reserve (3.0)
Workers' Compensation Reserve (2.5)
FY 2016 Anticipated Excess Equity Estimate 6.0$
23
Significant Citywide Issues: Public Liability Funds
Office of the Independent Budget Analyst
April 2016
Public Liability Funds
The Public Liability (PL) Funds are support-
ed by transfers from the General Fund’s
Citywide Program Expenditures budget.
The PL Funds section will be discussed in
the PL Operating Fund and PL Reserve Fund
sub-sections below.
Public Liability Operating Fund
The FY 2017 Proposed Budget includes
$25.2 million to support FY 2017 PL oper-
ating expenses, up $6.6 million from the
$18.6 million in the FY 2016 Adopted Budg-
et.
For FY 2016, additional resources have
been needed above the $18.6 million
Adopted Budget amount. FY 2016 claims
payouts, expenses, and insurance for the PL
Operating Fund are estimated to be $74.7
million. These projected costs are offset
with the $18.6 million budgeted and trans-
ferred from the General Fund, as well as the
following sources:
$24.4 million in beginning cash balance
$11.4 million in insurance reimburse-
ments for current year claims expendi-
tures
$15.0 million from the PL Reserve to
help cover Aglio settlement expenses
$2.0 million from the De Anza Operat-
ing Fund for Aglio settlement expenses
$3.1 million additional contribution
amount noted in the Mid-Year Report
for increased claims and settlement pay-
ments
Public Liability Reserve Fund
For FY 2016 there was no budgeted Gen-
eral Fund transfer to support the PL Re-
serve, as the required amounts had been
pre-funded in FY 2015. However, as stated
above, the PL Reserve was reduced in FY
2016 by a $15.0 million transfer to the PL
Operating Fund.
To increase the Reserve balance, a FY 2016
Mid-Year Budget Adjustment of $5.8 million
was requested by the Financial Management
Department and approved by Council. Also,
a $5.0 million insurance reimbursement
(related to the De La Fuente settlement)
increased the PL Reserve balance.
For the PL Reserve to reach its FY 2016
40% reserve requirement of $36.7 million, it
is anticipated that the PL Reserve will need
an additional $3.0 million transfer from
General Fund Excess Equity. This amount is
anticipated to be included in the FY 2016
Year-End Budget Adjustment requests.
The overall reserve target of 50% funding of
the PL actuarial liability is $45.9 million.
This is based on the average value of annual
actuarial liabilities for the three fiscal years
ending in 2015, which equals $91.8 million.
The 50% target is anticipated to be achieved
with an additional $9.2 million from FY
2017 through FY 2019, with $2.8 million
included in the FY 2017 Proposed Budget.
24
Significant Citywide Issues: Workers’ Compensation
Office of the Independent Budget Analyst
April 2016
Workers’ Compensation Fund Estimated costs for Workers’ Compensa-
tion (WC) are based on a three-year aver-
age of actual annual payments. WC rates
are applied to employees’ salaries and re-
flect a blend of claims cost estimates (which
are allocated by job classification) and the
allocated reserve contribution, as necessary.
The estimated costs are distributed accord-
ingly in the budget system and categorized
as Fringe Benefit expenditures.
The $30.3 million budgeted in the FY 2017
Proposed Budget for citywide fringe pay-
ments to the WC Fund has increased by
$5.1 million, from $25.2 million in the FY
2016 Adopted Budget. Of the $5.1 million
increase, $2.5 million is related to the esti-
mated increase in the reserve requirement;
and $2.6 million is related to estimated in-
creases in operating costs.
The General Fund portion of the WC budg-
et is increasing by $4.1 million, from $20.6
million to $24.7 million. The total portion of
WC Fringe Benefits costs attributable to
the General Fund budget is 81.6%.
Workers Compensation Reserve
The overall WC reserve target in the City
Reserve Policy is 25% funding of the WC
actuarial liability, which is based on the
most recent three-year average of actuarial
liabilities. With the June 30, 2015 valuation
completed, that average increased from
$193.7 million to $218.1 million. Thus, the
25% reserve target increased by $6.1 mil-
lion, from $48.4 million to $54.5 million.
Although the target amount changed, the
25% funding requirement per the City Re-
serve Policy remains the same.
To help meet the FY 2016 target amount,
$3.1 million in additional Reserve contribu-
tions (citywide) are projected, per the Mid-
Year Report. Furthermore, it is anticipated
that the WC Reserve will need an addition-
al $3.0 million transfer ($2.5 million from
General Fund Excess Equity) to reach the
$54.5 million Reserve target. This amount is
anticipated to be included in the FY 2016
Year-End Budget Adjustment requests.
25
Significant Citywide Issues: LTD Fund
Office of the Independent Budget Analyst
April 2016
Long-Term Disability Fund Estimated costs for Long-Term Disability
(LTD) are based on a three-year average of
actual annual payments combined with an
annual reserve contribution, as necessary. A
single LTD rate is determined and applied
to employees’ salaries. Estimated costs are
distributed accordingly in the budget system
and categorized as Fringe Benefit expendi-
tures.
The FY 2017 proposed budget for citywide
fringe payments to the LTD Fund is $2.1
million ($1.4 million General Fund). This is
unchanged from the 2016 Adopted Budget.
For both years, only pay-go amounts are
budgeted, as the reserve requirement has
been met. The total portion of LTD Fringe
Benefits costs attributable to the General
Fund budget is 67.8%.
Per the City Reserve Policy, the LTD over-
all target reserve level is 100% of the out-
standing actuarial liability for LTD. The out-
standing liability is based on the average of
the annual actuarial liabilities for the three
most recent fiscal years. With the June 30,
2015 valuation completed, that average de-
creased from $18.3 million to $14.9 million.
The current reserve balance of $18.4 mil-
lion exceeds that target by approximately
$3.5 million.
Lastly, the City has negotiated and will con-
tinue to negotiate the LTD program and its
administration with its recognized employee
organizations. Negotiations are in accord-
ance with the City’s Memorandums of Un-
derstanding (MOUs) with its employee or-
ganizations and the Meyers-Milias-Brown
Act (MMBA), which governs labor-
management relations and collective bar-
gaining in California.
26
Significant Citywide Issues: OPEB
Office of the Independent Budget Analyst
April 2016
Other Post-Employment Benefits
Retiree health obligations, or Other Post-
Employment Benefits (OPEB), total $60.7
million ($39.9 million for the General Fund)
in the FY 2017 Proposed Budget.
Currently, the City provides a defined bene-
fit plan (DB) for employees hired before July
1, 2005. This benefit was restructured for
employees retiring on or after April 1,
2012.(1)
In the DB retiree medical plan, vested em-
ployees are provided a specific health bene-
fit at retirement. Effective July 1, 2009 the
vesting time requirement for the full DB
benefit is 20 years.
For employees retiring before the DB retir-
ee health benefit restructure became effec-
tive (April 1, 2012), the City has frozen the
automatic escalator on the retiree health
benefit for POA and AFSCME Local 127
employees retiring on or after July 1, 2009
and before April 1, 2012. The benefit is fro-
zen at $8,883 per year.
Additionally, for General Members there is
a separate defined contribution Retiree
Medical Trust for employees hired on or
after July 1, 2009. The plan requires both an
employee contribution and City match of
0.25% of an employee’s base compensation.
Fiscal Effects of Restructuring the
Retiree Health Benefit
The effect of the retiree health benefit re-
structure of the City’s defined benefit re-
tiree health plans is evident in the most re-
cent actuarial valuation for the City, for the
period ending June 30, 2015. The OPEB Un-
funded Actuarial Liability (UAL) at June 30,
2015 is $537.3 million, down from $1.1 bil-
lion at June 30, 2011.
However, since June 30, 2013, the UAL has
increased by $93.2 million—from $444.1
million at June 30, 2013 to $537.3 million at
June 30, 2015. One of the main factors for
the increase occurred in the FY 2015 valua-
tion, where there was a “change in mortali-
ty assumption, which resulted in an increase
in the Actuarial Accrued Liability of about
11%,” as stated in the valuation. Another
notable factor in the UAL increase occurred
in the FY 2014 valuation, with adjustments
to account for the higher costs associated
with non-Medicare participants over the age
of 65.
The June 30, 2015 OPEB Annual Required
Contribution (ARC) projected for FY 2017
is $47.3 million, as compared to the June
30, 2013 valuation’s projected FY 2015
ARC of $38.1 million. The $47.3 million
ARC amount is essentially related to the
amortization of the UAL of the defined ben-
efit plan, which is closed to new partici-
pants.
The ARC figure does not reflect the pay-
ment components the City plans to make
(1)There are three options associated with the restructured retiree health benefit: Option A is a defined benefit with a full annual allow-
ance (at 20 years of service) equal to $8,883 per year, with a 2 percent annual escalator beginning FY 2014; Option B is a defined benefit
with a full annual allowance (at 20 years of service) equal to $5,500 per year, with no escalator; Option C is a defined contribution plan
projected to yield $8,500 annually (with 20 years of service). Options A and B require that employees make nonrefundable contributions.
27
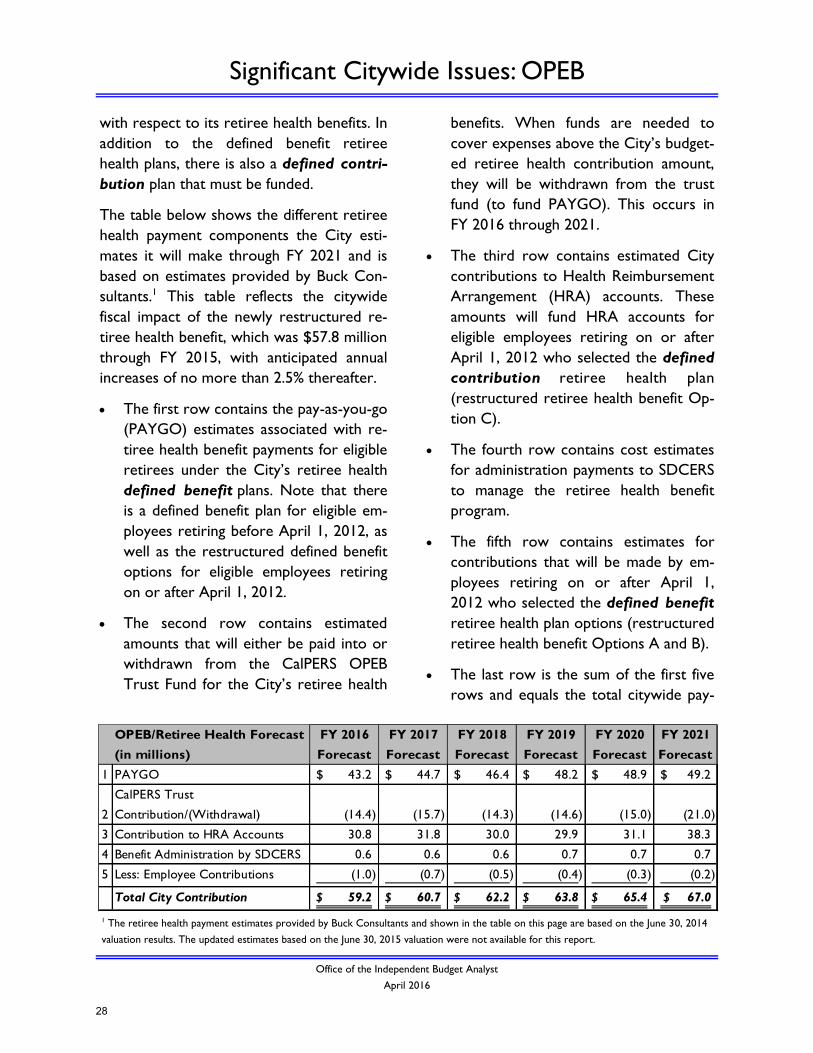
Significant Citywide Issues: OPEB
Office of the Independent Budget Analyst
April 2016
with respect to its retiree health benefits. In
addition to the defined benefit retiree
health plans, there is also a defined contri-
bution plan that must be funded.
The table below shows the different retiree
health payment components the City esti-
mates it will make through FY 2021 and is
based on estimates provided by Buck Con-
sultants.1 This table reflects the citywide
fiscal impact of the newly restructured re-
tiree health benefit, which was $57.8 million
through FY 2015, with anticipated annual
increases of no more than 2.5% thereafter.
The first row contains the pay-as-you-go
(PAYGO) estimates associated with re-
tiree health benefit payments for eligible
retirees under the City’s retiree health
defined benefit plans. Note that there
is a defined benefit plan for eligible em-
ployees retiring before April 1, 2012, as
well as the restructured defined benefit
options for eligible employees retiring
on or after April 1, 2012.
The second row contains estimated
amounts that will either be paid into or
withdrawn from the CalPERS OPEB
Trust Fund for the City’s retiree health
benefits. When funds are needed to
cover expenses above the City’s budget-
ed retiree health contribution amount,
they will be withdrawn from the trust
fund (to fund PAYGO). This occurs in
FY 2016 through 2021.
The third row contains estimated City
contributions to Health Reimbursement
Arrangement (HRA) accounts. These
amounts will fund HRA accounts for
eligible employees retiring on or after
April 1, 2012 who selected the defined
contribution retiree health plan
(restructured retiree health benefit Op-
tion C).
The fourth row contains cost estimates
for administration payments to SDCERS
to manage the retiree health benefit
program.
The fifth row contains estimates for
contributions that will be made by em-
ployees retiring on or after April 1,
2012 who selected the defined benefit
retiree health plan options (restructured
retiree health benefit Options A and B).
The last row is the sum of the first five
rows and equals the total citywide pay-
1 The retiree health payment estimates provided by Buck Consultants and shown in the table on this page are based on the June 30, 2014
valuation results. The updated estimates based on the June 30, 2015 valuation were not available for this report.
OPEB/Retiree Health Forecast
(in millions)
FY 2016
Forecast
FY 2017
Forecast
FY 2018
Forecast
FY 2019
Forecast
FY 2020
Forecast
FY 2021
Forecast
1 PAYGO 43.2$ 44.7$ 46.4$ 48.2$ 48.9$ 49.2$
2
CalPERS Trust
Contribution/(Withdrawal) (14.4) (15.7) (14.3) (14.6) (15.0) (21.0)
3 Contribution to HRA Accounts 30.8 31.8 30.0 29.9 31.1 38.3
4 Benefit Administration by SDCERS 0.6 0.6 0.6 0.7 0.7 0.7
5 Less: Employee Contributions (1.0) (0.7) (0.5) (0.4) (0.3) (0.2)
Total City Contribution 59.2$ 60.7$ 62.2$ 63.8$ 65.4$ 67.0$
28
Significant Citywide Issues: OPEB
Office of the Independent Budget Analyst
April 2016
ments to be made each fiscal year.
Annual Required Contribution (ARC)
Despite its name, the City is not required
to pay the OPEB ARC, but as of FY 2008
the cumulative difference between the
ARCs and the payments made by the City is
reported as the Net OPEB Liability in the
financial statements. The full amount of the
unfunded OPEB liability is disclosed in the
notes to the financial statements, in accord-
ance with Governmental Accounting Stand-
ards Board (GASB) requirements.
New GASB requirements will be in effect
for FY 2018 which parallel the recently im-
plemented pension requirements in the
City’s FY 2015 CAFR (Comprehensive An-
nual Financial Report). These requirements
include incorporating the total OPEB liabil-
ity less the fair value of assets, or Net OPEB
Liability, into the citywide financial state-
ments.
Information regarding the OPEB ARC and
Unfunded Actuarial Liability are available in
the June 30, 2015 valuation—which was
performed by Buck Consultants and provid-
ed to the City in December 2015.
29
Significant Citywide Issues: Pension
Office of the Independent Budget Analyst
April 2016
Pension Defined Benefit (DB) Pension
The FY 2017 Proposed Budget includes
$261.1 million for the Actuarially Deter-
mined Contribution (ADC), which is the
City’s defined benefit (DB) pension contri-
bution requirement. This is an increase of
$6.2 million from the FY 2016 Adopted
Budget amount of $254.9 million. The Gen-
eral Fund portion of the FY 2017 budgeted
payment is $191.0 million—an increase of
$3.3 million from the FY 2016 Adopted
Budget of $187.7 million.
The FY 2017 ADC of $261.1 million is
based on the FY 2015 actuarial valuation.
The valuation shows that the pension sys-
tem’s Unfunded Actuarial Liability (UAL)
totals $2.0 billion as of June 30, 2015.
The City’s pension system liabilities as of
June 30, 2015 are funded at a rate of 75.6%
—increased from the 74.2% funding ratio at
June 30, 2014. The ADC is 7.8% of total
budgeted expenditures for the City and is
14.4% of budgeted expenditures for the
General Fund.
The City’s budgeting system provides a rela-
tively precise allocation of the ADC, and
other fringe benefits, among employees.
The ADC budget distribution is based on
actual filled positions and is calculated based
on percentages of salaries, from information
contained in the pension system’s actuarial
valuation.
Increases to the Defined Benefit
ADC from Prior Assumptions
The FY 2017 ADC of $261.1 million is
$13.0 million higher than the $248.1 million
contribution estimated in the previous (FY
2014) valuation, which was also included in
the FY 2017-2021 Five-Year Outlook. The
increase is largely due to the items outlined
below.
A $6.8 million increase related to
SDCERS Board-approved changes in
economic assumptions. The Board ap-
proved reducing both the discount rate
and the wage inflation rate assumptions
by 0.125% for the FY 2015 valuation,
and again by 0.125% for FY 2016.
A $5.4 million increase related to a low-
er than assumed investment return for
FY 2015. The FY 2015 investment re-
turn of 3.3% was lower than the 7.25%
return assumed in the FY 2014 valua-
tion.
Future ADC Considerations
There are a couple of items that could po-
tentially impact the City’s FY 2018 ADC or
other funding requirements. First, pension
fund investment returns have been trending
at less than 7.125%, the current assumed
rate of return. If the annual return for FY
2016 ends up being less than the 7.125%
return assumed when calculating the ADC,
there would be an investment experience
loss that could increase the FY 2018 ADC.
Whatever the FY 2016 investment return
ends up being, the preliminary impact will
likely be quantifiable by August 2016.
Second, the SDCERS actuary, Cheiron, is in
the process of completing an “experience
study” for Board review this coming July.
The experience study involves historical
30
Significant Citywide Issues: Pension
Office of the Independent Budget Analyst
April 2016
analysis of pension plan assumptions, includ-
ing the rate of investment return, wage in-
flation, and retirement and mortality rates.
The period under review is FY 2011
through FY 2015.
The experience study and related analysis
will be the basis for Cheiron’s recommend-
ed changes in the plan’s actuarial assump-
tions. The Board will consider any recom-
mended assumption changes, and any ap-
proved changes would be included in the
calculation of the FY 2018 ADC. Any such
changes would affect estimated ADCs in
future years as well. It is anticipated by
Cheiron that there could be a “meaningful
cost increase (2% to 6%)” related to as-
sumptions regarding mortality.
Pension Impacts of Proposition B
Below is a brief summary of some of the
pension effects of Proposition B, which was
approved by voters in June 2012.
The following pension changes were negoti-
ated with the City’s employee organizations
and agreement for an interim defined con-
tribution (DC) plan was reached. This inter-
im plan is anticipated to be in effect until a
permanent plan can be negotiated.
Employees hired on or after July 20, 2012,
except police officers, are no longer eligible
to participate in the DB pension plan. In-
stead they participate in the Supplemental
Pension Savings Plan H (SPSP-H), which was
previously for hourly employees but was
modified to include these new participants.
Both the City and employees contribute
9.2% and 11% of eligible compensation for
general members and safety members, re-
spectively.
The FY 2017 proposed SPSP-H budget is
$12.7 million citywide. This figure includes
amounts for the interim defined contribu-
tion plan, as well as hourly workers ($11.8
million and $919,000, respectively). The
SPSP-H budget for the interim DC plan has
increased by $2.5 million from FY 2016, pri-
marily due to the assumption that vacant
and new positions will be filled by employ-
ees who will become members of SPSP-H.
Some terms of the interim DC plan include
that employee contributions are mandatory,
employees are 100% vested at all times, and
the terms of future negotiated disability and
death benefits will be retroactive.
Additionally, although new sworn Police
Officers continue to be eligible for the de-
fined benefit plan, Proposition B prescribes
pension plan changes for new sworn officers
hired on or after July 1, 2013. Provisions in
Proposition B include a cap on sworn of-
ficer pensions: 80% of the average of the
highest 36 consecutive months’ compensa-
tion. This cap is reduced by 3% for each
year the employee retires prior to age 55.
Proposition B was challenged by four of the
City’s recognized employee organizations,
alleging a violation of the Meyers-Milias-
Brown Act (MMBA)—the State law that
governs collective bargaining for public
agency employers, like the City. On Decem-
ber 29, 2015 the Public Employment Rela-
tions Board (PERB)—the State administra-
tive body that enforces the MMBA—
decided that the City violated the MMBA by
refusing to meet and confer prior to place-
ment of Proposition B on the June 2012 bal-
lot. The City is appealing the PERB decision
to the California Court of Appeal.
31
Significant Citywide Issues: Infra. & Financing Issues
Office of the Independent Budget Analyst
April 2016
Infrastructure & Financing Issues In December 2015, the City released its
second Five-Year Capital Infrastructure
Planning Outlook (Capital Outlook) for fis-
cal years 2017 through 2021, which identi-
fied known capital needs and funding
sources over the next five years. The Capi-
tal Outlook identified $4.2 billion of capital
needs, and $2.8 billion of available funding
for capital projects through FY 2021. This
leaves a gap of $1.4 billion in needed fund-
ing.
While the Capital Outlook includes many of
the City's important future capital needs, it
does not comprehensively cover all of the
known capital needs, including but not lim-
ited to the following:
Additional Funding for Sidewalk Repairs
New Fire Stations
Facilities identified in the most recent
condition assessments (286 of the 560
General Fund buildings occupied by City
staff or the public)
Facilities and Parks that have pending
condition assessments (about half of the
240 leased General Fund facilities, ap-
proximately 160 developed parks includ-
ing Balboa Park, and approximately 300
Public Utilities buildings)
Convention Center Expansion
Information Technology Improvements
Sea Walls, Piers and Coastal Assets
The following sections provide an overview
of funding included for infrastructure in the
FY 2017 Proposed Budget, and issues and
challenges facing the City as it moves for-
ward in tackling its infrastructure backlog.
Funding for Infrastructure in
FY 2017 Proposed Budget
Cash Funding
In his FY 2015 Adopted Budget, the Mayor
committed to dedicating 50% of each year's
growth in major revenues to infrastructure
spending. Major revenue growth in the FY
2017 Proposed Budget is projected to be
$29.6 million; therefore, $14.8 million rep-
resents the commitment to fund 50% of
that amount. However, the Mayor has
elected to exceed the 50% commitment and
included 71% or $20.9 million of projected
major revenue growth for infrastructure
spending in the FY 2017 Proposed Budget.
Significant infrastructure areas to be ad-
dressed with $20.9 million include:
$11.6 million for flood control and
storm water quality improvement pro-
jects and programs
$4.3 million to repair City streets
$3.2 million to maintain and repair City
facilities, including police stations
$942,000 for a fueling station for clean
Compressed Natural Gas powered vehi-
cles
$850,000 to repair playgrounds and
playground equipment
32
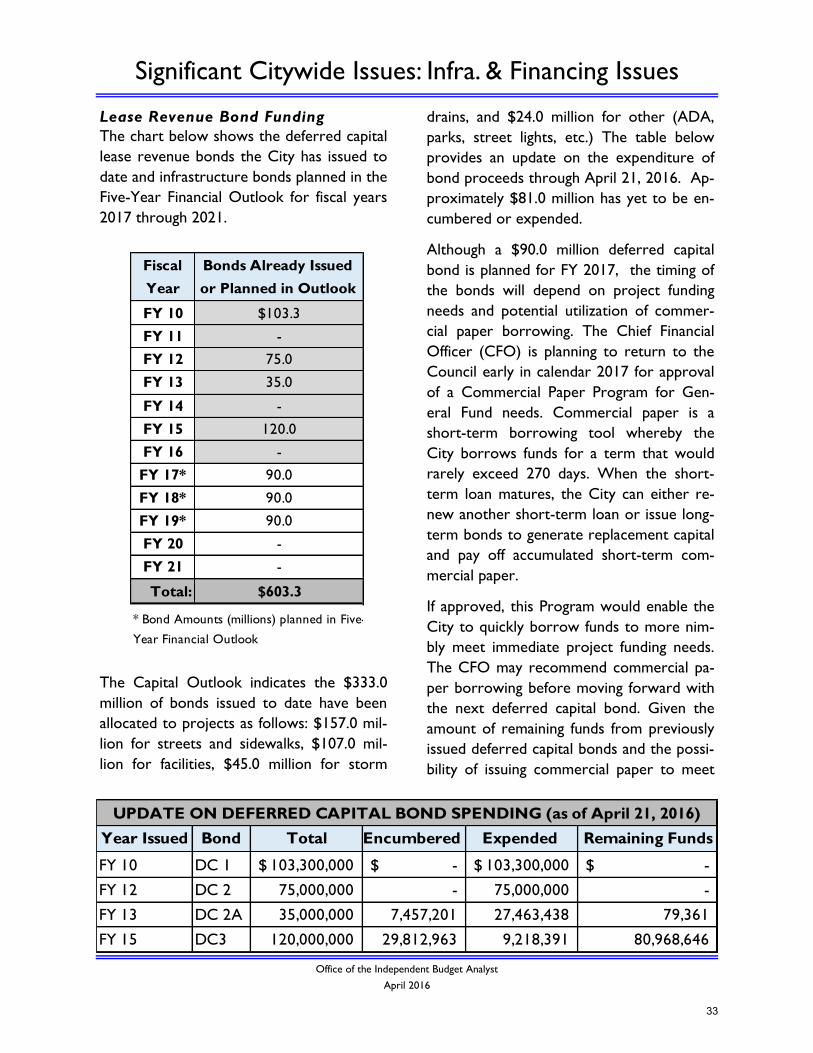
Significant Citywide Issues: Infra. & Financing Issues
Office of the Independent Budget Analyst
April 2016
Lease Revenue Bond Funding
The chart below shows the deferred capital
lease revenue bonds the City has issued to
date and infrastructure bonds planned in the
Five-Year Financial Outlook for fiscal years
2017 through 2021.
The Capital Outlook indicates the $333.0
million of bonds issued to date have been
allocated to projects as follows: $157.0 mil-
lion for streets and sidewalks, $107.0 mil-
lion for facilities, $45.0 million for storm
drains, and $24.0 million for other (ADA,
parks, street lights, etc.) The table below
provides an update on the expenditure of
bond proceeds through April 21, 2016. Ap-
proximately $81.0 million has yet to be en-
cumbered or expended.
Although a $90.0 million deferred capital
bond is planned for FY 2017, the timing of
the bonds will depend on project funding
needs and potential utilization of commer-
cial paper borrowing. The Chief Financial
Officer (CFO) is planning to return to the
Council early in calendar 2017 for approval
of a Commercial Paper Program for Gen-
eral Fund needs. Commercial paper is a
short-term borrowing tool whereby the
City borrows funds for a term that would
rarely exceed 270 days. When the short-
term loan matures, the City can either re-
new another short-term loan or issue long-
term bonds to generate replacement capital
and pay off accumulated short-term com-
mercial paper.
If approved, this Program would enable the
City to quickly borrow funds to more nim-
bly meet immediate project funding needs.
The CFO may recommend commercial pa-
per borrowing before moving forward with
the next deferred capital bond. Given the
amount of remaining funds from previously
issued deferred capital bonds and the possi-
bility of issuing commercial paper to meet
Year Issued Bond Total Encumbered Expended Remaining Funds
FY 10 DC 1 103,300,000$ -$ 103,300,000$ -$
FY 12 DC 2 75,000,000 - 75,000,000 -
FY 13 DC 2A 35,000,000 7,457,201 27,463,438 79,361
FY 15 DC3 120,000,000 29,812,963 9,218,391 80,968,646
UPDATE ON DEFERRED CAPITAL BOND SPENDING (as of April 21, 2016)
Fiscal Bonds Already Issued
Year or Planned in Outlook
FY 10 $103.3
FY 11 -
FY 12 75.0
FY 13 35.0
FY 14 -
FY 15 120.0
FY 16 -
FY 17* 90.0
FY 18* 90.0
FY 19* 90.0
FY 20 -
FY 21 -
Total: $603.3
* Bond Amounts (millions) planned in Five-
Year Financial Outlook
33
Significant Citywide Issues: Infra. & Financing Issues
Office of the Independent Budget Analyst
April 2016
project needs in FY 2017, the next deferred
capital bond issuance may not take place
until FY 2018 although borrowing capacity
would be available when needed.
Over the last several years, deferred capital
lease revenue bonds have been a primary
source of funds for the General Fund capital
projects. However, it is important to note
that 1) debt service for lease revenue bonds
creates a long-term obligation for the Gen-
eral Fund and 2) lease revenue bonds are
not a sufficient or sustainable solution for
addressing the magnitude of the City’s sig-
nificant infrastructure needs.
Cash Management and Streamlining
Improvements
The Financial Management Department is-
sued the Semi-Annual Budget Monitoring
Report (Report) in December 2015. The
Report provided an update on the imple-
mentation status of CIP cash management
improvement measures. It also provided
information on efficiencies gained, as well a
consolidated request for supporting Council
actions which were approved. Process im-
provements include:
New internal CIP monitoring process
New CIP budget review process
Reallocation of funds from projects that
are technically complete
Establishment of an aggregate contingen-
cy for multiple projects to free up funds
for other projects
Deappropriation of annual allocations at
year-end
Encumbrance policy improvements
Development of a commercial paper
borrowing program
These improvements are intended to man-
age cash in the CIP as efficiently and effec-
tively as possible. The Report detailed $74.4
million of project savings and reallocations
from cash management and streamlining
improvements.
Condition Assessments
General Fund Facilities/Buildings
The FY 2017 Proposed Budget provides
$250,000 in non-personnel expenditures for
continuing General Fund facility condition
assessments. In March of this year, Public
Works presented the results from the facili-
ties condition assessment for 560 City-
occupied buildings. A more detailed review
of the assessment’s findings can be found in
the Public Works: Facilities Division section
of this report. An assessment of about half
of an additional 240 General Fund facilities
that the City owns but leases to tenants is
expected to be completed in the fall of this
year.
Park Assets
The FY 2017 Proposed Budget includes
$300,000 to continue the park assessment
process initiated in FY 2015. The Park and
Recreation Department normally anticipates
30 to 50 parks assessments will be complet-
ed on an annual basis, depending upon the
size and amenities of each park. However,
because the Department is currently under-
taking the assessment of Balboa Park, the
number of other completed park assess-
ments will be significantly reduced until the
Balboa Park assessment is completed.
The Mayor’s FY 2017 – 2021 Five-Year Fi-
nancial Outlook continues annual funding in
the amount of $300,000 as a baseline ex-
34
Significant Citywide Issues: Infra. & Financing Issues
Office of the Independent Budget Analyst
April 2016
pense through FY 2021 (anticipated comple-
tion for all the park assessments). The Park
and Recreation Department anticipates
providing a report on the completed park
assessments in late calendar year 2016.
Information from the completed park as-
sessments will support the development of
the Parks Master Plan (PMP) being initiated
by the Planning Department in FY 2017.
The Planning Department anticipates the
Parks Master Plan to be a three-year work
project. Funding for the PMP has been in-
cluded in the proposed Planning Depart-
ment budget for FY 2017 and is carried for-
ward through FY 2019 in the Mayor’s 2017
– 2021 Five-Year Financial Outlook.
Water and Wastewater Assets
The Public Utilities Department (PUD) has
a Five-Year Condition Assessment Program
(FY 2013-2017), and is expected to spend
$33.3 million over that period to assess var-
ious water and wastewater assets. The FY
2017 Proposed Budget for PUD includes a
combined $10.2 million in funding from the
Water and Wastewater Funds for ongoing
condition assessments of the Department’s
assets.
Infrastructure Asset Manage-
ment (IAM)
The City owns and maintains billions of dol-
lars of infrastructure assets. The IAM San
Diego Project (formerly Enterprise Asset
Management or EAM), is a citywide strate-
gic initiative being led by the Office of the
DCOO for Infrastructure/Public Works, to
develop and implement an integrated SAP-
based software solution that will improve
the City’s management of infrastructure as-
sets.
The Project began in FY 2016 and will be
implemented over a three year period with
a projected go-live date in early FY 2018.
Originally initiated in the Public Utilities De-
partment in FY 2014, this project is now a
citywide strategic initiative with four depart-
ments participating in Phase 1, the founda-
tional phase, including: Department of Infor-
mation Technology, Public Utilities, Public
Works, and Transportation & Storm Wa-
ter.
IAM will replace existing disparate and out-
dated maintenance management systems in
these departments, including 32 applications
citywide, and will serve as the foundation
for future phases of implementation by oth-
er City departments. IAM will provide City
staff with state-of-the-art technology to
support their work, including mobile work
management solutions.
The IAM system will improve the way the
City plans, prioritizes, and delivers needed
maintenance and capital projects by trans-
forming the City’s process for managing non
-Utility assets—from a predominantly reac-
tive, break-down maintenance and repair
approach to a proactive asset lifecycle ap-
proach that is standardized across all asset
classes.
For example, the IAM asset-based planning
tool will enable staff to use information on
assets, such as current conditions, to devel-
op optimal maintenance and CIP investment
strategies. Once implemented, this system
will greatly support the development of the
Five-Year CIP Outlook.
On April 5, 2016, Council approved an
Agreement with Deloitte for System Inte-
grator (SI) consulting services in an amount
35
Significant Citywide Issues: Infra. & Financing Issues
Office of the Independent Budget Analyst
April 2016
not to exceed $20.6 million. This is an im-
portant step for moving the Project forward
as the SI will have the primary responsibility
of gathering and analyzing the City’s busi-
ness and system requirements, designing
and implementing business process and
technology solutions, and deploying these
complex IAM solutions in the City’s existing
Enterprise Resource Planning (ERP) land-
scape.
The total cost for the Project over the
three years is estimated to be $54.2 million,
including both capital and O&M expenses.
Approximately 70% of the Project will be
funded by Public Utilities’ enterprise funds,
with the remaining 30% to be funded by the
General Fund and the Wireless Technology
Fund.
The FY 2017 Proposed Budget includes
$24.4 million for the IAM Project comprised
of $22.7 million in capital expenditures and
$1.7 million in citywide O&M funding. It is
anticipated that the General Fund’s share of
capital costs will be lease financed over a
seven to ten year term, which reduces the
capital expense in FY 2017 by spreading
payments over several years. The total allo-
cation of IAM Project costs to the General
Fund in the FY 2017 Proposed Budget is
approximately $1.0 million, including:
$523,000 for lease payments on the fi-
nanced debt, $330,000 for software licens-
ing costs, $75,000 for training, and $40,000
for archiving legacy systems.
Capacity to Implement Cap-
ital Projects
Engineering & Capital Projects (E&CP) pro-
vides engineering services for the CIP.
E&CP’s responsibilities include planning, de-
sign, project management, and construction
management of capital improvement pro-
jects for client departments, such as Trans-
portation & Storm Water and Park & Rec-
reation. E&CP also conducts quality control
and inspection of private work permitted in
the public right-of-way, and surveying and
materials testing.
As discussed in more detail in the Public
Works - E&CP section of this report, the
FY 2017 Proposed Budget reflects an in-
crease of 46.10 FTEs and $7.5 million in
personnel and non-personnel expenditures
to support additional expansion of the CIP.
This continues the expansion of E&CP’s CIP
support that began in FY 2016 with the ad-
dition of 99.00 FTEs in the FY 2016 Adopt-
ed Budget. E&CP staff will continue to
charge CIP projects for services and will be
reimbursed directly from capital fund
sources as appropriate.
This additional staff will be needed to ad-
dress the expectation for a significant in-
crease in projects over the next five fiscal
years. As noted in the Capital Outlook, pro-
jected capital funding has increased from
$2.2 billion to $2.8 billion over the Outlook
period. The additional funding increases the
number and dollar value of projects to be
undertaken in the coming years as follows:
FY 2017: $634.0 million
FY 2018: $458.0 million
FY 2019: $399.0 million
FY 2020: $522.0 million
FY 2021: $836.0 million
In previous fiscal years, the Public Works
Department has implemented between
36
Significant Citywide Issues: Infra. & Financing Issues
Office of the Independent Budget Analyst
April 2016
$300.0 and $350.0 million in capital projects
each year. As noted above, the Capital
Outlook has identified annual funding for
projects ranging from $399.0 to $836.0 mil-
lion over the next five years. E&CP has indi-
cated that its capacity to implement and ad-
minister capital projects is increasing. This is
attributable to project streamlining efficien-
cies that have been implemented in the last
year, and a significant increase in budgeted
staff.
It is important to mention that factors oth-
er than the number of E&CP staff can signifi-
cantly impact the Department’s ability to
complete projects identified in the Capital
Outlook over the next five years. These
other factors include but are not limited to:
The size of projects (smaller projects
often require as much or more time to
administer as larger projects)
Market demand for qualified engineers
and project managers
Ability to compete with other major
hiring agencies/firms (Navy, County, pri-
vate sector, etc.) to attract capable and
experienced contractors
Laws and environmental regulations that
often impact project timelines
Need to coordinate projects internally
and externally with other entities (i.e.,
public utilities) working in the same pub-
lic right-of-way
37
Significant Citywide Issues: Performance Measures
Office of the Independent Budget Analyst
April 2016
Performance Measures Performance Measures Provided in
the FY 2017 Budget
Over the years, the Executive Branch’s ap-
proaches to performance measurement
have changed numerous times. Measures
were not available for the first several years
of the Strong Mayor/Strong Council form of
government. They were included in the FY
2009 budget for the first time and contin-
ued through FY 2010. For the FY 2011
budget, following a period of significant ser-
vice reductions due to the recession, no
measures were provided to the Council or
the public. In FY 2012, measures returned
to the budget but were cut back significant-
ly.
In 2012, our Office worked with the
Mayor’s Office and City staff to bring back
to the FY 2013 budget some of the
measures of high interest to the community
and Council. In February 2012, the Budget
and Finance Committee adopted a focused
list of 60 performance measures that the
Committee requested be consistently meas-
ured and tracked and made visible to the
public through the City’s budget document
and ultimately the City’s website. Our Of-
fice worked closely with departments to
refine or improve upon the suggested
measures to meet their needs. Most of
these measures were included in the budget
documents through the FY 2016 budget.
For the FY 2017 budget, City departments
were asked to update their tactical plans to
ensure consistency with the City’s Strategic
Plan and revise their performance measures
as they determined appropriate for their
operation. Fortunately, several large key
departments including Police, Fire, Environ-
mental Services, Transportation and Storm
Water, and Public Utilities have retained
existing measures while adding some new
ones as well. However, numerous “old”
measures in other operational areas
(including many requested by Council), have
been dropped. As a result, some valuable
and frequently requested trending infor-
mation is not available in the Proposed
Budget. The new measures are important as
well, but most are missing data from prior
years (FY 2015 and FY 2016) and have no
historical context or baseline information.
In the future, we would like to see some of
the “old” measures, which have been
tracked for some time, return to the budget
documents such as: library circulation per
capita; number of annual or weekly library
and recreation center operating hours; val-
ue of commercial and residential building
permits; and number of aquatics users, to
name a few. The International City/County
Management Association (ICMA) Center
for Performance Analytics refers to these
input and output measures as “descriptors”
as they assist the public in understanding
what levels of service are being provided
with tax dollars, and are of value along with
“outcome” or “efficiency” measures. A cur-
sory review of several other large cities’
performance measures showed a common
or core set of descriptor measures. During
the reductions of the recent recession and
in the years following, historical information
on library circulation, library and recreation
38
Significant Citywide Issues: Performance Measures
Office of the Independent Budget Analyst
April 2016
center operating hours, number of potholes
repaired, length of time to repair potholes,
etc. provided important baseline and histor-
ical service level information, and provided
goal posts for future budget decisions rela-
tive to service restorations.
Another concern is how and when a perfor-
mance measure dashboard, which is intend-
ed to provide access to a very broad range
of performance measures and could substi-
tute for the quarterly reporting of measures
requested by Council beginning in FY 2015,
will be implemented. Two departments are
currently working to implement “dash
boarding” software: Performance & Analyt-
ics is working to have a dashboard in place
for “external measures” by July 1, 2016,
while the Department of IT is scoping an
SAP dashboard project although at this time
no concrete timetable is in place. It is un-
clear how these dashboards will work to-
gether, and what information will be provid-
ed and to whom.
Last, we have previously advocated for
more robust “on time and on budget” CIP
project delivery measures. We think this is
important for accountability should addi-
tional resources for infrastructure need to
be pursued in the future. In reviewing the
City of San Antonio’s Quarterly Perfor-
mance Report, we noted that their key per-
formance measures include “completing
projects 100% on time and on budget.”
39
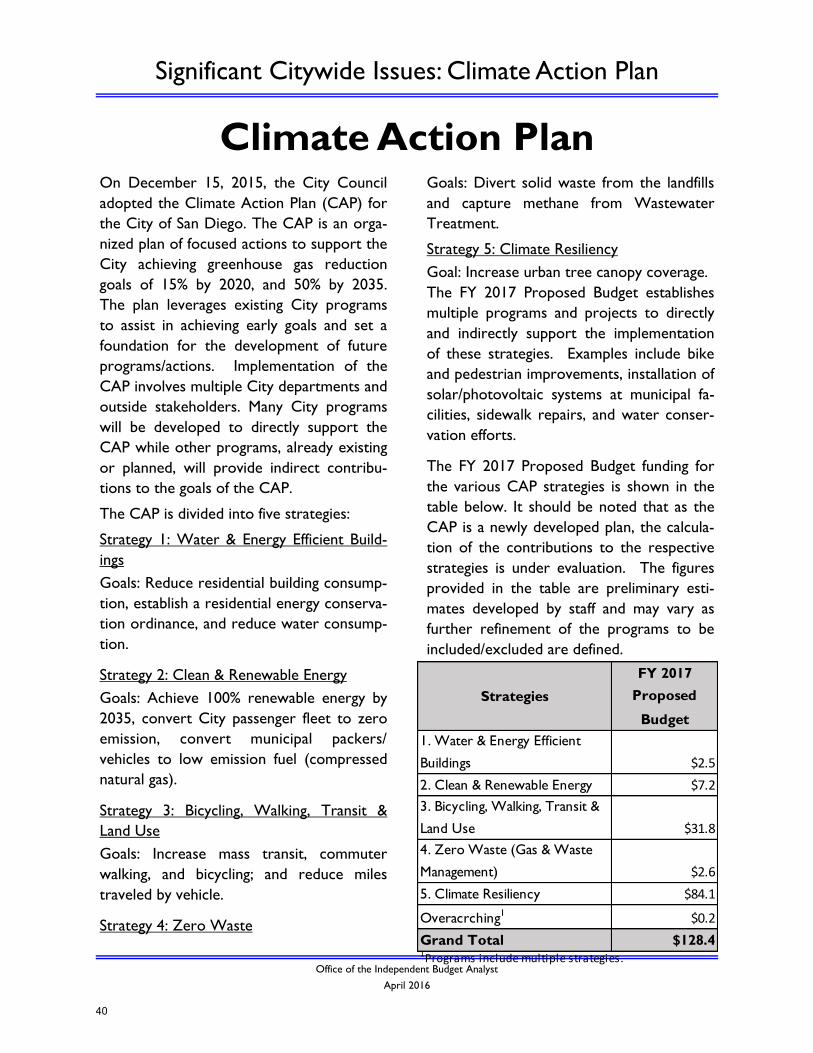
Significant Citywide Issues: Climate Action Plan
Office of the Independent Budget Analyst
April 2016
Climate Action Plan On December 15, 2015, the City Council
adopted the Climate Action Plan (CAP) for
the City of San Diego. The CAP is an orga-
nized plan of focused actions to support the
City achieving greenhouse gas reduction
goals of 15% by 2020, and 50% by 2035.
The plan leverages existing City programs
to assist in achieving early goals and set a
foundation for the development of future
programs/actions. Implementation of the
CAP involves multiple City departments and
outside stakeholders. Many City programs
will be developed to directly support the
CAP while other programs, already existing
or planned, will provide indirect contribu-
tions to the goals of the CAP.
The CAP is divided into five strategies:
Strategy 1: Water & Energy Efficient Build-
ings
Goals: Reduce residential building consump-
tion, establish a residential energy conserva-
tion ordinance, and reduce water consump-
tion.
Strategy 2: Clean & Renewable Energy
Goals: Achieve 100% renewable energy by
2035, convert City passenger fleet to zero
emission, convert municipal packers/
vehicles to low emission fuel (compressed
natural gas).
Strategy 3: Bicycling, Walking, Transit &
Land Use
Goals: Increase mass transit, commuter
walking, and bicycling; and reduce miles
traveled by vehicle.
Strategy 4: Zero Waste
Goals: Divert solid waste from the landfills
and capture methane from Wastewater
Treatment.
Strategy 5: Climate Resiliency
Goal: Increase urban tree canopy coverage.
The FY 2017 Proposed Budget establishes
multiple programs and projects to directly
and indirectly support the implementation
of these strategies. Examples include bike
and pedestrian improvements, installation of
solar/photovoltaic systems at municipal fa-
cilities, sidewalk repairs, and water conser-
vation efforts.
The FY 2017 Proposed Budget funding for
the various CAP strategies is shown in the
table below. It should be noted that as the
CAP is a newly developed plan, the calcula-
tion of the contributions to the respective
strategies is under evaluation. The figures
provided in the table are preliminary esti-
mates developed by staff and may vary as
further refinement of the programs to be
included/excluded are defined.
Strategies
FY 2017
Proposed
Budget
1. Water & Energy Efficient
Buildings $2.5
2. Clean & Renewable Energy $7.2
3. Bicycling, Walking, Transit &
Land Use $31.8
4. Zero Waste (Gas & Waste
Management) $2.6
5. Climate Resiliency $84.1
Overacrching1 $0.2
Grand Total $128.41Programs include multiple strategies.
40
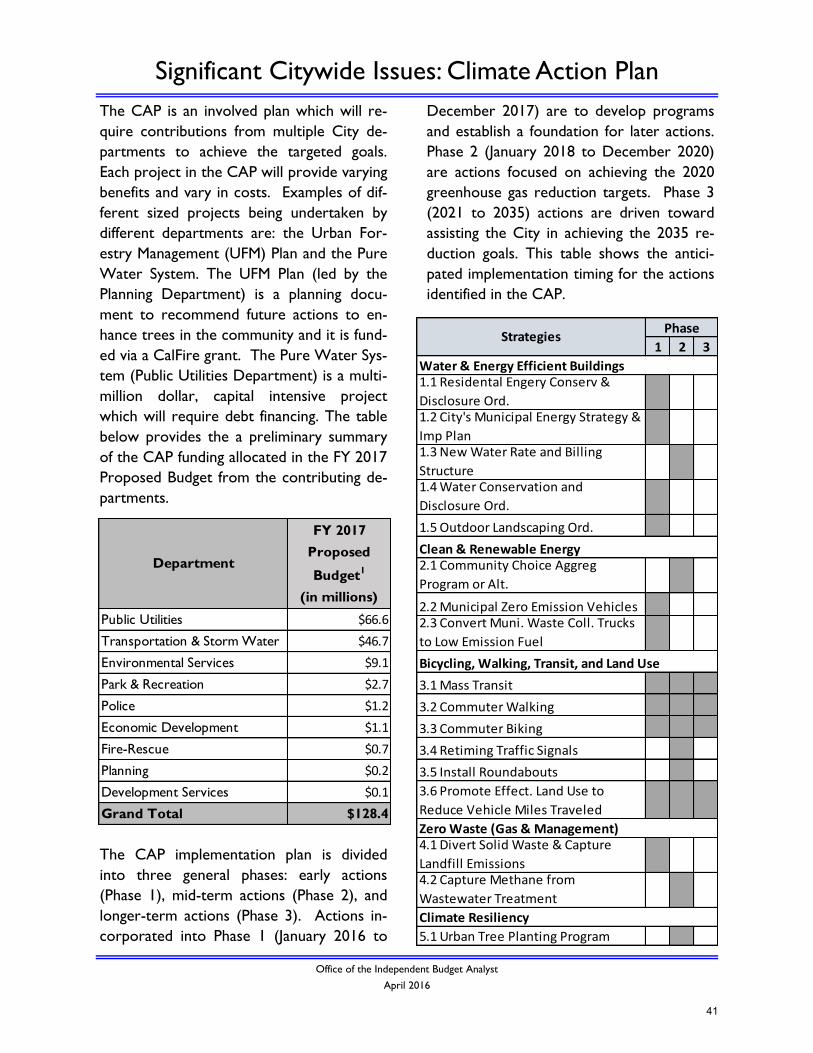
Significant Citywide Issues: Climate Action Plan
Office of the Independent Budget Analyst
April 2016
The CAP is an involved plan which will re-
quire contributions from multiple City de-
partments to achieve the targeted goals.
Each project in the CAP will provide varying
benefits and vary in costs. Examples of dif-
ferent sized projects being undertaken by
different departments are: the Urban For-
estry Management (UFM) Plan and the Pure
Water System. The UFM Plan (led by the
Planning Department) is a planning docu-
ment to recommend future actions to en-
hance trees in the community and it is fund-
ed via a CalFire grant. The Pure Water Sys-
tem (Public Utilities Department) is a multi-
million dollar, capital intensive project
which will require debt financing. The table
below provides the a preliminary summary
of the CAP funding allocated in the FY 2017
Proposed Budget from the contributing de-
partments.
The CAP implementation plan is divided
into three general phases: early actions
(Phase 1), mid-term actions (Phase 2), and
longer-term actions (Phase 3). Actions in-
corporated into Phase 1 (January 2016 to
December 2017) are to develop programs
and establish a foundation for later actions.
Phase 2 (January 2018 to December 2020)
are actions focused on achieving the 2020
greenhouse gas reduction targets. Phase 3
(2021 to 2035) actions are driven toward
assisting the City in achieving the 2035 re-
duction goals. This table shows the antici-
pated implementation timing for the actions
identified in the CAP.
1 2 3
1.1 Residental Engery Conserv &
Disclosure Ord.1.2 City's Municipal Energy Strategy &
Imp Plan1.3 New Water Rate and Billing
Structure1.4 Water Conservation and
Disclosure Ord.
1.5 Outdoor Landscaping Ord.
2.1 Community Choice Aggreg
Program or Alt.
2.2 Municipal Zero Emission Vehicles2.3 Convert Muni. Waste Coll. Trucks
to Low Emission Fuel
3.1 Mass Transit
3.2 Commuter Walking
3.3 Commuter Biking
3.4 Retiming Traffic Signals
3.5 Install Roundabouts
3.6 Promote Effect. Land Use to
Reduce Vehicle Miles Traveled
4.1 Divert Solid Waste & Capture
Landfill Emissions4.2 Capture Methane from
Wastewater Treatment
5.1 Urban Tree Planting Program
PhaseStrategies
Climate Resiliency
Zero Waste (Gas & Management)
Bicycling, Walking, Transit, and Land Use
Clean & Renewable Energy
Water & Energy Efficient Buildings
Department
FY 2017
Proposed
Budget1
(in millions)
Public Utilities $66.6
Transportation & Storm Water $46.7
Environmental Services $9.1
Park & Recreation $2.7
Police $1.2
Economic Development $1.1
Fire-Rescue $0.7
Planning $0.2
Development Services $0.1
Grand Total $128.4
41
Significant Citywide Issues: Climate Action Plan
Office of the Independent Budget Analyst
April 2016
The CAP includes a requirement for an An-
nual Monitoring Report to provide an up-
dated status on the City’s progress toward
achieving the set goals. A copy of the CAP
can be found in the Planning Department on
the City’s website for additional information
related to the CAP. Additional information
on the implementation of the CAP can be
found in a forthcoming funding and imple-
mentation plan from Mayoral staff.
42
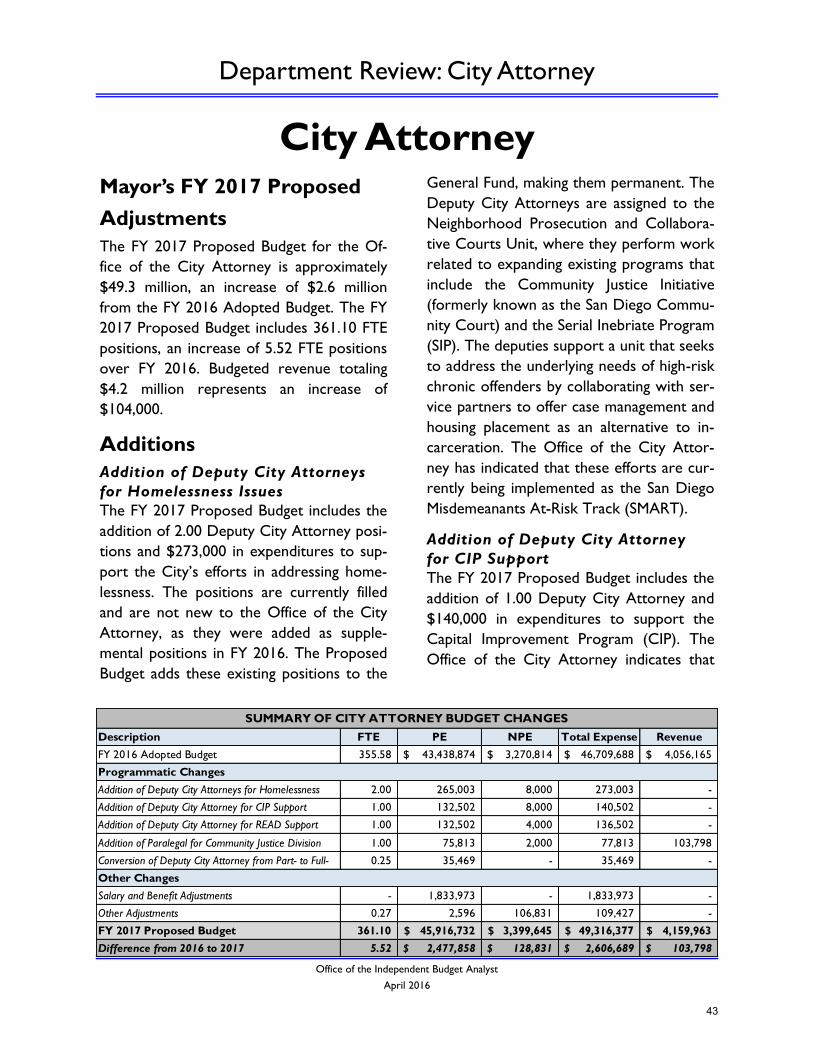
Department Review: City Attorney
Office of the Independent Budget Analyst
April 2016
City Attorney
Mayor’s FY 2017 Proposed
Adjustments
The FY 2017 Proposed Budget for the Of-
fice of the City Attorney is approximately
$49.3 million, an increase of $2.6 million
from the FY 2016 Adopted Budget. The FY
2017 Proposed Budget includes 361.10 FTE
positions, an increase of 5.52 FTE positions
over FY 2016. Budgeted revenue totaling
$4.2 million represents an increase of
$104,000.
Additions
Addition of Deputy City Attorneys
for Homelessness Issues
The FY 2017 Proposed Budget includes the
addition of 2.00 Deputy City Attorney posi-
tions and $273,000 in expenditures to sup-
port the City’s efforts in addressing home-
lessness. The positions are currently filled
and are not new to the Office of the City
Attorney, as they were added as supple-
mental positions in FY 2016. The Proposed
Budget adds these existing positions to the
General Fund, making them permanent. The
Deputy City Attorneys are assigned to the
Neighborhood Prosecution and Collabora-
tive Courts Unit, where they perform work
related to expanding existing programs that
include the Community Justice Initiative
(formerly known as the San Diego Commu-
nity Court) and the Serial Inebriate Program
(SIP). The deputies support a unit that seeks
to address the underlying needs of high-risk
chronic offenders by collaborating with ser-
vice partners to offer case management and
housing placement as an alternative to in-
carceration. The Office of the City Attor-
ney has indicated that these efforts are cur-
rently being implemented as the San Diego
Misdemeanants At-Risk Track (SMART).
Addition of Deputy City Attorney
for CIP Support
The FY 2017 Proposed Budget includes the
addition of 1.00 Deputy City Attorney and
$140,000 in expenditures to support the
Capital Improvement Program (CIP). The
Office of the City Attorney indicates that
Description FTE PE NPE Total Expense Revenue
FY 2016 Adopted Budget 355.58 43,438,874$ 3,270,814$ 46,709,688$ 4,056,165$
Addition of Deputy City Attorneys for Homelessness 2.00 265,003 8,000 273,003 -
Addition of Deputy City Attorney for CIP Support 1.00 132,502 8,000 140,502 -
Addition of Deputy City Attorney for READ Support 1.00 132,502 4,000 136,502 -
Addition of Paralegal for Community Justice Division 1.00 75,813 2,000 77,813 103,798
Conversion of Deputy City Attorney from Part- to Full- 0.25 35,469 - 35,469 -
Salary and Benefit Adjustments - 1,833,973 - 1,833,973 -
Other Adjustments 0.27 2,596 106,831 109,427 -
FY 2017 Proposed Budget 361.10 45,916,732$ 3,399,645$ 49,316,377$ 4,159,963$
Difference from 2016 to 2017 5.52 2,477,858$ 128,831$ 2,606,689$ 103,798$
SUMMARY OF CITY ATTORNEY BUDGET CHANGES
Programmatic Changes
Other Changes
43
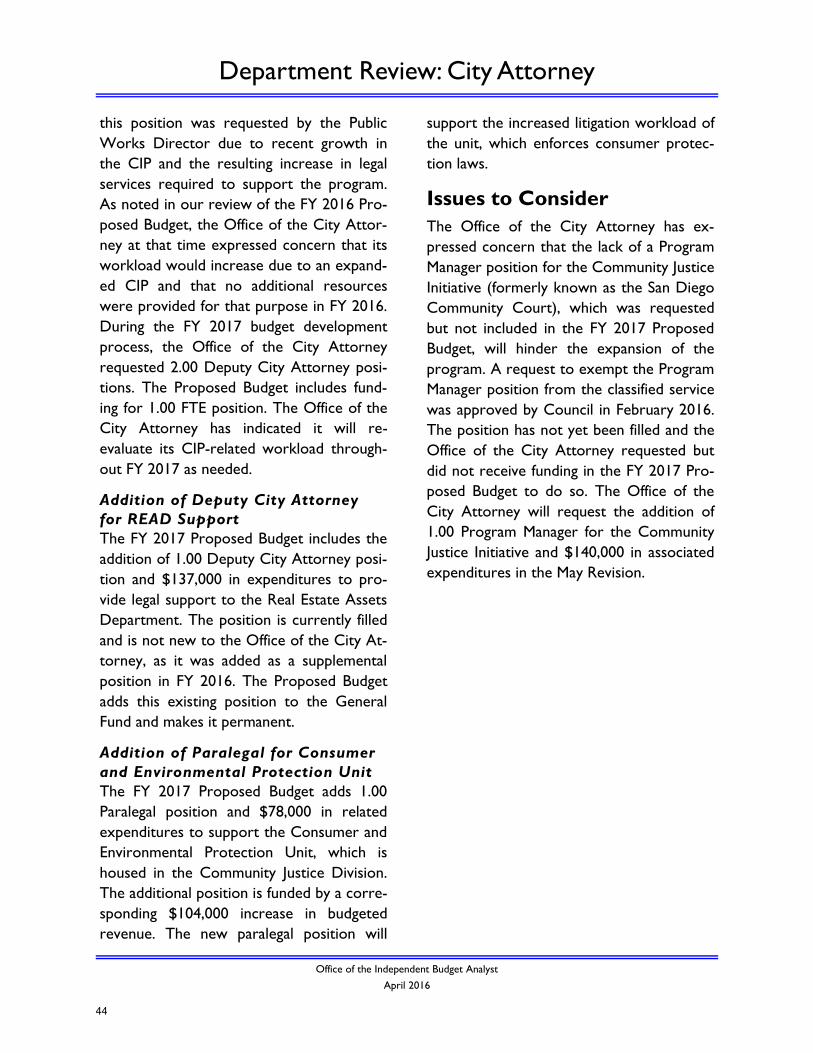
Department Review: City Attorney
Office of the Independent Budget Analyst
April 2016
this position was requested by the Public
Works Director due to recent growth in
the CIP and the resulting increase in legal
services required to support the program.
As noted in our review of the FY 2016 Pro-
posed Budget, the Office of the City Attor-
ney at that time expressed concern that its
workload would increase due to an expand-
ed CIP and that no additional resources
were provided for that purpose in FY 2016.
During the FY 2017 budget development
process, the Office of the City Attorney
requested 2.00 Deputy City Attorney posi-
tions. The Proposed Budget includes fund-
ing for 1.00 FTE position. The Office of the
City Attorney has indicated it will re-
evaluate its CIP-related workload through-
out FY 2017 as needed.
Addition of Deputy City Attorney
for READ Support
The FY 2017 Proposed Budget includes the
addition of 1.00 Deputy City Attorney posi-
tion and $137,000 in expenditures to pro-
vide legal support to the Real Estate Assets
Department. The position is currently filled
and is not new to the Office of the City At-
torney, as it was added as a supplemental
position in FY 2016. The Proposed Budget
adds this existing position to the General
Fund and makes it permanent.
Addition of Paralegal for Consumer
and Environmental Protection Unit
The FY 2017 Proposed Budget adds 1.00
Paralegal position and $78,000 in related
expenditures to support the Consumer and
Environmental Protection Unit, which is
housed in the Community Justice Division.
The additional position is funded by a corre-
sponding $104,000 increase in budgeted
revenue. The new paralegal position will
support the increased litigation workload of
the unit, which enforces consumer protec-
tion laws.
Issues to Consider
The Office of the City Attorney has ex-
pressed concern that the lack of a Program
Manager position for the Community Justice
Initiative (formerly known as the San Diego
Community Court), which was requested
but not included in the FY 2017 Proposed
Budget, will hinder the expansion of the
program. A request to exempt the Program
Manager position from the classified service
was approved by Council in February 2016.
The position has not yet been filled and the
Office of the City Attorney requested but
did not receive funding in the FY 2017 Pro-
posed Budget to do so. The Office of the
City Attorney will request the addition of
1.00 Program Manager for the Community
Justice Initiative and $140,000 in associated
expenditures in the May Revision.
44
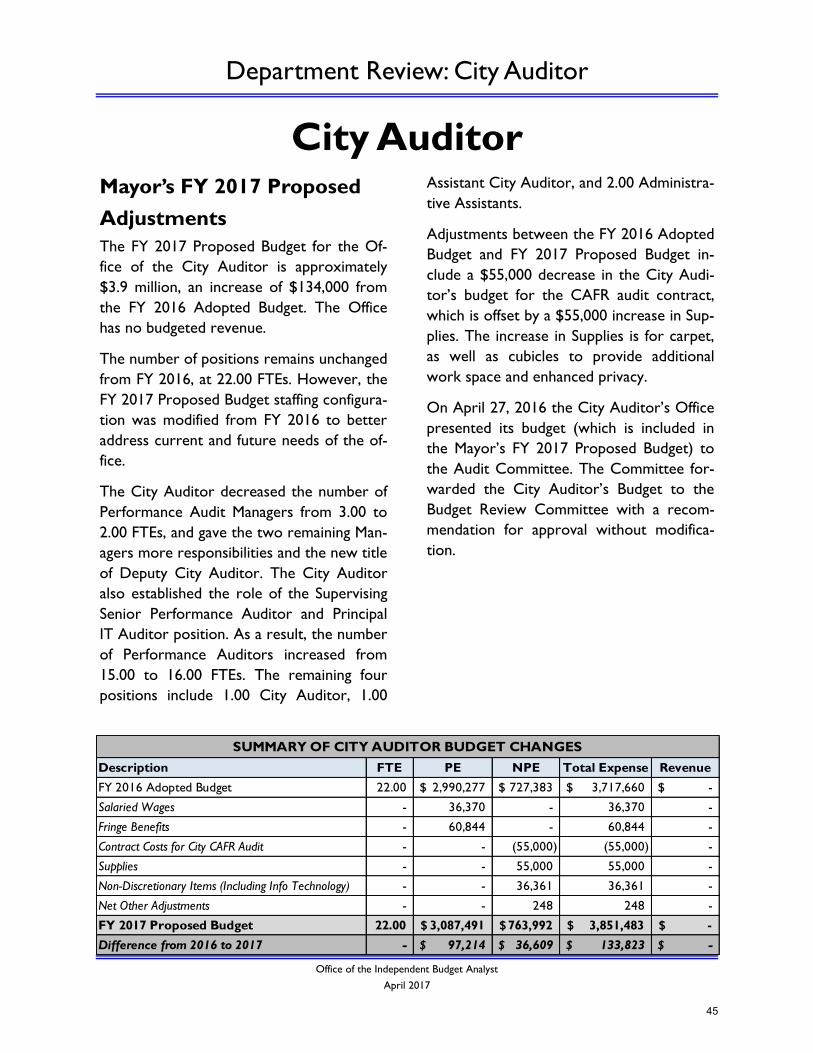
Department Review: City Auditor
Office of the Independent Budget Analyst
April 2017
City Auditor
Mayor’s FY 2017 Proposed
Adjustments
The FY 2017 Proposed Budget for the Of-
fice of the City Auditor is approximately
$3.9 million, an increase of $134,000 from
the FY 2016 Adopted Budget. The Office
has no budgeted revenue.
The number of positions remains unchanged
from FY 2016, at 22.00 FTEs. However, the
FY 2017 Proposed Budget staffing configura-
tion was modified from FY 2016 to better
address current and future needs of the of-
fice.
The City Auditor decreased the number of
Performance Audit Managers from 3.00 to
2.00 FTEs, and gave the two remaining Man-
agers more responsibilities and the new title
of Deputy City Auditor. The City Auditor
also established the role of the Supervising
Senior Performance Auditor and Principal
IT Auditor position. As a result, the number
of Performance Auditors increased from
15.00 to 16.00 FTEs. The remaining four
positions include 1.00 City Auditor, 1.00
Assistant City Auditor, and 2.00 Administra-
tive Assistants.
Adjustments between the FY 2016 Adopted
Budget and FY 2017 Proposed Budget in-
clude a $55,000 decrease in the City Audi-
tor’s budget for the CAFR audit contract,
which is offset by a $55,000 increase in Sup-
plies. The increase in Supplies is for carpet,
as well as cubicles to provide additional
work space and enhanced privacy.
On April 27, 2016 the City Auditor’s Office
presented its budget (which is included in
the Mayor’s FY 2017 Proposed Budget) to
the Audit Committee. The Committee for-
warded the City Auditor’s Budget to the
Budget Review Committee with a recom-
mendation for approval without modifica-
tion.
Description FTE PE NPE Total Expense Revenue
FY 2016 Adopted Budget 22.00 2,990,277$ 727,383$ 3,717,660$ -$
Salaried Wages - 36,370 - 36,370 -
Fringe Benefits - 60,844 - 60,844 -
Contract Costs for City CAFR Audit - - (55,000) (55,000) -
Supplies - - 55,000 55,000 -
Non-Discretionary Items (Including Info Technology) - - 36,361 36,361 -
Net Other Adjustments - - 248 248 -
FY 2017 Proposed Budget 22.00 3,087,491$ 763,992$ 3,851,483$ -$
Difference from 2016 to 2017 - 97,214$ 36,609$ 133,823$ -$
SUMMARY OF CITY AUDITOR BUDGET CHANGES
45
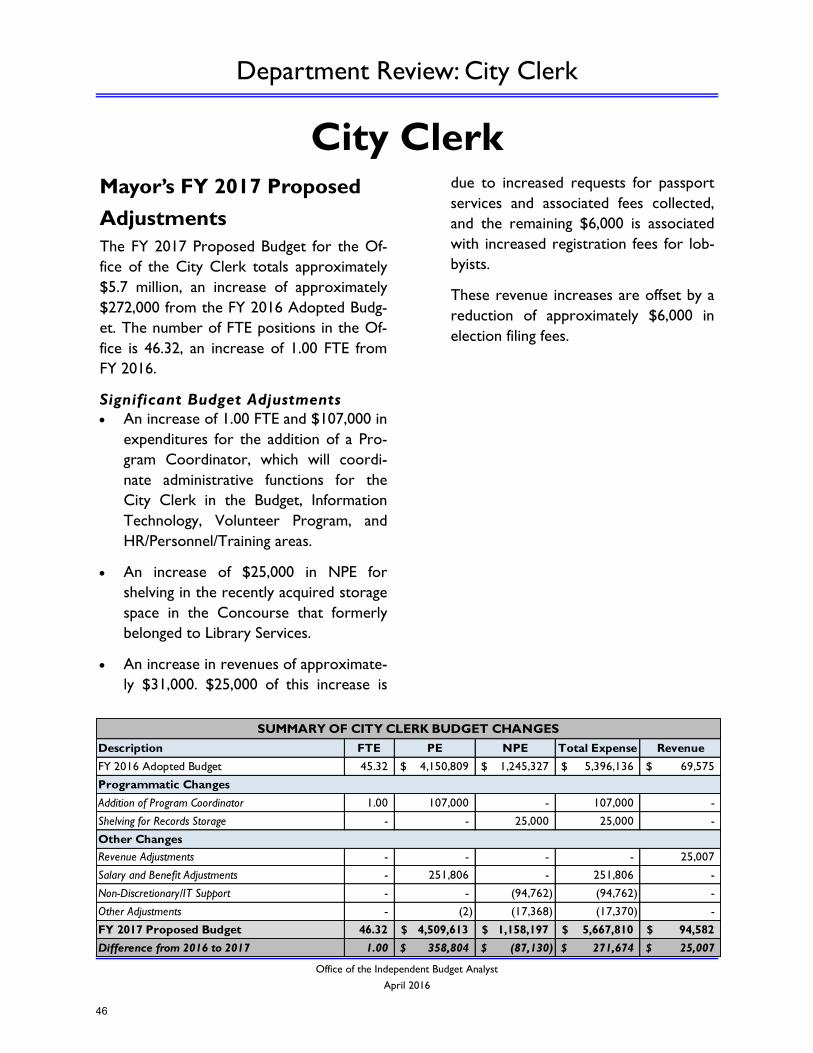
Department Review: City Clerk
Office of the Independent Budget Analyst
April 2016
City Clerk
Mayor’s FY 2017 Proposed
Adjustments
The FY 2017 Proposed Budget for the Of-
fice of the City Clerk totals approximately
$5.7 million, an increase of approximately
$272,000 from the FY 2016 Adopted Budg-
et. The number of FTE positions in the Of-
fice is 46.32, an increase of 1.00 FTE from
FY 2016.
Significant Budget Adjustments
An increase of 1.00 FTE and $107,000 in
expenditures for the addition of a Pro-
gram Coordinator, which will coordi-
nate administrative functions for the
City Clerk in the Budget, Information
Technology, Volunteer Program, and
HR/Personnel/Training areas.
An increase of $25,000 in NPE for
shelving in the recently acquired storage
space in the Concourse that formerly
belonged to Library Services.
An increase in revenues of approximate-
ly $31,000. $25,000 of this increase is
due to increased requests for passport
services and associated fees collected,
and the remaining $6,000 is associated
with increased registration fees for lob-
byists.
These revenue increases are offset by a
reduction of approximately $6,000 in
election filing fees.
Description FTE PE NPE Total Expense Revenue
FY 2016 Adopted Budget 45.32 4,150,809$ 1,245,327$ 5,396,136$ 69,575$
Addition of Program Coordinator 1.00 107,000 - 107,000 -
Shelving for Records Storage - - 25,000 25,000 -
Revenue Adjustments - - - - 25,007
Salary and Benefit Adjustments - 251,806 - 251,806 -
Non-Discretionary/IT Support - - (94,762) (94,762) -
Other Adjustments - (2) (17,368) (17,370) -
FY 2017 Proposed Budget 46.32 4,509,613$ 1,158,197$ 5,667,810$ 94,582$
Difference from 2016 to 2017 1.00 358,804$ (87,130)$ 271,674$ 25,007$
SUMMARY OF CITY CLERK BUDGET CHANGES
Programmatic Changes
Other Changes
46
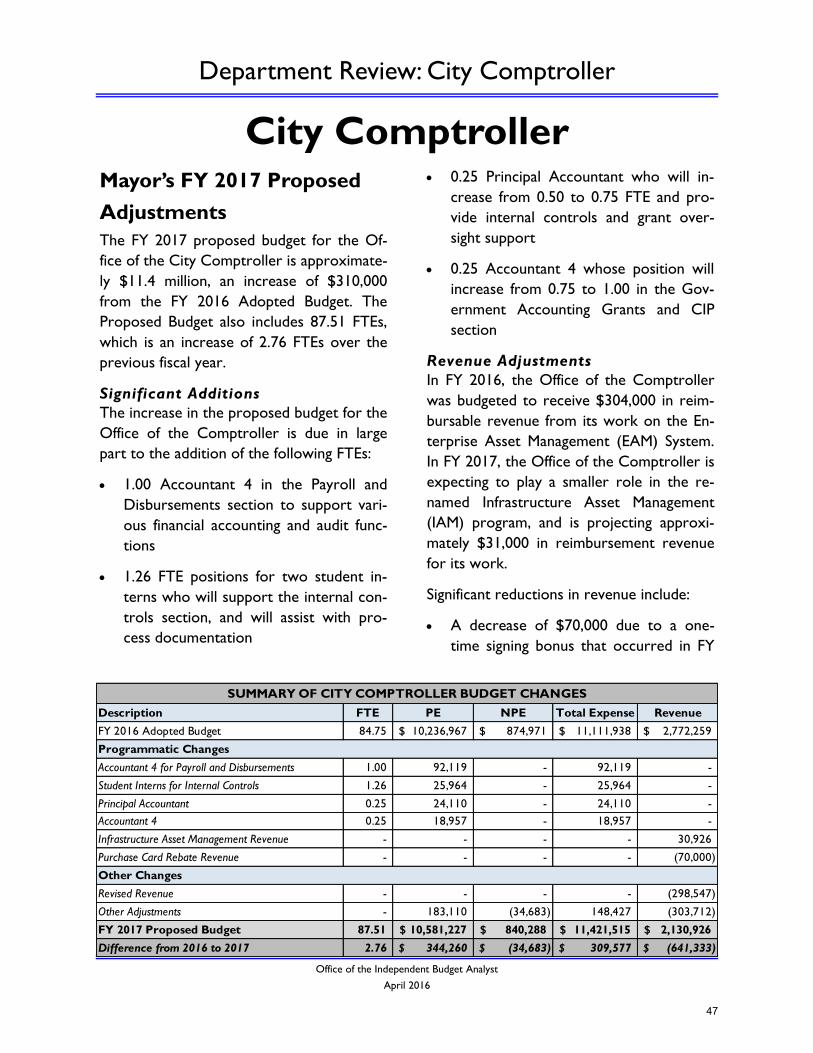
Department Review: City Comptroller
Office of the Independent Budget Analyst
April 2016
City Comptroller
Mayor’s FY 2017 Proposed
Adjustments
The FY 2017 proposed budget for the Of-
fice of the City Comptroller is approximate-
ly $11.4 million, an increase of $310,000
from the FY 2016 Adopted Budget. The
Proposed Budget also includes 87.51 FTEs,
which is an increase of 2.76 FTEs over the
previous fiscal year.
Significant Additions
The increase in the proposed budget for the
Office of the Comptroller is due in large
part to the addition of the following FTEs:
1.00 Accountant 4 in the Payroll and
Disbursements section to support vari-
ous financial accounting and audit func-
tions
1.26 FTE positions for two student in-
terns who will support the internal con-
trols section, and will assist with pro-
cess documentation
0.25 Principal Accountant who will in-
crease from 0.50 to 0.75 FTE and pro-
vide internal controls and grant over-
sight support
0.25 Accountant 4 whose position will
increase from 0.75 to 1.00 in the Gov-
ernment Accounting Grants and CIP
section
Revenue Adjustments
In FY 2016, the Office of the Comptroller
was budgeted to receive $304,000 in reim-
bursable revenue from its work on the En-
terprise Asset Management (EAM) System.
In FY 2017, the Office of the Comptroller is
expecting to play a smaller role in the re-
named Infrastructure Asset Management
(IAM) program, and is projecting approxi-
mately $31,000 in reimbursement revenue
for its work.
Significant reductions in revenue include:
A decrease of $70,000 due to a one-
time signing bonus that occurred in FY
Description FTE PE NPE Total Expense Revenue
FY 2016 Adopted Budget 84.75 10,236,967$ 874,971$ 11,111,938$ 2,772,259$
Accountant 4 for Payroll and Disbursements 1.00 92,119 - 92,119 -
Student Interns for Internal Controls 1.26 25,964 - 25,964 -
Principal Accountant 0.25 24,110 - 24,110 -
Accountant 4 0.25 18,957 - 18,957 -
Infrastructure Asset Management Revenue - - - - 30,926
Purchase Card Rebate Revenue - - - - (70,000)
Revised Revenue - - - - (298,547)
Other Adjustments - 183,110 (34,683) 148,427 (303,712)
FY 2017 Proposed Budget 87.51 10,581,227$ 840,288$ 11,421,515$ 2,130,926$
Difference from 2016 to 2017 2.76 344,260$ (34,683)$ 309,577$ (641,333)$
SUMMARY OF CITY COMPTROLLER BUDGET CHANGES
Programmatic Changes
Other Changes
47
Department Review: City Comptroller
Office of the Independent Budget Analyst
April 2016
2016 and was related to the new Pur-
chase Card program
A $299,000 decrease in revised revenue,
which is largely due to right-sizing of the
Office’s budget
Issues to Consider
Unfunded Request
For the FY 2017 Proposed Budget, the City
Comptroller requested the addition of
$130,000 for vacation pay in lieu; however,
it was not included in the budget. When
asked about the ramifications of not includ-
ing this item in the budget, the Comptroller
noted that this request has not been includ-
ed in the Proposed Budget in past years,
and is often handled at the Mid-Year or is
covered by vacancy savings. Although vaca-
tion pay in lieu can be hard to forecast, the
City Comptroller’s expenditures for this
item have remained fairly consistent for the
last four years. As is noted in the General
Fund Overview Section of this report, we
recommend that the City reexamine poten-
tial methodologies for estimating pay in lieu
so that a more accurate citywide budget for
those expenditures can be established.
Internal Controls
In April 2016, the Comptroller’s Office
brought its Annual Report on Internal Con-
trols (Report) to the City Council. The Re-
port outlined the Office’s internal control
activities, and defined its strategy for contin-
uing to develop and implement process
documentation and controls for all finance-
related activity throughout the City. Ac-
cording to the Report, documenting pro-
cesses remains one of the City’s greatest
challenges due to the large amount of time
and resources required. Despite this chal-
lenge, the Office anticipates that current
staffing levels are sufficient to fully docu-
ment all significant financial processes within
the next three fiscal years.
48
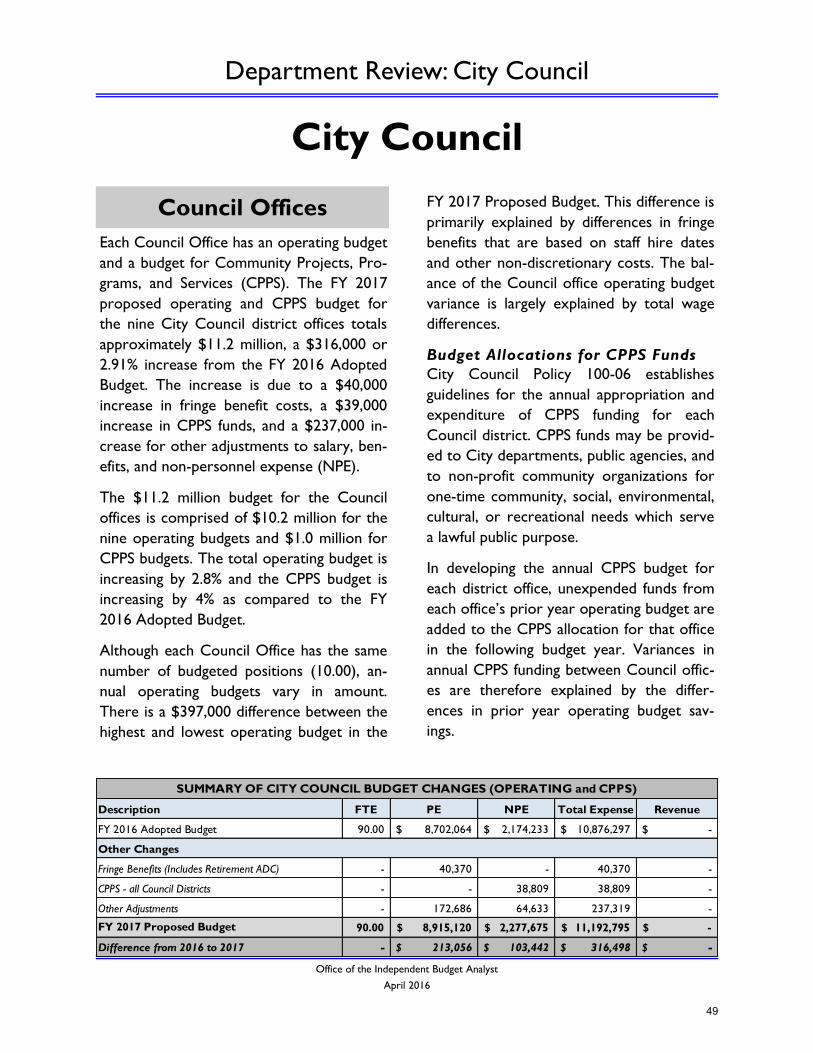
Department Review: City Council
Office of the Independent Budget Analyst
April 2016
City Council
Each Council Office has an operating budget
and a budget for Community Projects, Pro-
grams, and Services (CPPS). The FY 2017
proposed operating and CPPS budget for
the nine City Council district offices totals
approximately $11.2 million, a $316,000 or
2.91% increase from the FY 2016 Adopted
Budget. The increase is due to a $40,000
increase in fringe benefit costs, a $39,000
increase in CPPS funds, and a $237,000 in-
crease for other adjustments to salary, ben-
efits, and non-personnel expense (NPE).
The $11.2 million budget for the Council
offices is comprised of $10.2 million for the
nine operating budgets and $1.0 million for
CPPS budgets. The total operating budget is
increasing by 2.8% and the CPPS budget is
increasing by 4% as compared to the FY
2016 Adopted Budget.
Although each Council Office has the same
number of budgeted positions (10.00), an-
nual operating budgets vary in amount.
There is a $397,000 difference between the
highest and lowest operating budget in the
FY 2017 Proposed Budget. This difference is
primarily explained by differences in fringe
benefits that are based on staff hire dates
and other non-discretionary costs. The bal-
ance of the Council office operating budget
variance is largely explained by total wage
differences.
Budget Allocations for CPPS Funds
City Council Policy 100-06 establishes
guidelines for the annual appropriation and
expenditure of CPPS funding for each
Council district. CPPS funds may be provid-
ed to City departments, public agencies, and
to non-profit community organizations for
one-time community, social, environmental,
cultural, or recreational needs which serve
a lawful public purpose.
In developing the annual CPPS budget for
each district office, unexpended funds from
each office’s prior year operating budget are
added to the CPPS allocation for that office
in the following budget year. Variances in
annual CPPS funding between Council offic-
es are therefore explained by the differ-
ences in prior year operating budget sav-
ings.
Council Offices
Description FTE PE NPE Total Expense Revenue
FY 2016 Adopted Budget 90.00 8,702,064$ 2,174,233$ 10,876,297$ -$
Fringe Benefits (Includes Retirement ADC) - 40,370 - 40,370 -
CPPS - all Council Districts - - 38,809 38,809 -
Other Adjustments - 172,686 64,633 237,319 -
FY 2017 Proposed Budget 90.00 8,915,120$ 2,277,675$ 11,192,795$ -$
Difference from 2016 to 2017 - 213,056$ 103,442$ 316,498$ -$
SUMMARY OF CITY COUNCIL BUDGET CHANGES (OPERATING and CPPS)
Other Changes
49
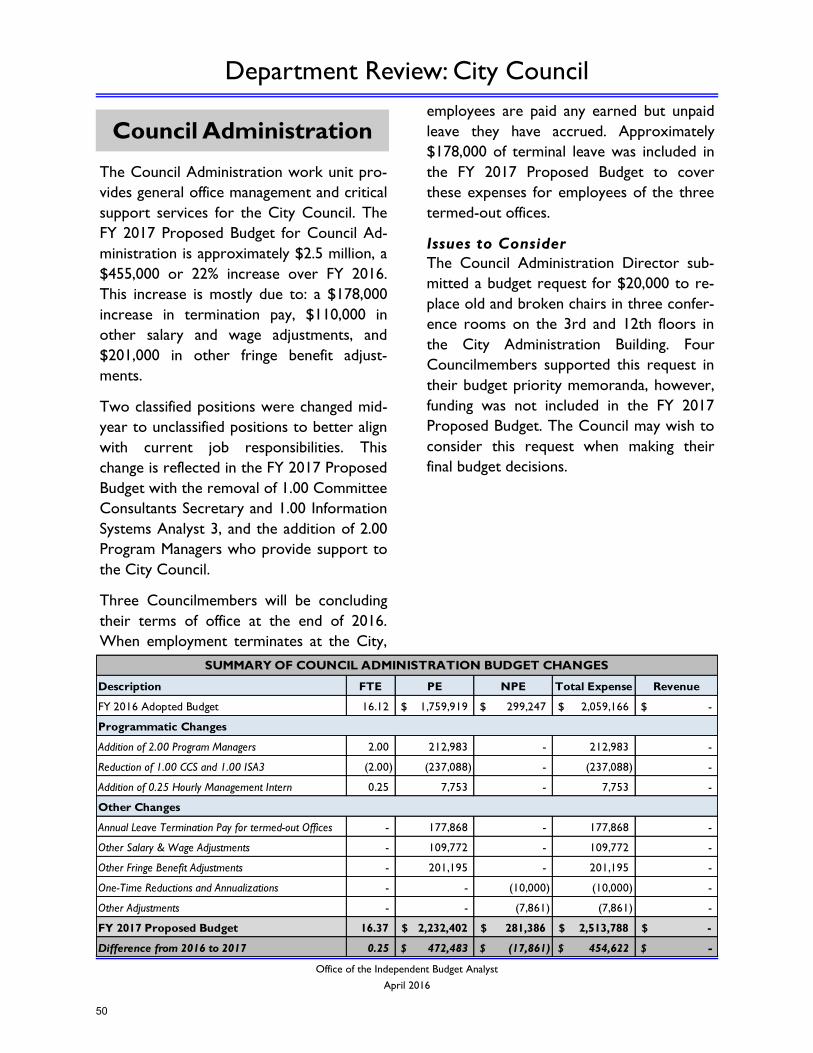
Department Review: City Council
Office of the Independent Budget Analyst
April 2016
The Council Administration work unit pro-
vides general office management and critical
support services for the City Council. The
FY 2017 Proposed Budget for Council Ad-
ministration is approximately $2.5 million, a
$455,000 or 22% increase over FY 2016.
This increase is mostly due to: a $178,000
increase in termination pay, $110,000 in
other salary and wage adjustments, and
$201,000 in other fringe benefit adjust-
ments.
Two classified positions were changed mid-
year to unclassified positions to better align
with current job responsibilities. This
change is reflected in the FY 2017 Proposed
Budget with the removal of 1.00 Committee
Consultants Secretary and 1.00 Information
Systems Analyst 3, and the addition of 2.00
Program Managers who provide support to
the City Council.
Three Councilmembers will be concluding
their terms of office at the end of 2016.
When employment terminates at the City,
employees are paid any earned but unpaid
leave they have accrued. Approximately
$178,000 of terminal leave was included in
the FY 2017 Proposed Budget to cover
these expenses for employees of the three
termed-out offices.
Issues to Consider
The Council Administration Director sub-
mitted a budget request for $20,000 to re-
place old and broken chairs in three confer-
ence rooms on the 3rd and 12th floors in
the City Administration Building. Four
Councilmembers supported this request in
their budget priority memoranda, however,
funding was not included in the FY 2017
Proposed Budget. The Council may wish to
consider this request when making their
final budget decisions.
Council Administration
Description FTE PE NPE Total Expense Revenue
FY 2016 Adopted Budget 16.12 1,759,919$ 299,247$ 2,059,166$ -$
Addition of 2.00 Program Managers 2.00 212,983 - 212,983 -
Reduction of 1.00 CCS and 1.00 ISA3 (2.00) (237,088) - (237,088) -
Addition of 0.25 Hourly Management Intern 0.25 7,753 - 7,753 -
Annual Leave Termination Pay for termed-out Offices - 177,868 - 177,868 -
Other Salary & Wage Adjustments - 109,772 - 109,772 -
Other Fringe Benefit Adjustments - 201,195 - 201,195 -
One-Time Reductions and Annualizations - - (10,000) (10,000) -
Other Adjustments - - (7,861) (7,861) -
FY 2017 Proposed Budget 16.37 2,232,402$ 281,386$ 2,513,788$ -$
Difference from 2016 to 2017 0.25 472,483$ (17,861)$ 454,622$ -$
SUMMARY OF COUNCIL ADMINISTRATION BUDGET CHANGES
Programmatic Changes
Other Changes
50
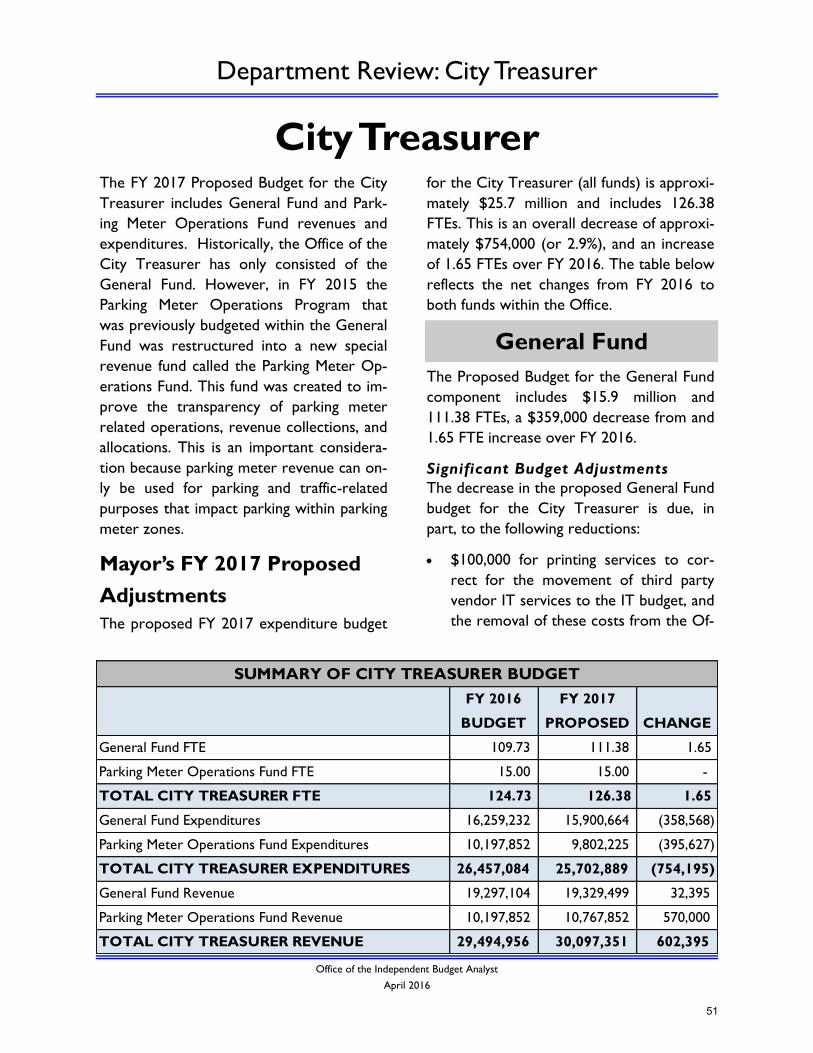
Department Review: City Treasurer
Office of the Independent Budget Analyst
April 2016
City Treasurer The FY 2017 Proposed Budget for the City
Treasurer includes General Fund and Park-
ing Meter Operations Fund revenues and
expenditures. Historically, the Office of the
City Treasurer has only consisted of the
General Fund. However, in FY 2015 the
Parking Meter Operations Program that
was previously budgeted within the General
Fund was restructured into a new special
revenue fund called the Parking Meter Op-
erations Fund. This fund was created to im-
prove the transparency of parking meter
related operations, revenue collections, and
allocations. This is an important considera-
tion because parking meter revenue can on-
ly be used for parking and traffic-related
purposes that impact parking within parking
meter zones.
Mayor’s FY 2017 Proposed
Adjustments
The proposed FY 2017 expenditure budget
for the City Treasurer (all funds) is approxi-
mately $25.7 million and includes 126.38
FTEs. This is an overall decrease of approxi-
mately $754,000 (or 2.9%), and an increase
of 1.65 FTEs over FY 2016. The table below
reflects the net changes from FY 2016 to
both funds within the Office.
The Proposed Budget for the General Fund
component includes $15.9 million and
111.38 FTEs, a $359,000 decrease from and
1.65 FTE increase over FY 2016.
Significant Budget Adjustments
The decrease in the proposed General Fund
budget for the City Treasurer is due, in
part, to the following reductions:
$100,000 for printing services to cor-
rect for the movement of third party
vendor IT services to the IT budget, and
the removal of these costs from the Of-
General Fund
FY 2016
BUDGET
FY 2017
PROPOSED CHANGE
General Fund FTE 109.73 111.38 1.65
Parking Meter Operations Fund FTE 15.00 15.00 -
TOTAL CITY TREASURER FTE 124.73 126.38 1.65
General Fund Expenditures 16,259,232 15,900,664 (358,568)
Parking Meter Operations Fund Expenditures 10,197,852 9,802,225 (395,627)
TOTAL CITY TREASURER EXPENDITURES 26,457,084 25,702,889 (754,195)
General Fund Revenue 19,297,104 19,329,499 32,395
Parking Meter Operations Fund Revenue 10,197,852 10,767,852 570,000
TOTAL CITY TREASURER REVENUE 29,494,956 30,097,351 602,395
SUMMARY OF CITY TREASURER BUDGET
51
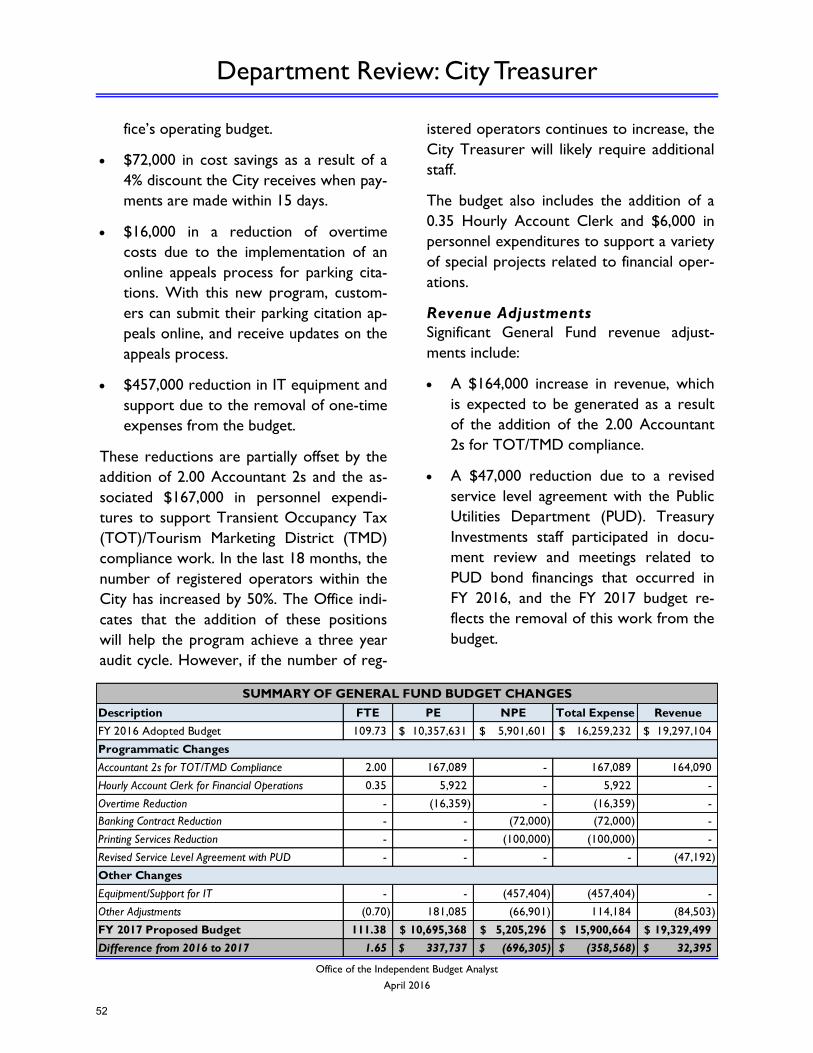
Department Review: City Treasurer
Office of the Independent Budget Analyst
April 2016
fice’s operating budget.
$72,000 in cost savings as a result of a
4% discount the City receives when pay-
ments are made within 15 days.
$16,000 in a reduction of overtime
costs due to the implementation of an
online appeals process for parking cita-
tions. With this new program, custom-
ers can submit their parking citation ap-
peals online, and receive updates on the
appeals process.
$457,000 reduction in IT equipment and
support due to the removal of one-time
expenses from the budget.
These reductions are partially offset by the
addition of 2.00 Accountant 2s and the as-
sociated $167,000 in personnel expendi-
tures to support Transient Occupancy Tax
(TOT)/Tourism Marketing District (TMD)
compliance work. In the last 18 months, the
number of registered operators within the
City has increased by 50%. The Office indi-
cates that the addition of these positions
will help the program achieve a three year
audit cycle. However, if the number of reg-
istered operators continues to increase, the
City Treasurer will likely require additional
staff.
The budget also includes the addition of a
0.35 Hourly Account Clerk and $6,000 in
personnel expenditures to support a variety
of special projects related to financial oper-
ations.
Revenue Adjustments
Significant General Fund revenue adjust-
ments include:
A $164,000 increase in revenue, which
is expected to be generated as a result
of the addition of the 2.00 Accountant
2s for TOT/TMD compliance.
A $47,000 reduction due to a revised
service level agreement with the Public
Utilities Department (PUD). Treasury
Investments staff participated in docu-
ment review and meetings related to
PUD bond financings that occurred in
FY 2016, and the FY 2017 budget re-
flects the removal of this work from the
budget.
Description FTE PE NPE Total Expense Revenue
FY 2016 Adopted Budget 109.73 10,357,631$ 5,901,601$ 16,259,232$ 19,297,104$
Accountant 2s for TOT/TMD Compliance 2.00 167,089 - 167,089 164,090
Hourly Account Clerk for Financial Operations 0.35 5,922 - 5,922 -
Overtime Reduction - (16,359) - (16,359) -
Banking Contract Reduction - - (72,000) (72,000) -
Printing Services Reduction - - (100,000) (100,000) -
Revised Service Level Agreement with PUD - - - - (47,192)
Equipment/Support for IT - - (457,404) (457,404) -
Other Adjustments (0.70) 181,085 (66,901) 114,184 (84,503)
FY 2017 Proposed Budget 111.38 10,695,368$ 5,205,296$ 15,900,664$ 19,329,499$
Difference from 2016 to 2017 1.65 337,737$ (696,305)$ (358,568)$ 32,395$
SUMMARY OF GENERAL FUND BUDGET CHANGES
Programmatic Changes
Other Changes
52
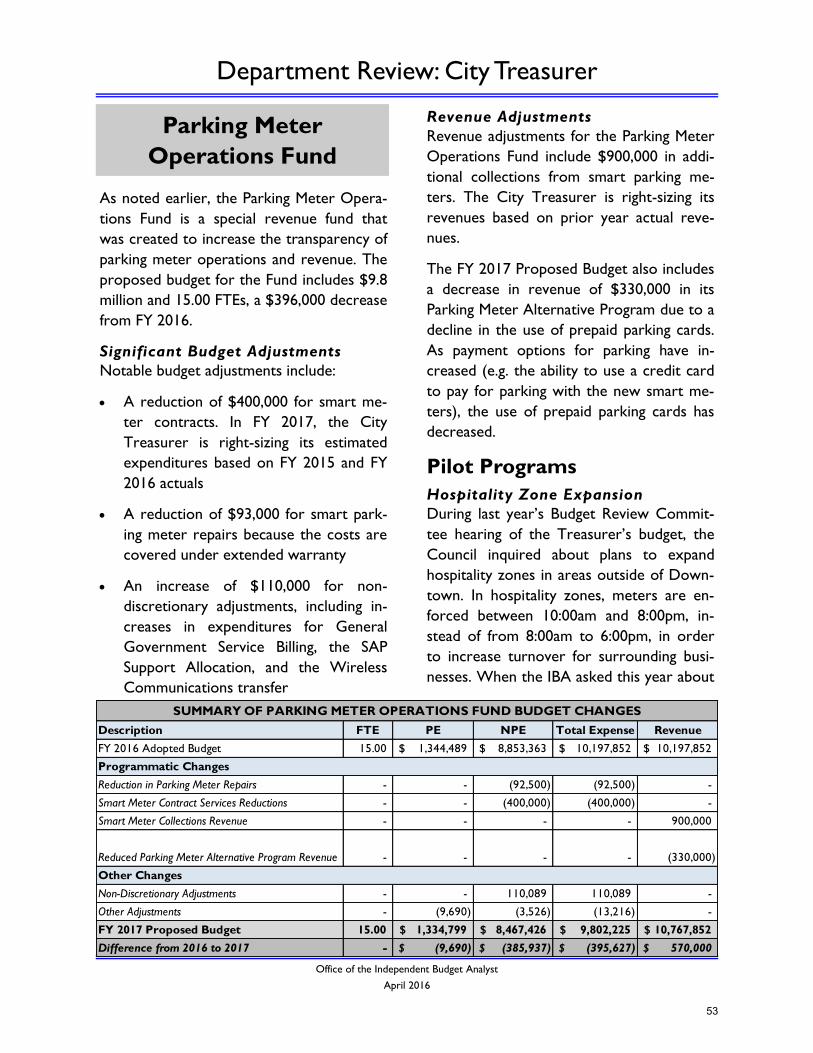
Department Review: City Treasurer
Office of the Independent Budget Analyst
April 2016
As noted earlier, the Parking Meter Opera-
tions Fund is a special revenue fund that
was created to increase the transparency of
parking meter operations and revenue. The
proposed budget for the Fund includes $9.8
million and 15.00 FTEs, a $396,000 decrease
from FY 2016.
Significant Budget Adjustments
Notable budget adjustments include:
A reduction of $400,000 for smart me-
ter contracts. In FY 2017, the City
Treasurer is right-sizing its estimated
expenditures based on FY 2015 and FY
2016 actuals
A reduction of $93,000 for smart park-
ing meter repairs because the costs are
covered under extended warranty
An increase of $110,000 for non-
discretionary adjustments, including in-
creases in expenditures for General
Government Service Billing, the SAP
Support Allocation, and the Wireless
Communications transfer
Revenue Adjustments
Revenue adjustments for the Parking Meter
Operations Fund include $900,000 in addi-
tional collections from smart parking me-
ters. The City Treasurer is right-sizing its
revenues based on prior year actual reve-
nues.
The FY 2017 Proposed Budget also includes
a decrease in revenue of $330,000 in its
Parking Meter Alternative Program due to a
decline in the use of prepaid parking cards.
As payment options for parking have in-
creased (e.g. the ability to use a credit card
to pay for parking with the new smart me-
ters), the use of prepaid parking cards has
decreased.
Pilot Programs
Hospitality Zone Expansion
During last year’s Budget Review Commit-
tee hearing of the Treasurer’s budget, the
Council inquired about plans to expand
hospitality zones in areas outside of Down-
town. In hospitality zones, meters are en-
forced between 10:00am and 8:00pm, in-
stead of from 8:00am to 6:00pm, in order
to increase turnover for surrounding busi-
nesses. When the IBA asked this year about
Parking Meter
Operations Fund
Description FTE PE NPE Total Expense Revenue
FY 2016 Adopted Budget 15.00 1,344,489$ 8,853,363$ 10,197,852$ 10,197,852$
Reduction in Parking Meter Repairs - - (92,500) (92,500) -
Smart Meter Contract Services Reductions - - (400,000) (400,000) -
Smart Meter Collections Revenue - - - - 900,000
Reduced Parking Meter Alternative Program Revenue - - - - (330,000)
Non-Discretionary Adjustments - - 110,089 110,089 -
Other Adjustments - (9,690) (3,526) (13,216) -
FY 2017 Proposed Budget 15.00 1,334,799$ 8,467,426$ 9,802,225$ 10,767,852$
Difference from 2016 to 2017 - (9,690)$ (385,937)$ (395,627)$ 570,000$
SUMMARY OF PARKING METER OPERATIONS FUND BUDGET CHANGES
Programmatic Changes
Other Changes
53
Department Review: City Treasurer
Office of the Independent Budget Analyst
April 2016
future plans for expansion, the City Treas-
urer noted that the Uptown Parking Dis-
trict has expressed interest in pursuing hos-
pitality zone enforcement in FY 2017. How-
ever, the plan has not been approved at this
time, so any change in projected revenue
from an expansion of hospitality zones in
Uptown has not been included in the Pro-
posed Budget.
Mobile Payment Pilot
Since September 2015 in Uptown and Feb-
ruary 2016 in Downtown, the City Treasur-
er has been piloting Parkmobile, a mobile
app that allows users to pay for parking via
their phones. The app also allows users to
extend their parking time remotely, as long
as they have not already reached the me-
ter’s maximum. Approximately 850 meters
in Uptown and 450 meters in Downtown
accept mobile pay as part of this pilot,
which will end in September 2016. The City
incurs no costs associated with the pilot,
but Parkmobile charges a transaction fee to
the customer for the service.
Vehicle Detection Sensors Pilot
The City Treasurer is also planning a six-
month pilot of vehicle detection sensors in
the first half of FY 2017. The sensors will be
located inside the meter dome, and will
provide real-time parking utilization data.
The data could be used to develop an app
that could direct drivers to available park-
ing. It could also be used by the City to:
guide enforcement (e.g. sensors could alert
officers to occupied spaces that have not
been paid for); and to determine better
rates and hours of enforcement. The pilot is
expected to include a total of approximately
200 meters in Uptown and Downtown. The
proposed pilot is at no cost to the City, and
will begin upon execution of the pilot agree-
ment; however, should the City wish to ex-
pand the program after the pilot, there
would likely be one-time costs associated
with the purchase of each sensor, as well as
ongoing communication fees for data.
54
Department Review: Citywide Program Expenditures
Office of the Independent Budget Analyst
April 2017
Citywide Program Expenditures
Mayor’s FY 2017 Proposed
Adjustments
The FY 2017 Proposed Budget for the
Citywide Program Expenditures Depart-
ment totals $114.4 million, an increase of
$24.8 million from the FY 2016 Adopted
Budget.
Highlights of certain expenditures are in-
cluded in the next few pages.
Reserves and Public Liability Claims
Contributions to the Public Liability Operat-
ing and Reserve Funds and General Fund
Reserve are typically budgeted in Citywide
Program Expenditures.
General Fund Reserve
A General Fund Reserve contribution of
$7.6 million is budgeted for FY 2017. There
was no contribution budgeted for FY 2016.
The increased contribution is the result of
increased revenues, combined with the re-
cent increase in the overall General Fund
Reserve target—from 14% of General Fund
operating revenues to 16.7%.
The increase toward the new 16.7% target
will be phased in over six years, beginning in
FY 2016. For FY 2016, it is anticipated that
there will be enough fund balance to meet
the first-year target increase from 14% to
14.5%. The FY 2017 proposed contribution
of $7.6 million will bring the reserve to the
14.75% target for FY 2017, which equals
$172.3 million. See the General Fund Re-
serve section of this report (under Signifi-
cant Citywide Issues) for more information.
Public Liability Operations
The FY 2017 Proposed Budget includes
$25.2 million to support the Public Liability
(PL) Operating Fund, up $6.6 million from
the $18.6 million in the FY 2016 Adopted
Budget.
For FY 2016 the PL Operating Fund re-
ceived an additional $20.1 million in funding
from City sources, due to increased claims
payouts. This additional funding includes a
$15.0 million transfer from the PL Reserve,
a $2.0 million transfer from the De Anza
Operating Fund, and a $3.1 million addition-
al contribution amount noted in the Mid-
Year Report. See the Public Liability Funds
section of this report (under Significant
Citywide Issues) for more information.
Public Liability Reserve
For FY 2016 there was no budgeted Gen-
eral Fund transfer to support the PL Re-
serve, as the required amounts had been
pre-funded in FY 2015. However, as stated
above, the PL Reserve was reduced in FY
2016 by a $15.0 million transfer to the PL
Operating Fund.
To increase the Reserve balance, a FY 2016
Mid-Year Budget Adjustment of $5.8 million
was requested by the Financial Management
Department and approved by Council. Ad-
ditionally, $5.0 million in insurance reim-
bursement (related to the De La Fuente
settlement) increased the PL Reserve bal-
ance.
For the PL Reserve to reach its FY 2016 40%
reserve requirement of $36.7 million, it is antici-
55
Department Review: Citywide Program Expenditures
Office of the Independent Budget Analyst
April 2017
pated that the PL Reserve will need an addition-
al $3.0 million transfer from General Fund Ex-
cess Equity. This amount is anticipated to be
included in the FY 2016 Year-End Budget Ad-
justment requests.
For the FY 2017 Proposed Budget, there is
$2.8 million included as a contribution to
the PL Reserve. This amount, combined
with FY 2018 and FY 2019 contributions,
will provide the additional $9.2 million an-
ticipated as needed to reach the overall Re-
serve target (which is 50% funding of the PL
actuarial liability).
Corporate Master Lease Rent
The City leases various facilities, such as
office space and warehouses, from private
parties to house some City employees and
support the daily operations of the City.
The budgeted amount for corporate master
lease rent is increasing by $1.6 million, from
$10.4 million in FY 2016 to $12.0 million in
the FY 2017 Proposed Budget. This is large-
ly due to increases related to the Civic
Center Plaza.
Animal Services
The City contracts with the County of San
Diego to provide “Animal Services” (animal
control, shelter, trapping, etc.). The FY
2017 Animal Services budget amount of
$9.4 million has increased by $444,000 from
the FY 2016 Adopted Budget.
Citywide Elections
The FY 2017 Proposed Budget for Citywide
Elections is unchanged from the FY 2016
Adopted Budget, at $4.2 million. Primary
election races for Mayor, City Attorney,
and Council Districts 1, 3, 5, 7, and 9 occur
in June 2016, for which funding is included
in the FY 2016 Budget. Possible run-offs to
these elections will occur in the November
2016 General Election, for which funding is
included in the FY 2017 Proposed Budget.
The elections amounts in the FY 2016 Budg-
et and FY 2017 Proposed Budget include
preliminary estimates for ballot proposition
costs. Actual costs can vary and will depend
on the number of ballot measures, number
of candidates, and number of items each
County jurisdiction places on the ballot.
For the November General Election in FY
2017, there are signature gathering efforts
currently underway for several ballot
measures that, if successful, would appear
on the November ballot; and two of those
measures would be lengthy. Additionally,
there are anticipated propositions for revi-
sions to the City Charter, resulting from
the Charter Review Committee’s work.
For FY 2016, the most recent estimate for
June Primary costs is $5.2 million, $1.0 mil-
lion higher than the amount projected at
Mid-Year. There are nine ballot measures,
estimated to cost $4.2 million; and $1.0 mil-
lion is the current estimate for the candi-
date races. FY 2017 may prove to be more
expensive, as the State has numerous initia-
tives for the November election that could
increase costs for each jurisdiction, includ-
ing the City; and there are a number of po-
tential ballot measures as stated above.
These issues will be closely monitored by
the City Clerk as information becomes
available.
CIP Debt Service
The $21.0 million in FY 2017 debt service
payments for deferred capital bonds are
budgeted in Citywide Program Expenditures
56
Department Review: Citywide Program Expenditures
Office of the Independent Budget Analyst
April 2017
as follows:
$7.3 million for the $100 million 2010A
Refunding issuance (known as “DC1”)
$4.6 million for the $75 million 2012A
issuance (known as “DC2”)
$2.2 million for the $35 million 2013A
issuance (known as “DC2A”)
$6.9 million for the $120 million 2015
A&B issuance (known as “DC3”)
Transfer to Park Improvement Funds
The City Charter sets the threshold
amount of Mission Bay rents and concession
revenues that are to be placed into the
General Fund for any municipal purpose,
without restriction, at $20.0 million. The
remainder of funds greater than the thresh-
old amount will be allocated to the San Die-
go Regional Park Improvements Fund and
the Mission Bay Park Improvements Fund
each year.
The amount above the $20.0 million thresh-
old to be transferred to the Park Improve-
ment Funds is budgeted in Citywide Pro-
gram Expenditures. That amount has in-
creased in the FY 2017 Proposed Budget by
$2.3 million—from $8.7 million to $11.0
million. This increase is due to an anticipat-
ed increase in Mission Bay Park lease reve-
nues. Note that revenue from Mission Bay
Park rents and concessions is budgeted in
the Real Estate Assets Department.
Public Use Leases
The public use lease expenditures are relat-
ed to the use of parking lots in Las Ameri-
cas and Imperial Marketplace for the park
and ride program. The FY 2017 Proposed
Budget for the public use leases is $1.6 mil-
lion, unchanged from FY 2016.
57
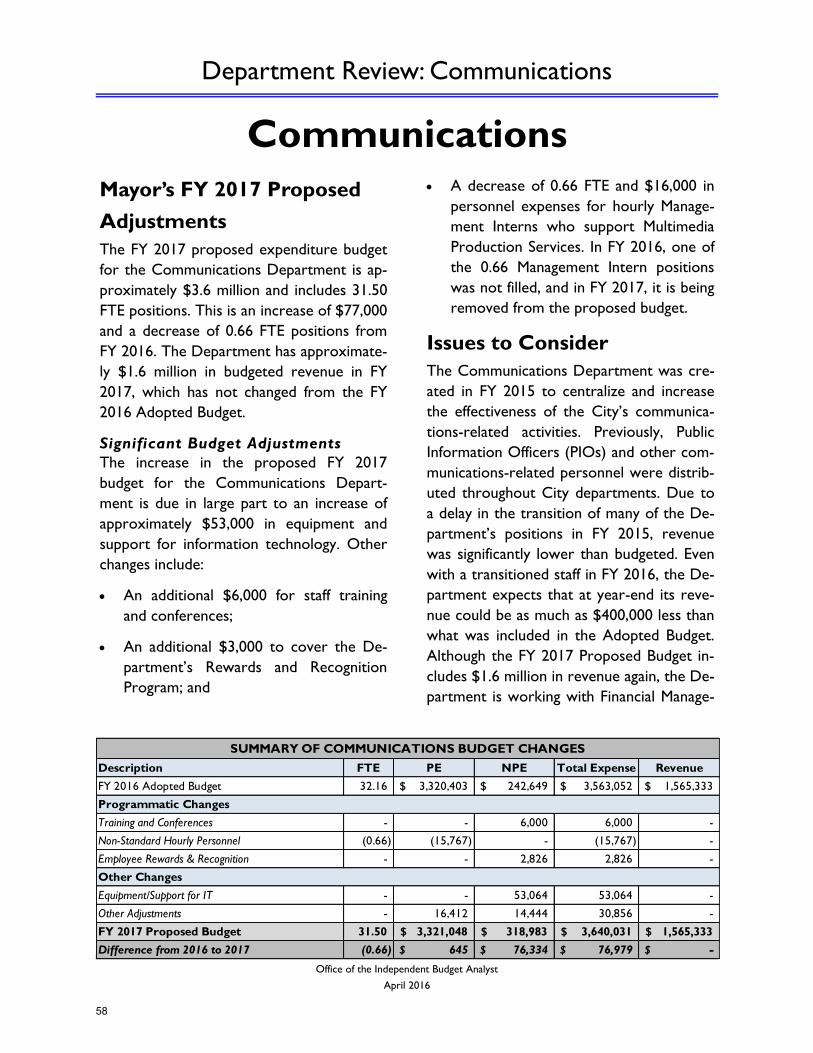
Department Review: Communications
Office of the Independent Budget Analyst
April 2016
Communications
Mayor’s FY 2017 Proposed
Adjustments
The FY 2017 proposed expenditure budget
for the Communications Department is ap-
proximately $3.6 million and includes 31.50
FTE positions. This is an increase of $77,000
and a decrease of 0.66 FTE positions from
FY 2016. The Department has approximate-
ly $1.6 million in budgeted revenue in FY
2017, which has not changed from the FY
2016 Adopted Budget.
Significant Budget Adjustments
The increase in the proposed FY 2017
budget for the Communications Depart-
ment is due in large part to an increase of
approximately $53,000 in equipment and
support for information technology. Other
changes include:
An additional $6,000 for staff training
and conferences;
An additional $3,000 to cover the De-
partment’s Rewards and Recognition
Program; and
A decrease of 0.66 FTE and $16,000 in
personnel expenses for hourly Manage-
ment Interns who support Multimedia
Production Services. In FY 2016, one of
the 0.66 Management Intern positions
was not filled, and in FY 2017, it is being
removed from the proposed budget.
Issues to Consider
The Communications Department was cre-
ated in FY 2015 to centralize and increase
the effectiveness of the City’s communica-
tions-related activities. Previously, Public
Information Officers (PIOs) and other com-
munications-related personnel were distrib-
uted throughout City departments. Due to
a delay in the transition of many of the De-
partment’s positions in FY 2015, revenue
was significantly lower than budgeted. Even
with a transitioned staff in FY 2016, the De-
partment expects that at year-end its reve-
nue could be as much as $400,000 less than
what was included in the Adopted Budget.
Although the FY 2017 Proposed Budget in-
cludes $1.6 million in revenue again, the De-
partment is working with Financial Manage-
Description FTE PE NPE Total Expense Revenue
FY 2016 Adopted Budget 32.16 3,320,403$ 242,649$ 3,563,052$ 1,565,333$
Training and Conferences - - 6,000 6,000 -
Non-Standard Hourly Personnel (0.66) (15,767) - (15,767) -
Employee Rewards & Recognition - - 2,826 2,826 -
Equipment/Support for IT - - 53,064 53,064 -
Other Adjustments - 16,412 14,444 30,856 -
FY 2017 Proposed Budget 31.50 3,321,048$ 318,983$ 3,640,031$ 1,565,333$
Difference from 2016 to 2017 (0.66) 645$ 76,334$ 76,979$ -$
SUMMARY OF COMMUNICATIONS BUDGET CHANGES
Programmatic Changes
Other Changes
58
Department Review: Communications
Office of the Independent Budget Analyst
April 2016
ment to right-size its revenues for future
budgets.
Looking Ahead
In January 2016, the Department launched
the website InsideSanDiego.org to show the
human interest side of the City’s work. The
Department produces videos and short arti-
cles that can be shared through social me-
dia, and posts them on its website. Site traf-
fic has grown steadily since the launch, but
the Department notes that engaging with
the public via the website and its other so-
cial media platforms will continue to be a
priority in FY 2017.
In FY 2017, the Department indicates that it
will also:
Launch the Citywide Communications
plan by December 31, 2016. The plan
will serve as a two-year outlook of ma-
jor initiatives and projects in order to
support coordinated messaging and out-
reach.
Develop its presentation and media
training modules, which will be used for
its group training sessions for City
spokespersons.
Prioritize outreach to Councilmember
Offices. With the new Director and
Deputy Director of Communications
now in place, the Department is work-
ing to improve outreach to Coun-
cilmember offices. This is in response to
last year’s Budget Review Committee
hearing when Councilmembers ex-
pressed concern that at times they were
not informed when important media-
related issues arose in their districts.
59
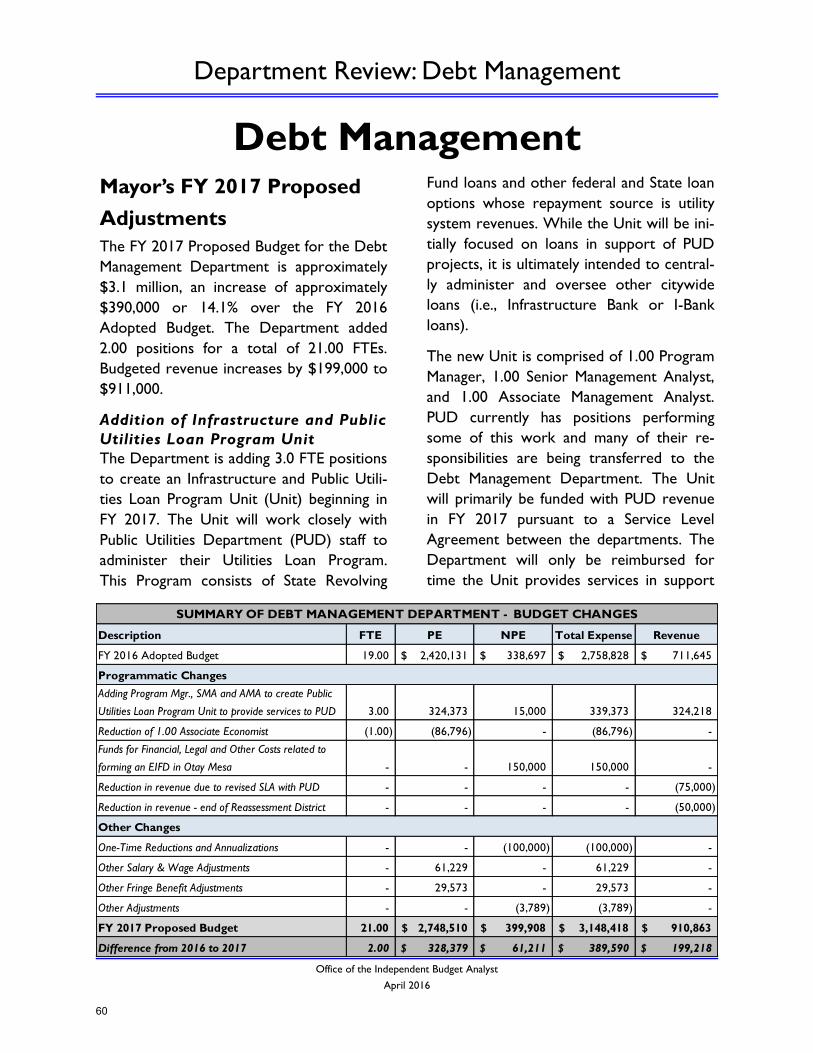
Department Review: Debt Management
Office of the Independent Budget Analyst
April 2016
Debt Management
Mayor’s FY 2017 Proposed
Adjustments
The FY 2017 Proposed Budget for the Debt
Management Department is approximately
$3.1 million, an increase of approximately
$390,000 or 14.1% over the FY 2016
Adopted Budget. The Department added
2.00 positions for a total of 21.00 FTEs.
Budgeted revenue increases by $199,000 to
$911,000.
Addition of Infrastructure and Public
Utilities Loan Program Unit
The Department is adding 3.0 FTE positions
to create an Infrastructure and Public Utili-
ties Loan Program Unit (Unit) beginning in
FY 2017. The Unit will work closely with
Public Utilities Department (PUD) staff to
administer their Utilities Loan Program.
This Program consists of State Revolving
Fund loans and other federal and State loan
options whose repayment source is utility
system revenues. While the Unit will be ini-
tially focused on loans in support of PUD
projects, it is ultimately intended to central-
ly administer and oversee other citywide
loans (i.e., Infrastructure Bank or I-Bank
loans).
The new Unit is comprised of 1.00 Program
Manager, 1.00 Senior Management Analyst,
and 1.00 Associate Management Analyst.
PUD currently has positions performing
some of this work and many of their re-
sponsibilities are being transferred to the
Debt Management Department. The Unit
will primarily be funded with PUD revenue
in FY 2017 pursuant to a Service Level
Agreement between the departments. The
Department will only be reimbursed for
time the Unit provides services in support
Description FTE PE NPE Total Expense Revenue
FY 2016 Adopted Budget 19.00 2,420,131$ 338,697$ 2,758,828$ 711,645$
Adding Program Mgr., SMA and AMA to create Public
Utilities Loan Program Unit to provide services to PUD 3.00 324,373 15,000 339,373 324,218
Reduction of 1.00 Associate Economist (1.00) (86,796) - (86,796) -
Funds for Financial, Legal and Other Costs related to
forming an EIFD in Otay Mesa - - 150,000 150,000 -
Reduction in revenue due to revised SLA with PUD - - - - (75,000)
Reduction in revenue - end of Reassessment District - - - - (50,000)
One-Time Reductions and Annualizations - - (100,000) (100,000) -
Other Salary & Wage Adjustments - 61,229 - 61,229 -
Other Fringe Benefit Adjustments - 29,573 - 29,573 -
Other Adjustments - - (3,789) (3,789) -
FY 2017 Proposed Budget 21.00 2,748,510$ 399,908$ 3,148,418$ 910,863$
Difference from 2016 to 2017 2.00 328,379$ 61,211$ 389,590$ 199,218$
SUMMARY OF DEBT MANAGEMENT DEPARTMENT - BUDGET CHANGES
Programmatic Changes
Other Changes
60
Department Review: Debt Management
Office of the Independent Budget Analyst
April 2016
of PUD projects. Any non-billable work
performed by the Unit will be an unbudget-
ed expense borne by the General Fund.
Funding for Formation of Otay Mesa
Enhanced Infrastructure Financing
District (EIFD)
An EIFD is a special district established in
accordance with State law that allows for
the use of specific property tax increment
within the district to finance the construc-
tion or rehabilitation of a wide variety of
public infrastructure and private facilities.
The Department received a one-time allo-
cation of $100,000 in the FY 2016 Adopted
Budget to hire consultants to evaluate the
feasibility of forming an EIFD in Otay Mesa.
The consultant has started working on the
project, however, staff does not expect to
be invoiced for the work in FY 2016. The
Department has requested $150,000 for
this work in FY 2017 to support:
formation counsel services ($50,000),
the fiscal consultant’s report and analysis
($80,000), and
other miscellaneous expenditures to
conduct a district election and facilitate
district board activities ($20,000).
The Department is coordinating EIFD for-
mation efforts with staff in the Planning and
Economic Development departments. Addi-
tionally, staff is reviewing infrastructure
needs identified in the Otay Mesa Facilities
Financing Plan to plan for potential EIFD
funding.
Reduction of 1.00 Associate Econo-
mist Position
The Department is eliminating 1.00 Associ-
ate Economist position as part of an internal
staff reorganization. Rather than having ana-
lysts assigned to particular projects and
work units, the Department intends to as-
sign analysts based on workload demands.
Department management indicates they can
handle their anticipated workload in FY
2017 with 6.00 analysts/economists rather
than the 7.00 currently budgeted.
Reduction in Budgeted Revenue
The Department is reducing budgeted reve-
nue by $75,000 to reflect a reduction in fi-
nancing services to the PUD (associated
with the water system) as there are no
bond issuances planned for FY 2017. Budg-
eted revenue is reduced by another
$50,000 because bonds for Assessment Dis-
trict 1999-1 have been paid off and the De-
partment will no longer be reimbursed this
amount for annual administrative services
provided in support of the District.
Other Budget Changes
The FY 2017 Proposed Budget removes the
one-time $100,000 addition of non-
personnel expense in FY 2016 for the EIFD
feasibility consultant. Other salary and wage
adjustments increased the Department’s FY
2017 Budget by $61,000 and other fringe
benefit adjustments further increased the
budget by $30,000.
Implementation of a Commercial
Paper Borrowing Program
The Department is planning to return to
Council early in FY 2017 for approval of
initial actions to authorize a Commercial
Paper Borrowing Program. The Program
will initially be used for water system capital
needs and may be used for citywide infra-
structure borrowing in the fall. The Depart-
ment believes they have sufficient staff to
administer this Program in FY 2017.
61
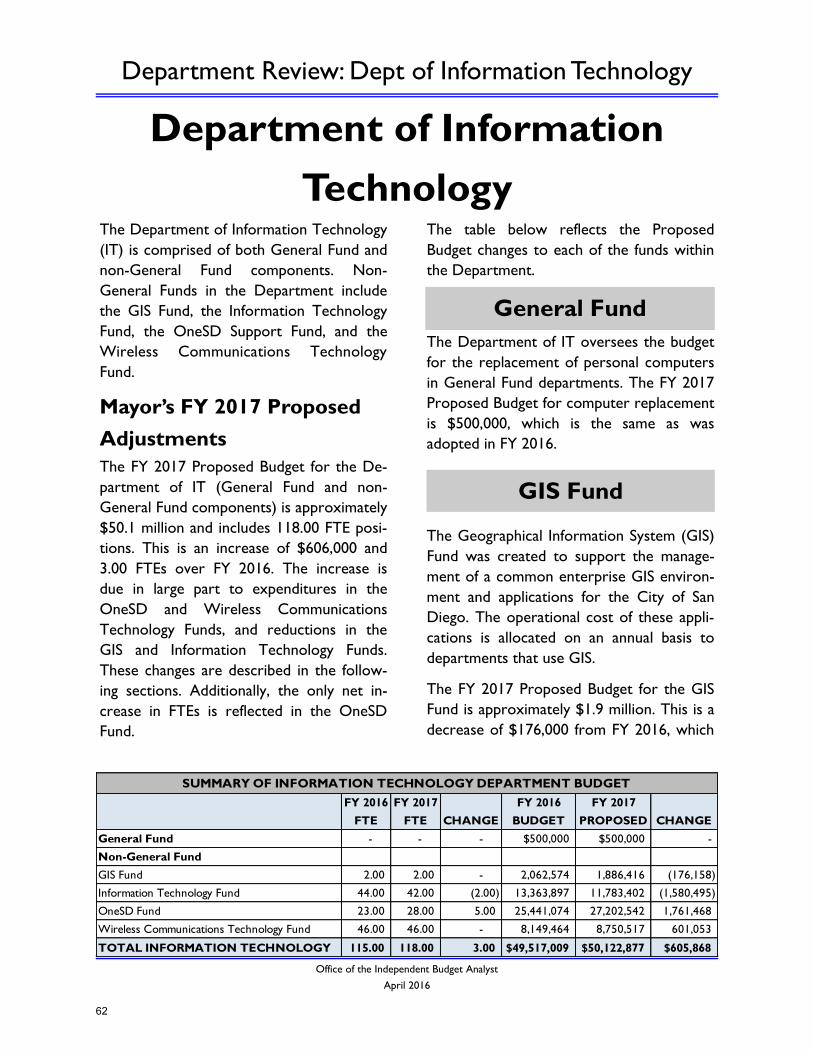
Department Review: Dept of Information Technology
Office of the Independent Budget Analyst
April 2016
Department of Information
Technology The Department of Information Technology
(IT) is comprised of both General Fund and
non-General Fund components. Non-
General Funds in the Department include
the GIS Fund, the Information Technology
Fund, the OneSD Support Fund, and the
Wireless Communications Technology
Fund.
Mayor’s FY 2017 Proposed
Adjustments
The FY 2017 Proposed Budget for the De-
partment of IT (General Fund and non-
General Fund components) is approximately
$50.1 million and includes 118.00 FTE posi-
tions. This is an increase of $606,000 and
3.00 FTEs over FY 2016. The increase is
due in large part to expenditures in the
OneSD and Wireless Communications
Technology Funds, and reductions in the
GIS and Information Technology Funds.
These changes are described in the follow-
ing sections. Additionally, the only net in-
crease in FTEs is reflected in the OneSD
Fund.
The table below reflects the Proposed
Budget changes to each of the funds within
the Department.
The Department of IT oversees the budget
for the replacement of personal computers
in General Fund departments. The FY 2017
Proposed Budget for computer replacement
is $500,000, which is the same as was
adopted in FY 2016.
The Geographical Information System (GIS)
Fund was created to support the manage-
ment of a common enterprise GIS environ-
ment and applications for the City of San
Diego. The operational cost of these appli-
cations is allocated on an annual basis to
departments that use GIS.
The FY 2017 Proposed Budget for the GIS
Fund is approximately $1.9 million. This is a
decrease of $176,000 from FY 2016, which
General Fund
GIS Fund
FY 2016
FTE
FY 2017
FTE CHANGE
FY 2016
BUDGET
FY 2017
PROPOSED CHANGE
General Fund - - - $500,000 $500,000 -
Non-General Fund
GIS Fund 2.00 2.00 - 2,062,574 1,886,416 (176,158)
Information Technology Fund 44.00 42.00 (2.00) 13,363,897 11,783,402 (1,580,495)
OneSD Fund 23.00 28.00 5.00 25,441,074 27,202,542 1,761,468
Wireless Communications Technology Fund 46.00 46.00 - 8,149,464 8,750,517 601,053
TOTAL INFORMATION TECHNOLOGY 115.00 118.00 3.00 $49,517,009 $50,122,877 $605,868
SUMMARY OF INFORMATION TECHNOLOGY DEPARTMENT BUDGET
62
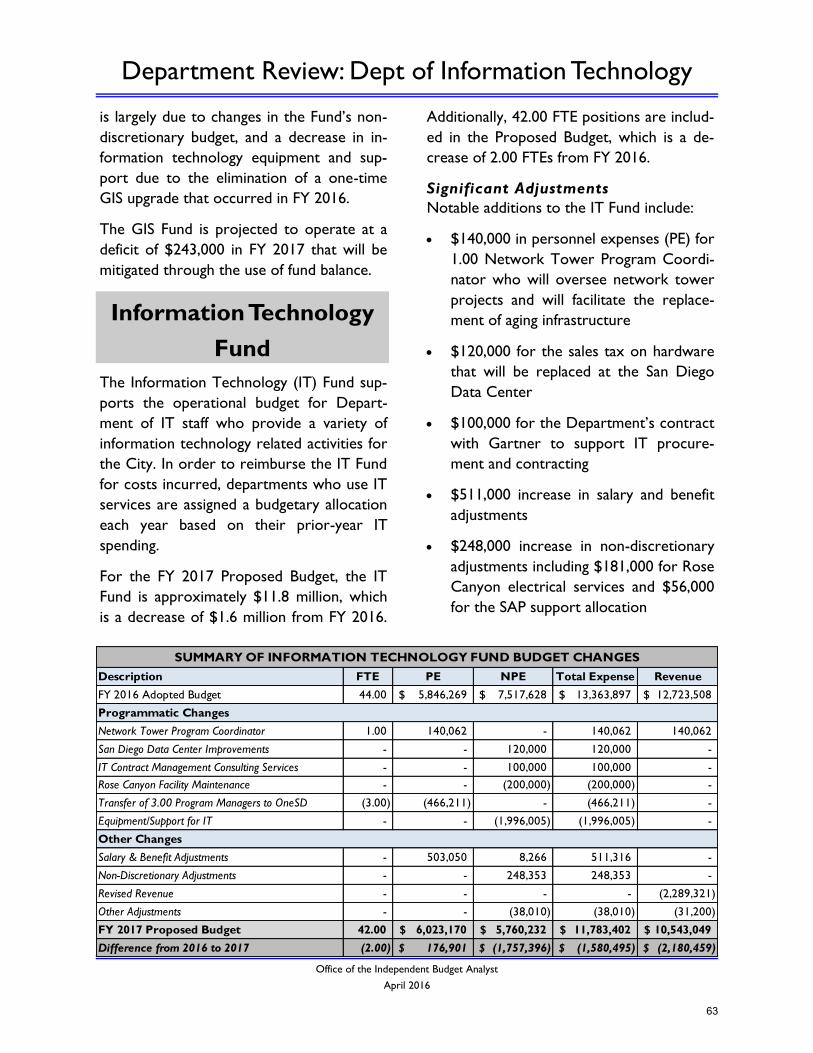
Department Review: Dept of Information Technology
Office of the Independent Budget Analyst
April 2016
is largely due to changes in the Fund’s non-
discretionary budget, and a decrease in in-
formation technology equipment and sup-
port due to the elimination of a one-time
GIS upgrade that occurred in FY 2016.
The GIS Fund is projected to operate at a
deficit of $243,000 in FY 2017 that will be
mitigated through the use of fund balance.
The Information Technology (IT) Fund sup-
ports the operational budget for Depart-
ment of IT staff who provide a variety of
information technology related activities for
the City. In order to reimburse the IT Fund
for costs incurred, departments who use IT
services are assigned a budgetary allocation
each year based on their prior-year IT
spending.
For the FY 2017 Proposed Budget, the IT
Fund is approximately $11.8 million, which
is a decrease of $1.6 million from FY 2016.
Additionally, 42.00 FTE positions are includ-
ed in the Proposed Budget, which is a de-
crease of 2.00 FTEs from FY 2016.
Significant Adjustments
Notable additions to the IT Fund include:
$140,000 in personnel expenses (PE) for
1.00 Network Tower Program Coordi-
nator who will oversee network tower
projects and will facilitate the replace-
ment of aging infrastructure
$120,000 for the sales tax on hardware
that will be replaced at the San Diego
Data Center
$100,000 for the Department’s contract
with Gartner to support IT procure-
ment and contracting
$511,000 increase in salary and benefit
adjustments
$248,000 increase in non-discretionary
adjustments including $181,000 for Rose
Canyon electrical services and $56,000
for the SAP support allocation
Information Technology
Fund
Description FTE PE NPE Total Expense Revenue
FY 2016 Adopted Budget 44.00 5,846,269$ 7,517,628$ 13,363,897$ 12,723,508$
Network Tower Program Coordinator 1.00 140,062 - 140,062 140,062
San Diego Data Center Improvements - - 120,000 120,000 -
IT Contract Management Consulting Services - - 100,000 100,000 -
Rose Canyon Facility Maintenance - - (200,000) (200,000) -
Transfer of 3.00 Program Managers to OneSD (3.00) (466,211) - (466,211) -
Equipment/Support for IT - - (1,996,005) (1,996,005) -
Salary & Benefit Adjustments - 503,050 8,266 511,316 -
Non-Discretionary Adjustments - - 248,353 248,353 -
Revised Revenue - - - - (2,289,321)
Other Adjustments - - (38,010) (38,010) (31,200)
FY 2017 Proposed Budget 42.00 6,023,170$ 5,760,232$ 11,783,402$ 10,543,049$
Difference from 2016 to 2017 (2.00) 176,901$ (1,757,396)$ (1,580,495)$ (2,180,459)$
SUMMARY OF INFORMATION TECHNOLOGY FUND BUDGET CHANGES
Programmatic Changes
Other Changes
63
Department Review: Dept of Information Technology
Office of the Independent Budget Analyst
April 2016
Significant reductions to the IT fund include:
$200,000 in expenditures that are no
longer needed for Rose Canyon mainte-
nance
$466,000 decrease in PE due to the
transfer of 3.0 Program Managers to the
OneSD Fund. These Program Managers
provide SAP security, and this transfer
aligns the budget with the work provid-
ed
$2.0 million decrease in IT equipment
and support due to the removal of one-
time expenses from last year’s budget,
including funding for the new website
and single sign-on projects
A decrease in revenue of approximately
$2.3 million reflects the allocation of
citywide transfers in FY 2017. The Infor-
mation Technology Fund is projected to
operate at a deficit of $1.2 million in FY
2017, which will be mitigated through the
use of fund balance.
Issues to Consider
The Department of IT is continuing to de-
velop its application roadmap, which formal-
izes its technology planning process. The
Department notes that it is working with
other departments to better understand
their application needs, and will leverage its
new Project Management Office (PMO) to
identify opportunities for consolidating the
number of citywide applications. To facili-
tate this effort and improve the Depart-
ment’s ability to forecast and govern
citywide IT projects, it requested $157,000
in personnel expenditures and $2,000 in
related non-personnel expenditures for
1.00 Program Manager position; however,
this position was not included in the Pro-
posed Budget. The position was originally
budgeted for in FY 2016, but was repur-
posed for cyber security monitoring to sup-
port the Department’s more urgent needs.
The Department has indicated that its Tow-
er Managers and new Program Management
Office will absorb this work, and that it will
reassess its need for this position in the fu-
ture. Given the benefit of forecasting the
City’s application needs and opportunity
for cost savings, the IBA recommends
that the Department track its staffing
needs for this work closely. Additionally,
we recommend that the Council request
an update at a future Committee meet-
ing about the development of the Depart-
ment’s IT application roadmap, its priori-
tization of projects, and its identification
of related cost saving opportunities.
Update Regarding the City’s IT
Sourcing Strategy
The CGI contract extension for application
development and maintenance services was
approved by the City Council on April 19,
2016. The Department also has two con-
tracts with Atos: one for network services,
and a second for data center, help desk, and
desktop support. These five-year contracts
with Atos will end in FY 2017 and FY 2018,
but have two-year renewal options. The
City has begun meeting with the Atos man-
agement team to discuss the potential for
contract extensions, but has not yet made a
decision about whether it will extend the
contracts or issue RFPs for this work. If the
City exercises its two-year renewal options,
potential transition costs would be deferred
for 3-4 years; however, if an RFP is pursued,
transition costs may need to be added to
the budget.
64
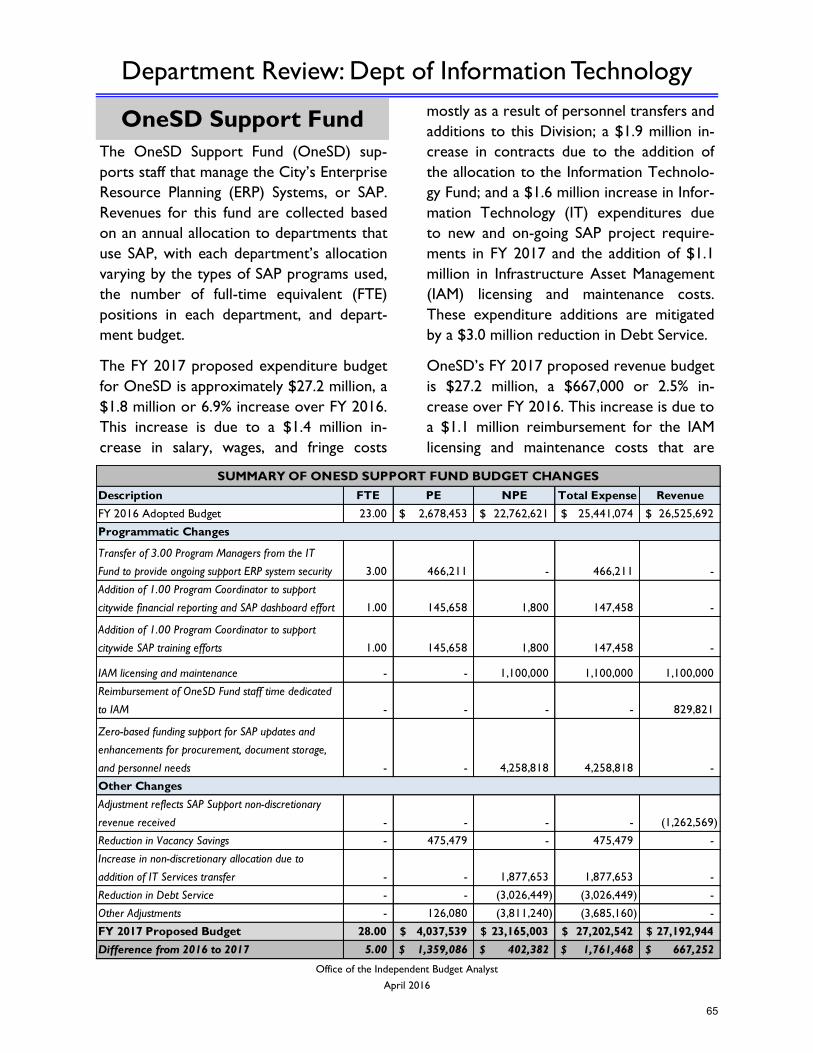
Department Review: Dept of Information Technology
Office of the Independent Budget Analyst
April 2016
The OneSD Support Fund (OneSD) sup-
ports staff that manage the City’s Enterprise
Resource Planning (ERP) Systems, or SAP.
Revenues for this fund are collected based
on an annual allocation to departments that
use SAP, with each department’s allocation
varying by the types of SAP programs used,
the number of full-time equivalent (FTE)
positions in each department, and depart-
ment budget.
The FY 2017 proposed expenditure budget
for OneSD is approximately $27.2 million, a
$1.8 million or 6.9% increase over FY 2016.
This increase is due to a $1.4 million in-
crease in salary, wages, and fringe costs
mostly as a result of personnel transfers and
additions to this Division; a $1.9 million in-
crease in contracts due to the addition of
the allocation to the Information Technolo-
gy Fund; and a $1.6 million increase in Infor-
mation Technology (IT) expenditures due
to new and on-going SAP project require-
ments in FY 2017 and the addition of $1.1
million in Infrastructure Asset Management
(IAM) licensing and maintenance costs.
These expenditure additions are mitigated
by a $3.0 million reduction in Debt Service.
OneSD’s FY 2017 proposed revenue budget
is $27.2 million, a $667,000 or 2.5% in-
crease over FY 2016. This increase is due to
a $1.1 million reimbursement for the IAM
licensing and maintenance costs that are
OneSD Support Fund
Description FTE PE NPE Total Expense Revenue
FY 2016 Adopted Budget 23.00 2,678,453$ 22,762,621$ 25,441,074$ 26,525,692$
Transfer of 3.00 Program Managers from the IT
Fund to provide ongoing support ERP system security 3.00 466,211 - 466,211 -
Addition of 1.00 Program Coordinator to support
citywide financial reporting and SAP dashboard effort 1.00 145,658 1,800 147,458 -
Addition of 1.00 Program Coordinator to support
citywide SAP training efforts 1.00 145,658 1,800 147,458 -
IAM licensing and maintenance - - 1,100,000 1,100,000 1,100,000
Reimbursement of OneSD Fund staff time dedicated
to IAM - - - - 829,821
Zero-based funding support for SAP updates and
enhancements for procurement, document storage,
and personnel needs - - 4,258,818 4,258,818 -
Adjustment reflects SAP Support non-discretionary
revenue received - - - - (1,262,569)
Reduction in Vacancy Savings - 475,479 - 475,479 -
Increase in non-discretionary allocation due to
addition of IT Services transfer - - 1,877,653 1,877,653 -
Reduction in Debt Service - - (3,026,449) (3,026,449) -
Other Adjustments - 126,080 (3,811,240) (3,685,160) -
FY 2017 Proposed Budget 28.00 4,037,539$ 23,165,003$ 27,202,542$ 27,192,944$
Difference from 2016 to 2017 5.00 1,359,086$ 402,382$ 1,761,468$ 667,252$
SUMMARY OF ONESD SUPPORT FUND BUDGET CHANGES
Programmatic Changes
Other Changes
65
Department Review: Dept of Information Technology
Office of the Independent Budget Analyst
April 2016
budgeted in this fund, and to projected rev-
enue of $830,000 for OneSD staff time ded-
icated to the IAM project. These additions
are off-set by a $1.3 million reduction in
revenues from the non-discretionary SAP
Support Allocation. Our Office notes that
funding for the IAM capital improvement
program (CIP) project will no longer be
budgeted in the OneSD Fund, it will be
budgeted in a separate fund administered by
the Public Utilities Department. Funds pre-
viously budgeted in OneSD for the IAM CIP
will continue to be reflected in the Divi-
sion’s revenue and expense statement until
they are fully expended.
Significant Adjustments
OneSD requested and received 2.00 Pro-
gram Coordinator positions in FY 2017,
1.00 FTE position to support citywide train-
ing efforts and 1.00 FTE position to work
on financial reporting and an SAP dash-
board. Our Office notes that any work on a
dashboard in FY 2017 would be prelimi-
nary—at this time there is no project scope
or timeline—and that this dashboard would
most likely draw primarily from SAP data
and be considered for “internal” use as op-
posed to the more “external-facing” dash-
board project budgeted in the Performance
& Analytics Department. As City dash-
board projects move forward our Office
recommends that the City Council re-
ceive project updates and review metrics
for, and request access to, dashboard data
in both the OneSD and Performance &
Analytics projects, in order to better facil-
itate legislative decision-making and in-
crease government transparency.
Other personnel changes in OneSD include
the transfer of 3.00 Program Managers from
the IT Fund to OneSD to provide system
security. This transfer aligns the budget with
work provided: these positions have been
working on SAP security and budgeting
them directly in this fund reflects the cost
of providing SAP services. The FY 2017 Pro-
posed Budget also reflects the exemption of
6.00 FTE positions from the classified ser-
vice that was approved by the City Council
in FY 2016.
As noted above, OneSD’s IT expenditure
budget increased by approximately $1.6 mil-
lion in FY 2017 due mainly to the addition
of $1.1 million in reimbursable IAM licensing
and maintenance costs. Funding for the im-
plementation and maintenance of citywide
SAP projects and modules is zero-based
each year, and is usually budgeted in OneSD
in order to appropriately allocate the cost
to end-users, while department-specific SAP
needs are budgeted in the departments who
are requesting them. SAP enhancements
and upgrades may vary from year-to-year as
one citywide or department-specific project
or phase ends and another begins. Projects
budgeted in FY 2017 include:
Enhancements to the City’s procure-
ment module including catalog shopping
and system controls for contract com-
pliance
Automation of various personnel ac-
tions (including new hire/rehire paper-
work, leave of absence forms, and or-
ganization reassignments) currently au-
thorized via paper forms
Upgrades to the City’s storage infra-
structure
These projects were included as part of the
FY 2017 projection in the SAP timeline that
was presented at the Budget and Govern-
66
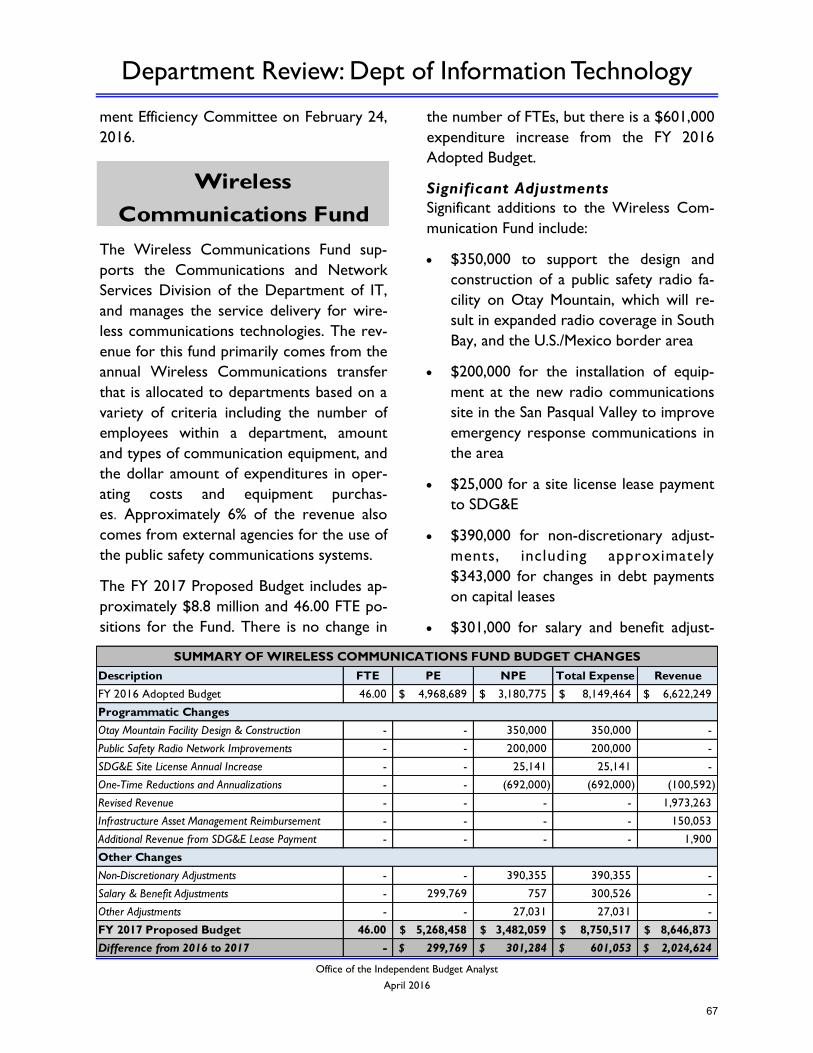
Department Review: Dept of Information Technology
Office of the Independent Budget Analyst
April 2016
ment Efficiency Committee on February 24,
2016.
The Wireless Communications Fund sup-
ports the Communications and Network
Services Division of the Department of IT,
and manages the service delivery for wire-
less communications technologies. The rev-
enue for this fund primarily comes from the
annual Wireless Communications transfer
that is allocated to departments based on a
variety of criteria including the number of
employees within a department, amount
and types of communication equipment, and
the dollar amount of expenditures in oper-
ating costs and equipment purchas-
es. Approximately 6% of the revenue also
comes from external agencies for the use of
the public safety communications systems.
The FY 2017 Proposed Budget includes ap-
proximately $8.8 million and 46.00 FTE po-
sitions for the Fund. There is no change in
the number of FTEs, but there is a $601,000
expenditure increase from the FY 2016
Adopted Budget.
Significant Adjustments
Significant additions to the Wireless Com-
munication Fund include:
$350,000 to support the design and
construction of a public safety radio fa-
cility on Otay Mountain, which will re-
sult in expanded radio coverage in South
Bay, and the U.S./Mexico border area
$200,000 for the installation of equip-
ment at the new radio communications
site in the San Pasqual Valley to improve
emergency response communications in
the area
$25,000 for a site license lease payment
to SDG&E
$390,000 for non-discretionary adjust-
ments, including approximately
$343,000 for changes in debt payments
on capital leases
$301,000 for salary and benefit adjust-
Wireless
Communications Fund
Description FTE PE NPE Total Expense Revenue
FY 2016 Adopted Budget 46.00 4,968,689$ 3,180,775$ 8,149,464$ 6,622,249$
Otay Mountain Facility Design & Construction - - 350,000 350,000 -
Public Safety Radio Network Improvements - - 200,000 200,000 -
SDG&E Site License Annual Increase - - 25,141 25,141 -
One-Time Reductions and Annualizations - - (692,000) (692,000) (100,592)
Revised Revenue - - - - 1,973,263
Infrastructure Asset Management Reimbursement - - - - 150,053
Additional Revenue from SDG&E Lease Payment - - - - 1,900
Non-Discretionary Adjustments - - 390,355 390,355 -
Salary & Benefit Adjustments - 299,769 757 300,526 -
Other Adjustments - - 27,031 27,031 -
FY 2017 Proposed Budget 46.00 5,268,458$ 3,482,059$ 8,750,517$ 8,646,873$
Difference from 2016 to 2017 - 299,769$ 301,284$ 601,053$ 2,024,624$
SUMMARY OF WIRELESS COMMUNICATIONS FUND BUDGET CHANGES
Programmatic Changes
Other Changes
67
Department Review: Dept of Information Technology
Office of the Independent Budget Analyst
April 2016
ments
The reduction of $692,000 is a result of
one-time expenditures that were included
in the FY 2016 Adopted Budget, but were
removed in FY 2017, including $500,000 for
mandated radio upgrades, and $192,000 to
pay for the sales tax associated with the fi-
nancing of the P25 Radio System.
A net increase in revenue of approximately
$2.0 million reflects:
The removal of $101,000 in one-time
revenue, which was for the Enterprise
Asset Management (EAM) reimburse-
ment in FY 2016
$2.0 million in revised revenue. In FY
2016, the Department used fund balance
to lower the cost of using the City’s
wireless communications technologies
for other departments. In FY 2017,
there is not enough fund balance to off-
set departmental costs as much as it was
in FY 2016
$150,000 for reimbursement for work
on Infrastructure Asset Management
(IAM, formerly EAM)
$2,000 from SDG&E for a sublease on
Black Mountain for communications
equipment. However, the Department
indicates that it may need to request a
revenue increase of approximately
$21,000 (for a total of $23,000) during
the May Revision because the $2,000
included in the budget is the monthly,
not the annual, revenue
The Wireless Communications Fund is pro-
jected to operate at a deficit of $104,000 in
FY 2017, which will be mitigated through
the use of fund balance.
FY 2017 Priorities
In FY 2017, significant budget adjustments in
the Wireless Communications Fund reflect
the Department’s goal of enhancing reliabil-
ity, availability, and security of technology
systems. By installing an emergency genera-
tor and power feeds at the new radio net-
work communications site in the San
Pasqual Valley, the Department is working
to improve emergency communications in
an area that has experienced major fires in
recent years. Moreover, by adding the Otay
Mountain facility, the Department is ex-
panding emergency radio coverage in the
South Bay, and U.S./Mexico border area.
These projects address the known wireless
communications gaps in the City; however,
the Department indicates that it is using
grant funding to complete a coverage gap
analysis to assess whether there are addi-
tional areas of the City that need improve-
ment. The IBA recommends the Council
request an update about this analysis, and
the gaps in service identified, once it has
been completed.
68
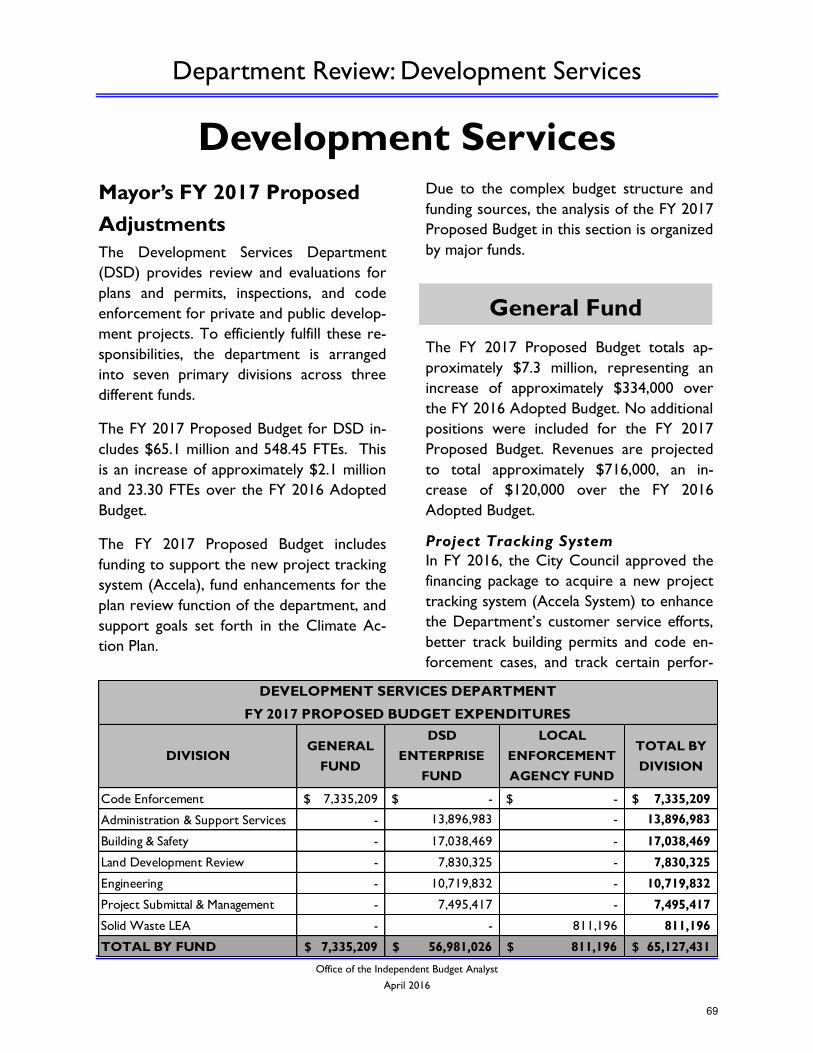
Department Review: Development Services
Office of the Independent Budget Analyst
April 2016
Development Services
Mayor’s FY 2017 Proposed
Adjustments
The Development Services Department
(DSD) provides review and evaluations for
plans and permits, inspections, and code
enforcement for private and public develop-
ment projects. To efficiently fulfill these re-
sponsibilities, the department is arranged
into seven primary divisions across three
different funds.
The FY 2017 Proposed Budget for DSD in-
cludes $65.1 million and 548.45 FTEs. This
is an increase of approximately $2.1 million
and 23.30 FTEs over the FY 2016 Adopted
Budget.
The FY 2017 Proposed Budget includes
funding to support the new project tracking
system (Accela), fund enhancements for the
plan review function of the department, and
support goals set forth in the Climate Ac-
tion Plan.
Due to the complex budget structure and
funding sources, the analysis of the FY 2017
Proposed Budget in this section is organized
by major funds.
The FY 2017 Proposed Budget totals ap-
proximately $7.3 million, representing an
increase of approximately $334,000 over
the FY 2016 Adopted Budget. No additional
positions were included for the FY 2017
Proposed Budget. Revenues are projected
to total approximately $716,000, an in-
crease of $120,000 over the FY 2016
Adopted Budget.
Project Tracking System
In FY 2016, the City Council approved the
financing package to acquire a new project
tracking system (Accela System) to enhance
the Department’s customer service efforts,
better track building permits and code en-
forcement cases, and track certain perfor-
General Fund
DIVISIONGENERAL
FUND
DSD
ENTERPRISE
FUND
LOCAL
ENFORCEMENT
AGENCY FUND
TOTAL BY
DIVISION
Code Enforcement 7,335,209$ -$ -$ 7,335,209$
Administration & Support Services - 13,896,983 - 13,896,983
Building & Safety - 17,038,469 - 17,038,469
Land Development Review - 7,830,325 - 7,830,325
Engineering - 10,719,832 - 10,719,832
Project Submittal & Management - 7,495,417 - 7,495,417
Solid Waste LEA - - 811,196 811,196
TOTAL BY FUND 7,335,209$ 56,981,026$ 811,196$ 65,127,431$
DEVELOPMENT SERVICES DEPARTMENT
FY 2017 PROPOSED BUDGET EXPENDITURES
69
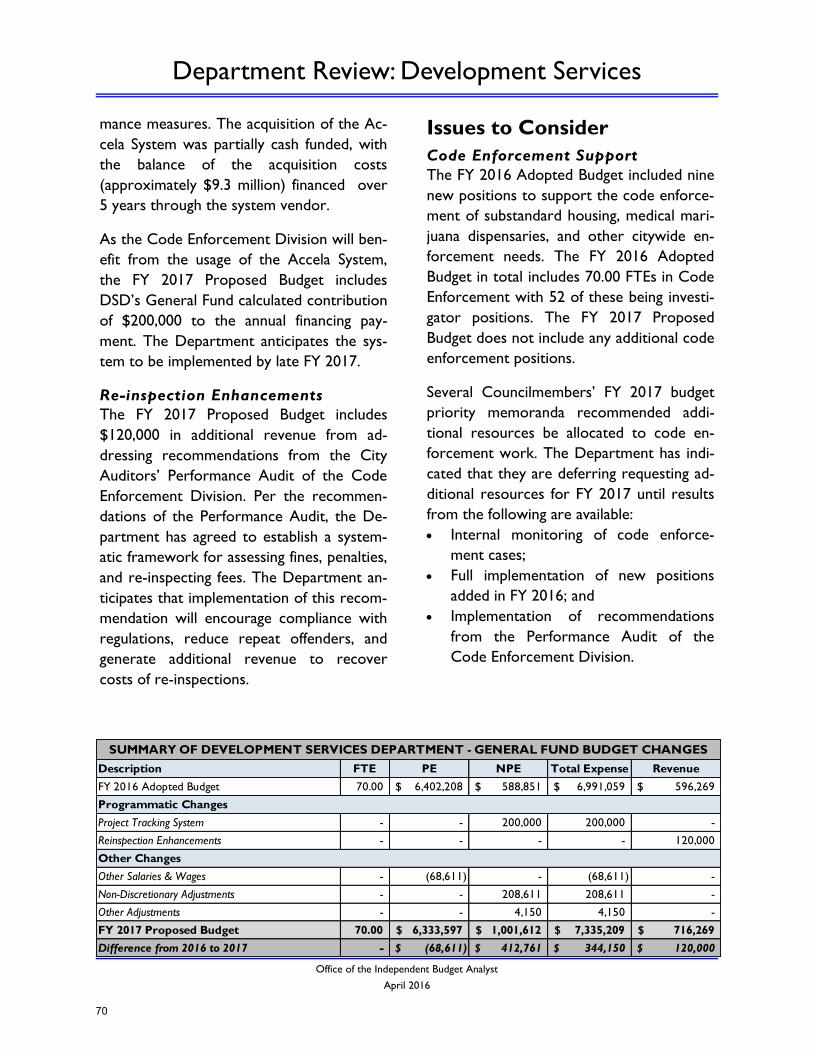
Department Review: Development Services
Office of the Independent Budget Analyst
April 2016
mance measures. The acquisition of the Ac-
cela System was partially cash funded, with
the balance of the acquisition costs
(approximately $9.3 million) financed over
5 years through the system vendor.
As the Code Enforcement Division will ben-
efit from the usage of the Accela System,
the FY 2017 Proposed Budget includes
DSD’s General Fund calculated contribution
of $200,000 to the annual financing pay-
ment. The Department anticipates the sys-
tem to be implemented by late FY 2017.
Re-inspection Enhancements
The FY 2017 Proposed Budget includes
$120,000 in additional revenue from ad-
dressing recommendations from the City
Auditors’ Performance Audit of the Code
Enforcement Division. Per the recommen-
dations of the Performance Audit, the De-
partment has agreed to establish a system-
atic framework for assessing fines, penalties,
and re-inspecting fees. The Department an-
ticipates that implementation of this recom-
mendation will encourage compliance with
regulations, reduce repeat offenders, and
generate additional revenue to recover
costs of re-inspections.
Issues to Consider
Code Enforcement Support
The FY 2016 Adopted Budget included nine
new positions to support the code enforce-
ment of substandard housing, medical mari-
juana dispensaries, and other citywide en-
forcement needs. The FY 2016 Adopted
Budget in total includes 70.00 FTEs in Code
Enforcement with 52 of these being investi-
gator positions. The FY 2017 Proposed
Budget does not include any additional code
enforcement positions.
Several Councilmembers’ FY 2017 budget
priority memoranda recommended addi-
tional resources be allocated to code en-
forcement work. The Department has indi-
cated that they are deferring requesting ad-
ditional resources for FY 2017 until results
from the following are available:
Internal monitoring of code enforce-
ment cases;
Full implementation of new positions
added in FY 2016; and
Implementation of recommendations
from the Performance Audit of the
Code Enforcement Division.
Description FTE PE NPE Total Expense Revenue
FY 2016 Adopted Budget 70.00 6,402,208$ 588,851$ 6,991,059$ 596,269$
Project Tracking System - - 200,000 200,000 -
Reinspection Enhancements - - - - 120,000
Other Salaries & Wages - (68,611) - (68,611) -
Non-Discretionary Adjustments - - 208,611 208,611 -
Other Adjustments - - 4,150 4,150 -
FY 2017 Proposed Budget 70.00 6,333,597$ 1,001,612$ 7,335,209$ 716,269$
Difference from 2016 to 2017 - (68,611)$ 412,761$ 344,150$ 120,000$
SUMMARY OF DEVELOPMENT SERVICES DEPARTMENT - GENERAL FUND BUDGET CHANGES
Programmatic Changes
Other Changes
70
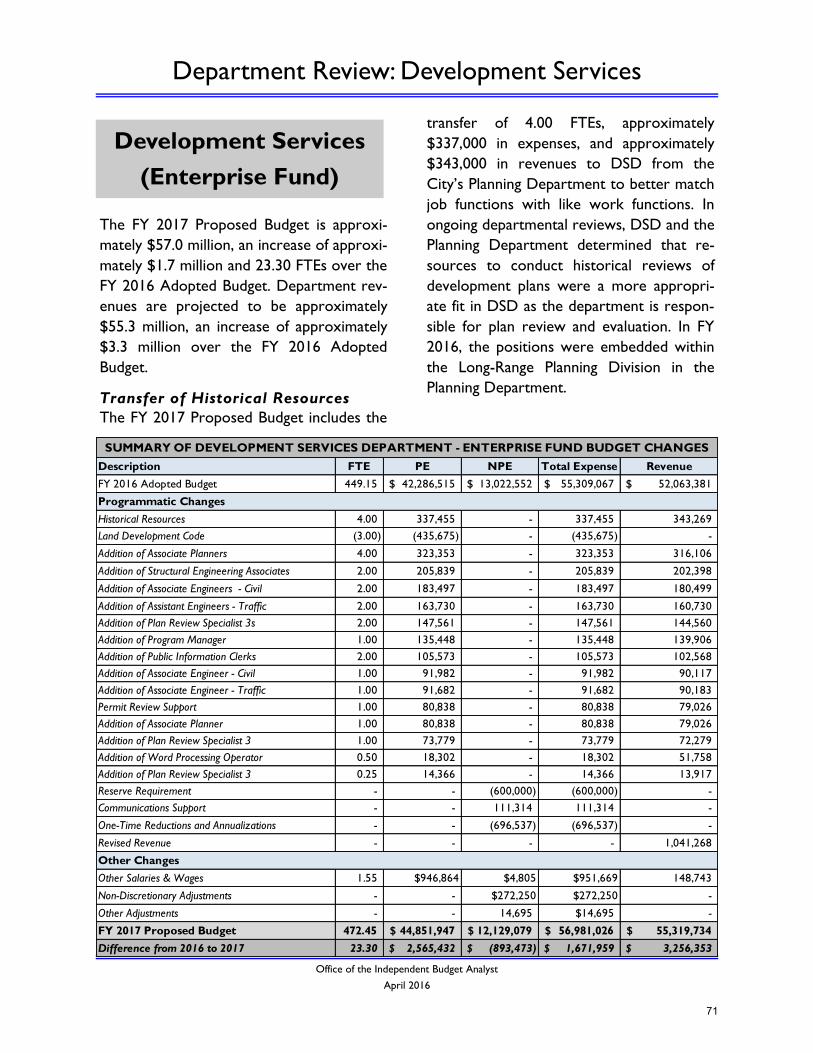
Department Review: Development Services
Office of the Independent Budget Analyst
April 2016
The FY 2017 Proposed Budget is approxi-
mately $57.0 million, an increase of approxi-
mately $1.7 million and 23.30 FTEs over the
FY 2016 Adopted Budget. Department rev-
enues are projected to be approximately
$55.3 million, an increase of approximately
$3.3 million over the FY 2016 Adopted
Budget.
Transfer of Historical Resources
The FY 2017 Proposed Budget includes the
transfer of 4.00 FTEs, approximately
$337,000 in expenses, and approximately
$343,000 in revenues to DSD from the
City’s Planning Department to better match
job functions with like work functions. In
ongoing departmental reviews, DSD and the
Planning Department determined that re-
sources to conduct historical reviews of
development plans were a more appropri-
ate fit in DSD as the department is respon-
sible for plan review and evaluation. In FY
2016, the positions were embedded within
the Long-Range Planning Division in the
Planning Department.
Development Services
(Enterprise Fund)
Description FTE PE NPE Total Expense Revenue
FY 2016 Adopted Budget 449.15 42,286,515$ 13,022,552$ 55,309,067$ 52,063,381$
Historical Resources 4.00 337,455 - 337,455 343,269
Land Development Code (3.00) (435,675) - (435,675) -
Addition of Associate Planners 4.00 323,353 - 323,353 316,106
Addition of Structural Engineering Associates 2.00 205,839 - 205,839 202,398
Addition of Associate Engineers - Civil 2.00 183,497 - 183,497 180,499
Addition of Assistant Engineers - Traffic 2.00 163,730 - 163,730 160,730
Addition of Plan Review Specialist 3s 2.00 147,561 - 147,561 144,560
Addition of Program Manager 1.00 135,448 - 135,448 139,906
Addition of Public Information Clerks 2.00 105,573 - 105,573 102,568
Addition of Associate Engineer - Civil 1.00 91,982 - 91,982 90,117
Addition of Associate Engineer - Traffic 1.00 91,682 - 91,682 90,183
Permit Review Support 1.00 80,838 - 80,838 79,026
Addition of Associate Planner 1.00 80,838 - 80,838 79,026
Addition of Plan Review Specialist 3 1.00 73,779 - 73,779 72,279
Addition of Word Processing Operator 0.50 18,302 - 18,302 51,758
Addition of Plan Review Specialist 3 0.25 14,366 - 14,366 13,917
Reserve Requirement - - (600,000) (600,000) -
Communications Support - - 111,314 111,314 -
One-Time Reductions and Annualizations - - (696,537) (696,537) -
Revised Revenue - - - - 1,041,268
Other Salaries & Wages 1.55 $946,864 $4,805 $951,669 148,743
Non-Discretionary Adjustments - - $272,250 $272,250 -
Other Adjustments - - 14,695 $14,695 -
FY 2017 Proposed Budget 472.45 44,851,947$ 12,129,079$ 56,981,026$ 55,319,734$
Difference from 2016 to 2017 23.30 2,565,432$ (893,473)$ 1,671,959$ 3,256,353$
SUMMARY OF DEVELOPMENT SERVICES DEPARTMENT - ENTERPRISE FUND BUDGET CHANGES
Programmatic Changes
Other Changes
71
Department Review: Development Services
Office of the Independent Budget Analyst
April 2016
Transfer of Land Development Code
The FY 2017 Proposed Budget includes the
transfer of 3.00 FTEs and approximately
$436,000 in expenses from DSD to the
City’s Planning Department. In ongoing de-
partmental reviews, DSD and the Planning
Department determined that resources
with knowledge of land development codes
were a more appropriate fit in the Planning
Department to assist in the Community
Plan Updates. In FY 2016, these positions
were part of the Plan Review Division with-
in DSD.
Support for the Plan Review Func-
tions
The Department manages staffing levels to
adjust to the changes in the construction
industry. The Department has seen the con-
struction industry not only strengthen over
the last several years (photovoltaic permits
increased by 78% over last year) but new
regulations (storm water and renewable
energy) are requiring more complex plan
reviews.
To address the increased demand and
scope of permitting services, the FY 2017
Proposed Budget includes a net increase of
23.30 FTEs and approximately $2.6 million
in expenses to support the plan review
functions of the Department. An increase of
approximately $2.3 million in revenue relat-
ed to the increased staffing will offset a ma-
jority of the additional expenses.
In addition to supporting increased custom-
er service and expedited plan reviews, the
additional positions will assist in the imple-
mentation (directly and indirectly) of the
Climate Action Plan strategies.
Reserve Requirement
The FY 2017 Proposed Budget includes a
decrease of $600,000 in non-personnel ex-
penses from the FY 2016 Adopted Budget
as the FY 2017 reserve requirements for
the Department have been achieved. Per
the Reserve Policy, the Department is to
maintain a reserve amount equal to 8.25%
of operating revenues. Current reserve
amounts meet this requirement and no con-
tribution will be required in FY 2017.
Other Budget Adjustments
The FY 2017 Proposed Budget also includes
the following adjustments:
An increase of approximately $111,000
in expenses for communication services
from the Communication Department.
A reduction of approximately $697,000
in expenses due to the removal of one-
time expenses in the FY 2016 Adopted
Budget and the annualization of expens-
es. The primary component ($693,000)
of these reductions is related to the ini-
tial one-time payment for the Accela
System added in the FY 2016 Adopted
Budget.
An increase of approximately $1.0 mil-
lion in revenue based upon projected
increases in demand for permitting ser-
vices and increased staffing.
Issues to Consider
User Fee Study
In FY 2015, the Department engaged a con-
sultant to conduct a study of the fees
charged by the Department. The study in-
cludes a review of the methodologies used
to calculate department fees and determine
if fee adjustments are necessary to ensure
the recovery of costs. The consultant has
72
Department Review: Development Services
Office of the Independent Budget Analyst
April 2016
completed the draft study and the Depart-
ment is currently reviewing the study and
recommendations with stakeholders. The
Department anticipates presenting the final
study to the appropriate City Council com-
mittee in May 2016, and anticipates present-
ing the item to the full City Council for con-
sideration in June 2016.
If any proposed rate adjustments are ap-
proved by the City Council in June, the De-
partment would target implementing the
rate adjustments by the end of the first
quarter of FY 2017. The FY 2017 Proposed
Budget does not include any proposed reve-
nue adjustments based upon the study.
Should the study recommendations be ap-
proved by the City Council and result in
material revenue adjustments, the Depart-
ment will work with the Financial Manage-
ment Department to make the appropriate
revisions to the FY 2017 budget.
73
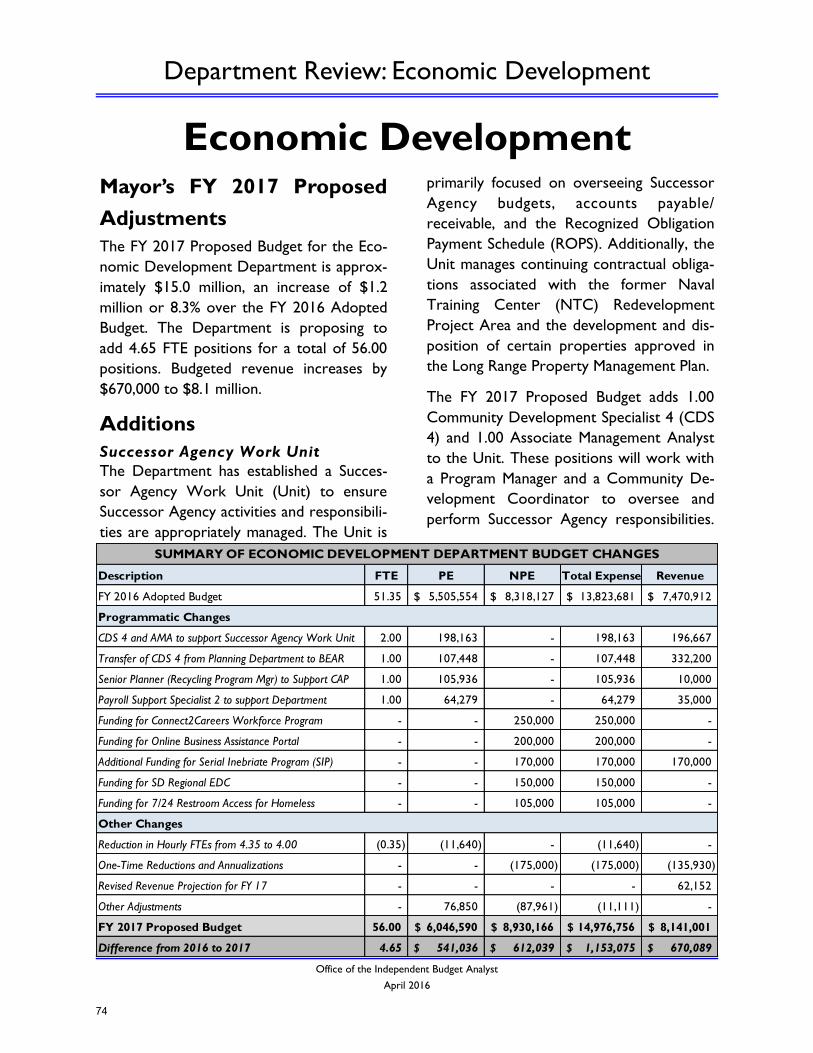
Department Review: Economic Development
Office of the Independent Budget Analyst
April 2016
Economic Development
Mayor’s FY 2017 Proposed
Adjustments
The FY 2017 Proposed Budget for the Eco-
nomic Development Department is approx-
imately $15.0 million, an increase of $1.2
million or 8.3% over the FY 2016 Adopted
Budget. The Department is proposing to
add 4.65 FTE positions for a total of 56.00
positions. Budgeted revenue increases by
$670,000 to $8.1 million.
Additions
Successor Agency Work Unit
The Department has established a Succes-
sor Agency Work Unit (Unit) to ensure
Successor Agency activities and responsibili-
ties are appropriately managed. The Unit is
primarily focused on overseeing Successor
Agency budgets, accounts payable/
receivable, and the Recognized Obligation
Payment Schedule (ROPS). Additionally, the
Unit manages continuing contractual obliga-
tions associated with the former Naval
Training Center (NTC) Redevelopment
Project Area and the development and dis-
position of certain properties approved in
the Long Range Property Management Plan.
The FY 2017 Proposed Budget adds 1.00
Community Development Specialist 4 (CDS
4) and 1.00 Associate Management Analyst
to the Unit. These positions will work with
a Program Manager and a Community De-
velopment Coordinator to oversee and
perform Successor Agency responsibilities.
Description FTE PE NPE Total Expense Revenue
FY 2016 Adopted Budget 51.35 5,505,554$ 8,318,127$ 13,823,681$ 7,470,912$
CDS 4 and AMA to support Successor Agency Work Unit 2.00 198,163 - 198,163 196,667
Transfer of CDS 4 from Planning Department to BEAR 1.00 107,448 - 107,448 332,200
Senior Planner (Recycling Program Mgr) to Support CAP 1.00 105,936 - 105,936 10,000
Payroll Support Specialist 2 to support Department 1.00 64,279 - 64,279 35,000
Funding for Connect2Careers Workforce Program - - 250,000 250,000 -
Funding for Online Business Assistance Portal - - 200,000 200,000 -
Additional Funding for Serial Inebriate Program (SIP) - - 170,000 170,000 170,000
Funding for SD Regional EDC - - 150,000 150,000 -
Funding for 7/24 Restroom Access for Homeless - - 105,000 105,000 -
Reduction in Hourly FTEs from 4.35 to 4.00 (0.35) (11,640) - (11,640) -
One-Time Reductions and Annualizations - - (175,000) (175,000) (135,930)
Revised Revenue Projection for FY 17 - - - - 62,152
Other Adjustments - 76,850 (87,961) (11,111) -
FY 2017 Proposed Budget 56.00 6,046,590$ 8,930,166$ 14,976,756$ 8,141,001$
Difference from 2016 to 2017 4.65 541,036$ 612,039$ 1,153,075$ 670,089$
SUMMARY OF ECONOMIC DEVELOPMENT DEPARTMENT BUDGET CHANGES
Programmatic Changes
Other Changes
74
Department Review: Economic Development
Office of the Independent Budget Analyst
April 2016
The Unit will be comprised of 4.00 FTE po-
sitions in FY 2017.
Transfer of 1.00 CDS 4 Position
from the Planning Department
Economic Development was consolidated
into the City Planning and Community In-
vestment Department (CPCI) in FY 2009
and separated to become a standalone de-
partment in FY 2014. This transfer returns
1.00 Community Development Specialist 4
(CDS 4) and $332,000 of budgeted revenue
to the Department. The CDS 4 position had
remained in the Planning Department and
will now transfer back to the Economic De-
velopment Department in FY 2017. The
CDS 4 will provide in-house expertise and
information data management for ongoing
evaluation of real estate trends and mar-
kets, business development research related
to growth industries, employment and de-
velopment statistics, and other economic
information.
Addition of 1.00 Senior Planner to
support Implementation of the Cli-
mate Action Plan (CAP)
The Department adds 1.00 Senior Planner
to support the implementation and mainte-
nance of the CAP. The position’s working
title is Recycling Program Manager (RPM)
and will provide support to the Sustainabil-
ity Program Manager. In their budget priori-
ty memoranda, a majority of Councilmem-
bers indicated support for the recently ap-
proved CAP is a priority in FY 2017.
The RPM’s roles and projects include: grant
application support, policy analysis and
greenhouse gas inventory tracking and re-
porting, CAP/sustainability tracking and re-
porting, development and implementation
of new and innovative projects or pro-
grams, and climate resiliency planning and
implementation. A Local Government Part-
nership Grant, administered by the Environ-
mental Services Department, will partially
reimburse the cost of the RPM.
Addition of 1.00 Payroll Specialist 2
The Department is one of the only depart-
ments in the City without its own payroll
specialist. In order to address this need and
better support payroll and human resource
activities, 1.00 Payroll Specialist 2 has been
added to the Department’s budget.
Implementation of Open Counter
Software for a Business Portal
The Department is allocating $200,000 to
purchase and implement Open Counter
Software that will allow citizens (small busi-
nesses, entrepreneurs, landlords, contrac-
tors) to discover which permits, licenses,
data, and fees are required to pursue a pro-
ject in a specific location within the City. It
will be designed to facilitate common com-
mercial permitting use cases such as open-
ing a business, remodeling a commercial
space, or permitting a new commercial con-
struction project. Department management
anticipates launching the service by the end
of the summer.
A majority of Councilmember budget prior-
ity memoranda included some support for a
variety of economic development programs
for small businesses, including the develop-
ment of an online business portal.
Contract Administration
The Department administers and supports
numerous contracts relating to the goals
and objectives of economic development. A
75
Department Review: Economic Development
Office of the Independent Budget Analyst
April 2016
few contracts to note or with budget chang-
es in FY 2017 are briefly discussed below:
Funding for the Connect2Careers
Program
The FY 2017 Proposed Budget includes
$250,000 to support the Connect2Careers
Workforce Program administered by the
San Diego Workforce Partnership. The pro-
gram provides youth with meaningful job
placements by providing workforce devel-
opment, preparation, and summer employ-
ment services to young adults between the
ages of 16 and 24 years old. This Program
was identified as a top priority by a majority
of Councilmembers in their FY 2017 budget
priority memos. Our Office notes that fund-
ing is being maintained and not increased.
Funding for the San Diego Regional
Economic Development Corporation
In recent years, the San Diego Regional Eco-
nomic Development Corporation (EDC)
has been allocated funding from the Eco-
nomic Development Programs category of
the Special Promotions Budget (TOT). This
is competitive grant funding with regulations
pertaining to the use of funds. In the FY
2017 Proposed Budget, management is pro-
posing to allocate $150,000 to the EDC in
the Economic Development Department
budget. In FY 2016, the EDC received
$140,000 in the Special Promotions Budget.
When asked about the shift in funding away
from Special Promotions, Department man-
agement responded that 1) a competitive
TOT grant is not an appropriate source for
the ongoing annual funding they would re-
quest for the EDC, and 2) TOT expenditure
regulations do not allow for certain activi-
ties the City would like the EDC to per-
form. The scope of the City’s contract with
the EDC calls for business lead generation,
organizing business roundtables to provide
the City with information on emerging
needs, and services related to the relaunch
of the World Trade Center San Diego.
Continued Funding for Homeless
Services
City funding for homeless services is allocat-
ed to the Economic Development Depart-
ment’s budget. The Department then exe-
cutes and administers contracts for the pro-
vision of homeless services. These contracts
are with the San Diego Housing Commis-
sion (SDHC) who, in turn, often subcon-
tracts with other providers for the desired
services.
In their budget priority memoranda, a ma-
jority of Councilmembers prioritized
providing additional funding and resources
to assist San Diego’s homeless population.
Approximately $2.3 million has been allo-
cated for homeless services in the FY 2017
Proposed Budget for the programs noted
below, an increase of $275,000 over the FY
2016 Budget.
Interim Housing and Related Services
for Homeless Adults ($1.495 million):
This amount funds 350 year-round in-
terim housing beds at the St. Vincent de
Paul Village campus, including 140 beds
for Veterans and 50 beds for homeless
triage and housing placement by the San
Diego Police Department’s Homeless
Outreach Team. It also includes $25,000
for an Inclement Weather Program and
$110,000 for Housing Commission ad-
ministration of the various programs
and services.
76
Department Review: Economic Development
Office of the Independent Budget Analyst
April 2016
Connections Housing ($300,000): Fund-
ing for People Assisting the Homeless
(PATH) to continue essential services
and for development partners to contin-
ue to pursue private fundraising and
public grants to fill the remaining gap in
operating funds.
Serial Inebriate Program (SIP)
($290,000): Funding is increased by
$170,000 to increase the number of
transitional housing beds from 32 to a
total of 56, and also provide supportive
services for residents experiencing
homelessness and struggling with sub-
stance abuse.
Transitional Storage Center ($125,000):
Continues funding to support the opera-
tion of the Think Dignity (formerly Girls
Think Tank) storage facility, which pro-
vides lockers and bins to homeless fami-
lies and individuals to safely store their
personnel belongings. Approximately
2,000 people use this facility.
24/7 Restroom Access ($105,000): This
amount represents new funding for the
operation of restrooms for the home-
less 24 hours per day, 7 days a week.
SDHC will subcontract with St. Vincent
de Paul for the continued provision of
these services.
Other Budget Changes
The Department uses Management Interns
on an hourly basis to assist with the work
of the Community Development and Busi-
ness Expansion Attraction and Retention
divisions. The Department requested 4.00
Management Interns in the FY 2017 Pro-
posed Budget, a decrease of 0.35 FTE from
the FY 2016 Budget.
One-time budget adjustments were made
to reduce non-personnel expenses by
$175,000 and revenue by approximately
$136,000. Revised projections increased
other revenue by about $62,000. Other ad-
justments included a $77,000 increase in
personnel expense related to salary and
benefits and there was a net $88,000 reduc-
tion in non-personnel expense largely at-
tributable to the transfer of debt service
responsibility for the NTC Section 108 loan
from the Department to ROPS.
Vacancies in the Department
The Department currently has 8.00 vacan-
cies. If the FY 2017 Proposed Budget for
the Department is approved, another 4.00
positions will need to be hired. While this
could cause some concern related to the
provision of services, Department manage-
ment indicates they plan to fill 5.00 of the
8.00 vacant positions by the end of FY 2016.
77
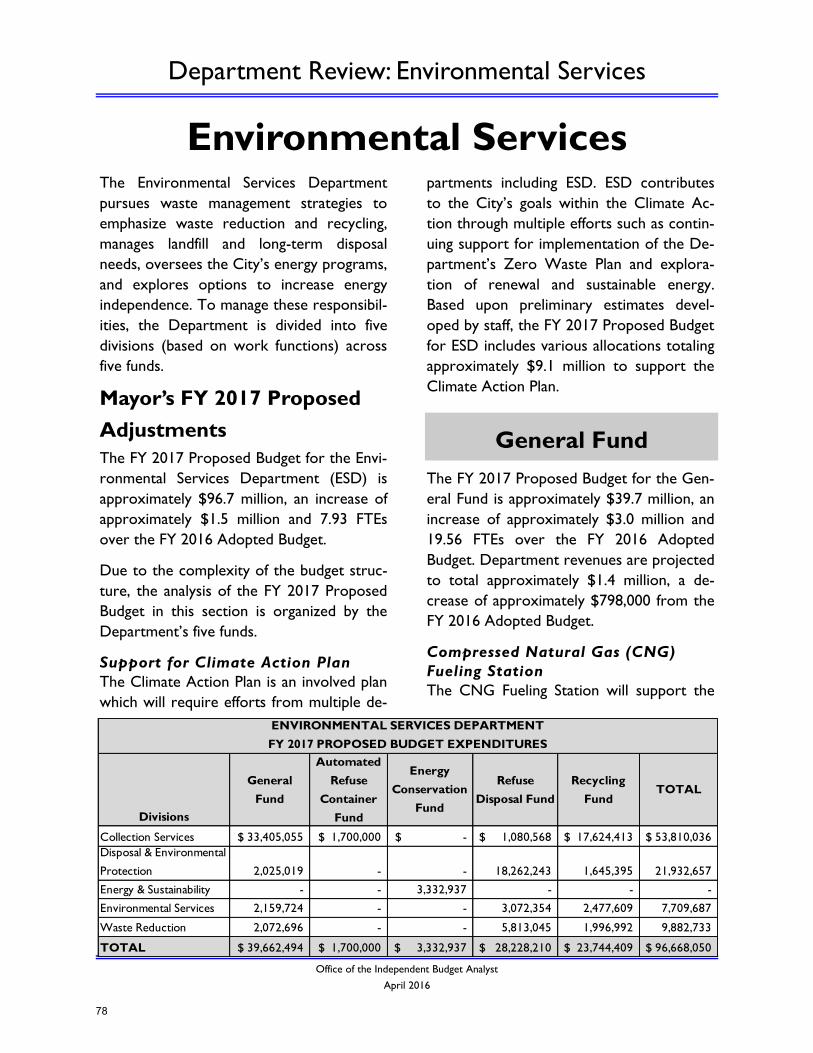
Department Review: Environmental Services
Office of the Independent Budget Analyst
April 2016
Environmental Services The Environmental Services Department
pursues waste management strategies to
emphasize waste reduction and recycling,
manages landfill and long-term disposal
needs, oversees the City’s energy programs,
and explores options to increase energy
independence. To manage these responsibil-
ities, the Department is divided into five
divisions (based on work functions) across
five funds.
Mayor’s FY 2017 Proposed
Adjustments
The FY 2017 Proposed Budget for the Envi-
ronmental Services Department (ESD) is
approximately $96.7 million, an increase of
approximately $1.5 million and 7.93 FTEs
over the FY 2016 Adopted Budget.
Due to the complexity of the budget struc-
ture, the analysis of the FY 2017 Proposed
Budget in this section is organized by the
Department’s five funds.
Support for Climate Action Plan
The Climate Action Plan is an involved plan
which will require efforts from multiple de-
partments including ESD. ESD contributes
to the City’s goals within the Climate Ac-
tion through multiple efforts such as contin-
uing support for implementation of the De-
partment’s Zero Waste Plan and explora-
tion of renewal and sustainable energy.
Based upon preliminary estimates devel-
oped by staff, the FY 2017 Proposed Budget
for ESD includes various allocations totaling
approximately $9.1 million to support the
Climate Action Plan.
The FY 2017 Proposed Budget for the Gen-
eral Fund is approximately $39.7 million, an
increase of approximately $3.0 million and
19.56 FTEs over the FY 2016 Adopted
Budget. Department revenues are projected
to total approximately $1.4 million, a de-
crease of approximately $798,000 from the
FY 2016 Adopted Budget.
Compressed Natural Gas (CNG)
Fueling Station
The CNG Fueling Station will support the
General Fund
Divisions
General
Fund
Automated
Refuse
Container
Fund
Energy
Conservation
Fund
Refuse
Disposal Fund
Recycling
FundTOTAL
Collection Services 33,405,055$ 1,700,000$ -$ 1,080,568$ 17,624,413$ 53,810,036$
Disposal & Environmental
Protection 2,025,019 - - 18,262,243 1,645,395 21,932,657
Energy & Sustainability - - 3,332,937 - - -
Environmental Services 2,159,724 - - 3,072,354 2,477,609 7,709,687
Waste Reduction 2,072,696 - - 5,813,045 1,996,992 9,882,733
TOTAL 39,662,494$ 1,700,000$ 3,332,937$ 28,228,210$ 23,744,409$ 96,668,050$
ENVIRONMENTAL SERVICES DEPARTMENT
FY 2017 PROPOSED BUDGET EXPENDITURES
78
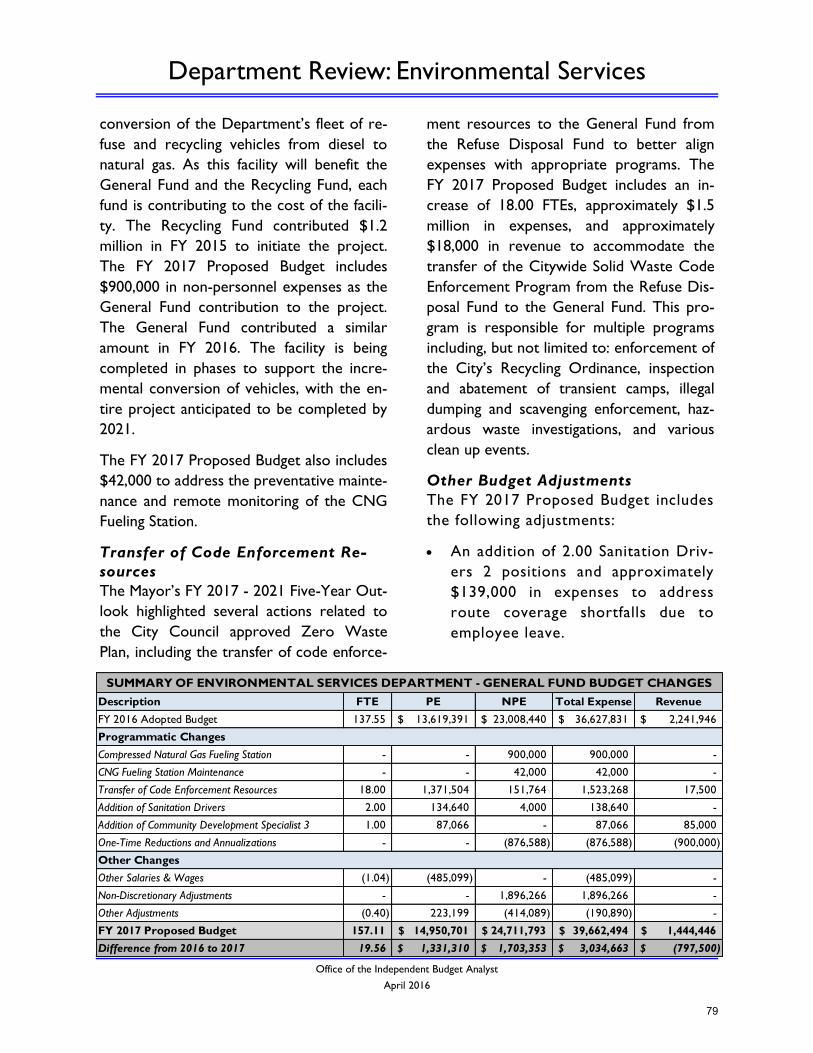
Department Review: Environmental Services
Office of the Independent Budget Analyst
April 2016
conversion of the Department’s fleet of re-
fuse and recycling vehicles from diesel to
natural gas. As this facility will benefit the
General Fund and the Recycling Fund, each
fund is contributing to the cost of the facili-
ty. The Recycling Fund contributed $1.2
million in FY 2015 to initiate the project.
The FY 2017 Proposed Budget includes
$900,000 in non-personnel expenses as the
General Fund contribution to the project.
The General Fund contributed a similar
amount in FY 2016. The facility is being
completed in phases to support the incre-
mental conversion of vehicles, with the en-
tire project anticipated to be completed by
2021.
The FY 2017 Proposed Budget also includes
$42,000 to address the preventative mainte-
nance and remote monitoring of the CNG
Fueling Station.
Transfer of Code Enforcement Re-
sources
The Mayor’s FY 2017 - 2021 Five-Year Out-
look highlighted several actions related to
the City Council approved Zero Waste
Plan, including the transfer of code enforce-
ment resources to the General Fund from
the Refuse Disposal Fund to better align
expenses with appropriate programs. The
FY 2017 Proposed Budget includes an in-
crease of 18.00 FTEs, approximately $1.5
million in expenses, and approximately
$18,000 in revenue to accommodate the
transfer of the Citywide Solid Waste Code
Enforcement Program from the Refuse Dis-
posal Fund to the General Fund. This pro-
gram is responsible for multiple programs
including, but not limited to: enforcement of
the City’s Recycling Ordinance, inspection
and abatement of transient camps, illegal
dumping and scavenging enforcement, haz-
ardous waste investigations, and various
clean up events.
Other Budget Adjustments
The FY 2017 Proposed Budget includes
the following adjustments:
An addition of 2.00 Sanitation Driv-
ers 2 positions and approximately
$139,000 in expenses to address
route coverage shortfalls due to
employee leave.
Description FTE PE NPE Total Expense Revenue
FY 2016 Adopted Budget 137.55 13,619,391$ 23,008,440$ 36,627,831$ 2,241,946$
Compressed Natural Gas Fueling Station - - 900,000 900,000 -
CNG Fueling Station Maintenance - - 42,000 42,000 -
Transfer of Code Enforcement Resources 18.00 1,371,504 151,764 1,523,268 17,500
Addition of Sanitation Drivers 2.00 134,640 4,000 138,640 -
Addition of Community Development Specialist 3 1.00 87,066 - 87,066 85,000
One-Time Reductions and Annualizations - - (876,588) (876,588) (900,000)
Other Salaries & Wages (1.04) (485,099) - (485,099) -
Non-Discretionary Adjustments - - 1,896,266 1,896,266 -
Other Adjustments (0.40) 223,199 (414,089) (190,890) -
FY 2017 Proposed Budget 157.11 14,950,701$ 24,711,793$ 39,662,494$ 1,444,446$
Difference from 2016 to 2017 19.56 1,331,310$ 1,703,353$ 3,034,663$ (797,500)$
SUMMARY OF ENVIRONMENTAL SERVICES DEPARTMENT - GENERAL FUND BUDGET CHANGES
Programmatic Changes
Other Changes
79
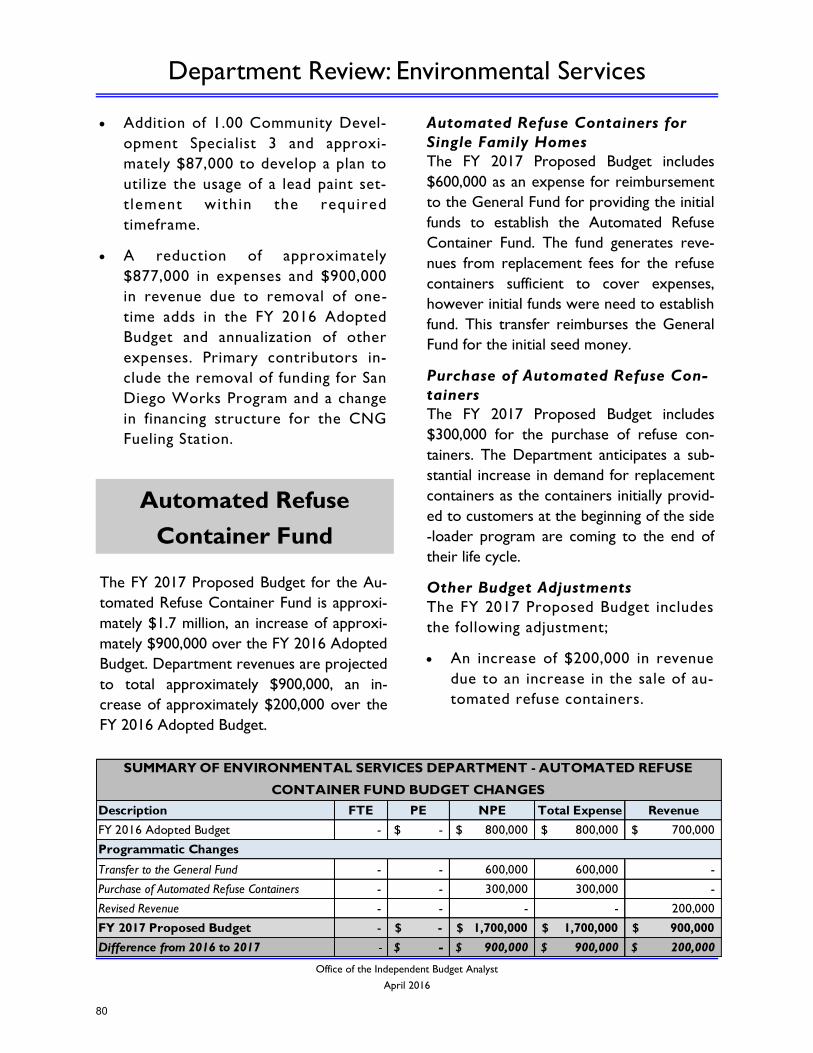
Department Review: Environmental Services
Office of the Independent Budget Analyst
April 2016
Addition of 1.00 Community Devel-
opment Specialist 3 and approxi-
mately $87,000 to develop a plan to
utilize the usage of a lead paint set-
t lement within the required
timeframe.
A reduction of approximately
$877,000 in expenses and $900,000
in revenue due to removal of one-
time adds in the FY 2016 Adopted
Budget and annualization of other
expenses. Primary contributors in-
clude the removal of funding for San
Diego Works Program and a change
in financing structure for the CNG
Fueling Station.
The FY 2017 Proposed Budget for the Au-
tomated Refuse Container Fund is approxi-
mately $1.7 million, an increase of approxi-
mately $900,000 over the FY 2016 Adopted
Budget. Department revenues are projected
to total approximately $900,000, an in-
crease of approximately $200,000 over the
FY 2016 Adopted Budget.
Automated Refuse Containers for
Single Family Homes
The FY 2017 Proposed Budget includes
$600,000 as an expense for reimbursement
to the General Fund for providing the initial
funds to establish the Automated Refuse
Container Fund. The fund generates reve-
nues from replacement fees for the refuse
containers sufficient to cover expenses,
however initial funds were need to establish
fund. This transfer reimburses the General
Fund for the initial seed money.
Purchase of Automated Refuse Con-
tainers
The FY 2017 Proposed Budget includes
$300,000 for the purchase of refuse con-
tainers. The Department anticipates a sub-
stantial increase in demand for replacement
containers as the containers initially provid-
ed to customers at the beginning of the side
-loader program are coming to the end of
their life cycle.
Other Budget Adjustments
The FY 2017 Proposed Budget includes
the following adjustment;
An increase of $200,000 in revenue
due to an increase in the sale of au-
tomated refuse containers.
Automated Refuse
Container Fund
Description FTE PE NPE Total Expense Revenue
FY 2016 Adopted Budget - -$ 800,000$ 800,000$ 700,000$
Transfer to the General Fund - - 600,000 600,000 -
Purchase of Automated Refuse Containers - - 300,000 300,000 -
Revised Revenue - - - - 200,000
FY 2017 Proposed Budget - -$ 1,700,000$ 1,700,000$ 900,000$
Difference from 2016 to 2017 - -$ 900,000$ 900,000$ 200,000$
SUMMARY OF ENVIRONMENTAL SERVICES DEPARTMENT - AUTOMATED REFUSE
CONTAINER FUND BUDGET CHANGES
Programmatic Changes
80
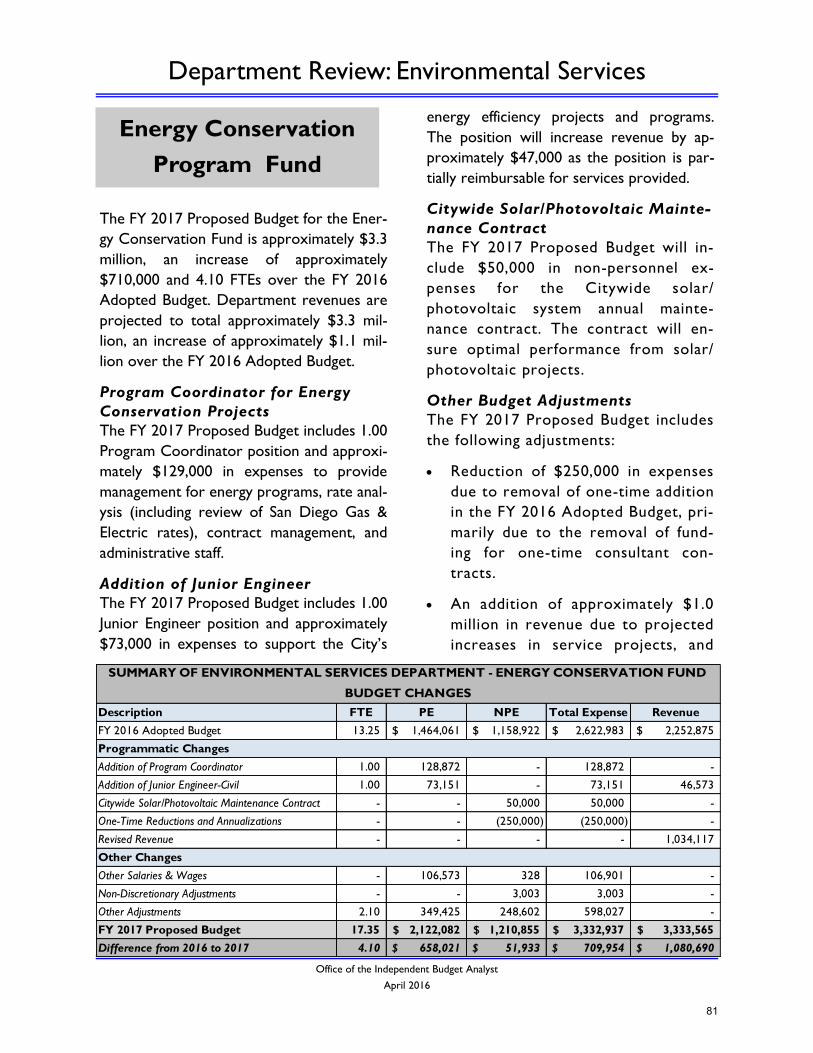
Department Review: Environmental Services
Office of the Independent Budget Analyst
April 2016
The FY 2017 Proposed Budget for the Ener-
gy Conservation Fund is approximately $3.3
million, an increase of approximately
$710,000 and 4.10 FTEs over the FY 2016
Adopted Budget. Department revenues are
projected to total approximately $3.3 mil-
lion, an increase of approximately $1.1 mil-
lion over the FY 2016 Adopted Budget.
Program Coordinator for Energy
Conservation Projects
The FY 2017 Proposed Budget includes 1.00
Program Coordinator position and approxi-
mately $129,000 in expenses to provide
management for energy programs, rate anal-
ysis (including review of San Diego Gas &
Electric rates), contract management, and
administrative staff.
Addition of Junior Engineer
The FY 2017 Proposed Budget includes 1.00
Junior Engineer position and approximately
$73,000 in expenses to support the City’s
energy efficiency projects and programs.
The position will increase revenue by ap-
proximately $47,000 as the position is par-
tially reimbursable for services provided.
Citywide Solar/Photovoltaic Mainte-
nance Contract
The FY 2017 Proposed Budget will in-
clude $50,000 in non-personnel ex-
penses for the Citywide solar/
photovoltaic system annual mainte-
nance contract. The contract will en-
sure optimal performance from solar/
photovoltaic projects.
Other Budget Adjustments
The FY 2017 Proposed Budget includes
the following adjustments:
Reduction of $250,000 in expenses
due to removal of one-time addition
in the FY 2016 Adopted Budget, pri-
marily due to the removal of fund-
ing for one-time consultant con-
tracts.
An addition of approximately $1.0
million in revenue due to projected
increases in service projects, and
Energy Conservation
Program Fund
Description FTE PE NPE Total Expense Revenue
FY 2016 Adopted Budget 13.25 1,464,061$ 1,158,922$ 2,622,983$ 2,252,875$
Addition of Program Coordinator 1.00 128,872 - 128,872 -
Addition of Junior Engineer-Civil 1.00 73,151 - 73,151 46,573
Citywide Solar/Photovoltaic Maintenance Contract - - 50,000 50,000 -
One-Time Reductions and Annualizations - - (250,000) (250,000) -
Revised Revenue - - - - 1,034,117
Other Salaries & Wages - 106,573 328 106,901 -
Non-Discretionary Adjustments - - 3,003 3,003 -
Other Adjustments 2.10 349,425 248,602 598,027 -
FY 2017 Proposed Budget 17.35 2,122,082$ 1,210,855$ 3,332,937$ 3,333,565$
Difference from 2016 to 2017 4.10 658,021$ 51,933$ 709,954$ 1,080,690$
SUMMARY OF ENVIRONMENTAL SERVICES DEPARTMENT - ENERGY CONSERVATION FUND
BUDGET CHANGES
Programmatic Changes
Other Changes
81
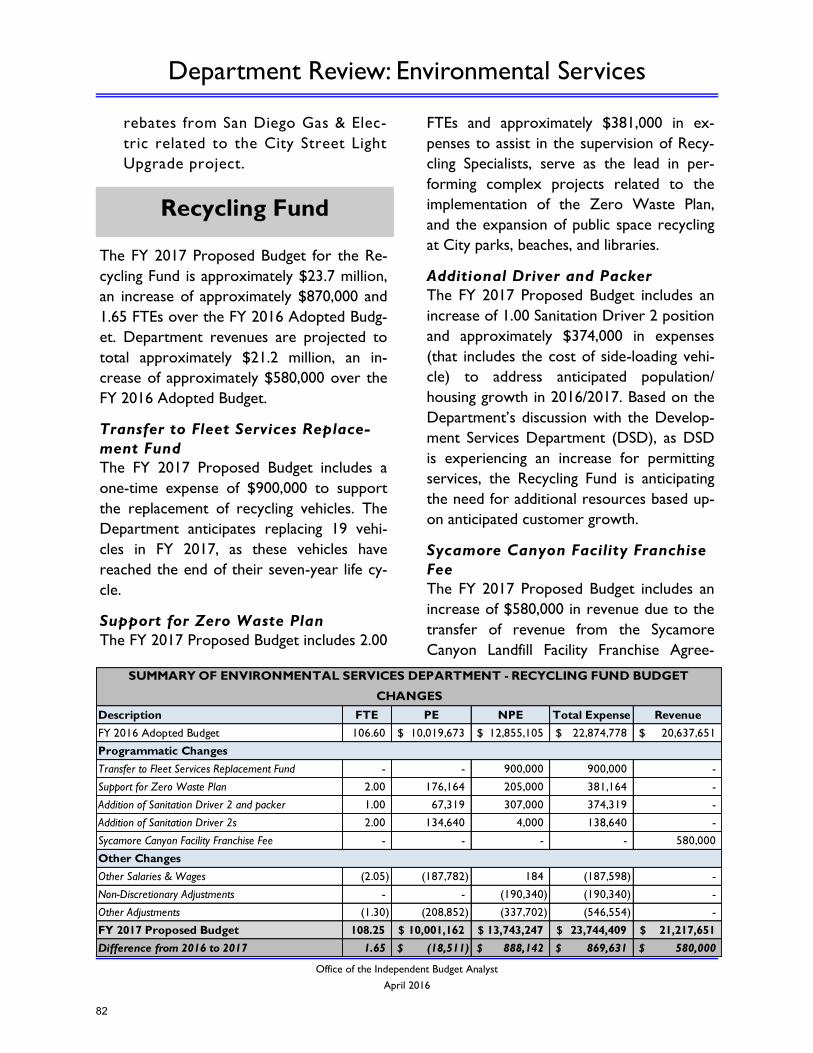
Department Review: Environmental Services
Office of the Independent Budget Analyst
April 2016
rebates from San Diego Gas & Elec-
tric related to the City Street Light
Upgrade project.
The FY 2017 Proposed Budget for the Re-
cycling Fund is approximately $23.7 million,
an increase of approximately $870,000 and
1.65 FTEs over the FY 2016 Adopted Budg-
et. Department revenues are projected to
total approximately $21.2 million, an in-
crease of approximately $580,000 over the
FY 2016 Adopted Budget.
Transfer to Fleet Services Replace-
ment Fund
The FY 2017 Proposed Budget includes a
one-time expense of $900,000 to support
the replacement of recycling vehicles. The
Department anticipates replacing 19 vehi-
cles in FY 2017, as these vehicles have
reached the end of their seven-year life cy-
cle.
Support for Zero Waste Plan
The FY 2017 Proposed Budget includes 2.00
FTEs and approximately $381,000 in ex-
penses to assist in the supervision of Recy-
cling Specialists, serve as the lead in per-
forming complex projects related to the
implementation of the Zero Waste Plan,
and the expansion of public space recycling
at City parks, beaches, and libraries.
Additional Driver and Packer
The FY 2017 Proposed Budget includes an
increase of 1.00 Sanitation Driver 2 position
and approximately $374,000 in expenses
(that includes the cost of side-loading vehi-
cle) to address anticipated population/
housing growth in 2016/2017. Based on the
Department’s discussion with the Develop-
ment Services Department (DSD), as DSD
is experiencing an increase for permitting
services, the Recycling Fund is anticipating
the need for additional resources based up-
on anticipated customer growth.
Sycamore Canyon Facility Franchise
Fee
The FY 2017 Proposed Budget includes an
increase of $580,000 in revenue due to the
transfer of revenue from the Sycamore
Canyon Landfill Facility Franchise Agree-
Recycling Fund
Description FTE PE NPE Total Expense Revenue
FY 2016 Adopted Budget 106.60 10,019,673$ 12,855,105$ 22,874,778$ 20,637,651$
Transfer to Fleet Services Replacement Fund - - 900,000 900,000 -
Support for Zero Waste Plan 2.00 176,164 205,000 381,164 -
Addition of Sanitation Driver 2 and packer 1.00 67,319 307,000 374,319 -
Addition of Sanitation Driver 2s 2.00 134,640 4,000 138,640 -
Sycamore Canyon Facility Franchise Fee - - - - 580,000
Other Salaries & Wages (2.05) (187,782) 184 (187,598) -
Non-Discretionary Adjustments - - (190,340) (190,340) -
Other Adjustments (1.30) (208,852) (337,702) (546,554) -
FY 2017 Proposed Budget 108.25 10,001,162$ 13,743,247$ 23,744,409$ 21,217,651$
Difference from 2016 to 2017 1.65 (18,511)$ 888,142$ 869,631$ 580,000$
SUMMARY OF ENVIRONMENTAL SERVICES DEPARTMENT - RECYCLING FUND BUDGET
CHANGES
Programmatic Changes
Other Changes
82
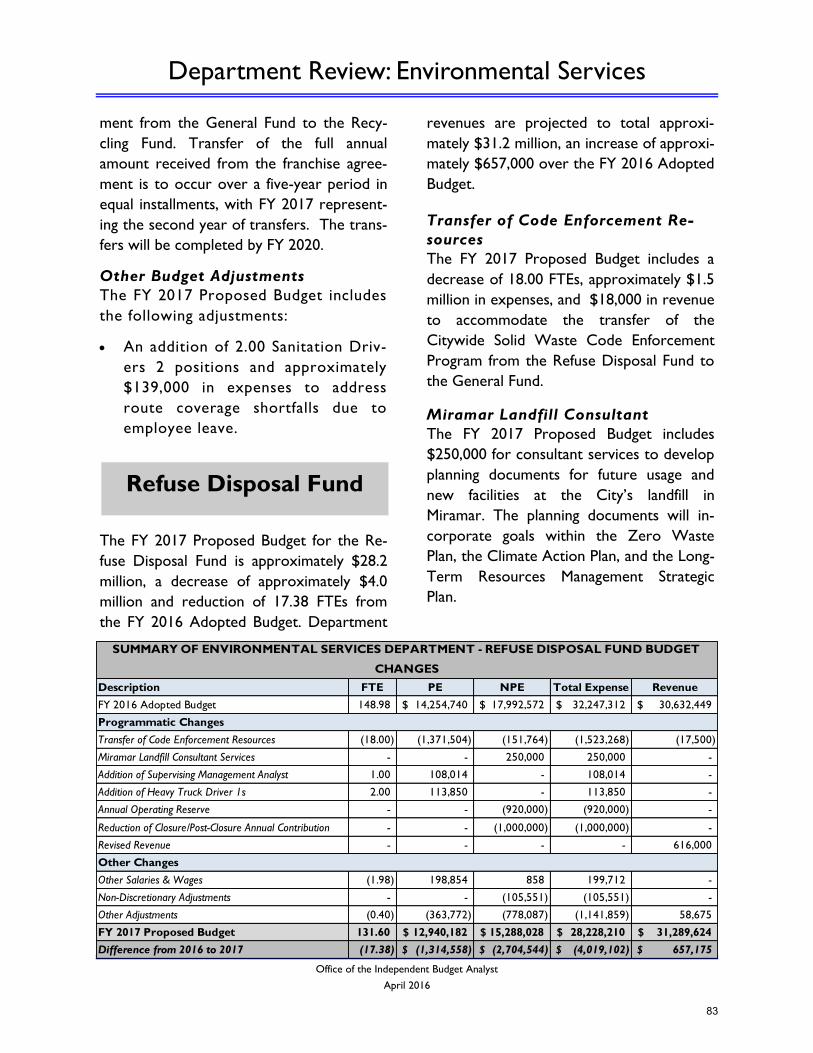
Department Review: Environmental Services
Office of the Independent Budget Analyst
April 2016
ment from the General Fund to the Recy-
cling Fund. Transfer of the full annual
amount received from the franchise agree-
ment is to occur over a five-year period in
equal installments, with FY 2017 represent-
ing the second year of transfers. The trans-
fers will be completed by FY 2020.
Other Budget Adjustments
The FY 2017 Proposed Budget includes
the following adjustments:
An addition of 2.00 Sanitation Driv-
ers 2 positions and approximately
$139,000 in expenses to address
route coverage shortfalls due to
employee leave.
The FY 2017 Proposed Budget for the Re-
fuse Disposal Fund is approximately $28.2
million, a decrease of approximately $4.0
million and reduction of 17.38 FTEs from
the FY 2016 Adopted Budget. Department
revenues are projected to total approxi-
mately $31.2 million, an increase of approxi-
mately $657,000 over the FY 2016 Adopted
Budget.
Transfer of Code Enforcement Re-
sources
The FY 2017 Proposed Budget includes a
decrease of 18.00 FTEs, approximately $1.5
million in expenses, and $18,000 in revenue
to accommodate the transfer of the
Citywide Solid Waste Code Enforcement
Program from the Refuse Disposal Fund to
the General Fund.
Miramar Landfill Consultant
The FY 2017 Proposed Budget includes
$250,000 for consultant services to develop
planning documents for future usage and
new facilities at the City’s landfill in
Miramar. The planning documents will in-
corporate goals within the Zero Waste
Plan, the Climate Action Plan, and the Long-
Term Resources Management Strategic
Plan.
Refuse Disposal Fund
Description FTE PE NPE Total Expense Revenue
FY 2016 Adopted Budget 148.98 14,254,740$ 17,992,572$ 32,247,312$ 30,632,449$
Transfer of Code Enforcement Resources (18.00) (1,371,504) (151,764) (1,523,268) (17,500)
Miramar Landfill Consultant Services - - 250,000 250,000 -
Addition of Supervising Management Analyst 1.00 108,014 - 108,014 -
Addition of Heavy Truck Driver 1s 2.00 113,850 - 113,850 -
Annual Operating Reserve - - (920,000) (920,000) -
Reduction of Closure/Post-Closure Annual Contribution - - (1,000,000) (1,000,000) -
Revised Revenue - - - - 616,000
Other Salaries & Wages (1.98) 198,854 858 199,712 -
Non-Discretionary Adjustments - - (105,551) (105,551) -
Other Adjustments (0.40) (363,772) (778,087) (1,141,859) 58,675
FY 2017 Proposed Budget 131.60 12,940,182$ 15,288,028$ 28,228,210$ 31,289,624$
Difference from 2016 to 2017 (17.38) (1,314,558)$ (2,704,544)$ (4,019,102)$ 657,175$
SUMMARY OF ENVIRONMENTAL SERVICES DEPARTMENT - REFUSE DISPOSAL FUND BUDGET
CHANGES
Programmatic Changes
Other Changes
83
Department Review: Environmental Services
Office of the Independent Budget Analyst
April 2016
Annual Operating Reserve
The FY 2017 Proposed Budget includes a
decrease of $920,000 in non-personnel ex-
penses from the FY 2016 Adopted Budget
as the FY 2017 reserve requirements for
the Department have been achieved. Per
the Reserve Policy, the Department is to
maintain a reserve amount equal to 15% of
operating revenues. Current reserve
amounts meet this requirement and no con-
tribution will be required in FY 2017.
Reduction of Closure/Post-Closure
Annual Contribution
The FY 2017 Proposed Budget includes a
decrease of $1.0 million in non-personnel
expenses due to a change in the funding
mechanism for providing Post-Closure Fi-
nancial Assurance for the Miramar Landfill.
Allowable per California State regulations
and approved by the City Council via Ordi-
nance No. 20590, the Department is chang-
ing the financing mechanism from an annual
contribution to a pledge of future revenue
generated from greenery fees.
Other Budget Adjustments
The FY 2017 Proposed Budget includes the
following adjustments:
An increase of 1.00 Supervising Manage-
ment Analyst position and approximate-
ly $108,000 in expenses to support fiscal
operations and grant development with-
in the Department.
Addition of 2.00 Heavy Truck Driver
positions and an increase of approxi-
mately $114,000 in personnel expenses.
These positions will support field opera-
tions and California’s Used Mattress Re-
covery and Recycling Program.
An increase of $616,000 in revenue re-
lated to a partial reduction of the dis-
count provided to City Forces. The
Mayor’s FY 2016 - 2020 Five-Year Out-
look included a phased reduction of the
total discount over three years, from FY
2016 to FY 2018.
84
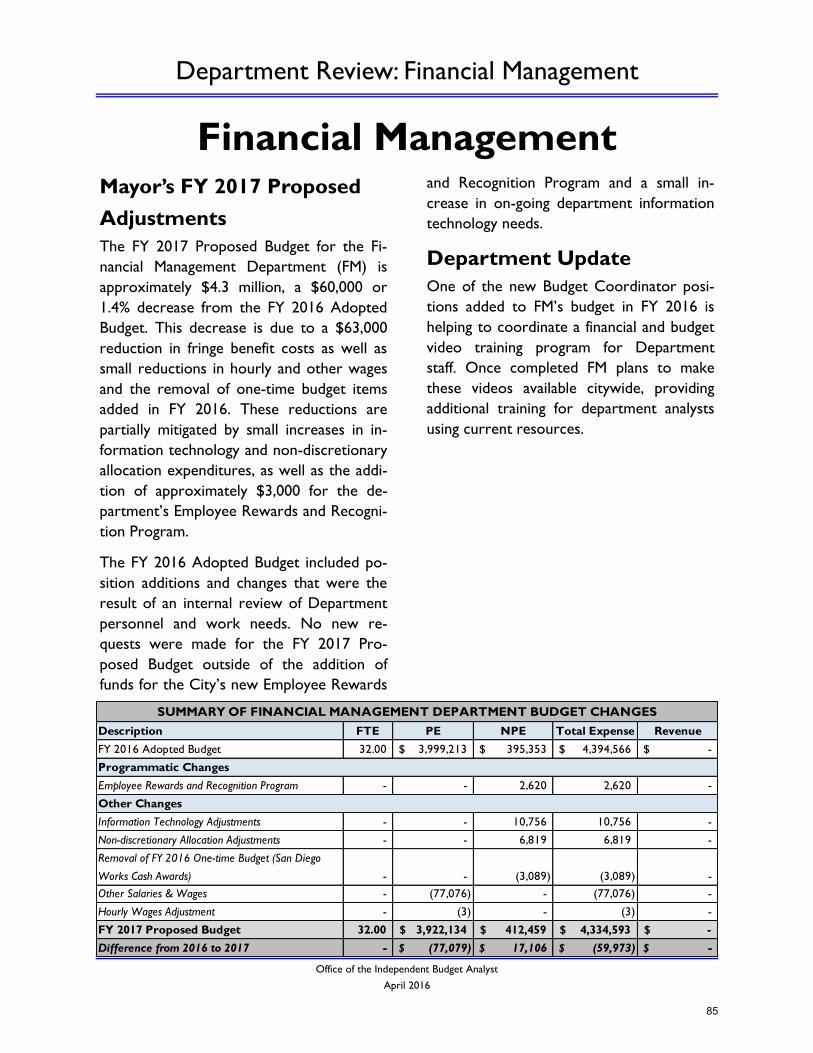
Department Review: Financial Management
Office of the Independent Budget Analyst
April 2016
Financial Management
Mayor’s FY 2017 Proposed
Adjustments
The FY 2017 Proposed Budget for the Fi-
nancial Management Department (FM) is
approximately $4.3 million, a $60,000 or
1.4% decrease from the FY 2016 Adopted
Budget. This decrease is due to a $63,000
reduction in fringe benefit costs as well as
small reductions in hourly and other wages
and the removal of one-time budget items
added in FY 2016. These reductions are
partially mitigated by small increases in in-
formation technology and non-discretionary
allocation expenditures, as well as the addi-
tion of approximately $3,000 for the de-
partment’s Employee Rewards and Recogni-
tion Program.
The FY 2016 Adopted Budget included po-
sition additions and changes that were the
result of an internal review of Department
personnel and work needs. No new re-
quests were made for the FY 2017 Pro-
posed Budget outside of the addition of
funds for the City’s new Employee Rewards
and Recognition Program and a small in-
crease in on-going department information
technology needs.
Department Update
One of the new Budget Coordinator posi-
tions added to FM’s budget in FY 2016 is
helping to coordinate a financial and budget
video training program for Department
staff. Once completed FM plans to make
these videos available citywide, providing
additional training for department analysts
using current resources.
Description FTE PE NPE Total Expense Revenue
FY 2016 Adopted Budget 32.00 3,999,213$ 395,353$ 4,394,566$ -$
Employee Rewards and Recognition Program - - 2,620 2,620 -
Information Technology Adjustments - - 10,756 10,756 -
Non-discretionary Allocation Adjustments - - 6,819 6,819 -
Removal of FY 2016 One-time Budget (San Diego
Works Cash Awards) - - (3,089) (3,089) -
Other Salaries & Wages - (77,076) - (77,076) -
Hourly Wages Adjustment - (3) - (3) -
FY 2017 Proposed Budget 32.00 3,922,134$ 412,459$ 4,334,593$ -$
Difference from 2016 to 2017 - (77,079)$ 17,106$ (59,973)$ -$
SUMMARY OF FINANCIAL MANAGEMENT DEPARTMENT BUDGET CHANGES
Programmatic Changes
Other Changes
85
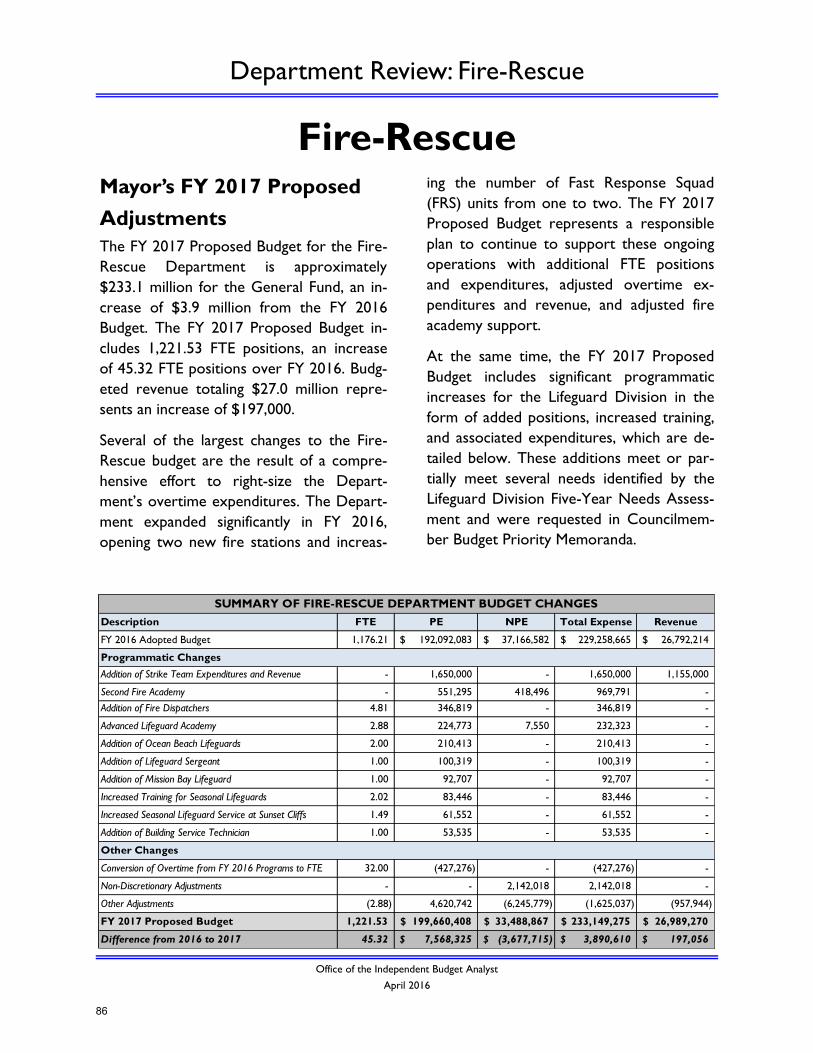
Department Review: Fire-Rescue
Office of the Independent Budget Analyst
April 2016
Fire-Rescue
Mayor’s FY 2017 Proposed
Adjustments
The FY 2017 Proposed Budget for the Fire-
Rescue Department is approximately
$233.1 million for the General Fund, an in-
crease of $3.9 million from the FY 2016
Budget. The FY 2017 Proposed Budget in-
cludes 1,221.53 FTE positions, an increase
of 45.32 FTE positions over FY 2016. Budg-
eted revenue totaling $27.0 million repre-
sents an increase of $197,000.
Several of the largest changes to the Fire-
Rescue budget are the result of a compre-
hensive effort to right-size the Depart-
ment’s overtime expenditures. The Depart-
ment expanded significantly in FY 2016,
opening two new fire stations and increas-
ing the number of Fast Response Squad
(FRS) units from one to two. The FY 2017
Proposed Budget represents a responsible
plan to continue to support these ongoing
operations with additional FTE positions
and expenditures, adjusted overtime ex-
penditures and revenue, and adjusted fire
academy support.
At the same time, the FY 2017 Proposed
Budget includes significant programmatic
increases for the Lifeguard Division in the
form of added positions, increased training,
and associated expenditures, which are de-
tailed below. These additions meet or par-
tially meet several needs identified by the
Lifeguard Division Five-Year Needs Assess-
ment and were requested in Councilmem-
ber Budget Priority Memoranda.
Description FTE PE NPE Total Expense Revenue
FY 2016 Adopted Budget 1,176.21 192,092,083$ 37,166,582$ 229,258,665$ 26,792,214$
Addition of Strike Team Expenditures and Revenue - 1,650,000 - 1,650,000 1,155,000
Second Fire Academy - 551,295 418,496 969,791 -
Addition of Fire Dispatchers 4.81 346,819 - 346,819 -
Advanced Lifeguard Academy 2.88 224,773 7,550 232,323 -
Addition of Ocean Beach Lifeguards 2.00 210,413 - 210,413 -
Addition of Lifeguard Sergeant 1.00 100,319 - 100,319 -
Addition of Mission Bay Lifeguard 1.00 92,707 - 92,707 -
Increased Training for Seasonal Lifeguards 2.02 83,446 - 83,446 -
Increased Seasonal Lifeguard Service at Sunset Cliffs 1.49 61,552 - 61,552 -
Addition of Building Service Technician 1.00 53,535 - 53,535 -
Conversion of Overtime from FY 2016 Programs to FTE 32.00 (427,276) - (427,276) -
Non-Discretionary Adjustments - - 2,142,018 2,142,018 -
Other Adjustments (2.88) 4,620,742 (6,245,779) (1,625,037) (957,944)
FY 2017 Proposed Budget 1,221.53 199,660,408$ 33,488,867$ 233,149,275$ 26,989,270$
Difference from 2016 to 2017 45.32 7,568,325$ (3,677,715)$ 3,890,610$ 197,056$
SUMMARY OF FIRE-RESCUE DEPARTMENT BUDGET CHANGES
Programmatic Changes
Other Changes
86
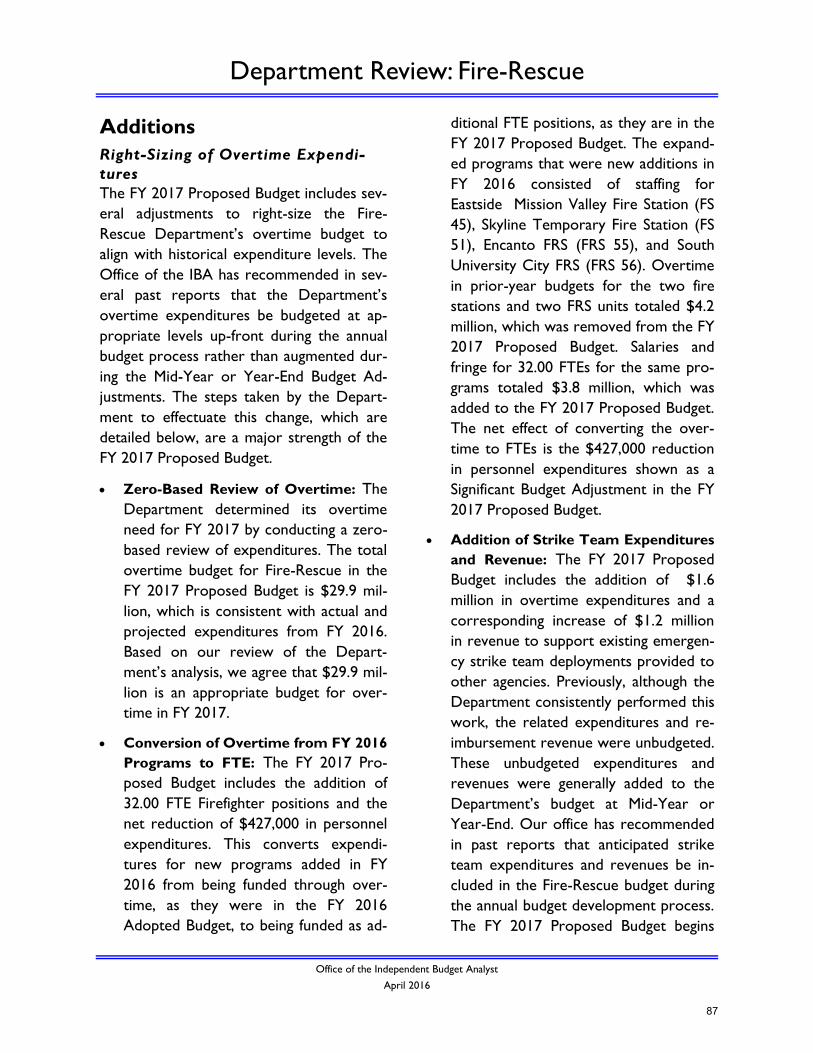
Department Review: Fire-Rescue
Office of the Independent Budget Analyst
April 2016
Additions
Right-Sizing of Overtime Expendi-
tures
The FY 2017 Proposed Budget includes sev-
eral adjustments to right-size the Fire-
Rescue Department’s overtime budget to
align with historical expenditure levels. The
Office of the IBA has recommended in sev-
eral past reports that the Department’s
overtime expenditures be budgeted at ap-
propriate levels up-front during the annual
budget process rather than augmented dur-
ing the Mid-Year or Year-End Budget Ad-
justments. The steps taken by the Depart-
ment to effectuate this change, which are
detailed below, are a major strength of the
FY 2017 Proposed Budget.
Zero-Based Review of Overtime: The
Department determined its overtime
need for FY 2017 by conducting a zero-
based review of expenditures. The total
overtime budget for Fire-Rescue in the
FY 2017 Proposed Budget is $29.9 mil-
lion, which is consistent with actual and
projected expenditures from FY 2016.
Based on our review of the Depart-
ment’s analysis, we agree that $29.9 mil-
lion is an appropriate budget for over-
time in FY 2017.
Conversion of Overtime from FY 2016
Programs to FTE: The FY 2017 Pro-
posed Budget includes the addition of
32.00 FTE Firefighter positions and the
net reduction of $427,000 in personnel
expenditures. This converts expendi-
tures for new programs added in FY
2016 from being funded through over-
time, as they were in the FY 2016
Adopted Budget, to being funded as ad-
ditional FTE positions, as they are in the
FY 2017 Proposed Budget. The expand-
ed programs that were new additions in
FY 2016 consisted of staffing for
Eastside Mission Valley Fire Station (FS
45), Skyline Temporary Fire Station (FS
51), Encanto FRS (FRS 55), and South
University City FRS (FRS 56). Overtime
in prior-year budgets for the two fire
stations and two FRS units totaled $4.2
million, which was removed from the FY
2017 Proposed Budget. Salaries and
fringe for 32.00 FTEs for the same pro-
grams totaled $3.8 million, which was
added to the FY 2017 Proposed Budget.
The net effect of converting the over-
time to FTEs is the $427,000 reduction
in personnel expenditures shown as a
Significant Budget Adjustment in the FY
2017 Proposed Budget.
Addition of Strike Team Expenditures
and Revenue: The FY 2017 Proposed
Budget includes the addition of $1.6
million in overtime expenditures and a
corresponding increase of $1.2 million
in revenue to support existing emergen-
cy strike team deployments provided to
other agencies. Previously, although the
Department consistently performed this
work, the related expenditures and re-
imbursement revenue were unbudgeted.
These unbudgeted expenditures and
revenues were generally added to the
Department’s budget at Mid-Year or
Year-End. Our office has recommended
in past reports that anticipated strike
team expenditures and revenues be in-
cluded in the Fire-Rescue budget during
the annual budget development process.
The FY 2017 Proposed Budget begins
87
Department Review: Fire-Rescue
Office of the Independent Budget Analyst
April 2016
this practice.
Adjustments to Overtime Expendi-
tures: The FY 2017 Proposed Budget
includes the addition of $2.6 million in
overtime expenditures as the final step
in the Department’s overtime right-
sizing process. Starting with the total
Fire-Rescue overtime budget for FY
2017 of $29.9 million, as determined by
a zero-based review, $4.2 million was
subtracted by converting previous over-
time to FTE positions. Subsequently,
$1.6 million was added for strike team
deployments. The resulting $2.6 million
funding gap was addressed by the addi-
tion of overtime expenditures, and is
highlighted as a Significant Budget Ad-
justment. The result is a right-sized Fire-
Rescue overtime budget of $29.9 mil-
lion.
Fire Academies
The FY 2017 Proposed Budget includes
funding for a total of two fire academies in
FY 2017, a reduction from the three fire
academies that were funded in FY 2016.
The Significant Budget Adjustment for this
item notes additional personnel and non-
personnel expenditures of $970,000 for a
second academy due to the fact that one
academy is already included in the Fire-
Rescue Department’s base budget. The FY
2017 Proposed Budget adds this second fire
academy as an ongoing expense for the Fire
-Rescue Department. The Department has
indicated that two fire academies will be
sufficient to mitigate the effects of attrition
and that it intends to achieve full fire sup-
pression staffing by the end of FY 2017.
Advanced Lifeguard Academy
The FY 2017 Proposed Budget includes the
addition of 2.88 hourly FTEs and $232,000
in associated personnel and non-personnel
costs to support an Advanced Lifeguard
Academy. The academy provides essential
training for the Lifeguard Division and is at-
tended by Lifeguard 1 hourly employees
who are paid while they participate in the
10-week training session. The Advanced
Lifeguard Academy does not add new full-
time positions to the Lifeguard Division. Re-
lated expenditures include hourly pay for
participants, overtime for instructors, and
supplies. Expenditures for an Advanced Life-
guard Academy in FY 2017 were included in
the FY 2017-2021 Five-Year Financial Out-
look.
Addition of Lifeguard Positions
The FY 2017 Proposed Budget includes the
addition of 7.51 FTE positions and $548,000
in related expenditures for expanded Life-
guard Division services. Of this amount,
4.00 FTEs are new lifeguard positions, 1.49
FTEs represent additional seasonal lifeguard
hours, and 2.02 FTEs represent increased
training hours for seasonal lifeguards. A ma-
jority of Councilmember Budget Priority
Memoranda requested funding to support
the Lifeguard Division’s Five-Year Needs
Assessment, which includes all of the added
positions described above and is discussed
later in the “Issues to Consider” section of
this Department Review. The FTEs added
to the Lifeguard Division in the FY 2017
Proposed Budget are as follows:
2.00 Lifeguard 3 positions for coastal
cliff rescue and water rescue at Ocean
Beach
1.00 Lifeguard Sergeant position to co-
ordinate training and support special
operations
88
Department Review: Fire-Rescue
Office of the Independent Budget Analyst
April 2016
1.00 Lifeguard 3 position to coordinate
training and lifeguard operations at Mis-
sion Bay
2.02 FTE positions for increased season-
al lifeguard hours for advanced training
1.49 FTE positions for increased season-
al lifeguard hours at Sunset Cliffs
Issues to Consider
Capital Needs for New Fire Stations
In our office’s review of the FY 2017-2021
Five-Year Financial Outlook, we noted that
although funding was included for the oper-
ation of five new fire stations by FY 2021,
capital funding has not yet been identified to
fully fund the design, land acquisition, and
construction costs for three out of five of
these facilities. Fully funded fire stations in-
clude Bayside Fire Station (FS 2), which is
fully funded by the Successor Agency to the
former Redevelopment Agency and is antici-
pated to become operational in FY 2018.
The second fully funded station is North
University City Fire Station (FS 50), which is
expected to be fully funded by Facilities
Benefits Assessments.
The remaining three stations, which the
Outlook anticipates opening in FY 2021,
have significant unfunded needs totaling
$32.8 million. These facilities include Col-
lege Avenue Fire Station, Home Avenue
Fire Station, and Paradise Hills Fire Station
(FS 54). The FY 2017 Proposed Budget does
not identify additional capital funding for
these fire stations.
Citygate Working Group Five-Year
Implementation Plan
The City Council approved the Citygate
Working Group Five-Year Implementation
Plan (CWG Plan), which addresses the most
critical Fire-Rescue Department needs, in
November 2011. The most recent update
to the CWG Plan was presented to the
Public Safety & Livable Neighborhoods
Committee in February 2016.
At the March 2016 Rules Committee meet-
ing, the Fire Chief announced that the De-
partment plans to retain Citygate Associ-
ates to conduct an updated Standards of
Coverage study beginning in June 2016. The
Department plans to expend $101,000 of
existing FY 2016 resources to conduct the
study, which is expected to be completed
no later than Fall 2016. The Fire-Rescue
Department has indicated that an updated
Citygate study is critical in order to accu-
rately prioritize plans for new fire stations.
As noted earlier in our discussion of capital
needs for new fire stations, the FY 2017
Proposed Budget does not include addition-
al funding for any new Citygate-related fire
stations (from the 2011 CWG Plan) beyond
what was added in prior fiscal years.
South University City FRS Expansion
A majority of Councilmember Budget Prior-
ity Memoranda requested funding for the
expansion of the existing 12-hour South
University City FRS to a 24-hour temporary
fire station. The FY 2017 Proposed Budget
does not include expenditures for this pur-
pose, nor were they requested by the Fire-
Rescue Department.
The conversion of the existing South Uni-
versity City FRS, which is staffed 12 hours
per day with two-person crews, to a tem-
porary fire station staffed 24 hours per day
89
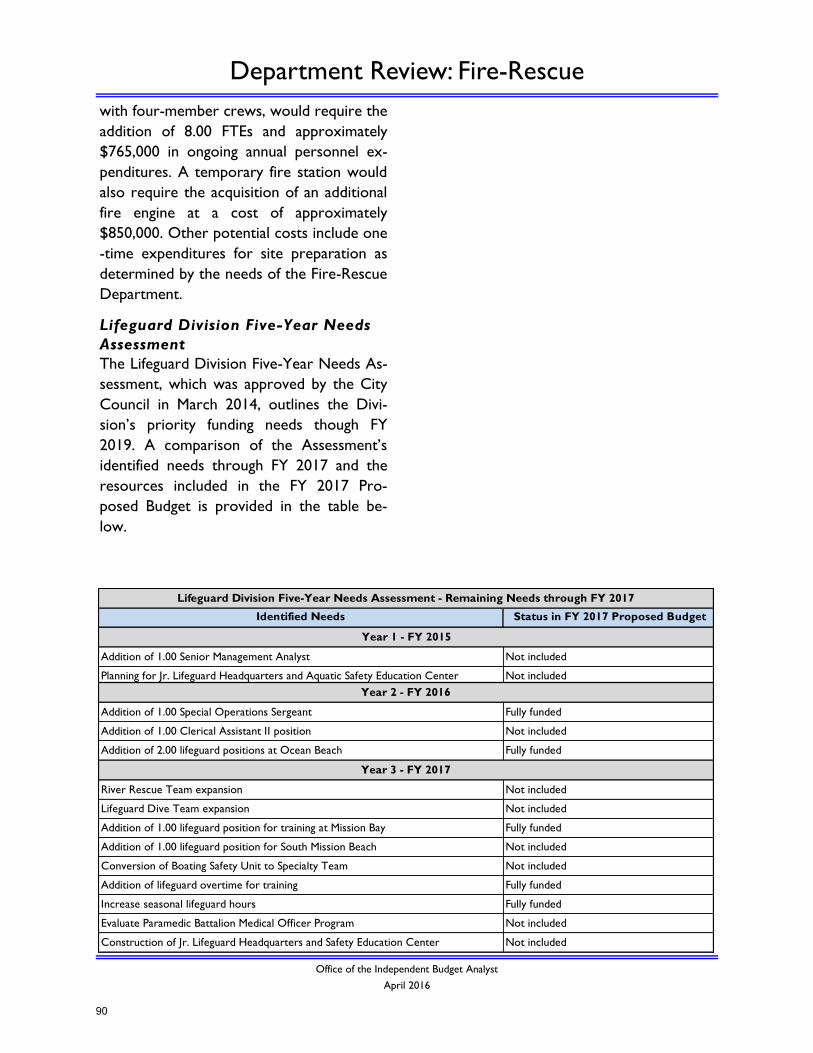
Department Review: Fire-Rescue
Office of the Independent Budget Analyst
April 2016
with four-member crews, would require the
addition of 8.00 FTEs and approximately
$765,000 in ongoing annual personnel ex-
penditures. A temporary fire station would
also require the acquisition of an additional
fire engine at a cost of approximately
$850,000. Other potential costs include one
-time expenditures for site preparation as
determined by the needs of the Fire-Rescue
Department.
Lifeguard Division Five-Year Needs
Assessment
The Lifeguard Division Five-Year Needs As-
sessment, which was approved by the City
Council in March 2014, outlines the Divi-
sion’s priority funding needs though FY
2019. A comparison of the Assessment’s
identified needs through FY 2017 and the
resources included in the FY 2017 Pro-
posed Budget is provided in the table be-
low.
Identified Needs Status in FY 2017 Proposed Budget
Addition of 1.00 Senior Management Analyst Not included
Planning for Jr. Lifeguard Headquarters and Aquatic Safety Education Center Not included
Addition of 1.00 Special Operations Sergeant Fully funded
Addition of 1.00 Clerical Assistant II position Not included
Addition of 2.00 lifeguard positions at Ocean Beach Fully funded
River Rescue Team expansion Not included
Lifeguard Dive Team expansion Not included
Addition of 1.00 lifeguard position for training at Mission Bay Fully funded
Addition of 1.00 lifeguard position for South Mission Beach Not included
Conversion of Boating Safety Unit to Specialty Team Not included
Addition of lifeguard overtime for training Fully funded
Increase seasonal lifeguard hours Fully funded
Evaluate Paramedic Battalion Medical Officer Program Not included
Construction of Jr. Lifeguard Headquarters and Safety Education Center Not included
Lifeguard Division Five-Year Needs Assessment - Remaining Needs through FY 2017
Year 1 - FY 2015
Year 2 - FY 2016
Year 3 - FY 2017
90
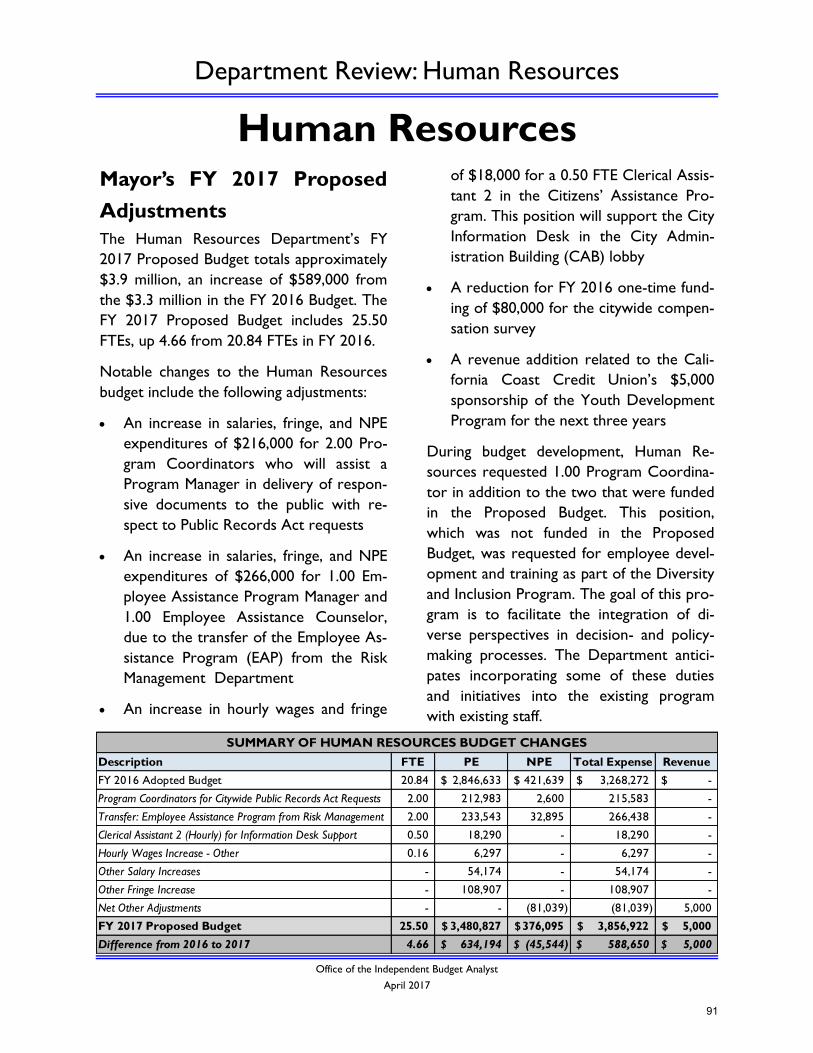
Department Review: Human Resources
Office of the Independent Budget Analyst
April 2017
Human Resources
Mayor’s FY 2017 Proposed
Adjustments
The Human Resources Department’s FY
2017 Proposed Budget totals approximately
$3.9 million, an increase of $589,000 from
the $3.3 million in the FY 2016 Budget. The
FY 2017 Proposed Budget includes 25.50
FTEs, up 4.66 from 20.84 FTEs in FY 2016.
Notable changes to the Human Resources
budget include the following adjustments:
An increase in salaries, fringe, and NPE
expenditures of $216,000 for 2.00 Pro-
gram Coordinators who will assist a
Program Manager in delivery of respon-
sive documents to the public with re-
spect to Public Records Act requests
An increase in salaries, fringe, and NPE
expenditures of $266,000 for 1.00 Em-
ployee Assistance Program Manager and
1.00 Employee Assistance Counselor,
due to the transfer of the Employee As-
sistance Program (EAP) from the Risk
Management Department
An increase in hourly wages and fringe
of $18,000 for a 0.50 FTE Clerical Assis-
tant 2 in the Citizens’ Assistance Pro-
gram. This position will support the City
Information Desk in the City Admin-
istration Building (CAB) lobby
A reduction for FY 2016 one-time fund-
ing of $80,000 for the citywide compen-
sation survey
A revenue addition related to the Cali-
fornia Coast Credit Union’s $5,000
sponsorship of the Youth Development
Program for the next three years
During budget development, Human Re-
sources requested 1.00 Program Coordina-
tor in addition to the two that were funded
in the Proposed Budget. This position,
which was not funded in the Proposed
Budget, was requested for employee devel-
opment and training as part of the Diversity
and Inclusion Program. The goal of this pro-
gram is to facilitate the integration of di-
verse perspectives in decision- and policy-
making processes. The Department antici-
pates incorporating some of these duties
and initiatives into the existing program
with existing staff.
Description FTE PE NPE Total Expense Revenue
FY 2016 Adopted Budget 20.84 2,846,633$ 421,639$ 3,268,272$ -$
Program Coordinators for Citywide Public Records Act Requests 2.00 212,983 2,600 215,583 -
Transfer: Employee Assistance Program from Risk Management 2.00 233,543 32,895 266,438 -
Clerical Assistant 2 (Hourly) for Information Desk Support 0.50 18,290 - 18,290 -
Hourly Wages Increase - Other 0.16 6,297 - 6,297 -
Other Salary Increases - 54,174 - 54,174 -
Other Fringe Increase - 108,907 - 108,907 -
Net Other Adjustments - - (81,039) (81,039) 5,000
FY 2017 Proposed Budget 25.50 3,480,827$ 376,095$ 3,856,922$ 5,000$
Difference from 2016 to 2017 4.66 634,194$ (45,544)$ 588,650$ 5,000$
SUMMARY OF HUMAN RESOURCES BUDGET CHANGES
91

Department Review: Internal Operations
Office of the Independent Budget Analyst
April 2016
Internal Operations The Deputy Chief Operating Officer
(DCOO) for Internal Operations is respon-
sible for overseeing the day-to-day opera-
tions of the Internal Operations Branch
which includes the following departments
and programs:
Fleet Services
Human Resources
Information Technology
Purchasing & Contracting
Real Estate Assets
In FY 2016, Fleet Services was moved to
report directly to the DCOO of Internal
Operations, in order to focus on the ser-
vices Fleet Services provides to all City de-
partments. Our review of the Proposed
Budget for Human Resources, Information
Technology, Purchasing & Contracting, and
Real Estate Assets are included in separate
sections of this report, and our review of
Fleet Services is included here in a subsec-
tion.
Mayor’s FY 2017 Proposed
Adjustments The FY 2017 Proposed Budget for General
Fund expenditures in Internal Operations
totals $417,000, an increase of $21,000
over FY 2016. $14,000 of that increase is
due to salary and benefit adjustments, and
$7,000 is due to non-discretionary adjust-
ments and Information Technology costs.
Fleet Services provides City departments
with motive equipment and support, includ-
ing vehicle acquisition, maintenance, repair,
and provisioning of fuel. Fleet Services is
funded by the Fleet Services Operating Fund
and the Fleet Services Replacement Fund,
each of which receives revenue by charging
customer departments.
The FY 2017 Proposed Budget for the com-
bined funds includes $85.9 million in ex-
penditures, which is a $2.9 million increase
over the FY 2016 Adopted Budget. Reve-
nues for the funds in the Proposed Budget
total $80.1 million, an increase of $6.6 mil-
lion over FY 2016.
An overview of changes to Fleet Service’s
budget is provided on the next page. Signifi-
cant adjustments to Fleet’s budget include:
$1.0 million in expenditures to repair
car washes and wash racks throughout
all fleet locations
$750,000 in expenditures to make on-
going upgrades, updates, and safety im-
provements at all Fleet Services loca-
tions
1.00 new FTE for a Fleet Team Leader
position, which will support the first
shift at the Chollas maintenance shop
3.00 new FTE positions to support the
Fleet Services parts program, which will
assist in clean-up, inventory, and main-
Fleet Services
92
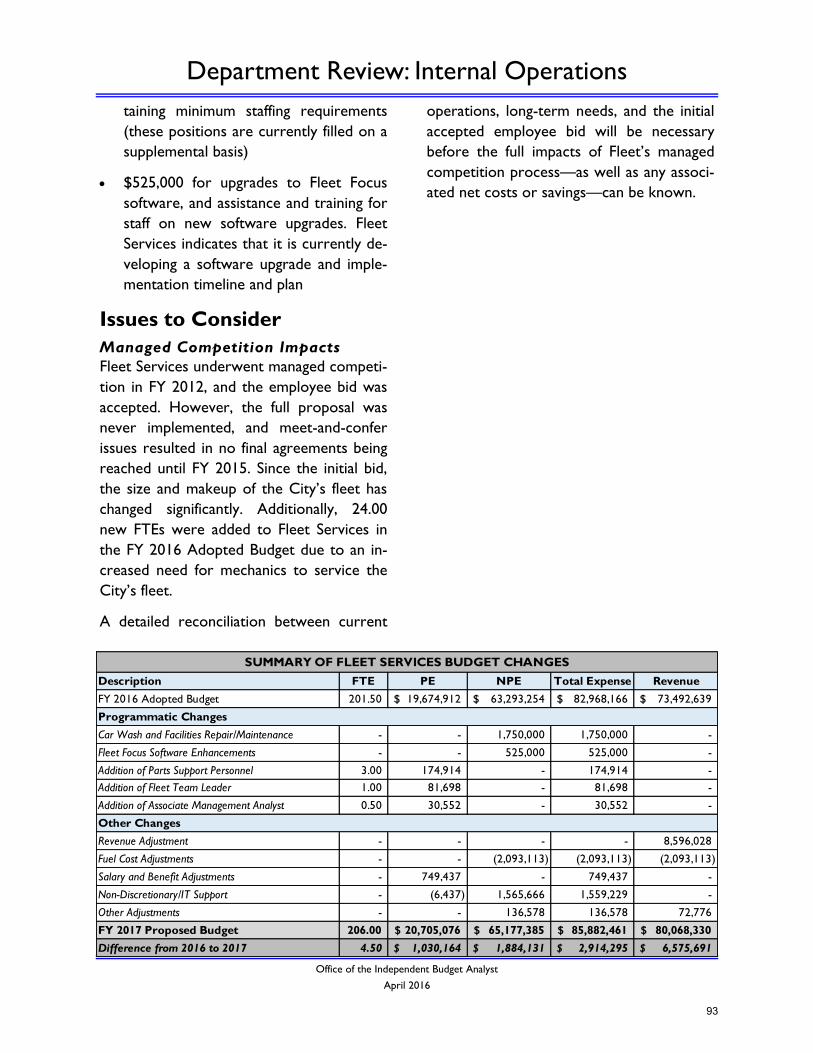
Department Review: Internal Operations
Office of the Independent Budget Analyst
April 2016
taining minimum staffing requirements
(these positions are currently filled on a
supplemental basis)
$525,000 for upgrades to Fleet Focus
software, and assistance and training for
staff on new software upgrades. Fleet
Services indicates that it is currently de-
veloping a software upgrade and imple-
mentation timeline and plan
Issues to Consider
Managed Competition Impacts
Fleet Services underwent managed competi-
tion in FY 2012, and the employee bid was
accepted. However, the full proposal was
never implemented, and meet-and-confer
issues resulted in no final agreements being
reached until FY 2015. Since the initial bid,
the size and makeup of the City’s fleet has
changed significantly. Additionally, 24.00
new FTEs were added to Fleet Services in
the FY 2016 Adopted Budget due to an in-
creased need for mechanics to service the
City’s fleet.
A detailed reconciliation between current
operations, long-term needs, and the initial
accepted employee bid will be necessary
before the full impacts of Fleet’s managed
competition process—as well as any associ-
ated net costs or savings—can be known.
Description FTE PE NPE Total Expense Revenue
FY 2016 Adopted Budget 201.50 19,674,912$ 63,293,254$ 82,968,166$ 73,492,639$
Car Wash and Facilities Repair/Maintenance - - 1,750,000 1,750,000 -
Fleet Focus Software Enhancements - - 525,000 525,000 -
Addition of Parts Support Personnel 3.00 174,914 - 174,914 -
Addition of Fleet Team Leader 1.00 81,698 - 81,698 -
Addition of Associate Management Analyst 0.50 30,552 - 30,552 -
Revenue Adjustment - - - - 8,596,028
Fuel Cost Adjustments - - (2,093,113) (2,093,113) (2,093,113)
Salary and Benefit Adjustments - 749,437 - 749,437 -
Non-Discretionary/IT Support - (6,437) 1,565,666 1,559,229 -
Other Adjustments - - 136,578 136,578 72,776
FY 2017 Proposed Budget 206.00 20,705,076$ 65,177,385$ 85,882,461$ 80,068,330$
Difference from 2016 to 2017 4.50 1,030,164$ 1,884,131$ 2,914,295$ 6,575,691$
SUMMARY OF FLEET SERVICES BUDGET CHANGES
Programmatic Changes
Other Changes
93
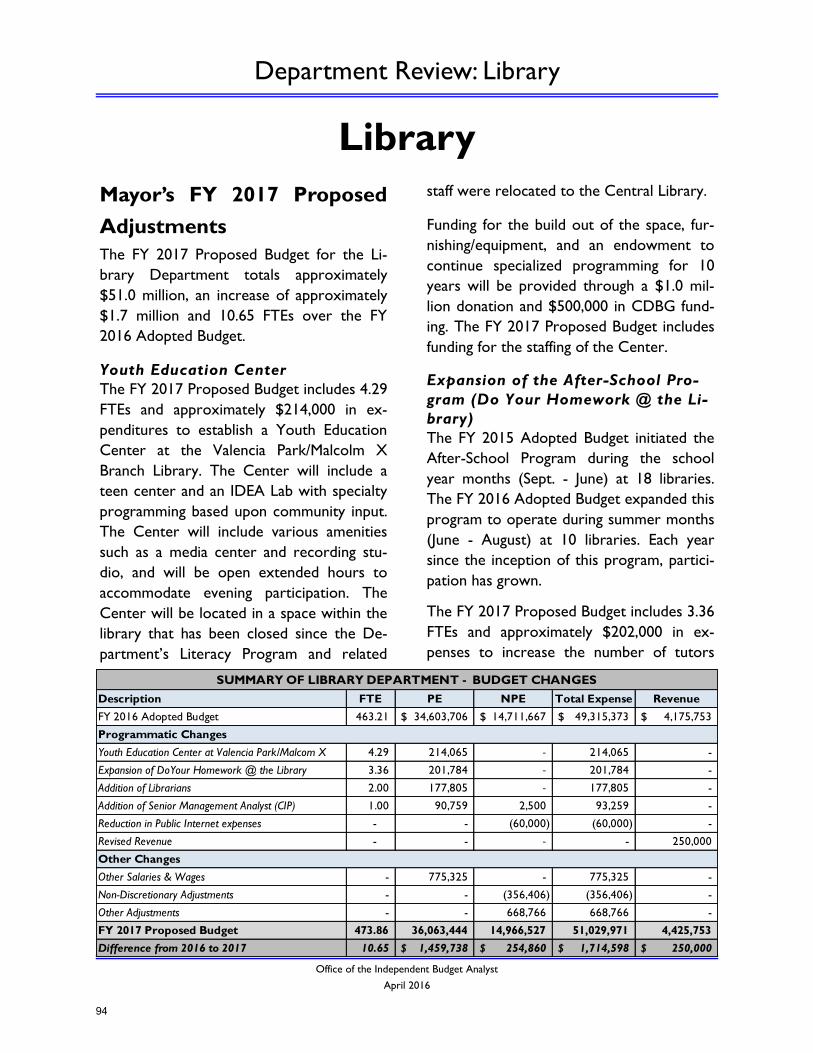
Department Review: Library
Office of the Independent Budget Analyst
April 2016
Library
Mayor’s FY 2017 Proposed
Adjustments
The FY 2017 Proposed Budget for the Li-
brary Department totals approximately
$51.0 million, an increase of approximately
$1.7 million and 10.65 FTEs over the FY
2016 Adopted Budget.
Youth Education Center
The FY 2017 Proposed Budget includes 4.29
FTEs and approximately $214,000 in ex-
penditures to establish a Youth Education
Center at the Valencia Park/Malcolm X
Branch Library. The Center will include a
teen center and an IDEA Lab with specialty
programming based upon community input.
The Center will include various amenities
such as a media center and recording stu-
dio, and will be open extended hours to
accommodate evening participation. The
Center will be located in a space within the
library that has been closed since the De-
partment’s Literacy Program and related
staff were relocated to the Central Library.
Funding for the build out of the space, fur-
nishing/equipment, and an endowment to
continue specialized programming for 10
years will be provided through a $1.0 mil-
lion donation and $500,000 in CDBG fund-
ing. The FY 2017 Proposed Budget includes
funding for the staffing of the Center.
Expansion of the After-School Pro-
gram (Do Your Homework @ the Li-
brary)
The FY 2015 Adopted Budget initiated the
After-School Program during the school
year months (Sept. - June) at 18 libraries.
The FY 2016 Adopted Budget expanded this
program to operate during summer months
(June - August) at 10 libraries. Each year
since the inception of this program, partici-
pation has grown.
The FY 2017 Proposed Budget includes 3.36
FTEs and approximately $202,000 in ex-
penses to increase the number of tutors
Description FTE PE NPE Total Expense Revenue
FY 2016 Adopted Budget 463.21 34,603,706$ 14,711,667$ 49,315,373$ 4,175,753$
Youth Education Center at Valencia Park/Malcom X 4.29 214,065 - 214,065 -
Expansion of DoYour Homework @ the Library 3.36 201,784 - 201,784 -
Addition of Librarians 2.00 177,805 - 177,805 -
Addition of Senior Management Analyst (CIP) 1.00 90,759 2,500 93,259 -
Reduction in Public Internet expenses - - (60,000) (60,000) -
Revised Revenue - - - - 250,000
Other Salaries & Wages - 775,325 - 775,325 -
Non-Discretionary Adjustments - - (356,406) (356,406) -
Other Adjustments - - 668,766 668,766 -
FY 2017 Proposed Budget 473.86 36,063,444 14,966,527 51,029,971 4,425,753
Difference from 2016 to 2017 10.65 1,459,738$ 254,860$ 1,714,598$ 250,000$
SUMMARY OF LIBRARY DEPARTMENT - BUDGET CHANGES
Programmatic Changes
Other Changes
94
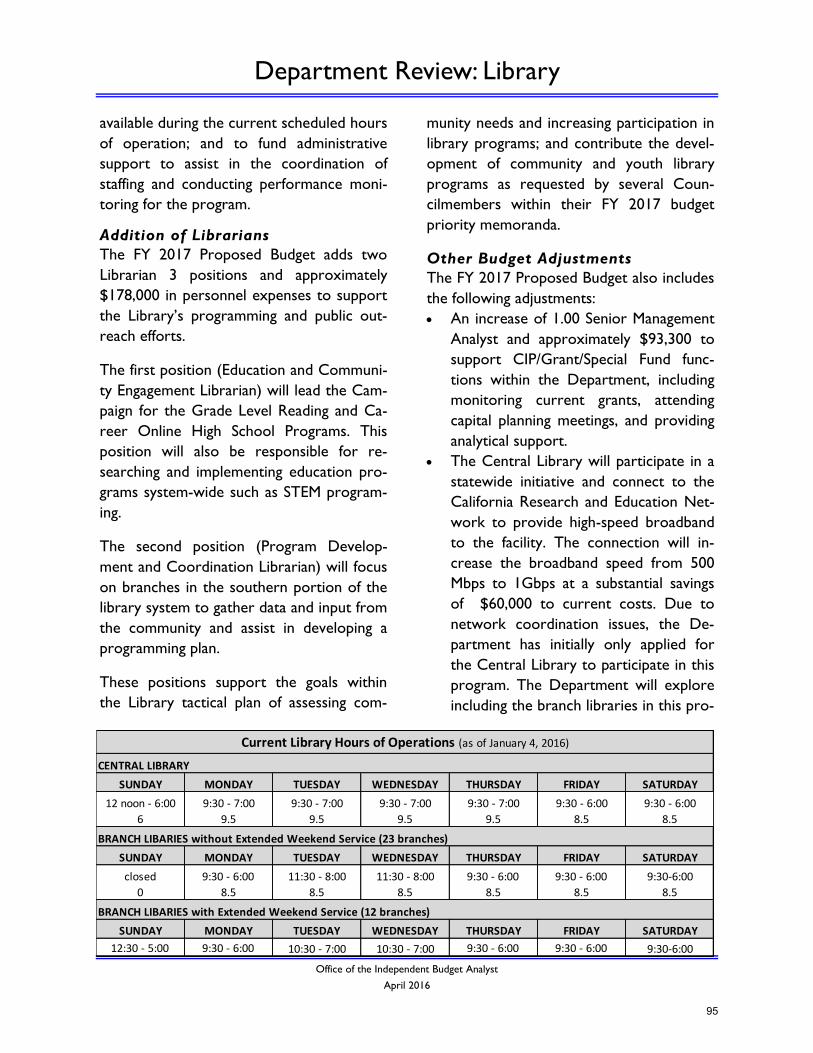
Department Review: Library
Office of the Independent Budget Analyst
April 2016
available during the current scheduled hours
of operation; and to fund administrative
support to assist in the coordination of
staffing and conducting performance moni-
toring for the program.
Addition of Librarians
The FY 2017 Proposed Budget adds two
Librarian 3 positions and approximately
$178,000 in personnel expenses to support
the Library’s programming and public out-
reach efforts.
The first position (Education and Communi-
ty Engagement Librarian) will lead the Cam-
paign for the Grade Level Reading and Ca-
reer Online High School Programs. This
position will also be responsible for re-
searching and implementing education pro-
grams system-wide such as STEM program-
ing.
The second position (Program Develop-
ment and Coordination Librarian) will focus
on branches in the southern portion of the
library system to gather data and input from
the community and assist in developing a
programming plan.
These positions support the goals within
the Library tactical plan of assessing com-
munity needs and increasing participation in
library programs; and contribute the devel-
opment of community and youth library
programs as requested by several Coun-
cilmembers within their FY 2017 budget
priority memoranda.
Other Budget Adjustments
The FY 2017 Proposed Budget also includes
the following adjustments:
An increase of 1.00 Senior Management
Analyst and approximately $93,300 to
support CIP/Grant/Special Fund func-
tions within the Department, including
monitoring current grants, attending
capital planning meetings, and providing
analytical support.
The Central Library will participate in a
statewide initiative and connect to the
California Research and Education Net-
work to provide high-speed broadband
to the facility. The connection will in-
crease the broadband speed from 500
Mbps to 1Gbps at a substantial savings
of $60,000 to current costs. Due to
network coordination issues, the De-
partment has initially only applied for
the Central Library to participate in this
program. The Department will explore
including the branch libraries in this pro-
SUNDAY MONDAY TUESDAY WEDNESDAY THURSDAY FRIDAY SATURDAY
12 noon - 6:00 9:30 - 7:00 9:30 - 7:00 9:30 - 7:00 9:30 - 7:00 9:30 - 6:00 9:30 - 6:00
6 9.5 9.5 9.5 9.5 8.5 8.5
SUNDAY MONDAY TUESDAY WEDNESDAY THURSDAY FRIDAY SATURDAY
closed 9:30 - 6:00 11:30 - 8:00 11:30 - 8:00 9:30 - 6:00 9:30 - 6:00 9:30-6:00
0 8.5 8.5 8.5 8.5 8.5 8.5
SUNDAY MONDAY TUESDAY WEDNESDAY THURSDAY FRIDAY SATURDAY
12:30 - 5:00 9:30 - 6:00 10:30 - 7:00 10:30 - 7:00 9:30 - 6:00 9:30 - 6:00 9:30-6:00
Current Library Hours of Operations (as of January 4, 2016)
CENTRAL LIBRARY
BRANCH LIBARIES without Extended Weekend Service (23 branches)
BRANCH LIBARIES with Extended Weekend Service (12 branches)
95
Department Review: Library
Office of the Independent Budget Analyst
April 2016
gram during FY 2017.
The FY 2017 Proposed Budget includes
an increase of $250,000 in revenue pri-
marily due to increased utilization of the
parking garage and special event rooms
within the Central Library.
Issues to Consider
Expansion of Specialty Labs
The Library system currently has specialty
labs established in the La Jolla Branch library
(biotech emphasis) and the Central Library
(entrepreneur and patent emphasis), with a
third anticipated to open in FY 2017 in the
Valencia Park/Malcolm X Branch library.
Several Councilmembers’ FY 2017 budget
priority memoranda requested support to
establish additional labs throughout the li-
brary system. The Department has indicat-
ed that the cost and time needed to estab-
lish additional labs will need to be evaluated
on a case by case basis as each lab will be
tailored to its respective community. Fac-
tors that will impact the cost include, but
may not be limited to, the availability of
space within existing City facilities or the
need to rent/purchase space, the desired
programming and components of the lab,
and necessary staffing levels.
Library Programs Budget
Several Councilmembers’ FY 2017 budget
priority memoranda indicated support to
establish funding for library programming.
Currently, the only Library program funded
by the General Fund is the After-School
Homework Program. All other programs
provided by the Library Department are
funded via alternate funding sources such as
donations and grants. This approach can
often lead to inequities between the branch-
es within Library programming.
Per the Department, the establishment of a
permanent funding source or annual alloca-
tion from the General Fund for library pro-
gramming would further the Department’s
efforts to provide consistent services to all
communities. The FY 2017 Proposed Budg-
et includes 2.00 Librarian 3 positions to re-
search, gather community input, and devel-
op appropriate programming for each com-
munity.
Increase in Library Service Hours
Several Councilmembers’ FY 2017 budget
priority memoranda suggested increasing
service hours system wide. While library
service hours reached a low in 2011 (with
the Central Library open 44 hours per
week and branch libraries open 36 hours
per week), efforts from the Mayor and the
City Council have incrementally increased
library service hours to 61 hours per week
at the Central Library and 51 core hours
per week for the branch libraries. The cur-
rent service levels are close to those in
2003, which represented the highest service
levels (The Central Library was open 64
hours per week and branches were open 54
hours per week).
Per the Department, the future goal for ser-
vice hours would be for all the branch li-
braries to meet the Central Library service
hours total of 61 hours per week. The pre-
liminary cost estimate to achieve this goal is
approximately $5.0 million annually for addi-
tional staffing.
Library Ordinance
The Library Ordinance requires the Library
Department budget to be equal to no less
than 6% of the total General Fund expendi-
96
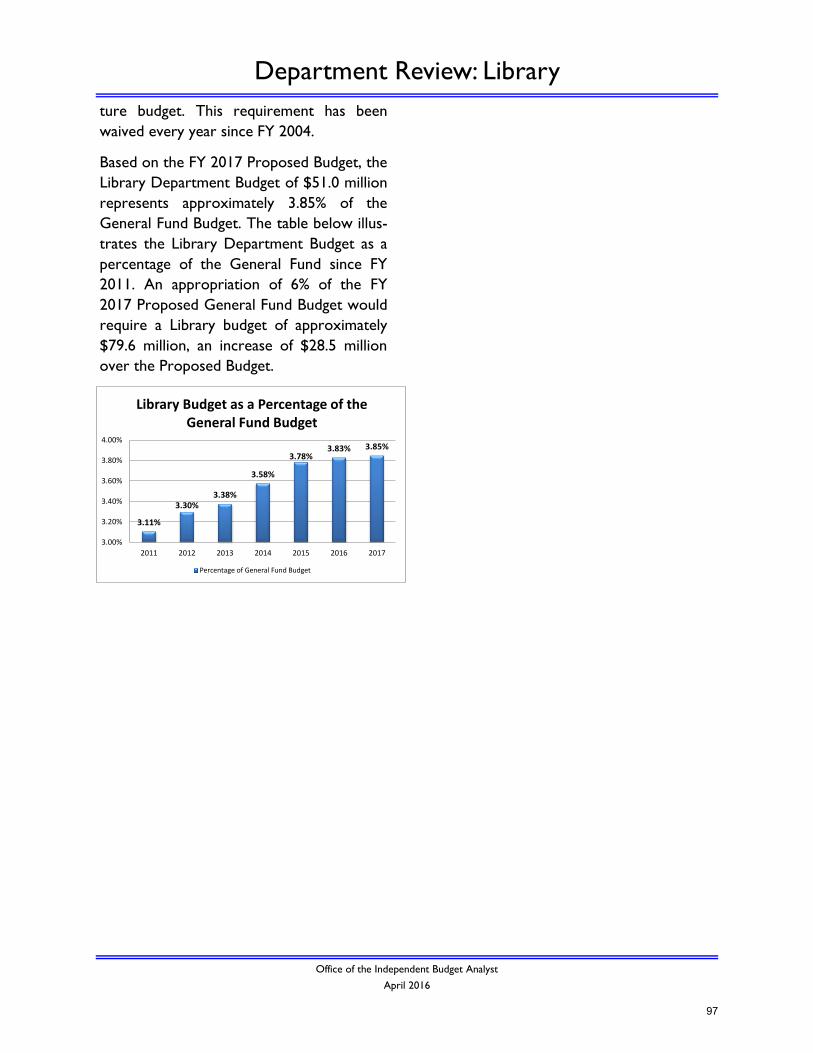
Department Review: Library
Office of the Independent Budget Analyst
April 2016
ture budget. This requirement has been
waived every year since FY 2004.
Based on the FY 2017 Proposed Budget, the
Library Department Budget of $51.0 million
represents approximately 3.85% of the
General Fund Budget. The table below illus-
trates the Library Department Budget as a
percentage of the General Fund since FY
2011. An appropriation of 6% of the FY
2017 Proposed General Fund Budget would
require a Library budget of approximately
$79.6 million, an increase of $28.5 million
over the Proposed Budget.
3.11%
3.30%3.38%
3.58%
3.78%3.83% 3.85%
3.00%
3.20%
3.40%
3.60%
3.80%
4.00%
2011 2012 2013 2014 2015 2016 2017
Library Budget as a Percentage of the General Fund Budget
Percentage of General Fund Budget
97
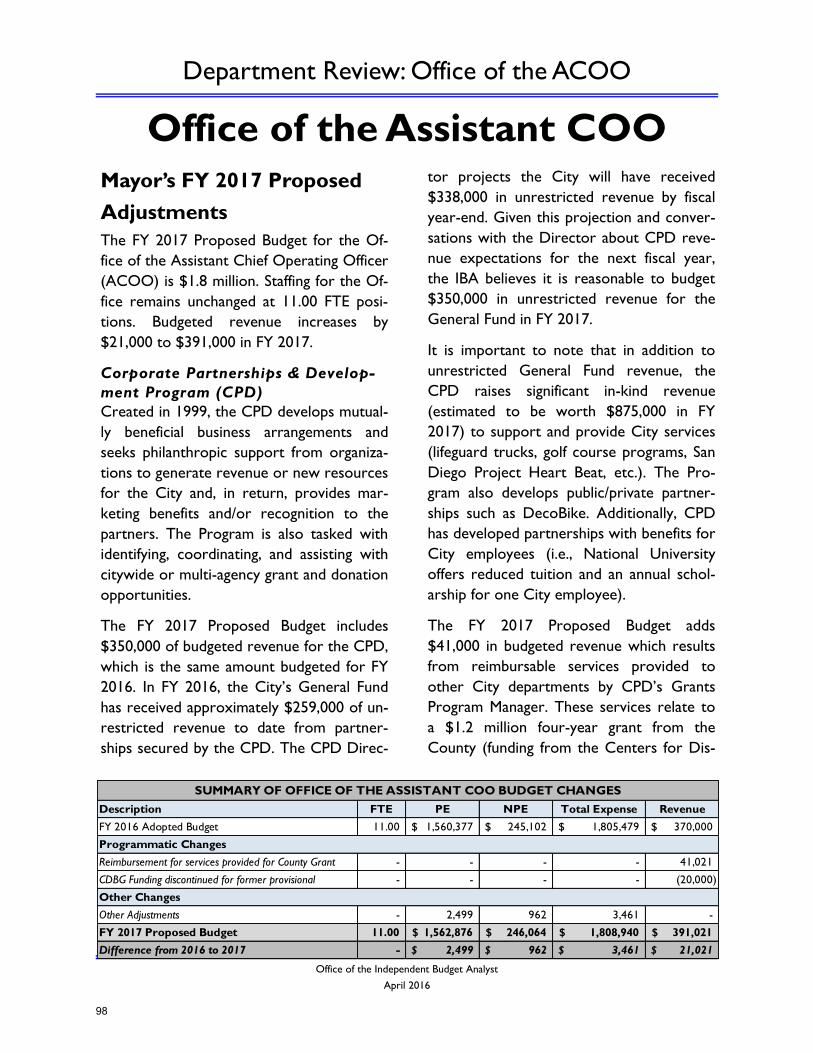
Department Review: Office of the ACOO
Office of the Independent Budget Analyst
April 2016
Office of the Assistant COO
Mayor’s FY 2017 Proposed
Adjustments
The FY 2017 Proposed Budget for the Of-
fice of the Assistant Chief Operating Officer
(ACOO) is $1.8 million. Staffing for the Of-
fice remains unchanged at 11.00 FTE posi-
tions. Budgeted revenue increases by
$21,000 to $391,000 in FY 2017.
Corporate Partnerships & Develop-
ment Program (CPD)
Created in 1999, the CPD develops mutual-
ly beneficial business arrangements and
seeks philanthropic support from organiza-
tions to generate revenue or new resources
for the City and, in return, provides mar-
keting benefits and/or recognition to the
partners. The Program is also tasked with
identifying, coordinating, and assisting with
citywide or multi-agency grant and donation
opportunities.
The FY 2017 Proposed Budget includes
$350,000 of budgeted revenue for the CPD,
which is the same amount budgeted for FY
2016. In FY 2016, the City’s General Fund
has received approximately $259,000 of un-
restricted revenue to date from partner-
ships secured by the CPD. The CPD Direc-
tor projects the City will have received
$338,000 in unrestricted revenue by fiscal
year-end. Given this projection and conver-
sations with the Director about CPD reve-
nue expectations for the next fiscal year,
the IBA believes it is reasonable to budget
$350,000 in unrestricted revenue for the
General Fund in FY 2017.
It is important to note that in addition to
unrestricted General Fund revenue, the
CPD raises significant in-kind revenue
(estimated to be worth $875,000 in FY
2017) to support and provide City services
(lifeguard trucks, golf course programs, San
Diego Project Heart Beat, etc.). The Pro-
gram also develops public/private partner-
ships such as DecoBike. Additionally, CPD
has developed partnerships with benefits for
City employees (i.e., National University
offers reduced tuition and an annual schol-
arship for one City employee).
The FY 2017 Proposed Budget adds
$41,000 in budgeted revenue which results
from reimbursable services provided to
other City departments by CPD’s Grants
Program Manager. These services relate to
a $1.2 million four-year grant from the
County (funding from the Centers for Dis-
Description FTE PE NPE Total Expense Revenue
FY 2016 Adopted Budget 11.00 1,560,377$ 245,102$ 1,805,479$ 370,000$
Reimbursement for services provided for County Grant - - - - 41,021
CDBG Funding discontinued for former provisional - - - - (20,000)
Other Adjustments - 2,499 962 3,461 -
FY 2017 Proposed Budget 11.00 1,562,876$ 246,064$ 1,808,940$ 391,021$
Difference from 2016 to 2017 - 2,499$ 962$ 3,461$ 21,021$
SUMMARY OF OFFICE OF THE ASSISTANT COO BUDGET CHANGES
Programmatic Changes
Other Changes
98
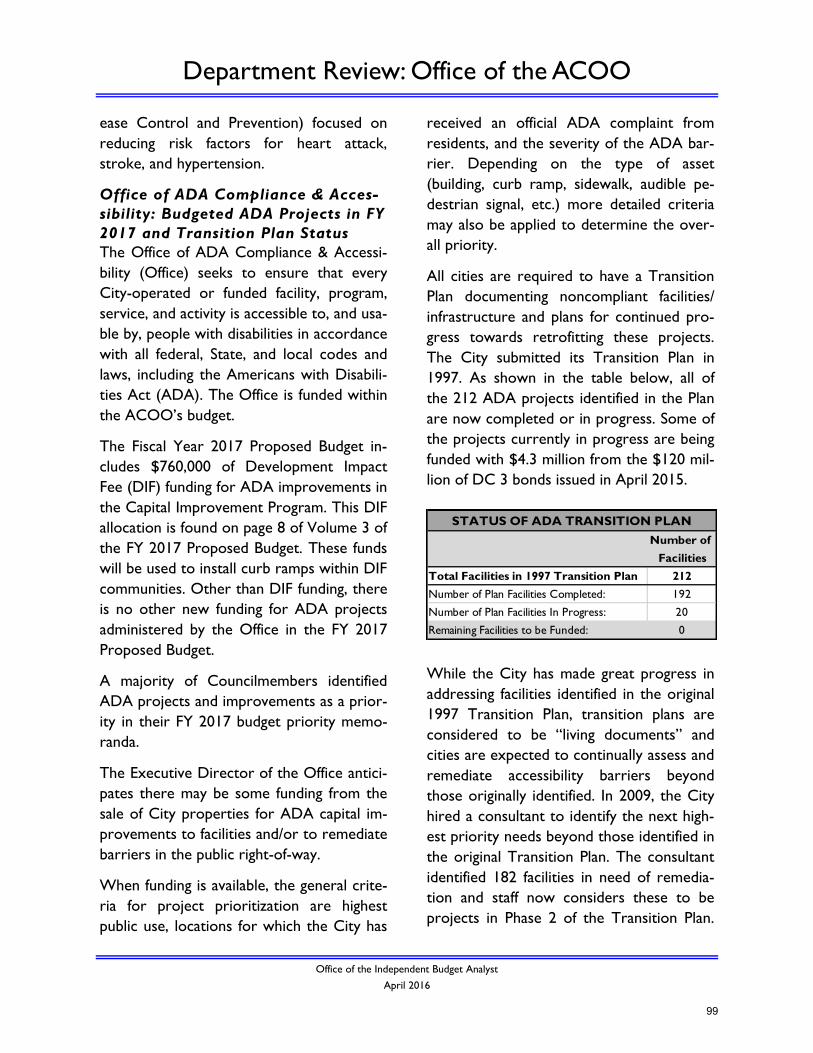
Department Review: Office of the ACOO
Office of the Independent Budget Analyst
April 2016
ease Control and Prevention) focused on
reducing risk factors for heart attack,
stroke, and hypertension.
Office of ADA Compliance & Acces-
sibility: Budgeted ADA Projects in FY
2017 and Transition Plan Status
The Office of ADA Compliance & Accessi-
bility (Office) seeks to ensure that every
City-operated or funded facility, program,
service, and activity is accessible to, and usa-
ble by, people with disabilities in accordance
with all federal, State, and local codes and
laws, including the Americans with Disabili-
ties Act (ADA). The Office is funded within
the ACOO’s budget.
The Fiscal Year 2017 Proposed Budget in-
cludes $760,000 of Development Impact
Fee (DIF) funding for ADA improvements in
the Capital Improvement Program. This DIF
allocation is found on page 8 of Volume 3 of
the FY 2017 Proposed Budget. These funds
will be used to install curb ramps within DIF
communities. Other than DIF funding, there
is no other new funding for ADA projects
administered by the Office in the FY 2017
Proposed Budget.
A majority of Councilmembers identified
ADA projects and improvements as a prior-
ity in their FY 2017 budget priority memo-
randa.
The Executive Director of the Office antici-
pates there may be some funding from the
sale of City properties for ADA capital im-
provements to facilities and/or to remediate
barriers in the public right-of-way.
When funding is available, the general crite-
ria for project prioritization are highest
public use, locations for which the City has
received an official ADA complaint from
residents, and the severity of the ADA bar-
rier. Depending on the type of asset
(building, curb ramp, sidewalk, audible pe-
destrian signal, etc.) more detailed criteria
may also be applied to determine the over-
all priority.
All cities are required to have a Transition
Plan documenting noncompliant facilities/
infrastructure and plans for continued pro-
gress towards retrofitting these projects.
The City submitted its Transition Plan in
1997. As shown in the table below, all of
the 212 ADA projects identified in the Plan
are now completed or in progress. Some of
the projects currently in progress are being
funded with $4.3 million from the $120 mil-
lion of DC 3 bonds issued in April 2015.
While the City has made great progress in
addressing facilities identified in the original
1997 Transition Plan, transition plans are
considered to be “living documents” and
cities are expected to continually assess and
remediate accessibility barriers beyond
those originally identified. In 2009, the City
hired a consultant to identify the next high-
est priority needs beyond those identified in
the original Transition Plan. The consultant
identified 182 facilities in need of remedia-
tion and staff now considers these to be
projects in Phase 2 of the Transition Plan.
Number of
Facilities
Total Facilities in 1997 Transition Plan 212
Number of Plan Facilities Completed: 192
Number of Plan Facilities In Progress: 20
Remaining Facilities to be Funded: 0
STATUS OF ADA TRANSITION PLAN
99
Department Review: Office of the ACOO
Office of the Independent Budget Analyst
April 2016
The Executive Director of the Office indi-
cates that 26 of the 182 projects have been
funded to date.
Issue to Consider
The City has made significant progress in
addressing identified accessibility barriers in
recent years, however, funding is limited
and these projects compete with other pri-
ority infrastructure needs in the City. The
City Council may wish to consider re-
questing an annual update from the Of-
fice of ADA Compliance & Accessibility
on the status of projects underway and
the identified needs going forward. This
information would be useful in the broader
discussion of the City’s overall infrastruc-
ture needs and the process for prioritizing
projects.
100
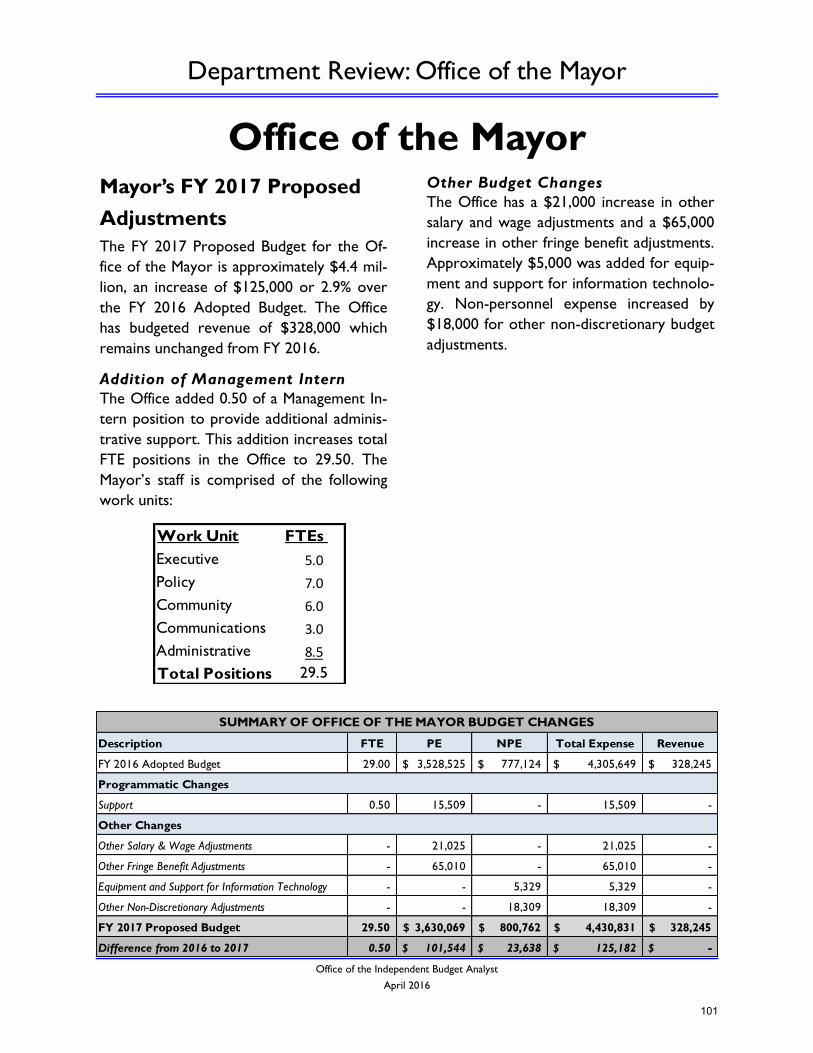
Department Review: Office of the Mayor
Office of the Independent Budget Analyst
April 2016
Office of the Mayor Mayor’s FY 2017 Proposed
Adjustments
The FY 2017 Proposed Budget for the Of-
fice of the Mayor is approximately $4.4 mil-
lion, an increase of $125,000 or 2.9% over
the FY 2016 Adopted Budget. The Office
has budgeted revenue of $328,000 which
remains unchanged from FY 2016.
Addition of Management Intern
The Office added 0.50 of a Management In-
tern position to provide additional adminis-
trative support. This addition increases total
FTE positions in the Office to 29.50. The
Mayor’s staff is comprised of the following
work units:
Other Budget Changes
The Office has a $21,000 increase in other
salary and wage adjustments and a $65,000
increase in other fringe benefit adjustments.
Approximately $5,000 was added for equip-
ment and support for information technolo-
gy. Non-personnel expense increased by
$18,000 for other non-discretionary budget
adjustments.
Work Unit FTEs
Executive 5.0
Policy 7.0
Community 6.0
Communications 3.0
Administrative 8.5
Total Positions 29.5
Description FTE PE NPE Total Expense Revenue
FY 2016 Adopted Budget 29.00 3,528,525$ 777,124$ 4,305,649$ 328,245$
Addition of 0.50 Management Intern for Admin.
Support 0.50 15,509 - 15,509 -
Other Salary & Wage Adjustments - 21,025 - 21,025 -
Other Fringe Benefit Adjustments - 65,010 - 65,010 -
Equipment and Support for Information Technology - - 5,329 5,329 -
Other Non-Discretionary Adjustments - - 18,309 18,309 -
FY 2017 Proposed Budget 29.50 3,630,069$ 800,762$ 4,430,831$ 328,245$
Difference from 2016 to 2017 0.50 101,544$ 23,638$ 125,182$ -$
SUMMARY OF OFFICE OF THE MAYOR BUDGET CHANGES
Programmatic Changes
Other Changes
101
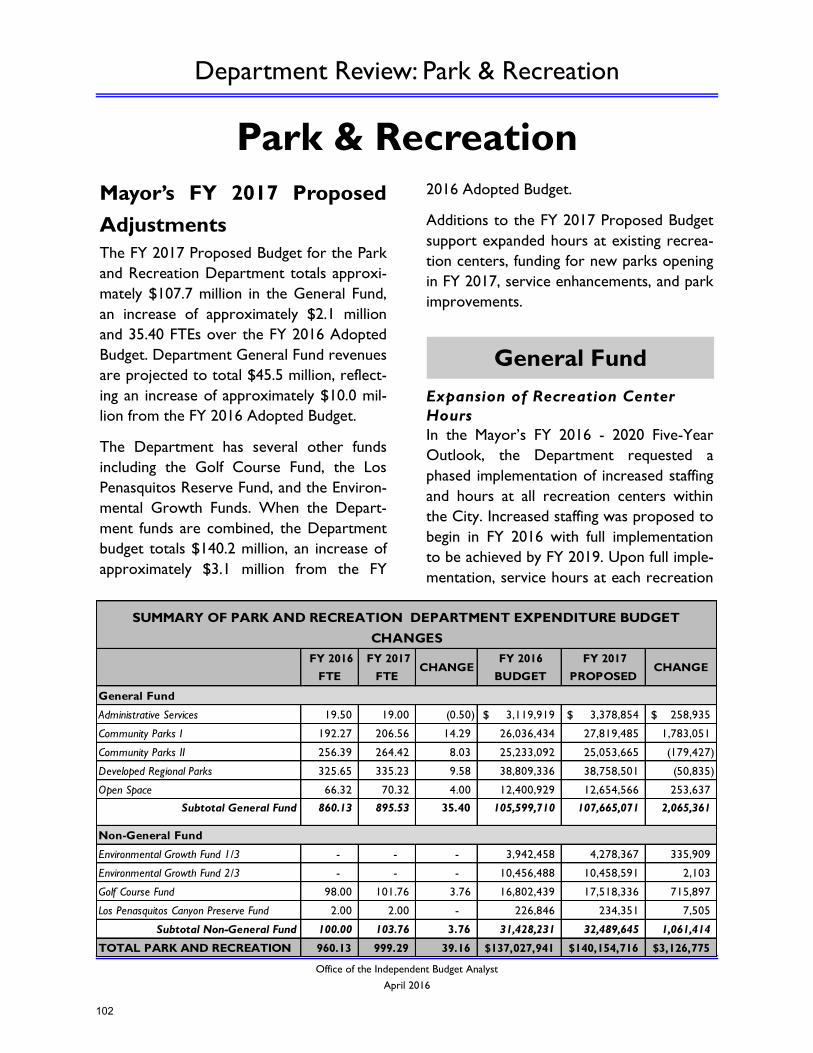
Department Review: Park & Recreation
Office of the Independent Budget Analyst
April 2016
Park & Recreation
Mayor’s FY 2017 Proposed
Adjustments
The FY 2017 Proposed Budget for the Park
and Recreation Department totals approxi-
mately $107.7 million in the General Fund,
an increase of approximately $2.1 million
and 35.40 FTEs over the FY 2016 Adopted
Budget. Department General Fund revenues
are projected to total $45.5 million, reflect-
ing an increase of approximately $10.0 mil-
lion from the FY 2016 Adopted Budget.
The Department has several other funds
including the Golf Course Fund, the Los
Penasquitos Reserve Fund, and the Environ-
mental Growth Funds. When the Depart-
ment funds are combined, the Department
budget totals $140.2 million, an increase of
approximately $3.1 million from the FY
2016 Adopted Budget.
Additions to the FY 2017 Proposed Budget
support expanded hours at existing recrea-
tion centers, funding for new parks opening
in FY 2017, service enhancements, and park
improvements.
Expansion of Recreation Center
Hours
In the Mayor’s FY 2016 - 2020 Five-Year
Outlook, the Department requested a
phased implementation of increased staffing
and hours at all recreation centers within
the City. Increased staffing was proposed to
begin in FY 2016 with full implementation
to be achieved by FY 2019. Upon full imple-
mentation, service hours at each recreation
General Fund
FY 2016
FTE
FY 2017
FTE CHANGE
FY 2016
BUDGET
FY 2017
PROPOSED CHANGE
Administrative Services 19.50 19.00 (0.50) 3,119,919$ 3,378,854$ 258,935$
Community Parks I 192.27 206.56 14.29 26,036,434 27,819,485 1,783,051
Community Parks II 256.39 264.42 8.03 25,233,092 25,053,665 (179,427)
Developed Regional Parks 325.65 335.23 9.58 38,809,336 38,758,501 (50,835)
Open Space 66.32 70.32 4.00 12,400,929 12,654,566 253,637
Subtotal General Fund 860.13 895.53 35.40 105,599,710 107,665,071 2,065,361
Environmental Growth Fund 1/3 - - - 3,942,458 4,278,367 335,909
Environmental Growth Fund 2/3 - - - 10,456,488 10,458,591 2,103
Golf Course Fund 98.00 101.76 3.76 16,802,439 17,518,336 715,897
Los Penasquitos Canyon Preserve Fund 2.00 2.00 - 226,846 234,351 7,505
Subtotal Non-General Fund 100.00 103.76 3.76 31,428,231 32,489,645 1,061,414
TOTAL PARK AND RECREATION 960.13 999.29 39.16 137,027,941$ 140,154,716$ 3,126,775$
SUMMARY OF PARK AND RECREATION DEPARTMENT EXPENDITURE BUDGET
CHANGES
General Fund
Non-General Fund
102
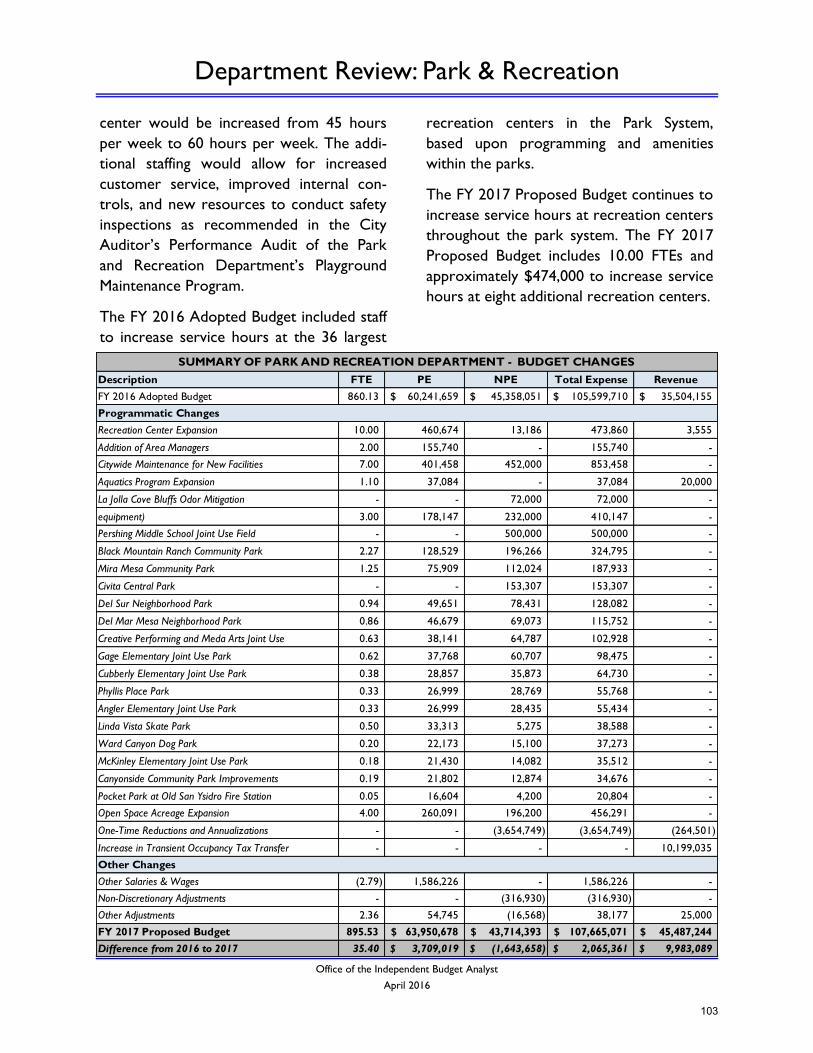
Department Review: Park & Recreation
Office of the Independent Budget Analyst
April 2016
center would be increased from 45 hours
per week to 60 hours per week. The addi-
tional staffing would allow for increased
customer service, improved internal con-
trols, and new resources to conduct safety
inspections as recommended in the City
Auditor’s Performance Audit of the Park
and Recreation Department’s Playground
Maintenance Program.
The FY 2016 Adopted Budget included staff
to increase service hours at the 36 largest
recreation centers in the Park System,
based upon programming and amenities
within the parks.
The FY 2017 Proposed Budget continues to
increase service hours at recreation centers
throughout the park system. The FY 2017
Proposed Budget includes 10.00 FTEs and
approximately $474,000 to increase service
hours at eight additional recreation centers.
Description FTE PE NPE Total Expense Revenue
FY 2016 Adopted Budget 860.13 60,241,659$ 45,358,051$ 105,599,710$ 35,504,155$
Recreation Center Expansion 10.00 460,674 13,186 473,860 3,555
Addition of Area Managers 2.00 155,740 - 155,740 -
Citywide Maintenance for New Facilities 7.00 401,458 452,000 853,458 -
Aquatics Program Expansion 1.10 37,084 - 37,084 20,000
La Jolla Cove Bluffs Odor Mitigation - - 72,000 72,000 - Playground Repairs (Rubberized surfacing and
equipment) 3.00 178,147 232,000 410,147 -
Pershing Middle School Joint Use Field - - 500,000 500,000 -
Black Mountain Ranch Community Park 2.27 128,529 196,266 324,795 -
Mira Mesa Community Park 1.25 75,909 112,024 187,933 -
Civita Central Park - - 153,307 153,307 -
Del Sur Neighborhood Park 0.94 49,651 78,431 128,082 -
Del Mar Mesa Neighborhood Park 0.86 46,679 69,073 115,752 -
Creative Performing and Meda Arts Joint Use 0.63 38,141 64,787 102,928 -
Gage Elementary Joint Use Park 0.62 37,768 60,707 98,475 -
Cubberly Elementary Joint Use Park 0.38 28,857 35,873 64,730 -
Phyllis Place Park 0.33 26,999 28,769 55,768 -
Angler Elementary Joint Use Park 0.33 26,999 28,435 55,434 -
Linda Vista Skate Park 0.50 33,313 5,275 38,588 -
Ward Canyon Dog Park 0.20 22,173 15,100 37,273 -
McKinley Elementary Joint Use Park 0.18 21,430 14,082 35,512 -
Canyonside Community Park Improvements 0.19 21,802 12,874 34,676 -
Pocket Park at Old San Ysidro Fire Station 0.05 16,604 4,200 20,804 -
Open Space Acreage Expansion 4.00 260,091 196,200 456,291 -
One-Time Reductions and Annualizations - - (3,654,749) (3,654,749) (264,501)
Increase in Transient Occupancy Tax Transfer - - - - 10,199,035
Other Salaries & Wages (2.79) 1,586,226 - 1,586,226 -
Non-Discretionary Adjustments - - (316,930) (316,930) -
Other Adjustments 2.36 54,745 (16,568) 38,177 25,000
FY 2017 Proposed Budget 895.53 63,950,678$ 43,714,393$ 107,665,071$ 45,487,244$
Difference from 2016 to 2017 35.40 3,709,019$ (1,643,658)$ 2,065,361$ 9,983,089$
SUMMARY OF PARK AND RECREATION DEPARTMENT - BUDGET CHANGES
Programmatic Changes
Other Changes
103
Department Review: Park & Recreation
Office of the Independent Budget Analyst
April 2016
The recreation centers include:
With the additional staffing included in the
FY 2017 Proposed Budget, 44 of the Park
System’s 58 recreation and visitor centers
will operate 60 hours per week. The re-
maining recreation center will operate at 45
hours per week. Per the Mayor’s FY 2017 -
2021 Five-Year Outlook, implementation of
the increased hours at all 58 centers is an-
ticipated to be completed by FY 2019.
New Parks and Enhanced Facilities
The FY 2017 Proposed Budget includes 8.73
FTEs and approximately $1.5 million in ex-
penses to operate and provide maintenance
to 15 new parks throughout the City. These
parks include 5 parks made available to the
public via joint use agreements with schools,
and 10 new parks including a dog park and
skate park. The new parks include:
Citywide Maintenance for New Fa-
cilities
The FY 2017 Proposed Budget includes 7.00
FTEs and approximately $853,000 in ex-
penses (of which $420,000 are one-time
costs) to add additional mowing and special-
ty maintenance staff to primarily address
needs generated by the new parks. These
positions will support the new parks
citywide.
Area Managers
Due to the additional parks opening and
extended service hours for several recrea-
tion centers, the Department requested
additional staffing to ensure the appropriate
management structure is continued. The FY
2017 Proposed Budget includes two Area
Manager positions and approximately
$156,000 in expenses to provide appropri-
ate levels of supervision.
Expansion of Aquatic Programs
The FY 2017 Proposed Budget includes 1.10
FTEs and approximately $37,000 to accom-
modate an increase in programming (swim
tournament/meets) at several pools includ-
ing the expanded Memorial Pool. The aquat-
ic programs are projected to generate ap-
proximately $20,000 in revenue to offset
expenses.
Addition of Open Space Rangers
The FY 2017 Proposed Budget includes 4.00
FTEs (including 2.00 Park Ranger positions)
and approximately $456,000 in expenses
($136,000 one-time costs) for management
of additional open space acreage anticipated
to be acquired by the City throughout the
year.
The Department has established a goal ratio
Silver Wing
Southcrest
Adams
La Jolla
Skyline
Pacific Beach
San Carlos
Lopez Ridge
Creative Performing
and Media Arts Joint
Use Agreement (JU)
Gage Elementary JU
Cubberly Elementary JU
Angler Elementary JU
McKinley Elementary JU
Black Mountain Ranch
Community Park
Pocket Park at Old SY
Fire Station
Del Sur Neighborhood
Park
Mira Mesa Com-
munity Park
Del Mar Mesa
Neighborhood
Park
Phyllis Place Park
Linda Vista Skate
Park
Ward Canyon
Park
Canyonside Com-
munity Park
Civita Central
Park
104
Department Review: Park & Recreation
Office of the Independent Budget Analyst
April 2016
of approximately 650 acres of park land to
one park ranger. Currently, the City has a
ratio of one park ranger for every 1,143
acres of park land. With the addition of
park rangers in the FY 2017 Proposed
Budget, the Department projects the ratio
to fall to 1,050 acres of park land to one
ranger, moving slightly closer to the De-
partment goal.
Playground Repairs (Rubberized Sur-
facing and Equipment Repairs)
The FY 2017 Proposed Budget includes 3.00
FTEs and approximately $410,000 in ex-
penses to repair/replace rubberized surfac-
ing and playground equipment. Planned rub-
berized surface projects for FY 2017 include
the Naval Training Center Park, Ward Can-
yon Neighborhood Park, Teralta Park,
Ocean View Hills Park, and the Nobel Ath-
letic Area. Replacement of playground
equipment will be based upon routine in-
spections and identified need.
Pershing Middle School Joint Use
Field
Per the Joint Use Agreement with the San
Diego Unified School District, the City is
responsible for the replacement of the arti-
ficial turf an the Pershing Joint Use facility.
The FY 2017 Proposed Budget includes
$500,000 for the first phase of the turf re-
placement. Per the Mayor’s FY 2017 - 2021
Five-Year Outlook, the second phase of this
project is to occur in FY 2018 with an esti-
mated cost of approximately $671,000.
Other Budget Adjustments
The FY 2017 Proposed Budget also includes
the following adjustments:
An addition of $72,000 to increase ef-
forts to mitigate odors from animal
waste at the La Jolla Cove bluffs. The
increased funding will allow for the
treatment of the bluffs to be increased
from once per month to three times
per month.
A reduction of approximately $3.7 mil-
lion in expenses due to the removal of
one-time additions in the FY 2016
Adopted Budget and annualization of
expenses. The primary component of
the reductions is the removal of a $2.0
million allocation for minor park capital
improvements in FY 2016.
An increase of approximately $10.2 mil-
lion in revenue due to an increase in
TOT transfers.
Issues to Consider
Park Condition Assessments
The FY 2017 Proposed Budget includes
$300,000 in funding to continue park condi-
tion assessments. The Department antici-
pates 30 to 50 park assessments to be com-
pleted on an annual basis depending upon
the complexity of the assessment and amen-
ities of the parks. However, the Depart-
ment has undertaken assessing Balboa Park
in its current work schedule, which will sig-
nificantly reduce the number of other parks
assessed in FY 2016. The Department antic-
ipates the Balboa Park assessment to be
completed by the end of Fiscal Year 2016. It
should be noted that the park condition as-
sessment is for park amenities such as play-
grounds, paved surfaces, fences, turf, etc.
The scope of this assessment does not in-
clude city-owned or leased buildings in Bal-
boa Park such as museums or art galleries.
These facilities are to be addressed through
condition assessments conducted by the
105

Department Review: Park & Recreation
Office of the Independent Budget Analyst
April 2016
Public Works Department which will be
completed by late Calendar Year 2016.
Information from the completed park as-
sessments will support the development of
the Parks Master Plan (PMP) being initiated
by the Planning Department in FY 2017.
The Planning Department anticipates the
PMP to be a three-year work project. Fund-
ing for the PMP has been included in the
Planning Department’s FY 2017 Proposed
Budget and is carried forward through FY
2019 in the Mayor’s FY 2017 - 2021 Five-
Year Outlook.
Expansion of Pool System Service
Hours
Several Councilmembers’ FY 2017 budget
priority memoranda suggested expanding
the pool system service hours. The FY 2017
Proposed Budget does not include addition-
al funding to expand pool service hours be-
yond the current operation schedules.
According to the Department, service
hours vary across the pool locations based
on demand for services, attendance, and
community input. Service hours for the
City’s pools range from 41 hours per week
to 76 hours per week during the summer,
and 21 hours per week to 60 hours per
week during the off-season.
Per the Department, additional operating
hours for the permanent pool system
would require community outreach, evalua-
tion of potential demand, and consideration
of the pool guard ratio as to the need for
additional staffing.
Service expansion of the City’s three porta-
ble/temporary pools would require consid-
eration of additional factors such as trans-
portation of the pools, the time necessary
to set up and dismantle the pools, and po-
tential duration of operation.
As these evaluations have not been under-
taken by the Department, the Department
has not requested additional resources to
support expanding the pool system service
hours.
The Environmental Growth Funds (EGFs)
are projected to receive approximately
$16.5 million in franchise fees from San Die-
go Gas & Electric, representing one-quarter
of the total SDG&E franchise fees received
by the City, in accordance with Charter
Section 103.1a. This revenue projection is
an increase of approximately $324,000 over
FY 2016. Additional information related to
the franchise fees can be found in the Fran-
chise Fee portion of the “General Fund
Revenues” Overview Section in our Report.
The EGFs are allocated into a one-third and
two-thirds portion, to reflect Charter pro-
visions that up to two-thirds of revenues
can be pledged for bonds for acquisition,
improvement and maintenance of park or
recreational open space.
In FY 2009, the Environmental Growth 2/3
Fund retired the 1994 San Diego Open
Space Facilities District No. 1 General Obli-
gation Bonds. To the extent funds exist
over and above the requirements for debt
service, the Charter provides that they may
be used for other purposes so long as it
preserves and enhances the environment
and is approved by the City Council. Since
Environmental Growth
Funds
106
Department Review: Park & Recreation
Office of the Independent Budget Analyst
April 2016
the time the bonds have been repaid in
FY 2009, available revenues have been uti-
lized to reimburse the General Fund for
eligible park and open space maintenance
activities.
The FY 2017 Proposed Budget for the EGFs
includes funding to reimburse the General
Fund for park expenses, and provides sup-
port for Regional Park and Open Space
Maintenance. Additional funds are budgeted
for reimbursement to Maintenance Assess-
ment Districts and for transfer to the Los
Penasquitos Canyon Preserve Fund.
The Golf Course Fund maintains the three
City golf courses operated by the City: Mis-
sion Bay, Balboa Park, and Torrey Pines
(future site of the 2021 U.S. Open Champi-
onship).
The FY 2017 Proposed Budget for the Golf
Course Fund totals $17.5 million, repre-
senting an increase of approximately
$715,000 over the FY 2016 Adopted Budg-
et. Department revenues are anticipated to
increase by approximately $490,000 to
$18.8 million from $18.3 million in FY 2016
due to additional support for the opera-
tions of the Balboa Golf Course pro shop
and Mission Bay Course improvements.
Significant Budget Adjustments
The FY 2017 Proposed Budget includes the
following significant budget adjustments:
An addition of 0.50 FTE and approxi-
mately $233,000 in expenses to support
the operations of the Balboa Golf
Course pro shop. The additional sup-
port is anticipated to generate approxi-
mately $490,000 in additional revenue
to offset costs.
An increase of approximately $1.6 mil-
lion in revenue related to the delay in
the Torrey Pines North Golf Course
renovations. The project and closure of
the North Course was anticipated to
occur in FY 2016; however the project
has been delayed until FY 2017.
A reduction in revenue of approximate-
ly $1.6 million due to a three-month
closure of the Torrey Pines North
Course due to scheduled course reno-
vations.
Golf Course Fund
107
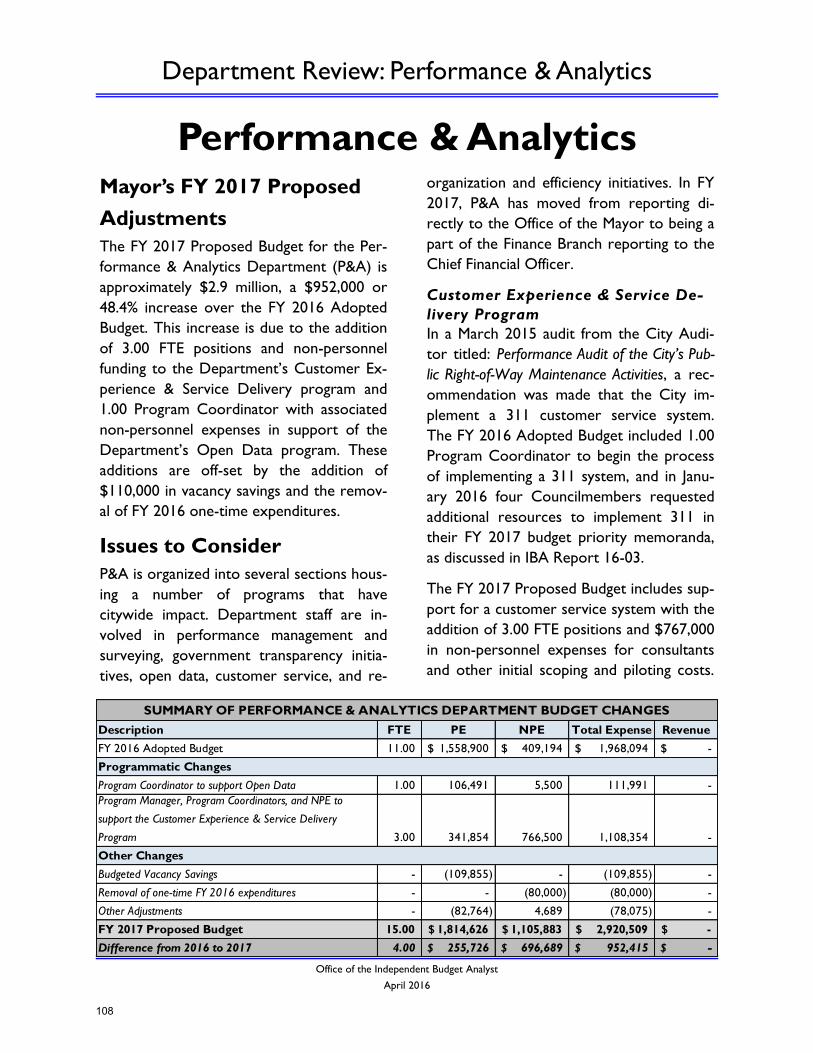
Department Review: Performance & Analytics
Office of the Independent Budget Analyst
April 2016
Performance & Analytics
Mayor’s FY 2017 Proposed
Adjustments
The FY 2017 Proposed Budget for the Per-
formance & Analytics Department (P&A) is
approximately $2.9 million, a $952,000 or
48.4% increase over the FY 2016 Adopted
Budget. This increase is due to the addition
of 3.00 FTE positions and non-personnel
funding to the Department’s Customer Ex-
perience & Service Delivery program and
1.00 Program Coordinator with associated
non-personnel expenses in support of the
Department’s Open Data program. These
additions are off-set by the addition of
$110,000 in vacancy savings and the remov-
al of FY 2016 one-time expenditures.
Issues to Consider
P&A is organized into several sections hous-
ing a number of programs that have
citywide impact. Department staff are in-
volved in performance management and
surveying, government transparency initia-
tives, open data, customer service, and re-
organization and efficiency initiatives. In FY
2017, P&A has moved from reporting di-
rectly to the Office of the Mayor to being a
part of the Finance Branch reporting to the
Chief Financial Officer.
Customer Experience & Service De-
livery Program
In a March 2015 audit from the City Audi-
tor titled: Performance Audit of the City’s Pub-
lic Right-of-Way Maintenance Activities, a rec-
ommendation was made that the City im-
plement a 311 customer service system.
The FY 2016 Adopted Budget included 1.00
Program Coordinator to begin the process
of implementing a 311 system, and in Janu-
ary 2016 four Councilmembers requested
additional resources to implement 311 in
their FY 2017 budget priority memoranda,
as discussed in IBA Report 16-03.
The FY 2017 Proposed Budget includes sup-
port for a customer service system with the
addition of 3.00 FTE positions and $767,000
in non-personnel expenses for consultants
and other initial scoping and piloting costs.
Description FTE PE NPE Total Expense Revenue
FY 2016 Adopted Budget 11.00 1,558,900$ 409,194$ 1,968,094$ -$
Program Coordinator to support Open Data 1.00 106,491 5,500 111,991 -
Program Manager, Program Coordinators, and NPE to
support the Customer Experience & Service Delivery
Program 3.00 341,854 766,500 1,108,354 -
Budgeted Vacancy Savings - (109,855) - (109,855) -
Removal of one-time FY 2016 expenditures - - (80,000) (80,000) -
Other Adjustments - (82,764) 4,689 (78,075) -
FY 2017 Proposed Budget 15.00 1,814,626$ 1,105,883$ 2,920,509$ -$
Difference from 2016 to 2017 4.00 255,726$ 696,689$ 952,415$ -$
SUMMARY OF PERFORMANCE & ANALYTICS DEPARTMENT BUDGET CHANGES
Programmatic Changes
Other Changes
108
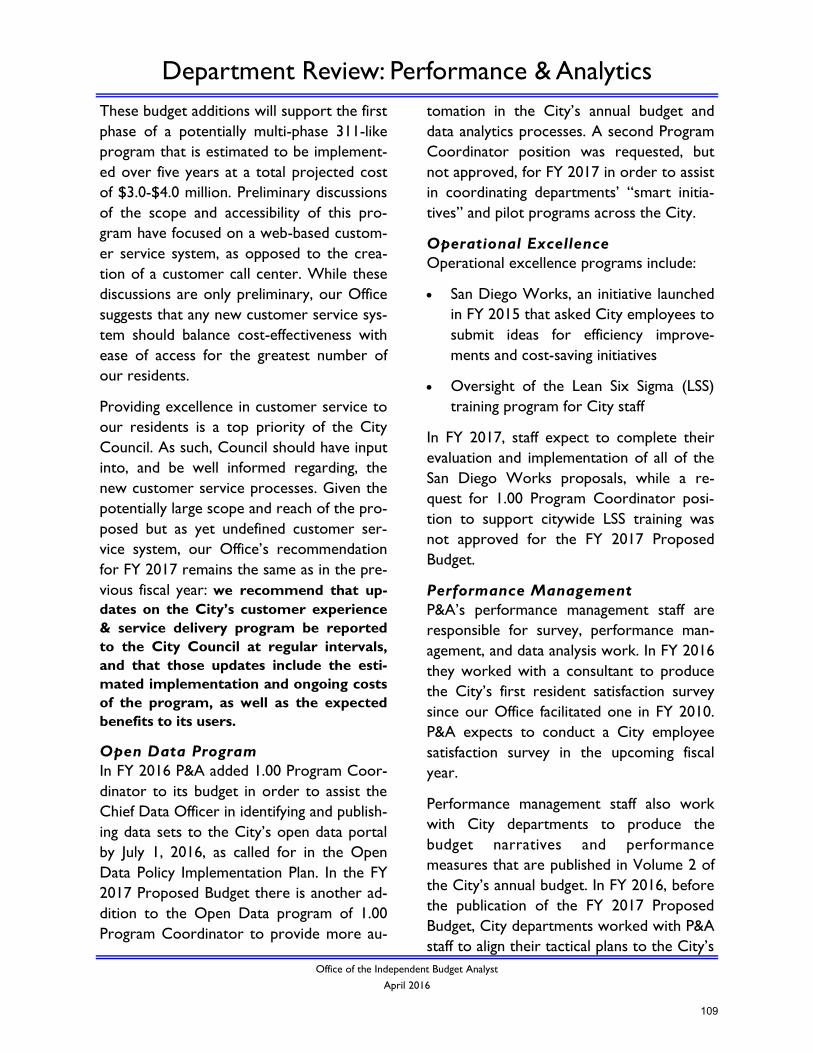
Department Review: Performance & Analytics
Office of the Independent Budget Analyst
April 2016
These budget additions will support the first
phase of a potentially multi-phase 311-like
program that is estimated to be implement-
ed over five years at a total projected cost
of $3.0-$4.0 million. Preliminary discussions
of the scope and accessibility of this pro-
gram have focused on a web-based custom-
er service system, as opposed to the crea-
tion of a customer call center. While these
discussions are only preliminary, our Office
suggests that any new customer service sys-
tem should balance cost-effectiveness with
ease of access for the greatest number of
our residents.
Providing excellence in customer service to
our residents is a top priority of the City
Council. As such, Council should have input
into, and be well informed regarding, the
new customer service processes. Given the
potentially large scope and reach of the pro-
posed but as yet undefined customer ser-
vice system, our Office’s recommendation
for FY 2017 remains the same as in the pre-
vious fiscal year: we recommend that up-
dates on the City’s customer experience
& service delivery program be reported
to the City Council at regular intervals,
and that those updates include the esti-
mated implementation and ongoing costs
of the program, as well as the expected
benefits to its users.
Open Data Program
In FY 2016 P&A added 1.00 Program Coor-
dinator to its budget in order to assist the
Chief Data Officer in identifying and publish-
ing data sets to the City’s open data portal
by July 1, 2016, as called for in the Open
Data Policy Implementation Plan. In the FY
2017 Proposed Budget there is another ad-
dition to the Open Data program of 1.00
Program Coordinator to provide more au-
tomation in the City’s annual budget and
data analytics processes. A second Program
Coordinator position was requested, but
not approved, for FY 2017 in order to assist
in coordinating departments’ “smart initia-
tives” and pilot programs across the City.
Operational Excellence
Operational excellence programs include:
San Diego Works, an initiative launched
in FY 2015 that asked City employees to
submit ideas for efficiency improve-
ments and cost-saving initiatives
Oversight of the Lean Six Sigma (LSS)
training program for City staff
In FY 2017, staff expect to complete their
evaluation and implementation of all of the
San Diego Works proposals, while a re-
quest for 1.00 Program Coordinator posi-
tion to support citywide LSS training was
not approved for the FY 2017 Proposed
Budget.
Performance Management
P&A’s performance management staff are
responsible for survey, performance man-
agement, and data analysis work. In FY 2016
they worked with a consultant to produce
the City’s first resident satisfaction survey
since our Office facilitated one in FY 2010.
P&A expects to conduct a City employee
satisfaction survey in the upcoming fiscal
year.
Performance management staff also work
with City departments to produce the
budget narratives and performance
measures that are published in Volume 2 of
the City’s annual budget. In FY 2016, before
the publication of the FY 2017 Proposed
Budget, City departments worked with P&A
staff to align their tactical plans to the City’s
109
Department Review: Performance & Analytics
Office of the Independent Budget Analyst
April 2016
strategic plan that had been updated in FY
2015. A discussion of the resulting new
measures is included in the “High Level Re-
view of the Mayor’s FY 2017 Proposed
Budget” section of this report.
Our Office notes that both P&A and the
Department of IT’s ERP Division are in the
preliminary stages of dashboard projects
that may provide, either to the public or to
City staff, some of the performance data
that had been reported prior to the FY
2017 Proposed Budget. In discussing the
two dashboard projects with the respective
departments, our Office has learned that
the ERP Division dashboard will most likely
draw primarily from SAP data and be for
“internal” use as opposed to P&A’s more
“external-facing” dashboard project.
Finally, our Office notes that P&A had un-
successfully requested 1.00 Program Coor-
dinator position in FY 2017 to implement an
umbrella, performance data gathering and
reporting program for the City as well as to
oversee the City’s internal and external sur-
vey efforts. As one or multiple City dash-
board projects move forward (with or
without the addition of new FTE posi-
tions), our Office recommends that the
City Council receive project updates as
well as review metrics for, and request
access to, dashboard data in all projects,
in order to better facilitate legislative de-
cision-making and increase government
transparency.
110
Department Review: Personnel
Office of the Independent Budget Analyst
April 2017
Personnel
Mayor’s FY 2017 Proposed
Adjustments
The FY 2017 Proposed Budget for the De-
partment of Personnel totals approximately
$7.9 million, an increase of $475,000 from
the $7.4 million in the FY 2016 Adopted
Budget.
The number of Personnel positions de-
creased by 2.99 FTEs, from 67.99 in the FY
2016 Budget to 65.00 in the FY 2017 Pro-
posed Budget. The 2.99 FTE decrease was
an erroneous removal of non-standard
hourly personnel, bringing hourly employ-
ees in the Personnel Department to zero.
These hourly FTEs are anticipated to be re-
instated in the May Revision to the Budget.
NPE additions to the Personnel budget in-
clude a $25,000 increase for a new web in-
terface with NEOGOV, which will allow for
test scores to be updated automatically in
NEOGOV—removing a manual data entry
process. This interface includes unlimited
licenses and will also allow remote access,
which will facilitate new testing locations.
Issues to Consider
FY 2017 Unfunded Requests
During the FY 2017 budget process, Per-
sonnel requested two additional positions
and NPEs items that were not funded:
1.00 Word Processing Operator
(WPO) to assist an existing WPO in
supporting the Civil Service Commis-
sion’s increased workload that has oc-
curred with expanded hiring activity,
(especially as relates to candidates’ ap-
peals for medical/background disqualifi-
cations). The requested WPO would
also be responsible for notifications to
departments regarding the results of
position classification studies, as well as
provide back-up assistance for reception
desk and accounts payable functions.
1.00 Test Administration Specialist to
assist in promulgation of eligible lists,
fingerprinting of new hires, responding
to public inquiries, reviewing and enter-
Description FTE PE NPE Total Expense Revenue
FY 2016 Adopted Budget 67.99 6,504,959$ 929,177$ 7,434,136$ 1,000$
Salaries and Wages - 125,938 - 125,938 -
Hourly Wages (2.99) (98,575) - (98,575) -
Fringe Benefits - 402,094 - 402,094 -
New Web Interface with NEOGOV - - 25,000 25,000 -
Non-Discretionary Items (Including Info Technology) - - 40,972 40,972 -
Net Other Adjustments - - (20,080) (20,080) -
FY 2017 Proposed Budget 65.00 6,934,416$ 975,069$ 7,909,485$ 1,000$
Difference from 2016 to 2017 (2.99) 429,457$ 45,892$ 475,349$ -$
SUMMARY OF PERSONNEL BUDGET CHANGES
111
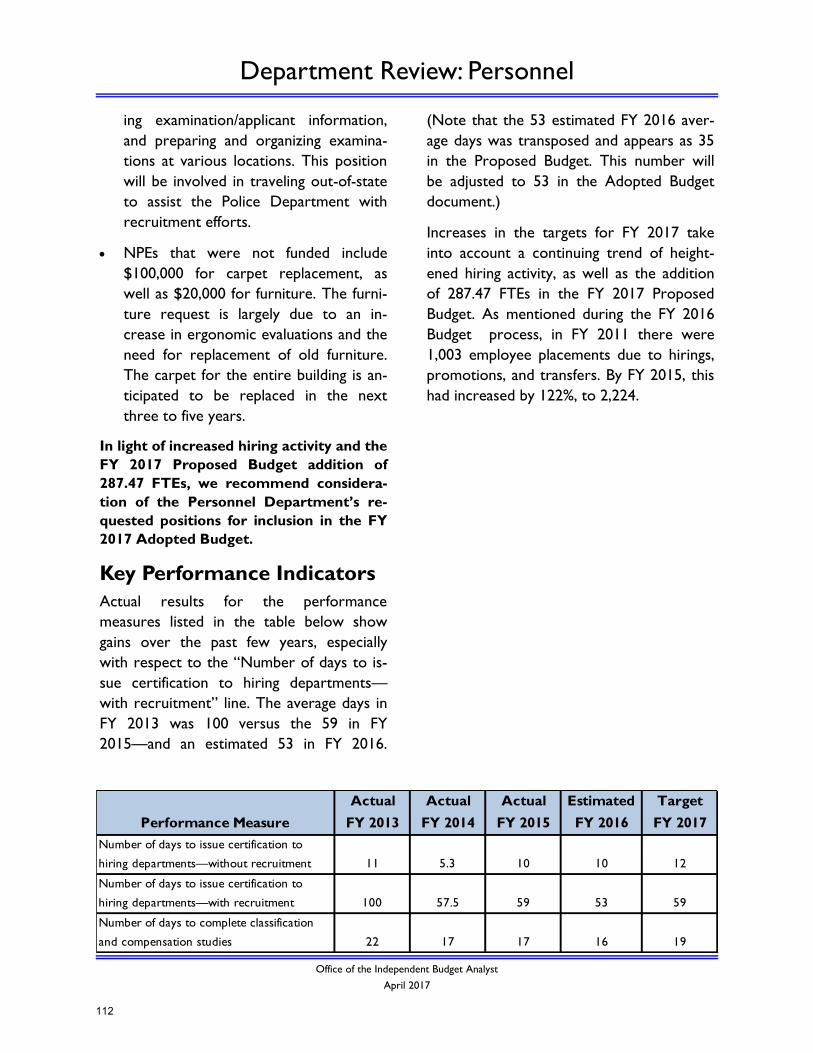
Department Review: Personnel
Office of the Independent Budget Analyst
April 2017
ing examination/applicant information,
and preparing and organizing examina-
tions at various locations. This position
will be involved in traveling out-of-state
to assist the Police Department with
recruitment efforts.
NPEs that were not funded include
$100,000 for carpet replacement, as
well as $20,000 for furniture. The furni-
ture request is largely due to an in-
crease in ergonomic evaluations and the
need for replacement of old furniture.
The carpet for the entire building is an-
ticipated to be replaced in the next
three to five years.
In light of increased hiring activity and the
FY 2017 Proposed Budget addition of
287.47 FTEs, we recommend considera-
tion of the Personnel Department’s re-
quested positions for inclusion in the FY
2017 Adopted Budget.
Key Performance Indicators
Actual results for the performance
measures listed in the table below show
gains over the past few years, especially
with respect to the “Number of days to is-
sue certification to hiring departments—
with recruitment” line. The average days in
FY 2013 was 100 versus the 59 in FY
2015—and an estimated 53 in FY 2016.
(Note that the 53 estimated FY 2016 aver-
age days was transposed and appears as 35
in the Proposed Budget. This number will
be adjusted to 53 in the Adopted Budget
document.)
Increases in the targets for FY 2017 take
into account a continuing trend of height-
ened hiring activity, as well as the addition
of 287.47 FTEs in the FY 2017 Proposed
Budget. As mentioned during the FY 2016
Budget process, in FY 2011 there were
1,003 employee placements due to hirings,
promotions, and transfers. By FY 2015, this
had increased by 122%, to 2,224.
Performance Measure
Actual
FY 2013
Actual
FY 2014
Actual
FY 2015
Estimated
FY 2016
Target
FY 2017
Number of days to issue certification to
hiring departments—without recruitment 11 5.3 10 10 12
Number of days to issue certification to
hiring departments—with recruitment 100 57.5 59 53 59
Number of days to complete classification
and compensation studies 22 17 17 16 19
112
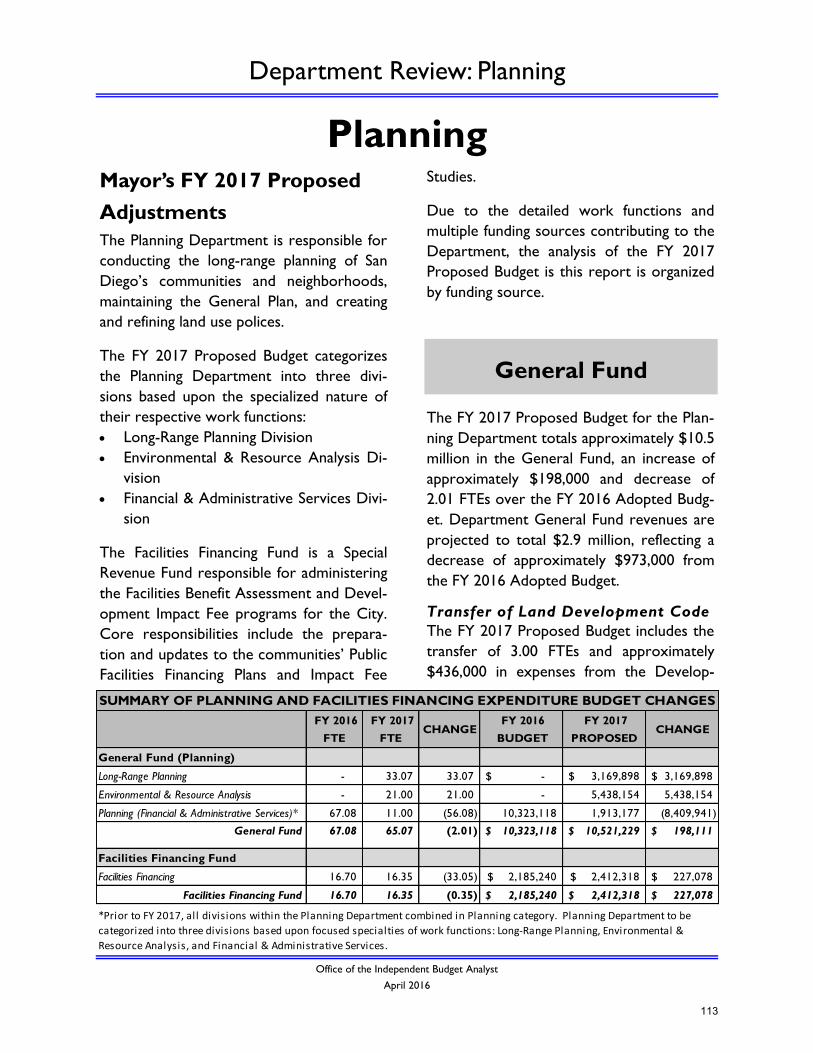
Department Review: Planning
Office of the Independent Budget Analyst
April 2016
Planning Mayor’s FY 2017 Proposed
Adjustments
The Planning Department is responsible for
conducting the long-range planning of San
Diego’s communities and neighborhoods,
maintaining the General Plan, and creating
and refining land use polices.
The FY 2017 Proposed Budget categorizes
the Planning Department into three divi-
sions based upon the specialized nature of
their respective work functions:
Long-Range Planning Division
Environmental & Resource Analysis Di-
vision
Financial & Administrative Services Divi-
sion
The Facilities Financing Fund is a Special
Revenue Fund responsible for administering
the Facilities Benefit Assessment and Devel-
opment Impact Fee programs for the City.
Core responsibilities include the prepara-
tion and updates to the communities’ Public
Facilities Financing Plans and Impact Fee
Studies.
Due to the detailed work functions and
multiple funding sources contributing to the
Department, the analysis of the FY 2017
Proposed Budget is this report is organized
by funding source.
The FY 2017 Proposed Budget for the Plan-
ning Department totals approximately $10.5
million in the General Fund, an increase of
approximately $198,000 and decrease of
2.01 FTEs over the FY 2016 Adopted Budg-
et. Department General Fund revenues are
projected to total $2.9 million, reflecting a
decrease of approximately $973,000 from
the FY 2016 Adopted Budget.
Transfer of Land Development Code
The FY 2017 Proposed Budget includes the
transfer of 3.00 FTEs and approximately
$436,000 in expenses from the Develop-
General Fund
FY 2016
FTE
FY 2017
FTE CHANGE
FY 2016
BUDGET
FY 2017
PROPOSED CHANGE
General Fund (Planning)
Long-Range Planning - 33.07 33.07 -$ 3,169,898$ 3,169,898$
Environmental & Resource Analysis - 21.00 21.00 - 5,438,154 5,438,154
Planning (Financial & Administrative Services)* 67.08 11.00 (56.08) 10,323,118 1,913,177 (8,409,941)
General Fund 67.08 65.07 (2.01) 10,323,118$ 10,521,229$ 198,111$
Facilities Financing Fund
Facilities Financing 16.70 16.35 (33.05) 2,185,240$ 2,412,318$ 227,078$
Facilities Financing Fund 16.70 16.35 (0.35) 2,185,240$ 2,412,318$ 227,078$
SUMMARY OF PLANNING AND FACILITIES FINANCING EXPENDITURE BUDGET CHANGES
*Prior to FY 2017, all divisions within the Planning Department combined in Planning category. Planning Department to be
categorized into three divisions based upon focused specialties of work functions: Long-Range Planning, Environmental &
Resource Analysis, and Financial & Administrative Services.
113
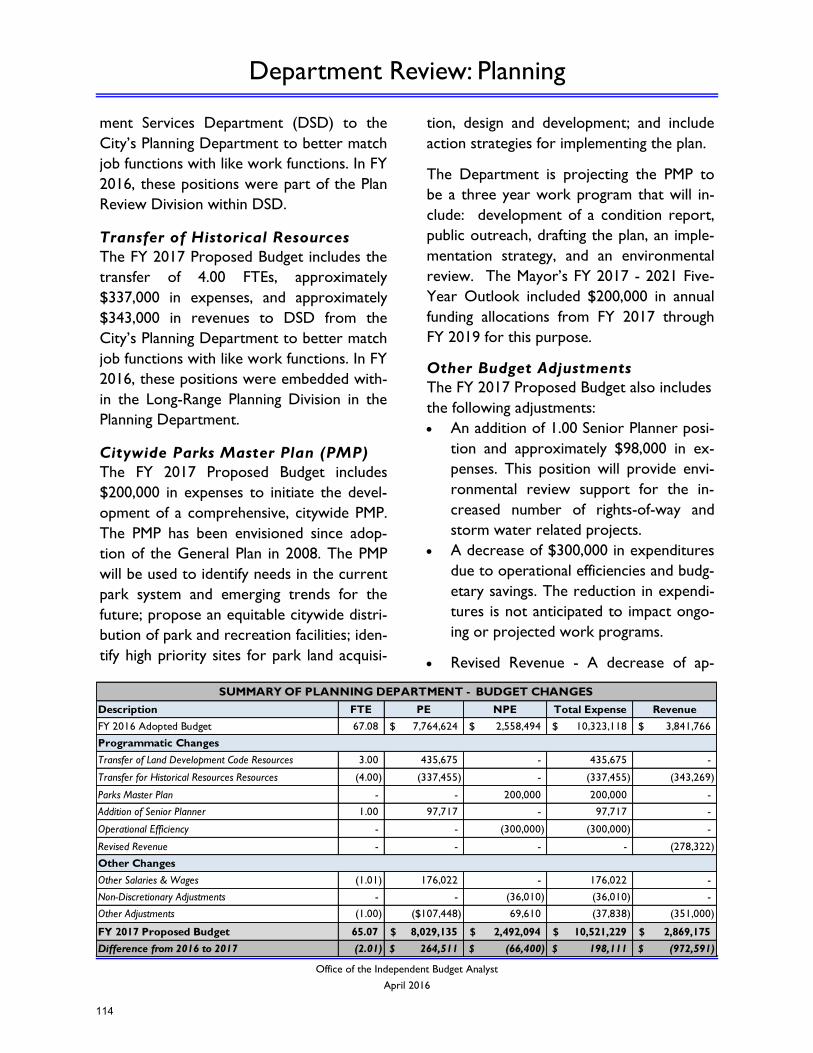
Department Review: Planning
Office of the Independent Budget Analyst
April 2016
ment Services Department (DSD) to the
City’s Planning Department to better match
job functions with like work functions. In FY
2016, these positions were part of the Plan
Review Division within DSD.
Transfer of Historical Resources
The FY 2017 Proposed Budget includes the
transfer of 4.00 FTEs, approximately
$337,000 in expenses, and approximately
$343,000 in revenues to DSD from the
City’s Planning Department to better match
job functions with like work functions. In FY
2016, these positions were embedded with-
in the Long-Range Planning Division in the
Planning Department.
Citywide Parks Master Plan (PMP)
The FY 2017 Proposed Budget includes
$200,000 in expenses to initiate the devel-
opment of a comprehensive, citywide PMP.
The PMP has been envisioned since adop-
tion of the General Plan in 2008. The PMP
will be used to identify needs in the current
park system and emerging trends for the
future; propose an equitable citywide distri-
bution of park and recreation facilities; iden-
tify high priority sites for park land acquisi-
tion, design and development; and include
action strategies for implementing the plan.
The Department is projecting the PMP to
be a three year work program that will in-
clude: development of a condition report,
public outreach, drafting the plan, an imple-
mentation strategy, and an environmental
review. The Mayor’s FY 2017 - 2021 Five-
Year Outlook included $200,000 in annual
funding allocations from FY 2017 through
FY 2019 for this purpose.
Other Budget Adjustments
The FY 2017 Proposed Budget also includes
the following adjustments:
An addition of 1.00 Senior Planner posi-
tion and approximately $98,000 in ex-
penses. This position will provide envi-
ronmental review support for the in-
creased number of rights-of-way and
storm water related projects.
A decrease of $300,000 in expenditures
due to operational efficiencies and budg-
etary savings. The reduction in expendi-
tures is not anticipated to impact ongo-
ing or projected work programs.
Revised Revenue - A decrease of ap-
Description FTE PE NPE Total Expense Revenue
FY 2016 Adopted Budget 67.08 7,764,624$ 2,558,494$ 10,323,118$ 3,841,766$
Transfer of Land Development Code Resources 3.00 435,675 - 435,675 -
Transfer for Historical Resources Resources (4.00) (337,455) - (337,455) (343,269)
Parks Master Plan - - 200,000 200,000 -
Addition of Senior Planner 1.00 97,717 - 97,717 -
Operational Efficiency - - (300,000) (300,000) -
Revised Revenue - - - - (278,322)
Other Salaries & Wages (1.01) 176,022 - 176,022 -
Non-Discretionary Adjustments - - (36,010) (36,010) -
Other Adjustments (1.00) ($107,448) 69,610 (37,838) (351,000)
FY 2017 Proposed Budget 65.07 8,029,135$ 2,492,094$ 10,521,229$ 2,869,175$
Difference from 2016 to 2017 (2.01) 264,511$ (66,400)$ 198,111$ (972,591)$
SUMMARY OF PLANNING DEPARTMENT - BUDGET CHANGES
Programmatic Changes
Other Changes
114
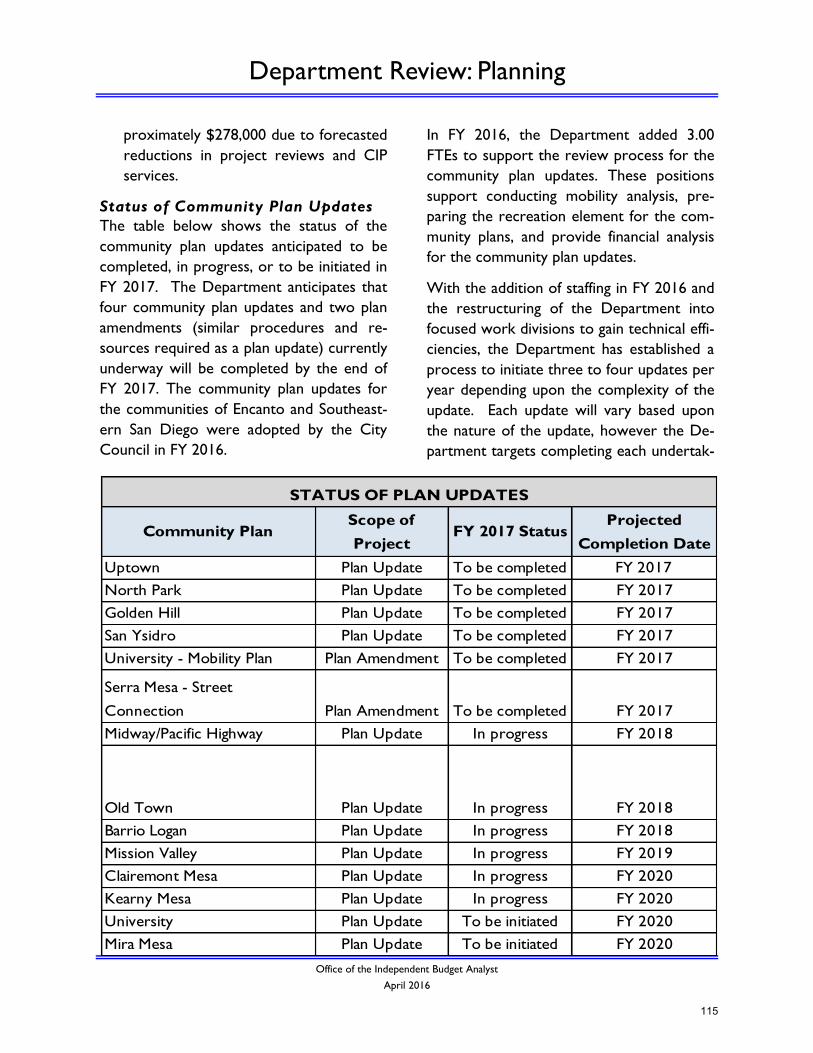
Department Review: Planning
Office of the Independent Budget Analyst
April 2016
proximately $278,000 due to forecasted
reductions in project reviews and CIP
services.
Status of Community Plan Updates
The table below shows the status of the
community plan updates anticipated to be
completed, in progress, or to be initiated in
FY 2017. The Department anticipates that
four community plan updates and two plan
amendments (similar procedures and re-
sources required as a plan update) currently
underway will be completed by the end of
FY 2017. The community plan updates for
the communities of Encanto and Southeast-
ern San Diego were adopted by the City
Council in FY 2016.
In FY 2016, the Department added 3.00
FTEs to support the review process for the
community plan updates. These positions
support conducting mobility analysis, pre-
paring the recreation element for the com-
munity plans, and provide financial analysis
for the community plan updates.
With the addition of staffing in FY 2016 and
the restructuring of the Department into
focused work divisions to gain technical effi-
ciencies, the Department has established a
process to initiate three to four updates per
year depending upon the complexity of the
update. Each update will vary based upon
the nature of the update, however the De-
partment targets completing each undertak-
Community PlanScope of
ProjectFY 2017 Status
Projected
Completion Date
Uptown Plan Update To be completed FY 2017
North Park Plan Update To be completed FY 2017
Golden Hill Plan Update To be completed FY 2017
San Ysidro Plan Update To be completed FY 2017
University - Mobility Plan Plan Amendment To be completed FY 2017
Serra Mesa - Street
Connection Plan Amendment To be completed FY 2017
Midway/Pacific Highway Plan Update In progress FY 2018
Old Town Plan Update In progress FY 2018
Barrio Logan Plan Update In progress FY 2018
Mission Valley Plan Update In progress FY 2019
Clairemont Mesa Plan Update In progress FY 2020
Kearny Mesa Plan Update In progress FY 2020
University Plan Update To be initiated FY 2020
Mira Mesa Plan Update To be initiated FY 2020
STATUS OF PLAN UPDATES
115
Department Review: Planning
Office of the Independent Budget Analyst
April 2016
en update within three years.
Based upon discussion with staff, the De-
partment has the capacity to maintain these
efforts. As such, no additional resources
were requested in the FY 2017 Proposed
Budget to support the community plan up-
dates. Per the Department, in order to in-
crease the number of updates undertaken
each year, a holistic growth within the De-
partment would be required as the updates
require input from multiple technical pro-
fessionals.
Issues to Consider Implementation of the Climate Ac-
tion Plan (CAP)
The Climate Action Plan is an involved plan
which will impact multiple City departments
(directly or indirectly), including the Plan-
ning Department. For the Department, the
FY 2017 Proposed Budget does not include
any additional funding over the FY 2016
Adopted budget for programs that will di-
rectly support the CAP.
The FY 2017 Proposed Budget does include
funding for programs that will support the
goals of the CAP indirectly. An example is
the proposed $200,000 allocation for the
initiation of the Parks Master Plan. The
Parks Master Plan will develop a strategy for
future development of parks including ad-
dressing the potential of expanding the tree
canopy.
There are multiple programs currently
funded in the FY 2016 Adopted Budget and
continued in FY 2017 which directly sup-
port the CAP. Examples include the devel-
opment of the Urban Forest Management
Plan (draft plan available on the City’s Plan-
ning Department website) and community
plan updates.
The Urban Forest Management Plan (funded
via a CalFire planning grant) outlines the
objectives and actions needed to sustain,
protect, and enhance community trees in
the City. This plan directly supports the Cli-
mate Resiliency strategy within the CAP.
Continuing work on community plan up-
dates includes the review, evaluation, and
potential growth in alternative transporta-
tion methods such as bicycling, walking, or
transit. This work directly supports the Bi-
cycling, Walking, Transit & Land Use strate-
gy within the CAP.
The FY 2017 Proposed Budget totals ap-
proximately $2.4 million for the Facilities
Financing Fund, an increase of approximate-
ly $227,000 and a slight decrease of 0.35
FTEs over the FY 2016 Adopted Budget.
As Facilities Financing is a Special Revenue
Fund, budgeted revenue will mirror budget-
ed expenses. Budgeted revenue totals ap-
proximately $2.4 million, an increase of ap-
proximately $227,000 over the FY 2016
Adopted Budget due to projected increase
review activity.
Staff charges its time for its reviews of
building permit applications and by assessing
fees. In negotiating reimbursement agree-
ments with developers, the applicant is re-
quired to open a deposit account that staff
can charge against while preparing the
Facilities Financing
116
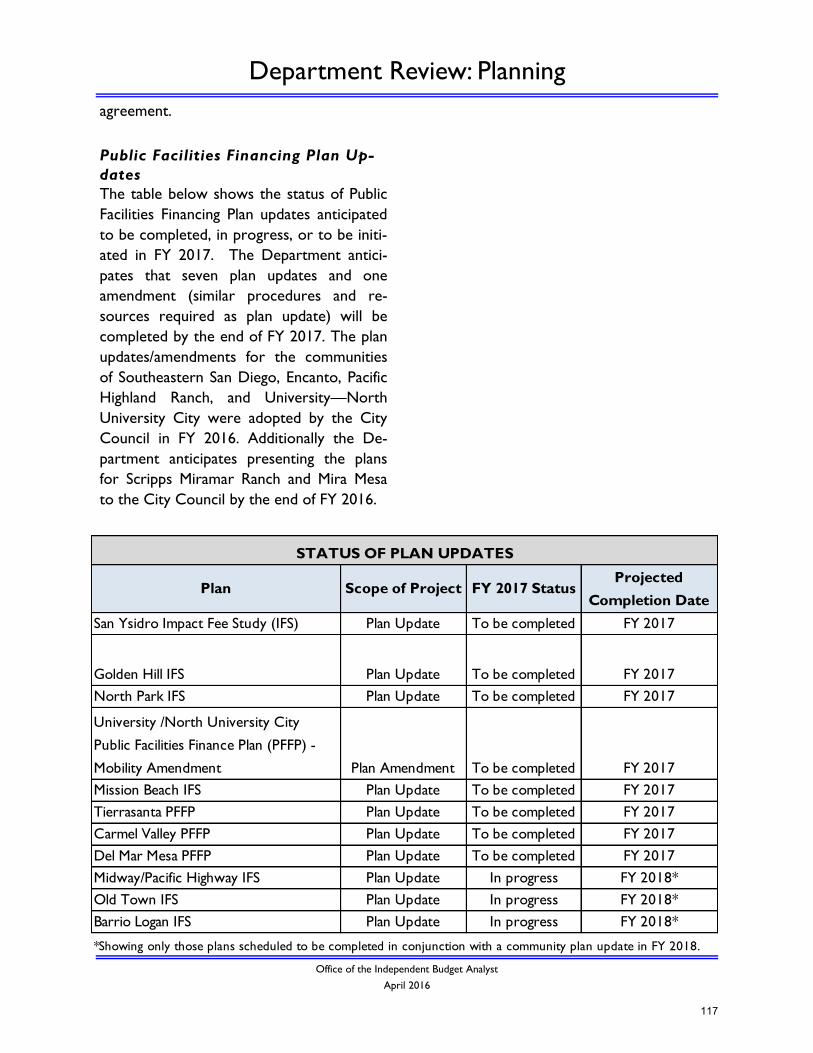
Department Review: Planning
Office of the Independent Budget Analyst
April 2016
agreement.
Public Facilities Financing Plan Up-
dates
The table below shows the status of Public
Facilities Financing Plan updates anticipated
to be completed, in progress, or to be initi-
ated in FY 2017. The Department antici-
pates that seven plan updates and one
amendment (similar procedures and re-
sources required as plan update) will be
completed by the end of FY 2017. The plan
updates/amendments for the communities
of Southeastern San Diego, Encanto, Pacific
Highland Ranch, and University—North
University City were adopted by the City
Council in FY 2016. Additionally the De-
partment anticipates presenting the plans
for Scripps Miramar Ranch and Mira Mesa
to the City Council by the end of FY 2016.
Plan Scope of Project FY 2017 StatusProjected
Completion Date
San Ysidro Impact Fee Study (IFS) Plan Update To be completed FY 2017
Golden Hill IFS Plan Update To be completed FY 2017
North Park IFS Plan Update To be completed FY 2017
University /North University City
Public Facilities Finance Plan (PFFP) -
Mobility Amendment Plan Amendment To be completed FY 2017
Mission Beach IFS Plan Update To be completed FY 2017
Tierrasanta PFFP Plan Update To be completed FY 2017
Carmel Valley PFFP Plan Update To be completed FY 2017
Del Mar Mesa PFFP Plan Update To be completed FY 2017
Midway/Pacific Highway IFS Plan Update In progress FY 2018*
Old Town IFS Plan Update In progress FY 2018*
Barrio Logan IFS Plan Update In progress FY 2018*
*Showing only those plans scheduled to be completed in conjunction with a community plan update in FY 2018.
STATUS OF PLAN UPDATES
117
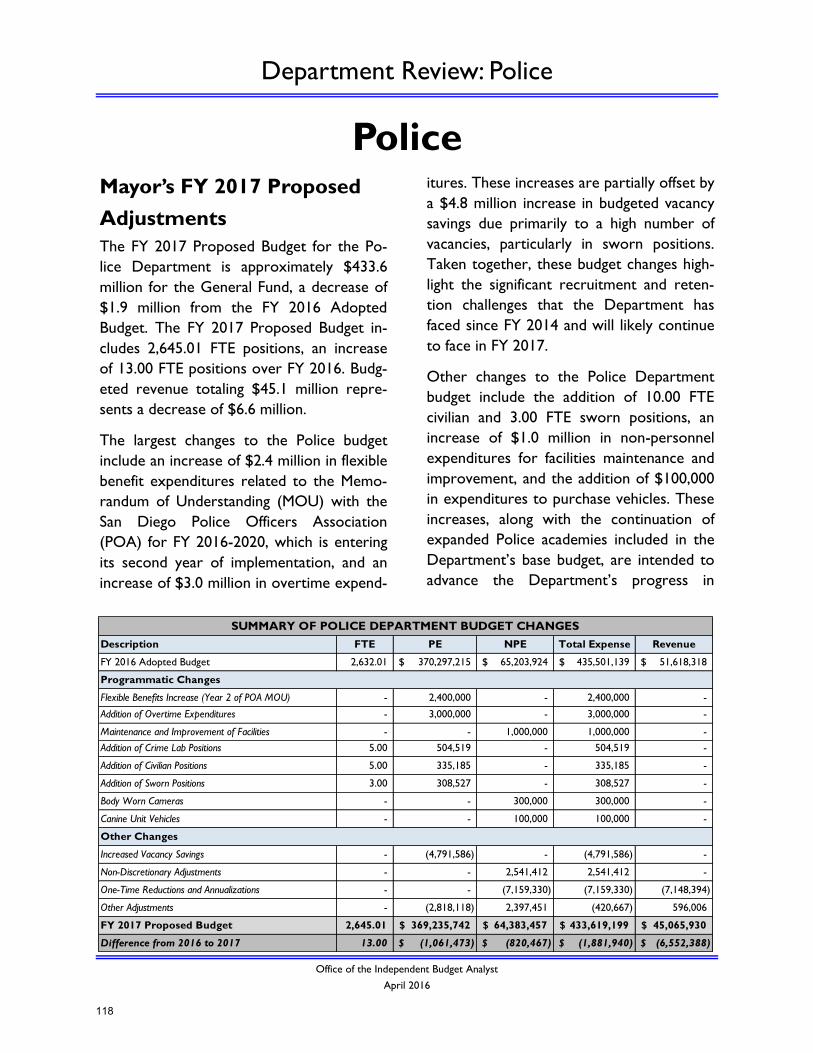
Department Review: Police
Office of the Independent Budget Analyst
April 2016
Police
Mayor’s FY 2017 Proposed
Adjustments
The FY 2017 Proposed Budget for the Po-
lice Department is approximately $433.6
million for the General Fund, a decrease of
$1.9 million from the FY 2016 Adopted
Budget. The FY 2017 Proposed Budget in-
cludes 2,645.01 FTE positions, an increase
of 13.00 FTE positions over FY 2016. Budg-
eted revenue totaling $45.1 million repre-
sents a decrease of $6.6 million.
The largest changes to the Police budget
include an increase of $2.4 million in flexible
benefit expenditures related to the Memo-
randum of Understanding (MOU) with the
San Diego Police Officers Association
(POA) for FY 2016-2020, which is entering
its second year of implementation, and an
increase of $3.0 million in overtime expend-
itures. These increases are partially offset by
a $4.8 million increase in budgeted vacancy
savings due primarily to a high number of
vacancies, particularly in sworn positions.
Taken together, these budget changes high-
light the significant recruitment and reten-
tion challenges that the Department has
faced since FY 2014 and will likely continue
to face in FY 2017.
Other changes to the Police Department
budget include the addition of 10.00 FTE
civilian and 3.00 FTE sworn positions, an
increase of $1.0 million in non-personnel
expenditures for facilities maintenance and
improvement, and the addition of $100,000
in expenditures to purchase vehicles. These
increases, along with the continuation of
expanded Police academies included in the
Department’s base budget, are intended to
advance the Department’s progress in
Description FTE PE NPE Total Expense Revenue
FY 2016 Adopted Budget 2,632.01 370,297,215$ 65,203,924$ 435,501,139$ 51,618,318$
Flexible Benefits Increase (Year 2 of POA MOU) - 2,400,000 - 2,400,000 -
Addition of Overtime Expenditures - 3,000,000 - 3,000,000 -
Maintenance and Improvement of Facilities - - 1,000,000 1,000,000 -
Addition of Crime Lab Positions 5.00 504,519 - 504,519 -
Addition of Civilian Positions 5.00 335,185 - 335,185 -
Addition of Sworn Positions 3.00 308,527 - 308,527 -
Body Worn Cameras - - 300,000 300,000 -
Canine Unit Vehicles - - 100,000 100,000 -
Increased Vacancy Savings - (4,791,586) - (4,791,586) -
Non-Discretionary Adjustments - - 2,541,412 2,541,412 -
One-Time Reductions and Annualizations - - (7,159,330) (7,159,330) (7,148,394)
Other Adjustments - (2,818,118) 2,397,451 (420,667) 596,006
FY 2017 Proposed Budget 2,645.01 369,235,742$ 64,383,457$ 433,619,199$ 45,065,930$
Difference from 2016 to 2017 13.00 (1,061,473)$ (820,467)$ (1,881,940)$ (6,552,388)$
SUMMARY OF POLICE DEPARTMENT BUDGET CHANGES
Programmatic Changes
Other Changes
118
Department Review: Police
Office of the Independent Budget Analyst
April 2016
meeting the needs identified in its Five-Year
Plan, which was most recently updated and
approved by the City Council in November
2013.
Additions
Flexible Benefits Increase (Year 2 of
Police Officers Association MOU)
The FY 2017 Proposed Budget includes
$2.4 million in increased expenditures for
flexible benefits pursuant to the POA MOU
for FY 2016-2020. The benefit increase is
non-pensionable, as are all MOU-related
compensation increases through FY 2018. It
is important to note that the FY 2017 flexi-
ble benefit increase is available only to po-
lice officers with eight or more years of ser-
vice. Several other compensation and bene-
fit increases that were funded in FY 2016,
such as the restoration of holiday premium
pay, are continued in the FY 2017 Proposed
Budget as part of the Department’s base
budget and therefore are not called out as
significant budget adjustments.
The intent of the POA MOU was to en-
hance the Police Department’s recruitment
and retention efforts in order to mitigate
the effects of recent above-normal attrition
and to support the staffing goals outlined in
the Police Department Five-Year Plan. Af-
ter close to one year of being in effect,
however, the MOU has not significantly re-
duced sworn officer attrition. Officers con-
tinue to leave the Department at a rate of
13 departures per month in FY 2016, the
same as FY 2015. Police recruitment and
retention challenges are further discussed
later in this Department Review in the
“Issues to Consider” Section.
Addition of Overtime Expenditures
An additional $3.0 million in overtime ex-
penditures is included in the FY 2017 Pro-
posed Budget to support an increase in ex-
tension-of-shift overtime and to better align
budgeted overtime with historical expendi-
ture levels. The Police Department has indi-
cated that its expanded use of this type of
overtime is due to increased neighborhood
policing efforts, increased training that in-
cludes more experienced officers working
alongside new officers, backfilling to meet
recommended staffing levels, and calls taking
longer to resolve.
The Office of the IBA has, in several re-
ports, recommended that the Police De-
partment’s overtime budget be right-sized
by increasing expenditures up-front during
the annual budget process rather than dur-
ing the Mid-Year or Year-End Budget Ad-
justments. In our review of the Mayor’s FY
2017-2021 Five-Year Financial Outlook, we
noted that the Department would likely ex-
pend an additional $3.0 to $5.0 million an-
nually over the next five years on overtime
based on our review of past expenditures as
well as the Department’s recent focus on
extension-of-shift activities. The FY 2017
Proposed Budget’s $3.0 million increase to
Police Department overtime is a positive
step toward right-sizing the Department’s
personnel expenditures.
It is important to note, however, that the
FY 2016 Mid-Year Budget Monitoring Re-
port projected that the Police Department
would exceed budgeted overtime expendi-
tures by $6.0 million. Of that amount, $4.0
million was attributed to extension-of-shift
overtime, $1.4 million to grant and task
force related overtime, and $600,000 to
119
Department Review: Police
Office of the Independent Budget Analyst
April 2016
unbudgeted AB 109 overtime. Assuming
that extension-of-shift overtime may fluctu-
ate in FY 2017, the addition of $3.0 million
for this purpose in FY 2017 is reasonable.
While our office continues to recommend-
ed that task force and grant related over-
time expenditures also be budgeted, those
specific uses of overtime are less of a con-
cern as they are largely reimbursable.
Nonetheless, Mid-Year and Year-End Budg-
et Adjustments may be needed in the future
if these costs continue and are not budget-
ed. As in past years, continued monitoring
of Police overtime expenditures is im-
portant.
Addition of Civilian Positions
The FY 2017 Proposed Budget includes the
addition of 5.00 FTE civilian positions and
$335,000 in associated personnel expendi-
tures to support Police Department opera-
tions, particularly within the Communica-
tions Division. The added positions include
3.00 Police Investigative Service Officers
(PISOs), 1.00 Police Dispatcher, and 1.00
Associate Management Analyst.
The Department has indicated it intends to
use several of the added positions to ad-
dress staffing concerns within the Commu-
nications Division, with a special focus on
dispatch operations. In addition to the new
Dispatcher position, two of the new PISOs
will replace two Dispatchers currently per-
forming 9-1-1 call research so that they may
focus solely on dispatch work. The third
PISO position will be assigned to the field.
With the addition of 3.00 PISOs, the De-
partment will have a total of 24.00 PISO
positions. The Associate Management Ana-
lyst will serve as the Department’s Califor-
nia Public Records Act liaison, replacing a
Police Officer 2 who is currently performing
that function and will be freed-up to return
to patrol work.
Seven Councilmembers expressed support
for the addition of civilian positions in the
Police Department in their FY 2017 budget
priority memoranda, including prioritizing
dispatcher positions and PISOs. A discus-
sion of issues related to dispatcher staffing
is included later in the “Issues to Consider”
section of this Department Review.
Addition of Crime Lab Positions
The FY 2017 Proposed Budget adds 5.00
FTE civilian positions and $505,000 in asso-
ciated personnel expenditures to support
the Crime Lab Unit. The positions are cur-
rently filled and are not new to the Police
Department, as they have been carried as
supplemental positions historically. The Pro-
posed Budget adds these existing positions
to the General Fund. The positions are
funded through the California DNA Data-
bank Program (Prop 69) and the state Re-
mote Access Network (RAN) Board.
Addition of Sworn Positions
The FY 2017 Proposed Budget includes the
addition of 3.00 FTE sworn positions and
$309,000 in associated personnel expendi-
tures to support the Police Department’s
operations. Although the Police Depart-
ment is currently experiencing high sworn
vacancies, the Department has indicated
that the additional positions will help to
gradually increase sworn staffing levels to
meet the long-term goals outlined in its Five
-Year Plan.
120
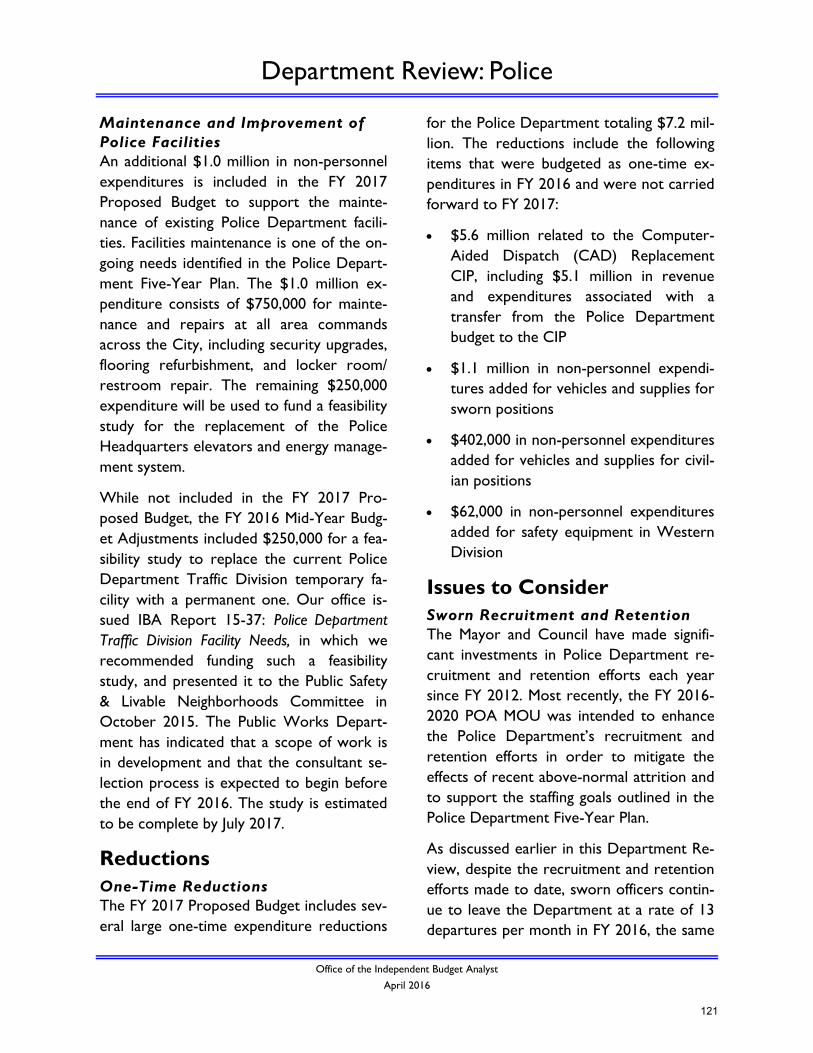
Department Review: Police
Office of the Independent Budget Analyst
April 2016
Maintenance and Improvement of
Police Facilities
An additional $1.0 million in non-personnel
expenditures is included in the FY 2017
Proposed Budget to support the mainte-
nance of existing Police Department facili-
ties. Facilities maintenance is one of the on-
going needs identified in the Police Depart-
ment Five-Year Plan. The $1.0 million ex-
penditure consists of $750,000 for mainte-
nance and repairs at all area commands
across the City, including security upgrades,
flooring refurbishment, and locker room/
restroom repair. The remaining $250,000
expenditure will be used to fund a feasibility
study for the replacement of the Police
Headquarters elevators and energy manage-
ment system.
While not included in the FY 2017 Pro-
posed Budget, the FY 2016 Mid-Year Budg-
et Adjustments included $250,000 for a fea-
sibility study to replace the current Police
Department Traffic Division temporary fa-
cility with a permanent one. Our office is-
sued IBA Report 15-37: Police Department
Traffic Division Facility Needs, in which we
recommended funding such a feasibility
study, and presented it to the Public Safety
& Livable Neighborhoods Committee in
October 2015. The Public Works Depart-
ment has indicated that a scope of work is
in development and that the consultant se-
lection process is expected to begin before
the end of FY 2016. The study is estimated
to be complete by July 2017.
Reductions
One-Time Reductions
The FY 2017 Proposed Budget includes sev-
eral large one-time expenditure reductions
for the Police Department totaling $7.2 mil-
lion. The reductions include the following
items that were budgeted as one-time ex-
penditures in FY 2016 and were not carried
forward to FY 2017:
$5.6 million related to the Computer-
Aided Dispatch (CAD) Replacement
CIP, including $5.1 million in revenue
and expenditures associated with a
transfer from the Police Department
budget to the CIP
$1.1 million in non-personnel expendi-
tures added for vehicles and supplies for
sworn positions
$402,000 in non-personnel expenditures
added for vehicles and supplies for civil-
ian positions
$62,000 in non-personnel expenditures
added for safety equipment in Western
Division
Issues to Consider
Sworn Recruitment and Retention
The Mayor and Council have made signifi-
cant investments in Police Department re-
cruitment and retention efforts each year
since FY 2012. Most recently, the FY 2016-
2020 POA MOU was intended to enhance
the Police Department’s recruitment and
retention efforts in order to mitigate the
effects of recent above-normal attrition and
to support the staffing goals outlined in the
Police Department Five-Year Plan.
As discussed earlier in this Department Re-
view, despite the recruitment and retention
efforts made to date, sworn officers contin-
ue to leave the Department at a rate of 13
departures per month in FY 2016, the same
121
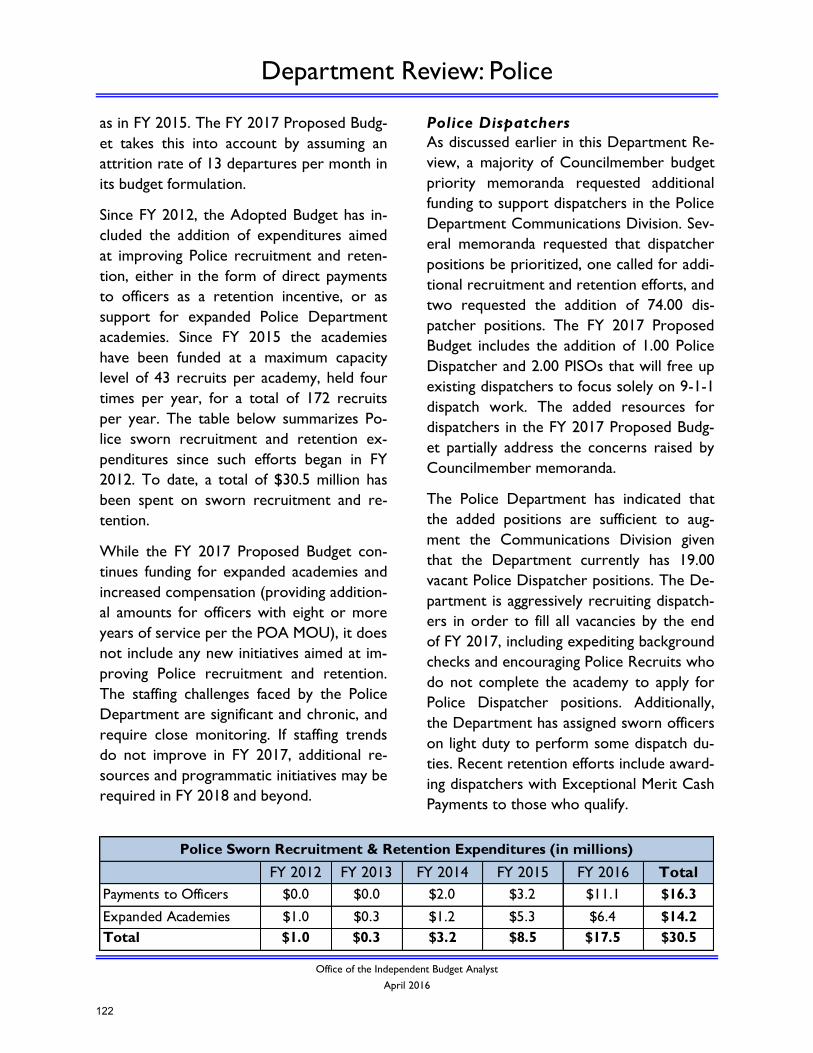
Department Review: Police
Office of the Independent Budget Analyst
April 2016
as in FY 2015. The FY 2017 Proposed Budg-
et takes this into account by assuming an
attrition rate of 13 departures per month in
its budget formulation.
Since FY 2012, the Adopted Budget has in-
cluded the addition of expenditures aimed
at improving Police recruitment and reten-
tion, either in the form of direct payments
to officers as a retention incentive, or as
support for expanded Police Department
academies. Since FY 2015 the academies
have been funded at a maximum capacity
level of 43 recruits per academy, held four
times per year, for a total of 172 recruits
per year. The table below summarizes Po-
lice sworn recruitment and retention ex-
penditures since such efforts began in FY
2012. To date, a total of $30.5 million has
been spent on sworn recruitment and re-
tention.
While the FY 2017 Proposed Budget con-
tinues funding for expanded academies and
increased compensation (providing addition-
al amounts for officers with eight or more
years of service per the POA MOU), it does
not include any new initiatives aimed at im-
proving Police recruitment and retention.
The staffing challenges faced by the Police
Department are significant and chronic, and
require close monitoring. If staffing trends
do not improve in FY 2017, additional re-
sources and programmatic initiatives may be
required in FY 2018 and beyond.
Police Dispatchers
As discussed earlier in this Department Re-
view, a majority of Councilmember budget
priority memoranda requested additional
funding to support dispatchers in the Police
Department Communications Division. Sev-
eral memoranda requested that dispatcher
positions be prioritized, one called for addi-
tional recruitment and retention efforts, and
two requested the addition of 74.00 dis-
patcher positions. The FY 2017 Proposed
Budget includes the addition of 1.00 Police
Dispatcher and 2.00 PISOs that will free up
existing dispatchers to focus solely on 9-1-1
dispatch work. The added resources for
dispatchers in the FY 2017 Proposed Budg-
et partially address the concerns raised by
Councilmember memoranda.
The Police Department has indicated that
the added positions are sufficient to aug-
ment the Communications Division given
that the Department currently has 19.00
vacant Police Dispatcher positions. The De-
partment is aggressively recruiting dispatch-
ers in order to fill all vacancies by the end
of FY 2017, including expediting background
checks and encouraging Police Recruits who
do not complete the academy to apply for
Police Dispatcher positions. Additionally,
the Department has assigned sworn officers
on light duty to perform some dispatch du-
ties. Recent retention efforts include award-
ing dispatchers with Exceptional Merit Cash
Payments to those who qualify.
FY 2012 FY 2013 FY 2014 FY 2015 FY 2016 Total
Payments to Officers $0.0 $0.0 $2.0 $3.2 $11.1 $16.3
Expanded Academies $1.0 $0.3 $1.2 $5.3 $6.4 $14.2
Total $1.0 $0.3 $3.2 $8.5 $17.5 $30.5
Police Sworn Recruitment & Retention Expenditures (in millions)
122
Department Review: Police
Office of the Independent Budget Analyst
April 2016
Due to the critical public safety function
that dispatchers perform and the high level
of Council interest in increasing staffing lev-
els in the Communications Division, the
Council may wish to request regular up-
dates from the Police Department on pro-
gress made on dispatcher staffing in FY
2017.
Police Department Five-Year Plan
The Police Department Five-Year Plan out-
lines the Department’s funding needs
through FY 2018 in an effort to restore de-
partment sworn and civilian staffing, as well
as resources for equipment and vehicles, to
levels achieved before past budget reduc-
tions after FY 2009. A comparison of the
Police Department Five-Year Plan identified
needs for FY 2017 and the corresponding
resources included in the FY 2017 Pro-
posed Budget is included below. The De-
partment has indicated that it will provide
an update to the Five-Year Plan in May
2016.
Community Policing
Several Councilmembers requested funding
for increased community policing efforts,
including identifying additional Community
Relations Officers (CROs), in their budget
priority memoranda. While the FY 2017
Proposed Budget does not specifically ad-
dress this concern, the Police Department
has indicated that it has made significant in-
vestments in community policing with exist-
ing staffing. The Department has begun
summarizing those efforts in new Quarterly
Community Policing Reports as of FY 2015,
which are available on the Department’s
website.
With regard to CROs, the Department
notes that the number of CROs has in-
creased from 10 to 20 in FY 2016 utilizing
existing staffing. CROs are not a separate
classification in the Department but are ex-
isting Police Officer 2 positions that are as-
signed community relations duties by the
Chief. Therefore, there is no budgetary im-
pact related to increasing the number of
CROs within the Police Department. The
number of Police Officer 2 positions as-
signed to work as CROs is based on an op-
erational decision by the Department.
Identified Needs Status in FY 2017 Proposed Budget
Addition of 35.00 Sworn Positions Included - Budget funds continued expanded academies using existing vacant
positions and adds 3.00 FTE sworn positions.
Addition of 24.00 Civilian Positions Partially included - Budget adds 13.00 FTE civilian sworn positions.
New Recruit Equipment Included - Budget includes non-personnel expenditures for this purpose.
New Police Vehicles Included - Budget includes $100,000 in expenditures for two vehicles to support
the Canine Unit.
Restoration of ABLE and Canine Hours Not included.
Replace Outdated Equipment Not included.
CAD Replacement Project Included in FY 2016 Adopted Budget.
Maintenance of Existing Facilities Included - Budget includes $1.0 million to support maintenance of Police facilities.
Police Department Five-Year Plan Identified Needs for FY 2017
123
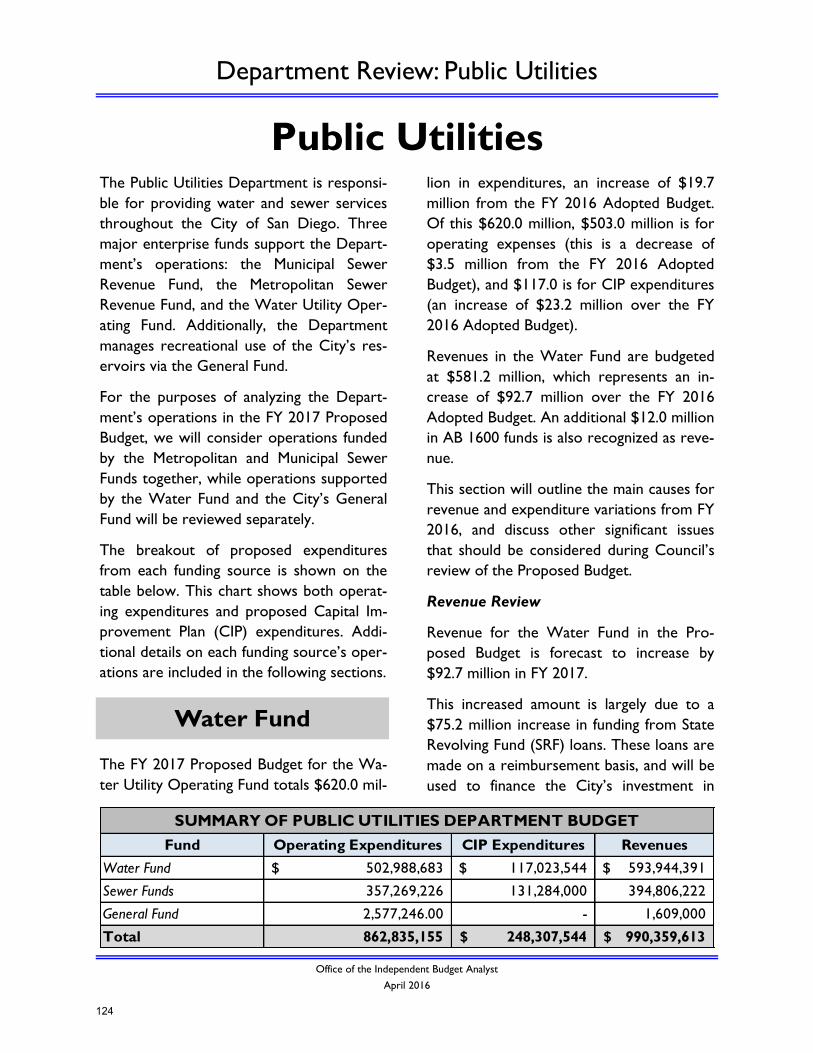
Department Review: Public Utilities
Office of the Independent Budget Analyst
April 2016
Public Utilities The Public Utilities Department is responsi-
ble for providing water and sewer services
throughout the City of San Diego. Three
major enterprise funds support the Depart-
ment’s operations: the Municipal Sewer
Revenue Fund, the Metropolitan Sewer
Revenue Fund, and the Water Utility Oper-
ating Fund. Additionally, the Department
manages recreational use of the City’s res-
ervoirs via the General Fund.
For the purposes of analyzing the Depart-
ment’s operations in the FY 2017 Proposed
Budget, we will consider operations funded
by the Metropolitan and Municipal Sewer
Funds together, while operations supported
by the Water Fund and the City’s General
Fund will be reviewed separately.
The breakout of proposed expenditures
from each funding source is shown on the
table below. This chart shows both operat-
ing expenditures and proposed Capital Im-
provement Plan (CIP) expenditures. Addi-
tional details on each funding source’s oper-
ations are included in the following sections.
The FY 2017 Proposed Budget for the Wa-
ter Utility Operating Fund totals $620.0 mil-
lion in expenditures, an increase of $19.7
million from the FY 2016 Adopted Budget.
Of this $620.0 million, $503.0 million is for
operating expenses (this is a decrease of
$3.5 million from the FY 2016 Adopted
Budget), and $117.0 is for CIP expenditures
(an increase of $23.2 million over the FY
2016 Adopted Budget).
Revenues in the Water Fund are budgeted
at $581.2 million, which represents an in-
crease of $92.7 million over the FY 2016
Adopted Budget. An additional $12.0 million
in AB 1600 funds is also recognized as reve-
nue.
This section will outline the main causes for
revenue and expenditure variations from FY
2016, and discuss other significant issues
that should be considered during Council’s
review of the Proposed Budget.
Revenue Review
Revenue for the Water Fund in the Pro-
posed Budget is forecast to increase by
$92.7 million in FY 2017.
This increased amount is largely due to a
$75.2 million increase in funding from State
Revolving Fund (SRF) loans. These loans are
made on a reimbursement basis, and will be
used to finance the City’s investment in
Water Fund
Fund Operating Expenditures CIP Expenditures Revenues
Water Fund 502,988,683$ 117,023,544$ 593,944,391$
Sewer Funds 357,269,226 131,284,000 394,806,222
General Fund 2,577,246.00 - 1,609,000
Total 862,835,155 248,307,544$ 990,359,613$
SUMMARY OF PUBLIC UTILITIES DEPARTMENT BUDGET
124
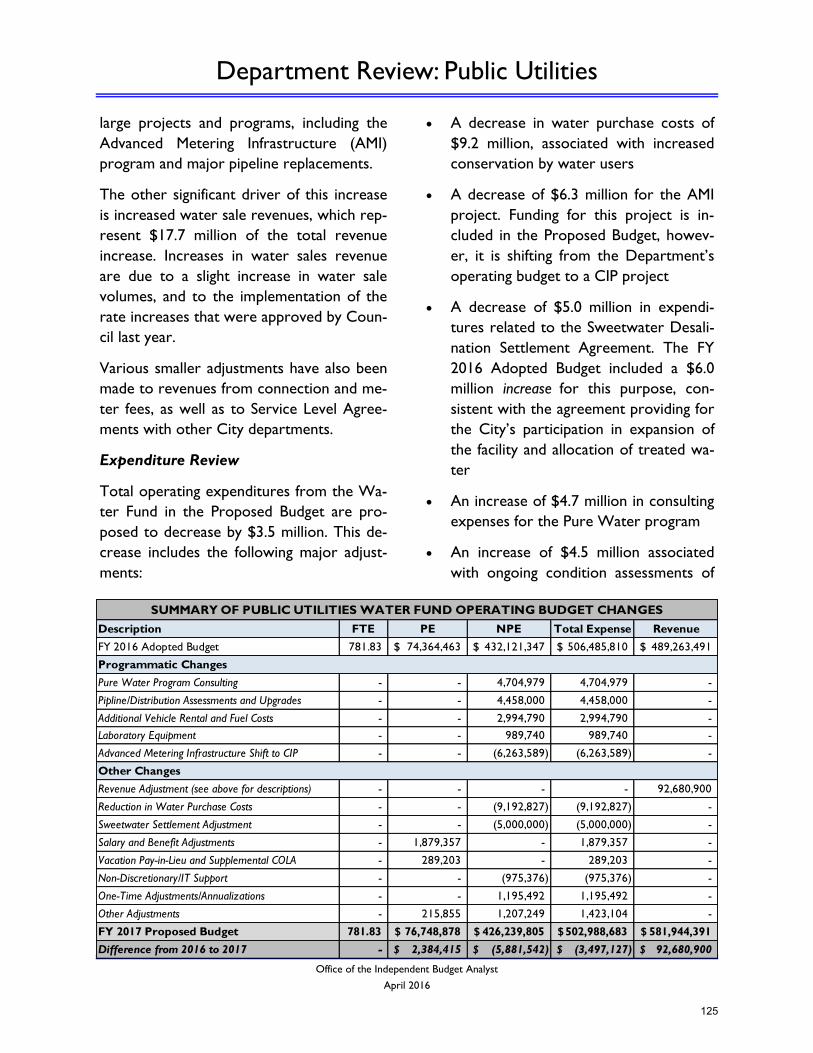
Department Review: Public Utilities
Office of the Independent Budget Analyst
April 2016
large projects and programs, including the
Advanced Metering Infrastructure (AMI)
program and major pipeline replacements.
The other significant driver of this increase
is increased water sale revenues, which rep-
resent $17.7 million of the total revenue
increase. Increases in water sales revenue
are due to a slight increase in water sale
volumes, and to the implementation of the
rate increases that were approved by Coun-
cil last year.
Various smaller adjustments have also been
made to revenues from connection and me-
ter fees, as well as to Service Level Agree-
ments with other City departments.
Expenditure Review
Total operating expenditures from the Wa-
ter Fund in the Proposed Budget are pro-
posed to decrease by $3.5 million. This de-
crease includes the following major adjust-
ments:
A decrease in water purchase costs of
$9.2 million, associated with increased
conservation by water users
A decrease of $6.3 million for the AMI
project. Funding for this project is in-
cluded in the Proposed Budget, howev-
er, it is shifting from the Department’s
operating budget to a CIP project
A decrease of $5.0 million in expendi-
tures related to the Sweetwater Desali-
nation Settlement Agreement. The FY
2016 Adopted Budget included a $6.0
million increase for this purpose, con-
sistent with the agreement providing for
the City’s participation in expansion of
the facility and allocation of treated wa-
ter
An increase of $4.7 million in consulting
expenses for the Pure Water program
An increase of $4.5 million associated
with ongoing condition assessments of
Description FTE PE NPE Total Expense Revenue
FY 2016 Adopted Budget 781.83 74,364,463$ 432,121,347$ 506,485,810$ 489,263,491$
Pure Water Program Consulting - - 4,704,979 4,704,979 -
Pipline/Distribution Assessments and Upgrades - - 4,458,000 4,458,000 -
Additional Vehicle Rental and Fuel Costs - - 2,994,790 2,994,790 -
Laboratory Equipment - - 989,740 989,740 -
Advanced Metering Infrastructure Shift to CIP - - (6,263,589) (6,263,589) -
Revenue Adjustment (see above for descriptions) - - - - 92,680,900
Reduction in Water Purchase Costs - - (9,192,827) (9,192,827) -
Sweetwater Settlement Adjustment - - (5,000,000) (5,000,000) -
Salary and Benefit Adjustments - 1,879,357 - 1,879,357 -
Vacation Pay-in-Lieu and Supplemental COLA - 289,203 - 289,203 -
Non-Discretionary/IT Support - - (975,376) (975,376) -
One-Time Adjustments/Annualizations - - 1,195,492 1,195,492 -
Other Adjustments - 215,855 1,207,249 1,423,104 -
FY 2017 Proposed Budget 781.83 76,748,878$ 426,239,805$ 502,988,683$ 581,944,391$
Difference from 2016 to 2017 - 2,384,415$ (5,881,542)$ (3,497,127)$ 92,680,900$
SUMMARY OF PUBLIC UTILITIES WATER FUND OPERATING BUDGET CHANGES
Programmatic Changes
Other Changes
125
Department Review: Public Utilities
Office of the Independent Budget Analyst
April 2016
high-priority water pipelines and distri-
bution system upgrades
An increase of $2.6 million in expendi-
tures to allow for replacement and rent-
al of vehicles and motorized equipment
Issues to Consider
PURE Water Implementation
The Proposed Budget includes a total of
$89.0 million ($13.0 million in the Depart-
ment’s operating budget and $76.0 million
in the CIP) and 18.66 FTE positions for the
City’s Pure Water Program.
The Pure Water program involves develop-
ment and construction of advanced water
purification facilities which will treat
wastewater to potable standards. The pro-
gram’s ultimate goal is to provide 83 million
gallons of water per day by 2035.
Pure Water is an important part of the
City’s efforts to ensure a local and reliable
supply of drinking water, and is also a large
part of the City’s efforts to receive modifi-
cation to its permit for the Point Loma
Wastewater Treatment Plant that will allow
the plant to continue to treat wastewater
to advanced primary levels.
Water Purchase Costs
The Proposed Budget includes water pur-
chase costs of $219.9 million. This includes
an assumed 5% increase in rates charged by
the County Water Authority for water pur-
chases. Actual updates to the CWA’s rates
will be partially dependent on actions taken
at the Metropolitan Water District in Los
Angeles. As the year progresses, Council
should be updated upon any action that
might impact the rates charged to the City
for the purchase of water, and the impacts
such actions will have on the Department’s
total water purchase expenses.
Overall Operating Costs and Personnel
During hearings on water rate increases in
2015, the Department noted that no in-
creased rates would be used for new or
expanded operating or personnel expenses.
The Proposed Budget is consistent with this
commitment—there is no net change to
FTE positions funded by the Water Fund,
and overall operating expenditures have de-
creased by $3.5 million (though capital ex-
penditures in CIP projects have increased).
Council may wish to monitor operating
costs throughout the coming fiscal year.
The Proposed Budget for the expenditures
in the combined Metropolitan and Municipal
Sewer Utility Funds total $488.6 million, an
increase of $6.6 million over the FY 2016
Adopted Budget. Of this $488.6 million
amount, $357.3 million is for operating ex-
penses (a decrease of $10.7 million from FY
2016), and $131.3 million is for CIP projects
(an increase of $17.2 million over FY 2016).
Revenues for the combined Funds total
$378.8 million, which is a decrease of $9.5
million, or 2.5% from FY 2016. An addition-
al $16.0 million in AB 1600 funds is also rec-
ognized as revenue.
Revenue Review
The $9.5 million decrease in anticipated
revenue in FY 2017 is largely due to re-
duced sewer service charge revenue associ-
ated with reduced flow rates.
Sewer Funds
126
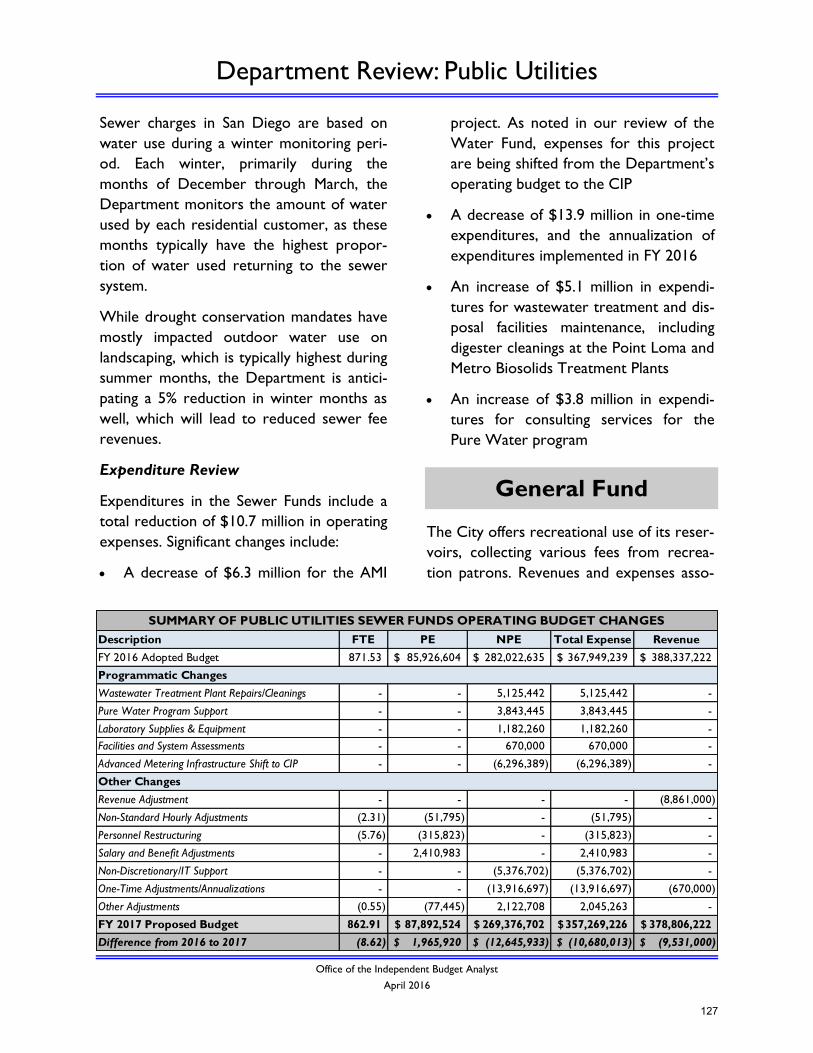
Department Review: Public Utilities
Office of the Independent Budget Analyst
April 2016
Sewer charges in San Diego are based on
water use during a winter monitoring peri-
od. Each winter, primarily during the
months of December through March, the
Department monitors the amount of water
used by each residential customer, as these
months typically have the highest propor-
tion of water used returning to the sewer
system.
While drought conservation mandates have
mostly impacted outdoor water use on
landscaping, which is typically highest during
summer months, the Department is antici-
pating a 5% reduction in winter months as
well, which will lead to reduced sewer fee
revenues.
Expenditure Review
Expenditures in the Sewer Funds include a
total reduction of $10.7 million in operating
expenses. Significant changes include:
A decrease of $6.3 million for the AMI
project. As noted in our review of the
Water Fund, expenses for this project
are being shifted from the Department’s
operating budget to the CIP
A decrease of $13.9 million in one-time
expenditures, and the annualization of
expenditures implemented in FY 2016
An increase of $5.1 million in expendi-
tures for wastewater treatment and dis-
posal facilities maintenance, including
digester cleanings at the Point Loma and
Metro Biosolids Treatment Plants
An increase of $3.8 million in expendi-
tures for consulting services for the
Pure Water program
The City offers recreational use of its reser-
voirs, collecting various fees from recrea-
tion patrons. Revenues and expenses asso-
General Fund
Description FTE PE NPE Total Expense Revenue
FY 2016 Adopted Budget 871.53 85,926,604$ 282,022,635$ 367,949,239$ 388,337,222$
Wastewater Treatment Plant Repairs/Cleanings - - 5,125,442 5,125,442 -
Pure Water Program Support - - 3,843,445 3,843,445 -
Laboratory Supplies & Equipment - - 1,182,260 1,182,260 -
Facilities and System Assessments - - 670,000 670,000 -
Advanced Metering Infrastructure Shift to CIP - - (6,296,389) (6,296,389) -
Revenue Adjustment - - - - (8,861,000)
Non-Standard Hourly Adjustments (2.31) (51,795) - (51,795) -
Personnel Restructuring (5.76) (315,823) - (315,823) -
Salary and Benefit Adjustments - 2,410,983 - 2,410,983 -
Non-Discretionary/IT Support - - (5,376,702) (5,376,702) -
One-Time Adjustments/Annualizations - - (13,916,697) (13,916,697) (670,000)
Other Adjustments (0.55) (77,445) 2,122,708 2,045,263 -
FY 2017 Proposed Budget 862.91 87,892,524$ 269,376,702$ 357,269,226$ 378,806,222$
Difference from 2016 to 2017 (8.62) 1,965,920$ (12,645,933)$ (10,680,013)$ (9,531,000)$
SUMMARY OF PUBLIC UTILITIES SEWER FUNDS OPERATING BUDGET CHANGES
Programmatic Changes
Other Changes
127
Department Review: Public Utilities
Office of the Independent Budget Analyst
April 2016
ciated with this recreational use of reser-
voirs are General Fund transactions.
The FY 2017 Proposed Budget includes ex-
penditures for these activities in the amount
of $2.6 million, an increase of $28,000 or
1% over FY 2016. $15,000 of this amount is
due to an increase in NPEs for the San Die-
guito Joint Powers Authority, and the re-
mainder of the increases are in non-
discretionary adjustments.
General Fund revenues in the Proposed
Budget include a $669,000 increase over FY
2016, bringing total revenues to $1.6 mil-
lion. Roughly $295,000 of this increase is
associated with increased concessions in-
come and recreation fees. A $390,000 in-
crease is associated with increased rental
income from agricultural land owned by
PUD, including properties in the San Pasqual
Valley.
The Proposed Budget also includes a
$16,000 decrease in revenues for water
fowl hunting permits at the Barrett and
Sutherland reservoirs, due to decreases in
water depth below what is permitted for
fowl hunting.
128
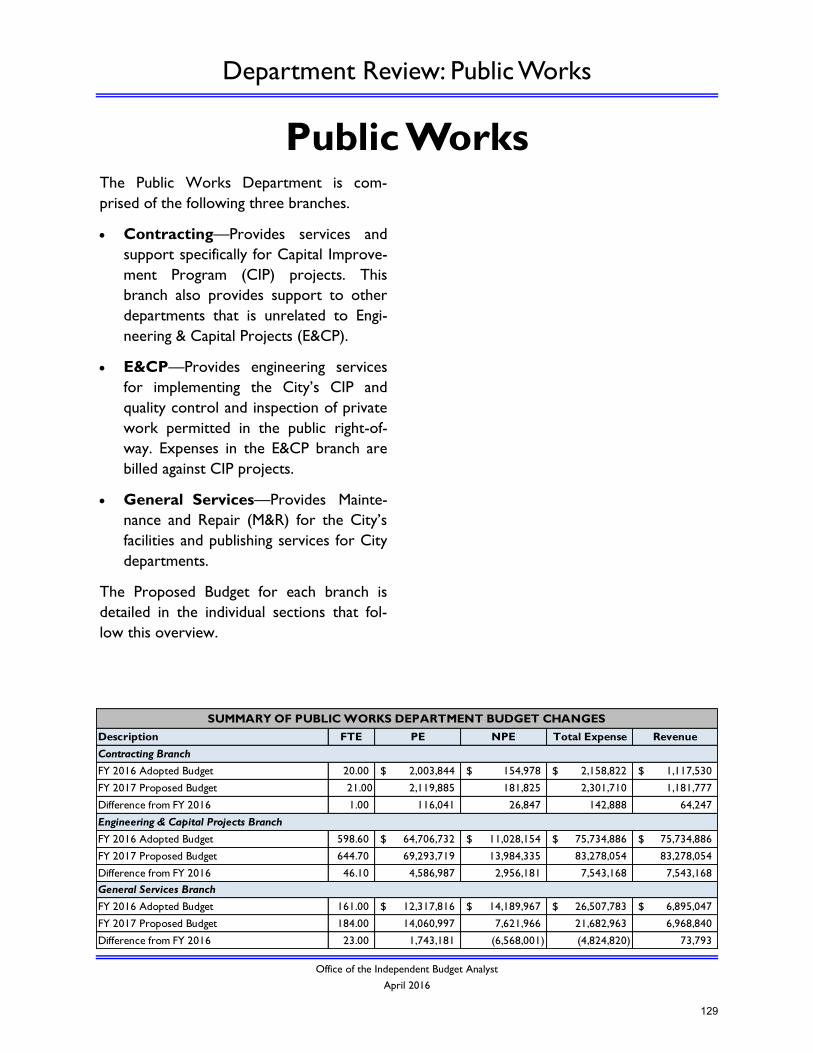
Department Review: Public Works
Office of the Independent Budget Analyst
April 2016
Public Works The Public Works Department is com-
prised of the following three branches.
Contracting—Provides services and
support specifically for Capital Improve-
ment Program (CIP) projects. This
branch also provides support to other
departments that is unrelated to Engi-
neering & Capital Projects (E&CP).
E&CP—Provides engineering services
for implementing the City’s CIP and
quality control and inspection of private
work permitted in the public right-of-
way. Expenses in the E&CP branch are
billed against CIP projects.
General Services—Provides Mainte-
nance and Repair (M&R) for the City’s
facilities and publishing services for City
departments.
The Proposed Budget for each branch is
detailed in the individual sections that fol-
low this overview.
Description FTE PE NPE Total Expense Revenue
FY 2016 Adopted Budget 20.00 2,003,844$ 154,978$ 2,158,822$ 1,117,530$
FY 2017 Proposed Budget 21.00 2,119,885 181,825 2,301,710 1,181,777
Difference from FY 2016 1.00 116,041 26,847 142,888 64,247
FY 2016 Adopted Budget 598.60 64,706,732$ 11,028,154$ 75,734,886$ 75,734,886$
FY 2017 Proposed Budget 644.70 69,293,719 13,984,335 83,278,054 83,278,054
Difference from FY 2016 46.10 4,586,987 2,956,181 7,543,168 7,543,168
FY 2016 Adopted Budget 161.00 12,317,816$ 14,189,967$ 26,507,783$ 6,895,047$
FY 2017 Proposed Budget 184.00 14,060,997 7,621,966 21,682,963 6,968,840
Difference from FY 2016 23.00 1,743,181 (6,568,001) (4,824,820) 73,793
SUMMARY OF PUBLIC WORKS DEPARTMENT BUDGET CHANGES
Contracting Branch
Engineering & Capital Projects Branch
General Services Branch
129
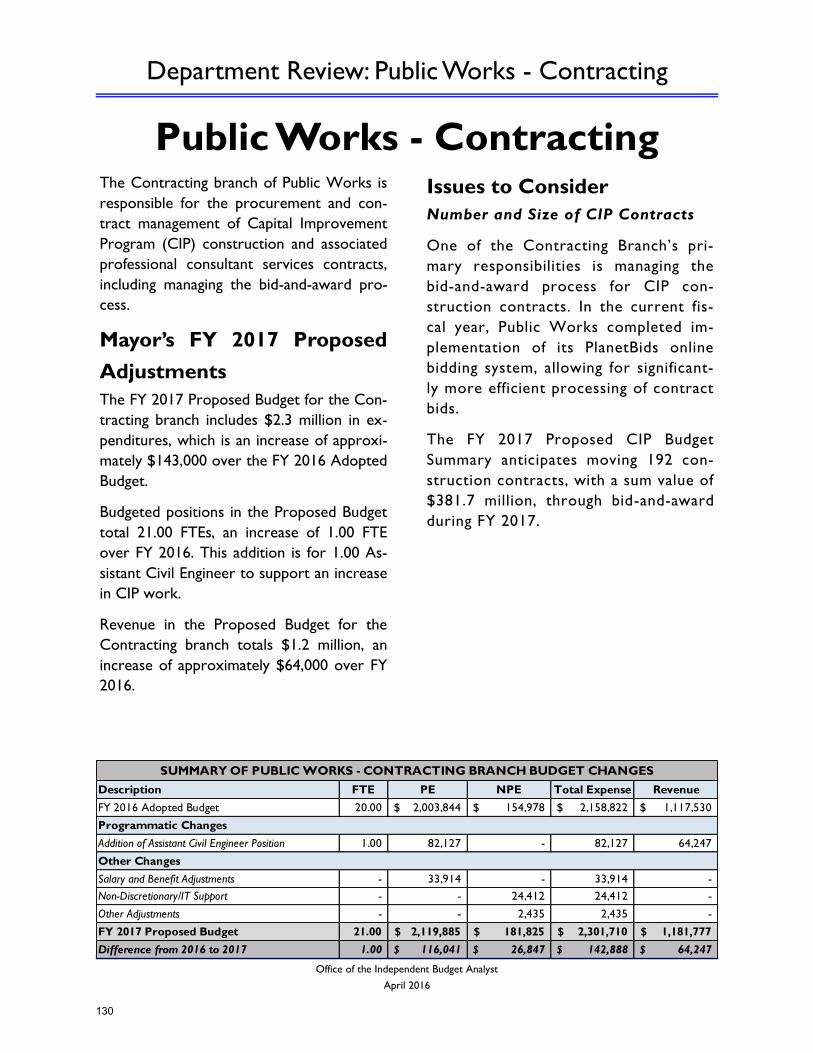
Department Review: Public Works - Contracting
Office of the Independent Budget Analyst
April 2016
Public Works - Contracting The Contracting branch of Public Works is
responsible for the procurement and con-
tract management of Capital Improvement
Program (CIP) construction and associated
professional consultant services contracts,
including managing the bid-and-award pro-
cess.
Mayor’s FY 2017 Proposed
Adjustments
The FY 2017 Proposed Budget for the Con-
tracting branch includes $2.3 million in ex-
penditures, which is an increase of approxi-
mately $143,000 over the FY 2016 Adopted
Budget.
Budgeted positions in the Proposed Budget
total 21.00 FTEs, an increase of 1.00 FTE
over FY 2016. This addition is for 1.00 As-
sistant Civil Engineer to support an increase
in CIP work.
Revenue in the Proposed Budget for the
Contracting branch totals $1.2 million, an
increase of approximately $64,000 over FY
2016.
Issues to Consider
Number and Size of CIP Contracts
One of the Contracting Branch’s pri-
mary responsibilities is managing the
bid-and-award process for CIP con-
struction contracts. In the current fis-
cal year, Public Works completed im-
plementation of its PlanetBids online
bidding system, allowing for significant-
ly more efficient processing of contract
bids.
The FY 2017 Proposed CIP Budget
Summary anticipates moving 192 con-
struction contracts, with a sum value of
$381.7 million, through bid-and-award
during FY 2017.
Description FTE PE NPE Total Expense Revenue
FY 2016 Adopted Budget 20.00 2,003,844$ 154,978$ 2,158,822$ 1,117,530$
Addition of Assistant Civil Engineer Position 1.00 82,127 - 82,127 64,247
Salary and Benefit Adjustments - 33,914 - 33,914 -
Non-Discretionary/IT Support - - 24,412 24,412 -
Other Adjustments - - 2,435 2,435 -
FY 2017 Proposed Budget 21.00 2,119,885$ 181,825$ 2,301,710$ 1,181,777$
Difference from 2016 to 2017 1.00 116,041$ 26,847$ 142,888$ 64,247$
SUMMARY OF PUBLIC WORKS - CONTRACTING BRANCH BUDGET CHANGES
Programmatic Changes
Other Changes
130
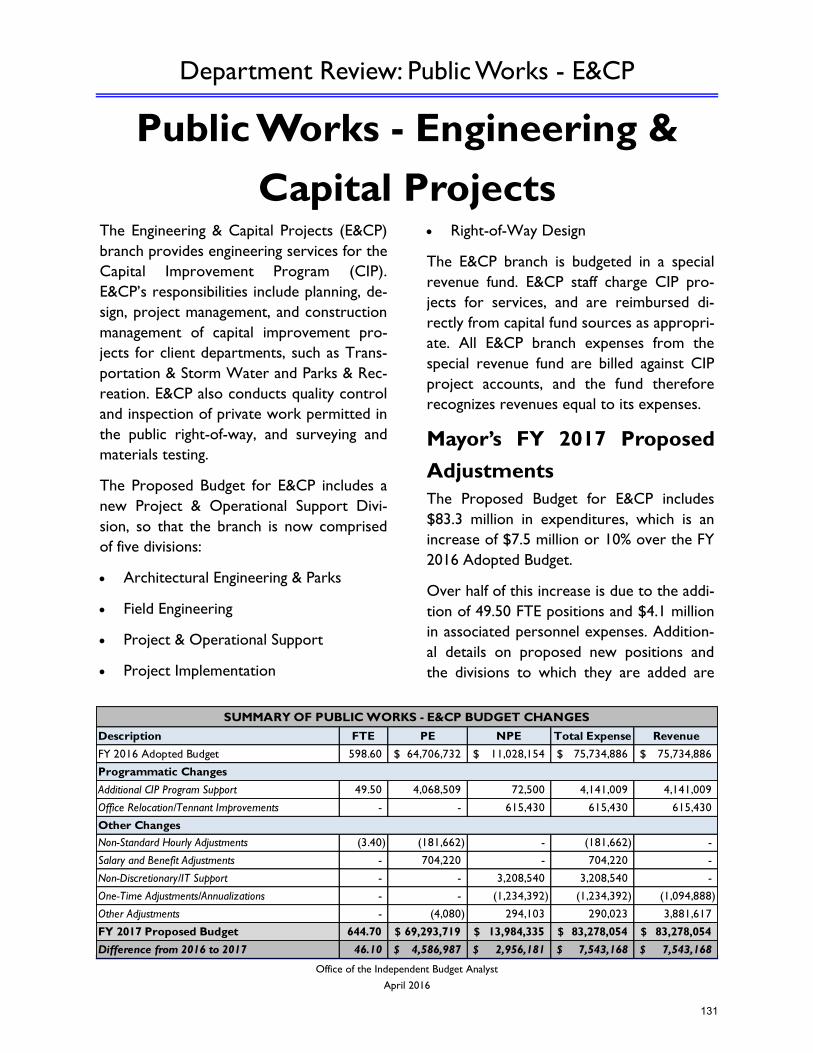
Department Review: Public Works - E&CP
Office of the Independent Budget Analyst
April 2016
Public Works - Engineering &
Capital Projects The Engineering & Capital Projects (E&CP)
branch provides engineering services for the
Capital Improvement Program (CIP).
E&CP’s responsibilities include planning, de-
sign, project management, and construction
management of capital improvement pro-
jects for client departments, such as Trans-
portation & Storm Water and Parks & Rec-
reation. E&CP also conducts quality control
and inspection of private work permitted in
the public right-of-way, and surveying and
materials testing.
The Proposed Budget for E&CP includes a
new Project & Operational Support Divi-
sion, so that the branch is now comprised
of five divisions:
Architectural Engineering & Parks
Field Engineering
Project & Operational Support
Project Implementation
Right-of-Way Design
The E&CP branch is budgeted in a special
revenue fund. E&CP staff charge CIP pro-
jects for services, and are reimbursed di-
rectly from capital fund sources as appropri-
ate. All E&CP branch expenses from the
special revenue fund are billed against CIP
project accounts, and the fund therefore
recognizes revenues equal to its expenses.
Mayor’s FY 2017 Proposed
Adjustments
The Proposed Budget for E&CP includes
$83.3 million in expenditures, which is an
increase of $7.5 million or 10% over the FY
2016 Adopted Budget.
Over half of this increase is due to the addi-
tion of 49.50 FTE positions and $4.1 million
in associated personnel expenses. Addition-
al details on proposed new positions and
the divisions to which they are added are
Description FTE PE NPE Total Expense Revenue
FY 2016 Adopted Budget 598.60 64,706,732$ 11,028,154$ 75,734,886$ 75,734,886$
Additional CIP Program Support 49.50 4,068,509 72,500 4,141,009 4,141,009
Office Relocation/Tennant Improvements - - 615,430 615,430 615,430
Non-Standard Hourly Adjustments (3.40) (181,662) - (181,662) -
Salary and Benefit Adjustments - 704,220 - 704,220 -
Non-Discretionary/IT Support - - 3,208,540 3,208,540 -
One-Time Adjustments/Annualizations - - (1,234,392) (1,234,392) (1,094,888)
Other Adjustments - (4,080) 294,103 290,023 3,881,617
FY 2017 Proposed Budget 644.70 69,293,719$ 13,984,335$ 83,278,054$ 83,278,054$
Difference from 2016 to 2017 46.10 4,586,987$ 2,956,181$ 7,543,168$ 7,543,168$
SUMMARY OF PUBLIC WORKS - E&CP BUDGET CHANGES
Programmatic Changes
Other Changes
131
Department Review: Public Works - E&CP
Office of the Independent Budget Analyst
April 2016
listed below:
Construction Management/Field Services
11.00 FTEs for Assistant and Associate
Civil Engineers
5.00 FTEs for Land Surveying Assis-
tants and Associates
4.00 FTEs for Principal Survey Aides
4.00 FTEs for Project Assistants
3.00 FTEs for Senior and Principal En-
gineering Aides
1.00 FTE for an Assistant Deputy Di-
rector
Architectural, Engineering, & Parks
3.00 FTEs for Assistant Civil Engineers
Project Implementation
4.00 FTEs for Senior and Associate
Planners
3.00 FTEs for Assistant and Associate
Civil Engineers
2.00 FTEs for Contracts Processing
Clerks
1.00 FTE for an Assistant Deputy Di-
rector
Project & Operational Support
3.00 FTEs for Word Processing Oper-
ators
0.50 FTEs for an Auto Messenger
Right of Way
4.00 FTEs for Associate and Assistant
Civil Engineers
1.00 FTE for an Associate Electrical
Engineer
An additional $615,000 in expenditures for
office relocations and tenant improvements
is included in the Proposed Budget.
Issues to Consider
Effective Implementation of Capital Pro-
jects
Historically, Public Works has implemented
between $300 and $350 million in capital
projects each year. The FY 2016 Adopted
Budget included significant increases to the
Department’s personnel and expenditures
in an effort to ramp-up project-delivery ca-
pacity. The City’s Multi-Year Capital Out-
look includes a capital program with identi-
fied needs that increase to up to $500 mil-
lion a year over the next five years. With
major capital projects—including Pure Wa-
ter—looming in that time frame and be-
yond, it is possible that project-delivery
needs in the future could grow past that
amount.
The Department has indicated that its ca-
pacity for capital projects is increasing, due
both to increased staffing levels and to a
number of project and program efficiencies
that have been implemented over the last
year.
The Proposed Budget for the FY 2017 CIP
includes expected new contracts of $381.7
million. E&CP’s budget also calls for ex-
penditures of $83.3 million, which suggests
that estimated project capacity in FY 2017
will approach $465 million.*
*This is a rough estimate. As construction contracts entered into in any given fiscal year may not be completed in that same year, using
the expected new contracts amount only provides a rough estimate for project delivery capacity.
132
Department Review: Public Works - E&CP
Office of the Independent Budget Analyst
April 2016
Council may wish to request additional in-
formation related to the Department’s ca-
pacity to deliver projects and the projected
growth in the City’s CIP.
Hiring Personnel
The FY 2016 Adopted Budget included
112.00 new FTE positions in the E&CP
branch. Public Works has made significant
efforts to fill these positions, as well as va-
cancies that open when existing employees
leave City service. Efforts have included hir-
ing-halls and university outreach and re-
cruiting. At present the Department indi-
cates that 86 of those positions are ex-
pected to be filled by year-end: 41 addition-
al staff have already been hired, and 45 addi-
tional candidates have accepted offers of
employment.
Some challenges remain, including a low
number of eligible candidates for certain
positions, a lack of office space for addition-
al personnel (this is discussed in more detail
below), and long recruitment timelines.
Council may wish to receive an update on
filling positions added in FY 2016, as well as
strategies for filling the additional 49.50 FTE
positions in the Proposed Budget, during its
budget hearings.
Office Space for Personnel
At present there is not sufficient office
space to house all of the positions included
in the FY 2017 Proposed Budget on top of
those included in the FY 2016 Adopted
Budget. Through the Real Estate Assets De-
partment, Public Works is working to ob-
tain floor space on two floors at 525 B
Street and the remainder of the vacant por-
tions of the 4th floor in the City Admin-
istration Building.
Public Works had initially planned on ob-
taining floor space on three floors at 525 B
Street, which would have provided sufficient
office space for the additional staff included
in the Proposed Budget. However, the
owner of 525 B street has since indicated
that only two floors are available to rent to
the City.
Additionally, Engineering staff is currently
spread out across multiple locations; this
may result in some inefficiencies that would
not be present were all Engineering staff co-
located in a single location.
133
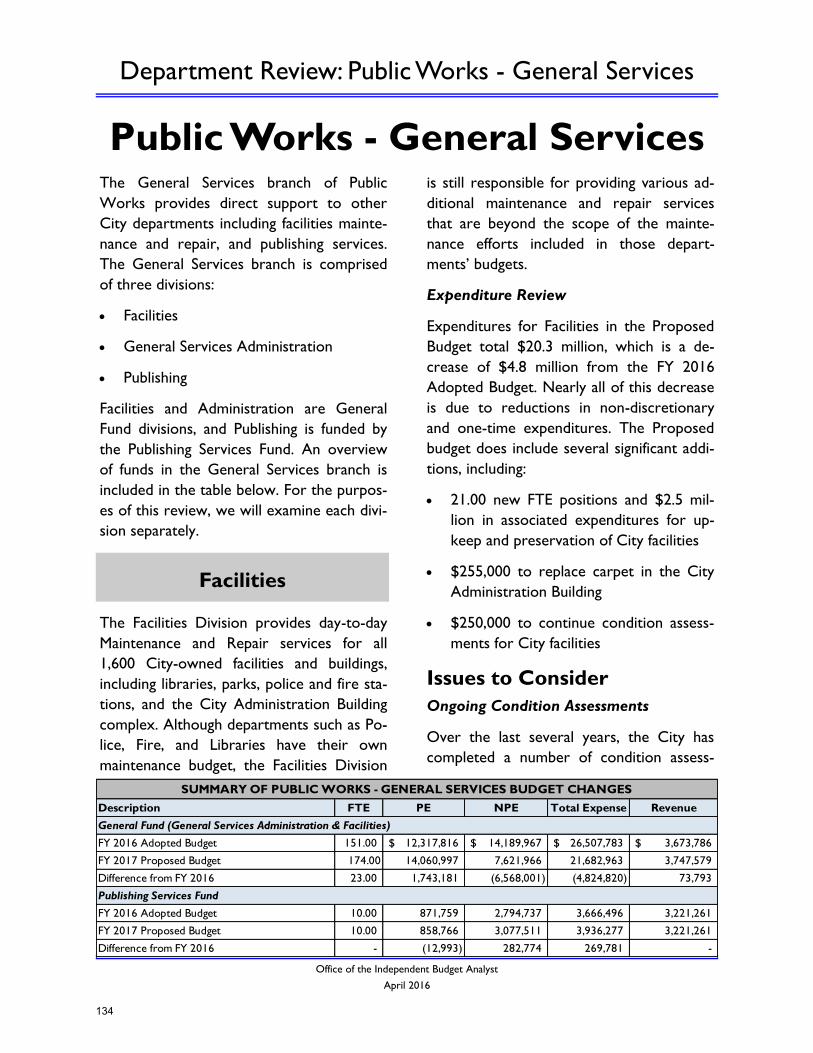
Department Review: Public Works - General Services
Office of the Independent Budget Analyst
April 2016
Public Works - General Services The General Services branch of Public
Works provides direct support to other
City departments including facilities mainte-
nance and repair, and publishing services.
The General Services branch is comprised
of three divisions:
Facilities
General Services Administration
Publishing
Facilities and Administration are General
Fund divisions, and Publishing is funded by
the Publishing Services Fund. An overview
of funds in the General Services branch is
included in the table below. For the purpos-
es of this review, we will examine each divi-
sion separately.
The Facilities Division provides day-to-day
Maintenance and Repair services for all
1,600 City-owned facilities and buildings,
including libraries, parks, police and fire sta-
tions, and the City Administration Building
complex. Although departments such as Po-
lice, Fire, and Libraries have their own
maintenance budget, the Facilities Division
is still responsible for providing various ad-
ditional maintenance and repair services
that are beyond the scope of the mainte-
nance efforts included in those depart-
ments’ budgets.
Expenditure Review
Expenditures for Facilities in the Proposed
Budget total $20.3 million, which is a de-
crease of $4.8 million from the FY 2016
Adopted Budget. Nearly all of this decrease
is due to reductions in non-discretionary
and one-time expenditures. The Proposed
budget does include several significant addi-
tions, including:
21.00 new FTE positions and $2.5 mil-
lion in associated expenditures for up-
keep and preservation of City facilities
$255,000 to replace carpet in the City
Administration Building
$250,000 to continue condition assess-
ments for City facilities
Issues to Consider
Ongoing Condition Assessments
Over the last several years, the City has
completed a number of condition assess-
Facilities
Description FTE PE NPE Total Expense Revenue
FY 2016 Adopted Budget 151.00 12,317,816$ 14,189,967$ 26,507,783$ 3,673,786$
FY 2017 Proposed Budget 174.00 14,060,997 7,621,966 21,682,963 3,747,579
Difference from FY 2016 23.00 1,743,181 (6,568,001) (4,824,820) 73,793
FY 2016 Adopted Budget 10.00 871,759 2,794,737 3,666,496 3,221,261
FY 2017 Proposed Budget 10.00 858,766 3,077,511 3,936,277 3,221,261
Difference from FY 2016 - (12,993) 282,774 269,781 -
SUMMARY OF PUBLIC WORKS - GENERAL SERVICES BUDGET CHANGES
General Fund (General Services Administration & Facilities)
Publishing Services Fund
134
Department Review: Public Works - General Services
Office of the Independent Budget Analyst
April 2016
ments of City facilities, including its streets,
sidewalks, and non-leased building facilities.
Condition assessments for the City’s parks
and leased facilities are ongoing.
The most recent facilities condition assess-
ment included 560 non-leased City build-
ings, and found a need to invest $403 mil-
lion to bring them to “good” standards.
A condition assessment for roughly half of
all leased buildings is expected to be com-
pleted by fall of this year. Between 30 and
50 Park facilities are generally assessed each
year, and an assessment for Balboa Park
amenities is expected to be complete by the
end of FY 2016. Additional assessments for
Enterprise Fund funded facilities are ongoing
and generally occur on a five-year basis.
An update to the Department’s Multi-Year
Capital Outlook, which includes capital
needs, identified funding sources, and fund-
ing gaps, is expected to be released towards
the end of Calendar Year 2016.
Proposed Service Level Standards
Facilities Condition Index (FCI) ratings de-
scribe the overall condition of a building,
with a score of 0-20 being good, 21-29 be-
ing fair, and 30 and above being poor.
The $403 million identified above assumes a
target FCI for public-facing facilities of 15,
semi-public facilities of 15, and city office/
work yard/operations facilities of 19. These
targets, however, have only been estab-
lished informally by Public Works staff.
Neither Council nor the Mayor has taken
action to determine an appropriate condi-
tion index for various City facilities; Council
may wish to consider taking action to set
FCI targets at some point in the coming
Fiscal Year, which would allow facility in-
vestment cost needs to be determined
more accurately.
The Administration Division provides ad-
ministrative and technical support to the
Public Works Director and the General
Services Division. The FY 2017 Proposed
Budget for the Administration Division in-
cludes $1.4 million in expenditures, a de-
crease of approximately $59,000 from FY
2016. The bulk of this decrease is in reduc-
tions to non-discretionary and one-time ex-
penditures.
The Proposed Budget for the Division does
include an increase of 2.00 FTE positions
and $139,000 in expenditures for an electri-
cal apprenticeship program, and 1.00 FTE
position and $107,000 in expenditures for
the Department’s Safety and Training pro-
gram.
The Publishing Services Division provides a
full service, in-house reproduction and
graphics center, and manages the citywide
Photocopier Program for all City depart-
ments. The Division is funded by charging
customer departments for its service
through the Publishing Services Fund.
General Services
Administration
Publishing Services
135
Department Review: Public Works - General Services
Office of the Independent Budget Analyst
April 2016
Mayor’s FY 2017 Proposed
Adjustments
The FY 2017 Proposed Budget for the Pub-
lish Services Division is approximately $3.9
million, an increase of approximately
$270,000 over the FY 2016 Adopted Budg-
et. Positions have remained at 10.00 FTE -
constant from the previous year. Division
revenues are projected to total approxi-
mately $3.2 million, reflecting no change
from FY 2016 Adopted Budget.
Significant Budget Adjustments
The FY 2017 Proposed Budget includes the
following significant budget adjustment:
An increase of approximately $190,000
in expenses due to cost of renting copy-
ing equipment.
136
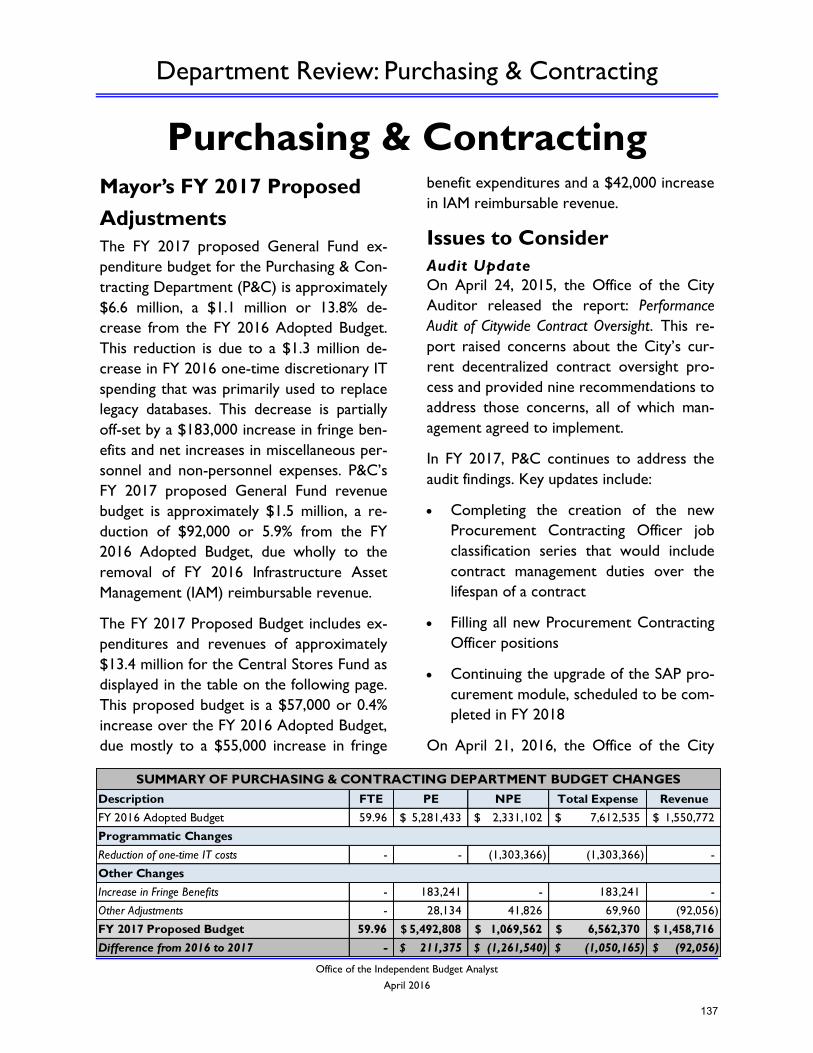
Department Review: Purchasing & Contracting
Office of the Independent Budget Analyst
April 2016
Purchasing & Contracting
Mayor’s FY 2017 Proposed
Adjustments
The FY 2017 proposed General Fund ex-
penditure budget for the Purchasing & Con-
tracting Department (P&C) is approximately
$6.6 million, a $1.1 million or 13.8% de-
crease from the FY 2016 Adopted Budget.
This reduction is due to a $1.3 million de-
crease in FY 2016 one-time discretionary IT
spending that was primarily used to replace
legacy databases. This decrease is partially
off-set by a $183,000 increase in fringe ben-
efits and net increases in miscellaneous per-
sonnel and non-personnel expenses. P&C’s
FY 2017 proposed General Fund revenue
budget is approximately $1.5 million, a re-
duction of $92,000 or 5.9% from the FY
2016 Adopted Budget, due wholly to the
removal of FY 2016 Infrastructure Asset
Management (IAM) reimbursable revenue.
The FY 2017 Proposed Budget includes ex-
penditures and revenues of approximately
$13.4 million for the Central Stores Fund as
displayed in the table on the following page.
This proposed budget is a $57,000 or 0.4%
increase over the FY 2016 Adopted Budget,
due mostly to a $55,000 increase in fringe
benefit expenditures and a $42,000 increase
in IAM reimbursable revenue.
Issues to Consider
Audit Update
On April 24, 2015, the Office of the City
Auditor released the report: Performance
Audit of Citywide Contract Oversight. This re-
port raised concerns about the City’s cur-
rent decentralized contract oversight pro-
cess and provided nine recommendations to
address those concerns, all of which man-
agement agreed to implement.
In FY 2017, P&C continues to address the
audit findings. Key updates include:
Completing the creation of the new
Procurement Contracting Officer job
classification series that would include
contract management duties over the
lifespan of a contract
Filling all new Procurement Contracting
Officer positions
Continuing the upgrade of the SAP pro-
curement module, scheduled to be com-
pleted in FY 2018
On April 21, 2016, the Office of the City
Description FTE PE NPE Total Expense Revenue
FY 2016 Adopted Budget 59.96 5,281,433$ 2,331,102$ 7,612,535$ 1,550,772$
Reduction of one-time IT costs - - (1,303,366) (1,303,366) -
Increase in Fringe Benefits - 183,241 - 183,241 -
Other Adjustments - 28,134 41,826 69,960 (92,056)
FY 2017 Proposed Budget 59.96 5,492,808$ 1,069,562$ 6,562,370$ 1,458,716$
Difference from 2016 to 2017 - 211,375$ (1,261,540)$ (1,050,165)$ (92,056)$
SUMMARY OF PURCHASING & CONTRACTING DEPARTMENT BUDGET CHANGES
Programmatic Changes
Other Changes
137
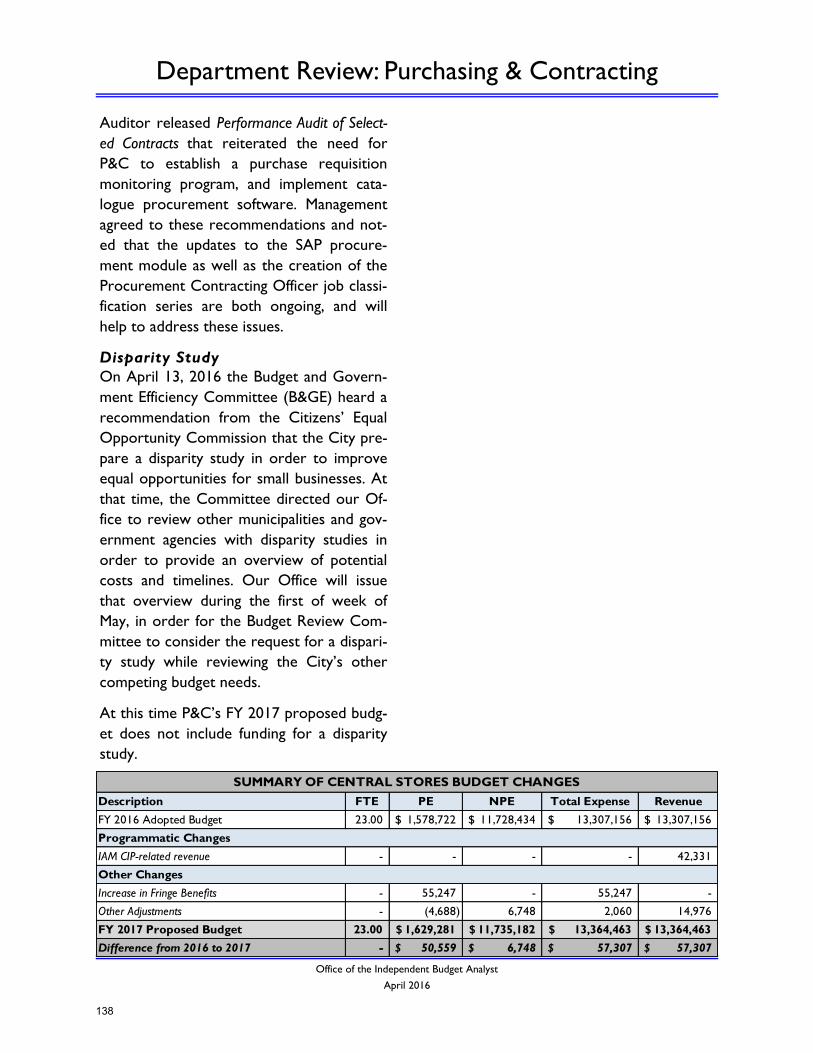
Department Review: Purchasing & Contracting
Office of the Independent Budget Analyst
April 2016
Auditor released Performance Audit of Select-
ed Contracts that reiterated the need for
P&C to establish a purchase requisition
monitoring program, and implement cata-
logue procurement software. Management
agreed to these recommendations and not-
ed that the updates to the SAP procure-
ment module as well as the creation of the
Procurement Contracting Officer job classi-
fication series are both ongoing, and will
help to address these issues.
Disparity Study
On April 13, 2016 the Budget and Govern-
ment Efficiency Committee (B&GE) heard a
recommendation from the Citizens’ Equal
Opportunity Commission that the City pre-
pare a disparity study in order to improve
equal opportunities for small businesses. At
that time, the Committee directed our Of-
fice to review other municipalities and gov-
ernment agencies with disparity studies in
order to provide an overview of potential
costs and timelines. Our Office will issue
that overview during the first of week of
May, in order for the Budget Review Com-
mittee to consider the request for a dispari-
ty study while reviewing the City’s other
competing budget needs.
At this time P&C’s FY 2017 proposed budg-
et does not include funding for a disparity
study.
Description FTE PE NPE Total Expense Revenue
FY 2016 Adopted Budget 23.00 1,578,722$ 11,728,434$ 13,307,156$ 13,307,156$
IAM CIP-related revenue - - - - 42,331
Increase in Fringe Benefits - 55,247 - 55,247 -
Other Adjustments - (4,688) 6,748 2,060 14,976
FY 2017 Proposed Budget 23.00 1,629,281$ 11,735,182$ 13,364,463$ 13,364,463$
Difference from 2016 to 2017 - 50,559$ 6,748$ 57,307$ 57,307$
SUMMARY OF CENTRAL STORES BUDGET CHANGES
Programmatic Changes
Other Changes
138
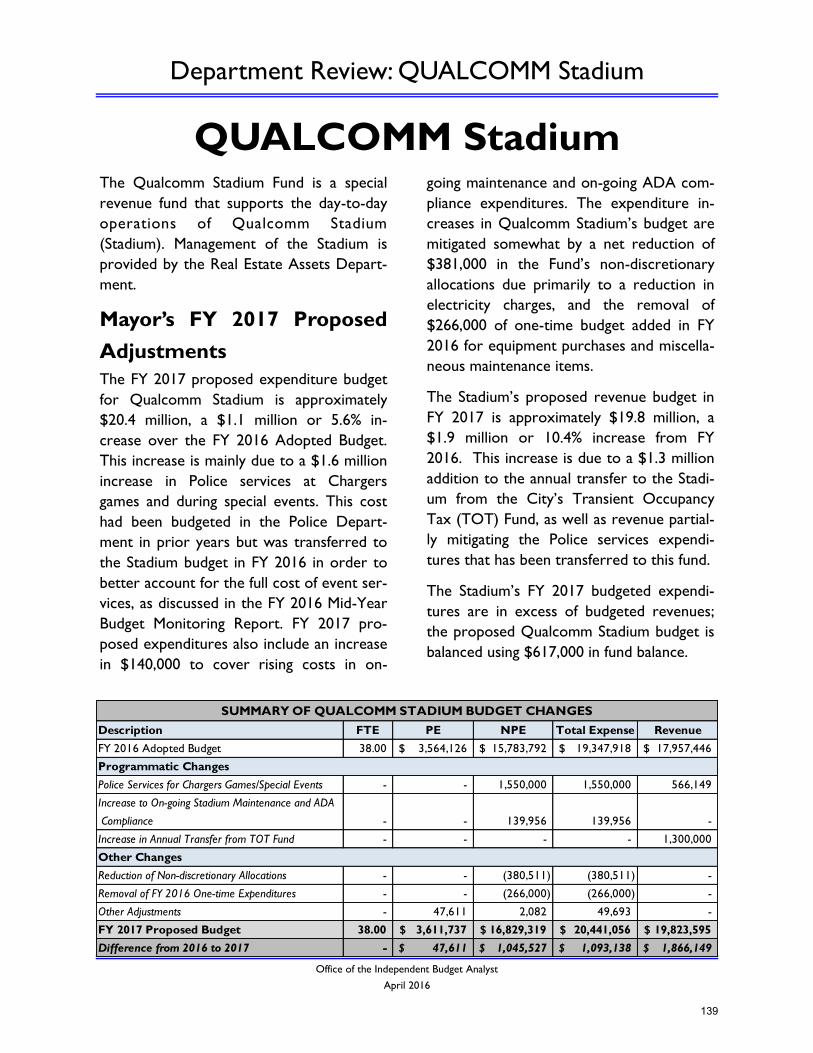
Department Review: QUALCOMM Stadium
Office of the Independent Budget Analyst
April 2016
QUALCOMM Stadium The Qualcomm Stadium Fund is a special
revenue fund that supports the day-to-day
operations of Qualcomm Stadium
(Stadium). Management of the Stadium is
provided by the Real Estate Assets Depart-
ment.
Mayor’s FY 2017 Proposed
Adjustments
The FY 2017 proposed expenditure budget
for Qualcomm Stadium is approximately
$20.4 million, a $1.1 million or 5.6% in-
crease over the FY 2016 Adopted Budget.
This increase is mainly due to a $1.6 million
increase in Police services at Chargers
games and during special events. This cost
had been budgeted in the Police Depart-
ment in prior years but was transferred to
the Stadium budget in FY 2016 in order to
better account for the full cost of event ser-
vices, as discussed in the FY 2016 Mid-Year
Budget Monitoring Report. FY 2017 pro-
posed expenditures also include an increase
in $140,000 to cover rising costs in on-
going maintenance and on-going ADA com-
pliance expenditures. The expenditure in-
creases in Qualcomm Stadium’s budget are
mitigated somewhat by a net reduction of
$381,000 in the Fund’s non-discretionary
allocations due primarily to a reduction in
electricity charges, and the removal of
$266,000 of one-time budget added in FY
2016 for equipment purchases and miscella-
neous maintenance items.
The Stadium’s proposed revenue budget in
FY 2017 is approximately $19.8 million, a
$1.9 million or 10.4% increase from FY
2016. This increase is due to a $1.3 million
addition to the annual transfer to the Stadi-
um from the City’s Transient Occupancy
Tax (TOT) Fund, as well as revenue partial-
ly mitigating the Police services expendi-
tures that has been transferred to this fund.
The Stadium’s FY 2017 budgeted expendi-
tures are in excess of budgeted revenues;
the proposed Qualcomm Stadium budget is
balanced using $617,000 in fund balance.
Description FTE PE NPE Total Expense Revenue
FY 2016 Adopted Budget 38.00 3,564,126$ 15,783,792$ 19,347,918$ 17,957,446$
Police Services for Chargers Games/Special Events - - 1,550,000 1,550,000 566,149
Increase to On-going Stadium Maintenance and ADA
Compliance - - 139,956 139,956 -
Increase in Annual Transfer from TOT Fund - - - - 1,300,000
Reduction of Non-discretionary Allocations - - (380,511) (380,511) -
Removal of FY 2016 One-time Expenditures - - (266,000) (266,000) -
Other Adjustments - 47,611 2,082 49,693 -
FY 2017 Proposed Budget 38.00 3,611,737$ 16,829,319$ 20,441,056$ 19,823,595$
Difference from 2016 to 2017 - 47,611$ 1,045,527$ 1,093,138$ 1,866,149$
SUMMARY OF QUALCOMM STADIUM BUDGET CHANGES
Programmatic Changes
Other Changes
139
Department Review: QUALCOMM Stadium
Office of the Independent Budget Analyst
April 2016
Operating and Debt Service Costs
While the future of the stadium—both its
purpose and its existence—is up in the air,
it is assumed that it will be operational as is,
in the near term. Currently, the Stadium
does not generate enough annual revenue
to cover its operating and maintenance
costs, and receives a transfer of TOT funds
each year to fully fund its expenditures. In
FY 2017 the proposed transfer from the
TOT Fund is approximately $12.9 million,
or 65% of the Stadium’s total revenue budg-
et. Of that $12.9 million, $4.8 million is
used to pay for debt service from the
1996A Qualcomm Stadium Bonds that were
refunded as part of the 2010A Master Re-
funding Bonds, and that will be fully paid in
FY 2026.
140
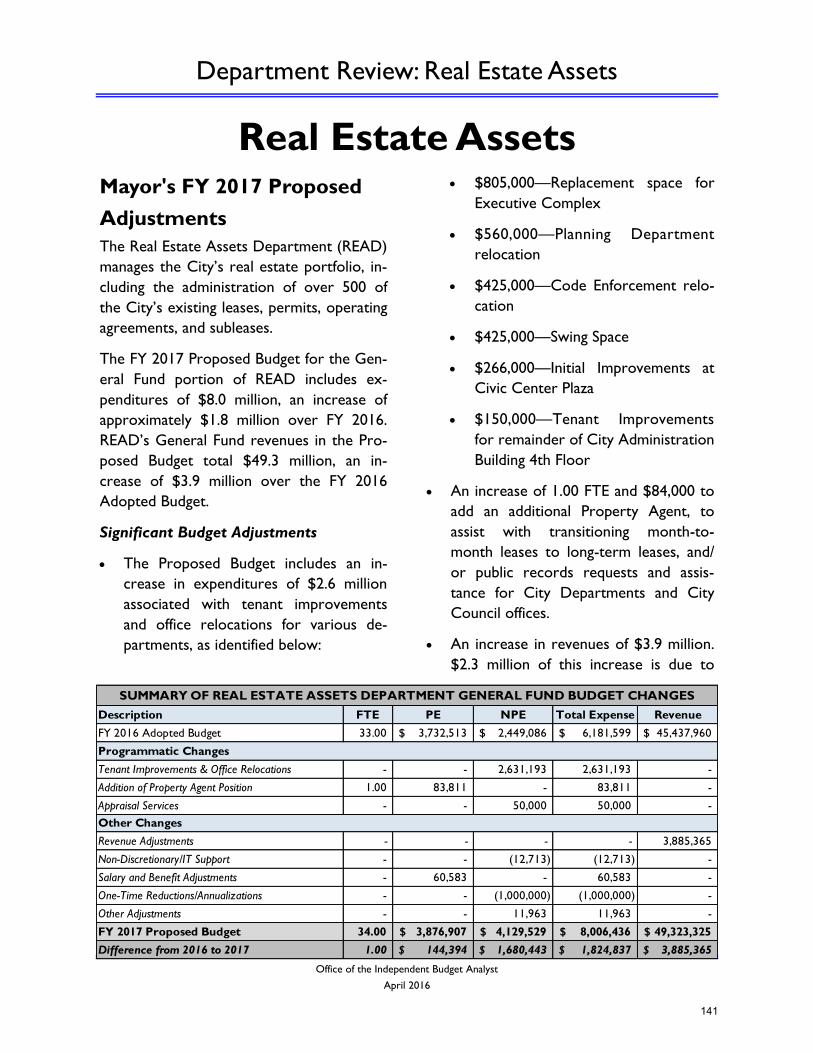
Department Review: Real Estate Assets
Office of the Independent Budget Analyst
April 2016
Real Estate Assets
Mayor's FY 2017 Proposed
Adjustments
The Real Estate Assets Department (READ)
manages the City’s real estate portfolio, in-
cluding the administration of over 500 of
the City’s existing leases, permits, operating
agreements, and subleases.
The FY 2017 Proposed Budget for the Gen-
eral Fund portion of READ includes ex-
penditures of $8.0 million, an increase of
approximately $1.8 million over FY 2016.
READ’s General Fund revenues in the Pro-
posed Budget total $49.3 million, an in-
crease of $3.9 million over the FY 2016
Adopted Budget.
Significant Budget Adjustments
The Proposed Budget includes an in-
crease in expenditures of $2.6 million
associated with tenant improvements
and office relocations for various de-
partments, as identified below:
$805,000—Replacement space for
Executive Complex
$560,000—Planning Department
relocation
$425,000—Code Enforcement relo-
cation
$425,000—Swing Space
$266,000—Initial Improvements at
Civic Center Plaza
$150,000—Tenant Improvements
for remainder of City Administration
Building 4th Floor
An increase of 1.00 FTE and $84,000 to
add an additional Property Agent, to
assist with transitioning month-to-
month leases to long-term leases, and/
or public records requests and assis-
tance for City Departments and City
Council offices.
An increase in revenues of $3.9 million.
$2.3 million of this increase is due to
Description FTE PE NPE Total Expense Revenue
FY 2016 Adopted Budget 33.00 3,732,513$ 2,449,086$ 6,181,599$ 45,437,960$
Tenant Improvements & Office Relocations - - 2,631,193 2,631,193 -
Addition of Property Agent Position 1.00 83,811 - 83,811 -
Appraisal Services - - 50,000 50,000 -
Revenue Adjustments - - - - 3,885,365
Non-Discretionary/IT Support - - (12,713) (12,713) -
Salary and Benefit Adjustments - 60,583 - 60,583 -
One-Time Reductions/Annualizations - - (1,000,000) (1,000,000) -
Other Adjustments - - 11,963 11,963 -
FY 2017 Proposed Budget 34.00 3,876,907$ 4,129,529$ 8,006,436$ 49,323,325$
Difference from 2016 to 2017 1.00 144,394$ 1,680,443$ 1,824,837$ 3,885,365$
SUMMARY OF REAL ESTATE ASSETS DEPARTMENT GENERAL FUND BUDGET CHANGES
Programmatic Changes
Other Changes
141
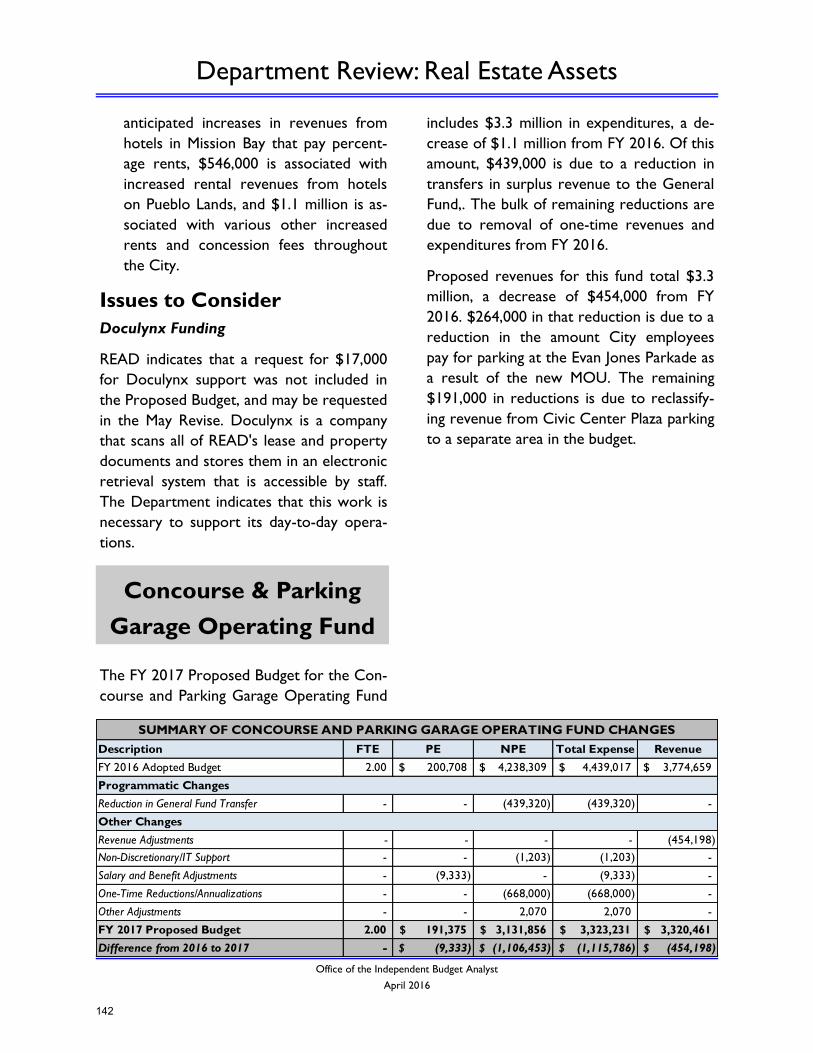
Department Review: Real Estate Assets
Office of the Independent Budget Analyst
April 2016
anticipated increases in revenues from
hotels in Mission Bay that pay percent-
age rents, $546,000 is associated with
increased rental revenues from hotels
on Pueblo Lands, and $1.1 million is as-
sociated with various other increased
rents and concession fees throughout
the City.
Issues to Consider
Doculynx Funding
READ indicates that a request for $17,000
for Doculynx support was not included in
the Proposed Budget, and may be requested
in the May Revise. Doculynx is a company
that scans all of READ's lease and property
documents and stores them in an electronic
retrieval system that is accessible by staff.
The Department indicates that this work is
necessary to support its day-to-day opera-
tions.
The FY 2017 Proposed Budget for the Con-
course and Parking Garage Operating Fund
includes $3.3 million in expenditures, a de-
crease of $1.1 million from FY 2016. Of this
amount, $439,000 is due to a reduction in
transfers in surplus revenue to the General
Fund,. The bulk of remaining reductions are
due to removal of one-time revenues and
expenditures from FY 2016.
Proposed revenues for this fund total $3.3
million, a decrease of $454,000 from FY
2016. $264,000 in that reduction is due to a
reduction in the amount City employees
pay for parking at the Evan Jones Parkade as
a result of the new MOU. The remaining
$191,000 in reductions is due to reclassify-
ing revenue from Civic Center Plaza parking
to a separate area in the budget.
Concourse & Parking
Garage Operating Fund
Description FTE PE NPE Total Expense Revenue
FY 2016 Adopted Budget 2.00 200,708$ 4,238,309$ 4,439,017$ 3,774,659$
Reduction in General Fund Transfer - - (439,320) (439,320) -
Revenue Adjustments - - - - (454,198)
Non-Discretionary/IT Support - - (1,203) (1,203) -
Salary and Benefit Adjustments - (9,333) - (9,333) -
One-Time Reductions/Annualizations - - (668,000) (668,000) -
Other Adjustments - - 2,070 2,070 -
FY 2017 Proposed Budget 2.00 191,375$ 3,131,856$ 3,323,231$ 3,320,461$
Difference from 2016 to 2017 - (9,333)$ (1,106,453)$ (1,115,786)$ (454,198)$
SUMMARY OF CONCOURSE AND PARKING GARAGE OPERATING FUND CHANGES
Programmatic Changes
Other Changes
142
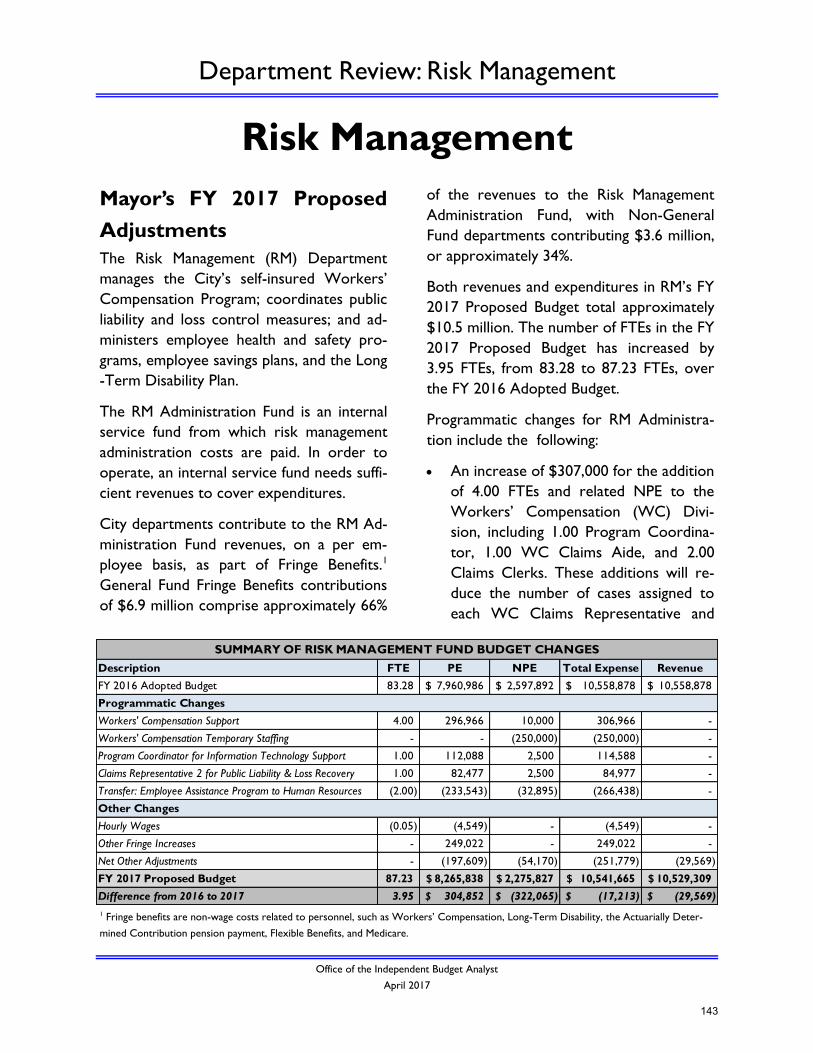
Department Review: Risk Management
Office of the Independent Budget Analyst
April 2017
Risk Management
Mayor’s FY 2017 Proposed
Adjustments
The Risk Management (RM) Department
manages the City’s self-insured Workers’
Compensation Program; coordinates public
liability and loss control measures; and ad-
ministers employee health and safety pro-
grams, employee savings plans, and the Long
-Term Disability Plan.
The RM Administration Fund is an internal
service fund from which risk management
administration costs are paid. In order to
operate, an internal service fund needs suffi-
cient revenues to cover expenditures.
City departments contribute to the RM Ad-
ministration Fund revenues, on a per em-
ployee basis, as part of Fringe Benefits.1
General Fund Fringe Benefits contributions
of $6.9 million comprise approximately 66%
of the revenues to the Risk Management
Administration Fund, with Non-General
Fund departments contributing $3.6 million,
or approximately 34%.
Both revenues and expenditures in RM’s FY
2017 Proposed Budget total approximately
$10.5 million. The number of FTEs in the FY
2017 Proposed Budget has increased by
3.95 FTEs, from 83.28 to 87.23 FTEs, over
the FY 2016 Adopted Budget.
Programmatic changes for RM Administra-
tion include the following:
An increase of $307,000 for the addition
of 4.00 FTEs and related NPE to the
Workers’ Compensation (WC) Divi-
sion, including 1.00 Program Coordina-
tor, 1.00 WC Claims Aide, and 2.00
Claims Clerks. These additions will re-
duce the number of cases assigned to
each WC Claims Representative and
1 Fringe benefits are non-wage costs related to personnel, such as Workers’ Compensation, Long-Term Disability, the Actuarially Deter-
mined Contribution pension payment, Flexible Benefits, and Medicare.
Description FTE PE NPE Total Expense Revenue
FY 2016 Adopted Budget 83.28 7,960,986$ 2,597,892$ 10,558,878$ 10,558,878$
Workers' Compensation Support 4.00 296,966 10,000 306,966 -
Workers' Compensation Temporary Staffing - - (250,000) (250,000) -
Program Coordinator for Information Technology Support 1.00 112,088 2,500 114,588 -
Claims Representative 2 for Public Liability & Loss Recovery 1.00 82,477 2,500 84,977 -
Transfer: Employee Assistance Program to Human Resources (2.00) (233,543) (32,895) (266,438) -
Hourly Wages (0.05) (4,549) - (4,549) -
Other Fringe Increases - 249,022 - 249,022 -
Net Other Adjustments - (197,609) (54,170) (251,779) (29,569)
FY 2017 Proposed Budget 87.23 8,265,838$ 2,275,827$ 10,541,665$ 10,529,309$
Difference from 2016 to 2017 3.95 304,852$ (322,065)$ (17,213)$ (29,569)$
SUMMARY OF RISK MANAGEMENT FUND BUDGET CHANGES
Programmatic Changes
Other Changes
143
Department Review: Risk Management
Office of the Independent Budget Analyst
April 2017
keep the Division on track in avoiding
penalties by meeting State-mandated
deadlines. It will also allow the Division
to provide training and direction to the
WC Claims Aides and facilitate succes-
sion planning.
Note that $250,000 for temporary
Workers’ Compensation staffing in
FY 2016 has been removed from the
budget for FY 2017 (no associated
FTEs).
An increase of $115,000 for the addition
of 1.00 Program Coordinator and relat-
ed NPE to support long-term infor-
mation technology projects planned
over the next three to five years. Such
projects include the upgrade of the
Workers’ Compensation and Public Lia-
bility claims management systems into a
single platform that would also interface
with SAP and external vendors. An In-
formation Systems Analyst 3 position is
also available as part of the base budget
for assistance on these projects.
An increase of $85,000 for the addition
of 1.00 Claims Representative 2 and re-
lated NPE for the Public Liability and
Loss Recovery Division. This addition
will reduce the number of cases as-
signed to each Claims Representative
and keep the Division on track in meet-
ing deadlines mandated by the California
Government Code. It will also allow
other Claims Representatives to per-
form more field work investigations and
attend mediations, small claims courts,
evaluation hearings, and regular Deputy
City Attorneys’ meetings.
A decrease of $266,000, including 2.00
FTE and related NPE, for the transfer of
the Employee Assistance Program
(Program Manager and Counselor) to
the Human Resources Department.
Other budget changes include:
A decrease of 0.05 FTE in non-standard
hourly personnel—from 1.28 to 1.23
FTEs
A decrease of $192,000 in salaries and
wages to align the budget to anticipated
spending levels
Issues to Consider
Risk Management Administration oversees
the Public Liability, Workers’ Compensa-
tion, and Long-Term Disability Funds. Infor-
mation on these three funds is included in
this report, under Significant Citywide Is-
sues.
144
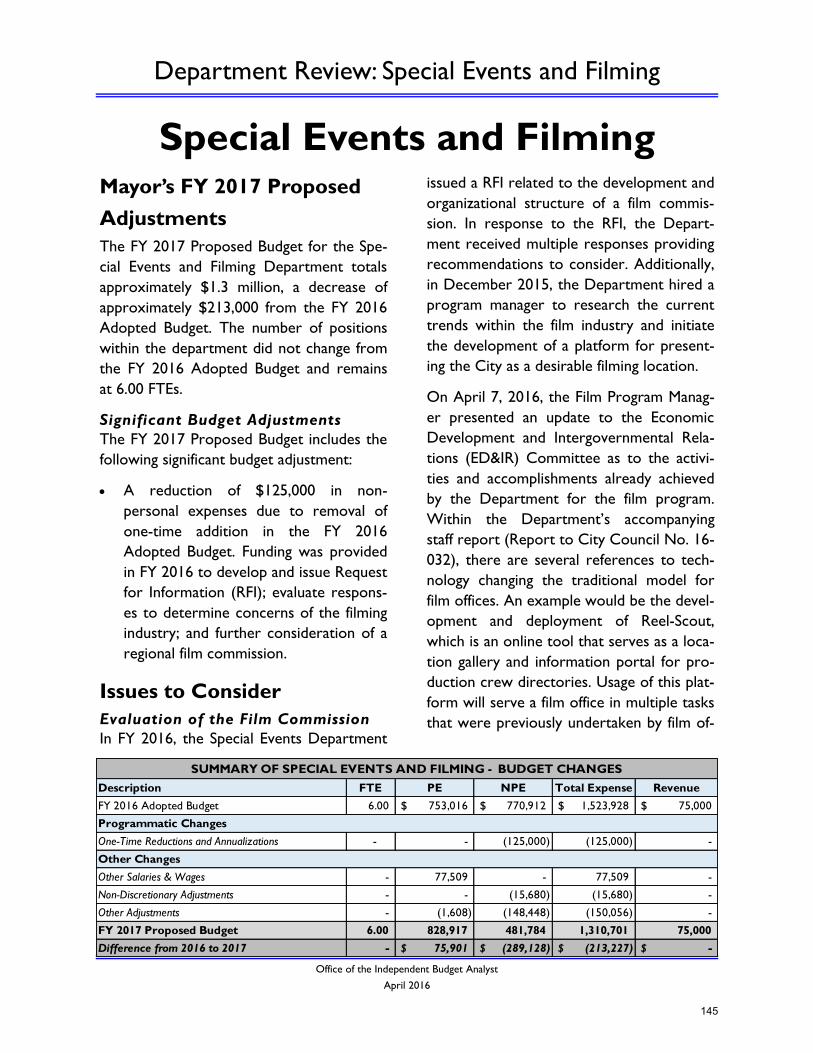
Department Review: Special Events and Filming
Office of the Independent Budget Analyst
April 2016
Special Events and Filming
Mayor’s FY 2017 Proposed
Adjustments
The FY 2017 Proposed Budget for the Spe-
cial Events and Filming Department totals
approximately $1.3 million, a decrease of
approximately $213,000 from the FY 2016
Adopted Budget. The number of positions
within the department did not change from
the FY 2016 Adopted Budget and remains
at 6.00 FTEs.
Significant Budget Adjustments
The FY 2017 Proposed Budget includes the
following significant budget adjustment:
A reduction of $125,000 in non-
personal expenses due to removal of
one-time addition in the FY 2016
Adopted Budget. Funding was provided
in FY 2016 to develop and issue Request
for Information (RFI); evaluate respons-
es to determine concerns of the filming
industry; and further consideration of a
regional film commission.
Issues to Consider
Evaluation of the Film Commission
In FY 2016, the Special Events Department
issued a RFI related to the development and
organizational structure of a film commis-
sion. In response to the RFI, the Depart-
ment received multiple responses providing
recommendations to consider. Additionally,
in December 2015, the Department hired a
program manager to research the current
trends within the film industry and initiate
the development of a platform for present-
ing the City as a desirable filming location.
On April 7, 2016, the Film Program Manag-
er presented an update to the Economic
Development and Intergovernmental Rela-
tions (ED&IR) Committee as to the activi-
ties and accomplishments already achieved
by the Department for the film program.
Within the Department’s accompanying
staff report (Report to City Council No. 16-
032), there are several references to tech-
nology changing the traditional model for
film offices. An example would be the devel-
opment and deployment of Reel-Scout,
which is an online tool that serves as a loca-
tion gallery and information portal for pro-
duction crew directories. Usage of this plat-
form will serve a film office in multiple tasks
that were previously undertaken by film of-
Description FTE PE NPE Total Expense Revenue
FY 2016 Adopted Budget 6.00 753,016$ 770,912$ 1,523,928$ 75,000$
One-Time Reductions and Annualizations - - (125,000) (125,000) -
Other Salaries & Wages - 77,509 - 77,509 -
Non-Discretionary Adjustments - - (15,680) (15,680) -
Other Adjustments - (1,608) (148,448) (150,056) -
FY 2017 Proposed Budget 6.00 828,917 481,784 1,310,701 75,000
Difference from 2016 to 2017 - 75,901$ (289,128)$ (213,227)$ -$
SUMMARY OF SPECIAL EVENTS AND FILMING - BUDGET CHANGES
Programmatic Changes
Other Changes
145
Department Review: Special Events and Filming
Office of the Independent Budget Analyst
April 2016
fice staff or contractors.
The FY 2017 Proposed Budget maintains an
allocation of $100,000 for non-personnel
expenses from the FY 2016 Adopted Budg-
et. In discussion with the Department, these
funds will be used to further develop the
scope and depth of the City’s website to
support the local film industry, advance an
advertising campaign, and support outreach
to the local film industry.
For the FY 2017 Proposed Budget, the De-
partment has not requested additional re-
sources as staff is working to evaluate the
evolution of the industry, assess the poten-
tial impacts and usages of technology, and
determine the most appropriate organiza-
tional structure for a film commission.
146
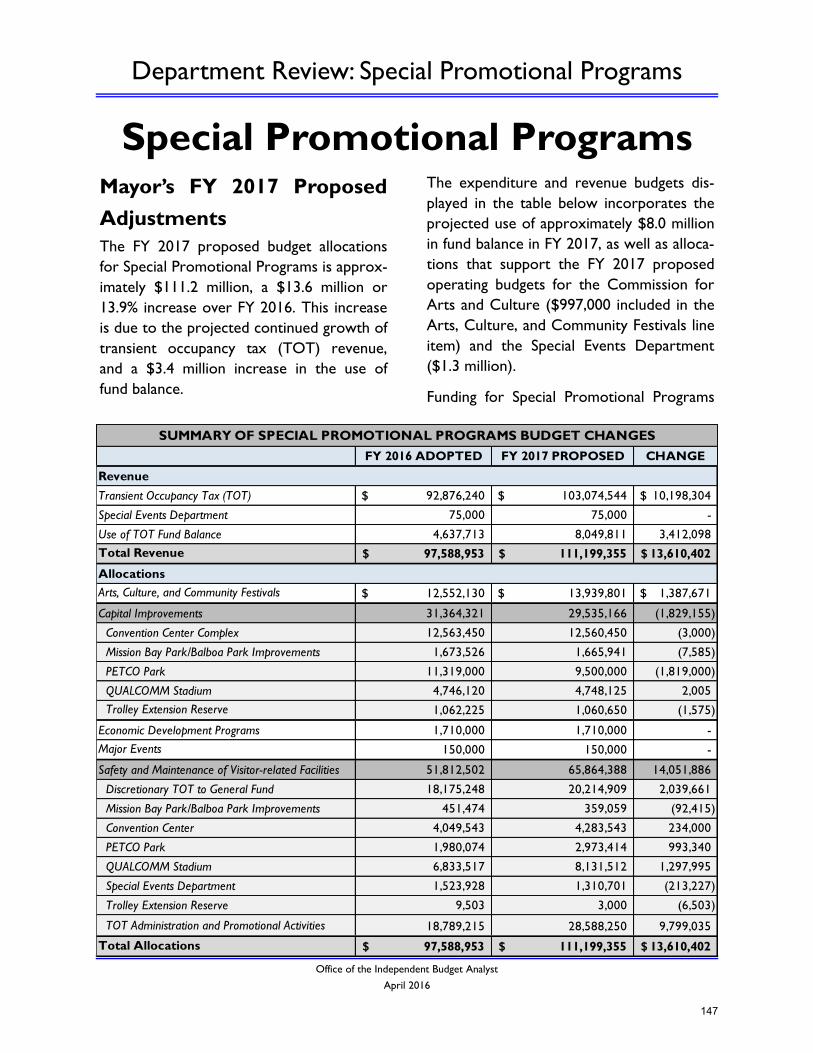
Department Review: Special Promotional Programs
Office of the Independent Budget Analyst
April 2016
Special Promotional Programs
Mayor’s FY 2017 Proposed
Adjustments
The FY 2017 proposed budget allocations
for Special Promotional Programs is approx-
imately $111.2 million, a $13.6 million or
13.9% increase over FY 2016. This increase
is due to the projected continued growth of
transient occupancy tax (TOT) revenue,
and a $3.4 million increase in the use of
fund balance.
The expenditure and revenue budgets dis-
played in the table below incorporates the
projected use of approximately $8.0 million
in fund balance in FY 2017, as well as alloca-
tions that support the FY 2017 proposed
operating budgets for the Commission for
Arts and Culture ($997,000 included in the
Arts, Culture, and Community Festivals line
item) and the Special Events Department
($1.3 million).
Funding for Special Promotional Programs
FY 2016 ADOPTED FY 2017 PROPOSED CHANGE
Transient Occupancy Tax (TOT) 92,876,240$ 103,074,544$ 10,198,304$
Special Events Department 75,000 75,000 -
Use of TOT Fund Balance 4,637,713 8,049,811 3,412,098
Total Revenue 97,588,953$ 111,199,355$ 13,610,402$
Arts, Culture, and Community Festivals 12,552,130$ 13,939,801$ 1,387,671$
Capital Improvements 31,364,321 29,535,166 (1,829,155)
Convention Center Complex 12,563,450 12,560,450 (3,000)
Mission Bay Park/Balboa Park Improvements 1,673,526 1,665,941 (7,585)
PETCO Park 11,319,000 9,500,000 (1,819,000)
QUALCOMM Stadium 4,746,120 4,748,125 2,005
Trolley Extension Reserve 1,062,225 1,060,650 (1,575)
Economic Development Programs 1,710,000 1,710,000 -
Major Events 150,000 150,000 -
Safety and Maintenance of Visitor-related Facilities 51,812,502 65,864,388 14,051,886
Discretionary TOT to General Fund 18,175,248 20,214,909 2,039,661
Mission Bay Park/Balboa Park Improvements 451,474 359,059 (92,415)
Convention Center 4,049,543 4,283,543 234,000
PETCO Park 1,980,074 2,973,414 993,340
QUALCOMM Stadium 6,833,517 8,131,512 1,297,995
Special Events Department 1,523,928 1,310,701 (213,227)
Trolley Extension Reserve 9,503 3,000 (6,503)
TOT Administration and Promotional Activities 18,789,215 28,588,250 9,799,035
Total Allocations 97,588,953$ 111,199,355$ 13,610,402$
SUMMARY OF SPECIAL PROMOTIONAL PROGRAMS BUDGET CHANGES
Revenue
Allocations
147
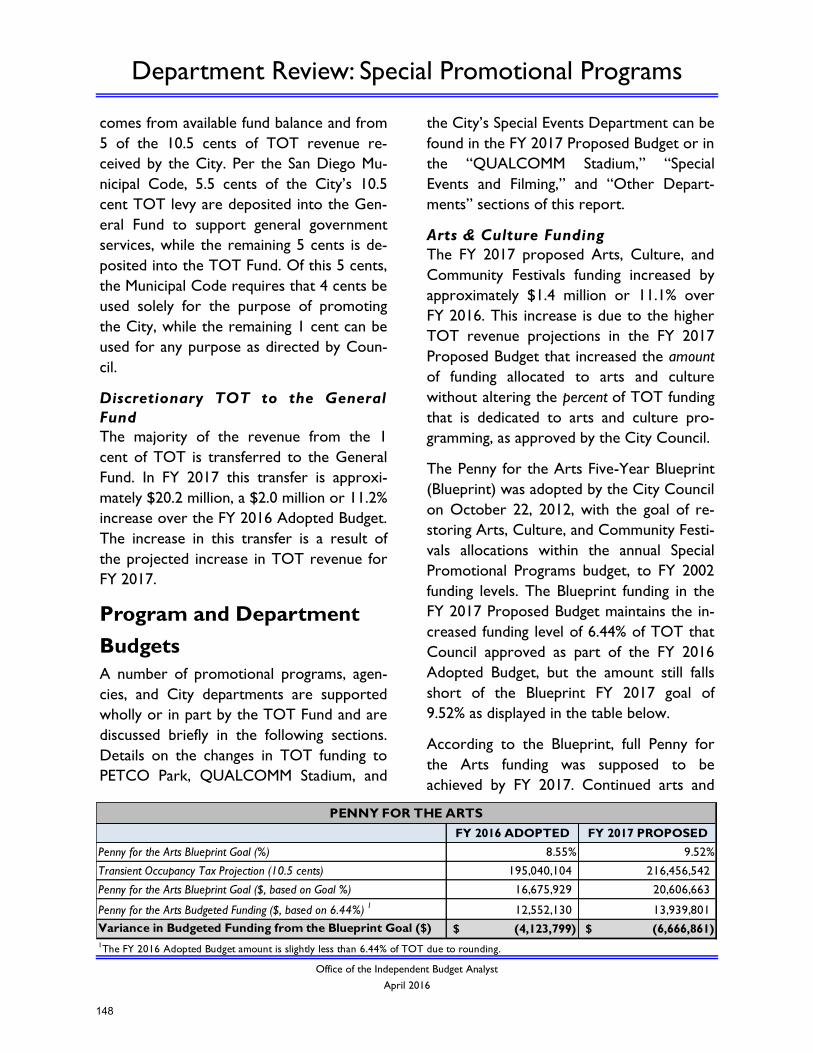
Department Review: Special Promotional Programs
Office of the Independent Budget Analyst
April 2016
comes from available fund balance and from
5 of the 10.5 cents of TOT revenue re-
ceived by the City. Per the San Diego Mu-
nicipal Code, 5.5 cents of the City’s 10.5
cent TOT levy are deposited into the Gen-
eral Fund to support general government
services, while the remaining 5 cents is de-
posited into the TOT Fund. Of this 5 cents,
the Municipal Code requires that 4 cents be
used solely for the purpose of promoting
the City, while the remaining 1 cent can be
used for any purpose as directed by Coun-
cil.
Discretionary TOT to the General
Fund
The majority of the revenue from the 1
cent of TOT is transferred to the General
Fund. In FY 2017 this transfer is approxi-
mately $20.2 million, a $2.0 million or 11.2%
increase over the FY 2016 Adopted Budget.
The increase in this transfer is a result of
the projected increase in TOT revenue for
FY 2017.
Program and Department
Budgets
A number of promotional programs, agen-
cies, and City departments are supported
wholly or in part by the TOT Fund and are
discussed briefly in the following sections.
Details on the changes in TOT funding to
PETCO Park, QUALCOMM Stadium, and
the City’s Special Events Department can be
found in the FY 2017 Proposed Budget or in
the “QUALCOMM Stadium,” “Special
Events and Filming,” and “Other Depart-
ments” sections of this report.
Arts & Culture Funding
The FY 2017 proposed Arts, Culture, and
Community Festivals funding increased by
approximately $1.4 million or 11.1% over
FY 2016. This increase is due to the higher
TOT revenue projections in the FY 2017
Proposed Budget that increased the amount
of funding allocated to arts and culture
without altering the percent of TOT funding
that is dedicated to arts and culture pro-
gramming, as approved by the City Council.
The Penny for the Arts Five-Year Blueprint
(Blueprint) was adopted by the City Council
on October 22, 2012, with the goal of re-
storing Arts, Culture, and Community Festi-
vals allocations within the annual Special
Promotional Programs budget, to FY 2002
funding levels. The Blueprint funding in the
FY 2017 Proposed Budget maintains the in-
creased funding level of 6.44% of TOT that
Council approved as part of the FY 2016
Adopted Budget, but the amount still falls
short of the Blueprint FY 2017 goal of
9.52% as displayed in the table below.
According to the Blueprint, full Penny for
the Arts funding was supposed to be
achieved by FY 2017. Continued arts and
FY 2016 ADOPTED FY 2017 PROPOSED
Penny for the Arts Blueprint Goal (%) 8.55% 9.52%
Transient Occupancy Tax Projection (10.5 cents) 195,040,104 216,456,542
Penny for the Arts Blueprint Goal ($, based on Goal %) 16,675,929 20,606,663
Penny for the Arts Budgeted Funding ($, based on 6.44%)1
12,552,130 13,939,801
Variance in Budgeted Funding from the Blueprint Goal ($) (4,123,799)$ (6,666,861)$
PENNY FOR THE ARTS
1The FY 2016 Adopted Budget amount is slightly less than 6.44% of TOT due to rounding.
148
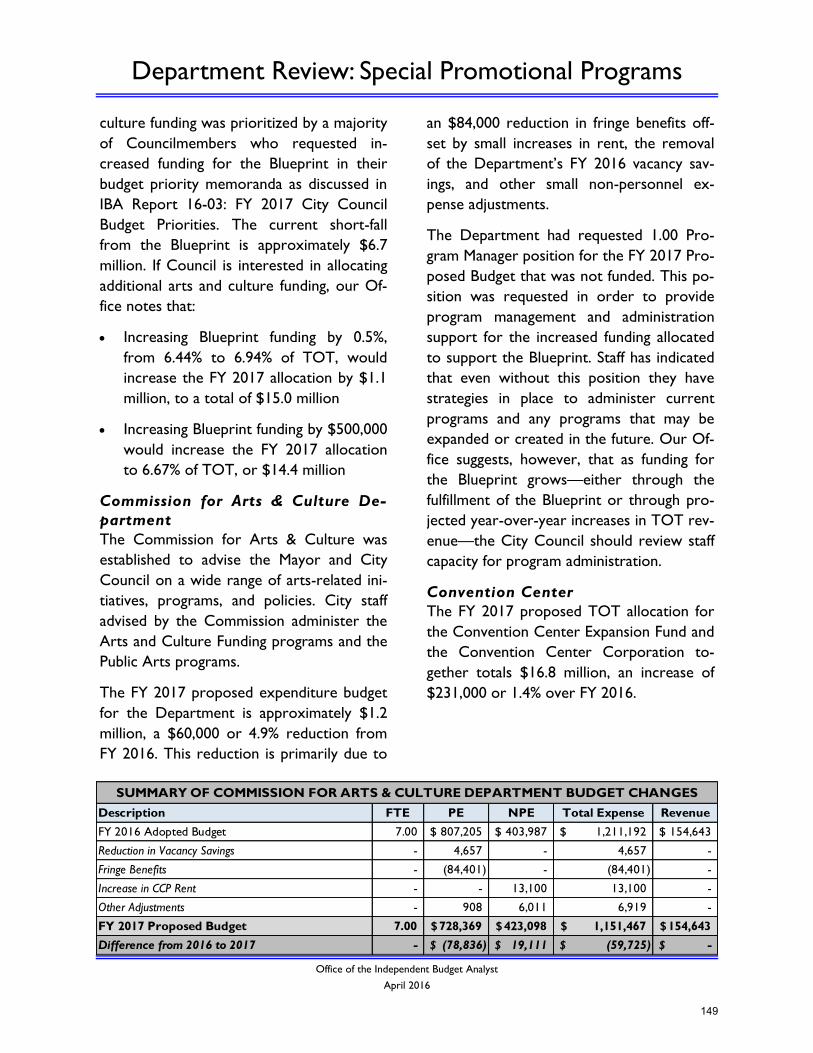
Department Review: Special Promotional Programs
Office of the Independent Budget Analyst
April 2016
culture funding was prioritized by a majority
of Councilmembers who requested in-
creased funding for the Blueprint in their
budget priority memoranda as discussed in
IBA Report 16-03: FY 2017 City Council
Budget Priorities. The current short-fall
from the Blueprint is approximately $6.7
million. If Council is interested in allocating
additional arts and culture funding, our Of-
fice notes that:
Increasing Blueprint funding by 0.5%,
from 6.44% to 6.94% of TOT, would
increase the FY 2017 allocation by $1.1
million, to a total of $15.0 million
Increasing Blueprint funding by $500,000
would increase the FY 2017 allocation
to 6.67% of TOT, or $14.4 million
Commission for Arts & Culture De-
partment
The Commission for Arts & Culture was
established to advise the Mayor and City
Council on a wide range of arts-related ini-
tiatives, programs, and policies. City staff
advised by the Commission administer the
Arts and Culture Funding programs and the
Public Arts programs.
The FY 2017 proposed expenditure budget
for the Department is approximately $1.2
million, a $60,000 or 4.9% reduction from
FY 2016. This reduction is primarily due to
an $84,000 reduction in fringe benefits off-
set by small increases in rent, the removal
of the Department’s FY 2016 vacancy sav-
ings, and other small non-personnel ex-
pense adjustments.
The Department had requested 1.00 Pro-
gram Manager position for the FY 2017 Pro-
posed Budget that was not funded. This po-
sition was requested in order to provide
program management and administration
support for the increased funding allocated
to support the Blueprint. Staff has indicated
that even without this position they have
strategies in place to administer current
programs and any programs that may be
expanded or created in the future. Our Of-
fice suggests, however, that as funding for
the Blueprint grows—either through the
fulfillment of the Blueprint or through pro-
jected year-over-year increases in TOT rev-
enue—the City Council should review staff
capacity for program administration.
Convention Center
The FY 2017 proposed TOT allocation for
the Convention Center Expansion Fund and
the Convention Center Corporation to-
gether totals $16.8 million, an increase of
$231,000 or 1.4% over FY 2016.
Description FTE PE NPE Total Expense Revenue
FY 2016 Adopted Budget 7.00 807,205$ 403,987$ 1,211,192$ 154,643$
Reduction in Vacancy Savings - 4,657 - 4,657 -
Fringe Benefits - (84,401) - (84,401) -
Increase in CCP Rent - - 13,100 13,100 -
Other Adjustments - 908 6,011 6,919 -
FY 2017 Proposed Budget 7.00 728,369$ 423,098$ 1,151,467$ 154,643$
Difference from 2016 to 2017 - (78,836)$ 19,111$ (59,725)$ -$
SUMMARY OF COMMISSION FOR ARTS & CULTURE DEPARTMENT BUDGET CHANGES
149
Department Review: Special Promotional Programs
Office of the Independent Budget Analyst
April 2016
Mission Bay Park/Balboa Park Im-
provements Fund (Improvements
Fund)
The Improvements Fund budget includes
debt service payments (Capital Improve-
ments line item), maintenance of the Balboa
Park tram, and other small miscellaneous
costs (Safety and Maintenance of Visitor-
related Facilities line item). In the FY 2017
Proposed Budget, the Improvements Fund
totals approximately $2.0 million, a de-
crease of $100,000 from FY 2016 due to
the projected use of fund balance in FY
2017.
TOT Administration and Promotion-
al Activities
A portion of the TOT 4 cent allocation is
allocated to the General Fund to support
promotional activities such as the mainte-
nance of parks and facilities in areas fre-
quently visited by tourists, in compliance
with the Municipal Code requirement for
promotional funding. The FY 2017 alloca-
tion for Administration and Promotional
Activities is approximately $28.6 million, a
$9.8 million or 52.2% increase over FY 2016
due to the projected increase in the City’s
TOT revenue, and the use of TOT Fund
balance.
150
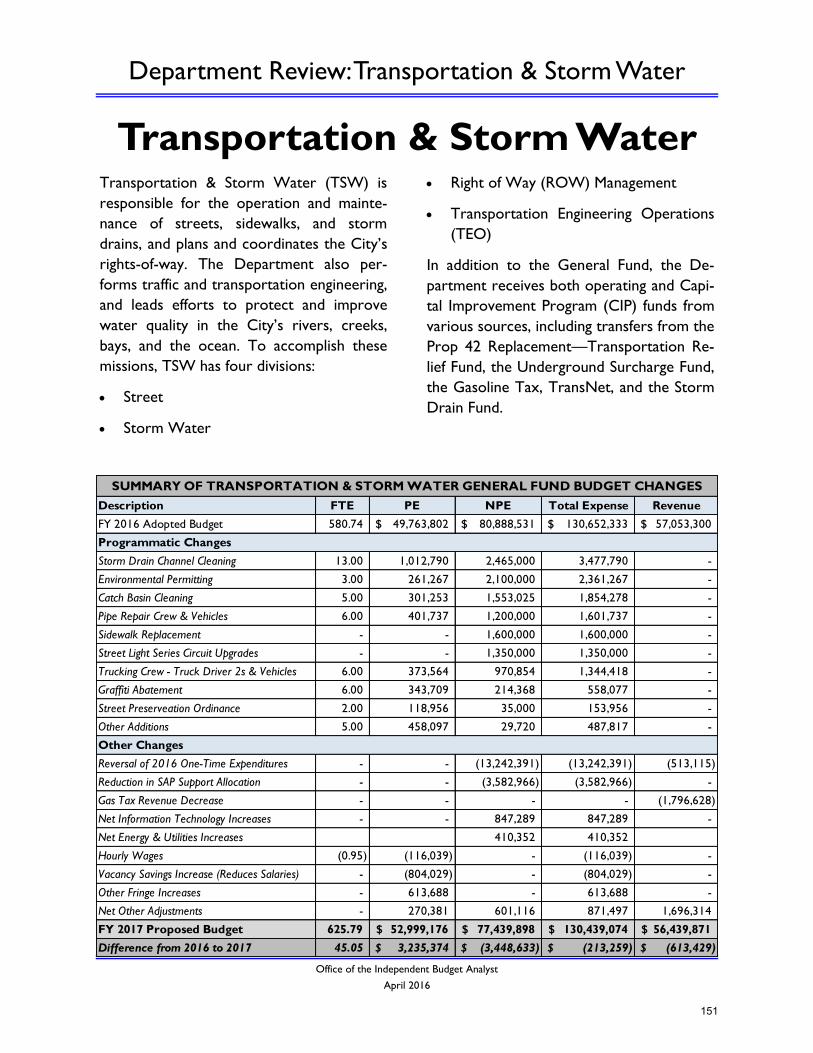
Department Review: Transportation & Storm Water
Office of the Independent Budget Analyst
April 2016
Transportation & Storm Water Transportation & Storm Water (TSW) is
responsible for the operation and mainte-
nance of streets, sidewalks, and storm
drains, and plans and coordinates the City’s
rights-of-way. The Department also per-
forms traffic and transportation engineering,
and leads efforts to protect and improve
water quality in the City’s rivers, creeks,
bays, and the ocean. To accomplish these
missions, TSW has four divisions:
Street
Storm Water
Right of Way (ROW) Management
Transportation Engineering Operations
(TEO)
In addition to the General Fund, the De-
partment receives both operating and Capi-
tal Improvement Program (CIP) funds from
various sources, including transfers from the
Prop 42 Replacement—Transportation Re-
lief Fund, the Underground Surcharge Fund,
the Gasoline Tax, TransNet, and the Storm
Drain Fund.
Description FTE PE NPE Total Expense Revenue
FY 2016 Adopted Budget 580.74 49,763,802$ 80,888,531$ 130,652,333$ 57,053,300$
Storm Drain Channel Cleaning 13.00 1,012,790 2,465,000 3,477,790 -
Environmental Permitting 3.00 261,267 2,100,000 2,361,267 -
Catch Basin Cleaning 5.00 301,253 1,553,025 1,854,278 -
Pipe Repair Crew & Vehicles 6.00 401,737 1,200,000 1,601,737 -
Sidewalk Replacement - - 1,600,000 1,600,000 -
Street Light Series Circuit Upgrades - - 1,350,000 1,350,000 -
Trucking Crew - Truck Driver 2s & Vehicles 6.00 373,564 970,854 1,344,418 -
Graffiti Abatement 6.00 343,709 214,368 558,077 -
Street Preserveation Ordinance 2.00 118,956 35,000 153,956 -
Other Additions 5.00 458,097 29,720 487,817 -
Reversal of 2016 One-Time Expenditures - - (13,242,391) (13,242,391) (513,115)
Reduction in SAP Support Allocation - - (3,582,966) (3,582,966) -
Gas Tax Revenue Decrease - - - - (1,796,628)
Net Information Technology Increases - - 847,289 847,289 -
Net Energy & Utilities Increases 410,352 410,352
Hourly Wages (0.95) (116,039) - (116,039) -
Vacancy Savings Increase (Reduces Salaries) - (804,029) - (804,029) -
Other Fringe Increases - 613,688 - 613,688 -
Net Other Adjustments - 270,381 601,116 871,497 1,696,314
FY 2017 Proposed Budget 625.79 52,999,176$ 77,439,898$ 130,439,074$ 56,439,871$
Difference from 2016 to 2017 45.05 3,235,374$ (3,448,633)$ (213,259)$ (613,429)$
SUMMARY OF TRANSPORTATION & STORM WATER GENERAL FUND BUDGET CHANGES
Programmatic Changes
Other Changes
151
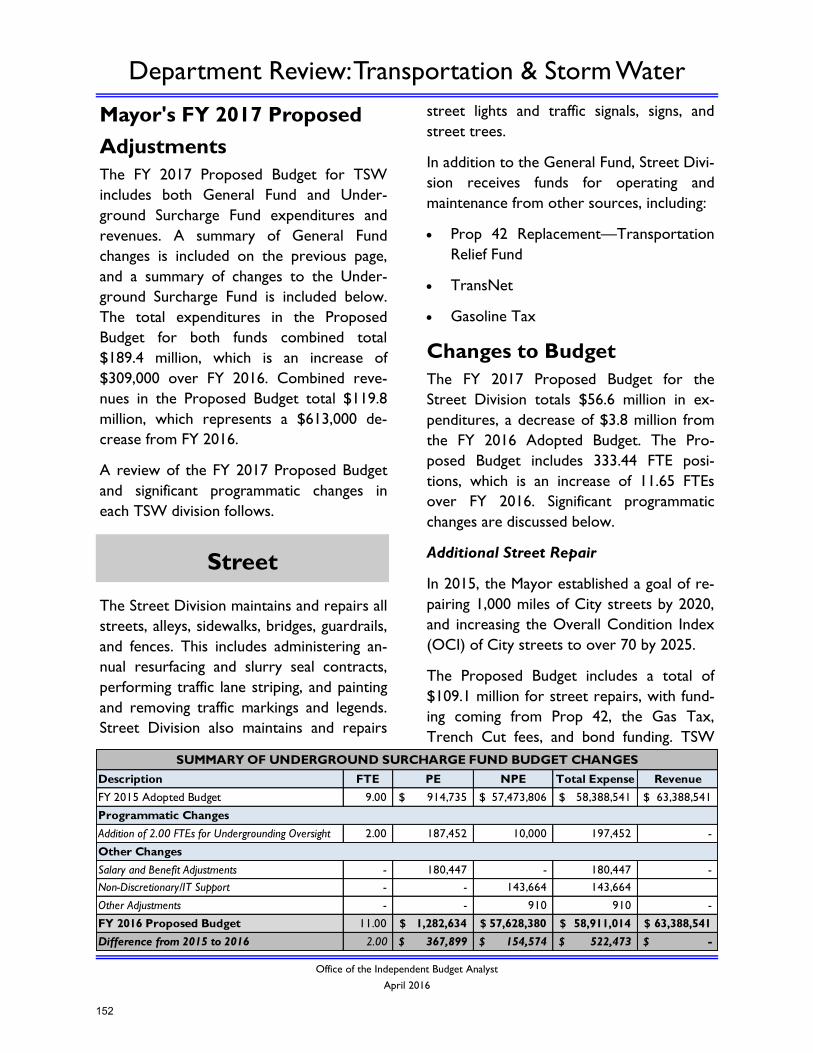
Department Review: Transportation & Storm Water
Office of the Independent Budget Analyst
April 2016
Mayor's FY 2017 Proposed
Adjustments
The FY 2017 Proposed Budget for TSW
includes both General Fund and Under-
ground Surcharge Fund expenditures and
revenues. A summary of General Fund
changes is included on the previous page,
and a summary of changes to the Under-
ground Surcharge Fund is included below.
The total expenditures in the Proposed
Budget for both funds combined total
$189.4 million, which is an increase of
$309,000 over FY 2016. Combined reve-
nues in the Proposed Budget total $119.8
million, which represents a $613,000 de-
crease from FY 2016.
A review of the FY 2017 Proposed Budget
and significant programmatic changes in
each TSW division follows.
The Street Division maintains and repairs all
streets, alleys, sidewalks, bridges, guardrails,
and fences. This includes administering an-
nual resurfacing and slurry seal contracts,
performing traffic lane striping, and painting
and removing traffic markings and legends.
Street Division also maintains and repairs
street lights and traffic signals, signs, and
street trees.
In addition to the General Fund, Street Divi-
sion receives funds for operating and
maintenance from other sources, including:
Prop 42 Replacement—Transportation
Relief Fund
TransNet
Gasoline Tax
Changes to Budget
The FY 2017 Proposed Budget for the
Street Division totals $56.6 million in ex-
penditures, a decrease of $3.8 million from
the FY 2016 Adopted Budget. The Pro-
posed Budget includes 333.44 FTE posi-
tions, which is an increase of 11.65 FTEs
over FY 2016. Significant programmatic
changes are discussed below.
Additional Street Repair
In 2015, the Mayor established a goal of re-
pairing 1,000 miles of City streets by 2020,
and increasing the Overall Condition Index
(OCI) of City streets to over 70 by 2025.
The Proposed Budget includes a total of
$109.1 million for street repairs, with fund-
ing coming from Prop 42, the Gas Tax,
Trench Cut fees, and bond funding. TSW
Street
Description FTE PE NPE Total Expense Revenue
FY 2015 Adopted Budget 9.00 914,735$ 57,473,806$ 58,388,541$ 63,388,541$
Addition of 2.00 FTEs for Undergrounding Oversight 2.00 187,452 10,000 197,452 -
Salary and Benefit Adjustments - 180,447 - 180,447 -
Non-Discretionary/IT Support - - 143,664 143,664
Other Adjustments - - 910 910 -
FY 2016 Proposed Budget 11.00 1,282,634$ 57,628,380$ 58,911,014$ 63,388,541$
Difference from 2015 to 2016 2.00 367,899$ 154,574$ 522,473$ -$
SUMMARY OF UNDERGROUND SURCHARGE FUND BUDGET CHANGES
Programmatic Changes
Other Changes
152
Department Review: Transportation & Storm Water
Office of the Independent Budget Analyst
April 2016
anticipates making repairs to 308 miles of
streets in FY 2017.
Of the $109.1 million in funding, $21.1 mil-
lion is planned for slurry seal of streets,
$82.4 million for asphalt overlay, and $5.6
for concrete streets.
Actual locations of street repairs are being
determined in conjunction with the Street
Condition Assessment, which is expected
to be released in May, 2016.
Sidewalk Repairs
The Proposed Budget includes $2.0 million
for sidewalk repairs, which includes a $1.6
million addition over the base budget. An
additional $1.7 million is budgeted for instal-
lation of new sidewalks.
In 2015 TSW completed a condition assess-
ment for all City sidewalks that identified
$46.4 million in repairs and replacement
needed to bring all City sidewalks up to
good condition. That assessment also iden-
tified 620 miles of areas where sidewalks do
not exist.
The funding identified above will be used for
major sidewalk repairs and new installations
of sidewalks; a list of actual locations for
repairs and installations is still being devel-
oped.
Streetlight Installation and Replacement
The Proposed Budget includes $1.4 million
for upgrading one circuit of old street-lights
from a series circuit to a parallel circuit. At
present, there are roughly 30 locations
where series circuit street lights are used in
the City; these locations are largely in older
neighborhoods. Due to the structure of
these circuits, any single light going out on a
circuit results in all lights on that circuit go-
ing out.
Upgrading these circuits to parallel circuits
will allow street lights on the same circuit
to continue to function even if other lights
on that same circuit are out.
Graffiti Abatement Program
The Proposed Budget for Street Division
includes the addition of 6.00 NPEs and
$558,000 of expenses to support the De-
partment’s Graffiti Abatement program.
The Department began implementation of
this program in FY 2015, and added staff
and resources to support the program in FY
2016 as well.
Graffiti abatement work on public property
is done by City employees, and abatement
work done on private property is contract-
ed out to Urban Corps.
Street Preservation Ordinance
The Proposed Budget includes 2.00 FTEs
and $154,000 of expenditures in support of
the street preservation ordinance. The De-
partment indicates that these positions will
assist with compliance and fee collection for
the program.
The Storm Water Division leads the City’s
efforts to protect and improve water quality
in the City’s waterways and water bodies.
The Division’s efforts are focused on ensur-
ing compliance with the Municipal Storm
Water Permit and other surface water qual-
ity regulations issued by governing bodies,
as well as engaging in flood risk management
activities.
Storm Water
153
Department Review: Transportation & Storm Water
Office of the Independent Budget Analyst
April 2016
In May 2013, the new Municipal Water Per-
mit (permit) was adopted by the San Diego
Regional Water Quality Control Board
(Regional Board). This permit mandates
more stringent regulations which require a
significant increase in municipal spending
over the next several decades to ensure
compliance with the permit.
In FY 2014, the Department prepared a
Watershed Asset Management Plan
(WAMP), which incorporates both the
costs of permit compliance and flood risk
management activities. The WAMP is used
by the City as a planning tool to project
how much funding is necessary for compli-
ance, including costs associated with Total
Maximum Daily Loads (TMDLs), Areas of
Special Biological Significance (ASBS), up-
coming compliance deadlines, the deferred
capital backlog, and the Storm Water Divi-
sion’s operational activities. This WAMP is
updated periodically.
The most recent update to the WAMP pro-
jects compliance costs through FY 2040 as
totaling $3.1 billion. TSW staff proactively
works with environmental stakeholders and
the Regional Board to refine regulations and
decrease compliance costs. TSW staff has
been effective in achieving future compli-
ance cost reductions. The $3.1 billion cost
estimate identified above has been reduced
from $3.9 billion when the WAMP was ini-
tially prepared. Even with reductions, how-
ever, compliance costs will remain high. To
ensure long-term compliance with storm
water regulations, significant sources of ad-
ditional funding will be necessary in future
years.
Development of the Division’s FY 2017 Pro-
posed Budget was guided by the WAMP,
which identified $120.6 million in funding
needed for compliance. Actual funding in
the Proposed budget for the Storm Water
division totals only $60.6 million. Of this
$60.6 million amount, $30.8 million is pro-
posed for water quality efforts, and $29.8
million for flood risk management.
Changes to Budget
The FY 2017 Proposed Budget for the
Storm Water Division’s operating expendi-
tures totals $60.6 million, which is an in-
crease of $5.1 million over FY 2016. The
Proposed Budget includes 202.35 FTE posi-
tions, an increase of 29.40 FTEs over FY
2016. Significant programmatic changes are
discussed below.
Flood Risk Management
The Proposed Budget includes significant
additions related to channel clearing and
flood risk management. These additions in-
clude:
13.00 FTE positions and $3.5 million in
expenditures to support channel clean-
ing and maintenance
6.00 FTE positions and $1.6 million in
expenditures to support pipe repairs to
for flood risk management
3.00 FTE positions and $2.4 million in
expenditures to support environmental
permitting associated with flood risk
management
In FY 2016, the Division embarked on a sig-
nificant increase in channel-clearing efforts
in preparation for expected El Niño storm
events. Largely on an emergency basis, the
154
Department Review: Transportation & Storm Water
Office of the Independent Budget Analyst
April 2016
Division cleared 22 storm channels, and an
additional 6 are currently targeted for clear-
ing. Ongoing environmental remediation
costs for those emergency cleanings are still
being determined, and are not included in
the Proposed Budget..
Increases in the Proposed Budget are antici-
pated to allow TSW to clear six channels a
year on an ongoing annual basis, whereas
the department had previously been clear-
ing between two and three channels each
year.
Storm Water Permit Compliance
The Proposed Budget includes the addition
of 5.00 FTE positions and $1.9 million to
increase catch-basin cleanings, as part of
improving storm water quality.
As noted previously, TSW staff continues to
work with the Regional Board to refine and
amend regulatory requirements. Compli-
ance deadlines for storm water quality regu-
lations begin in October 2017 for the Chol-
las Creek Metals TMDL, and then in winter
of 2018 for the Bacteria TMDL.
Transportation Engineering Operations
(TEO) serves as the asset manager of the
City’s roadway infrastructure within the
public right of way. These responsibilities
include performing operational functions for
the City’s transportation systems and plan-
ning and programming CIP projects.
Changes to Budget
The FY 2017 Proposed Budget for TEO in-
cludes $9.0 million in expenditures, a de-
crease of $2.7 million from FY 2016. The
Proposed Budget includes 70.00 FTE posi-
tions in the division, which is the same num-
ber of FTEs that was included in FY 2016.
Reductions in expenditures are largely due
to the removal of one-time expenditures
and non-discretionary adjustments.
Vision Zero Support
The Proposed Budget for the TEO Division
budget includes $2.3 million and 20.50 FTE
positions to support the Vision Zero plan
for pedestrian and bicycle safety efforts.
Support for Vision Zero was included in a
majority of Council Budget Priority Memos.
The ROW Management Division of TSW is
responsible for right-of-way planning, con-
trol, and coordination between City depart-
ments, franchise utilities, developers, and
other private entities that perform work in
the public right-of-way. The Division also
plans and manages the Utilities Under-
grounding Program, which is funded
through the Underground Surcharge Fund.
Changes to Budget
The FY 2017 Proposed Budget for ROW
Management includes $4.3 million in Gen-
eral Fund expenditures, an increase of $1.3
million over the FY 2016 Adopted Budget.
Underground Surcharge expenditures in the
Proposed Budget total $58.9 million, repre-
senting a $522,000 increase over FY 2016.
Revenues in the Underground Surcharge
ROW Management
Transportation
Engineering Operations
155
Department Review: Transportation & Storm Water
Office of the Independent Budget Analyst
April 2016
Fund remain unchanged at $63.4 million.
The ROW Management Division includes
31.00 FTE positions (11.00 of which are
funded through the Underground Surcharge
Fund), which is an increase of 6.00 FTE po-
sitions over FY 2016.
The Division estimates undergrounding 15
miles of overhead utilities in FY 2017, which
is the same number of miles it expects to
underground in FY 2016.
156
Department Review: Other Departments
Office of the Independent Budget Analyst
April 2016
Other Departments
The FY 2017 Proposed Budget for the Air-
ports Division is approximately $5.1 million,
a decrease of approximately $220,000 from
the FY 2016 Adopted Budget. Fund reve-
nues are budgeted at $5.0 million, an in-
crease of approximately $140,000 from FY
2016.
Significant adjustments include:
An increase of $425,000 for structural
repairs of the Montgomery and Brown
Field terminals
An increase of $150,000 for an as-
needed agreement with Atkins North
America, Inc. to provide general airport
consultant services
An addition of 2.00 FTE positions and
$138,000 to provide safety and opera-
tional support to the Airports Division
An addition of 1.00 FTE and $87,000 to
conduct State and Federal mandated
environmental studies
A decrease of $500,000 in maintenance,
repair, and security expenditures
A $650,000 reduction in expenditures
associated with one-time adjustments in
FY 2016
The FY 2017 Proposed Budget for the Eth-
ics Commission is approximately $1.2 mil-
lion, an increase of $133,000 or 12.7% over
the FY 2016 Adopted Budget. This change is
almost entirely due to an increase of
$139,000 in fringe benefits and a modest
net increase in non-personnel costs, mitigat-
ed by a reduction of almost $9,000 in per-
sonnel costs.
The FY 2017 Proposed Budget includes ex-
penditures for the Infrastructure/Public
Works Branch of approximately $989,000,
a decrease of $117,000 or 10.6% from the
FY 2016 Adopted Budget. This decrease is
almost entirely due to a $115,000 reduction
in the Branch’s fringe benefits budget.
The Branch’s FY 2017 projected revenues
are $139,000, a reduction of $71,000 or
33.9% from the FY 2016 Adopted Budget.
This decrease is wholly due to a reduction
in labor reimbursement related to the
City’s SAP I AM project.
The FY 2017 Proposed Budget includes ex-
penditures for the Neighborhood Services
Branch of approximately $980,000, an in-
crease of $123,000 or 14.4% over the FY
2016 Adopted Budget. This increase is due
to the addition of 1.00 Administrative Aide
2 to support boards and commissions as
discussed in the following section, as well as
smaller increases in the Branch’s fringe, in-
formation technology (IT), and non-
discretionary budgets.
Airports
Ethics Commission
Neighborhood Services
Infrastructure/
Public Works
157
Department Review: Other Departments
Office of the Independent Budget Analyst
April 2016
Citizens’ Review Board on Police
Practices
The FY 2017 Proposed Budget includes the
addition of 1.00 Administrative Aide 2 and
$66,000 in personnel expenditures to sup-
port the Neighborhood Services Branch.
The Deputy Chief Operating Officer for
Neighborhood Services has indicated that
the added position will provide assistance to
the three boards and commissions within
the Branch, including support specifically for
the Citizens’ Review Board on Police Prac-
tices (CRB). An addition of $6,000 in new
information technology expenditures has
also been added to the Proposed Budget in
support of the CRB.
It is worth noting that a significant number
of Councilmember Budget Priority Memo-
randa requested funding for additional staff-
ing or contractual support for the CRB, ei-
ther in the form of independent investiga-
tors or outside counsel. Funding for these
items was not included in the FY 2017 Pro-
posed Budget. The issue of outside counsel
for the CRB has been discussed recently at
the Public Safety & Livable Neighborhoods
Committee and the Rules Committee as
part of the consideration of a broader po-
tential ballot measure proposal regarding
the CRB. At both committee hearings, a
motion was passed unanimously that rec-
ommended that the Mayor include funding
in FY 2017 for independent outside counsel
for the CRB. Our office recommends that
funding for this purpose be added to the
Neighborhood Services Branch budget in
the May Revision at a level deemed ap-
propriate by the CRB.
The FY 2017 Proposed Budget for the Of-
fice of the Chief Financial Officer (CFO) in-
cludes approximately $586,000 in expendi-
tures, an increase of $5,000 or 0.9% over
the FY 2016 Adopted Budget. This increase
is mostly due to an increase of $13,000 in
the Office’s fringe benefits, that is mitigated
through reductions in non-discretionary and
IT allocations.
The Office of the CFO is comprised of 1.00
Chief Financial Officer and 1.00 Executive
Secretary positions. Office staffing remains
unchanged from the FY 2016 Adopted
Budget at 2.00 FTE positions.
The FY 2017 Proposed Budget for the Of-
fice of the Chief Operating Officer (COO)
includes approximately $1.1 million in ex-
penditures, an increase of $43,000 or 4.1%
over the FY 2016 Adopted Budget. This
change is primarily due to a $30,000 in-
crease in fringe benefits, a $5,000 addition
to the budget for professional training, and
increases to the Office’s IT budget and non-
discretionary allocations.
The Office of the COO is comprised of
5.35 FTE positions that support the Office
of the COO and the Docket Office. Office
staffing remains unchanged from the FY
2016 Adopted Budget.
The FY 2017 Proposed Budget for the Of-
Office of the CFO
Office of the COO
Office of
Homeland Security
158
Department Review: Other Departments
Office of the Independent Budget Analyst
April 2016
Office of the IBA
fice of Homeland Security (OHS) is $2.7
million, an increase of approximately
$347,000 over the FY 2016 Adopted Budg-
et. The FY 2017 Proposed Budget results in
a net increase of 1.65 FTE positions, due to
the addition of 3.00 FTE positions and the
reduction of 1.35 FTEs in non-standard
hour personnel funding, for a total of 18.05
FTE positions at OHS. The 3.00 FTEs added
in the FY 2017 Proposed Budget include
1.00 Supervising Management Analyst, 1.00
Associate Management Analyst, and 1.00
Administrative Aide 2 to support federal
grant management. All three positions are
fully funded by the federal Urban Area Secu-
rity Initiative (UASI) grant program.
The FY 2017 Proposed Budget for the Of-
fice of the Independent Budget Analyst
(IBA) is approximately $2.0 million in ex-
penditures, an increase of $128,000 or 7%
over the FY 2016 Adopted Budget. This
change is primarily due to an increase of
$74,000 in fringe benefits, $51,000 in sala-
ries and wages, and modest increases in in-
formation technology costs and the Office’s
non-discretionary allocations.
The Office of the IBA is comprised of 10.00
FTE positions. Office staffing remains un-
changed from the FY 2016 Adopted Budget.
The FY 2017 Proposed Budget for the PET-
CO Park Fund is $16.3 million, a decrease
of $23,000 from the FY 2016 Adopted
Budget. Significant expenditure increases
include $600,000 in expenses for Police De-
partment services during events, and
$81,000 related to the Joint Ballpark Oper-
ating Agreement. Net reductions of
$706,000 in debt service payments associat-
ed with refinanced ballpark bonds offset
these increases.
Revenue for the Fund is budgeted at $15.5
million, an increase of $250,000 over FY
2016.
PETCO Park
159
City Agencies
Office of the Independent Budget Analyst
April 2016
Budget Review for City Agencies The IBA will release a review of the Convention Center on May 2, 2016, ahead of its budget
hearing on May 4. Budget reviews for the San Diego Housing Commission, Civic San Diego/
Successor Agency, and the City Retirement System will be released on May 6, 2016, in antici-
pation of their budget hearings on May 10, 2016.
160
The Office of the Independent Budget Analyst
Office of the Independent Budget Analyst
April 2016