Embed Size (px)
Citation preview
Review of SUNY Oneonta Course Evaluation Form
Report and Recommendations from
The Committee on Instruction: Part I
March 16, 2009

Literature Review
Research Data
• One concern frequently expressed in published studies is the response rate
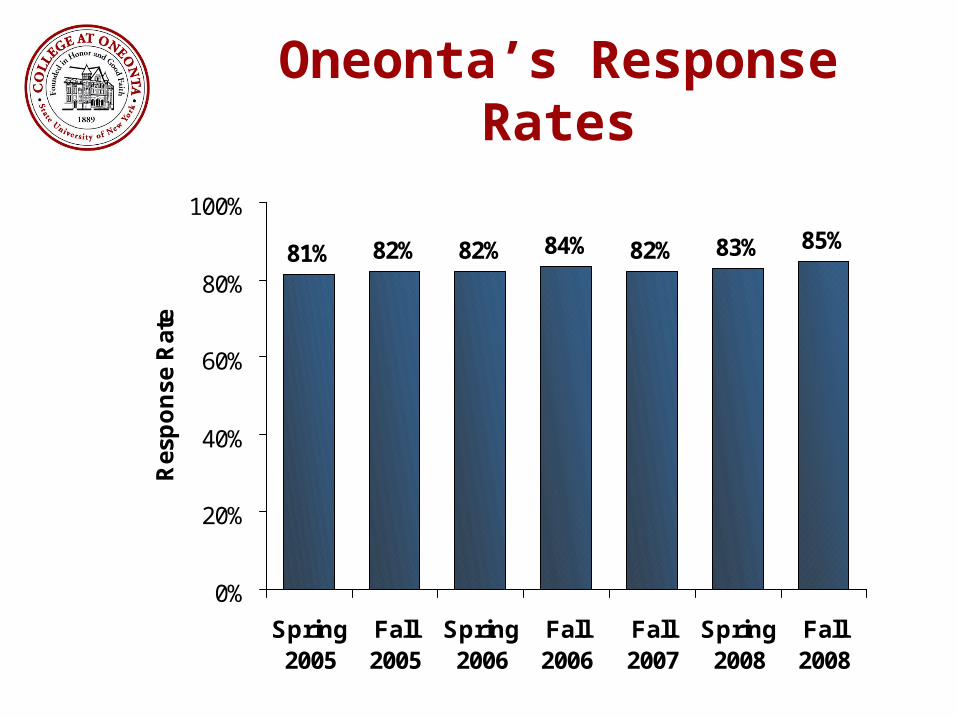
Oneonta’s Response Rates
81% 82% 82% 84% 82% 83% 85%
0%
20%
40%
60%
80%
100%
Spring2005
Fall2005
Spring2006
Fall2006
Fall2007
Spring2008
Fall2008
Res
po
nse
Rat
e

Layne et al. (1999)
61%
48%
0%
20%
40%
60%
80%
100%
Paper Evaluations(Enrollment = 1,246)
Electronic Evaluations(Enrollment = 1,207)
Res
po
nse
Rat
e
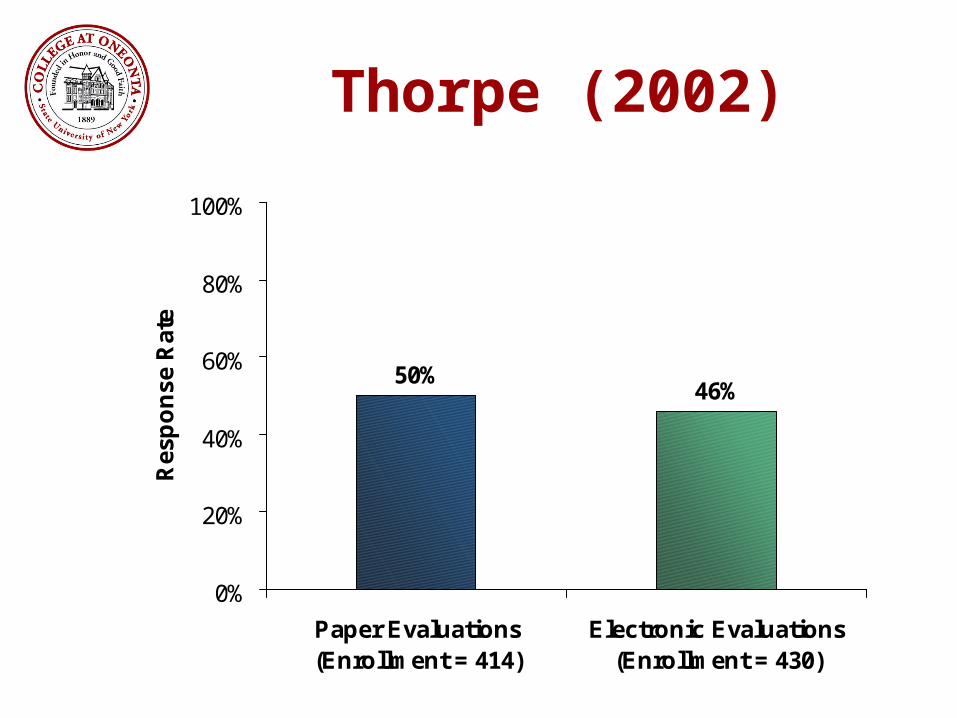
Thorpe (2002)
50%46%
0%
20%
40%
60%
80%
100%
Paper Evaluations(Enrollment = 414)
Electronic Evaluations(Enrollment = 430)
Res
po
nse
Rat
e

Dommeyer et al. (2003)
75%
43%
0%
20%
40%
60%
80%
100%
Paper Evaluations (withno incentives)
Electronic Evaluations(some with incentives)
Res
po
nse
Rat
e
Incentives for electronic evaluations (randomly assigned):
1) modest grade incentive
=> 87% response rate
2) in-class demonstration
=> 53% response rate
3) early grade notification
=> 51% response rate
4) no incentive
=> 29% response rate
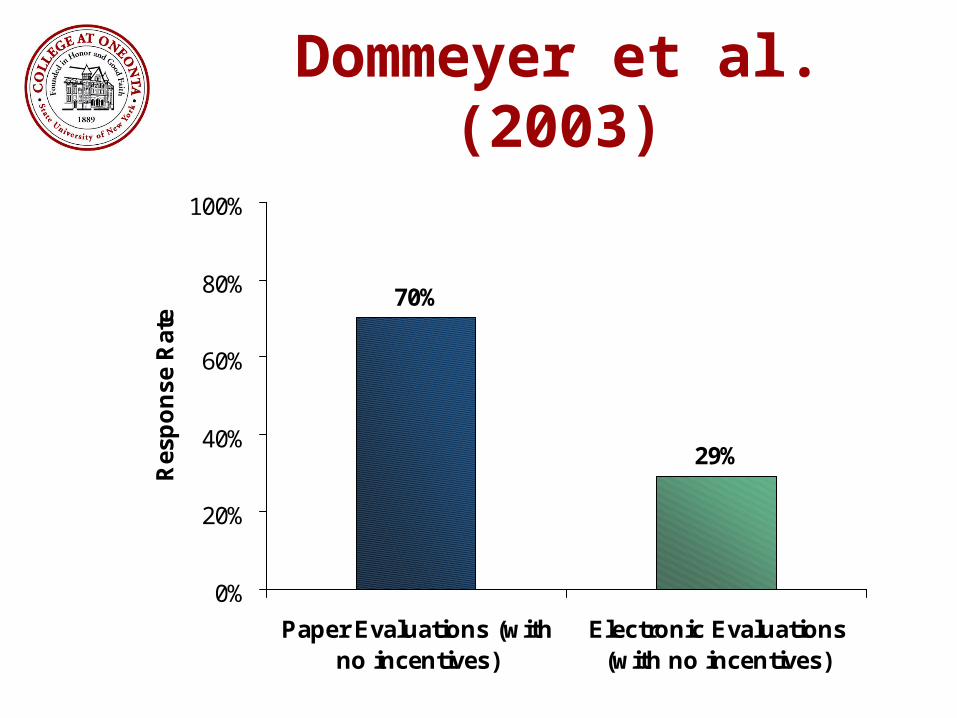
Dommeyer et al. (2003)
70%
29%
0%
20%
40%
60%
80%
100%
Paper Evaluations (withno incentives)
Electronic Evaluations(with no incentives)
Res
po
nse
Rat
e

Kulik (2005), Study 1
75% 74%
0%
20%
40%
60%
80%
100%
Paper Evaluations (18classes)
Electronic Evaluations(18 classes)
Res
po
nse
Rat
e
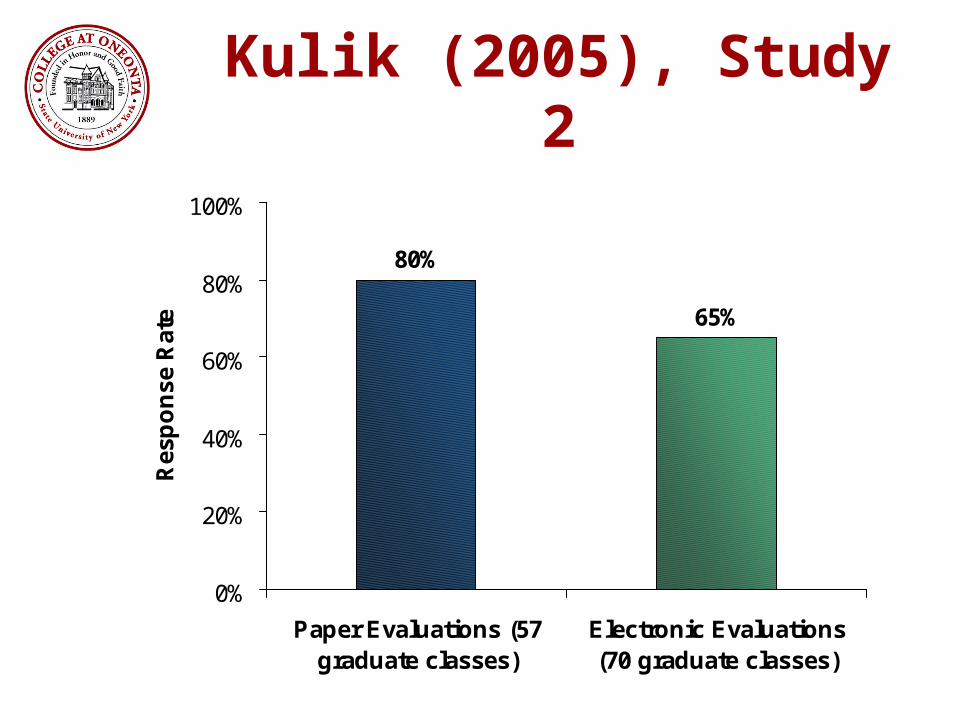
Kulik (2005), Study 2
80%
65%
0%
20%
40%
60%
80%
100%
Paper Evaluations (57graduate classes)
Electronic Evaluations(70 graduate classes)
Res
po
nse
Rat
e

Donovan et al. (2006)
83%76%
0%
20%
40%
60%
80%
100%
Paper Evaluations(Enrollment = 258)
Electronic Evaluations(Enrollment = 261)
Res
po
nse
Rat
e
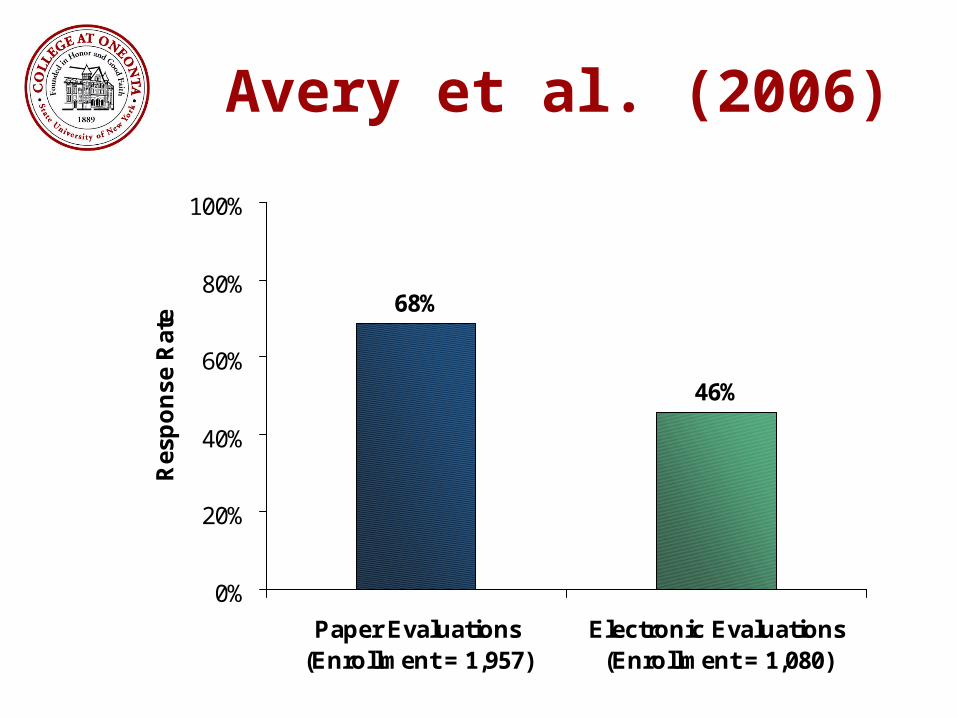
Avery et al. (2006)
68%
46%
0%
20%
40%
60%
80%
100%
Paper Evaluations(Enrollment = 1,957)
Electronic Evaluations(Enrollment = 1,080)
Res
po
nse
Rat
e

Heath et al. (2007)
82%
72%
0%
20%
40%
60%
80%
100%
Paper Evaluations(Enrollment = 162)
Electronic Evaluations(Enrollment = 180)
Res
po
nse
Rat
e
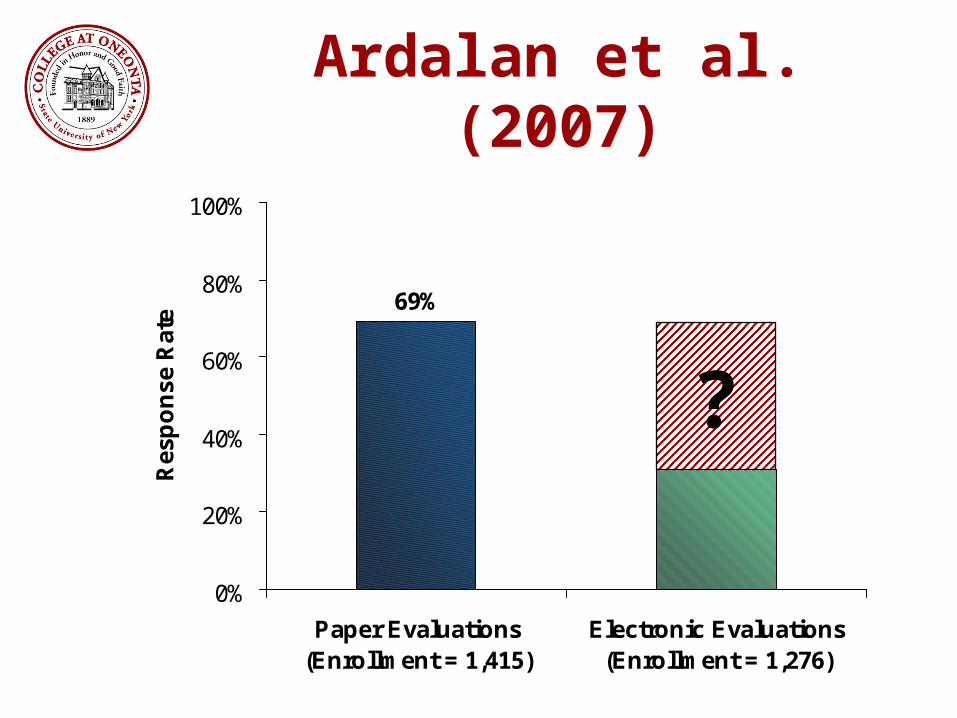
Ardalan et al. (2007)
69%
31%
0%
20%
40%
60%
80%
100%
Paper Evaluations(Enrollment = 1,415)
Electronic Evaluations(Enrollment = 1,276)
Res
po
nse
Rat
e
?

Whose voice is not heard?
Is there a non-response bias?

Richardson (2005)
“It is therefore reasonable to assume that students who respond to feedback questionnaires will be systematically different from those who do not respond in their attitudes and experience of higher education.”
(p. 406, emphasis added)

Layne et al. (1999)
• Statistically significant predictors of responding to electronic course evaluations:– GPA– class– subject area
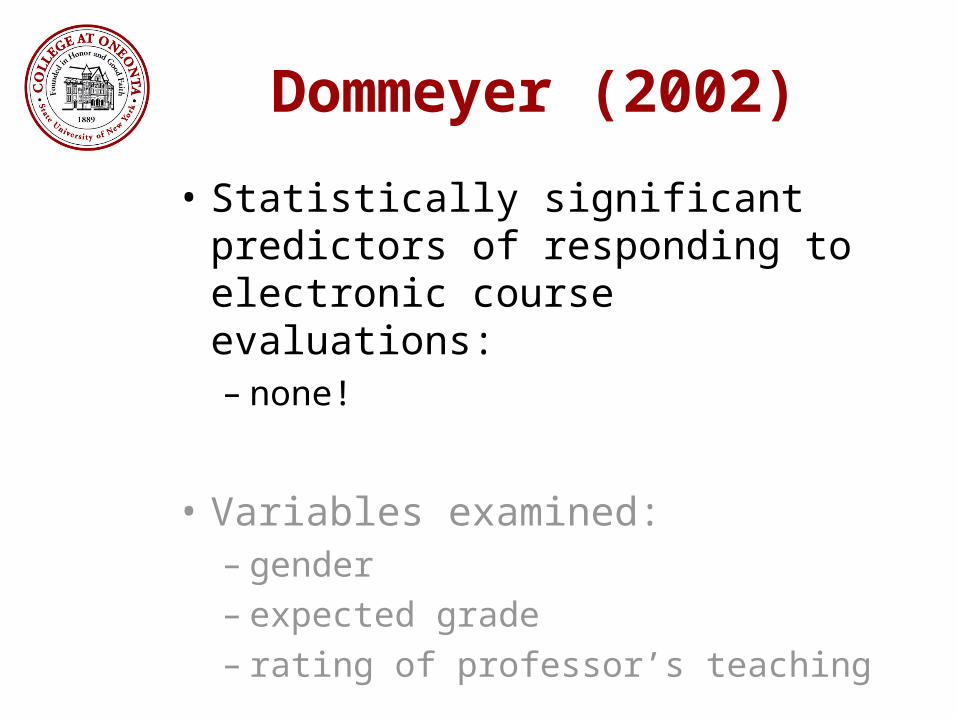
Dommeyer (2002)
• Statistically significant predictors of responding to electronic course evaluations:– none!
• Variables examined:– gender– expected grade– rating of professor’s teaching

Thorpe (2002)
• Statistically significant predictors of responding to electronic course evaluations:– final grade– gender– GPA
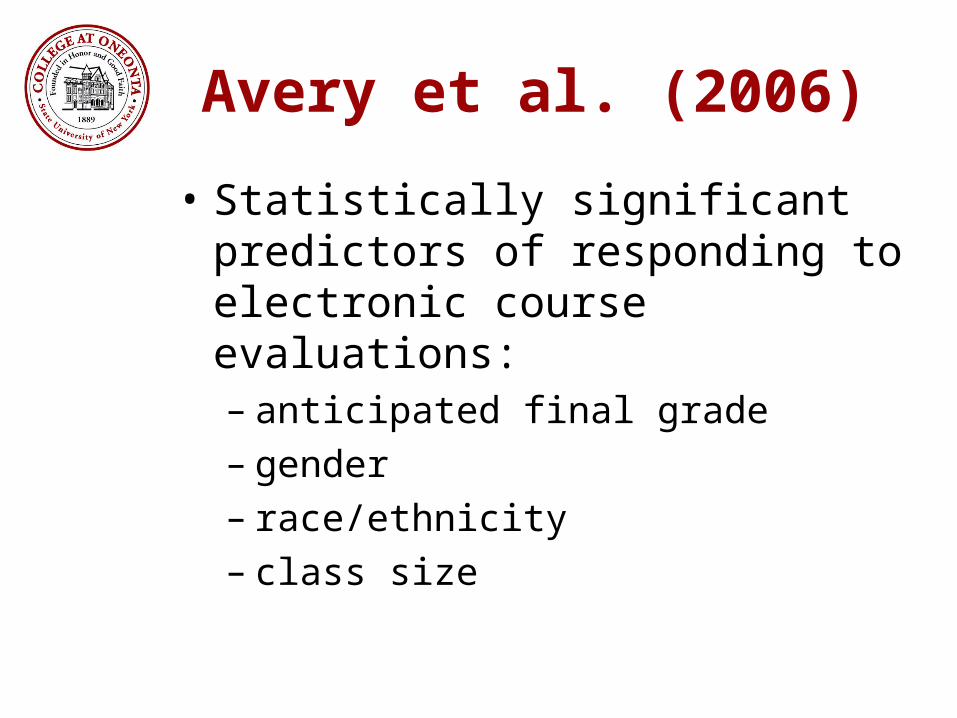
Avery et al. (2006)
• Statistically significant predictors of responding to electronic course evaluations:– anticipated final grade– gender– race/ethnicity– class size

Conclusion
• There is a fairly consistent, documented history of bias in response rates, resulting in some groups being under-represented

Are paper forms biased?
Perhaps, but the response rates are much higher, so whatever bias exists is not as
problematic as with electronic forms that yield much lower response rates

Are the averages different with fewer responses?
Does an electronic format result in higher or lower overall average ratings?

Conclusion
• Some studies show that electronic evaluations result in higher overall averages, some lower, and some not statistically different than paper-based forms
Responses fromSurvey of Teaching Faculty
February 4 - 13, 2009

Procedure
Wednesday, February 4:Survey opened; e-mail invitation sent to all teaching faculty
Monday, February 9:Reminder announcement in Senate
Wednesday, February 11:E-mail sent to all department chairs
Friday, February 13:Survey closed
Survey Responses
• Number of respondents: 178

Respondents’ Division
Behavioral and Applied Science, 45%
Science and Social
Science, 55%
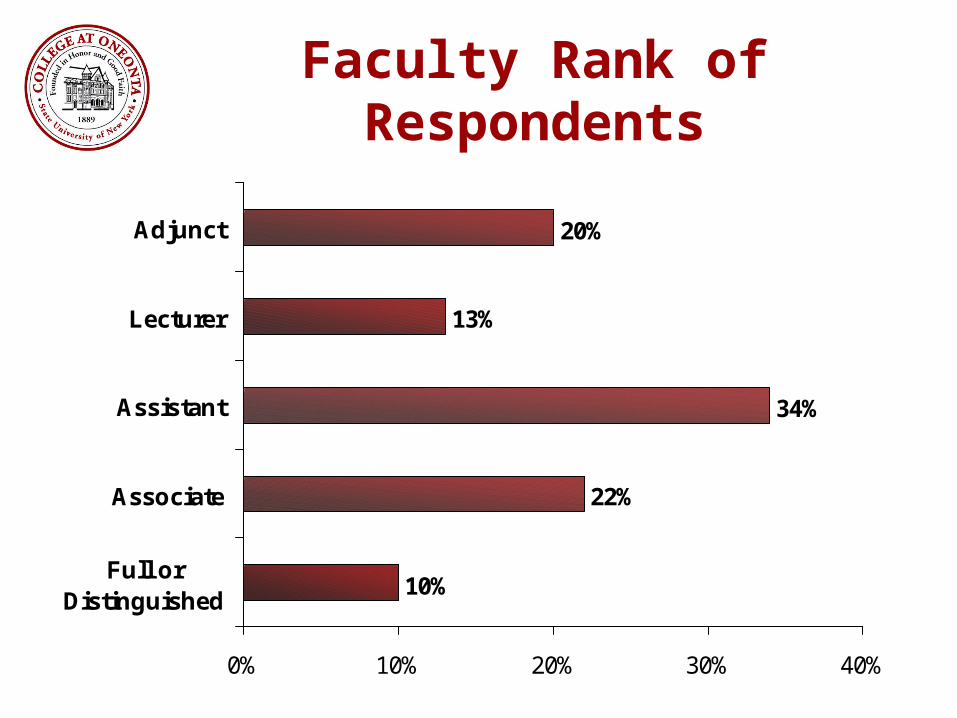
Faculty Rank of Respondents
10%
22%
34%
13%
20%
0% 10% 20% 30% 40%
Full orDistinguished
Associate
Assistant
Lecturer
Adjunct
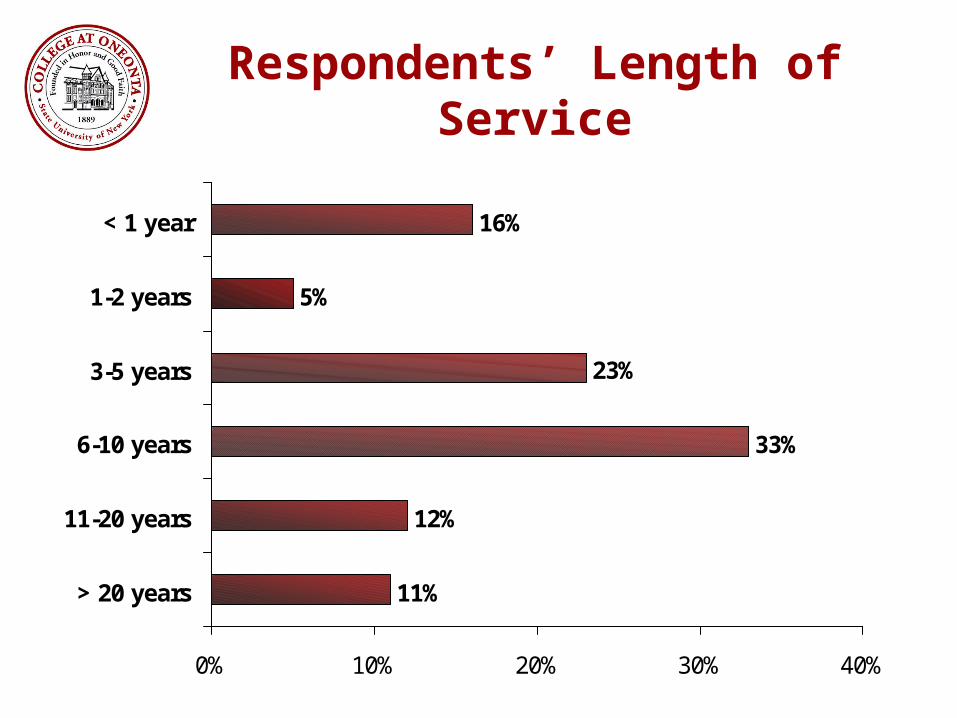
Respondents’ Length of Service
11%
12%
33%
23%
5%
16%
0% 10% 20% 30% 40%
> 20 years
11-20 years
6-10 years
3-5 years
1-2 years
< 1 year

1. Are you in favor or opposed to the College conducting all course evaluations online?
35%
49%
15%
0%
10%
20%
30%
40%
50%
60%
In Favor Opposed No Preference
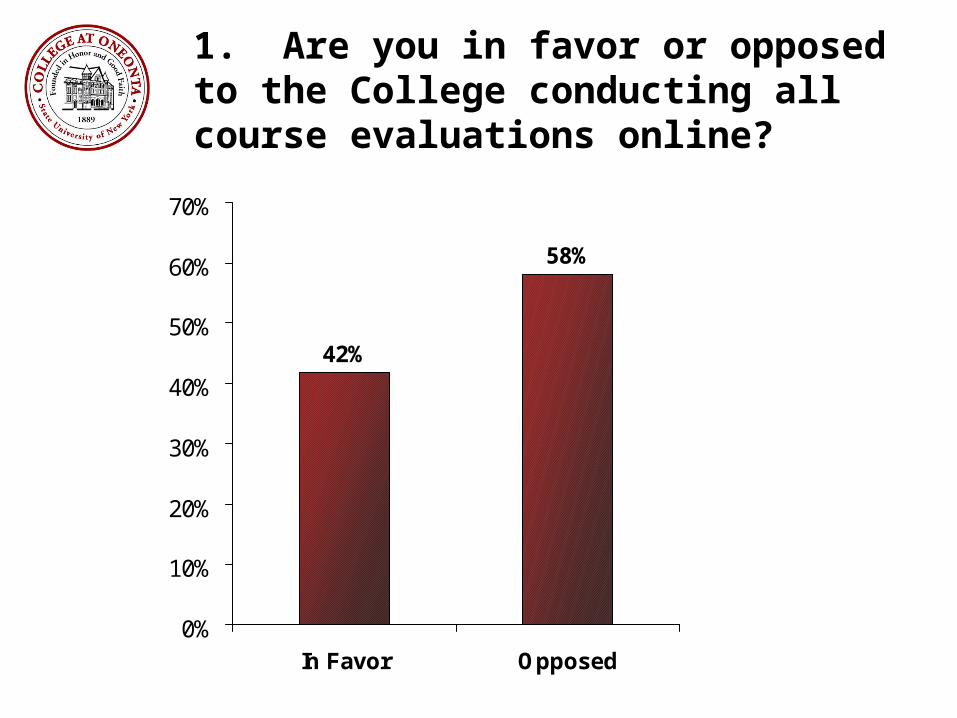
1. Are you in favor or opposed to the College conducting all course evaluations online?
42%
58%
0%
10%
20%
30%
40%
50%
60%
70%
In Favor Opposed

2. How strongly do you feel about the College conducting all course evaluations online?
27%
21%
12%
19%
21%
0% 10% 20% 30%
Wholeheartedlyopposed
Opposed withreservations
Neutral
Conditionally infavor
Wholeheartedlyin favor
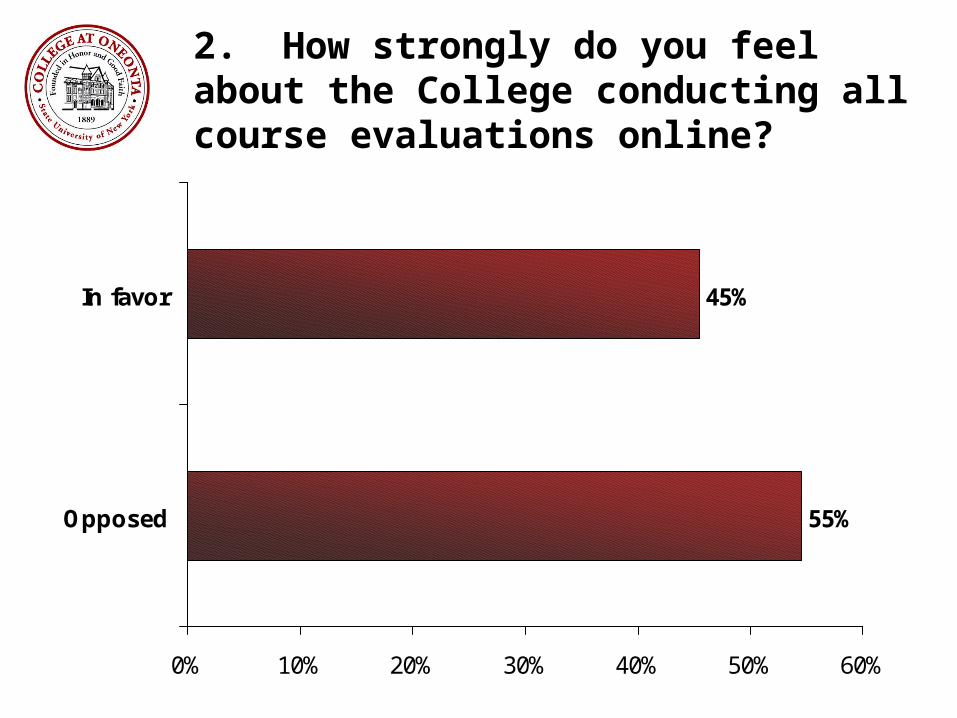
2. How strongly do you feel about the College conducting all course evaluations online?
55%
45%
0% 10% 20% 30% 40% 50% 60%
Opposed
In favor

Summary of Written Responses
• Faculty (even some who are in favor of online evaluations) say they are “worried” about the following:– low response rates– lack of security– non-discrimination (all instructors get
rated the same)– biased sample (because of who might
not respond)
Summary of Written Responses, cont.
• One person reported previous positive experience with online evaluations at another institution
Summary of Written Responses, cont.
• Some faculty who oppose online evaluations have had experience with either the pilot project last summer, online course evaluations at previous institutions, or other online aspects of their courses
• Faculty speaking from first-hand experience explicitly mentioned their concern about low response rates

Summary of Written Responses, cont.
• Faculty are concerned about the emotional/mental state of students when completing evaluations online
• They also worry about whether students might be influenced by others around them at the time

Summary of Written Responses, cont.
• Overall, the language and tone of faculty opposed to online evaluations was far more strongly and emphatically voiced than the (rather muffled) approval of those in favor

Summer 2008 Pilot

Response Rates and Overall Experience
• No summary data available
• Anecdotal data (from the survey and personal conversations):
Percentage of faculty who participated in the pilot who are now in favor of online evaluations: 0%
Percentage of faculty who participated in the pilot who are now opposed to online evaluations: 100%

Student Feedback

Committee Conclusions

Data Sources
• Survey of teaching faculty
• Published, peer-reviewed literature
• Consultation with Patty Francis and Steve Johnson
• Anecdotal evidence from other institutions
• Local campus experience

Conclusions: Paper Forms
Advantages:– higher response rate, less likely for bias
in results– more faculty are confident about
obtaining valid results through this method
– controlled setting for administration– students are familiar with the format

Conclusions: Paper Forms
Disadvantages:– time required to process forms– delay in receiving results– use of paper resources
=> Note that none of these disadvantages is related to the validity or accuracy of the data

Conclusions: Digital Forms
Advantages:– results could be delivered to faculty
more quickly– saves paper and some processing time
Conclusions: Digital Forms
Disadvantages:– lower response rate– no good options for incentives– more likely for bias in results, concerns
about validity– a majority of faculty have significant
reservations– concerns among both faculty and
students about security/privacy

Conclusions: Digital Forms
Disadvantages, cont.:– questions about faculty being able to
opt out– questions about students being able to
opt out– student responses can be posted online
for others to see

One Final Consideration
SPI data are currently used to evaluate faculty for:– merit pay– contract renewal– tenure/continuing appointment– promotion– performance awards
=> If faculty lack confidence in the integrity and accuracy of course evaluation data, any decisions that are made on the basis of these data are likely to be questioned in a way that we believe is unhealthy for our institution.

Recommendation #1
All course evaluations should be administered
using paper forms.
We believe the current consensus among faculty and students will shift at some
point toward favoring an electronic format. But we are not nearly there yet.

Recommendation #2
Electronic course evaluations should not
even be an option.Aggregated results cannot be interpreted
meaningfully (especially if differential incentives are offered).
EXCEPTION: Distance-learning courses

Recommendation #3
Since significant man-hours are needed to process course evaluation forms for our campus, the College Senate should advocate strongly for allocating additional (seasonal) help for processing these forms.

Stay tuned...
... for Part II of our recommendations regarding changes to the form used for course evaluation.