Embed Size (px)
Citation preview

Re v i e w of R em o t e S e n s i n g A p pl i c a t i o n s f or N a t ur a l R es o ur c e M a n a ge m e n t
© E CO LO G ICA L A U S T RA L IA P T Y LT D i
Review of Remote Sensing Applications for Natural Resource Management
Prepared for
Queensland Department of Science, Information Technology and the Arts and Department of Natural Resources and Mines
19 December 2014

Re v i e w of R em o t e S e n s i n g A p pl i c a t i o n s f or N a t ur a l R es o ur c e M a n a ge m e n t
© E CO LO G ICA L A U S T RA L IA P T Y LT D ii
DOCUMENT TRACKING
Item Detail
Project Name Review of Remote Sensing Applications for natural Resource Management
Project Number 14ARMNRM-0003
Project Manager
Bruce Wilson
Phone 07 3503 7193
Office address Suite 1, level 3, 471 Adelaide Street Brisbane QLD 4000
Prepared by Bruce Wilson, Steve Jarman, Paul Frazier
Reviewed by Robert Mezzatesta
Approved by Dr Ailsa Kerswell
Status FINAL
Version Number 1
Last saved on 19 December 2014
Cover photo USGS/NASA Landsat 5 image (16/2/2010, showing Cooper Creek, southwest
Queensland in flood
This report should be cited as ‘Eco Logical Australia 2014. Review of Remote Sensing Applications for natural Resource Management. Prepared for the Queensland Department of Science, Innovation, Information Technology and the Arts and the Queensland Department of Natural Resources and Mines’
ACKNOWLEDGEMENTS
This document has been prepared by Eco Logical Australia Pty Ltd.
Disclaimer
This document may only be used for the purpose for which it was commissioned and in accordance with the contract between
Eco Logical Australia Pty Ltd and Queensland Department of Science, Innovation, Information Technology and the Arts. The
scope of services was defined in consultation with the Queensland Department of Science, Innovation, Information
Technology and the Arts and the Queensland Department of Natural Resources and Mines by time and budgetary constraints
imposed by the client, and the availability of reports and other data on the subject area. Changes to available information,
legislation and schedules are made on an ongoing basis and readers should obtain up to date information.
Eco Logical Australia Pty Ltd accepts no liability or responsibility whatsoever for or in respect of any use of or reliance upon
this report and its supporting material by any third party. Information provided is not intended to be a substitute for site
specific assessment or legal advice in relation to any matter. Unauthorised use of this report in any form is prohibited.
Template 08/05/2014
Re v i e w of R em o t e S e n s i n g A p pl i c a t i o n s f or N a t ur a l R es o ur c e M a n a ge m e n t
© E CO LO G ICA L A U S T RA L IA P T Y LT D iii
Contents
Key Findings and Recommendations ................................................................................................... x
1 Introduction ................................................................................................................................ 1
Scope ........................................................................................................................................... 1 1.1
Current RSC program .................................................................................................................. 2 1.2
Infrastructure and other enabling functions .................................................................................. 2 1.2.1
Datasets ....................................................................................................................................... 2 1.2.2
Derived products .......................................................................................................................... 4 1.2.3
Applications .................................................................................................................................. 4 1.2.4
2 Methods ....................................................................................................................................... 5
User needs ................................................................................................................................... 5 2.1
Identification of users ................................................................................................................... 5 2.1.1
User interviews ............................................................................................................................. 5 2.1.2
Review of current arrangements .................................................................................................. 5 2.2
Evaluation of opportunities ........................................................................................................... 6 2.3
3 User needs .................................................................................................................................. 7
DNRM ........................................................................................................................................... 8 3.1
Compliance .................................................................................................................................. 8 3.1.1
Operations .................................................................................................................................... 8 3.1.2
Policy ............................................................................................................................................ 9 3.1.3
Mining ......................................................................................................................................... 10 3.1.4
Water .......................................................................................................................................... 10 3.1.5
Salinity ........................................................................................................................................ 10 3.1.6
Additional issues ........................................................................................................................ 11 3.1.7
DAFF .......................................................................................................................................... 11 3.2
Grazing management ................................................................................................................. 11 3.2.1
Assessment of agricultural lands ............................................................................................... 12 3.2.2
DPC/DNRM/DEHP - Reef Plan .................................................................................................. 12 3.3
DEHP.......................................................................................................................................... 13 3.4
Petroleum & Gas ........................................................................................................................ 13 3.4.1
Coastal management ................................................................................................................. 14 3.4.2
State of the Environment ............................................................................................................ 14 3.4.3
Biodiversity ................................................................................................................................. 14 3.4.4
DSDIP......................................................................................................................................... 15 3.5
NPRSR - fire management......................................................................................................... 15 3.6
PSBA .......................................................................................................................................... 15 3.7

Re v i e w of R em o t e S e n s i n g A p pl i c a t i o n s f or N a t ur a l R es o ur c e M a n a ge m e n t
© E CO LO G ICA L A U S T RA L IA P T Y LT D iv
Regional NRM Bodies ................................................................................................................ 16 3.8
4 Assessment of RSC products against user needs ............................................................... 18
Existing operational products ..................................................................................................... 18 4.1
Unexplained clearing assessment ............................................................................................. 18 4.1.1
Compliance support ................................................................................................................... 18 4.1.2
Reporting on clearing ................................................................................................................. 18 4.1.3
Woody extent and change.......................................................................................................... 26 4.1.4
Ground cover .............................................................................................................................. 27 4.1.5
Land use ..................................................................................................................................... 28 4.1.6
Fire scars .................................................................................................................................... 29 4.1.7
CSG compliance ........................................................................................................................ 30 4.1.8
Natural disasters ........................................................................................................................ 32 4.1.9
Weeds mapping ......................................................................................................................... 32 4.1.10
Products requiring further development ..................................................................................... 33 4.2
Hydrology ................................................................................................................................... 33 4.2.1
Lidar ............................................................................................................................................ 34 4.2.2
Real time, high resolution monitoring ......................................................................................... 36 4.2.3
4.2.3.1 UAVs ............................................................................................................................................. 37
5 Trade-offs in product delivery ................................................................................................ 38
Woody extent change data......................................................................................................... 38 5.1
Previous process ........................................................................................................................ 38 5.1.1
Updated process ........................................................................................................................ 39 5.1.2
Further refinement ...................................................................................................................... 39 5.1.3
6 Value for money ....................................................................................................................... 41
Contestability .............................................................................................................................. 41 6.1
7 Synergies between departments ............................................................................................ 44
8 Business continuity ................................................................................................................. 47
HPC continuity options ............................................................................................................... 47 8.1
Landsat platform ......................................................................................................................... 49 8.2
9 Current and future product communication.......................................................................... 50
Web delivery of applications/visualisation tools ......................................................................... 50 9.1
Current tools ............................................................................................................................... 50 9.1.1
Further developments ................................................................................................................ 50 9.1.2
9.1.2.1 Web version of VegMachine ................................................................................................... 50 9.1.2.2 AusCover visualisation tools ..................................................................................................... 50
Statistics reporting ...................................................................................................................... 51 9.1.3
Data delivery .............................................................................................................................. 55 9.1.4

Re v i e w of R em o t e S e n s i n g A p pl i c a t i o n s f or N a t ur a l R es o ur c e M a n a ge m e n t
© E CO LO G ICA L A U S T RA L IA P T Y LT D v
10 Research and Development resourcing ................................................................................ 58
Budgets and outputs .................................................................................................................. 58 10.1
The Joint Remote Sensing Research Program (JRSRP) .......................................................... 59 10.2
11 Future research, programs and products .............................................................................. 61
12 Recommendations ................................................................................................................... 64
1. Unexplained clearing assessment ............................................................................................. 64
2. Compliance support ................................................................................................................... 64
3. Reporting .................................................................................................................................... 64
4. Woody extent and change in extent datasets ............................................................................ 64
5. Ground cover .............................................................................................................................. 64
6. Land use ..................................................................................................................................... 64
7. Fire scars .................................................................................................................................... 65
8. Lidar ............................................................................................................................................ 65
9. Hydrology ................................................................................................................................... 65
10. Funding of the RSC program ..................................................................................................... 65
11. Business continuity ..................................................................................................................... 65
12. Web delivery of data and applications ....................................................................................... 65
13. Research and Development ....................................................................................................... 65
13 References ................................................................................................................................ 66
Appendix A User Needs Questionnaire .............................................................................................. 71
Appendix B List of Interviewees .......................................................................................................... 72
Appendix C List of Non-respondents ................................................................................................. 74
Appendix D RSC Product List.............................................................................................................. 75
Appendix E New and Developing Technologies ................................................................................ 84

Re v i e w of R em o t e S e n s i n g A p pl i c a t i o n s f or N a t ur a l R es o ur c e M a n a ge m e n t
© E CO LO G ICA L A U S T RA L IA P T Y LT D vi
List of figures
Figure 1 RSC products arranged into program hierarchy ....................................................................... 3
Figure 2: Numbers of users interviewed by group .................................................................................. 7
Figure 3 Policy and planning instruments associated with RSC products ............................................ 26
Figure 4: Comparison of imagery used for CSG Infrastructure mapping ............................................. 31
Figure 5: Lidar assessment of flood damage on the Lockyer Creek .................................................... 32
Figure 6: Standard Lidar products ........................................................................................................ 35
Figure 7: Extent of Airborne Lidar coverage stored by RSC ................................................................. 35
Figure 8: Pléiades satellite imagery after oil spill on left and after clean up on right. ........................... 36
Figure 9: Riegl RiCOPTER (from Riegl 2014a) .................................................................................... 37
Figure 10: Comparison of the previous and updated SLATS product delivery process ....................... 40
Figure 11: RSC program funding arrangements ................................................................................... 46
Figure 12: AusCover product download, visualisation portal ................................................................ 52
Figure 13: AusCover portal visualisation tool - seasonal fractional cover ............................................ 53
Figure 14 The chopper tool ................................................................................................................... 53
Figure 15: Example of data visualisation available on the AussieGRASS web site ............................. 54
Figure 16: Wetland extent summary tool .............................................................................................. 54
Figure 17: WorldView-3 imagery ........................................................................................................... 85
Figure 18: The A-Train .......................................................................................................................... 86
Figure 19 3D LiDAR vegetation height data from the Riegl RiCOPTER for a corridor study (from Riegl,
2014b) ................................................................................................................................................... 91
Figure 21: the BRAMOR rTK and launch system ................................................................................. 92

Re v i e w of R em o t e S e n s i n g A p pl i c a t i o n s f or N a t ur a l R es o ur c e M a n a ge m e n t
© E CO LO G ICA L A U S T RA L IA P T Y LT D vii
List of tables
Table 1: Summary of RSC products, identified needs and limitations .................................................. 19
Table 2: RSC products with a potential delivery market ....................................................................... 43
Table 3 Summary of major RSC datasets by department use ............................................................. 45
Table 4 Indicative annual funding of the RSC program ........................................................................ 45
Table 5: Downloads for some RSC datasets for 2013 from QGIS web site. ........................................ 55
Table 6: Proportion of R&D budget for some private companies ......................................................... 59
Table 7: List of future R&D projects ...................................................................................................... 61
Table 8: A –Train Satellites (from NASA 2014) .................................................................................... 86
Table 9: Example UAV Applications ..................................................................................................... 89
Re v i e w of R em o t e S e n s i n g A p pl i c a t i o n s f or N a t ur a l R es o ur c e M a n a ge m e n t
© E CO LO G ICA L A U S T RA L IA P T Y LT D viii
Abbreviations
Abbreviation Description
BPA Biodiversity Planning Assessments
CASA Civil Aviation Safety Authority
DAFF Department of Agriculture, Fisheries and Forestry
DEHP Department of Environment and Heritage Protection
DEWS Department of Energy and Water Supply
DNRM Department Natural Resources and Mines
DSDIP Department of State Development, Infrastructure and Planning
DSITIA Department of Science, Information Technology, Innovation and the Arts
eLVAS electronic Land and Vegetation Administration System (a DNRM database)
FPC Foliage Projective Cover
GDE Groundwater Dependent Ecosystem
GIS Geographic Information System
MDB Murray Darling Basin
MSES Matters of State Environmental Significance
NAFI North Australian Fire Information
NPRSR National Parks, Recreation, Sport and Racing
NRM Natural Resource Management (as in the non-government Regional NRM bodies)
PAA Protected Agricultural Areas
PALU Protected Agricultural Land Uses
PMAV Property Maps of Assessable Vegetation
PSBA Public Safety Business Agency
QFES Queensland Fire and Emergency Services
QGIS Queensland Government Information Service
QLUMP Queensland Land Use Mapping Program
RPI Act Regional Planning Interest Act 2014
RSC Remote Sensing Centre
SCA Strategic Cropping Areas
SCL Strategic Cropping Lands
SEA Strategic Environmental Areas
SLAM State Land Assets Management
SLATS State Landcover and Tree Study

Re v i e w of R em o t e S e n s i n g A p pl i c a t i o n s f or N a t ur a l R es o ur c e M a n a ge m e n t
© E CO LO G ICA L A U S T RA L IA P T Y LT D ix
VMA Vegetation Management Act 1999
Re v i e w of R em o t e S e n s i n g A p pl i c a t i o n s f or N a t ur a l R es o ur c e M a n a ge m e n t
© E CO LO G ICA L A U S T RA L IA P T Y LT D x
Key Findings and Recommendations
The Remote Sensing Centre (RSC) produces a wide range of products which are extensively used
across the Department of Natural Resources and Mines (DNRM) and other Queensland Government
Departments particularly the Department of Environment and Heritage Protection (DEHP), the
Department of Agriculture, Fisheries and Forestry (DAFF) and the Department of State Development,
Infrastructure and Planning (DSDIP). Eco Logical Australia Pty Ltd (ELA) was engaged to conduct a
user needs analysis followed by a review of the current RSC deliverables and their fitness for purpose
for DNRM policy, planning, operational and legislative compliance needs.
User needs and RSC products
The major RSC products, an assessment of their fitness for purpose and recommendations for their
future production include:
Unexplained clearing assessment
The unexplained clearing assessment produced by the RSC provides DNRM with the means to
prioritise areas for subsequent compliance investigations.
Recent modifications to the process used to produce this assessment by the RSC has enabled an
interim product to be delivered 1 month after the last image is captured for the reporting period. This
revised process has addressed many of the previous limitations in relation to timing to meet DNRM
compliance needs.
Recommendations for future developments include quantification of the differences between the
interim and final woody data sets so users can assess any systematic differences and investigating
processes that can prioritise specific areas or issues (nominated by DNRM) for finalisation of data to
enable more real-time monitoring for auditing self-assessable codes under the Vegetation
Management Act 1999.
Compliance support
The RSC provides technical support for DNRM for more detailed compliance cases including
prosecutions under relevant legislation.
It is recommended that this service should be reviewed within the context that overall demand in
relation to vegetation matters has reduced in recent years, although the size of individual cases may
have increased and the service could be extended to other matters such as water.
Reporting on tree clearing
In the past two tree-clearing reports have been produced each year: a SLATS report which provides
information on total woody clearing broken down by region, local government, catchment etc. and a
SLATS supplementary report, which breaks the total area cleared down by type of clearing – thinning,
fodder harvesting etc. The information in the SLATS report and the SLATS supplementary report is
used across the Queensland Government and is accepted as the point of truth for tree clearing data
with a high acceptance by non-government stakeholders. These reports are not currently widely used
by the DNRM users interviewed, although the Land and Mines Policy Section indicated that the
supplementary report was still required for monitoring policy implementation.
It is recommended that the RSC should produce a clearing report with the area cleared broken down
by clearing type (fodder, thinning etc.) to provide fuller context for the tree clearing figures.

Re v i e w of R em o t e S e n s i n g A p pl i c a t i o n s f or N a t ur a l R es o ur c e M a n a ge m e n t
© E CO LO G ICA L A U S T RA L IA P T Y LT D xi
The current pdf type report should be replaced with an online web-based reporting tool, possibly in
partnership with the State of the Environment reporting, that provides users with statistics for their
area of interest.
Woody extent and change in extent datasets
These datasets and derived products are used for a range of auditing, monitoring and assessment
activities within DNRM, Reef Plan reporting and implementation, biodiversity assessments by DEHP,
inputs into grazing management tools by DAFF and a range of applications by regional Natural
Resource Management (NRM) bodies.
The derivation of these data from the freely available US Landsat imagery from the US Geological
Survey provides a highly cost effective product that has a high acceptance from users. The scale of
resolution of these data is seen as a limitation by users for property level assessments, although
users showed a high level of awareness of the fit for purpose applications and need to incorporate
other higher resolution data when required.
The continued production of this dataset is essential to meet a range of whole of government needs,
although further improvements in automation and timeliness would increase its utility for DNRM
purposes.
Ground cover
The ground cover dataset provides essential inputs into a range of applications particularly for
reporting on the catchment loads and ground cover target in the Reef Plan and grazing management
applications for Reef Plan implementation and grazing/drought management applications used by
DAFF and the grazing industry
It is recommended that this dataset continue to evolve and improve to meet the current a future needs
identified in this report.
Land use
The land use data provide input into a range of applications and used by a wide range of Queensland
Government agencies. Major uses include incorporation into agricultural land use planning and trigger
maps and assessments under the Regional Planning Interest Act 2014 (RPI Act) by DNRM, DAFF
and DSDIP and Reef Plan reporting and implementation. These data are delivered by the RSC in
partnership with DNRM regional staff.
A main limitation of the land use data raised by users is the ad hoc nature of updates to the mapping
which is associated with the ad hoc nature of funding such as reef catchment science in combination
with a range of other short term funding sources. It is recommended that more frequent and/or
consistent updates are produced, particular in areas where land use changes more frequently, with a
forward schedule so users can see when areas will be updated.
Fire scars
The RSC fire scar mapping is used for assessment of fire hazard and risk by the Public Safety
Business Agency (PSBA) and as a potentially useful product by a range of other users. This is a
relatively new product that requires a greater level understanding about how it is best used. It is
recommended that RSC engages with users to clarify the role of the RSC fire scar mapping in relation
to other products available and its application in specific situations.

Re v i e w of R em o t e S e n s i n g A p pl i c a t i o n s f or N a t ur a l R es o ur c e M a n a ge m e n t
© E CO LO G ICA L A U S T RA L IA P T Y LT D xii
Lidar
Lidar imagery can provide high resolution, three-dimensional information that can be used to meet a
wide range of vegetation and land surface data needs across DNRM (in relation to vegetation and
mining) and other agencies. Currently Lidar data are not very cost effective as they are expensive and
the existing coverage from airborne platforms is confined to small areas. However, Lidar data
coverage is becoming more widespread with potentially more cost effective delivery options (e.g. from
space) becoming available in the near future.
It is recommended that the RSC continue to capture all Queensland Government available Lidar data
onto the RSC computer system; develop standard products that can be used for vegetation and; land
assessments and make these products discoverable and accessible to users.
Hydrology
A wide range of remote sensing needs were identified in relation to management of surface water and
ground water by DNRM, and in relation to coal seam gas project compliance in DEHP and DNRM.
While some of these needs can be addressed by some current water related RSC products, many of
these needs require new products to be developed with appropriate resource allocation.
Value for money and synergies between Departments
The RSC program and long term monitoring datasets enable the production of applications and
products that provide defensible science and spatial data that are used to underpin a range of
Queensland initiatives across a range of agencies. The extensive use of the freely available Landsat
imagery for many of the RSC datasets enables the production of cost effective data compared to
other options available in the market.
In particular the core landscape monitoring data sets (woody vegetation, ground cover and land use)
and the underpinning enabling functions (image archive processing and High Performance Computing
(HPC) including the multi-petabyte scale data storage) service a wide range of interconnected uses
and users and it is difficult to allocate a proportion of their use to a specific department.
Therefore it is recommended that the $1.9 million annual funding for the enabling functions (image
archive and processing systems) should be shared across the whole of government. The $1.7 million
annual funding for the key landscape monitoring programs (woody vegetation, ground cover and land
use) should be proportioned across agencies by relative use, although this should be negotiated on a
multilateral/whole of government basis, in recognition that these services underpin a wide range of
interconnected uses and uses.
The funding and delivery of specific products for specific uses (currently $1.3 per annum) should
continue to be negotiated on a bilateral basis.
Business continuity
Many of the RSC products rely on the ongoing functioning of the HPC and associated satellite image
archive and the ongoing free supply of the Landsat imagery. It is recommended that the RSC review
the current situation to develop a medium to long term strategy to ensure their needs are met into the
future.
Product communication
A range of RSC products can currently be viewed and interpreted on a number of web based
applications and visualisation tools. It is recommended RSC, in partnership with users, further

Re v i e w of R em o t e S e n s i n g A p pl i c a t i o n s f or N a t ur a l R es o ur c e M a n a ge m e n t
© E CO LO G ICA L A U S T RA L IA P T Y LT D xiii
develop web based applications and associated data visualisation tools to make RSC products more
accessible to users.
Research and Development
The current level of investment in R&D by the RSC represents the minimum required to ensure that
there is continued improvement in product quality and cost effectiveness while also developing new
products to meet emerging user needs. It is recommended that this level of R&D be continually
monitored and assessed against the criteria of ensuring that new and innovative products that meet
user needs continue to be produced in the medium to long term.
A list of potential priority R&D projects is provided. This list includes many areas highlighted in the
user needs assessment and includes ongoing continuous improvements of existing products as well
as the development of new products.

Re v i e w of R em o t e S e n s i n g A p pl i c a t i o n s f or N a t ur a l R es o ur c e M a n a ge m e n t
© E CO LO G ICA L A U S T RA L IA P T Y LT D 1
1 Introduction
The Remote Sensing Centre (RSC) within the Science Division of the Queensland Department of
Science, Innovation, Information Technology and the Arts (DSITIA) has been undertaking applied
remote sensing to research and monitor the State’s woody vegetation extent and woody clearing
since the mid-1990s.
The RSC also derives land use, ground cover and fire scar mapping and a range of other products
including cropping frequency, riparian vegetation extent, weed prevalence, water bodies and flood
extent, tropical cyclone damage, wildlife habitat, and landscape erosion features.
The RSC uses DSITIA’s High Performance Computing systems to support the storage and serving of
the extensive satellite image archive which is used to support the delivery of the range of datasets
and products. The archive includes satellite imagery, aerial imaging and photography, airborne Lidar
and terrestrial laser scanning.
The products delivered by RSC are funded by a mixture of DSITIA and other Department or external
sources. In the past, a substantial proportion of RSC funding was from direct “treasury special”
sources. Currently, the Department of Natural Resources and Mines (DNRM) approves funding each
year to the RSC to run the satellite image archive, the woody vegetation extent and change
monitoring and compliance support services.
Scope 1.1
Eco Logical Australia Pty Ltd (ELA) was engaged to undertake a formal review of the needs for
remote sensing science by DNRM and other users across government. The scope items, and the
section of this report where they addressed, are:
1. Determine the need for remote sensing in DNRM’s natural resources and mining portfolios via
user needs analysis (section 3).
2. Review the current deliverables of the RSC science and projects and their fitness for purpose for
DNRM policy, planning, operational and legislative compliance needs (section 4).
3. Evaluate any trade-offs with changes in timeliness, scientific rigour, image resolution, quality, and
error levels against business outcomes and cost effectiveness (section 5).
4. Review the value for money of the current arrangements (section 6).
5. Evaluate synergies and potential for resource sharing where products are also useful for other
Queensland government departments (section 7).
6. Assess business continuity and security of product supply (section 8).
7. Advise on current and future product communication, web, internet and cloud delivery options,
including data visualisation and advanced server protocols (section 9).
8. Advise on the optimum proportion of resources addressing long-term core remote sensing
science capability in the RSC vis-à-vis value-added specific application products built on the
foundation capability (section 10).
9. Recommend future remote sensing research, programs and products that address DNRM needs, including funding requirements (section 11).

Re v i e w of R em o t e S e n s i n g A p pl i c a t i o n s f or N a t ur a l R es o ur c e M a n a ge m e n t
© E CO LO G ICA L A U S T RA L IA P T Y LT D 2
Current RSC program 1.2
A comprehensive list of over 70 datasets and products produced by the RSC are included in D.
These products range from raw and corrected imagery and associated field calibration data, to long
term landscape monitoring datasets and derived statistics and maps. However, many users
identify/access RSC products at a broader level and often use RSC products through applications
developed and delivered by third parties. Therefore the detailed RSC products are summarised into
groupings under the following broad headings:
Enabling functions - raw and corrected image archive, Research and Development, HPC
processing.
Datasets - state-wide long term monitoring and specific features/issues (over 25 individual
datasets).
Derived products - for specific users and applications (over 25 individual products).
Applications - usually developed by third parties for specific uses.
At this broader level the different datasets and products can be arranged into a logical hierarchy
forming an overall RSC program (Figure 1) with enabling functions and infrastructure underpinning
the monitoring datasets which support more specific user defined products which in turn support
applications and ultimately their use. The different products and the relationships between them are
briefly summarised below.
Infrastructure and other enabling functions 1.2.1
This is made up of the functions and infrastructure that underpin the datasets, products and
applications accessed by users. They include:
Image archive and HPC
This includes image correction science, storage architecture, cloud and cloud shadow removal,
workflow and associated software to process state-wide time series; and the HPC with “near-line”
multi-petabyte data storage capacity, an AARNet portal, and field calibration data.
The HPC infrastructure is critical to the ongoing RSC business continuity and is addressed in more
detail in section 8 of this report.
Research and Development (R&D).
Ongoing R&D activities are embedded within the operational activities of the RSC. These activities
ensure the ongoing development and evolution of existing products to allow for their continual
improvement over time as well as for the development of new products.
The proportion of R&D work carried out by the RSC is addressed in more detail under section 10 of
this report.
Datasets 1.2.2
The datasets can be divided into long term state-wide landscape monitoring datasets, which underpin
a wide range of products and applications, and other datasets that address specific areas and / or
issues.

Re v i e w of R em o t e S e n s i n g A p pl i c a t i o n s f or N a t ur a l R es o ur c e M a n a ge m e n t
© E CO LO G ICA L A U S T RA L IA P T Y LT D 3
Figure 1 RSC products arranged into program hierarchy
Landscape monitoring datasets
Woody vegetation - The woody extent and the change in extent datasets are produced by the
SLATS project originally to assess tree clearing and are referred to by some users as the
SLATS or tree clearing data. The derived data include woody vegetation cover (FPC) as well
biomass and other related attributes. These datasets are derived mainly from the Landsat
image archive although, where available, Lidar and radar products can provide more detailed
data on structure and biomass.
Ground cover – This dataset is derived from Landsat imagery using automated algorithms
that have been calibrated with field data. The current ground cover data are generated from
the total vegetation cover measured by the fractional cover dataset but only for areas where
the woody FPC cover is less than 15%. A new product showing ground cover “under trees”,
which includes areas where woody cover is greater than 15%, has recently been developed
(Scarth et al. 2014). This product is likely to replace the current dataset in the near future.
Land use - The Queensland Land Use Mapping Programme (QLUMP) produces land use
mapping according to the national Australian Collaborative Land Use Mapping Program
(ACLUMP) method and standards (Australian Government 2014). The QLUMP mapping is
compiled by RSC scientists in partnership with regional DNRM staff who provide significant
local knowledge and field checking. The land use mapping is generally derived from SPOT
imagery or higher resolution aerial photography if available.
Crop frequency mapping – Showing the frequency areas are cropped. Currently only
available for selected areas but is been expanded to cover all cropping areas in the state.

Re v i e w of R em o t e S e n s i n g A p pl i c a t i o n s f or N a t ur a l R es o ur c e M a n a ge m e n t
© E CO LO G ICA L A U S T RA L IA P T Y LT D 4
Fire scar mapping – This provides historical (from 1986) and current information about extent
and timing of fires. Fire scars are automatically detected and mapped using the dense time
series from the Landsat imagery archive.
Water body mapping – showing the extent of water bodies across the Landsat time series.
Persistent green – is a dataset that is under development that estimates the proportion of
green or photosynthetic vegetation cover that does not vary greatly in the amount of green
cover from season to season, which in most areas of Queensland, Persistent Green is likely
to represent woody vegetation.
Persistent green trend - indicate changes in thickness and extent of woody vegetation
including the recovery of healthier tree crowns (e.g. after drought).
Specific area / issues datasets
There are a range of datasets that have been produced for individual users or user groups with
specific needs. Specific area / issue data includes:
Coal seam gas (CSG) well infrastructure derived from Rapid Eye and other imagery.
Stream bank condition derived from Lidar for flood impact assessment in South East
Queensland (SEQ).
Various weed mapping datasets.
Habitat mapping (such as SEQ koala habitat).
Gully mapping in the Great Barrier Reef (GBR) catchments.
Derived products 1.2.3
A range of derived and special purpose products are produced by the RSC, including:
GBR catchment riparian woody extent and ground cover mapping for reporting under the
Reef Plan.
SLATS annual report detailing areas cleared broken down by attributes including local
government area and region.
Woody extent and ground cover mapping and statistics for input into various applications and
uses.
Unexplained clearing assessment that flags areas of clearing that are not associated with
approvals, for subsequent investigation by DNRM.
Annual composites of all fire scars mapped across the state in a calendar year, data on the
number of times an area has been burnt and the time since the last burn.
Water body mapping, including farm dams.
Estimates of carbon biomass derived from field calibration.
Land use summary regional reports and maps.
Applications 1.2.4
There are a range of higher order applications, often produced by third parties, serve up the RSC data
as tailored, interpreted products for specific uses/users. Some of these applications include:
FORAGE online reporting tool developed by DSITIA. This tool uses the RSC ground cover
and woody products for use in grazing lands assessment and monitoring in extension
activities and by individual land managers.
VegMachine developed by DAFF and CSIRO. This tool uses the RSC ground cover woody
cover and imagery products to report on the relative ground cover in user specified areas.

Re v i e w of R em o t e S e n s i n g A p pl i c a t i o n s f or N a t ur a l R es o ur c e M a n a ge m e n t
© E CO LO G ICA L A U S T RA L IA P T Y LT D 5
AussieGRASS is a tool that was developed in the 1990s to assist in the management of
pasture. It uses simulation modelling to synthesise multiple data sources about land cover,
climate and management to provide products which are surrogates for land condition and
agricultural productivity measures. AussieGRASS is a fundamental RSC program although it
is treated as an application here because it packages other RSC products with a range of
other data into a decision support tool for users.
NRM Spatial Hub is a tool being developed by a coalition of NRM organisations and will use
the RSC ground and woody vegetation data to generate information for use by land
managers.
2 Methods
User needs 2.1
Identification of users 2.1.1
The main source of information for this report was a series of interviews with users and staff from
DNRM, DEHP, DAFF, RSC and other organisations as well as published and unpublished documents
provided by the RSC. The participants interviewed were identified by DNRM and RSC.
User interviews 2.1.2
A questionnaire was developed to guide the interviews (Appendix A). In some cases interviewees
completed the questionnaire. However, in most cases the form was used as a guide for an open
ended discussion with respondents. The questionnaire focused on specific remote sensing uses and
requirements, including:
Existing uses of RSC products and exactly how and what they were used for
Gaps in user needs (i.e. potential uses of remote sensing information that are not currently
supported or available)
The user’s current understandings of what RSC products and information are available
Other key issues associated with the use of RSC products.
Interviews were conducted in October 2014, either in person or by phone and usually with 1-3 people
at a time.
Review of current arrangements 2.2
A review of the current deliverables provided by DSITIA’s RSC was carried out to assess their fitness
for purpose for DNRM policy, planning, operational and legislative needs. The review assessed
DNRM’s compliance requirements and the associated RSC products that are currently being utilised
to support these requirements. This assessment identified where there may be potential shortfalls or
efficiency gains in regard to the current deliverables and programs.
The review formed the basis of a tabularised report that assessed:
Product fitness for purpose (compliance suitability).
Product flexibility (multi-purpose use and value add for resource sharing with other Queensland
government agencies).
Product reliability (lifespan and future supply).

Re v i e w of R em o t e S e n s i n g A p pl i c a t i o n s f or N a t ur a l R es o ur c e M a n a ge m e n t
© E CO LO G ICA L A U S T RA L IA P T Y LT D 6
Evaluation of opportunit ies 2.3
Using the outcomes of the user needs and current deliverables review, an evaluation of potential
opportunities for remote sensing information, programs and products was carried out in the context of
Queensland government needs / operational requirements.
The evaluation included an exploration of current and emerging technologies for resource sharing,
internal and external communication and product delivery options and options for information
visualisation and analysis.

Re v i e w of R em o t e S e n s i n g A p pl i c a t i o n s f or N a t ur a l R es o ur c e M a n a ge m e n t
© E CO LO G ICA L A U S T RA L IA P T Y LT D 7
3 User needs
A total of 59 data users were interviewed. The users interviewed were mainly from DNRM, DEHP and
DAFF (Figure 2) but also from Public Safety Business Agency (PSBA), Department of State
Development, Infrastructure and Planning (DSDIP) and National Parks, Recreation, Sport and Racing
(NPRSR). They covered a wide range of activities and responsibilities including compliance,
vegetation management operations, policy, monitoring and auditing of State Land Assets
Management (SLAM), mining, ground water, petroleum and gas compliance, biodiversity, Great
Barrier Reef Water Quality, fire management, primary industries and regional natural resource
management. A list of individuals interviewed, their affiliation and allocated grouping is provided in
Appendix B
In addition to the above users, 4 people from DNRM – Land and Spatial Information were interviewed
to gain context into the coordination of their activities with the RSC. Another 12 people from the RMC
and one person from University of Queensland were interviewed to gain insights into how RSC
products were developed and delivered, as well as their use in Research and Development activities.
Figure 2: Numbers of users interviewed by group
6
3
1 1
3
8
4
7
12
2
1
2
4
1
12
1
3
1
3
1
0
5
10
15
DA
FF
DEH
P - b
iod
iversity
DEH
P - co
astal
DEH
P - p
etrole
um
& gas
DEH
P - SO
E
DN
RM
- com
plian
ce
DN
RM
- land
& sp
atial
DN
RM
- min
ing
DN
RM
- op
eratio
ns
DN
RM
- po
licy
DN
RM
- salinity
DN
RM
- wate
r
DP
C/D
NR
M/EH
P - re
ef plan
DSIP
DSITIA
- RSC
DSITIA
- soils
NP
RSR
- fire m
anage
me
nt
PSB
A
Re
gion
al bo
die
s
UQ
- research
Re v i e w of R em o t e S e n s i n g A p pl i c a t i o n s f or N a t ur a l R es o ur c e M a n a ge m e n t
© E CO LO G ICA L A U S T RA L IA P T Y LT D 8
Some users recommended by RSC/DNRM could not be interviewed (Appendix C). In most cases
these people put forward substitutes or their content area was covered by other interviewees. All areas
identified in the original list were therefore covered by at least one person interviewed.
There was a wide range of needs identified in the interviews. Many needs related to the existing uses of
current RSC products while some needs require the development of new products. The following
provides a brief summary of major needs of each of the groups interviewed. This is followed by a more
detailed assessment of the RSC products in relation to the identified needs in section 4.
DNRM 3.1
Compliance 3.1.1
The DNRM compliance activity requires an annual prioritisation of areas of “unexplained clearing” to
create compliance cases for subsequent investigation. Unexplained clearing is clearing that is not
associated with permits, self-assessable code notifications or exempt categories of clearing such as fire
break and fencing. These areas need to be assessed as they may include areas of illegal clearing. As
there are generally many more areas of unexplained clearing than can be addressed by current
resources, an overview of all the unexplained clearing across the state or a region is required to enable
the allocation of priorities for investigations. Generally, the largest areas receive higher priority, although
other factors such as a greater occurrence of unexplained clearing in a local region could be
considered.
Once the priority list has been allocated, investigation of individual cases occurs. This requires an initial
desktop assessment to verify the nature of vegetation particularly in terms of remnant/non-remnant
status, structure (height and cover) and vegetation type. This includes an assessment of if and when
the current clearing occurred as well as an assessment of historical clearing at the site to help
determine the remnant status of the current vegetation. The remote sensing needs of the desktop
assessment include the collation of the RSC woody extent and change in extent layers along with
current and historical Landsat and any other available current or historical imagery. Some of these
cases are investigated in more detail including on ground verification.
For compliance investigations, ready access to imagery that shows an area immediately before and
after a clearing event is often required. There is also sometimes a need for “near real time” imagery for
where land access is difficult and/or suspected illegal clearing is occurring. This is to prove clearing is
occurring but also to allow early intervention rather than trying to use a regulatory approach after the
clearing event has occurred. Users are aware such imagery can be purchased in specific situations
although resources are generally only available for specific cases. Unmanned Aerial Vehicles (UAVs)
are also suggested as a possible solution to this need, although there was a low level of knowledge
about the legal and logistical aspects of this solution (see section 0).
Particular investigations and/or prosecutions require detailed technical support from the RSC. This can
involve the use of high resolution imagery, preparation of maps and statistics for court hearings and
providing expert witness evidence. The number of prosecutions requiring RSC support has decreased
over the last 3 years. Although the time spent by RSC staff on each individual case has increased
during this time it appeared overall demand for this service to DNRM for vegetation compliance matters
has decreased.
Operations 3.1.2
Some assessments previously carried out by DNRM staff are no longer required or have been replaced
by self-assessable codes. However, DNRM operations staff outlined a range of monitoring, auditing and

Re v i e w of R em o t e S e n s i n g A p pl i c a t i o n s f or N a t ur a l R es o ur c e M a n a ge m e n t
© E CO LO G ICA L A U S T RA L IA P T Y LT D 9
assessment verification activities which required remote sensing information about vegetation extent,
change in extent and type and land use. These activities included:
Verification of Property Maps of Assessable Vegetation (PMAV) applications, auditing of self-
assessable codes and detailed compliance investigations under the Vegetation Management
Act 1999 (VMA 1999).
Verification of clearing/development applications including Material Change of Use, and
Reconfigurations of Lots under the VMA 1999 and other legislation.
State Land Asset Management (SLAM which includes stock route management).
Assessment of strategic cropping areas/lands applications under the RPI Act to provide advice
to DSDIP.
A range of site specific assessments including pre-lodgement advice for clients and to the
Department.
Ad hoc advice relating to matters such as stock route condition, self-assessable codes and land
tenure conversions.
In many cases these assessments included a similar desktop assessment to that outlined in the
compliance investigations above. Additional needs include information on ground cover and condition,
land use mapping and fire history mapping.
Policy 3.1.3
DNRM Land and Mines policy identified the need to report on SLATS tree clearing change to monitor
the impacts of changes in Vegetation Management Policy. This is still required annually, although rather
than the full SLATS report, it is considered that the SLATS supplementary report is more useful for
policy needs. In the past this report has been compiled by the Vegetation Management Policy Group.
An example of the needs in this area is evident in a recent request to report on the total area cleared
under thinning self-assessable codes, which could only be replied to with gross area figures derived
from referrals. The SLATS data, if available at the time of the request, could be used to provide net
figures and a more realistic assessment of actual thinning carried out compared to the gross area from
the referrals.
The woody vegetation layer from RSC is used to define Category R (riparian areas in the Great Barrier
Reef catchments) and Category C (high value regrowth on leasehold lands) area certified under the
VMA 1999. The wetland mapping produced by the Queensland Herbarium, which uses the RSC water
body mapping as an input, is also certified under the VMA 1999. The regional ecosystem mapping from
the Queensland Herbarium, which also uses RSC SLATS products as an input, is a support map under
the VMA 1999. However, there are no plans to update these maps in the immediate future and currently
they are only updated by the PMAV process.
The land use mapping produced by the RSC is used to develop the Strategic Cropping Lands map by
DNRM. This SCL mapping is provided to DSDIP for incorporation into the Strategic Cropping Area
trigger map under the RPI Act (section 3.5).
Other potential remote sensing needs in the policy area included:
The derivation of changes in vegetation cover (thickening vs. thinning) from the persistent green
trend product to provide context for self-assessable thinning codes.
Ground cover for land condition assessments for future policy development around soil
conservation and land condition.
Detailed land contours that can be used to help define salinity and acid sulfate soils.

Re v i e w of R em o t e S e n s i n g A p pl i c a t i o n s f or N a t ur a l R es o ur c e M a n a ge m e n t
© E CO LO G ICA L A U S T RA L IA P T Y LT D 10
Mining 3.1.4
DNRM has an extensive role in assessing various aspects of mining that use remote sensing products.
Generally these assessments are concerned with land surface or sub-surface geology rather than the
terrestrial vegetation that has been the traditional focus of the RSC. The Mining section of DNRM
purchases radiometric remotely sensed data from private providers for use in geological survey. These
data are made available across government and used in other activities such as soils and regional
ecosystem mapping.
The assessment of abandoned mines requires detailed information on micro-topography to determine
the safety status of sites. At this stage most of the assessments are concerned with assessing flooding
and safety risks although the latter can include issues such as such as acid drainage from pyrites and
the presence of endangered regional ecosystems. Available imagery is used for additional desktop
assessments although this generally needs to be detailed aerial photography to be able to assess the
relevant features and provide detailed land surface information. UAVs have been used to collect this
information in situations where sites have been difficult to access in a safe manner (see section 0).
Potential needs include the use of specific sensors to detect chemical changes and emissions at
particular mine sites.
Water 3.1.5
The management of ground water, associated Groundwater Dependent Ecosystems (GDEs) and
surface water requires the assessment/monitoring of a range of parameters, many of which can be
readily measured by remote sensing.
Examples of specific needs identified in the user survey include:
Monitoring changes in the extent of springs using site specific imagery.
Measurement of surface water permanence to support hydrological modelling of flows.
Direct monitoring of turbidity and other measures relevant to water quality.
Measurement of permanence, frequency of inundation of water to indicate where ground water
supports surface water wetlands, watercourses that are connected to the ground water and
other potential GDEs at a regional or local scale.
Use remote sensing to measure historical wetness/GDE extent mapping. This history often
needs to be longer than the satellite imagery archive so utilises the aerial photography archive.
Measurement of water balance recharge of ground water (indicated by ground cover, ground
surface cover) evapotranspiration.
Detailed assessment of individual springs with specific sensors to measure things like water
balance or evapotranspiration.
Use of remote sensing to measure hydraulic head and ground water.
Assessment of detailed geometry at a spring site including biomass changes and land use
impacts.
Detection of new dams and water discharge associated with CSG operations and across the
general landscape.
Monitoring water quality in rivers and estuaries to support water resource planning.
Salinity 3.1.6
Assessments of salinity hazard by DNRM include those required for reporting for the Murray Darling
Basin Salinity Management Strategy. The main remote sensing products required for this work include
digital elevation models along with the RSC woody extent and land use mapping data. SPOT and
Landsat imagery (accessed from the RSC archive of Landsat and aerial photography) is also used in
day to day assessments of salinity hazards. The imagery is used to map soils for background/context,
Re v i e w of R em o t e S e n s i n g A p pl i c a t i o n s f or N a t ur a l R es o ur c e M a n a ge m e n t
© E CO LO G ICA L A U S T RA L IA P T Y LT D 11
and is also used for assessing historical land use for detailed assessment of salinity at specific
locations.
The persistent green trend product is also seen as potentially useful for the assessment of hydrological
impacts to vegetation dynamics, which are currently been conducted in the Murray Darling Basin in
Queensland by DNRM. These studies also make use of remote sensing to assess vegetation
greenness.
Additional issues 3.1.7
Some additional issues were raised in the user interviews that while outside the scope of this study are
included here as they may have an influence on the effective use of RSC products.
Several user groups from DNRM identified the need to improve access and ability to collate RSC data
on internal IT systems. Some users are able to access information by assembling it onto the
Queensland Globe or a pre-package globe such as the “Compliance Globe”, which includes the
regulated vegetation map, cadastral information, tenure, self-assessable code notifications. This has the
added advantage of being a useful tool to communicate with landholders even by phone to determine
the exact locations of areas of interest. Other users who have good Geographic Information System
(GIS) skills and/or GIS support and are able to assemble and manipulate the information themselves,
while others who did not have these available had to make do with inefficient processes. Several users
commented that tools previously used to carry out such activities that would improve efficiencies are no
longer maintained and accessible.
Users from compliance required a method to update the regional ecosystem mapping in some cases
(12 a year). Assuming this cannot be done through a PMAV type amendment it would have to be done
by negotiating with the Queensland herbarium through the Memorandum of Understanding between
DNRM and DSITIA.
DAFF 3.2
Grazing management 3.2.1
Grazing management needs include information that can be used in audits of government schemes and
to facilitate extension and/or improved decision making tools for industry. Examples of needs and
current uses include extension activities that incorporate the RSC ground cover data from applications
such as CSIRO’s VegMachine and DSITIA’s FORAGE. These tools are used by DAFF extension
officers and NRM regional groups to assess funding applications as well the grazing Best Management
Practice guidelines to provide improved decision making tools to industry.
Drought committees in some parts of the state have recently begun using the ground cover tools (e.g.
FORAGE) to help assess individual properties for drought declarations or revocations by comparing
ground cover on the target property to the surrounding area. This information is proving to be a useful
objective tool that has improved efficiencies as departmental officers spend less time carrying out
property inspections.
The use of the RSC’s AussieGRASS pasture modelling application is well established within DAFF and
the grazing industry for drought assessments as well as reporting economic forecasts. This information
is used with other extension tools in grazing management workshops and extensively by industry.
Further needs identified included the estimate of biomass and quality (greenness) of the ground layer
rather than just cover which is currently measured. The incorporation of remote sensing data into the
AussieGRASS application, which is currently based mainly on simulation modelling (albeit with
calibration against data) is a potential area of development.

Re v i e w of R em o t e S e n s i n g A p pl i c a t i o n s f or N a t ur a l R es o ur c e M a n a ge m e n t
© E CO LO G ICA L A U S T RA L IA P T Y LT D 12
Other grazing management activities identified the need for additional mapping that can provide an
estimate of landscape health/condition. In addition to the current FORAGE/VegMachine applications,
several RSC products have potential to do this, although further work is needed to investigate and
calibrate the relationship between the mapped attributes and landscape health. Potentially useful RSC
products identified included fire scar mapping and persistent green trend in relation to changes in
woody foliage projected cover (FPC).
Assessment of agricultural lands 3.2.2
The Queensland Agricultural Land Audit (the Audit) has been compiled by DAFF to identify land
important to current and potential future agricultural production and the constraints to development. The
Audit is used as a key reference tool to help guide investment in the agricultural sector and inform
decision making to ensure the best use of our agricultural land in the future. The initial product was a
static map and associated reports but spatial datasets produced for the Audit can now be viewed on the
DAFF Web-based Agricultural Land Information (WALI).
Most of the current land-use information used in the Audit is sourced from the RSC land use mapping.
The Audit also uses the RSC product AussieGRASS to help define grazing classes.
The land use categories from QLUMP are used (directly or via the audit) to define trigger areas and
assess applications under the RPI Act as well as amendments to the VMA. DAFF (and DNRM) carryout
assessments in relation to Protected Agricultural Land Uses (PALUs) and Strategic Cropping Lands
(SCL) within Priority Agricultural Areas (PAA) and Strategic Cropping Areas (SCA) which are
designated under the RPI Act. The DAFF and DNRM assessments are provided as advice to DSDIP for
a final decision on the applications.
RSC products required to verify applications relating to SCL and PALUs include crop frequency
mapping and the QLUMP mapping, via the Audit or directly. Other remote sensing needs include
information on slope derived from Lidar, although this is sometimes supplied with larger applications
(e.g. from coal seam gas companies) under the RPI Act.
DPC/DNRM/DEHP - Reef Plan 3.3
The Water Quality Protection Plan for the Great Barrier Reef (Reef Plan) is a major government
initiative coordinated by the Department of Premier and Cabinet (DPC) with implementation by DEHP,
DNRM, DAFF and regional NRM bodies. Implementation of the Paddock to Reef component of the Reef
Plan requires and uses a number of remote sensing products.
The DNRM “Paddock to Reef” modelling component of the Reef Plan relies on the ground cover, land
use and woody extent data as inputs to the catchment water quality models or “Source Catchments”.
This modelling is used to estimate average annual loads of key pollutants (sediment, nutrients and
pesticides) for each of the 35 catchments draining to the Great Barrier Reef.
Ground cover and woody vegetation cover information is required to report against the ground cover
and riparian vegetation catchment indicators under the Reef Plan. The water bodies produced by the
RSC are used as an input to update the extent of wetlands produced by the Queensland Herbarium.
This wetland mapping is used to report directly on the change in extent of wetlands Reef Plan target
and as an input into the change in wetland function Reef Plan target.
The above measures calculated from RSC products - pollutant loads, ground cover, riparian vegetation
extent wetland extent and (in future) wetland function - are included in the annual Report Cards that
track the progress of the Reef Plan against the specified catchment targets.

Re v i e w of R em o t e S e n s i n g A p pl i c a t i o n s f or N a t ur a l R es o ur c e M a n a ge m e n t
© E CO LO G ICA L A U S T RA L IA P T Y LT D 13
Other remote sensing needs identified by users for reef plan modelling included:
Mapping of gullies and stream bank erosion.
Mapping of surface rock cover.
Direct measurement of change in land management.
Direct measurement of turbidity (in larger rivers).
Fire scar data could be incorporated models in future although additional information to that
currently collected, such as changes in cover and nutrient fluxes, may be required.
The Reef Water Quality Program (RWQP), run by DEHP, is part of the overall Reef Plan and aims to
help deliver on targets by changing management practices on grazing (and cane) lands. In recent years
the focus of this program has shifted from regulatory to a more extension approach with the emphasis
now on making relevant information available for land managers to facilitate management change. The
remote sensing information used in this programme includes ground cover, land use mapping and
potentially other datasets such as fire scar mapping. DEHP has previously contributed to funding for
delivery of these products.
The RSC ground cover and land use mapping dataset are incorporated into applications such as
FORAGE and VegMachine which allow land managers to assess ground cover in their areas of interest
relative to the surrounding region. These applications are also incorporated into the Best Management
Practice (BMP) guidelines that were developed as part of the RWQP and are used by extension officers
in DAFF, regional NRM bodies and industry.
DEHP 3.4
Petroleum & Gas 3.4.1
The Petroleum and Gas (P&G) compliance unit in DEHP needs remote sensing to audit the location of
P&G infrastructure relative to approved Environmental Authorities. This infrastructure includes wells,
pipelines, waste streams, gas processing plants etc.
DEHP has previously commissioned the RSC to conduct a trial project to develop a method and now
funds annual assessments. This annual monitoring does not include the whole state but focuses on
compliance priorities such as infrastructure location in relation to environmentally sensitive areas or in a
region. This information is used to assess if more detailed work and/or compliance investigations are
required and can include the utilisation of the RSC compliance support unit.
Other potential needs identified included:
An annual across the board assessment of new P&G infrastructure. This is currently being
investigated by the RSC to determine if it can be delivered in a cost effective manner.
The measurement of water discharge and dams levels in P&G holding ponds. This requirement
has also been identified by DNRM officers involved in CSG work (see section 3.1.5).
DEHP P&G compliance also investigates issues such as oil spills for which high resolution near real
time imagery is required. This is to provide an accurate picture of activities on the ground in what are
sometimes very remote localities.
Other activities of the P&G unit that require remote sensing include the assessment of approvals in
relation to Category A, B and C Environmentally Sensitive Areas define under the Environmental
Protection Act 1994 (EPA 1994). These requirements are similar to those used in the vegetation
monitoring, auditing and assessment by DNRM (section 3.1.2) including the woody extent layer to

Re v i e w of R em o t e S e n s i n g A p pl i c a t i o n s f or N a t ur a l R es o ur c e M a n a ge m e n t
© E CO LO G ICA L A U S T RA L IA P T Y LT D 14
assess regrowth vegetation and the regional ecosystem and wetland mapping (which use RSC
products as inputs in their compilation).
Coastal management 3.4.2
Coastal management requires the measurement of changes over time in coastal land forms and
geomorphology. This is done to carry out coastal hazard and risk assessments related to issues such
as storm surge, tidal inundation and mapping of evacuation areas. Detailed products derived from
repeat Lidar imagery, which have been obtained in coastal areas, are particularly useful for this use.
State of the Environment 3.4.3
The State of the Environment (SOE) report is to be published at least every four years as specified
under the Environmental Protection Act 1994 and the Coastal Protection and Management Act 1995.
The State of the Environment report is a whole-of-government report that includes an assessment of the
condition of Queensland’s environment and identifies significant trends in environmental values.
This requires state-wide datasets (such as those produced by the RSC) that can be used to monitor
changes in the environment over time. The SOE has proposed to replace the static four yearly SOE
report with a web based reporting tool.
Biodiversity 3.4.4
The Biodiversity Planning Assessments (BPA) complied by DEHP require state or region wide datasets
that can be interpreted and incorporated into biodiversity assessments.
The extent of woody vegetation is currently used to indicate non-remnant woody vegetation to map
potential offset sites and/or hubs for use under the Environmental Offsets Policy. The riparian mapping
product is likely to be incorporated into the BPA as well. The woody change extent and water body
mapping is incorporated into updates of the regional ecosystem and wetland mapping (by the
Queensland Herbarium) which is used by DEHP in Biodiversity Assessments including the definition of
essential habitat. These are incorporated into mapping of Matters of State Environmental Significance
(by DSDIP) and into the essential habitat and wetland mapping under the VMA by DNRM.
The QLUMP mapping is used to indicate areas suitable or not suitable for off-sets. QLUMP is also used
in the aquatic conservation assessments as a measure of the naturalness criteria. These are
incorporated into the map of referable wetlands that is (currently) incorporated into the Matters of Sate
Environmental Significance which is used by DSDIP to define Matters of State Environmental
Significance.
The Biodiversity Planning Assessments require an index of vegetation condition. The ground cover
datasets have been trialled to do this but require further development to determine the most appropriate
way to use and interpret the data for condition. There may be some synergies with other application
being developed for grazing assessments, although for biodiversity purposes there is a need to
separate out exotic from native cover. The persistent green trend product could also provide useful
information in relation to condition.
Lidar and or radar imagery is potentially useful where there is a need to measure actual progress of
vegetation rehabilitation on an offset site under the Environmental Offsets Policy. Lidar could potentially
measure actual height and stem densities and other attributes that contribute to these measurements.
Fire history mapping is required to carry out ecological assessments, and calculation of greenhouse gas
emission calculations and changes in fire regime for incorporation into direct benefits management plan
under the Environmental offsets policy.

Re v i e w of R em o t e S e n s i n g A p pl i c a t i o n s f or N a t ur a l R es o ur c e M a n a ge m e n t
© E CO LO G ICA L A U S T RA L IA P T Y LT D 15
A range of remote sensing products can provide information to indicate species habitat or provide inputs
into species modelling. For example Lidar products are used to map vegetation structure to refine the
endangered Mahogany Glider habitat models which are incorporated into the essential habitat mapping
under the VMA and Matters of State Environmental Significance (MSES).
Remote sensing of woody vegetation structure is required for estimates of woody biomass and carbon
for use in the Regrowth Benefits Tool which is being produced for DEHP. The woody FPC extent is
used to delineate regrowth areas for potential carbon sequestration sites and the RSC biomass library
is used to calibrate radar imagery estimates of biomass. Detailed information on vegetation structure
such as that produced by Lidar imagery would be useful in this regard.
DSDIP 3.5
Implementation of the RPI Act by DSDIP requires information on cropping, horticulture and other
intensive agricultural land use categories. This information is used to derive the Priority Agricultural
Areas (PAA) and the Strategic Cropping Areas (SCA) mapping. The RSC land use and crop frequency
mapping products are considered essential inputs into the development of the above mapping by
DSDIP. The RSC land use mapping is a major dataset used to derived the PAA by DSDIP. The SCA
mapping is derived from Strategic Cropping Lands mapping developed by DNRM which incorporates
the RSC land use mapping (see section 3.1.3). The RSC satellite imagery is also used by DSDIP as
background to check the mapping and areas in the development of these products.
The RSC land use mapping is also used by DAFF (section 3.2.2) and DNRM (section 3.1.2) in the
assessment of applications made under the RPI Act for subsequent advice to DSDIP as the decision
agency. Land holders and other entities also use this information when making applications under the
RPI Act, including accessing the crop frequency mapping via DSITIA’s FORAGE application. The scale
and frequency of updates are considered as limitations to the mapping, although it is acknowledged that
the ongoing mapping program is continuously improving these aspects of the datasets.
A number of RSC products are, at least indirectly, incorporated into the Strategic Environmental Areas
(SEA) under the RPI Act and the Matters of State Environmental Significance (MSES) mapping used
under the State Planning Policy (SPP) to define state interests under the Sustainable Planning Act 2009
(SPA). This includes the regional ecosystem and wetland mapping (which are updated using the RSC
woody change and water body mapping). The terrestrial and aquatic Biodiversity Planning Assessments
and Essential Habitat mapping (see section 3.4.4) which are reliant on the wetland and regional
ecosystem mapping and therefore the RSC woody change and water body mapping.
NPRSR - f i re management 3.6
The management of fires on the conservation reserves requires mapping of fire history across the
reserve estate to enable the assessment of fire risk. The RSC fire scar history mapping can contribute
to these assessments along with other NPRSR data sources. The use of the RSC fire scar history
mapping product varies across the agency from frequent to intermittent mainly due to it not being widely
accessible on internal applications. More advanced users were able to download the datasets from
QGIS. The mapping is not always reliable in parts of the state where confounding land uses such as
cultivation are common.
PSBA 3.7
The PSBA requires fire scar mapping and vegetation information to assess fire hazard and risk across
Queensland. The PSBA has develop a number of applications that use RSC products including:
Re v i e w of R em o t e S e n s i n g A p pl i c a t i o n s f or N a t ur a l R es o ur c e M a n a ge m e n t
© E CO LO G ICA L A U S T RA L IA P T Y LT D 16
The Total Operational Map which uses arrange of datasets that includes the RSC fire scar
mapping to indicate fuel loads and likelihood of fire on a web server application for use by the
Queensland Fire and Emergency Services.
The Queensland Natural Disaster Register which uses fire scar and regional ecosystem
mapping to model fuel loads. This product in currently in an advanced development stage and
should be released in 2015.
The Bushfire Prone Area tool which uses fire scar, regional ecosystem, woody FPC and ground
cover mapping as well as other datasets such as the regional ecosystem mapping to map bush
fire prone areas on an annual basis.
Limitations to the existing RSC datasets include a lack of accuracy in the FPC product in some coastal
areas. There is also a need for a more integration between the RSC water body data set with the
related regional ecosystem and wetland mapping to define what the different products map and how
they can be readily combined to give an overall assessment of water in the landscape. Other needs
include the development of more detailed biomass mapping broken into woody and non- woody
fractions for use in fire hazard assessments.
Regional NRM Bodies 3.8
There are over 14 regional NRM bodies in Queensland covering a diverse range of environments and
associated issues. Only representatives from the SEQ regional body and the coordinating NRM
collective body were interviewed in this study. While the needs may be similar to other regional bodies
there could also be variations across the state not reflected in this summary.
The SEQ catchments group listed a wide range of needs for RSC products including development of
benchmarks for NRM plan targets in relation to matters including ecosystem services, fragmentation,
and riparian health. These benchmarks are incorporated into statutory regional plans (for DSDIP) and
the targets for water quality under the Healthy Country Program in SEQ (for DEHP) as well as reporting
to the Commonwealth Government. Other uses included generating habitat mapping for the DEHP's
Back on Track Program and producing a range of value added products for groups such as local
governments, non-government organisations and SEQWater. Extensive use was made of the RSC
woody cover, ground cover and land use mapping in these applications.
The catchments groups require assessments of landscape health across catchments but also for
monitoring and auditing of individual projects. The woody and ground cover products are used to
assess vegetation condition and health and quantify ecosystem services. The persistent green product
is seen as potentially useful for monitoring changes in landscape heath and identifying changes in
woody cover and associated impacts of grazing for use in extension activities with graziers. This
product is used to identify spread of Prickly Acacia to enable more strategic targeting of weed control
efforts.
The SLATS annual report is used extensively by SEQ Catchments (and other regional NRM bodies) to
provide relevant statistics on changes in extent of vegetation across their area. The report is also
supplied to local Governments and other organisations such as SEQWater and for the identification of
priorities for investments and extension work.
The ground cover data and associated FORAGE and VegMachine applications are extensively used by
regional bodies to engage with graziers and identify areas for investment in NRM projects and to
promote Best Management Practice (BMP) guidelines in the reef catchments.

Re v i e w of R em o t e S e n s i n g A p pl i c a t i o n s f or N a t ur a l R es o ur c e M a n a ge m e n t
© E CO LO G ICA L A U S T RA L IA P T Y LT D 17
The RSC fire scar mapping has been used to assess fire history and develop of fire management
guidelines by at least one regional body although it is not used by SEQ Catchments. The riparian trend
data is used for targeting rehabilitation sites and the use of laser scanning (including the terrestrial laser
scanner) is potentially useful for monitoring and auditing rehabilitation sites.

Re v i e w of R em o t e S e n s i n g A p pl i c a t i o n s f or N a t ur a l R es o ur c e M a n a ge m e n t
© E CO LO G ICA L A U S T RA L IA P T Y LT D 18
4 Assessment of RSC products against user needs
Table 1 provides a summary of the major uses identified in the user needs survey against the major
current operational and some developmental RSC products and Figure 3 summarises the major policy
drivers associated with each of the RSC products. Following is a more detailed assesment of these
RSC products which includes an assessment of their fit for purpose to meet the needs of DNRM and
other groups. Any limitations of, and/or improvements to, current products are also highlighted.
Existing operat ional products 4.1
Unexplained clearing assessment 4.1.1
The current compliance assessment produced by RSC allows for the rapid sorting and prioritising of
unexplained clearing for subsequent investigation by DNRM regional staff. Apart from relying on reports
from third parties this is the only cost effective method available to flag such areas. While the number of
cases proceeding to prosecution has declined in recent years, the ability to audit tree clearing across
the state is still seen as an important deterrent to illegal tree clearing and part of the DNRM compliance
strategy.
DNRM users in operations support indicated that it would be useful to acquire finalised SLATS data in a
quicker time frame for reporting and auditing priority areas or issues. Figures for priority areas (e.g.
thinning in the Brigalow Belt) could be produced from the interim SLATS data although the
recommended approach is to investigate further modification to the SLATS method and/or to prioritise
areas for finalisation (see section 5.1.3).
Compliance support 4.1.2
The RSC provides technical support to DNRM and DEHP for more detailed compliance cases including
prosecutions under relevant legislation. The number of prosecutions within DNRM has decreased over
the last 3 years and is now only one or two a year. Even though the time spent by RSC staff on each
individual case has increased, it appeared overall demand for this service to DNRM in relation to
vegetation matters had decreased.
The compliance support function delivered by RSC is also utilised (and paid for) by Petroleum & Gas
compliance at DEHP and may be relevant to other matters in DNRM such as water. The compliance
support service provided by RSC to DNRM should be reviewed in this context.
Reporting on clearing 4.1.3
The RSC continues to produce an annual SLATS report which includes statistics on clearing
categorised by attribute such as remnant status, local government area, regional NRM body or
bioregion. The SLATS supplementary report, which reports on areas by type of clearing such as
clearing permits, thinning and other self-assessable codes, has in the past been produced by the
DNRM policy group.
The user needs analysis found that the information in the SLATS report is used by a range of agencies
including regional NRM bodies and is considered reliable, point of truth data for tree clearing with a high
acceptance by stakeholders. These reports were not widely used by DNRM users interviewed, although
the land and mines policy section indicated that the supplementary report was still required for
monitoring policy implementation.

Re v i e w of R em o t e S e n s i n g A p pl i c a t i o n s f or N a t ur a l R es o ur c e M a n a ge m e n t
© E CO LO G ICA L A U S T RA L IA P T Y LT D 19
Table 1: Summary of RSC products, identified needs and limitations
1 Denotes derived from material provided by RSC
RSC product,
application DNRM/other agency needs Legislation/major policy Fit for purpose/ limitations/
Unexplained
clearing
assessment
DNRM – Prioritisation of unexplained
clearing for subsequent vegetation
compliance case investigations.
Vegetation Management Act 1999 (through the Sustainable
Planning Act 2009), subordinate legislation, policy and
instruments (Native Forest Practice, Area Management
Plans; Self-assessable vegetation clearing codes), DNRM
Compliance Strategy
Appropriate and required for compliance
strategy implementation. Updated interim
assessment provides a more timely product
for compliance needs although more timely
product required by DNRM for auditing self-
assessable codes and other specific issues.
Compliance
support
DNRM – Support for selected vegetation
compliance cases.
Vegetation Management Act 1999 (through the Sustainable
Planning Act 2009), subordinate legislation, policy and
instruments (Native Forest Practice, Area Management
Plans; Self-assessable vegetation clearing codes), DNRM
Compliance Strategy
This support is required although level of
demand for vegetation compliance should
be reviewed within the context of
requirements to support DEHP petroleum &
gas and any other needs within DNRM (e.g.
water).
Woody clearing
and clearing by
type reports
DEHP - SOE reporting. Environmental Protection Act 1994, Coastal Protection and
Management Act 1995 The replacement with an online report, as
per current WetlandInfo or SOE proposal, is
an alternative way to provide this data. The
gross clearing figures need to be broken
down by clearing type as per the
supplementary report to enable full
interpretation of results.
Regional NRM bodies - for reporting. Statutory Regional Plans, reporting for local government,
SEQWater state of the catchments
DNRM – To monitor vegetation
management policy implementation.
Vegetation Management Act 1999 (through the Sustainable
Planning Act 2009) and subordinate legislation

Re v i e w of R em o t e S e n s i n g A p pl i c a t i o n s f or N a t ur a l R es o ur c e M a n a ge m e n t
© E CO LO G ICA L A U S T RA L IA P T Y LT D 20
RSC product,
application DNRM/other agency needs Legislation/major policy Fit for purpose/ limitations/
Woody extent and
change in extent
DNRM - Defining High Value Regrowth on
certified mapping, input wetlands regional
ecosystem mapping. These products are
currently updated only by the PMAV
process.
Vegetation Management Act 1999 (through the Sustainable
Planning Act 2009) and subordinate legislation
Appropriate for use in broader level
assessments. Where lack of resolution for
property level assessments is limiting,
available aerial photographs and other
higher resolution imagery is used to verify
Landsat based products.
- Used in development assessments
included broad scale clearing, Material
Change of Use, Reconfiguration of Lots
for advice to the decision agency DSDIP.
Sustainable Planning Act 2009 and other relevant
development assessment matters (e.g. local government
planning schemes).
- Monitoring and auditing of SLAM and
Stock route condition assessment.
Land Protection (Pest and Stock Route Management) Act
2002
- Input into salinity modelling and hazard
assessment.
Reporting in the MDB Salinity Management Stately
(schedule B salinity).
DEHP/DSDIP/DNRM - Input into regional
ecosystem mapping which is used for
supporting mapping under the VMA, input
into Biodiversity Planning Assessments
and definition of Critical Habitat by DEHP
and subsequent use in Matter of State
Environmental Significant by DSDIP and
definition of Environmentally Sensitive
Areas by DEHP.
Definition of Category A, B and C Environmentally Sensitive
Areas under the Environmental Protection Act 1994 (EPA
1994), Matters of State Environmental Significance
mapping under the Sustainable Planning Act 2009.
Vegetation Management Act 1999 and Sustainable
Planning Act 2009 and subordinate legislation
Regional NRM bodies – for reporting and
assessments.
Statutory Regional Plans, Regional NRM Investment
Program.
DPC/DNRM/DEHP - input into catchment
loads modelling, direct reporting against
riparian target (GBR riparian mapping
product).
Reef Plan and Regional NRM Investment Program.

Re v i e w of R em o t e S e n s i n g A p pl i c a t i o n s f or N a t ur a l R es o ur c e M a n a ge m e n t
© E CO LO G ICA L A U S T RA L IA P T Y LT D 21
RSC product,
application DNRM/other agency needs Legislation/major policy Fit for purpose/ limitations/
Woody extent and
change in extent
cont….
DEHP - identifying potential
Environmental Offset areas.
Identification of carbon in the regrowth
assessment tool.
Environmental Offsets Act 2014, Commonwealth emissions
reduction fund.
PSBA – defining fire hazard and risk Public Safety Business Agency Act 2014

Re v i e w of R em o t e S e n s i n g A p pl i c a t i o n s f or N a t ur a l R es o ur c e M a n a ge m e n t
© E CO LO G ICA L A U S T RA L IA P T Y LT D 22
RSC product,
application DNRM/other agency needs Legislation/major policy Fit for purpose/ limitations/
Ground cover
monitoring
DPC (DNRM/DEHP) - input into
catchment loads modelling and direct
measurement of ground cover target
(Reef Plan ground cover and pollutants
loads targets).
DEHP - input into the grazing Best
Management Practice guidelines and
other extension activities.
Input into extension activities to improve
management practices
Reef Plan and Regional NRM Investment Program, Reef
Water Quality Program.
Provides fit for purpose products which are
incorporated into a range of applications for
specific uses. Ongoing improvements in
products are occurring.
DNRM - vegetation condition audits for
stock route and other State Land Assets.
Land Protection (Pest and Stock Route Management) Act
2002 and State Lands Assets Management (SLAM).
DAFF applications (FORAGE,
VegMachine, AussieGRASS) used to
assess drought and as an extension tool.
Used to help define grazing classes (via
AussieGRASS) in the Audit. Used (directly
or indirectly via derived applications) as
decision support tool for economic
forecasting and other assessments
Economic assessments forecasting, drought assessment,
tools for extension and decision making by land manager.
DSDIP (assessments by DAFF/DNRM) -
input into defining and assessments for
Strategic Cropping Lands and Priority
Agricultural Land Use.
Regional Planning Interest Act 2014 (used by assessment
agencies (DAFF and DNRM) to provide information to
decision agency (DSDIP).
PSBA – defining fire hazard and risk Public Safety Business Agency Act 2014

Re v i e w of R em o t e S e n s i n g A p pl i c a t i o n s f or N a t ur a l R es o ur c e M a n a ge m e n t
© E CO LO G ICA L A U S T RA L IA P T Y LT D 23
RSC product,
application DNRM/other agency needs Legislation/major policy Fit for purpose/ limitations/
Land use mapping
DPC (DNRM/DEHP) - input into
catchment loads modelling (Reef Plan
pollutant loads targets).
Reef Plan and Regional NRM Investment Program, Reef
Water Quality Program.
More frequent and/or consistent updates are
required, preferably at least every 5 years,
and with a forward schedule. Generally
accepted as a useful regional scale
assessment tool, with continuous
improvements in scale and category
resolution over time requirement to meet
more detailed needs.
DAFF - incorporated into the Agricultural
Land Audit (the Audit) to help define land
important to current agricultural production
and for economic forecasting.
Assessment of PALU for advice to DSDIP
Queensland Government commitment to support the
agriculture pillar.
Regional Planning Interest Act 2014
DSDIP – incorporated into definition of
SAA and SCA Regional Planning Interest Act 2014
DNRM – Assessment of SCA for advice to
DSDIP Regional Planning Interest Act 2014
DEHP- Input into Biodiversity
Assessments which are incorporated into
Matters of State Environmental
Significance mapping used by DSDIP.
State Planning Act 2009
DEWS - development of irrigation
estimates in groundwater irrigation areas1
Water Act 2000.
Regional NRM bodies and other –
planning and reporting and extension Statutory Regional Plans and non-statutory planning.

Re v i e w of R em o t e S e n s i n g A p pl i c a t i o n s f or N a t ur a l R es o ur c e M a n a ge m e n t
© E CO LO G ICA L A U S T RA L IA P T Y LT D 24
RSC product,
application DNRM/other agency needs Legislation/major policy Fit for purpose/ limitations/
Water body
mapping, other
hydrology
DNRM/DEHP/DSDIP - input into the
updating of the Queensland Wetland
Mapping which are incorporated in the
monitoring reef plan catchment indicator
targets (wetland extent and
condition).VMA regulated map, the
Aquatic Biodiversity Planning Assessment
(DEHP) and subsequently matters of
State Environmental Significance (DSDIP)
Reef Plan and Regional NRM Investment Program,
Vegetation Management Act 1999 and Sustainable
Planning Act 2009 and subordinate legislation. A range of needs in relation of hydrology
identified by DNRM users are not addressed
by current RSC products and require the
development of new products/applications.
DEWS – dam safety assessments1 Water Act 2000; National water compliance framework.
1
DNRM/DEHP – potential input into
Ground Water Dependent Ecosystem
(GDE) identification.
Water Act 2000, Office of Groundwater Impact Assessment.
Fire scar mapping
PSBA – defining fire hazard and risk Public Safety Business Agency Act 2014 Useful product although there needs to be
further engagement by the RSC with users
to clarify the role of the RSC fire scar
mapping in relation to other products
available and its application in specific
situations.
NPRSR - fire risk assessment for estate
although variable availability on intra
departmental systems and variable
reliability in some areas.
Nature Conservation Act 1992.
Coal seam gas
compliance
mapping
DEHP - Petroleum and Gas Compliance.
To highlight areas of activities that are
potentially outside approved areas or to
audit high risk areas and provide support
for subsequent investigations
Petroleum and Gas (Production and Safety) Act 2004 (P&G
Act), Petroleum Act 1923 and Water Act 2000 (Chapter 3).
Current program meets the needs of DEHP
subject to ongoing review. DNRM - Coal seam gas engagement and
compliance plan 2013. Provides support
for community liaison activities.
Support for the DNRM coal seam gas Engagement and
Compliance Plan 2013.
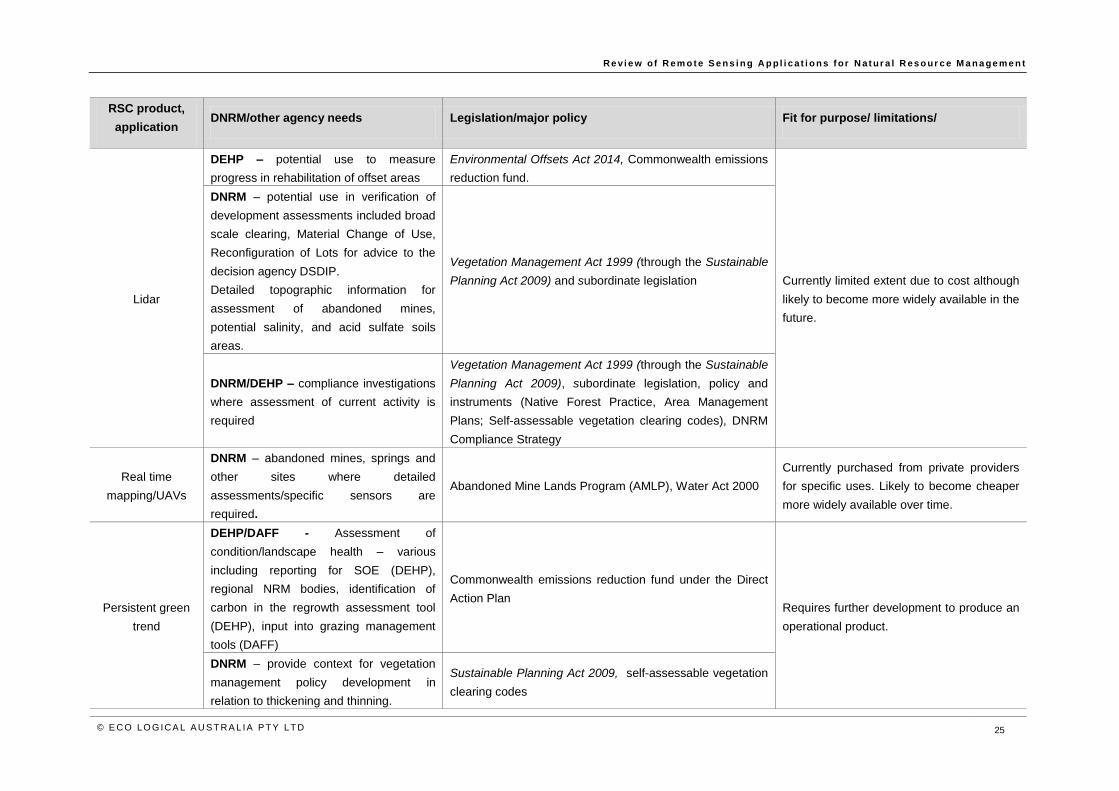
Re v i e w of R em o t e S e n s i n g A p pl i c a t i o n s f or N a t ur a l R es o ur c e M a n a ge m e n t
© E CO LO G ICA L A U S T RA L IA P T Y LT D 25
RSC product,
application DNRM/other agency needs Legislation/major policy Fit for purpose/ limitations/
Lidar
DEHP – potential use to measure
progress in rehabilitation of offset areas
Environmental Offsets Act 2014, Commonwealth emissions
reduction fund.
Currently limited extent due to cost although
likely to become more widely available in the
future.
DNRM – potential use in verification of
development assessments included broad
scale clearing, Material Change of Use,
Reconfiguration of Lots for advice to the
decision agency DSDIP.
Detailed topographic information for
assessment of abandoned mines,
potential salinity, and acid sulfate soils
areas.
Vegetation Management Act 1999 (through the Sustainable
Planning Act 2009) and subordinate legislation
DNRM/DEHP – compliance investigations
where assessment of current activity is
required
Vegetation Management Act 1999 (through the Sustainable
Planning Act 2009), subordinate legislation, policy and
instruments (Native Forest Practice, Area Management
Plans; Self-assessable vegetation clearing codes), DNRM
Compliance Strategy
Real time
mapping/UAVs
DNRM – abandoned mines, springs and
other sites where detailed
assessments/specific sensors are
required.
Abandoned Mine Lands Program (AMLP), Water Act 2000
Currently purchased from private providers
for specific uses. Likely to become cheaper
more widely available over time.
Persistent green
trend
DEHP/DAFF - Assessment of
condition/landscape health – various
including reporting for SOE (DEHP),
regional NRM bodies, identification of
carbon in the regrowth assessment tool
(DEHP), input into grazing management
tools (DAFF)
Commonwealth emissions reduction fund under the Direct
Action Plan Requires further development to produce an
operational product.
DNRM – provide context for vegetation
management policy development in
relation to thickening and thinning.
Sustainable Planning Act 2009, self-assessable vegetation
clearing codes

Re v i e w of R em o t e S e n s i n g A p pl i c a t i o n s f or N a t ur a l R es o ur c e M a n a ge m e n t
© E CO LO G ICA L A U S T RA L IA P T Y LT D 26
Figure 3 Policy and planning instruments associated with RSC products
It is recommended that the RSC should consider producing the supplementary report instead of the
SLATS report for use by DNRM policy. This is because clearing under self-assessable codes is likely to
have increased in recent years and this information is required to interpret the gross figures.
The report could be produced bi-annually rather than annually as is the regional ecosystem extent and
change in extent report (by the Queensland Herbarium). It is recommended that the static pdf type
reporting be replaced with an on line web delivery system, similar to the summary tool on the
Queensland Government WetlandInfo web site (see section 9.1 on web delivery tools). The next SOE
report by DEHP is considering a similar approach and may be an avenue to producing such as
summary tool for woody extent and woody extent change.
Woody extent and change 4.1.4
This dataset underpins the compliance assessment product as well as a range of auditing, monitoring
and assessment activities carried out by DNRM regional staff, Reef Plan reporting and implementation,
biodiversity assessments by DEHP and a wide range of activities in regional NRM bodies. This dataset
also provides inputs into various grazing management tools developed and/or used by DAFF.
The woody extent and historical clearing data and associated Landsat imagery are widely used for
vegetation assessments by DNRM users particularly to determine the remnant status of vegetation
under the VMA in investigation of compliances cases and verification of development and PMAV
applications. The data are also used as context in a range of other monitoring and auditing

Re v i e w of R em o t e S e n s i n g A p pl i c a t i o n s f or N a t ur a l R es o ur c e M a n a ge m e n t
© E CO LO G ICA L A U S T RA L IA P T Y LT D 27
assessments that require advice on specific issues or situations such as management of State Lands
Assets (including stock routes) or advice on implementation of self-assessable codes under the VMA.
Other uses of the RSC woody extent and change in extent data include:
An input into the catchment loads modelling for reporting on progress against Reef Plan loads
target. This product is considered an essential input and appropriate for use in the catchment
scale modelling.
An input into the GBR riparian mapping for reporting against Reef Plan riparian target. This
product is considered an essential input and appropriate for use in the catchment indicator
reporting.
Defining regrowth vegetation on assessable vegetation under the VMA by DNRM regional staff.
State-wide updates to this mapping would require the RSC products although at this stage
updates only occur through the PMAV process.
Defining potential offsets areas for environmental and carbon sequestration. This product is an
important input into these tools that are/potentially widely used in DEHP and industry and need
to be updated annually.
Input into salinity modelling and hazard assessment by DNRM for reporting in the Murray
Darling Basin (MDB) Salinity Management Strategy (schedule B salinity).
Input into regional ecosystem mapping which is used for a variety of purposes included
supporting mapping under the VMA, input into Biodiversity Planning Assessments and definition
of Critical habitat by DEHP and subsequent use in Matter of State Environmental Significant by
DSDIP and definition of Category A, B and C Environmentally Sensitive Areas by DEHP.
Defining fire risk in Bushfire Prone Area mapping by the PSBA.
The resolution of these Landsat derived data is seen as a limitation for property level assessments.
However, users showed a high level of knowledge of the limitations and appropriate fit for purpose
applications. The products are used for regional/context assessment and some property level
assessments in western parts of the state. Generally more detailed SPOT imagery, aerial photography
from the DNRM SMARTMAP system or Google Earth imagery is used for property level assessments,
particularly for assessment of smaller areas in more coastal parts of the state.
The SPOT imagery does not have the historical archive of the Landsat imagery which lessens its utility
for assessment of remnant/non-remnant status. However, the state-wide SPOT captures are used
widely as an assessment tool and have been used to create a woody extent layer in parts of the state
(e.g. by RSC for koala habitat mapping and by SEQ catchments for assessments of ecosystem
services). The creation of a state-wide woody extent layer from the SPOT imagery would be a useful
additional tool, if it could be produced in a cost effective way.
Ground cover 4.1.5
The ground cover dataset underpins a range of other products and derived applications particularly for
Reef Plan reporting and implementation and as inputs into a variety of grazing management tools. Most
users access the ground cover data via derived applications that have been developed for a specific
use.
The ground cover dataset provides important inputs into the catchment loads modelling for reporting on
progress against Reef Plan loads target in the Reef Plan Report Cards. The ground cover data are also
used to produce the GBR ground cover mapping for reporting against Reef Plan ground cover target.
The ground cover is considered an essential input and appropriate for use in both these activities.

Re v i e w of R em o t e S e n s i n g A p pl i c a t i o n s f or N a t ur a l R es o ur c e M a n a ge m e n t
© E CO LO G ICA L A U S T RA L IA P T Y LT D 28
Various products are derived from the ground cover dataset and incorporated into the FORAGE and
VegMachine applications. These applications provide users with contextualised ground cover reports for
user defined areas within a regional context that partition out the effects of season from management.
These tools have been included in the grazing Best Management Practice guidelines that were initiated
by DEHP for use in the implementation of the Reef Plan by DAFF, industry and regional NRM bodies.
The FORAGE and VegMachine tools are also extensively used for more general extension activities by
DAFF, regional NRM groups and as an aid to decision making by private industry. The FORAGE
ground cover reports have recently been used for the assessment of drought declarations and
revocations of individual properties by DAFF staff and drought committees. Users indicated this
information is proving a useful objective tool as well an leading to improved efficiencies as departmental
officers do not have to spend time carrying out property inspections.
Other uses of the RSC ground cover data and derived products include:
Estimation of vegetation condition for biodiversity assessments. This has been trialled by DEHP
in several regions of the state. More work is required to determine the most appropriate way to
analyse and interpret the data for biodiversity.
Condition assessments of stock routes and other State Land Assets by DNRM monitoring and
auditing activities. This is not a major use but DNRM staff indicated it could provide useful
context.
Condition assessments for potential policy development around soil conservation and land
condition by DNRM policy.
Facilitate the definition of grazing classes in the Agricultural Audit by DAFF (via the
AussieGRASS application).
In some cases users indicated ground cover data are not accurate in specific areas or situations (e.g.
parts of SEQ). However, there is generally a good understanding of the dataset, its limitations and
appropriate applications. There is also widespread understanding of the continuous improvement that
had been made to the ground cover dataset over the years and support for its ongoing evolution and
improvement over time.
Land use 4.1.6
The land use data provides input into a range of applications, particularly for agricultural land use
planning and trigger maps and assessments under the Regional Planning Interest Act 2014 (RPI Act).
Most of the current land-use information used in the Queensland Agricultural Land Audit (the Audit) has
been obtained from the RSC land use mapping. The audit has been compiled by DAFF to identify land
important to agricultural production and the constraints to development. The Audit is a key reference
tool to help guide investment in the agricultural sector and inform decision making.
The RSC land use mapping is an important input into the map of Strategic Cropping Land (SCL). This
map is compiled by DNRM and used as a trigger map the RPI Act administered by DSDIP. The RSC
land use mapping is used (directly or indirectly via the audit) to assess applications under the RPI Act.
These assessments are carried out in relation to SCL and Protected Agricultural Land Uses (PALU).
The assessments are carried out by DNRM and DAFF to provide advice to DSDIP to make the final
decision. The related RSC cropping frequency product is also used in these assessments to help
identify and define recent areas of cropping activity.
Other uses of the RSC land cover data include:

Re v i e w of R em o t e S e n s i n g A p pl i c a t i o n s f or N a t ur a l R es o ur c e M a n a ge m e n t
© E CO LO G ICA L A U S T RA L IA P T Y LT D 29
An input into the catchment loads modelling to report on progress against Reef Plan loads
target. The land use mapping is an essential input into this modelling.
Incorporation into Best Management Practice Guidelines extension tools under the
implementation strategies for the Reef Plan (DEHP/Industry/Regional NRM bodies).
Development of irrigation estimates in groundwater irrigation areas by the Department of
Energy and Water.
Other planning and reporting by Regional NRM bodies and other groups e.g. defining the extent
of urban footprints and rural living areas or reporting on alienation of Ecosystem Services by
SEQ catchments.
A main limitation of the land use data raised by users is the ad hoc nature of updates to the mapping
associated with the ad hoc nature of funding, such as reef catchment science in combination with a
range of other short term funding sources. More frequent and/or consistent updates are required,
preferably at least every 5 years, and with a forward schedule rather than the current ad hoc
arrangements.
Other improvements included more detailed classes such as separating the broad grazing class into
native and non-native (for biodiversity assessments by DEHP), and refinements of some of the classes
important for management such as horticultural species (e.g. bananas). Increased resolution was raised
as an issue but it is generally accepted as a useful regional scale assessment tool, and that the
resolution of the product is being continuously improved over time.
Fire scars 4.1.7
The RSC fire scar mapping is seen as a potentially useful product by a range of users. Current and
potential uses include:
Assessment of fire risk/hazards on the reserve estate (NPRSR) and other areas (Public Safety
Business Agency (PSBA) and Queensland Fire and Emergency Services (QFES).
Development of fire management guidelines by regional NRM bodies for the Reef Water Quality
Program (DEHP) under the implementation of the Reef Plan.
Potentially incorporated into catchment loads models for the Reef Plan although it would require
more detailed quantification of intensity and associated changes in cover and nutrient flux.
Greenhouse gas emission calculations and direct benefit management plans for offsets by
DEHP.
Fire ecological assessments (DEHP).
The fire scar mapping program includes the cloud and cloud shadow removal science which is
incorporated into the range of other Landsat derived RSC products.
The fire scar mapping is extensively used for fire hazards assessments in a number of applications
developed by PSBA. However, other users reported varying levels of accuracy particularly in areas
where cultivation is widespread. These users were not aware of the recent improvements to the method
and associated accuracy made by the RSC. Others users have difficulty accessing the fire scar data on
internal IT systems or do (did) not know that it is available in QGIS.
Some users also indicated that they obtain fire data from alternative sources such as the North
Australian Fire Information (NAFI) data base which is derived from 1.1 km resolution NOAA satellite
imagery. The AussieGRASS application uses fire mapping as an input into its pasture models but this is
sourced from the Landgate Remote Sensing Centre in West Australia.

Re v i e w of R em o t e S e n s i n g A p pl i c a t i o n s f or N a t ur a l R es o ur c e M a n a ge m e n t
© E CO LO G ICA L A U S T RA L IA P T Y LT D 30
The fire scar mapping is a relatively recent product that was first released in December 2013 that
requires a greater level understanding about how it is best used. While the fire scar mapping product
has a range of existing and potential uses, there needs to be some engagement by the RSC with users
to clarify the role of the RSC fire scar mapping in relation to other products available and its application
in specific situations.
CSG compliance 4.1.8
The annual CSG compliance assessment carried out by the RSC does not include the whole state but
focuses on compliance priorities such as infrastructure location in relation to environmentally sensitive
areas or in a region. This infrastructure includes wells, pipelines, waste streams, gas processing plants
etc. The assessment is used to determine if more detailed work and/or compliance investigations are
required and can include the utilisation of the RSC compliance support unit.
The CSG compliance mapping was originally based on Rapid Eye imagery (5 metre resolution) which
was purchased by DEHP specifically for this use. It was found that after the initial baseline mapping
using this imagery was completed, new infrastructure could be readily detected on the (freely available)
Panchromatic Landsat imagery (15 metre resolution - Figure 4). This latter imagery is more appropriate
than the normal multi-spectral Landsat imagery for the distinctive but small CSG features
Current development work to assess the potential to use time series analysis to automatically detect
when and where some CSG infrastructure is installed is underway. The distinctive size, shape and pixel
brightness values of CSG infrastructure and the fact it remains static for a number of years suggest this
might be possible, based on the experience at the RSC using similar techniques on a number of other
projects. If this is possible it will further increase the efficiency of detection of new features and speed
up notification of potential breaches. Other potential needs identified included the measurement of
water discharge and dams levels in holding ponds. This requirement is readily measured by existing
remote sensing techniques for mapping surface water (see section 4.2) although these are unlikely to
be cost effective without further investigation.

Re v i e w of R em o t e S e n s i n g A p pl i c a t i o n s f or N a t ur a l R es o ur c e M a n a ge m e n t
© E CO LO G ICA L A U S T RA L IA P T Y LT D 31
Figure 4: Comparison of imagery used for CSG Infrastructure mapping
TL Landsat 8 Panchromatic 15m 19 April 2013. TR Landsat 8 Panchromatic 15m 11 July 2014 showing new CSG features.
BL: RapidEye multispectral, 5m, 22 March 2013 BC: Landsat 8 multispectral 30m resolution. BR Landsat 8 panchromatic, 15 m resolution 19 April 2013 showing good resolution compared to
multispectral and comparable resolution for CSG features compared to RapidEye

Re v i e w of R em o t e S e n s i n g A p pl i c a t i o n s f or N a t ur a l R es o ur c e M a n a ge m e n t
© E CO LO G ICA L A U S T RA L IA P T Y LT D 32
Natural disasters 4.1.9
The mapping of natural disasters by the RSC is carried out to address specific issues as the need
arises. Past assessments have included information to assess the impacts of floods and cyclones which
have been used by DAFF, DNRM and other agencies to estimate the extent of damage against land
use and potential costs of restoration. Examples of RSC natural disaster products include the Landsat
derived mapping of floods in the Gulf Plains, mapping damage to woodlands and forests resulting from
Tropical Cyclone Yasi (and previously Larry) and use of Lidar to assess changes in erosion associated
with the floods in the Lockyer Valley (Figure 5).
Figure 5: Lidar assessment of flood damage on the Lockyer Creek
The top two images are pre (left) and post (right) flood aerial photography. Bottom shows the same areas using
Lidar derived elevation data which highlights increased scouring of the creek after the floods.
Weeds mapping 4.1.10
Many users from DNRM, DAFF, DEHP and Regional NRM groups commented on the need for accurate
mapping of weeds. No staff from Biosecurity Queensland were included on the list of interviews but this
group requires similar information to map weed distribution across the state. The nature of weeds to be
identified differed between users. For example, users from DEHP required information on all exotics
versus native cover while other agencies required specific weeds that required management in specific
situations such as protecting pasture from grazing, which is not currently provided by RSC products.
Re v i e w of R em o t e S e n s i n g A p pl i c a t i o n s f or N a t ur a l R es o ur c e M a n a ge m e n t
© E CO LO G ICA L A U S T RA L IA P T Y LT D 33
Products requiring further development 4.2
Hydrology 4.2.1
The recently completed science capability audit for water by Greenfield and Riches (2014) has
highlighted that the RSC has traditionally focused on terrestrial rather than aquatic issues. Therefore
while some of the wide range of water related needs identified in the users survey can be addressed by
some existing RSC water related products, many of the needs identified require the development of
new products.
The RSC currently produces a water mask for use in processing the Landsat archive for woody extent
and change in extent analysis. This water mask is used in updates of the Queensland wetland mapping
which in turn provide inputs into the VMA certified mapping and the Aquatic Conservation Assessments
by DEHP and subsequent incorporation into Wetland Protection Areas and matters of State
Environmental Significance used by DSDIP. This water mask is able to generate an index of water
flooding frequency across the Landsat archive. This product could be used to assess some of the
hydrological user needs particularly in relation to permanency of water and the identification of
Groundwater Dependent Ecosystems (GDEs).
Some other relevant approaches for remote sensing of issues related to GDEs have been summarised
in the GDE toolbox (Richardson et al. 2011) and the report on improved monitoring approaches for
springs in the Surat region (SKM 2014). GDE assessments are often based on the assumption that, if
vegetation is active, or wetlands and surface-water features persist, during dry periods they are likely to
be using or contain water other than surface runoff or rain-fed infiltration.
Examples of applications and remote sensing products related to hydrology that may be relevant
include:
Surface characteristics of GDE vegetation which contrast with nearby non-GDE vegetation
(particularly during dry periods or seasons), such as leaf-area index or greenness.
Higher rate of evapotranspiration (ET) where vegetation has access to groundwater, compared
with nearby non-GDE vegetation.
Constant activity rate of vegetation, suggesting a continuous supply of water. The NDVI
(Normalised Difference Vegetation Index), which is strongly correlated with primary productivity
and therefore is used as an indicator of live, green vegetation, is often used to indicate this.
Permanent high water levels within wetlands and possible presence of springs or seeps.
Detailed assessment of individual springs with specific sensors to measure attributes such as
water balance or evapotranspiration.
Use of remote sensing to measure hydraulic head and ground water using techniques such as
those outlined by Reeves et al, (2014) and Tregoining et al. (2012).
The Terrestrial Laser scanner from the RSC could be used for assessing detailed geometry at a
springs site including biomass changes and land use impacts.
Measurement of thermal anomalies related to a direct effect of groundwater on surface
temperature in groundwater discharge zones (including within water features).
Mapping of wetland/wetted extent from high resolution and multi spectral imagery or air-borne
thermal imagery to distinguish thermal anomalies associated with groundwater discharge.
Direct measurement of water quality in large rivers or estuaries.

Re v i e w of R em o t e S e n s i n g A p pl i c a t i o n s f or N a t ur a l R es o ur c e M a n a ge m e n t
© E CO LO G ICA L A U S T RA L IA P T Y LT D 34
Lidar 4.2.2
Lidar imagery can provide high resolution, three-dimensional information that can be used to derive a
number of vegetation structures (cover and height by layer) and land surface parameters which can be
made available as standard products (Figure 6). Identified needs that can be addressed by Lidar
products include assessments of:
Vegetation status under the VMA and other legislation (DNRM operations).
Gullies, stream bank erosion for input into reef modelling (DPC, DNRM, regional NRM bodies).
Defining high risk area for salinity, acid sulphate soils and coastal flooding storm surge zones.
Slope criteria for Strategic Cropping Lands and Priority Agricultural Land Use slope criteria
(DAFF, DNRM, DSDIP).
Detailed topography for assessment of drainage, flooding and safety on abandoned mines
(DNRM).
Erosion and flood recovery - before and after Lidar imagery can be used to assess changes in
stream profile (various).
Carbon accumulation in regrowth under the commonwealth’s Direct Action plan.
In combination with Lidar, the RSC has also developed methods to use the related space-borne radar
technology to derive vegetation structure and biomass products across the state. These products are
being integrated with the structural data derived from radar and cover and temporal data derived from
Landsat products to improve woody biomass and extent mapping across the state.
Existing Lidar data are expensive to capture and coverage from airborne platforms is likely to be cost
effective for specific projects over small areas. The current RSC archive (Figure 7) reflects this and
includes coastal data capture area of the eastern seaboard of the state, including captures from 2009 to
2012 and other ad hoc areas. However Lidar data may become more widespread in the futire. For
example, the Commonwealth has recently acquired Lidar data over extensive areas of the Queensland
Murray Darling Basin which should be available for use in Queensland. Furthermore there is currently a
project to place Lidar onto a space platform (University of Maryland 2014) and UAVs platforms may
potential make Lidar capture more cost effective.
RSC have developed systems to capture and store available Lidar data onto its computer infrastructure.
The capture of Queensland Government Lidar data is managed by the Spatial Imagery Subscription
Plan administered by DNRM and the Lidar coverage is likely to continue to increase over time.
Therefore, Lidar data could be used in situations where it is available and this information will become
more useful as Lidar coverage increases over time.
It is therefore recommended that the RSC:
Continue to capture all available Lidar data onto the HPC.
Develop standard products for all Lidar data stored, that can be used for vegetation and land
assessments.
Enable the above Lidar products to be discovered and accessed by users.

Re v i e w of R em o t e S e n s i n g A p pl i c a t i o n s f or N a t ur a l R es o ur c e M a n a ge m e n t
© E CO LO G ICA L A U S T RA L IA P T Y LT D 35
Figure 6: Standard Lidar products
Figure 7: Extent of Airborne Lidar coverage stored by RSC

Re v i e w of R em o t e S e n s i n g A p pl i c a t i o n s f or N a t ur a l R es o ur c e M a n a ge m e n t
© E CO LO G ICA L A U S T RA L IA P T Y LT D 36
Real time, high resolution monitoring 4.2.3
Several users highlighted the need for high resolution imagery and for real-time or near-real-time
monitoring. This included property level inspection where access is difficult or unsafe or for compliance
investigations to enable appropriate intervention where suspected illegal clearing is occurring.
In recent decades there has been a significant increase in the number of remote sensing satellites
launched into space. Advances in technology has also increased sensitivity, the range of sensors
available, resolution, operability and reduced the price of products. The use of Unmanned Aerial
Vehicles (UAVs) fitted with camera has also increased and these were often mentioned as a potential
solution by users.
Examples of a range of recently launched remote sensing satellites with possible applications to user
needs has been compiled and summarised in Appendix E. Following is a specific example of the
application of near real time monitoring using high resolution satellite imagery.
The DEHP Petroleum and Gas Compliance unit recently investigated an oil spill in remote south
western Queensland. Following advice from the RSC, this investigation used imagery from the recently1
(2011 and 2012) launched Pléiades 1A and 1B satellites (Figure 8). Features of using this technology
for this assessment include:
The identical twin satellites deliver high-resolution optical data products and offer a daily revisit
capability to any point on the globe (subject to cloud free images).
50cm black and white, 50 cm colour and 2 metre multispectral resolution products are available.
The scale of the imagery allowed for viewing of on ground activities including the extent of oil on
the surface and contour bank construction.
Costs associated with purchase of the imagery are in the order of $4,000 (AU). This is
substantially less than sending officers to this remote part of Queensland for an inspection of
the area, which at the time of the spill had strict controls on access.
Figure 8: Pléiades satellite imagery after oil spill on left and after clean up on right.
1 This satellite was launched in 2011 and the investigation occurred in 2013.
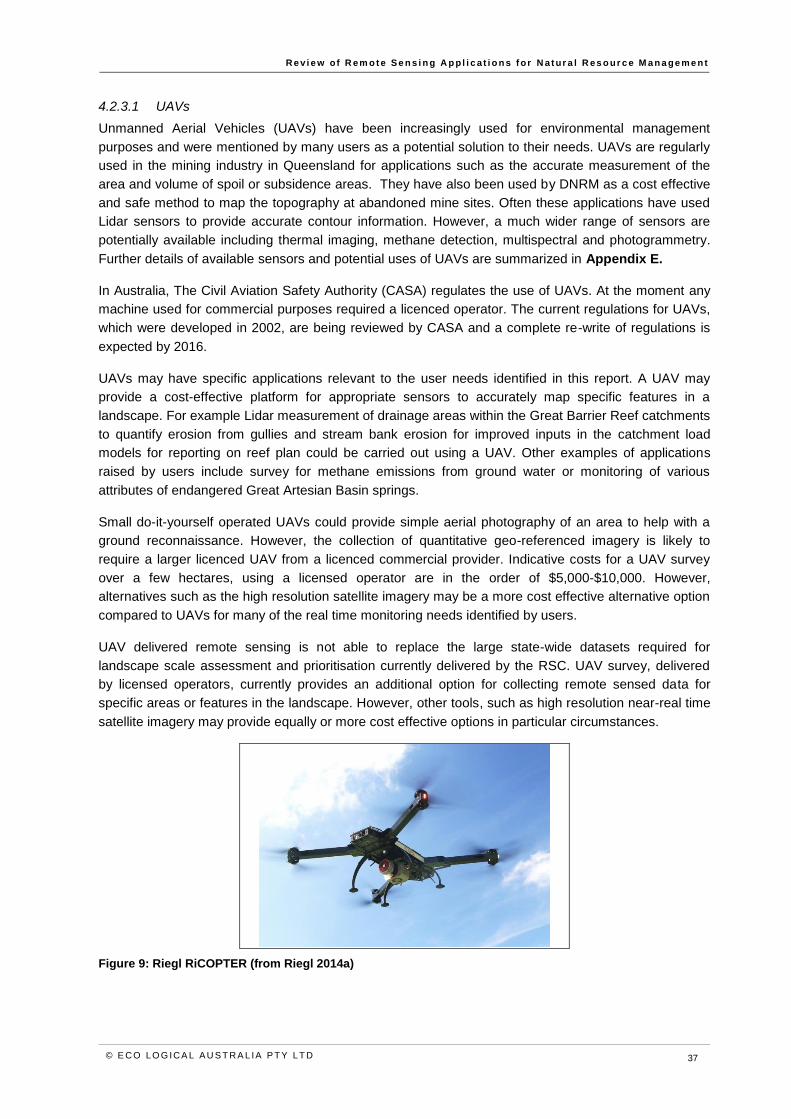
Re v i e w of R em o t e S e n s i n g A p pl i c a t i o n s f or N a t ur a l R es o ur c e M a n a ge m e n t
© E CO LO G ICA L A U S T RA L IA P T Y LT D 37
4.2.3.1 UAVs
Unmanned Aerial Vehicles (UAVs) have been increasingly used for environmental management
purposes and were mentioned by many users as a potential solution to their needs. UAVs are regularly
used in the mining industry in Queensland for applications such as the accurate measurement of the
area and volume of spoil or subsidence areas. They have also been used by DNRM as a cost effective
and safe method to map the topography at abandoned mine sites. Often these applications have used
Lidar sensors to provide accurate contour information. However, a much wider range of sensors are
potentially available including thermal imaging, methane detection, multispectral and photogrammetry.
Further details of available sensors and potential uses of UAVs are summarized in Appendix E.
In Australia, The Civil Aviation Safety Authority (CASA) regulates the use of UAVs. At the moment any
machine used for commercial purposes required a licenced operator. The current regulations for UAVs,
which were developed in 2002, are being reviewed by CASA and a complete re-write of regulations is
expected by 2016.
UAVs may have specific applications relevant to the user needs identified in this report. A UAV may
provide a cost-effective platform for appropriate sensors to accurately map specific features in a
landscape. For example Lidar measurement of drainage areas within the Great Barrier Reef catchments
to quantify erosion from gullies and stream bank erosion for improved inputs in the catchment load
models for reporting on reef plan could be carried out using a UAV. Other examples of applications
raised by users include survey for methane emissions from ground water or monitoring of various
attributes of endangered Great Artesian Basin springs.
Small do-it-yourself operated UAVs could provide simple aerial photography of an area to help with a
ground reconnaissance. However, the collection of quantitative geo-referenced imagery is likely to
require a larger licenced UAV from a licenced commercial provider. Indicative costs for a UAV survey
over a few hectares, using a licensed operator are in the order of $5,000-$10,000. However,
alternatives such as the high resolution satellite imagery may be a more cost effective alternative option
compared to UAVs for many of the real time monitoring needs identified by users.
UAV delivered remote sensing is not able to replace the large state-wide datasets required for
landscape scale assessment and prioritisation currently delivered by the RSC. UAV survey, delivered
by licensed operators, currently provides an additional option for collecting remote sensed data for
specific areas or features in the landscape. However, other tools, such as high resolution near-real time
satellite imagery may provide equally or more cost effective options in particular circumstances.
Figure 9: Riegl RiCOPTER (from Riegl 2014a)

Re v i e w of R em o t e S e n s i n g A p pl i c a t i o n s f or N a t ur a l R es o ur c e M a n a ge m e n t
© E CO LO G ICA L A U S T RA L IA P T Y LT D 38
5 Trade-offs in product delivery
Delivery of the woody extent change data, including the associated unexplained clearing assessment,
has in the past been delayed by up to two years after the clearing reporting period. This has made it
difficult to carry out investigations within the time frame required by legislation but also to allow early
intervention to halt any ongoing clearing. The RSC has recently taken steps to improve the process for
delivery of woody change products by a combination of automating more processes and delivering
interim products at an earlier date for use in compliance, followed by later completion of the final state-
wide product.
The updated process allows delivery of an interim unexplained clearing assessment 1 month after the
last image is captured for the reporting period and the final state-wide dataset to be delivered 8 months
later. This revised process has addressed many of the previous limitations in relation to timing of the
assessment. Further details of this process and possible future improvements are discussed below.
Woody extent change data 5.1
The delivery of the unexplained clearing assessment and woody change extent data under the previous
and updated process is shown graphically in Figure 10. The annual reporting of woody extent change
covers a 12 month period from dry season to dry season. The precise end date for the reporting period
is dictated by when suitable (cloud free) Landsat images can be captured for a particular location and
therefore varies from about June to November. Therefore the reporting period ends progressively,
between about June to November each year, for different parts of the state.
Previous process 5.1.1
The previous woody change assessment process delivered the state wide woody change products and
associated reports 20 or more months after the end of the reporting period. Under this process image
analysis did not begin until after images had been captured for the entire state, which was about
January in the year after the end of the reporting period. This analysis included application of automated
algorithms followed by desktop and field checking and associated manual editing and then a final
check. The change in extent data was generally completed by the September of the year after the
reporting period.
This was followed by statistical analysis and compilation of a state-wide SLATS report to accompany
the data in September. The associated unexplained clearing assessment, which breaks down the
clearing by permit and other exemptions was prepared concurrently with the full SLATS report and was
ready for release at the same time. The datasets and associated reports were completed and ready for
release by about April of the following year - about 22 months after the end of the reporting period2.
RSC unexplained clearing assessment
The unexplained clearing assessment uses data on permits, native forest practice notifications, self-
assessable codes and other exempt clearing and is obtained from the DNRM electronic Land and
2 Release of the report and data was subject to ministerial approval and therefore often did not occur until 2 or more years after
the reporting period.

Re v i e w of R em o t e S e n s i n g A p pl i c a t i o n s f or N a t ur a l R es o ur c e M a n a ge m e n t
© E CO LO G ICA L A U S T RA L IA P T Y LT D 39
Vegetation Administration System (eLVAS) database. There have been delays in transferring this data
from DNRM to RSC in the past, although RSC is not expecting delays in the future. The eLVAS data
are intersected with the preliminary woody change (tree clearing) layer and a series of rules and filters
are applied to flag areas of unexplained clearing. Further manual edits are carried out to eliminate linear
and other exempt clearing. The time taken to complete this manual editing varies with the amount of
exempt clearing that has occurred but generally takes about a week to complete.
Updated process 5.1.2
The modified woody change assessment process now in operation includes the production of an interim
change cover for use in the RSC unexplained clearing assessment that is completed 1 month after the
last image is captured for the reporting period, followed by the production of the final dataset 8 months
later.
Image analysis for the change cover now begins as soon as suitable (cloud free) imagery is captured
taking place progressively as images are acquired. The initial analysis focuses on parts of the state
where most (95%) of tree clearing has occurred in the past, which includes about half (50) of Landsat
scenes that cover the entire state. This interim analysis only includes automated processing and office
based checks and manual editing. It does not include field validation, further manual editing and final
checks. The interim analysis is completed by about December each year, shortly after the final scenes
for the reporting period are captured. This is followed by the RSC unexplained clearing assessment
which is expected to be completed by early February the year after the reporting period, for prioritisation
of investigations within each region.
After completion of the interim woody change data, the final state-wide woody change cover is then
produced by processing imagery from the remainder of the state and along with field validation, manual
editing and final checking. This is completed by June of the year following the reporting period. The
analysis and completion of the SLATS report is completed by the following August.
Further refinement 5.1.3
The user interviews indicated the updated timing and content of the interim RSC unexplained clearing
assessment was a major improvement over the previous process and is adequate for the purposes of
prioritising the work of compliance investigations in the regions. This new process is likely to require
continued refinement to ensure it continues to meet the requirements of DNRM compliance. There is
also a need to quantify the differences between the interim assessment and final assessment to allow
users to further assess the suitability of the interim products and make appropriate allowances
particularly if systematic differences occur.
Further reductions in the time lag the clearing and mapping of clearing by RSC are required to allow
DNRM to effective audit and where necessary intervene in suspected non-compliant activities,. For
example, to assess areas of thinning or fodder harvesting, currently only the gross area derived from
the total area referred under the self-assessable code notifications are available. The more timely
availability of woody change data from the RSC would allow the net area of thinning/fodder harvesting
to be assessed and audited. Currently the manual editing required to produce a final woody change
cover is a major constraint to delivering a more timely product. One solution suggested is to prioritise
the production of final woody change products for specific areas or issues.
Therefore, recommendations for future updates to the process are:
Undertake ongoing review and new interim unexplained clearing assessment to ensure it
continues to meet compliance and user needs.
Quantify changes that occur between the interim and final SLATS change cover products.
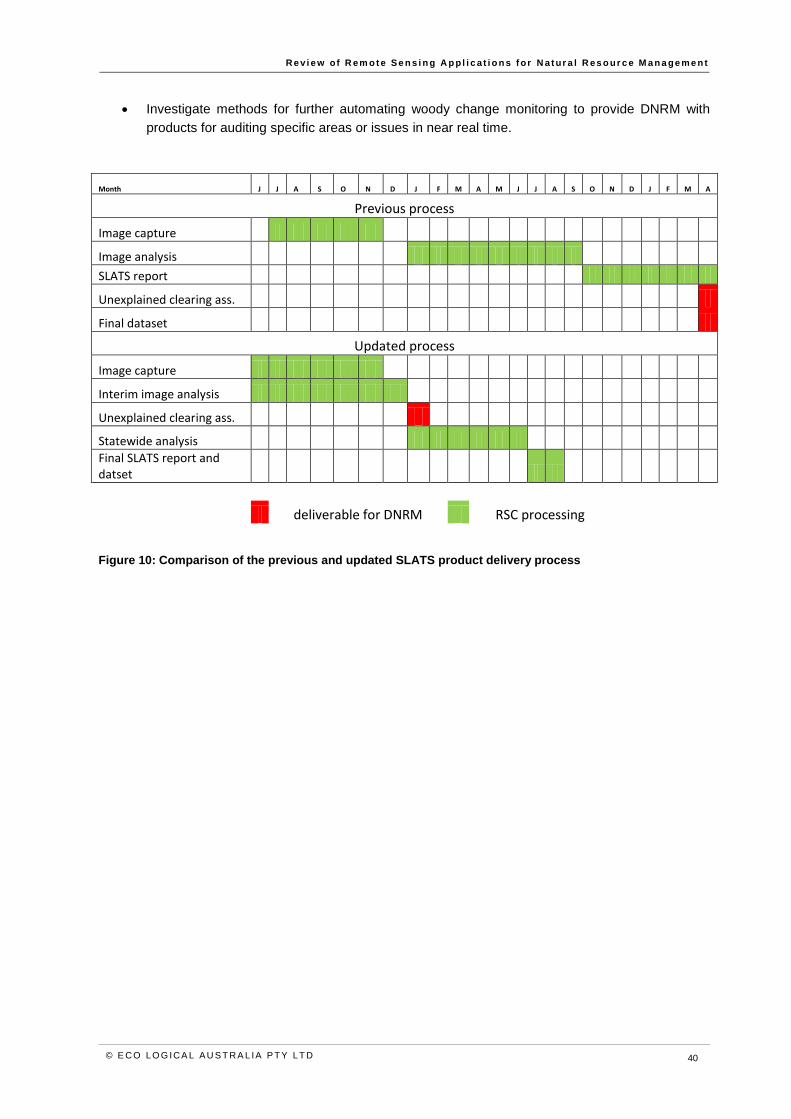
Re v i e w of R em o t e S e n s i n g A p pl i c a t i o n s f or N a t ur a l R es o ur c e M a n a ge m e n t
© E CO LO G ICA L A U S T RA L IA P T Y LT D 40
Investigate methods for further automating woody change monitoring to provide DNRM with
products for auditing specific areas or issues in near real time.
Month J J A S O N D J F M A M J J A S O N D J F M A
Previous process
Image capture
Image analysis
SLATS report
Unexplained clearing ass.
Final dataset
Updated process
Image capture
Interim image analysis
Unexplained clearing ass.
Statewide analysis Final SLATS report and datset
deliverable for DNRM RSC processing
Figure 10: Comparison of the previous and updated SLATS product delivery process

Re v i e w of R em o t e S e n s i n g A p pl i c a t i o n s f or N a t ur a l R es o ur c e M a n a ge m e n t
© E CO LO G ICA L A U S T RA L IA P T Y LT D 41
6 Value for money
The RSC runs one of the leading programs of its kind in Australia. Products and programs have been
so successful that they have been copied and adopted in New South Wales (and Victoria) because the
products produced are “… reliable and proven nature …. with a high acceptance by stakeholders”
(NSW DEH 2014). NSW now has a remote sensing program with a scope broadly similar to
Queensland RSC. The Queensland RSC has a total annual budget of about $4 million which equates to
about $2.30 per km2
of the state. This compares to the costs of the similar program in NSW which has
an annual budget of about $6 million which equates to about $7.30 per km2
of the state3. Much of the
difference in cost is because NSW programs use SPOT imagery which provides a high resolution
products and greater discrimination within the more sparsely wooded area. While this would address
some of the deficiencies identified in the current Landsat based products it would add up to $1.4 million
a year to the budget for a complete coverage of Queensland.
The extensive use of the freely available US Landsat imagery US Geological Survey provides a highly
cost effective product that has a high acceptance from users. The scale of resolution of these data is
seen for many of the RSC datasets enables the production of cost effective data compared to other
options available in the market. The RSC program and long term monitoring datasets (Figure 1)
enables the production of applications and products that provide defensible science and spatial data
that are used to underpin a range of Queensland initiatives across a range of agencies (Table 1).
The long term nature of the RSC program has enabled ongoing development and improvements of
existing products as well as the development of new products over time. For example the ground cover
dataset were initially developed as a by-product of the woody SLATS project. The measurement of
ground cover has evolved from the bare ground/ground cover index, derived from fractional cover
masked by the woody (tree) layer (DSITIA 2014). Ground cover dataset have been incorporated into a
wide range of products and applications and is now used as much as the woody extent data products
by the SLATS project.
Contestabil ity 6.1
The Queensland Government has identified the process of “contestability” as the means to provide
better value for money in the delivery of services. This includes testing of the market for product delivery
to ensure the current arrangements are providing value for money.
Many of the RSC products are difficult to test in the market because, apart from other state and
Commonwealth government organisations, there are few providers able to deliver the ongoing
extensive research and development and the (Landsat) satellite image archive hosted on the High
Performance Computing infrastructure that underpins the delivery of the products.
However, some of the higher order products delivered by the RSC and associated applications (such as
FORAGE and VegMachine) could potentially be delivered by external providers and tested in the
market (Table 2). This process is being progressed by DSITIA and will confirm the value for money of
the current arrangements or recommend appropriate changes to service delivery.
3 The NSW funding figure is based on the $24 million over 4 years from 2007 quoted on NSW Office of Environment and Heritage
web site : http://www.environment.nsw.gov.au/projects/NativeVegetationMapping.htm [October 27 2014]

Re v i e w of R em o t e S e n s i n g A p pl i c a t i o n s f or N a t ur a l R es o ur c e M a n a ge m e n t
© E CO LO G ICA L A U S T RA L IA P T Y LT D 42
The Independent Commission of Audit (COA) identified contestability as the means to provide better
value for money in the delivery of front-line services by the Queensland Government. Contestability
encourages more efficient and more innovative service delivery, whether by the public, private or the
not for profit sector. Contestability is a process where Government tests the market to ensure it is
providing the public with the best possible solution at the best possible price. Contestability does not
automatically result in the outsourcing of a service. A contestability review will consider a whole range of
service delivery options to ensure all possible options are considered. These include:
Keep and improve the service.
Joint ventures.
Performance-based contracting, such as payment by outcomes.
Mutual and employee-owned organisations.
It should be noted that commercial providers like Google are beginning to provide ‘big data’ applications
(Hansen et al 2013). An assessment of these products by the RSC has shown that they may be of
poorer quality compared to RSC products. While at present these applications are limited but they are
drawing on time series information and a range of current sensors and although they do not match the
services currently provided by RSC they have potential to do so in the future. There needs to be
ongoing monitoring of these developments and comparison of the associated products with the RSC
products to ensure that the most costs effective solution is used in the future.

Re v i e w of R em o t e S e n s i n g A p pl i c a t i o n s f or N a t ur a l R es o ur c e M a n a ge m e n t
© E CO LO G ICA L A U S T RA L IA P T Y LT D 43
Table 2: RSC products with a potential delivery market
Product Delivery Market
Comments
Vegetation extent, structure,
biomass and change Very limited Difficult to separate out individual services from historical time series archive.
Fire scar mapping (historical and
recent) Possible Techniques are reasonably established and transportable and can be applied to deliver recent mapping to add to existing historical mapping.
Ground cover monitoring
(historical and recent) Very limited Heavy reliance on Landsat image archive and automated processing and undergoing continuous improvement resulting from research and development work.
Land use and land use change Possible Standard national methods. Would need to be able to match the local input and knowledge currently provided by DNRM regional staff.
Seasonal crop mapping and
monitoring Possible Queensland specific methodology (version 1) which requires improvement, but could be evaluated in other states/territories.
Landscape erosion features (e.g.
gullies, stream banks, contour
banks) Very Limited
High degree of experimentation and development of techniques required with no certainly in final product
Riparian vegetation corridors Possible Use of existing data and techniques although there is also continued evolution of techniques making it difficult to test.
Coal seam gas infrastructure
mapping Possible
Use of current imagery to manually map limited number of features could be delivered by a number of organisations, although may be difficult to supply ongoing development of automated methods. May require government deliver to maintain independence of advice for investigations and expert evidence in court.
Water body and flood extent
mapping Very Limited By product of water masks from other processes.
Weeds mapping Very Limited High degree of experimentation and development of techniques required with no certainly in final product
Koala habitat mapping Possible
One-off woody vegetation cover from SPOT imagery has been produced by external providers in the past (see RPS 2014) although there are no plans to continue this mapping at the moment.
Natural disaster response mapping Very Limited Requires immediate response with little opportunity to develop specifications
Pasture biomass modelling and
forecasting (AussieGRASS
system) Very Limited Highly specialised modelling techniques.
Development of future
applications from datasets Possible Required in depth knowledge of the data although partnerships between RSC and users/other organisations may be appropriate

Re v i e w of R em o t e S e n s i n g A p pl i c a t i o n s f or N a t ur a l R es o ur c e M a n a ge m e n t
© E CO LO G ICA L A U S T RA L IA P T Y LT D 44
7 Synergies between departments
The user needs analysis and assessment of use of current products has shown there are multiple users
and uses for many of the RSC products. The uses of the core landscape monitoring datasets by
departments are summarised in Table 3. This shows that the image archive and the core landscape
monitoring datasets (woody vegetation, ground cover and land use) are used extensively by DNRM,
DEHP, DSDIP and DAFF. The state-wide fire scar mapping has some important potential uses but has
not yet been fully incorporated into operational applications by other agencies.
The total funding for the RSC is about $4.9 million per annum and is derived from a variety of sources
(Table 4). While the total amount and breakdown varies from year to year, the 2013/14 figures shows
that the satellite image archive and other enabling functions costs about $1.9 million/annum and the
core landscape monitoring datasets costs about $1.7 million/annum.
There is a mixture of funding sources directed at different levels of the RSC program (Figure 11).
Funding of the core datasets and image archive is mainly by DSITIA and DNRM, while funding for the
applications is mainly from DNRM (including the Regional NRM Investment Program for Reef Plan),
DEHP and other external grants. A comparison of the funding in Table 4 with the uses by agencies in
Table 3 shows DSDIP and DAFF are major uses that do not provide direct funding of core datasets.
In summary there are multiple agencies using a range of products that are derived from each of the
core RSC datasets and that this use is not reflected in the breakdown of funding sources. The risk with
the current bilateral (between DSITIA and individual Departments) negotiations for funding of RSC
products and services is that the withdrawal of funding by one department for one component of the
RSC program may impact on a range of products and associated users. While a detailed consideration
of how funding is currently allocated is outside the scope of this report, in broad terms the approach to
funding the RSC programme should include:
The $1.9 million annual funding for the enabling functions (image archive and processing
systems) should be shared across the whole of government. This should be negotiated on a
multilateral/whole of government basis in recognition that these services underpin a wide range
of interconnected uses and users and it is difficult to allocate a proportion of their use to a
specific department.
The $1.7 million annual funding for the landscape monitoring programs (woody vegetation,
ground cover, and land use) should be proportioned across agencies by relative use. This
should still be negotiated on a multilateral/whole of government basis, in recognition that these
services underpin a wide range of interconnected uses and uses.
The funding and delivery of specific products and uses, which is currently $1.3 million/annum,
should continue to be negotiated on a bilateral basis.
An alternative is to allocate the cost of the core monitoring programs and enabling functions as
overheads across all products. Apart from raising the costs of individuals products this would still be
subject to variations associated with the year to year level of funding from individual departments and
may stop some products being delivered for what essential programs such as the Reef Plan Reporting.

Re v i e w of R em o t e S e n s i n g A p pl i c a t i o n s f or N a t ur a l R es o ur c e M a n a ge m e n t
© E CO LO G ICA L A U S T RA L IA P T Y LT D 45
Table 3 Summary of major RSC datasets by department use
Major Datasets and Image archive
DNRM DEHP DAFF DSDIP DPC (Reef Plan)
NPRSR PSBA
Image archive and support systems
Woody vegetation extent and change
Ground cover
Land Use
Fire scar
major or critical requirement. = minor or potential requirement.
Table 4 Indicative annual funding of the RSC program
Item Total Cost
($ mill/year)
Cost ($ mill/year) by funding source
DNRM DSITIA NRM
regional (reef)
DEHP OTHER
Enabling functions
Image archive/processing and system development
0.9 0.9
computing infrastructure – hardware
1
0.3 0.3
AARNet 0.2 0.08 0.15
computing infrastructure – personal FTE
1
0.5 0.5
Landscape monitoring datasets
Woody vegetation 0.7 0.6 0.2
Land use 0.3
0.3
Ground cover 0.4
0.1 0.1
0.2
Fire scar 0.1
0.1
AussieGRASS 0.2
0.2
Other products
Vegetation management compliance support
0.1 0.1
CSG compliance support 0.5
0.5
GBR riparian monitoring 0.6
0.6
NRM spatial hub 0.1
0.1
Total 4.9 1.7 1.2 0.7 0.5 0.3
1 90% of total costs as usage is shared with climate modelling group.

Re v i e w of R em o t e S e n s i n g A p pl i c a t i o n s f or N a t ur a l R es o ur c e M a n a ge m e n t
© E CO LO G ICA L A U S T RA L IA P T Y LT D 46
Figure 11: RSC program funding arrangements
1 Based on 2013/14 indicative figures

Re v i e w of R em o t e S e n s i n g A p pl i c a t i o n s f or N a t ur a l R es o ur c e M a n a ge m e n t
© E CO LO G ICA L A U S T RA L IA P T Y LT D 47
8 Business continuity
Business continuity is traditionally concerned with ensuring that critical business functions will be
maintained, or at least recovered to an operational state within a reasonably short period, when faced
with serious incidents or disasters. The RSC has a draft business continuity plan addressing risks
posed by short term disasters, to the functioning of the High Performance Computing that facilitates
most of the services delivered by the RSC.
The business continuity assessment carried out here focuses on medium term risks to the critical
computing infrastructure needed to maintain the current RSC products and options for updates to the
Landsat imagery that underpin many of the current RSC products. Other factors are also important to
ongoing supply of products including ongoing Research and Development (addressed under section
10) and ongoing funding of products (not addressed in this report).
This DSITIA owned equipment is secured in a Department of Agriculture, Fisheries and Forestry
(DAFF) managed computer room with process air-conditioning and uninterruptible power supply backup
power. DAFF’s Information Technology Partners (ITP) maintain other equipment and network switches
in the same room which also houses some CSIRO computing and network equipment. Facilities
management of the HPC resources is undertaken by specialists employed by the Land and Spatial
Information Group (LSI), Department of Natural Resources and Mines (DNRM).
DSITIA contracts with SGI and Oracle specify response times for general hardware faults. DAFF and
DNRM have service level agreements (SLAs) with DSITIA for network and computing issue response
times. Copies of backup tapes and duplicates of mass storage tapes are held off-site at a commercial
Iron Mountain Australia repository.
The Ecosciences Precinct computer room also houses a 5 gigabit per second network gateway to
AARNet. This network linkage provides high speed and tariff-free capacity to exchange very large
datasets with collaborators and to acquire new satellite imagery from the USA, Europe and Asia
systems. Satellite imagery files tend to be in the 100s of megabytes to gigabyte size range. DAFF’s ITP
maintain the operation and security of the AARNet gateway. Only DSITIA’s Science Division staff and
DNRM’s LSI staff, based at the Ecosciences Precinct, may use the AARNet network.
This system allows multi-petabyte image volumes to be stored and with 10-100, 000 individual requests that are many terabytes in size per day.
HPC continuity opt ions 8.1
Funding for the HPC and associated operational staff is in place until 2017. However, medium term
risks include the ability to maintain funding to support this infrastructure, the maintenance of specialist
skills required to run the system and the facility becoming redundant in the face of rapidly changing
technology.
A final stable solution would be the development of another replacement HPC facility or a full move to
cloud based computing4 from an external provider. Substitute sites such as the Amazon Web Services
4 “Cloud” computing is the delivery of IT resources and applications via the internet, generally with pay-as-you-go pricing.

Re v i e w of R em o t e S e n s i n g A p pl i c a t i o n s f or N a t ur a l R es o ur c e M a n a ge m e n t
© E CO LO G ICA L A U S T RA L IA P T Y LT D 48
(AWS) are being considered and actively investigated by the RSC. Preliminary conclusions are that
some of the data processing software can be run on cloud based systems and are worth investigating
further. However, these systems are not currently able to cope with the extremely large amount of data
(image) storage and processing requirements of the RSC. The volumes of data stored on the HPC, the
need to access dispersed internal intra-government network natural resource and environmental
databases, and network latency issues between cloud storage and image processing workstations
indicates this will be both technically demanding and /or expensive.
It seems more likely that alternatives to an in house HPC might stem from current proposals for future
national coordination programs that will enable a more coordinated, integrated and effective approach
to developing infrastructure and sharing resources (Space Science and Earth Observations Working
Group, 2009). Given similar remote sensing programs to those delivered by RSC are operating
elsewhere in Australia (e.g. NSW, VIC and at the national level by GA), it would seem there will be a
national need for the continuing development of appropriate infrastructure.
Initiatives to address computing infrastructure are currently being developed at the national level under
the National Collaborative Research Infrastructure Strategy (NCRIS) which includes the Terrestrial
Ecosystem Research Network (TERN) and the National Computational Infrastructure (NCI). Many of the
RSC products are currently stored and available to users on the TERN AusCover facility (see section
9.1.2.2). However while these facilities can store remote sensing products or possess high data
processing capabilities they are not yet able to cope with the very high data storage requirements of
remote sensing applications. There are no clear alternatives for the current HPC arrangements currently
available and the RSC needs to continue investigation into cloud based options in combination with
HPC either in house or in collaboration with emerging national computing infrastructure.
National Computational Infrastructure
The National Computational Infrastructure (NCI) is part of the National Collaborative Research
Infrastructure Strategy (NCRIS) and is Australia’s national research computing facility, providing world-
class services to Australian researchers, industry and government. NCI provides high performance
computer based research, with a focus in the environment, climate change and earth system science.
NCI is home to the Southern Hemisphere’s fastest supercomputer and file systems, It houses a new 1.2
petaflop HPC system, a 3,200 core high-performance compute cloud, persistent disk storage of more
than 10 PBytes (as at July 2013, and growing), and a new purpose-built data centre. This facility has
the ability to process ‘big data’ sometimes associated with remote sensing and also houses a range of
remote sensing data products.
The RSC has time allocated to and has been actively investigating the ability of cloud based systems to
support its needs. These investigations have found that although there may be some potential in using
hybrid systems which combine in house computing with cloud based systems, there are currently major
constraints to using this technology, particularly from latency issues associated with accessing the
extremely large RSC data sets across remote networks.
It is recommended that the RSC conduct an in-house review to build on the current work in this area
and develop a medium to long term strategy to ensure their needs are met into the future.

Re v i e w of R em o t e S e n s i n g A p pl i c a t i o n s f or N a t ur a l R es o ur c e M a n a ge m e n t
© E CO LO G ICA L A U S T RA L IA P T Y LT D 49
Landsat platform 8.2
Many of the state-wide datasets are based on the Landsat imagery that is currently made freely
available. While this platform has delivered a stable supply of ongoing data, a contingency plan for
replacement imagery needs to be considered.
Options that could be considered include:
The substitution of state-wide SPOT data for Landsat. The NSW remote sensing program uses
SPOT as the basis for the woody extent and change in extent analysis. Therefore the methods
to adapt to this imagery are available.
Use of other imagery such as European Space Agency supported Sentinel Satellite 1 & 2.
However this would require investment from the Australian Government to obtain access to the
imagery.
Using and combing multiple data sources such as combining MODIS with Rapideye, Skybox or
other new launched imagery.

Re v i e w of R em o t e S e n s i n g A p pl i c a t i o n s f or N a t ur a l R es o ur c e M a n a ge m e n t
© E CO LO G ICA L A U S T RA L IA P T Y LT D 50
9 Current and future product communication
Web delivery of appl icat ions/visualisation tools 9.1
Current tools 9.1.1
A range of RSC products can currently be viewed and interpreted on a number of web based
applications and visualisation tools including:
Many of RSC products are available via the Queensland Globe which allows such products to
be viewed inside the GoogleEarthTM
application.
Static (pdf format) annual reports of woody cover change are available on the RSC web site
(e.g. DSITIA 2014).
Other applications which are currently available, or in development, that allow for visualisation and
interpretation of RSC products include:
AusCover which includes a portal for visualising and downloading data (Figure 12, Figure 13).
Open source tool which accesses the RSC products on AusCover including:
CHOPPER which produced a subset time series datasets (Figure 14)
PAST which provides a time-series graph and summary statistics for the fractional cover
datasets.
FORAGE which currently uses RSC ground cover and woody FPC extent data to produce
reports and provides RSC imagery.
VegMachine which is widely used in extension programs including Grazing Best Management
Practice (BMP). This provides ground cover reports and comparisons for user defined areas.
AussieGRASS is a RSC product that includes climate and pasture modelling tools as well as
ground and woody cover information. The Longpaddock web site where AussieGRASS is
available and has a large number of visualization tools (e.g. Figure 15).
NRM Spatial Information Hub (the Hub - part of the CRC for Spatial Information. The aim of the
Hub is to provide land managers with systems, tools, data, and skills needed to dramatically
improve access to farm-scale information and knowledge. These tools may include ground
cover and other RSC products.
Further developments 9.1.2
9.1.2.1 Web version of VegMachine
There is a proposal to develop a web based version of VegMachine. This could be developed to
complement the similar regional comparison report on FORAGE. It could also be developed with a view
to eventually serving similar applications such as Dynamic Reference cover (Bastin et al. 2012) and
other vegetation condition applications.
9.1.2.2 AusCover visualisation tools
RSC should build on the visualisation tools already available for RSC products on the AusCover portal.
This could be achieved by setting up a similar portal using served data to reflect specific Queensland
Government branded products or by making direct links from Queensland Government web sites to the
AusCover portal.
An alternative is the custom development of a portal for the main datasets (e.g. QLUMP) using ArcGIS
online (available with current ESRI licencing that is currently used to deliver WetlandInfo and similar

Re v i e w of R em o t e S e n s i n g A p pl i c a t i o n s f or N a t ur a l R es o ur c e M a n a ge m e n t
© E CO LO G ICA L A U S T RA L IA P T Y LT D 51
products) Such portals will allow branding as well as flexibility to provide specific use cases /
applications that make use of RSC data (including mashing with other available data sources) and can
also provide some geoprocessing abilities (i.e. geocoding, route selection, simple spatial analysis etc.)
and report production (i.e. ground cover report). However, the latter case is best provided and
developed by, or at least in partnership with, users and other third parties to ensure the products are
developed to meet specific user defined needs.
Development of web delivery applications and associated data visualisation tools will make RSC
products more accessible to users. The development of these tools is not necessarily the prime
responsibility of RSC. However, RSC should facilitate these developments by making data available
(via web services etc. listed above) and also be involved in partnerships with government and non-
governments agencies to develop and deliver such tools. This will allow RSC to work to the data
limitations and potential best use case scenario.
Statistics reporting 9.1.3
The current SLATS report is produced as a static pdf document. This could be replaced with an on line
web delivery system, similar to the Summary tool on the Queensland Government WetlandInfo web site
(Figure 16). The user needs analysis indicated that the next SOE report is considering a similar
approach and may be an avenue to producing such a summary tool for woody extent and woody extent
change.

Re v i e w of R em o t e S e n s i n g A p pl i c a t i o n s f or N a t ur a l R es o ur c e M a n a ge m e n t
© E CO LO G ICA L A U S T RA L IA P T Y LT D 52
Figure 12: AusCover product download, visualisation portal
Source: http://www.auscover.org.au/data/product-list

Re v i e w of R em o t e S e n s i n g A p pl i c a t i o n s f or N a t ur a l R es o ur c e M a n a ge m e n t
© E CO LO G ICA L A U S T RA L IA P T Y LT D 53
Figure 13: AusCover portal visualisation tool - seasonal fractional cover
Landsat, QLD DSITIA algorithm, QLD coverage. Source: http://www.auscover.org.au/data/product-list
Figure 14 The chopper tool
Source: http://vegcover.com/chopper

Re v i e w of R em o t e S e n s i n g A p pl i c a t i o n s f or N a t ur a l R es o ur c e M a n a ge m e n t
© E CO LO G ICA L A U S T RA L IA P T Y LT D 54
Figure 15: Example of data visualisation available on the AussieGRASS web site
Figure 16: Wetland extent summary tool
Source: WetlandInfo web site http://wetlandinfo.ehp.qld.gov.au/wetlands/facts-maps/queensland/

Re v i e w of R em o t e S e n s i n g A p pl i c a t i o n s f or N a t ur a l R es o ur c e M a n a ge m e n t
© E CO LO G ICA L A U S T RA L IA P T Y LT D 55
Data delivery 9.1.4
Many of the RSC spatial (GIS shapefiles) products can be downloaded from the Queensland
Government Information Service (QGIS) web site. This is part of the Queensland Government’s recently
introduced (late 2013) open data strategy, which aims to share data to drive innovation, growth and job
creation within the private sector and direct benefit the community. Data are provided freely and openly,
allowing reuse by the public for virtually any purpose.
RSC products include some of the most downloaded datasets on QGIS (Table 5). Datasets are
downloaded by a broad range of users with at least 65% of QGIS data accessed by the private sector.
Uses outside government include Regional NRM groups, industry bodies, consultants, research
agencies and increasingly by landholders.
Table 5: Downloads for some RSC datasets for 2013 from QGIS web site.
RSC Datasets No. downloads
Land use mapping 1714
Foliage Projective Cover (FPC; woody vegetation canopy density
measure) 1316*
SLATS tree clearing layers 192
Fire scar mapping 462
Satellite image footprints and dates for SLATS analysis 68
* The FPC dataset is very large and is divided into satellite footprints across Queensland. To cover any particular region a number
of datasets have to be downloaded. As a result the FPC download number is always very high.
This latter dataset, and other RSC products, are currently made available via the AusCover portal
(Figure 12). This includes some products that cannot be made available on QGIS due to limitations of
that site. AusCover is part of the Terrestrial Ecosystem Research Network (TERN), which delivers
critical research infrastructure needed to improve understanding and management of Australia’s
ecosystems. TERN is part of the National Collaborate Research Infrastructure Strategy (NCRIS).
AusCover is also developing a consolidated repository and meta-database, including standard
processing and validation methods for specific biophysical land cover products and basic processed
time-series biophysical image maps. This will involve processing of medium resolution satellite data
from national archives, as well as data from current and future satellite acquisition, supported by a
national system of instrumented field validation sites.
The AusCover facility has established and implements a range of data management principles attached
to products including:
Naming and versioning conventions
Identified distributed data serving hubs
Appropriate metadata standards (for data discovery)
Copyright & custodian restrictions
Nominated data managers

Re v i e w of R em o t e S e n s i n g A p pl i c a t i o n s f or N a t ur a l R es o ur c e M a n a ge m e n t
© E CO LO G ICA L A U S T RA L IA P T Y LT D 56
The AusCover portal includes advanced server protocols that enable the data to be delivered via web
services. There is no doubt advanced sever protocols will be required to effectively deliver data and
data processing for high level users and RSC staff if cloud computing is used to house data. There is a
lot of excitement generated about these technologies including predictions that cloud computing will
revolutionise remote sensing (also see box below).
The RSC needs to continue to investigate these areas, mindful that this is a rapidly growing area and
that implementation should only proceed when there is an appropriate level of confidence with the
maturity and reliability of the technology. Making data available on the web via web services and other
cloud based technology will facilitate the development of applications and visualisation tools by
Queensland Government Departments and third parties, consistent with the Queensland Governments
open data strategy. RSC should continue to utilise the AusCover portal, particularly where the datasets
cannot be delivered on the QGIS portal due to limitations of that site. However RSC should consider
making explicit links to the AusCover portal from the Queensland Government web site to promote RSC
branding.
THREDDS is an application that enables metadata and datasets to be stored on computers or clusters
of computers and delivered via web services such as WMS, WCS and OPeNDAP. OPeNDAP is able to
subset very large files into small windows. These applications are currently used on the AusCover
portal.
Apache HadoopTM
is a framework for managing large distributed datasets. It includes a distributed file-
system and the MapReduce programming model for large scale distributed processing.
These (and similar) software:
Enable data to be served via web mapping (and other similar) services.
Allows direct data access via URLs, which enables users to build value-adding services and
applications.
Has solid uptake in the remote sensing and spatial/GIS (GeoServer) communities.
Are freely available, open source and have a strong development community that facilitates
collaboration and makes them relatively easy to deploy and maintain.
Allow processing across multiple-sites without the need to (fully) download copies of the data.
Facilitate processing, collaboration with other R&D groups and promote a more innovative
environment (this is relevant to separate scope item on R&D).
Predications about cloud based computing impacts on remote sensing
High-performance cloud computing products and services are claimed (by providers) to open the
geospatial industry to a global market at reduced costs and allow for large volumes of data to be stored,
accessed and manipulated without being ingested into users’ systems. The companies developing
cloud computing are proven entities, such as Google and Amazon, as well as their developer
communities, and already have proved themselves capable of supporting a global audience and
working with governments as technology partners.
Cloud-based, multisensor intelligence networks will emerge. High-performance cloud computing
products and services will become a key enabler to global multisensor intelligence networks. The
following enabling technologies will drive the evolution of such cloud-based networks
Network transport, with lower latencies and higher traffic volumes (100Gbps), will be required to
support multisensor intelligence networks.

Re v i e w of R em o t e S e n s i n g A p pl i c a t i o n s f or N a t ur a l R es o ur c e M a n a ge m e n t
© E CO LO G ICA L A U S T RA L IA P T Y LT D 57
Cloud-based storage and data access will bring 1,000x improvements in input/output data
access, using global file systems that limit the need to move or replicate data.
Object/cloud databases will have the ability to manage trillions of data transactions.
Cloud-based encryption and security will allow secure multidomain data and user access
Source: Earth Imaging Journal (2014)

Re v i e w of R em o t e S e n s i n g A p pl i c a t i o n s f or N a t ur a l R es o ur c e M a n a ge m e n t
© E CO LO G ICA L A U S T RA L IA P T Y LT D 58
10 Research and Development resourcing
Criteria to determine the balance between R&D and delivery of operational products are not clear cut.
The approach taken in this report is to firstly benchmark R&D with some available quantitative data from
the private sector, then undertake a qualitative assessment of the R&D by the RSC.
Budgets and outputs 10.1
Table 6 lists R&D budgets as a proportion of the total budget for some private companies found online.
The total R&D budgets in this list vary between 3-16% of the total budget (or revenue). Companies with
small R&D budgets, such as Apple and IBM, deal with consumer goods in highly competitive markets,
where the stated (in the case of Apple) company strategy is not to develop the ‘best’ product, but to
produce a ‘good’ product with support from a relatively high marketing budget to ensure sales. This
contrasts with pharmaceutical companies, where higher R&D budgets are required as the development
of innovative and new products that are key to their business. While the relevance of private company
R&D to the RSC activities may be limited, the situation applying to pharmaceutical companies would
appear to be more similar to the RSC than companies such as Apple and IBM.
The current RSC R&D budget is about 15.9% of the total budget5. This R&D is generally embedded
within operational project work and therefore closely aligned to applied natural resource and agricultural
issues and real-world user problems. Technology selection for new satellites, laser, radar, UAVs is
cautious. The RSC has an excellent track record in the development of operational state wide products
that are well regarded by stakeholders and that are also improved over time. For example the
measurement of ground cover has evolved from the bare ground/ground cover index to an improved
measure derived from fractional cover and to measuring ground cover under denser woody vegetation
(DSITIA 2014). Many users are well aware of this evolution and reported that the new products better
met their needs.
There are many reasons why the RSC requires a significant proportion of its budget to be allocated to
R&D. Substantial R&D is required in the remote sensing field, to stay abreast of rapidly developing
technologies such as new satellites, aerial capture techniques and computer processing. Therefore,
while it is of prime importance for the RSC to continue to deliver operational products that meet user’s
needs, for this to continue to occur over the medium to long term an adequate level of R&D needs to be
invested to ensure products evolve and improve both with changing user needs and changes in
technology. In the user interviews one comment was made about the frustration of RSC product
delivery being delayed while an improved product was developed. However, generally users seemed
satisfied that the RSC is able to produce useful operational products within acceptable timeframes while
at the same time allowing for continuous improvement in product quality.
Most of the RSC datasets are made freely available to public and private users. There is very little
restriction imposed on the use of this data facilitating the development of new products by third parties.
Therefore the RSC’s R&D around innovation/ideas/research contributes to external parties creating
tertiary products.
5 In 2013/14 it was estimated about $640,000 of the total RSC budget of $4 million was spent on R&D, although the total and
R&D budgets vary from year to year (Christian Witte pers. comm.).

Re v i e w of R em o t e S e n s i n g A p pl i c a t i o n s f or N a t ur a l R es o ur c e M a n a ge m e n t
© E CO LO G ICA L A U S T RA L IA P T Y LT D 59
The RSC is also required to act as a knowledge broker across government, advising on the latest and
best technologies that support agency service delivery (such as broad scale policy development,
environmental management and planning). An example of this is the advice on cost effective imagery
the RSC was able to provide to DEHP for the oil spill investigation in western Queensland (section
4.2.3). Another example is the development of new techniques to map CSG infrastructure followed by
innovation and improvements that have resulted in substantial reductions in the costs of imagery
(section 4.1.7).
R&D by the RSC is not a standalone activity but is embedded within the delivery of operational
products. This ensures R&D is applied and focused on user needs. In addition the RSC is an active
participant in the Joint Remote Sensing Research Program with the University of Queensland and other
organisations. This enables the R&D investment by the RSC to be leveraged by receiving additional
input from the university and state collaborators. The embedded applied and collaborative nature of the
R&D is a strength that clearly needs to be maintained into the future.
The RSC currently delivers operational products that meet user needs while at the same time making a
significant R&D investment to enable continuous improvement in product quality and cost effectiveness
and also develop new products to meet new user needs. It is difficult to define an optimal proportion of
R&D required to ensure that this situation continues into the medium and long term. The user needs
analysis indicate users require more products but also faster processing and product turn around and
improvements in existing products. The current 16% R&D proportion would appear to be the minimum
level of R&D budget required. Monitoring future progress against the criteria of supply and improvement
of ongoing and new products is required. R&D investment may need to be increased particularly where
new products using new technology are required.
Table 6: Proportion of R&D budget for some private companies
Company R&D as % of total budget
Apple 3%
Microsoft 14%
Google 13%
Oracle 13%
IBM 6%
10 largest Pharmaceutical companies 16%
Merk (pharmaceuticals) 17%
Europe computing and electronics 11%
The Joint Remote Sensing Research Program (JRSRP) 10.2
The JRSRP was founded in 2007 and is collaboration between The Queensland RSC and the remote
sensing groups at the University of Queensland’s Centre for Spatial Environmental Research, and, the
New South Wales Office of Environment and Heritage (OEH) and the Victorian Department of

Re v i e w of R em o t e S e n s i n g A p pl i c a t i o n s f or N a t ur a l R es o ur c e M a n a ge m e n t
© E CO LO G ICA L A U S T RA L IA P T Y LT D 60
Environment and Primary Industries (DEPI). The JRSRP also functions as the Terrestrial Ecosystem
Research Network’s (TERN) AusCover Brisbane Node.
The program incorporates researchers, government scientists, environmental managers and significant
computing and data storage capacity from within these agencies. Principles of operating are to develop
and implement scientifically sound approaches that contribute to national and international sciences,
and are open and publicly accessible, for use in public good activities. Engaging in evidence based
decision making through employing a solid scientific approach leads to well informed policy decisions
and effective environmental outcomes because decisions are based on accurate information. This, in
turn, will lead to policies addressing the immediate and long term needs of our environment.
The major benefits for the JRSRP participants include:
Cost effectiveness: the cost of research has been reduced through sharing, re-use and
improvement as well as avoiding duplication of activities. Because programs participants’ share
common interests, research related activities and new products can be targeted based on what
is relevant to the operational requirements of each organisation.
Sharing of knowledge of industry and networking.
Access to new technologies and field instruments e.g. terrestrial laser scanner.
Providing a single point of contact for other government agencies to engage and collaborate.
Producing assured high quality science through international peer review of models, collective
field data and information sharing.
Combined capacity to address strategic problems common across agencies, e.g. loss of access
to Landsat sensors and need for consistent national calibration and validation.
Increased skills and capability within partner organisations.
Calibrating and validating algorithms and remote sensing indices (e.g. fractional ground cover
index) across a wider range of ecological and climatic zones improving robustness of science.

Re v i e w of R em o t e S e n s i n g A p pl i c a t i o n s f or N a t ur a l R es o ur c e M a n a ge m e n t
© E CO LO G ICA L A U S T RA L IA P T Y LT D 61
11 Future research, programs and products
A list of potential R&D projects for the RSC is provided in Table 7. This is derived mainly from issues
raised in the user needs interviews. Many of the areas listed involve ongoing continuous improvement
of existing products with major new areas in water, which has previously been identified as an area
outside the traditional focus of the RSC on terrestrial vegetation.
The total annual costs of the in the table is $880,000 which is $140,000 more than the current R&D
expenditure. The projects are listed in an indicative order of decreasing priority with higher priority
projects determined as meeting identified user needs and/or high chance of success. Indicative costs
are listed with an indication of how many years this research would be expected to take and if the
research is already part of the RSC R&D program.
Much of the current R&D is delivered through the Joint Remote Sensing Research Program (JRSRP)
where priorities are agreed with the partner organisations. This enables the RSC research investment to
be leveraged by collaboration with other partners. The list in the should be incorporated into the
development of JRSRP priorities.
Table 7: List of future R&D projects
Area of R&D topic Comment
Funding
($,000/annum)
and years to
complete
Investigate ways to improve
SLATS method for woody change
mapping
Improve ability to detect changes based on Landsat
time-series and radar imagery. Aim to improve
detection accuracy to reduce editing. If successful
this creates an opportunity to undertake SLATS
change detection with similar resources. More
automated processes are required to further reduce the
reporting time lag. This may include investigation of
replacing current SLATS method with products derived
from the fractional cover dataset and quantifying
differences between interim and final datasets.
70
in progress,
review in 6 –
12 months
Release and enhance persistent
green trend product.
This was identified by many users as a need such as for
woody increase/decrease for development of vegetation
management policy, vegetation condition in relation to
grazing management (woodland thickening) but also
biodiversity, carbon sequestration. Could include
improved use of FPC time series and other
approaches.
70
3 years
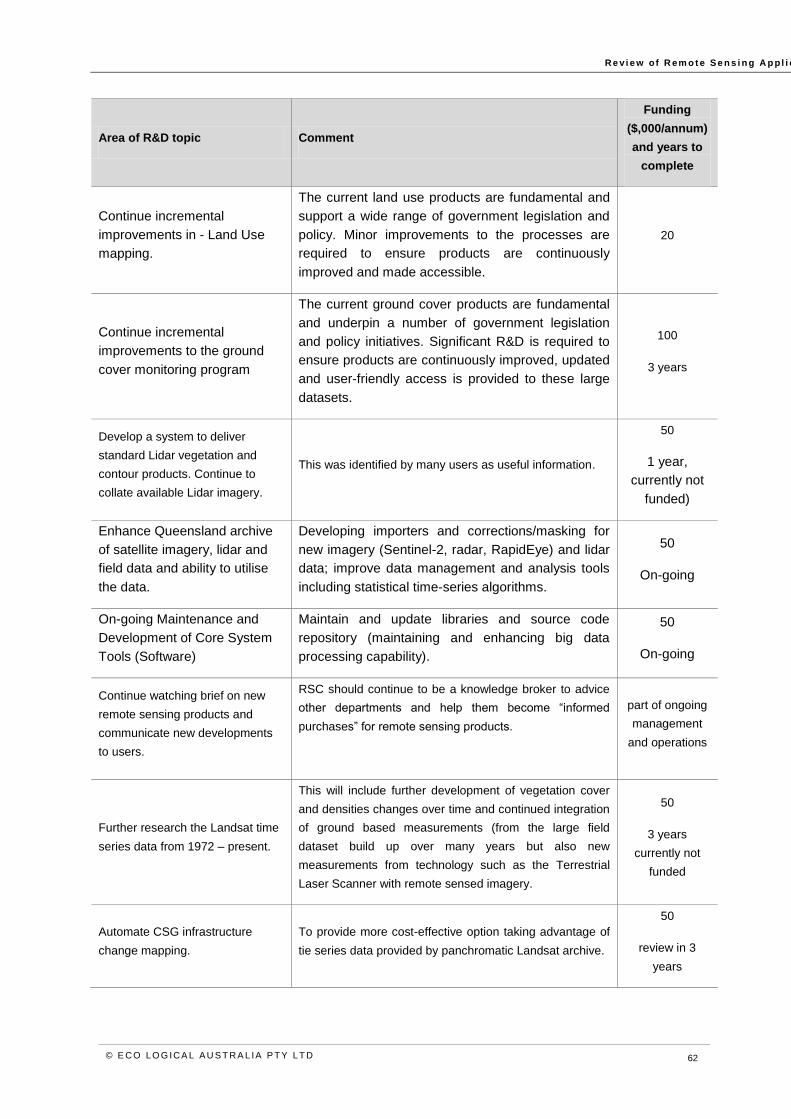
Re v i e w of R em o t e S e n s i n g A p pl i c a t i o n s f or N a t ur a l R es o ur c e M a n a ge m e n t
© E CO LO G ICA L A U S T RA L IA P T Y LT D 62
Area of R&D topic Comment
Funding
($,000/annum)
and years to
complete
Continue incremental
improvements in - Land Use
mapping.
The current land use products are fundamental and
support a wide range of government legislation and
policy. Minor improvements to the processes are
required to ensure products are continuously
improved and made accessible.
20
Continue incremental
improvements to the ground
cover monitoring program
The current ground cover products are fundamental
and underpin a number of government legislation
and policy initiatives. Significant R&D is required to
ensure products are continuously improved, updated
and user-friendly access is provided to these large
datasets.
100
3 years
Develop a system to deliver
standard Lidar vegetation and
contour products. Continue to
collate available Lidar imagery.
This was identified by many users as useful information.
50
1 year,
currently not
funded)
Enhance Queensland archive
of satellite imagery, lidar and
field data and ability to utilise
the data.
Developing importers and corrections/masking for
new imagery (Sentinel-2, radar, RapidEye) and lidar
data; improve data management and analysis tools
including statistical time-series algorithms.
50
On-going
On-going Maintenance and
Development of Core System
Tools (Software)
Maintain and update libraries and source code
repository (maintaining and enhancing big data
processing capability).
50
On-going
Continue watching brief on new
remote sensing products and
communicate new developments
to users.
RSC should continue to be a knowledge broker to advice
other departments and help them become “informed
purchases” for remote sensing products.
part of ongoing
management
and operations
Further research the Landsat time
series data from 1972 – present.
This will include further development of vegetation cover
and densities changes over time and continued integration
of ground based measurements (from the large field
dataset build up over many years but also new
measurements from technology such as the Terrestrial
Laser Scanner with remote sensed imagery.
50
3 years
currently not
funded
Automate CSG infrastructure
change mapping.
To provide more cost-effective option taking advantage of
tie series data provided by panchromatic Landsat archive.
50
review in 3
years

Re v i e w of R em o t e S e n s i n g A p pl i c a t i o n s f or N a t ur a l R es o ur c e M a n a ge m e n t
© E CO LO G ICA L A U S T RA L IA P T Y LT D 63
Area of R&D topic Comment
Funding
($,000/annum)
and years to
complete
Continue to investigate storage
and processing of large datasets
across multiple processors and
sites.
This is required to facilitate the exploration of cloud based
and other options to the current in-house HPC.
50
ongoing
Investigate improved ground cover
products particularly in relation to
pasture biomass and quality.
These measures are relevant to grazing assessments but
not included in current ground cover product.
Appropriate areas of investigation include modeling with
AussieGRASS in conjunction with remote sensing
100
review in 3
years largely
unfunded apart
from a small
pilot project
Develop improved and new
measures of landscape health and
condition.
Participate in work lead by users to develop new
applications.
100
review in 3
years,
currently not
funded
Investigate ways to map gully and
stream-bank erosion and other
needs identified for reef modelling
(rock cover, land management
practices)
Identified as a need for Reef Plan modeling. Requires
development of an appropriate method such as a cost
effective delivery mechanisms for Lidar or measurements
using radar based satellites (section 4.2.2).
70
review in 2
years
Investigate remote sensing
solutions to issues relating to
management of ground and
surface hydrology.
Work with Office of Ground Water Impact Assessment
/relevant DNRM to detail R&D requirements. This includes
methane detection, vegetation greenness and surface and
ground water monitoring and requires more detailed
assessment of specific issues to be investigated
as required
Further research the Landsat time
series data from 1972 – present.
This will include further development of vegetation
cover and densities changes over time and
continued integration of ground based
measurements (from the large field dataset build up
over many years but also new measurements from
technology such as the Terrestrial Laser Scanner
with remote sensed imagery.
50
3 years,
currently not
funded

Re v i e w of R em o t e S e n s i n g A p pl i c a t i o n s f or N a t ur a l R es o ur c e M a n a ge m e n t
© E CO LO G ICA L A U S T RA L IA P T Y LT D 64
12 Recommendations
Key recommendations from this study are summarised below.
1.Unexplained clearing assessment
Further refine the delivery of this product including quantification of changes that occur between the
interim and final woody change cover products to make appropriate allowances for systemic errors and
consider prioritising specific areas or issues (nominated by DNRM) for finalisation of data.
Investigate processes that can prioritise specific areas or issues (nominated by DNRM) for finalisation
of data to enable more real-time monitoring for auditing self-assessable codes under the Vegetation
Management Act 1999.
2.Compliance support
Review the level of compliance support for vegetation matters provided to DNRM.
3.Reporting
Include a breakdown of total area cleared by clearing type (fodder, thinning etc.) in the clearing report to
provide fuller context for the tree clearing figures.
Replace the current pdf type format for reporting with an online web-based reporting tool, possibly in
partnership with the State of the Environment reporting, that provides users with statistics for their area
of interest derived directly from the data.
4.Woody extent and change in extent datasets
Continue to deliver this costs effective core dataset to meet the wide range of uses currently provided
for.
Further development of the method including using the persistent green products from the fractional
ground cover dataset and methods to further improvement automation and timeliness to increase utility
for DNRM purposes.
The creation of a state-wide woody extent layer from the SPOT imagery would be a useful additional
tool for users, if it could be produced and funded in a cost effective way.
5.Ground cover
Continue to deliver this costs effective core dataset to meet the wide range of uses currently provided
for. Continue the development of the method and products such as the below tree ground cover.
6.Land use
Continue to deliver this costs effective core dataset to meet the wide range of uses currently provided
for. More frequent and/or consistent updates are required, preferably at least every 5 years where land
use change frequency and with a forward schedule so users can see when areas will be updated.
Re v i e w of R em o t e S e n s i n g A p pl i c a t i o n s f or N a t ur a l R es o ur c e M a n a ge m e n t
© E CO LO G ICA L A U S T RA L IA P T Y LT D 65
7.Fire scars
Engage with users and potential users of this data set to clarify the role of the RSC fire scar mapping in
relation to other products available and its application in specific situations.
8.Lidar
Continue to capture all Queensland Government available Lidar data onto the RSC high performance
computer system.
Develop standard products that can be used for vegetation and land assessments.
Make these products discoverable and accessible to users.
9.Hydrology
Work with users to develop new applications and products and associated resourcing to meet the wide
range of needs identified in this study.
10. Funding of the RSC program
The $1.9 million annual funding for the enabling functions (image archive and processing systems)
should be shared across the whole of government. The $1.7 million annual funding for the key
landscape monitoring programs (woody vegetation, ground cover, and land use) should be proportioned
across agencies by relative use. This should be negotiated on a multilateral/whole of government basis,
in recognition that these services underpin a wide range of interconnected uses and users.
The funding and delivery of specific products for specific uses (currently $1.3 million per annum) should
continue to be negotiated on a bilateral basis.
11. Business continuity
Conduct an in-house review to build on the current work by the RSC in this area and develop a medium
to long term strategy that sets out how to meet the centre’s HPC needs into the future.
12. Web delivery of data and appl icat ions
Build on the visualisation tools already available for RSC products on the AusCover portal by setting up
a similar portal using served data to reflect specific Queensland Government branded products or by
making direct links from Queensland Government web site to the AusCover portal.
Work in partnership with users to develop specific web based applications to deliver interpreted data to
meet specific needs (e.g. VegMachine online).
Continue to investigate the use of cloud based delivery of datasets and the use of advanced server
protocols that enables the data to be delivered via web services and processed across multiple
platforms.
13. Research and Development
Maintain the current level of R&D investment in the RSC program and evaluate the effectiveness of this
investment against the criteria of being able to supply products that meet user need over the medium to
long term.
Re v i e w of R em o t e S e n s i n g A p pl i c a t i o n s f or N a t ur a l R es o ur c e M a n a ge m e n t
© E CO LO G ICA L A U S T RA L IA P T Y LT D 66
13 References
Australian Government 2014. Australian Collaborative Land Use Mapping Program. Department of
Agriculture, Canberra. Available: http://www.daff.gov.au/abares/aclump/pages/about-aclump.aspx [3
November 2014].
Australian Research Council 2014. Measurement of paddock scale pasture biomass using synthetic
aperture radar remote sensing, Available: http://researchdata.ands.org.au/measurement-paddock-
scale-remote-sensing/65001 [29 October 2014].
Bastin, G., Scarth, P. Chewings, P., Sparrow A., Denham R. Schmidt M. O'Reagain P, Shepherd R,
Abbott B. 2012. ‘Separating grazing and rainfall effects at regional scale using remote sensing imagery:
A dynamic reference-cover method’ Remote Sensing of Environment 121, 443-457.
Bendig, A., Bolten, G. and Bareth, A. 2012. ‘Introducing a low-cost mini-UAV for thermal- and
multispectral-imaging’ Int. Arch. Photogramm. Remote Sens. Spatial Inform. Sci., 345–349
Beutel, T.S., Karfs, R.A., Bull, A.L., Peel, L. and Wallace, J.F. 2004. ‘VegMachine – putting pastoralists
in the picture’ Agricultural Science 17(3), 18-20.
Colomina, I and Molina, P. 2014. ‘Unmanned aerial systems for photogrammetry and remote sensing: A
review’ Journal of Photogrammetry and Remote Sensing, Vol 92, 79-97.
Costa, F.G., Ueyama, J., Braun, T., Pessin, G., Osorio, F.S., and Vargas, P.A., 2012. The use of
unmanned aerial vehicles and wireless sensor network in agricultural applications. In: Geoscience and
Remote Sensing Symposium (IGARSS), pp. 5045–5048.
Cox, T., Somers, I., and Fratello, S., 2006. Earth Observation and Role of UAVs: A Capabilities
Assessment, Version 1.1. Technical Report. Civil UAV Team, NASA.
Danaher, T. and Collett, L. 2006. ‘Development, optimisation, and multi-temporal application of a simple
Landsat based water index’ Proceedings of the 13th Australasian Remote Sensing and
Photogrammetry Conference, Canberra, 2006.
Delacourt, C., Allemand, P., Jaud, M., Grandjean, P., Deschamps, A.,Ammann, J., Cuq, V. and Suanez,
S. 2009. ‘DRELIO: An unmanned helicopter for imaging coastal areas’ J. Coast. Res., 2, 1489–1493.
DSITIA 2014. Land cover change in Queensland 2011 –12: A Statewide Landcover and Trees Study
(SLATS) report. DSITIA, Brisbane Available:
https://www.qld.gov.au/environment/land/vegetation/mapping/slats-reports
DSITIA (2012), The Long Paddock – FORAGE, Available: http://www.longpaddock.qld.gov.au/forage/ [9
October 2014].
DSITIA 2014. Water Planning Science Plan 2014–2019. DSITIA and DNRM, Brisbane.
DSITIA 2014. Cover Under Trees. Final Report. DSITIA, Brisbane.

Re v i e w of R em o t e S e n s i n g A p pl i c a t i o n s f or N a t ur a l R es o ur c e M a n a ge m e n t
© E CO LO G ICA L A U S T RA L IA P T Y LT D 67
DSITIA 2014a. Guide to Using FORAGE: Version 1.4. The State of Queensland, Brisbane, Available:
https://www.longpaddock.qld.gov.au/forage/
DSITIA 2014b. Australian Grassland And Rangeland Assessment by Spatial Simulation, The State of
Queensland, Brisbane. Available:
https://www.longpaddock.qld.gov.au/about/researchprojects/aussiegrass/index.html [15 October 2014].
Earth Imaging Journal 2014. State of the Industry Report. Tracking the Trends Shaping the Remote
Sensing Industry. February 14 2014. Available: http://eijournal.com/print/articles/state-of-the-industry
[December 10 2014]
ESA, 2014. ESA EO Missions: Sentinal-1, Available https://earth.esa.int/web/guest/missions/esa-
operational-eo-missions/sentinel-1 [29 October 2014]
Frish et al. 2014. date, Low-cost lightweight airborne laser-based sensors for pipeline leak detection
and reporting, Physical Sciences Inc., Andover, Massachusetts.
Frish, M. 2012. Laser-based Standoff Methane Detectors, ARPA_E Workshop on Ubiquitous Methane
Leak Detection through Novel Sensors and Sensing Platforms, 29 March 2012, Washing DC.
Geoimage 2014. WorldView-3, viewed online 27 October 214, available at
http://www.geoimage.com.au/satellite/worldview-3
Gini, R., Passoni, D., Pinto L., and Sona, G. 2012. ‘Aerial images from a UAV system: 3D modelling
and tree species classification in a park area’ Int. Arch. Photogramm. Remote Sens. Spatial Inform.
Sci., 361–366.
Goodwin, N.R. and Collett, L.J. 2014. ‘Development of an automated method for mapping fire history
captured in Landsat TM and ETM+ time series across Queensland, Australia.’ Remote Sensing of
Environment 148: 206-221.
Greenfield, P. and Riches, J. 2014. Science Capability Audit – Water. Office of Queensland Chief
Scientists. DSITIA, Brisbane.
Grenzdörffer, G., 2013. ‘UAS-based automatic bird count of a common gull colony’ Int. Arch.
Photogramm. Remote Sens. Spatial Inform. Sci, 169–174
Guanter et al. 2013. ‘Using field spectroscopy to assess the potential of statistical approaches for the
retrieval of sun-induced chlorophyll fluorescence from ground and space’ Remote Sensing of
Environment, 133, 52-61.
Guanter et al., 2014. ‘Global and time-resolved monitoring of crop photosynthesis with chlorophyll
fluorescence’ Proceedings of the National Academy of Sciences, 111(14).
Hansen, M. C., P. V. Potapov, R. Moore, M. Hancher, S. A. Turubanova, A. Tyukavina, D. Thau, S. V.
Stehman, S. J. Goetz, T. R. Loveland, A. Kommareddy, A. Egorov, L. Chini, C. O. Justice, and J. R. G.
Townshend. 2013. “High-Resolution Global Maps of 21st-Century Forest Cover Change.” Science 342
(15 November): 850–53. Data available on-line from:http://earthenginepartners.appspot.com/science-
2013-global-forest.
Jensen, A.M., Neilson, B.T., McKee, M., Chen, Y. 2012. ‘Thermal remote sensing with an autonomous
unmanned aerial remote sensing platform for surface stream temperatures’ IGARSS 5049–5052
Re v i e w of R em o t e S e n s i n g A p pl i c a t i o n s f or N a t ur a l R es o ur c e M a n a ge m e n t
© E CO LO G ICA L A U S T RA L IA P T Y LT D 68
Khan et al., 2012. ‘Low power greenhouse gas sensors for unmanned aerial vehicle’ Journal of Remote
Sensing, 4, 1355-1368.
Khan, A., David Schaefer, D, Tao, L., Miller, D.J., Sun, K., Zondlo, M.A., Harrison, W.A., Roscoe, B,
Lary, D.J. 2012. ‘Low Power Greenhouse Gas Sensors for Unmanned Aerial Vehicles’ Remote Sens.,
4, 1355
Kitchen, J., Armstone J., Clark, A., Danaher T. and Scarth P. .2010. Operational use of annual Landsat
-5 TM and Landsat-7 ETM+ image time-series for mapping wooded extent and foliage projective cover
in noth-eastern Australia. In Proceedings of the 15th Australasian Remote Sensting and
Photogrammetry Conference, Alice Springs, Australia, 13-17 September 2010.
Koehn, J.D., Brierley, G.J., Cant B.L. and Lucas, A.M. 2001. River Restoration Framework. Land and
Water Australia Occasional Paper 01/01.
Lucieer, A., S. Robinson, D. Turner, S. Harwin, and J. Kelcey 2012. ‘Using a micro-UAV for ultra-high
resolution multi-sensor observations of antarctic moss beds’ Int. Arch. Photogramm. Remote Sens.
Spatial Inform. Sci., 429–433
Ludwig J., Tongway D., Hodgkinson K., Freudenberger D., & Noble J. 1996. Landscape Ecology,
Function and Management: Principles from Australia’s Rangelands. CSIRO Publishing,
McNeill,S., Parman, D., Belliss, S., Dalley, D., and Dynes, R. 2010. Robust estimation of pasture
biomass using dual-polarisation TerrASAR-X imagery, Geoscience and Remote Sensing Symposium
(IGARSS), 25-30 July 2010. Honolulu, Hawaii.
NASA, 2014, Orbiting Carbon Observatory-2 (OCO-2), Available
http://oco.jpl.nasa.gov/science/ProductInfo/# [28 October 2014]
NSW DEH (2014). Native Vegetation Monitoring. Office of Environment and Heritage web site.
Available: http://www.environment.nsw.gov.au/projects/NativeVegetationMapping.htm. [October 27
2014]
NRM Alliance 2014. The NRM Spatial Information Hub Available:
http://www.crcsi.com.au/getattachment/7af84617-d187-4239-b305-3e7da5bd9e07/.aspx [9 October
2014]
Queensland Government 2014. Web-based Agricultural Land Information(WALI) On line mapping tool.
Queensland Government Brisbane. Available: http://www.daff.qld.gov.au/environment/ag-land-
audit/web-mapping-tool [9 October 2014]
Queensland Government 2013. Queensland Agricultural Land Audit. Queensland Government
Brisbane. Available: http://www.daff.qld.gov.au/environment/ag-land-audit [9 October 2014]
RWQPPS - Reef Water Quality Protection Plan Secretariat (2014), Great Barrier Reef Report Card
2012-2013 Reef Water Quality Protection Plan, Queensland Government, Available:
http://www.reefplan.qld.gov.au/measuring-success/report-cards/2012-2013-report-card.aspx
RWQPPS - Reef Water Quality Protection Plan Secretariat (2013) Reef Water Quality Protection Plan
2009. Queensland Department of Premier and Cabinet, Brisbane.

Re v i e w of R em o t e S e n s i n g A p pl i c a t i o n s f or N a t ur a l R es o ur c e M a n a ge m e n t
© E CO LO G ICA L A U S T RA L IA P T Y LT D 69
Reeves, J.A., Knight R., Zebker H.A., Kitanidis P.K. and Schreüder W.A. 2014. Estimating temporal
changes in hydraulic head using InSAR data in the San Luis Valley, Colorado. Water Resources
Research Volume 50, Issue 5, 4459–4473
Riegl 2014a. The Riegl USA Newsroom. Available https://rieglusa.wordpress.com/ [28 October 2014]
Riegl 2014b. The new fully integrated RiCOPTER UAV in flight!, Available:
https://www.youtube.com/watch?v=1mqHQZ39O14&list=UUI1fudzgTI-Ga59aCCGnyRA [28 October
2014]
Robertson, K. 1989. Spatial transformation for rapid scan-line surface shadowing, IEEE Computer
Graphics and Applications.
RPS .2014. 2013 Landcover Mapping Update for South East Queensland Catchment Area Project
Report TP 100038. Report prepared from SEQ Catchments. Ltd.
Rufino G. and A. Moccia 2005. Integrated VIS-NIR Hyperspectral/thermal-IR Electro-optical Payload
System for a Mini-UAV, American Institute of Aeronautics and Astronautics, Arlington, VA, USA, 647–
664.
Richardson, S., Irvine, E., Froend, R., Boon, P., Barber, S. and Bonneville, B. 2011. Australian
groundwater-dependent ecosystems toolbox part 2: assessment tools, Waterlines report, National
Water Commission, Canberra.
Satellite Imaging Corporation 2014. SkySat-2, Available: http://www.satimagingcorp.com/satellite-
sensors/skysat-2/ [27 October 2014]
Scarth P, Gillingham S, Muir J 2008b. ‘Assimilation of spectral information and temporal history into a
statewide woody cover change classification’. Proceedings of the 14th Australasian Remote Sensing
and Photogrammetry Conference.
Scarth P., Roder A., & Schmidt M. (2010) ‘Tracking grazing pressure and climate interaction , the role of
Landsat fractional cover in time series analysis’ 15th Australasian Remote Sensing and
Photogrammetry Conference.
SKM 2014. Developing an Improved Monitoring Approach for Springs in the Surat CMA Stage 1 & 2.
Progress Report QE06812. A report prepared for Office of Groundwater Impact Assessment, Brisbane.
Skybox Imaging .2013. Skybox Imaging Captures World's First High-Resolution, HD Video of Earth from
Space, Available: http://www.skyboximaging.com/news/FirstHigh-ResolutionHDVideoofEarth [27
October 2014]
SSEO Working Group - Space Science and Earth Observations Working Group 2009. Australian
Strategic Plan for Earth Observations from Space. Australian Academy of Science, Canberra.
https://www.science.org.au//sites/default/files/user-content/eosfinal.pdf
State of Queensland 2014. SLATS: Reports and Spatial Products, Available:
https://www.qld.gov.au/environment/land/vegetation/mapping/slats-reports/ [9 October 2014]
Tregoining, P., McClusky, S., van Dijk, A.IJ.M., Crosbie, R.S. and Pena-Arancibia, J.L. 2012.
Assessment of GRACE satellites for groundwater in Australia. Waterlines report Series No 71. National
Water Commission, Canberra. Available:

Re v i e w of R em o t e S e n s i n g A p pl i c a t i o n s f or N a t ur a l R es o ur c e M a n a ge m e n t
© E CO LO G ICA L A U S T RA L IA P T Y LT D 70
http://archive.nwc.gov.au/__data/assets/pdf_file/0003/21468/71-Assessment-of-GRACE-satellites-for-
groundwater-estimation-in-Australia.pdf [October 24 2014]
University of Maryland 2014. UMD Right now: UMD/NASA Goddard Instrument to Fly on Space Station,
Available: http://www.umdrightnow.umd.edu/news/umdnasa-goddard-instrument-fly-space-station [28
October 2014]
Wang, X., Ge, L., and L. and X. Li 2013. ‘Pasture Monitoring Using SAR with COSMO-SkyMed,
ENVISAT ASAR, and ALOS PALSAR in Otway, Australia.’ Journal of Remote Sensing, 5(7), 3611-
3636.
Wang, X., Ge, L., Li, X., and S. Gherardi 2014. ‘The feasibility of using ENVISAT ASAR and ALOS
PALSAR to monitor pastures in western Australia.’ Journal of Photogrammetric Engineering and
Remote Sensing, 80(1), 43-57.
Waters, D.K., Carroll, C., Ellis, C., Hateley, R., McCloskey, L., Packett, G.L., Dougall, R., Fentie, C.
2014. Modelling reductions of pollutant loads due to improved management practices in the Great
Barrier Reef catchments – Whole of GBR. Technical Report, Volume 1, Queensland Department of
Natural Resources and Mines, Toowoomba, Queensland (ISBN: 978-1-7423-0999).
Whitehead, K and Hugenholtz, C. 2014. ‘Remote sensing of the environment with small unmanned
aircraft systems (UASs), part 1: a review of progress and challenges.’ Journal of Unmanned Vehicle
System, 2(3).
Whitehead, K., Hugenholtz, C., Myshak, S., Brown., O., LeClair, A., Tamminga, A., Barchyn, T.,
Moorman, B., and Eaton, B. 2014. ‘Remote sensing of the environment with small unmanned aircraft
systems (UASs), part 2: scientific and commercial applications’ Journal of Unmanned Vehicle Systems,
2(3): 86-102.
Wich, S. and L. Koh, L. 2012. ‘Conservation drones: the use of unmanned aerial vehicles by ecologists’
GIM International, 26, 29–33
Zarco-Tejada, P., Berni, J., (2012) ‘Vegetation monitoring using a micro-hyperspectral imaging sensor
onboard an unmanned aerial vehicle (UAV)’ In: Proceedings of the EuroCOW 2012, European Spatial
Data Research (EuroSDR), Castelldefels, Spain
Zhu, Z. and Woodcock, C. E. 2012. ‘Object-based cloud and cloud shadow detection in Landsat
imagery.’ Remote Sensing of Environment. 118, 83–94.

Re v i e w of R em o t e S e n s i n g A p pl i c a t i o n s f or N a t ur a l R es o ur c e M a n a ge m e n t
© E CO LO G ICA L A U S T RA L IA P T Y LT D 71
Appendix A User Needs Questionnaire
Person interviewed and position
Position, Unit, Organisation
Detailed description of activity
References (web sites, etc.)
Remote sensing products used (from List)
How is remote sensing used
Drivers/uses
Importance of remote sensing to activities
Existing limitations to remote sensing products
Existing method of access/ Preferred method of access
Preferred accuracy/scale/improvements
Related/derived products used
Future developments/related needs

Re v i e w of R em o t e S e n s i n g A p pl i c a t i o n s f or N a t ur a l R es o ur c e M a n a ge m e n t
© E CO LO G ICA L A U S T RA L IA P T Y LT D 72
Appendix B List of Interviewees
Name Title Agency/Group
Bob Karfs Science Leader, Animal Science DAFF
Lea Diffey General Manager, Resources Planning DAFF
Lew Markey Climate Risk State Coordinator DAFF
Rebecca Paine Principal Policy Officer , Resources and Planning DAFF
Steve Potts Principal Policy Officer , Resources and Planning DAFF
Terry Beutel Senior Scientist, Spatial Data & Mapping DAFF
Brian Smith Senior Investigator, Investigations DNRM - compliance
Chris Holeszko Senior Investigator, Compliance & Systems DNRM - compliance
John Forcier Team Leader, Compliance & Systems DNRM - compliance
Ken Murray Manager, Land Services DNRM - compliance
Lloyd Taylor Exec Dir, Operations Support DNRM - compliance
Ray Fitzsimon CIRAN administrator, Compliance & Systems DNRM - compliance
Tanya Bartlett Director, Compliance & Systems DNRM - compliance
Warren Raddatz Senior Investigator, Compliance & Systems DNRM - compliance
Jim Walls Senior Scientist, Spatial Data & Mapping DNRM - IT coordination
Lindsay Brebber Principal IT Officer DNRM - IT coordination
Paul Brown Spatial Imagery Coordinator DNRM - IT coordination
Peter Lennon Director - Land & Spatial Information DNRM - IT coordination
Amanda Stones Rehabilitation Scientist DNRM - mining
Daniel Gillender Rehabilitation Scientist DNRM - mining
Jason Webber Rehabilitation Scientist DNRM - mining
Oskar Kadletz Abandoned Mines Coordinator DNRM - mining
Paul Donchak Manager Mineral DNRM - mining
Ross Carruthers Acting Chief Hydr-geologist DNRM - mining
Russell Dann Rehabilitation Scientist DNRM - mining
Dave Waters Principal Scientist (Modelling) DNRM - reef plan
Mark Silburn Principal Scientist, Water Planning DNRM - reef plan
Andrew Biggs Senior Scientist, Technical Support DNRM - resource assessment
Angela Pollet
Senior Spatial Analysis, Resource Assessment and
Information DNRM - resource assessment
David Calland,
Acting Manager, Land Services. Resource
Assessment and Information DNRM - resource assessment
Earl Barry Natural Resources Management Officer DNRM - resource assessment
Janice Jackson Natural Resource Management Officer DNRM - resource assessment
Jeff Pickering
Senior project officer, Resource Assessment and
Information DNRM - resource assessment
Mike Cannon Senior Land Officer, North Region DNRM - resource assessment
Paul Harris Manager, Land Services DNRM - resource assessment
Rob Hassett Senior Natural Resources Management Officer, DNRM - resource assessment

Re v i e w of R em o t e S e n s i n g A p pl i c a t i o n s f or N a t ur a l R es o ur c e M a n a ge m e n t
© E CO LO G ICA L A U S T RA L IA P T Y LT D 73
Name Title Agency/Group
Operations Support
Sue Ellen-Dear
Senior Land Resource Officer, Resource Assessment
and Information DNRM - resource assessment
Andrew Collins Senior Natural Resource Management Officer DNRM - vegetation assessment
Clynton Wells Team Leader DNRM - vegetation assessment
George Bourne Senior Natural Resource Management Officer DNRM - vegetation assessment
Ken Sherwood Regional Manager, South Region DNRM - vegetation assessment
Peter Burton Director, Lands and Mine Policy DNRM - vegetation policy
Peter Lazzarini Manager, Vegetation Management DNRM - vegetation policy
Ian Gordon Regional Manager, Central Region DNRM - water
Steven Flook
Principal Project Officer, Office of Groundwater Impact
Assessment DNRM - water
Nyssa Henry Principal Project Officer, Reef Water Quality DPC - reef plan
Rob Preston Principal Strategy Advisor PSBA
Colin Wade Spatial Analyst/Planner DSDIP
Bruce Goulevitch Principal Scientist, Remote Sensing DSITIA - RSC
Christian Witte Science Leader, Remote Sensing DSITIA - RSC
Craig Shephard Principal Scientist, QLUMP DSITIA - RSC
Dan Tindall Principal Scientist, Remote Sensing DSITIA - RSC
Dave Harris Principal Scientist, SLATS DSITIA - RSC
John Armiston Principal Scientist, LIDAR DSITIA - RSC
John Carter Principal Scientist, AussieGRASS DSITIA - RSC
Ken Brook Director, Land Surface Sciences DSITIA - RSC
Peter Scarth Principal Scientist, Remote Sensing DSITIA - RSC
Paul Lawrence Director - Landscape Sciences DSITIA - soils
Craig Hempel Principal Project Officer, Biodiversity DEHP - biodiversity
Lindsey Jones Acting Manager, Biodiversity Planning DEHP - biodiversity
Sel Saltman Principal Coastal Scientist, Environmental Planning
Unit, Environmental Planning and Policy Division DEHP - coastal
Jean Erbacher Project Manager, Reef Water Quality DEHP - healthy waterways/reef
Kari-Ann West Environmental Planning, Planning and Policy Division DEHP - SOE
Ken Horrigan State of the Environment Report, Planning and Policy
Division DEHP - SOE
Nicole Polzi Environmental Planning, Planning and Policy Division DEHP - SOE
Mark Venz Director, Energy Assessment DEHP CSG
Dan Beard Ranger NPRSR - fire management
Peter Leeson Principal Conservation Officer NPRSR - fire management
Shaun Kolomeit Team Leader – Spatial and Information Systems NPRSR - fire management
Lee Blacklock Spatial Imagery Coordinator Regional bodies
Mik Petter GIS special projects, SEQ Catchments Regional bodies
Shannon Mooney GIS and Information Manager, SEQ Catchments Regional bodies
Stuart Phinn Associate. Science Director UQ - research

Re v i e w of R em o t e S e n s i n g A p pl i c a t i o n s f or N a t ur a l R es o ur c e M a n a ge m e n t
© E CO LO G ICA L A U S T RA L IA P T Y LT D 74
Appendix C List of Non-respondents
This lists individuals that were recommended for interview that could not be contacted or made a
referral to an alternative contact.
Name Status Title Agency/grouping
Mitzi Venn Referred to Colin Wade Acting Director, Planning & Property DSDIP
Bill Date Referred to Ross Carruthers ED CSG Compliance DNRM - mining
Anne Lenz Referred to Mark Venz Executive Director DEHP - CSG compliance
Steve Jacoby Referred to Paul Lennon Executive Director, Land & Spatial Info
DNRM - Land and Spatial coordination
Claire Anderson On leave Program Leader
DEHP - healthy waterways/reef
Michael McDougall On leave Senior Valuer
DNRM - vegetation assessment
Scott Robinson
On leave referred to Jean Erbacher
Director, Reef Water Quality DEHP - reef
Brad John Referred to Paul Donchak Chief Geologist DNRM - mining
Rob Ellis Did not respond Principal Scientist (Modeling) DNRM - reef plan
Grahame Wise Referred to Oskar Kadletz
Executive Director Statewide Operations DNRM - mining
Graham Nicholas
Not available covered by Peter Burton
Director, Vegetation Management DNRM - vegetation policy
Robert Hughes Referred to Craig Hempl
Director, Biodiversity Policy DEHP - biodiversity
Scott Buchanan Referred to Craig Hempl
Director, Biodiversity Implementation DEHP - biodiversity
Steven Howell Referred to Lindsey Jones
Manager, Biodiversity Assessment DEHP - biodiversity
Joshua Bull
Did not respond content addressed by Mike Canon
Team Leader, State Land Assessment
DNRM - resource assessment
Chris Carroll On leave Theme Leader, Reef Science DNRM - reef plan
Dan Murphy Referred to Oskar Kadletz Deputy Chief Inspector DNRM - mining
Martin Land Referred to Oskar Kadletz Principal Inspector of Explosives DNRM - mining
Noel Erichsen Referred to Oskar Kadletz Deputy Chief Inspector of Explosives DNRM - mining
Phil Goode Referred to Oskar Kadletz Chief Inspector of Mines DNRM - mining
Greg Payne Referred to Oskar Kadletz Manager, Management Solutions DNRM - IT coordination
Vern Rudwick Referred to Rebecca Paine
Director, Land Management DAFF
Eugene Immisch
Did not respond content addressed by Mark Venz
Prin. Project Officer, Regional Compliance DEHP - compliance
Paul Horrocks Referred to Janice Taylor Manager DNRM - vegetation assessment
Daniel Brough Referred to Paul Lawrence
Science Leader - Land Resource Assessment DSITIA - soils

Re v i e w of R em o t e S e n s i n g A p pl i c a t i o n s f or N a t ur a l R es o ur c e M a n a ge m e n t
© E CO LO G ICA L A U S T RA L IA P T Y LT D 75
Appendix D RSC Product List
Product Level: 1 = Image archive (1a = process imagery) 2 = datasets (2a specific areas/issues), 3 = derived products
Product type
Product Level
Imagery Products Imagery
used Availability Description Function Format
Spatial Resolution (pixel/site)
Temporal Resolution
Spatial Extent /
Coverage Temporal Extent
Raw
Imag
ery
1 Imagery - Landsat - Single date (Surface Reflectance)
Multispectral satellite imagery (30m resolution) for all of Queensland. Repeat coverage every 8 - 16 days from Landsat 5 Thematic Mapper (TM) Landsat 7 Enhanced Thematic Mapper Plus (ETM+) sensors. Landsat 8 (the Landsat Data Continuity Mission - LDCM) to become operational in 2013). Imagery has been georeferenced to within 15m and corrected to top of atmosphere reflectance.
Monitoring and mapping land cover change. Either single date mapping or time-series analysis and change detection. Derived products are used to map, monitor and report on fractional cover, ground cover, foliage projective cover, water bodies, fire and weeds.
Raster Image (Imagine file ".img")
30m 16 days All of QLD 1986 - 2013 (every 8 or 16 days)
1 Imagery - SPOT 5 Multispectral satellite imagery (10 m) for all of Queensland at three time periods (2006, 2009 and 2012 - soon to be acquired).
Monitoring and mapping land cover change. Derived products include foliage projective cover, water bodies, cloud and cloud shadow, water hyacinth mapping, and woody vegetation extent for South East Queensland.
Raster Image (Imagine file ".img")
10m Multispectral;
2.5m Pan-sharpened
2-3 days All of QLD 2005/2006; 2009; 2012
1 Imagery - RapidEye
Multispectral satellite imagery captured at 6.5m resolution and resampled to 5m for specific study sites in Queensland. Imagery is georeferenced and corrected to at sensor reflectance.
The majority of Rapideye imagery at RSC was captured for pre and post cyclone Yasi mapping and coal seam gas infrastructure compliance monitoring.
Raster Image (Imagine file ".img")
5m Daily off-nadir; 5.5 days nadir
Specified study areas
Single date captures
1 Imagery - Quickbird
High resolution multispectral satellite imagery. Captured at approximately 2.5m multispectral resolution and pan sharpened to 0.6m resolution.
Quickbird imagery has been acquired for a number of small scale projects including weeds mapping and compliance.
Raster Image (Imagine file ".img")
2.5m Multispectral;
0.6m Pan-sharpened
1-3.5 days, depending on latitude
(30° off-nadir)
Specified study areas
Single date captures
1 Imagery - DMC
Multispectral satellite imagery captured by a variety of satellites in the Disaster Monitoring Satellite Constellation. Rsc holdings include imagery from Deimos-1 and UK-DMC2, both of which use the instrument SLIM-6-22. Images are georeferenced and corrected to top-of-atmosphere radiance.
Geoscience Australia purchased a complete coverage of Australia, as an alternative to Landsat captured by the satellite UK-DMC2. RSC has obtained these: single to multiple dates of imagery for the majority of Australia from 2010 to 2012. Four Deimos-1 images were also acquired in 2013 to map flooding extent in Queensland.
Raster Image (Imagine file ".img")
22m
Daily by at least one
of the DMC
satellites
All of Australia
Various dates from 2010 - 2013
1 Aerial Imagery Various aerial imagery, either in hard copy or digital form.
Aerial imagery for a variety of tasks. The majority is captured over urban areas.
Various 5cm - 50cm? Tasked capture
All of QLD (various dates)
Various dates (pre 1960s - current)
1 Imagery - Airborne LiDAR
Point Cloud (LAS file ".las")
1 ~ 5m
1 Imagery - Icesat (Satellite LiDAR)

Re v i e w of R em o t e S e n s i n g A p pl i c a t i o n s f or N a t ur a l R es o ur c e M a n a ge m e n t
© E CO LO G ICA L A U S T RA L IA P T Y LT D 76
Product type
Product Level
Imagery Products Imagery
used Availability Description Function Format
Spatial Resolution (pixel/site)
Temporal Resolution
Spatial Extent /
Coverage Temporal Extent
1 Imagery - ALOS PALSAR (Radar) - Scenes
Raster Image (Imagine file ".img")
15m
1 Imagery - ALOS PALSAR (Radar) - Strips
Raster Image (Imagine file ".img")
50m
1 Cosmo Sky Med
1 Radarsat
1 Multiple Sensors Imagery from multiple sensors used to map or monitor particular landscape features
Surf
ace
Ref
lect
ance
Pro
du
cts
1a Seasonal Composite (Surface Reflectance) - Single Date
Landsat on request Raster Image (Imagine file ".img")
30m
8-16 days according to landsat image availability
All of Qld 1986-current
1a Imagery - Landsat - Seasonal Composite (Surface Reflectance)
Landsat
Available through Open Data/TERN-AusCover
A seasonal composite of Landsat multispectral imagery, with the most representative pixel value from each band used in the output image.
Used to produce a cloud free, continuous image, robust against outliers and Landsat-7 SLC-off gaps. This product can be used as a starting point for time series analysis, removing the need for a number of the pre-processing stages while capturing the majority of the variation in the time series and reducing the computing power needed for time series analysis. Four composite products are produced for each year corresponding to summer, autumn, winter and spring.
Raster Image (BigTiff)
30m 4 per year All of Qld 1986-current
Mas
ks
1a Time series Cloud and cloud shadow Landsat on request
Cloud and shadow masks for each date of landsat imagery derived from time series change detection and classification
masking cloud and shadow from imagery for subsequent applications
Raster Image (Imagine file ".img") 30m
8-16 days according to landsat
image availability
whole of Qld currently 2000-2012
1a Fmask Cloud and Shadow Landsat on request
Cloud and shadow masks for each date of landsat imagery derived from the published Fmask algorithm. Zhu, Z.; Woodcock, C.E. Object-based cloud and cloud shadow detection in Landsat imagery. Remote Sensing of Environment 2012, 118, 83–94.
masking cloud and shadow from imagery for subsequent applications
Raster Image (Imagine file ".img") 30m
8-16 days according to landsat
image availability
whole of Qld 1986 - current
1a Topographic Mask Landsat on request
Raster Image (Imagine file ".img") 30m
1a Water Index - Water Bodies (Landsat) Landsat on request
A water index developed using canonical variants analysis of Landsat 5 TM imagery. The index is threshold to perform mapping of water body extent and persistence in Queensland.
Detect the presence of new farm dams, to show flooding extent and as a water mask used when classifying other imagery features.
Raster Image (".img") and ESRI shapefile 30m
8-16 days according to landsat
image availability All of QLD 1986 - current
Frac
tio
nal
Co
ver
Pro
du
cts
2
Fractional Cover - Single Date - Single Date Landsat By request
Statewide monitoring of vegetation fractions (bare, green, dry) at 16 day intervals
Reporting of fractional cover on state-wide, regional and lot and plan basis. Used in Forage and VegMachine. 30m
8-16 days according to landsat
image availability All of QLD 1986-current

Re v i e w of R em o t e S e n s i n g A p pl i c a t i o n s f or N a t ur a l R es o ur c e M a n a ge m e n t
© E CO LO G ICA L A U S T RA L IA P T Y LT D 77
Product type
Product Level
Imagery Products Imagery
used Availability Description Function Format
Spatial Resolution (pixel/site)
Temporal Resolution
Spatial Extent /
Coverage Temporal Extent
2 Fractional Cover - Seasonal - Seasonal Landsat
Available through Open Data/TERN-AusCover
Seasonal composite of single date fractional cover fractions, giving most representative value for the season (per-pixel).
Gives a robust time series of cover fractions, on a regular time interval, suitable for time series analysis. Raster Image 30m 4 per year All of Qld 1986-current
3 Ground Cover - Single Date Landsat By request
Statewide monitoring of vegetation fractions (bare, green, dry) at 16 day intervals. Produced on request only. To produce the ground cover product, the fractional cover product is adjusted using an estimate of the proportion of the pixel obscured by mid- and over-story foliage. This estimate of cover is an estimate of the combined persistent dry and persistent green layers. That is, all vegetation in the mid- and upper- storeys. The mid and upper storage foliage is effectively removed from the estimates of cover and the ground cover estimate is therefore based only on the proportion of ground that was visible by the satellite.
Reporting of fractional cover on state-wide, regional and lot and plan basis. Used in Forage and VegMachine. Raster Image 30 m All of QLD 1986-current
3 Persistent Green - Seasonal Landsat On request
Spline fit to minimum of green cover fraction seasonal composites tiff 30m Seasonal Qld 1988-2012
3 Ground Cover - Seasonal Landsat
Available through Open Data/TERN-AusCover
Seasonal composite of single date ground cover fractions, giving most representative value for the season (per-pixel).
Gives a robust time series of cover fractions, on a regular time interval, suitable for time series analysis. tiff 30m Seasonal Qld 1986-current
3
Fractional Cover Deciles - Green and Non-Green Landsat
Available through Open Data/TERN-AusCover
Two fractional cover decile products, green cover and total cover, are currently produced. These products compare, at the per-pixel level, the level of cover for the specific season of interest against the long term cover for that same season. For each pixel all cover values over the entire time-series of seasonal images are classified into deciles. The cover value for the pixel in the season of interest is then classified according to the decile in which it falls. tiff 30m Seasonal Qld 1986-current
3
Ground Cover - Long Term Seasonal - Min/Med/Max/SD/No Observations (Bare, Green and Non-Green) Landsat
Available through Open Data/TERN-AusCover and QGIS tiff 30m
Once only baseline product Qld 1986-current
3
Ground Cover - Long Term Annual - Min/Med/Max/SD/No Observations (Bare, Green and Non-Green) Landsat
Available through Open Data/TERN-AusCover and QGIS tiff 30m
Once only baseline product Qld 1986-current
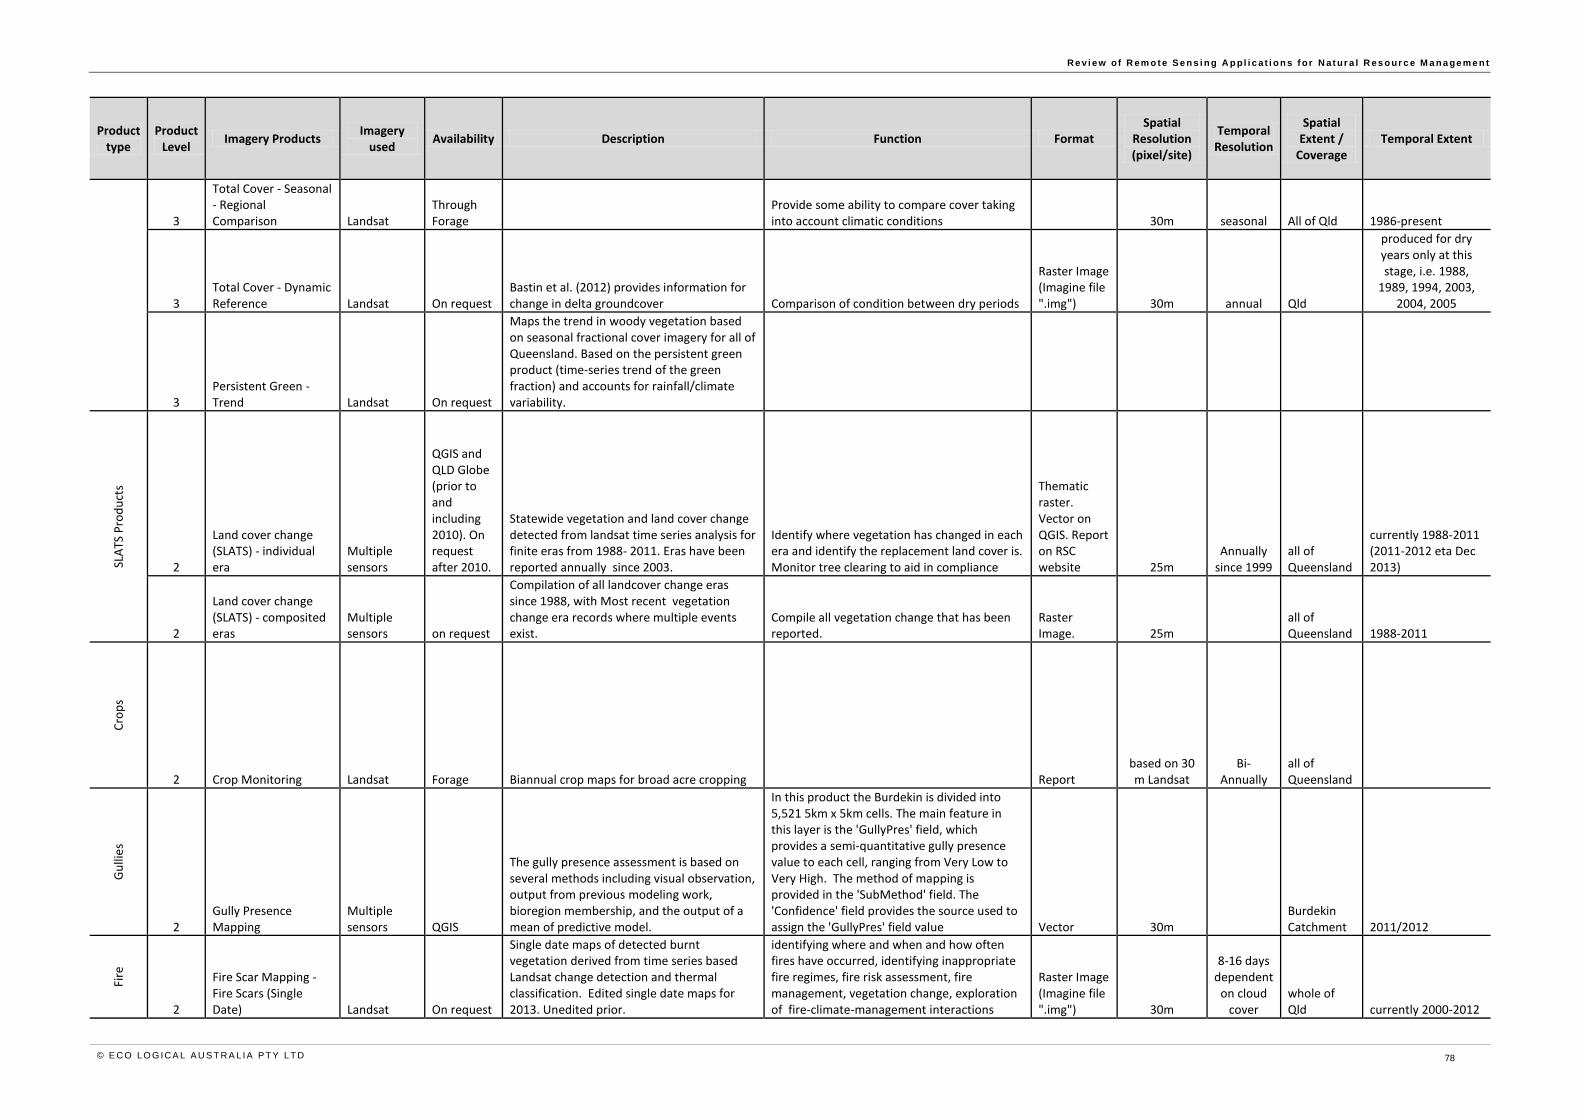
Re v i e w of R em o t e S e n s i n g A p pl i c a t i o n s f or N a t ur a l R es o ur c e M a n a ge m e n t
© E CO LO G ICA L A U S T RA L IA P T Y LT D 78
Product type
Product Level
Imagery Products Imagery
used Availability Description Function Format
Spatial Resolution (pixel/site)
Temporal Resolution
Spatial Extent /
Coverage Temporal Extent
3
Total Cover - Seasonal - Regional Comparison Landsat
Through Forage
Provide some ability to compare cover taking into account climatic conditions 30m seasonal All of Qld 1986-present
3 Total Cover - Dynamic Reference Landsat On request
Bastin et al. (2012) provides information for change in delta groundcover Comparison of condition between dry periods
Raster Image (Imagine file ".img") 30m annual Qld
produced for dry years only at this stage, i.e. 1988,
1989, 1994, 2003, 2004, 2005
3 Persistent Green - Trend Landsat On request
Maps the trend in woody vegetation based on seasonal fractional cover imagery for all of Queensland. Based on the persistent green product (time-series trend of the green fraction) and accounts for rainfall/climate variability.
SLA
TS P
rod
uct
s
2
Land cover change (SLATS) - individual era
Multiple sensors
QGIS and QLD Globe (prior to and including 2010). On request after 2010.
Statewide vegetation and land cover change detected from landsat time series analysis for finite eras from 1988- 2011. Eras have been reported annually since 2003.
Identify where vegetation has changed in each era and identify the replacement land cover is. Monitor tree clearing to aid in compliance
Thematic raster. Vector on QGIS. Report on RSC website 25m
Annually since 1999
all of Queensland
currently 1988-2011 (2011-2012 eta Dec 2013)
2
Land cover change (SLATS) - composited eras
Multiple sensors on request
Compilation of all landcover change eras since 1988, with Most recent vegetation change era records where multiple events exist.
Compile all vegetation change that has been reported.
Raster Image. 25m
all of Queensland 1988-2011
Cro
ps
2 Crop Monitoring Landsat Forage Biannual crop maps for broad acre cropping Report based on 30 m Landsat
Bi-Annually
all of Queensland
Gu
llie
s
2 Gully Presence Mapping
Multiple sensors QGIS
The gully presence assessment is based on several methods including visual observation, output from previous modeling work, bioregion membership, and the output of a mean of predictive model.
In this product the Burdekin is divided into 5,521 5km x 5km cells. The main feature in this layer is the 'GullyPres' field, which provides a semi-quantitative gully presence value to each cell, ranging from Very Low to Very High. The method of mapping is provided in the 'SubMethod' field. The 'Confidence' field provides the source used to assign the 'GullyPres' field value Vector 30m
Burdekin Catchment 2011/2012
Fire
2
Fire Scar Mapping - Fire Scars (Single Date) Landsat On request
Single date maps of detected burnt vegetation derived from time series based Landsat change detection and thermal classification. Edited single date maps for 2013. Unedited prior.
identifying where and when and how often fires have occurred, identifying inappropriate fire regimes, fire risk assessment, fire management, vegetation change, exploration of fire-climate-management interactions
Raster Image (Imagine file ".img") 30m
8-16 days dependent
on cloud cover
whole of Qld currently 2000-2012

Re v i e w of R em o t e S e n s i n g A p pl i c a t i o n s f or N a t ur a l R es o ur c e M a n a ge m e n t
© E CO LO G ICA L A U S T RA L IA P T Y LT D 79
Product type
Product Level
Imagery Products Imagery
used Availability Description Function Format
Spatial Resolution (pixel/site)
Temporal Resolution
Spatial Extent /
Coverage Temporal Extent
3
Fire Scar Mapping - Fire Scars (Annual Composite) Landsat
On QGIS and TERN-AusCover
Annual composites of above single date burnt vegetation maps encoded by day of year that fire was first detected
Raster Image (Imagine file ".img" and BigTiff) 30m annual
whole of Qld currently 2000-2012
3 Fire Scar Mapping - No. times burnt Landsat On request
Frequency of fire detection through time (1986-present) 30m
3 Fire Scar Mapping - Time since burnt Landsat On request Time since fire detected (1986-present) 30m
3 Potential Grassfire Risk AussieGRASS
Long Paddock Risk of grass fire (high/medium/low) GIF,IMG 5km X 5km Monthly Australia
3 Curing Index (Percentiles) AussieGRASS
Long Paddock
Based on simulated green and dead pasture and a Potential Grassfire Risk where the curing index is combined with information of fuel mass. These data apply to the last day of each calendar month. GIF,IMG 5km X 5km Monthly Australia
Lan
d U
se
2 Land Use Multiple sensors QGIS Catchment scale land use mapping
QLUMP maps and assesses patterns of land use and land use change across the State in accordance with the Australian Land Use and Management (ALUM) classification.
ESRI Geodatabase NA
Baseline for 1999 is state-wide, various catchment updated since.
2 Land Use Change Multiple sensors QGIS Catchment scale land use change mapping
QLUMP maps and assesses patterns of land use and land use change across the State in accordance with the Australian Land Use and Management (ALUM) classification.
ESRI Geodatabase NA
Varies at catchment scale.
Fiel
d D
ata 2
Field Data - Fractional Cover
Field Collection
Available through Open Data/TERN-AusCover
Point intersect transects used to calibrate and validate products derived from satellite imagery
Used as training and validation of foliage projective cover and fractional cover products derived from Landsat imagery (RSC Qld based products, JRSPS products for NSW,VIC and NT, national Fractional Cover Products produced under Auscover) and MODIS based fractional cover (MODIS).
shapefiles, field photos ~1 ha
Sites Australia-wide
2 Field Data - Terrestrial Laser Scanning
Field Collection
Available through Open Data/TERN-AusCover Riegl VZ400 waveform TLS.
To derive canopy and stem biophysical variables. Mapping of gully and beach erosion.
shapefiles, field photos, scans ~1 ha
2
Field Data - Hemispherical Photography
Field Collection On request
Canon EOS cameras with 8mm Sigma fisheye lenses
Used as a cheap, rapid alternative to point-intercept transected for some applications (e.g. riparian). Estimation of LAI/PAI/clumping.
shapefiles, hemispheric photographs ~1 ha

Re v i e w of R em o t e S e n s i n g A p pl i c a t i o n s f or N a t ur a l R es o ur c e M a n a ge m e n t
© E CO LO G ICA L A U S T RA L IA P T Y LT D 80
Product type
Product Level
Imagery Products Imagery
used Availability Description Function Format
Spatial Resolution (pixel/site)
Temporal Resolution
Spatial Extent /
Coverage Temporal Extent
Co
al S
eam
Gas
2
Baseline mapping of coal seam gas infrastructure in Surat and Bowen basins.
Multiple sensors On request
This was based on visual analysis of RapidEye imagery captured late 2012 – mid 2013.We are progressing with the monitoring stage so new infrastructure installed between the RapidEye capture and mid-2014 will be progressively available. vector
Surat and Bowen basins 2012/2013
Veg
etat
ion
Str
uct
ure
/FP
C
2
Foliage Projective Cover - Landsat - Annual Landsat
Available through Open Data/TERN-AusCover
Field calibrated spectrally derived estimate of overstorey FPC, which maps of the extent and cover of woody vegetation based on Landsat reflectance imagery for all of Queensland. Tiff
25 m (SLATS); 30 m (USGS)
1999, 2001 and 2004-2011
3
Wooded Extent and Foliage Projective Cover - Landsat Landsat On request
Wooded extent classification from annual time-series. Wooded areas have a modeled FPC value for each pixel.
This is a Level 3 product used as input for numerous applications (SLATS reporting, RE revision, fire risk, riparian) Tiff
25 m (SLATS); 30 m (USGS) Annual Qld/NSW 2000-2012
3
Foliage Projective Cover - Landsat- Forest Fragmentation Landsat
State-wide forest fragmentation/connectivity analysis
An analysis of every forest patch in Queensland Vector (shp) 30m 4 years All of QLD 2011
2 Foliage Projective Cover - SPOT SPOT SPOT derived FPC 10m
3 Foliage Projective Cover - LiDAR
Airborne LiDAR Lidar derived FPC
Calibration and validation of satellite derived products. Tiff 1-5m Variable Variable
3 Vegetation Extent SPOT
Woody vegetation extent mapping in South Eastern Queensland for 2012 derived from SPOT 5 10m imagery and manually edited.
Mapping completed to update bushland extent in existing Department of Environment and Heritage Koala Habitat Mapping.
Raster Image (Imagine file ".img"); Updated GIS vector (".shp") for Koala Habitat Mapping 10m 2012 SEQ 2012

Re v i e w of R em o t e S e n s i n g A p pl i c a t i o n s f or N a t ur a l R es o ur c e M a n a ge m e n t
© E CO LO G ICA L A U S T RA L IA P T Y LT D 81
Product type
Product Level
Imagery Products Imagery
used Availability Description Function Format
Spatial Resolution (pixel/site)
Temporal Resolution
Spatial Extent /
Coverage Temporal Extent
Rip
aria
n V
eget
atio
n
2
Foliage Projective Cover, SLATS & ground cover - Landsat & SPOT - Riparian Vegetation
Multiple sensors On request
Defining riparian areas and mapping vegetation extent
Reporting on forest extent, forest connectivity, forest loss and ground cover within riparian areas for Reef and QMDB
Vector (shp), csv, report 30/15m 4 years
Reef Catchments, QMDB 2009
Bio
mas
s
2 Wooded Biomass Allometric relationship between field measured AGB and L-band HV BigTIFF 15m/50m Annual Qld/NSW 2007-2010
Gra
zin
g
2 Total Standing Dry Matter (kg DM/ha) AussieGRASS
Long Paddock
TSDM is the product of pasture growth and pasture removal processes. TSDM includes: green leaf, dead leaf, green stem, dead stem, reproductive material that is attached to tussock bases and standing. Both annual and perennial species (palatable and un-palatable) are included but not shrub canopy biomass GIF,IMG 5km X 5km Monthly Australia
3
TSDM Relative to Historical Records (Percentiles) AussieGRASS
Long Paddock
GIF,IMG 5km X 5km Monthly Australia
2 Total Pasture Growth (kg/ha) AussieGRASS
Long Paddock
Pasture growth is defined as new plant material produced during the period being considered. Calculated daily and summed to give monthly and annual totals. reported on a dry matter basis in the units kg/ha. Growth is dynamic and calculated daily. Growth includes palatable and unpalatable species. GIF,IMG 5km X 5km Monthly Australia
3
Pasture Growth Relative to Historical Records from 1957 (Percentiles) AussieGRASS
Long Paddock
GIF,IMG 5km X 5km
Various (monthly, quarterly,
6-monthly,
12-monthly, annually,
24-monthly) Australia
3 Chance of Exceeding Median Growth AussieGRASS
Long Paddock High/medium/low risk map of chance GIF,IMG 5km X 5km Monthly Australia

Re v i e w of R em o t e S e n s i n g A p pl i c a t i o n s f or N a t ur a l R es o ur c e M a n a ge m e n t
© E CO LO G ICA L A U S T RA L IA P T Y LT D 82
Product type
Product Level
Imagery Products Imagery
used Availability Description Function Format
Spatial Resolution (pixel/site)
Temporal Resolution
Spatial Extent /
Coverage Temporal Extent
3 LEPS Forecast Skill – Pasture Growth AussieGRASS
Long Paddock
GIF,IMG 5km X 5km Monthly Australia
Rai
nfa
ll an
d S
trea
mfl
ow
2
Potential Flow to Stream, Relative to Historical Records from 1957 SILO
Long Paddock
PFTS runs a continental scale daily water balance (tree transpiration, grass transpiration, soil evaporation, run-off and drainage) GIF,IMG 5km X 5km
Various (monthly, quarterly,
6-monthly,
12-monthly, annually,
24-monthly) Australia
3
Chance of Exceeding Potential Flow to Stream SILO
Long Paddock High/medium/low risk map of chance GIF,IMG 5km X 5km Monthly Australia
2 Total Rainfall (mm) SILO Long Paddock
Rainfall maps are produced by interpolating point data from rain gauges recorded at BoM registered rainfall station sites GIF,IMG 5km X 5km Monthly Australia
3
Rainfall Relative to Historical Records (Percentiles) SILO
Long Paddock
Rainfall percentiles compare the period (i.e. 1, 3, 6, 12, 24 months) with data from the corresponding period over the recorded history (1890). GIF,IMG 5km X 5km Monthly Australia
Veg
Hei
ght 3
Vegetation Height (Airborne LiDAR)
Airborne LiDAR On request
Multiple height metrics derived from lidar point clouds at a user specified resolution Tiff 1-5m
3 Vegetation Height (Icesat) Icesat On request
Aggregation of Icesat pulses using Regional Ecosystem mapping Vector RE
Input data spans 7-9
years Qld
Dis
aste
r M
app
ing 2
Water - Flood Extents - High Resolution
Multiple sensors On request
Flood water extents from high resolution imagery at selected sites
Mapping of flood extent for various rainfall events throughout QLD. A variety of imagery has been used for this mapping including radar (Radarsat, Cosmo SkyMed and Aerial Imagery)
ESRI shapefile (".shp") and Raster Image (".img") 30cm - 10m Various Various
2
Water - Flood Extents - Medium/Low Resolution
Multiple sensors On request
Flood water extents from medium/low resolution imagery at selected sites
Mapping of flood extent for various rainfall events throughout QLD. A variety of imagery has been used for this mapping including radar (DMC and Landsat Imagery)
ESRI shapefile (".shp") and Raster Image (".img") 22m - 30m Various Various
2a Cyclone Yasi Mapping RapidEye On request
Mapping of wooded vegetation affected by tropical cyclone Yasi (i.e. canopy loss, tree fall) using Rapideye imagery (5m).
Change detection pre and post tropical cyclone Yasi.
Raster Image (".img") 5m
Area impacted by Yasi near Innisfail 2010 - 2011
Wee
ds
2a Weeds - Prickly Acacia On request
Mapping of prickly acacia extent and change in extent in the Mitchell Grass Downs bioregion
Prickly acacia mapping was completed for the years 1987, 1999 and 2008. This mapping shows the change in extent over time, within the Mitchell Grass Downs Bioregion of QLD. This mapping can be used to determine effects of management, as well as target areas of infestation.
ESRI shapefile (".shp") and Raster Image (".img") 30m
Mitchel Grass Downs Bioregion 1987, 1999 and 2008

Re v i e w of R em o t e S e n s i n g A p pl i c a t i o n s f or N a t ur a l R es o ur c e M a n a ge m e n t
© E CO LO G ICA L A U S T RA L IA P T Y LT D 83
Product type
Product Level
Imagery Products Imagery
used Availability Description Function Format
Spatial Resolution (pixel/site)
Temporal Resolution
Spatial Extent /
Coverage Temporal Extent
2a Weeds - Lantana On request
Mapping of Lantana infestation probability of occurrence along the eastern coast of Australia
Delineation of likely areas infested by lantana for targeting by weed management authorities
Raster Image (".img") 30m
Eastern Coast of Australia (QLD, NSW, VIC) 2006/2007
2a Weeds - Rubber Vine On request Mapping of rubber vine at selected locations using high resolution imagery
Mapping using pan-sharpened Quickbird imagery for 2008 at selected sites in central and western Queensland. Location of rubber vine for targeting of weed management activities. Research to determine the accuracy of using remote sensing to map rubber vine.
ESRI shapefile (".shp") and Raster Image (".img") 0.6m
Cloncurry, Richmond, Hughenden 2008
2a Weeds - Water Hyacinth On request
Mapping of water hyacinth in the Brisbane River
Mapping to show change and existence of water hyacinth infestations for targeting by weed management authorities
ESRI shapefile (".shp") and Raster Image (".img") 10m
Brisbane River
2005, 2006, 2011, 2012 (?)

Re v i e w of R em o t e S e n s i n g A p pl i c a t i o n s f or N a t ur a l R es o ur c e M a n a ge m e n t
© E CO LO G ICA L A U S T RA L IA P T Y LT D 84
Appendix E New and Developing Technologies
Developments in satellite technology and their remote sensing applications
In recent decades there has been a significant increase in the number of missions deploying remote
sensing satellites into space. Advances in technology has also increased sensitivity, resolution,
operability and reduced the price of products. The below sections outline some recent advances in
remote sensing satellite technology.
High resolution, High-definition Video
A company called Skybox Imaging owns two satellites (SkySat -1 and 2) which can collect high
resolution, high-definition video of the Earth’s surface. Video remote sensing is a developing
technology, and the company claims that it is the world’s first video of this quality (Skybox Imaging,
2013).
Videos are full motion black and white 30 frames per second, duration up to 90 seconds, field of view 2
km by 1.1 km, resolution 1.1 m at nadir (Satellite Imaging Corporation, 2014).
WorldView-3 high resolution imagery
WorldView-3 is a commercial satellite owned by Digital Globe that was launched in mid-2014. It
provides the highest resolution panchromatic imagery commercially available in the world via satellite,
up to 31cm resolution.
It also has several other capabilities, including:
Eight-band multispectral imagery with 1.24m accuracy at nadir.
Eight SWIR bands at 3.7m resolution
12 VACIS bands at 30m resolution
The minimum area of purchase is 25 square kilometres from the archive, and 100 square kilometres for
tasking. Minimum widths and segments of 5km also apply (Geoimage, 2014).

Re v i e w of R em o t e S e n s i n g A p pl i c a t i o n s f or N a t ur a l R es o ur c e M a n a ge m e n t
© E CO LO G ICA L A U S T RA L IA P T Y LT D 85
Figure 17: WorldView-3 imagery
Nasa’s Orbiting Carbon Observatory-2 (OCO2)
OCO2 was launched in mid-2014. It is dedicated to studying sources and sinks of carbon dioxide and
how they change over time. It measures the intensity of sunlight reflected from the presence of CO2 in a
column of air. Once fully operational, OCO2 will provide a variety of products to the public, including
vertical atmospheric profiles of temperature, CO2 and water vapour as well as aerosol content (NASA,
2014).
The A-Train
The Afternoon Constellation of Satellites (A-Train) is a constellation of satellites that allows for synergy
between the missions. This means that more remotely sensed information about the condition of the
Earth can be obtained from the combined observations than would be possible from the sum of the
observations taken independently. For instance, measurements taken by the lead satellite (which is the
OCO-2) can be supported by measurements from other satellites that follow close behind (such as
CALIPSO, which collects information on the role of clouds and aerosols on the Earth’s climate).
The A-Train Data Depot has been developed to process, archive, visualise, analyse and correlate
distributed atmospheric measures from A-Train instruments. It provides on-line access and services for
science, applications and education uses. Data is usually provided free or charge. A summary of
satellites in the A Train constellation is provided in Table 8.

Re v i e w of R em o t e S e n s i n g A p pl i c a t i o n s f or N a t ur a l R es o ur c e M a n a ge m e n t
© E CO LO G ICA L A U S T RA L IA P T Y LT D 86
Table 8: A –Train Satellites (from NASA 2014)
Figure 18: The A-Train
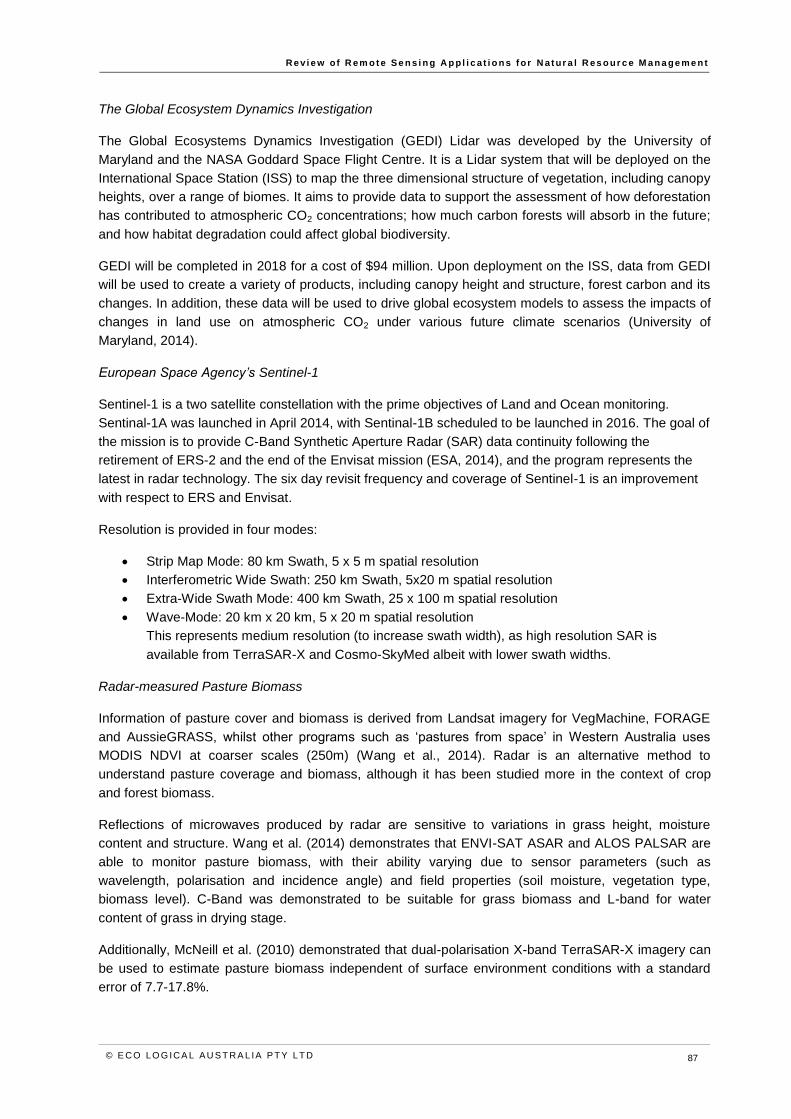
Re v i e w of R em o t e S e n s i n g A p pl i c a t i o n s f or N a t ur a l R es o ur c e M a n a ge m e n t
© E CO LO G ICA L A U S T RA L IA P T Y LT D 87
The Global Ecosystem Dynamics Investigation
The Global Ecosystems Dynamics Investigation (GEDI) Lidar was developed by the University of
Maryland and the NASA Goddard Space Flight Centre. It is a Lidar system that will be deployed on the
International Space Station (ISS) to map the three dimensional structure of vegetation, including canopy
heights, over a range of biomes. It aims to provide data to support the assessment of how deforestation
has contributed to atmospheric CO2 concentrations; how much carbon forests will absorb in the future;
and how habitat degradation could affect global biodiversity.
GEDI will be completed in 2018 for a cost of $94 million. Upon deployment on the ISS, data from GEDI
will be used to create a variety of products, including canopy height and structure, forest carbon and its
changes. In addition, these data will be used to drive global ecosystem models to assess the impacts of
changes in land use on atmospheric CO2 under various future climate scenarios (University of
Maryland, 2014).
European Space Agency’s Sentinel-1
Sentinel-1 is a two satellite constellation with the prime objectives of Land and Ocean monitoring.
Sentinal-1A was launched in April 2014, with Sentinal-1B scheduled to be launched in 2016. The goal of
the mission is to provide C-Band Synthetic Aperture Radar (SAR) data continuity following the
retirement of ERS-2 and the end of the Envisat mission (ESA, 2014), and the program represents the
latest in radar technology. The six day revisit frequency and coverage of Sentinel-1 is an improvement
with respect to ERS and Envisat.
Resolution is provided in four modes:
Strip Map Mode: 80 km Swath, 5 x 5 m spatial resolution
Interferometric Wide Swath: 250 km Swath, 5x20 m spatial resolution
Extra-Wide Swath Mode: 400 km Swath, 25 x 100 m spatial resolution
Wave-Mode: 20 km x 20 km, 5 x 20 m spatial resolution
This represents medium resolution (to increase swath width), as high resolution SAR is
available from TerraSAR-X and Cosmo-SkyMed albeit with lower swath widths.
Radar-measured Pasture Biomass
Information of pasture cover and biomass is derived from Landsat imagery for VegMachine, FORAGE
and AussieGRASS, whilst other programs such as ‘pastures from space’ in Western Australia uses
MODIS NDVI at coarser scales (250m) (Wang et al., 2014). Radar is an alternative method to
understand pasture coverage and biomass, although it has been studied more in the context of crop
and forest biomass.
Reflections of microwaves produced by radar are sensitive to variations in grass height, moisture
content and structure. Wang et al. (2014) demonstrates that ENVI-SAT ASAR and ALOS PALSAR are
able to monitor pasture biomass, with their ability varying due to sensor parameters (such as
wavelength, polarisation and incidence angle) and field properties (soil moisture, vegetation type,
biomass level). C-Band was demonstrated to be suitable for grass biomass and L-band for water
content of grass in drying stage.
Additionally, McNeill et al. (2010) demonstrated that dual-polarisation X-band TerraSAR-X imagery can
be used to estimate pasture biomass independent of surface environment conditions with a standard
error of 7.7-17.8%.

Re v i e w of R em o t e S e n s i n g A p pl i c a t i o n s f or N a t ur a l R es o ur c e M a n a ge m e n t
© E CO LO G ICA L A U S T RA L IA P T Y LT D 88
Radar provides some benefit over use of other methods as it is sensitive to biomass and moisture, and
is unhindered by rain and cloud cover or pasture dynamics (whether green or dry) (Australian Research
Council, no date; Wang et al 2013). It can also be deployed at higher spatial (pasture and paddock
scales) and temporal resolutions than Landsat and MODIS.
Monitoring of terrestrial sun-induced chlorophyll fluorescence from space
Sun-induced chlorophyll fluorescence (SiCF) is an electromagnetic signal emitted in the 650–800 nm
spectral window by the chlorophyll-a of green leaves (Guanter et al, 2013a). Recent advances in remote
sensing have enabled space-based monitoring of sun-induced chlorophyll fluorescence from terrestrial
plants. Guanter et al. (2014) has shown that gross primary productivity (the output from photosynthesis)
can be measured more accurately than for traditional methods such as remotely sensed vegetation
indices or complex carbon cycle modes. This has applications to measure crop, forest and ocean
productivity, plant stress (e.g. drought due to climate change) and carbon cycles.
Guanter et al (2013a) has used high spectral resolution measurements by the Fourier Transform
Spectrometer (FTS) on board the greenhouse gases observing satellite (GOSAT) to obtain SiCF. The
OCO-2 also has capacity to obtain SiCF data, with improved spatial resolution and coverage (~100x
more measurements that GOSAT). Upcoming missions also have potential for improved SiCF coverage
and resolution, including (Guanter et al, 2013b):
Sentinel-5 Precursor TROPOMI, due to be launched in January 2015 with global coverage and
improved spatial resolution.
Sentinel-5 due to be launched around 2019, which is similar to TROPOMI
Sentinel-4, due to be launched around 2020
ESA Earth Explorer 8th: FLEX or CarbonSat.
Developments in Unmanned Aerial Vehicles (UAVs)
UAVs, otherwise known as Unmanned Aerial Systems, Drones, and aerial robots, were developed in a
military context, though the benefits of civilian use in remote sensing has been realised since the 1970’s
(Colomina and Molina, 2014). In an agricultural and environmental management context, they have
been known to provide benefits over aerial photography and/or satellite imagery when fine resolution
data is required.
Conventional satellite mounted remote sensing platforms post several tradeoffs, including high cost,
lack of operational flexibility, limited versatility and/or poor spatial and temporal resolutions (Whitehead
and Hugenholtz, 2014). To overcome some of these challenges UAV are emerging as a technology to
replace, compliment or supplement remote sensing data acquired from satellites.
UAVs are usually fixed or rotary wing system, with the fixed wings having greater speed, ranges and
flight durations. Rotary wing systems tend to have greater manoeuvrability however. Common remote
sensing applications in use or in development include (Whitehead and Hugenholtz, 2014):
Photogrammetry. Data quality is usually less than that collected with manned aircraft due to
platform stability and the use of nonmetric cameras (Whitehead and Hugenholtz, 2014). Despite
this they usually provide greater resolution (sub-cm). It is often an attractive option for users due
to the low costs, flexibility in the timing of image acquisition and short turnaround times
(Whitehead and Hugenholtz, 2014).
Multispectral and hyperspectral data capture. Payload weight restrictions and the cost of high
end miniaturised imaging devices means that UAVs are often restricted to carrying consumer
grade cameras that are typically designed to record spectral reflectances between 400-700 nm

Re v i e w of R em o t e S e n s i n g A p pl i c a t i o n s f or N a t ur a l R es o ur c e M a n a ge m e n t
© E CO LO G ICA L A U S T RA L IA P T Y LT D 89
(the visible region). This is particularly a problem for vegetation health, which utilised Near-
infrared reflectance usually between 750 and 1250 nm. Nonetheless, advances are being made
to fit multispectral and hyperspectral sensors to UAVs.
Thermal. UAVs are well suited to carry new generation thermal imaging devices, which are both
smaller and less expensive than traditional (cooled) thermal imaging sensors. This has practical
application with vegetation monitoring, wildlife counts and real time bushfire monitoring.
SAR and Lidar. SAR systems for UAVs appear to be in the development phase while Lidar is
further advanced.
Future developments include improvements to platform stability, ease of operation/deployment, greater
operating ranges, and automated sense and avoid systems to mitigate any safety concerns (Whitehead
and Hugenholtz, 2014) making them more attractive to users.
Examples of UAV application is provided in Table 9 below, which has been adapted from Colomina and
Molina (2014) and Khan et al. (2014). Applications are usually for mapping, feature detection (including
solid, gas and water), wildlife management or the study of landscape dynamics (Whitehead et al. 2014;
Khan et al. 2012).
Table 9: Example UAV Applications
System Application Reference
Radio-controlled fixed-wing model with
thermal imager and hyperspectral
sensor in visible NIR hands
Forest fire monitoring Rufino and Moccia
(2005)
Miniaturised hyperspectral camera
mounted on a fixed-wing auto-piloted
platform of 6 kg Max take-off weight
Vegetation monitoring Zarco-Tejada, and
Berni (2012)
Mini-UAS MK-Okto by HiSystems
GmbH equipped with either a NEC
F30 IS thermal imaging system or a
tetracam Mini MCA-4.
Thermal- and multispectral-imaging
Normalized Difference Vegetation
Index (NDVI) computation
Bendig et al. (2012)
Pentax Optio A40 for RGB photos and
a Sigma DP1 modified to acquire the
NIR band, on-board a Microdrones
md4-200
Tree species classification based on
different vegetation indices in a park
area
Gini et al. (2012)
Oktokopter with optical and
hyperspectral cameras. Extremely
dense 3D point cloud and ultra-high
resolution spatial data.
Analysis of Antarctic moss beds as
indicators for the regional effects of
climate change. Output: 2 cm
resolution digital terrain model
(DTM).
Lucieer et al. (2012)
Low-cost high-resolution thermal
imagery using AggieAir UAS. RGB,
NIR and thermal-vision.
Stream temperature monitoring for
aquatic ecosystem health. The
thermal image provided 30cm×30cm
resolution stream temperatures.
Jensen et al. (2012)

Re v i e w of R em o t e S e n s i n g A p pl i c a t i o n s f or N a t ur a l R es o ur c e M a n a ge m e n t
© E CO LO G ICA L A U S T RA L IA P T Y LT D 90
System Application Reference
A combination of UAV and a ground
wireless sensor network.
Crop fertilizing missions. The UAS
route is modified depending on the
inputs from the ground network,
which detects the amount of fertiliser
applied on the ground.
Costa et al. (2012)
Small fixed-wing UAS carrying photo-
or video-cameras are
Used in missions in Switzerland, the
Netherlands, Indonesia, Malaysia
and Nepal, to perform detection of
several species such as orangutans,
elephants or rhinos and provide
information on density and circulation
of animals.
Wich and Koh (2012)
Fixed wing UAV with high resolution
imagery - no detail on remote sensing
system employed.
Bird counts in a common gull colony.
Resolution: 1.5cm. Grenzdörffer (2013)
Rotary-wing platform carrying a
commercial digital reflex camera to
generate a DEM for hydrodynamics
numerical modelling
Coastal management application,
related to the quantification of
morpho-sedimentary changes of the
coastal fringe
Delacourt et al.
(2009),
High-resolution 3-axis magnetic
sensor, mounted on an autonomous
Scout B1-100 helicopter
To generate detailed magnetic maps
and identify various ferrous objects in
the soil.
Eck and Imbach
(2011)
Low power, lightweight (1-2kg) laser
based sensor for trace gas species.
Battery operated.
Attached to T-Rex Align 700E robotic
helicopter
The sensors were developed to
measure greenhouse gas
concentrations (CO2, water vapour
and methane). 1% precision in
measurement for all three gases.
Khan et al (2012)
Remote Methane Leak Detection laser
on UAV. Battery powered. The
underlying technology is near-infrared
Standoff Tunable Diode Laser
Absorption Spectroscopy (STDLAS)
Laser detection of methane leaks.
Scanning soil surface from above
enables mapping methane
concentration contours and locate
hot spots. Can detect leaks as low as
1.0m3/hr
Frish (2012); Frish et
al. (no date)

Re v i e w of R em o t e S e n s i n g A p pl i c a t i o n s f or N a t ur a l R es o ur c e M a n a ge m e n t
© E CO LO G ICA L A U S T RA L IA P T Y LT D 91
System Application Reference
Other hazardous gas detection via
STDLAS mounted on UAV.
Gas leak detection of gases such as
HF, H2S, NH3, H2O, HCl using near-
infrared wavelengths. Can be used
for inspecting CSG facilities,
chemical production or containment
facilities, illicit drug factors or
surveying for hazardous gases prior
to human entry.
Frish et al. (no date)
Cox et al. (2006) further describes missions undertaken by NASA since 1995. Applications include clear
air radiation measurements, cumulus electrification, harvest optimisation, coastal mapping and
atmospheric chemistry, amongst many others. Whitehead et al. (2014) also describes several recent
case studies. Examples of recently developed UAVs are given below.
Riegl RiCOPTER UAV
Riegl is a company specialising in laser scanning. They have recently released the RiCOPTER UAV,
which is a remotely piloted airborne laser scanning octo-copter equipped with a survey grade VUX-1
LiDAR sensor (Figure 19). The VUX-1 provides 500,000 measurements/sec and is accurate to up to
10mm, depending on height. The RiCOPTER also includes:
Inertial Measurement Unit (IMU)/ Global Navigation Satellite System unit with antenna
Up to 4 optional cameras providing 330deg Field of View
Maximum operating altitude of 550m
Maximum flight time of 30 minutes.
Max. take off mass of up to 25kg with a max payload of 16kg
Figure 19 3D LiDAR vegetation height data from the Riegl RiCOPTER for a corridor study (from Riegl, 2014b)

Re v i e w of R em o t e S e n s i n g A p pl i c a t i o n s f or N a t ur a l R es o ur c e M a n a ge m e n t
© E CO LO G ICA L A U S T RA L IA P T Y LT D 92
C-ASTRAL BRAMOR rTK UAV
The BRAMOR rTK is a UAV produced by C-Astral, an aerospace company based on Slovenia (Figure
20). It carries a system that includes 24.3 Megapixel colour, infrared, NDVI, hyperspectral, multispectral
or GAS Spectronometer sensor. Accuracy is sub-cm at 70m AGL.
It also includes a high rate GPS and IMU precision data-logging electronics. The whole system fits into
two transport cases or a single backpack to enable field use. The UAV has a maximum flight time of 2.5
hours and has a 30km datalink range.
Figure 20: the BRAMOR rTK and launch system
UAV Regulation
The Civil Aviation Safety Authority (CASA) regulates the use of UAVs. CASA is currently reviewing Civil
Aviation Safety Regulations for UAVs and a complete re-write of regulations is expected by 2016.
The current regulations were developed in 2002. In general, there are requirements for:
UAVs to operate in accordance with rules governing flights of manned aircraft in controlled
airspace
Operating Area Approval from CASA for operations in designated airspace areas
Restrictions of use over populous areas as per conditions stated within specific CASA approval
Operator certification and training
Approval of aircraft for airworthiness.
Equipment requirements
At the moment any machine used for commercial purposes required a licenced operator.

Re v i e w of R em o t e S e n s i n g A p pl i c a t i o n s f or N a t ur a l R es o ur c e M a n a ge m e n t
© E CO LO G ICA L A U S T RA L IA P T Y LT D 93
HEAD OFFICE
Suite 4, Level 1
2-4 Merton Street
Sutherland NSW 2232
T 02 8536 8600
F 02 9542 5622
SYDNEY
Level 6
299 Sussex Street
Sydney NSW 2000
T 02 8536 8650
F 02 9264 0717
ST GEORGES BASIN
8/128 Island Point Road
St Georges Basin NSW 2540
T 02 4443 5555
F 02 4443 6655
CANBERRA
Level 2
11 London Circuit
Canberra ACT 2601
T 02 6103 0145
F 02 6103 0148
NEWCASTLE
Suites 28 & 29, Level 7
19 Bolton Street
Newcastle NSW 2300
T 02 4910 0125
F 02 4910 0126
NAROOMA
5/20 Canty Street
Narooma NSW 2546
T 02 4476 1151
F 02 4476 1161
COFFS HARBOUR
35 Orlando Street
Coffs Harbour Jetty NSW 2450
T 02 6651 5484
F 02 6651 6890
ARMIDALE
92 Taylor Street
Armidale NSW 2350
T 02 8081 2681
F 02 6772 1279
MUDGEE
Unit 1, Level 1
79 Market Street
Mudgee NSW 2850
T 02 4302 1230
F 02 6372 9230
PERTH
Suite 1 & 2
49 Ord Street
West Perth WA 6005
T 08 9227 1070
F 08 9322 1358
WOLLONGONG
Suite 204, Level 2
62 Moore Street
Austinmer NSW 2515
T 02 4201 2200
F 02 4268 4361
GOSFORD
Suite 5, Baker One
1-5 Baker Street
Gosford NSW 2250
T 02 4302 1220
F 02 4322 2897
DARWIN
16/56 Marina Boulevard
Cullen Bay NT 0820
T 08 8989 5601
F 08 8941 1220
BRISBANE
Suite 1 Level 3
471 Adelaide Street
Brisbane QLD 4000 T 07 3503 7191 F 07 3854 0310
1300 646 131 www.ecoaus.com.au


![[REMOTE SENSING] 3-PM Remote Sensing](https://img.pdfslide.us/doc/110x75/61f2bbb282fa78206228d9e2/remote-sensing-3-pm-remote-sensing.jpg)