Embed Size (px)
Citation preview
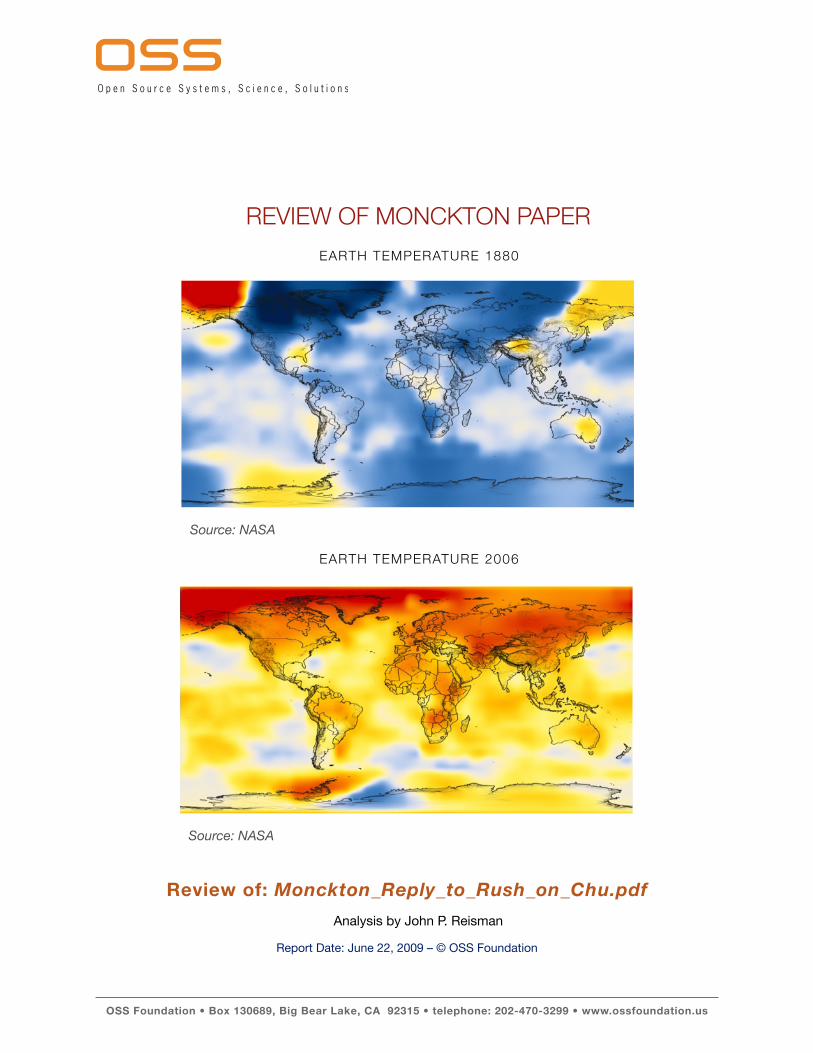
REVIEW OF MONCKTON PAPER
EARTH TEMPERATURE 1880
Source: NASA
EARTH TEMPERATURE 2006
Source: NASA
Review of: Monckton_Reply_to_Rush_on_Chu.pdf
Analysis by John P. Reisman
Report Date: June 22, 2009 – © OSS Foundation
OSS Foundation • Box 130689, Big Bear Lake, CA 92315 • telephone: 202-470-3299 • www.ossfoundation.us
Notes:
The bibliography is omitted in leu of footnotes, including web links. The links provided go to summary
web pages that are sufficiently linked to origination sources including NASA, NOAA, NSIDC, NCDC,
ReaClimate.org, etc., and these sources via the OSS Foundation web site, which link to a multitude of
government and university data sources.
The paper is presented on the Science and Public Policy web site1 as an answer to a question by Rush
Limbaugh.
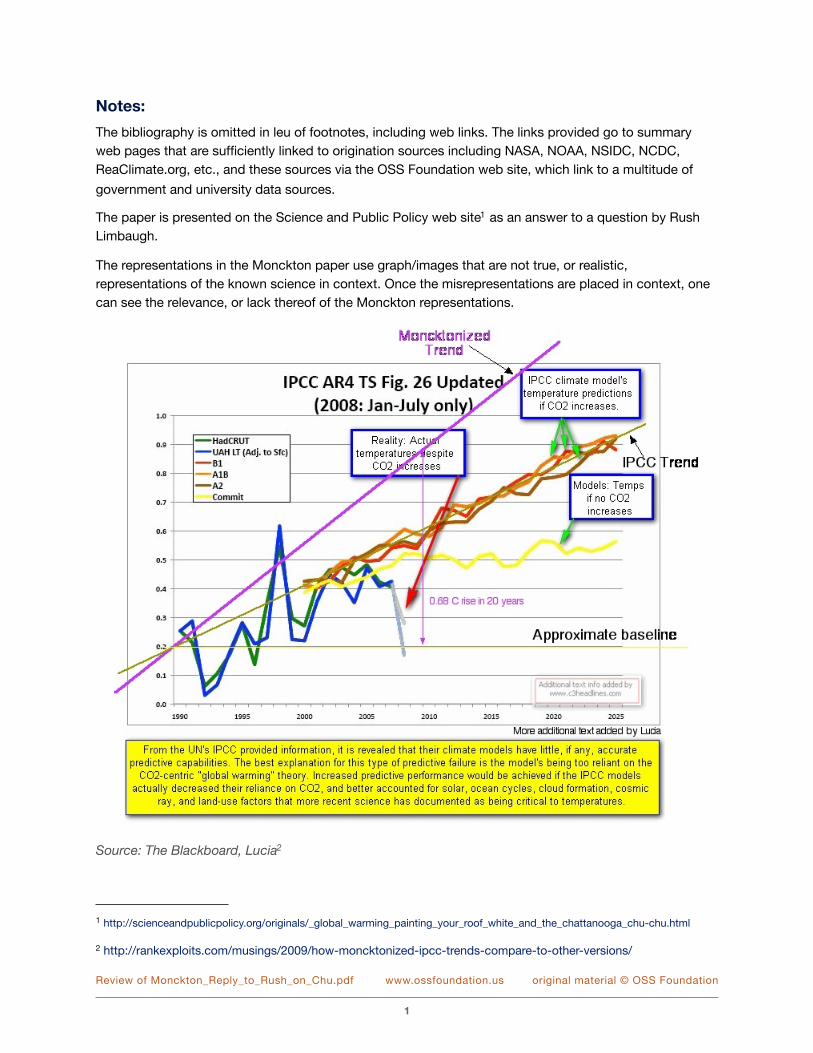
The representations in the Monckton paper use graph/images that are not true, or realistic,
representations of the known science in context. Once the misrepresentations are placed in context, one
can see the relevance, or lack thereof of the Monckton representations.
Source: The Blackboard, Lucia2
Review of Monckton_Reply_to_Rush_on_Chu.pdf www.ossfoundation.us! original material © OSS Foundation
1
1 http://scienceandpublicpolicy.org/originals/_global_warming_painting_your_roof_white_and_the_chattanooga_chu-chu.html
2 http://rankexploits.com/musings/2009/how-moncktonized-ipcc-trends-compare-to-other-versions/
TABLE OF CONTENTS
Introduction! 3
________________________________________General analysis of “Monckton_Reply_to_Rush_on_Chu.pdf”! 3
Science vs. Rhetoric! 5
____________________________‘Global warming’, painting your roof white, and the Chattanooga Chu-Chu! 5
Review of “His Lordship’s elegant answer” as follows! 6
_________________________________________________________The sexual life of heteroatomic molecules ! 6
______________________________________________________________________________Enter the Chu-Chu! 6
Economics! 7
_____________________________________________________________The junkonomics of "global warming"! 7
Manipulating and falsifying the data! 8
____________________________________________What the media aren't telling you about the ‘real climate’! 8
Oceans: Temperatures/Weather vs. Climate! 10
_______________________________________________________Five years’ ocean cooling: UN wrong again ! 10
Oceans: Three Scenarios of Global Behavior and Consequences! 11
____________________________________________Dr. Jeremy Jackson, Scripps Institute of Oceanography! 11
Ocean Acidification! 12
_______________________________________________________________________The Coca Cola argument! 12
Sea Level! 13
____________________________________________________Sea level has stopped rising: UN wrong again ! 13
____________________________________________________Jim Hansen - 246 feet of Sea Level Rise (SLR) ! 14
_________________________________________________________Al Gore - 20 feet of Sea Level Rise (SLR) ! 14
Cryosphere - Arctic Sea Ice! 15
_______________________________________________________Arctic sea-ice extent: an 8 year record high ! 15
Cryosphere - Antarctica! 16
_______________________________________________________Antarctic sea-ice: third greatest in 30 years ! 16
________________________________________________________Global sea-ice extent: a regular heartbeat! 17
Cryosphere - Greenland! 18
____________________________“Greenland ice sheet actually grew by 2 inches per year from 1993-2003”! 18
Hurricanes! 19
_______________________________________________________Hurricane activity is at a 30-year record low! 19
Carbon Dioxide! 21
____________________________________________________CO2 concentration well below UN predictions ! 21
Summary ! 22
_____________________________________The bottom line: "It's not about climatology, it's about freedom"! 22
Appendix! 23
_______________________________________________Synthesis Report - Copenhagen 2009, 10-12 March ! 23
_____________________________Leading edge assessment of projections if no significant action is taken.! 24
Review of Monckton_Reply_to_Rush_on_Chu.pdf www.ossfoundation.us! original material © OSS Foundation
2
INTRODUCTION
General analysis of “Monckton_Reply_to_Rush_on_Chu.pdf”
The following report examines a paper presented as a
reply to a question posed by Rush Limbaugh. The paper
is attributed to be written by Lord Monckton of
Brenchley.
http://scienceandpublicpolicy.org/press/
sppi_report_monckton_answers_rush_limbaugh_on_global_warming.html
http://scienceandpublicpolicy.org/originals/
_global_warming_painting_your_roof_white_and_the_chattanooga_chu-chu.html
While our report is not fully vetted, it examines the general lack of relevant science
presented by the paper examined. This report does show stark differences between
what are apparently fake graphs, but also facts presented out of context by
Monckton.
In general, the overall report is a red herring. Monckton seems to be representing his
opinions, and the fake graphs as science. The language Monckton uses in the paper
is generally unprofessional in nature and extremely misleading to the unaware
reader.
While Monckton does reference a modicum of science, the majority of the report is
awash in unsound reasoning.
It is assumed that the reasoning for using at least a tiny bit of science, before
Monckton launches into a series of disinformation opinions, is apparently to
establish the credibility of the paper as a science document in the eyes of those that
do not understand the material fully enough to make an informed decision. This
could be considered naive, or fraudulent. In this, Monckton fails utterly, but this
would only be evident to those that understand the science more fully.
Monckton carries the reader through a series of cherry picked data references, non
sequitur, straw man, and red herring arguments, that have little to no scientific basis.
Review of Monckton_Reply_to_Rush_on_Chu.pdf www.ossfoundation.us! original material © OSS Foundation
3
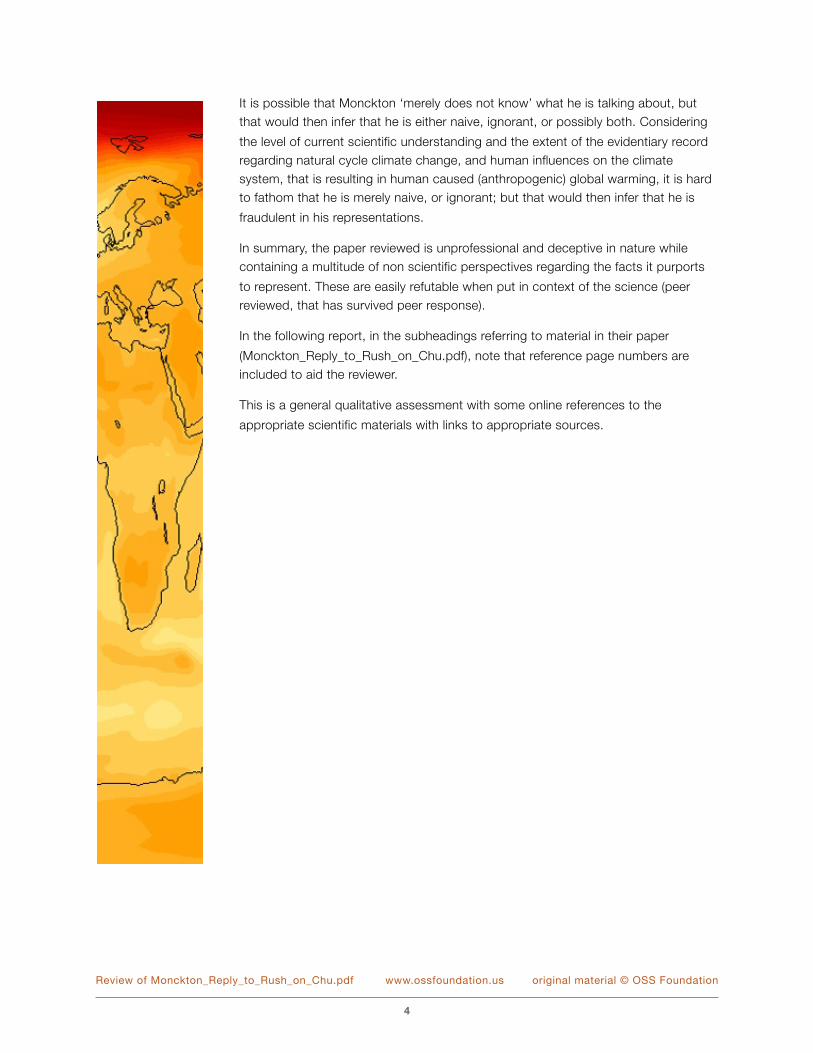
It is possible that Monckton ‘merely does not know’ what he is talking about, but
that would then infer that he is either naive, ignorant, or possibly both. Considering
the level of current scientific understanding and the extent of the evidentiary record
regarding natural cycle climate change, and human influences on the climate
system, that is resulting in human caused (anthropogenic) global warming, it is hard
to fathom that he is merely naive, or ignorant; but that would then infer that he is
fraudulent in his representations.
In summary, the paper reviewed is unprofessional and deceptive in nature while
containing a multitude of non scientific perspectives regarding the facts it purports
to represent. These are easily refutable when put in context of the science (peer
reviewed, that has survived peer response).
In the following report, in the subheadings referring to material in their paper
(Monckton_Reply_to_Rush_on_Chu.pdf), note that reference page numbers are
included to aid the reviewer.
This is a general qualitative assessment with some online references to the
appropriate scientific materials with links to appropriate sources.
Review of Monckton_Reply_to_Rush_on_Chu.pdf www.ossfoundation.us! original material © OSS Foundation
4
SCIENCE VS. RHETORIC
‘Global warming’, painting your roof white, and the Chattanooga Chu-Chu
(“Monckton_Reply_to_Rush_on_Chu.pdf” page 2)
The paper “Monckton_Reply_to_Rush_on_Chu.pdf” begins by stating:
“A science-based answer by The Viscount Monckton of Brenchley to a
science-based question from Rush Limbaugh”
Stating it is science based is of course incorrect. Science requires the process of peer review and peer
response. The Monckton paper is a series of cherry picked data series, facts out of context, red herrings
and non sequitur opinion items, which he seems to be attempting to peddle as science.
The paper and perspectives presented, in its entirety (considered holistically), would have a very slim
chance (virtually zero) of making it into any peer reviewed publication, and no chance of surviving peer
response. Science is not something you just make up based on your opinion.
The paper is an emotional appeal to ‘living the good life’ and essentially is written so as to prove global
warming is a hoax based on the idea that it’s too expensive to fix; and that any such expense would be
an inconvenience; therefore global warming is not real. This of course is a non sequitur. The paper is best
described as absurd.
Burying ones head in the sand actually does not remove the threat, no matter how neurotic one chooses
to be.
Review of Monckton_Reply_to_Rush_on_Chu.pdf www.ossfoundation.us! original material © OSS Foundation
5
REVIEW OF “HIS LORDSHIP’S ELEGANT ANSWER”
AS FOLLOWS(“Monckton_Reply_to_Rush_on_Chu.pdf” page 2)
The sexual life of heteroatomic molecules
(“Monckton_Reply_to_Rush_on_Chu.pdf” page 3)
Here is where Monckton builds the straw man: There is ‘some’ science here, but it is presented in a
somewhat obtuse manner. It also seems to be the cornerstone of his straw man argument, that he can
later use to tear down the argument regarding white roofs, etc., which is an argument he is using out of
context in the first place.
Monckton uses facts out of context though, which as we see throughout the document is pro forma. This
is a red herring to distract the reader.
Enter the Chu-Chu
(“Monckton_Reply_to_Rush_on_Chu.pdf” page 4)
The whole argument is a red herring to distract. The best reason you would paint a roof white is to reduce
energy consumption (air conditioning), not to reduce global warming effect. This of course saves people
money on energy consumption.
Dark surfaces absorb heat, white surfaces are reflective. In other words, it takes a lot more energy to cool
a building that has a black roof (one that absorbs more heat) than a white roof (one that absorbs less
heat).
Less energy used means less energy needed and generally less atmospheric CO2 contribution. These to
effects combined equate to energy security and at least a contribution to environmental security.
It may prove that white asphalt lasts longer and is therefore less expensive (white asphalt would likely be
less subject to thermal expansion due to reflective quality). That may also reduce expense by extending
the useful lifetime of the roads, but that would have to be studied.
Review of Monckton_Reply_to_Rush_on_Chu.pdf www.ossfoundation.us! original material © OSS Foundation
6
ECONOMICS
The junkonomics of "global warming"
(“Monckton_Reply_to_Rush_on_Chu.pdf” page 6)
Here Monckton burns down the straw-man he built earlier by illustrating how much paint you need, and
how much the paint costs.
Then he attacks Waxman/Markey, which they are using as another straw-man to tear down.
It would take some research to attack the numbers they are using but you don't need to. The numbers are
not important to understanding the main fallacy of the argument, which is its premise, ‘the cost of the
white paint’.
There are of course numerous obvious errors due to the use of ‘facts out of context’ and creative
argument constructions (misinformation or lies).
The primary response to this Monckton argument is ‘the cost of doing nothing’, which is largely ignored in
his argument (requires contexts)."
[The economics of resource availability/scarcity and distribution with energy mix capacity will
be the determining factor that exacerbates human migration issues that will impact political
borders and governmental capacity to cope economically with the rapidly increasing cost of
dealing with the problem. That needs to be tied also to the exponential component of the
inflation rate. But that also needs to be calculated with the artificial inflation components
within the existing economic system (this is a separate subject but connected to human sys-
tem adaptive ability).]
Sea level rise will not be the first problem, economics will be the first problem.
The cost of food and lack of water will seriously challenge the worlds population, especially in third world
regions or areas where corruption is prone, or systemic in nature (one could argue this is endemic as a
problem in all systems).
It is generally assumed that the combination of latitudinal shift exacerbating resource scarcity issues
combined with internal national security and stability issues, will possibly cause more starvation issues
than might otherwise occur (depending on national security capacity and stability of governments).
However this is a problem in stages. As the latitudinal shift proceeds, the problem is expected to degrade
further into resource scarcity issues.
The economics of resource scarcity, if unaddressed in a meaningful manner, is expected to be evident
long before sea level rise becomes a more major issue.
Review of Monckton_Reply_to_Rush_on_Chu.pdf www.ossfoundation.us! original material © OSS Foundation
7
MANIPULATING AND FALSIFYING THE DATA
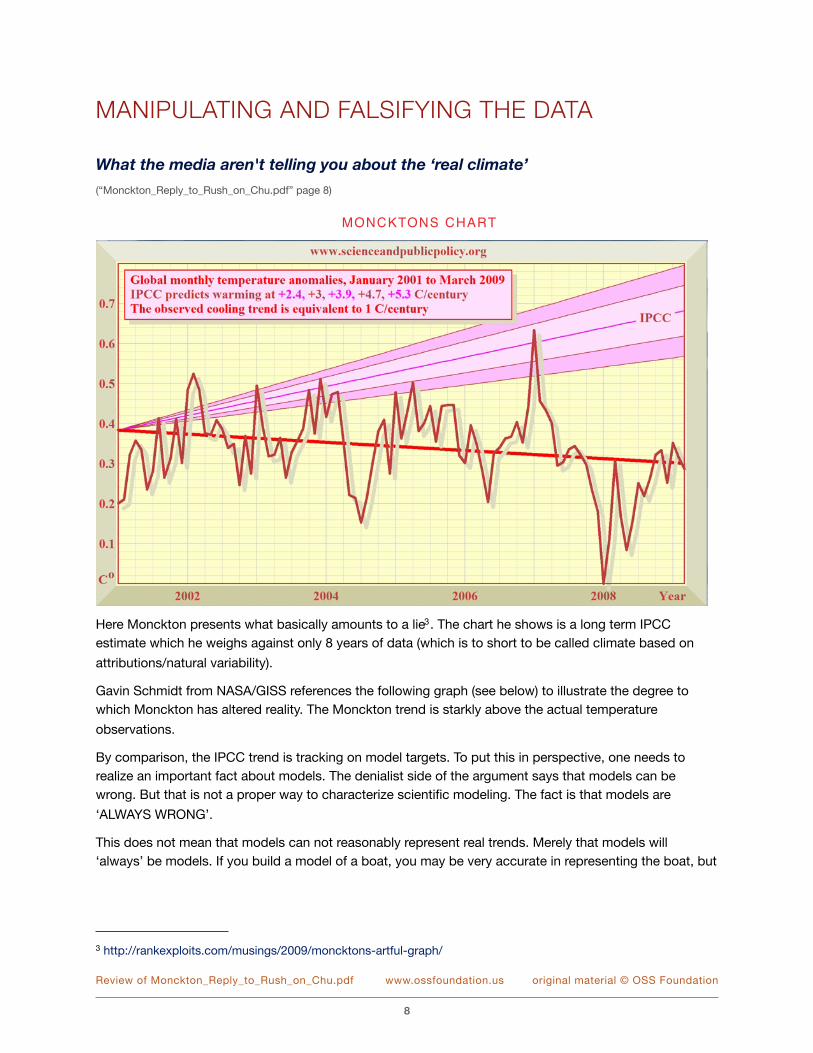
What the media aren't telling you about the ‘real climate’
(“Monckton_Reply_to_Rush_on_Chu.pdf” page 8)
MONCKTONS CHART
Here Monckton presents what basically amounts to a lie3. The chart he shows is a long term IPCC
estimate which he weighs against only 8 years of data (which is to short to be called climate based on
attributions/natural variability).
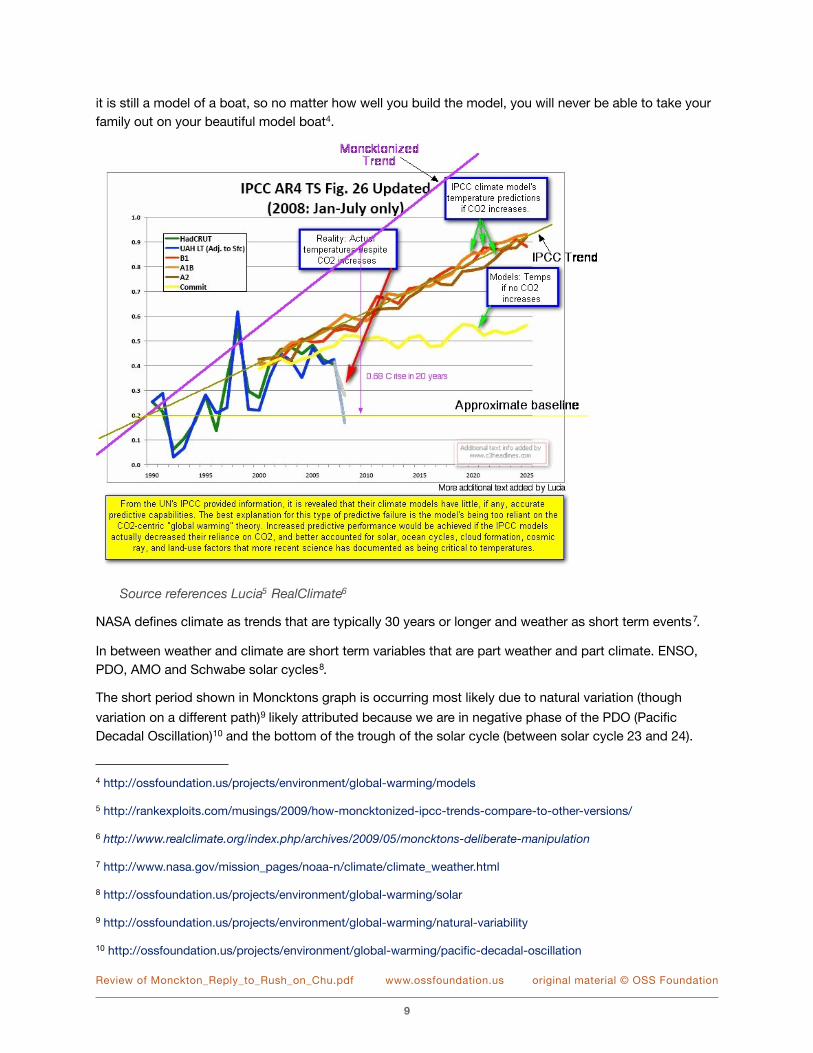
Gavin Schmidt from NASA/GISS references the following graph (see below) to illustrate the degree to
which Monckton has altered reality. The Monckton trend is starkly above the actual temperature
observations.
By comparison, the IPCC trend is tracking on model targets. To put this in perspective, one needs to
realize an important fact about models. The denialist side of the argument says that models can be
wrong. But that is not a proper way to characterize scientific modeling. The fact is that models are
‘ALWAYS WRONG’.
This does not mean that models can not reasonably represent real trends. Merely that models will
‘always’ be models. If you build a model of a boat, you may be very accurate in representing the boat, but
Review of Monckton_Reply_to_Rush_on_Chu.pdf www.ossfoundation.us! original material © OSS Foundation
8
3 http://rankexploits.com/musings/2009/moncktons-artful-graph/
it is still a model of a boat, so no matter how well you build the model, you will never be able to take your
family out on your beautiful model boat4.
Source references Lucia5 RealClimate6
NASA defines climate as trends that are typically 30 years or longer and weather as short term events7."
In between weather and climate are short term variables that are part weather and part climate. ENSO,
PDO, AMO and Schwabe solar cycles8.
The short period shown in Moncktons graph is occurring most likely due to natural variation"(though
variation on a different path)9 likely attributed because we are in negative phase of the PDO (Pacific
Decadal Oscillation)10 and the bottom of the trough of the solar cycle (between solar cycle 23 and 24).
Review of Monckton_Reply_to_Rush_on_Chu.pdf www.ossfoundation.us! original material © OSS Foundation
9
4 http://ossfoundation.us/projects/environment/global-warming/models
5 http://rankexploits.com/musings/2009/how-moncktonized-ipcc-trends-compare-to-other-versions/
6 http://www.realclimate.org/index.php/archives/2009/05/moncktons-deliberate-manipulation
7 http://www.nasa.gov/mission_pages/noaa-n/climate/climate_weather.html
8 http://ossfoundation.us/projects/environment/global-warming/solar
9 http://ossfoundation.us/projects/environment/global-warming/natural-variability
10 http://ossfoundation.us/projects/environment/global-warming/pacific-decadal-oscillation
OCEANS: TEMPERATURES/WEATHER VS. CLIMATE
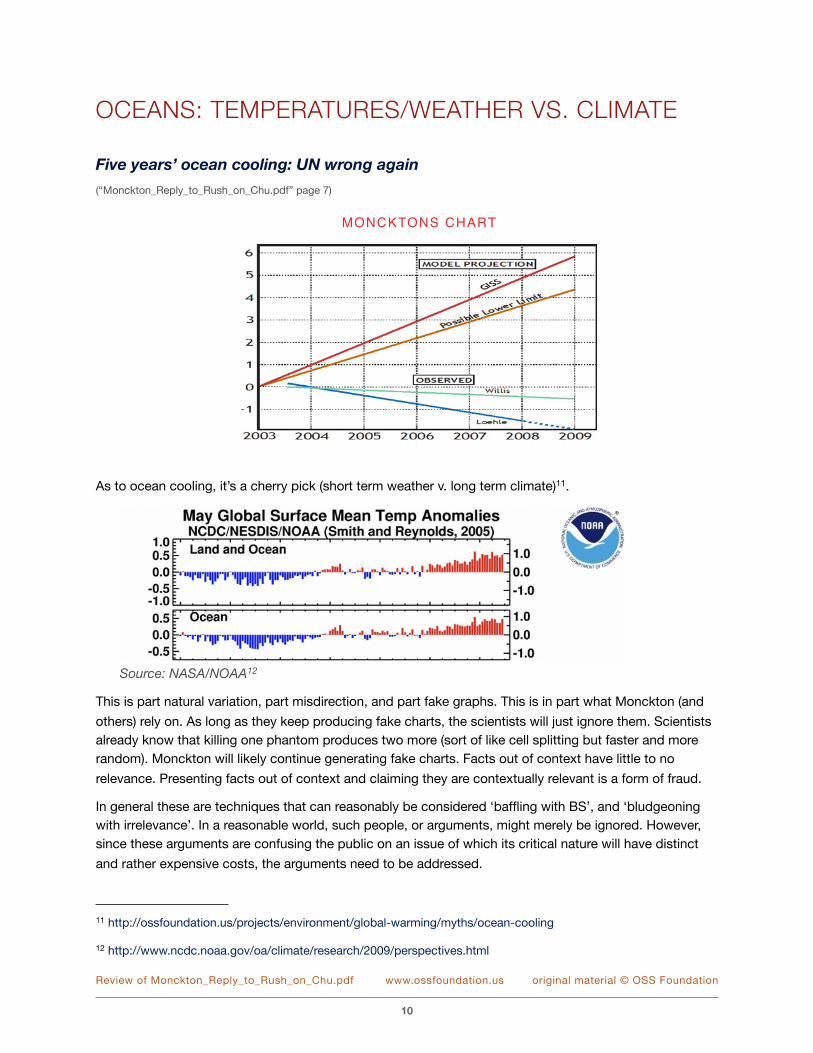
Five years’ ocean cooling: UN wrong again
(“Monckton_Reply_to_Rush_on_Chu.pdf” page 7)
MONCKTONS CHART
As to ocean cooling, it’s a cherry pick (short term weather v. long term climate)11.
Source: NASA/NOAA12
This is part natural variation, part misdirection, and part fake graphs. This is in part what Monckton (and
others) rely on. As long as they keep producing fake charts, the scientists will just ignore them. Scientists
already know that killing one phantom produces two more (sort of like cell splitting but faster and more
random). Monckton will likely continue generating fake charts. Facts out of context have little to no
relevance. Presenting facts out of context and claiming they are contextually relevant is a form of fraud.
In general these are techniques that can reasonably be considered ‘baffling with BS’, and ‘bludgeoning
with irrelevance’. In a reasonable world, such people, or arguments, might merely be ignored. However,
since these arguments are confusing the public on an issue of which its critical nature will have distinct
and rather expensive costs, the arguments need to be addressed.
Review of Monckton_Reply_to_Rush_on_Chu.pdf www.ossfoundation.us! original material © OSS Foundation
10
11 http://ossfoundation.us/projects/environment/global-warming/myths/ocean-cooling
12 http://www.ncdc.noaa.gov/oa/climate/research/2009/perspectives.html
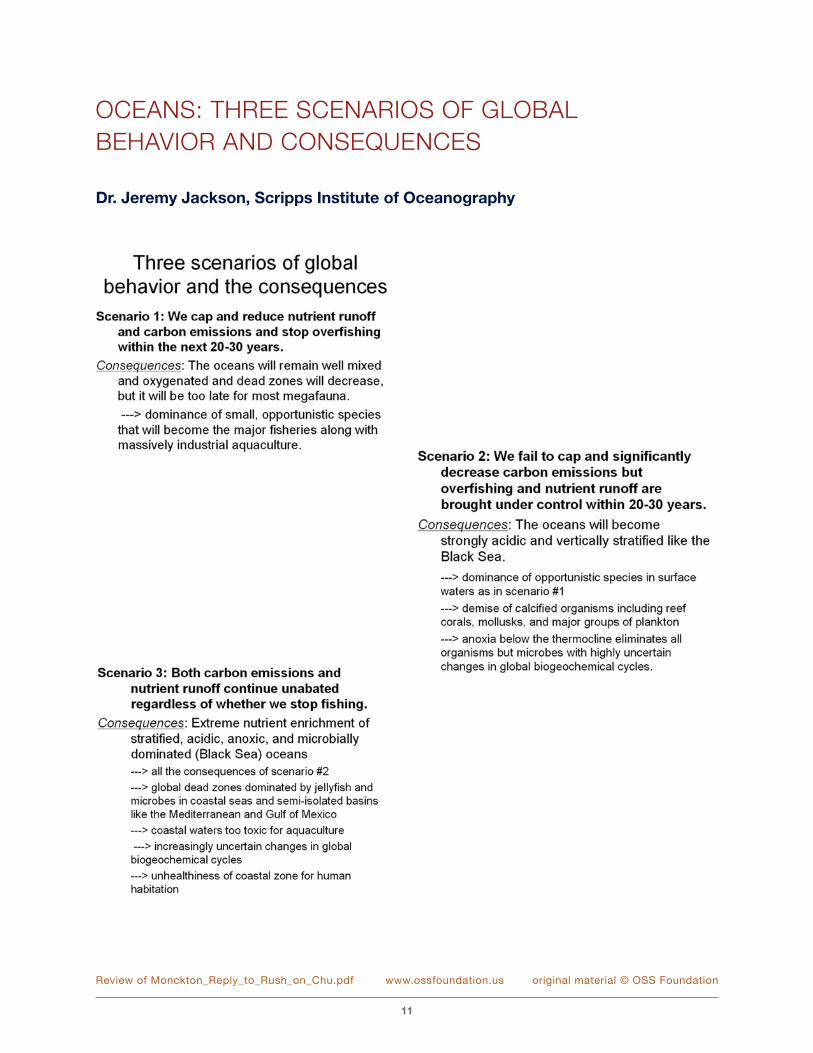
OCEANS: THREE SCENARIOS OF GLOBAL
BEHAVIOR AND CONSEQUENCES
Dr. Jeremy Jackson, Scripps Institute of Oceanography
Review of Monckton_Reply_to_Rush_on_Chu.pdf www.ossfoundation.us! original material © OSS Foundation
11
OCEAN ACIDIFICATION(“Monckton_Reply_to_Rush_on_Chu.pdf” page 9)
Ocean acidification is a major problem but it is thrown out there as if the scientists are just trying to sound
scary. Ocean acidification is not the only problem in our ocean though. The situation is quite serious as
described in the 3 scenarios (see above) from Dr. Jeremy Jackson Scripps Institute of Oceanography.
If you wish to understand what is happening in the oceans the video presented by Arthur M. Sackler
Colloquia, National Academy of Sciences of a presentation by Dr. Jeremy Jackson will help (link below13).
This is a must see video if you wish to understand the degree of the situation in the ocean (44:03
minutes). The argument that ‘global warming’ is missing ‘global warming’ is silly. If only we could get the
Arctic to cooperate with the cooling theory? With Arctic ice, it's not about ice extent, it's about loss of
multiyear ice14.
The Coca Cola argument
(“Monckton_Reply_to_Rush_on_Chu.pdf” page 10)
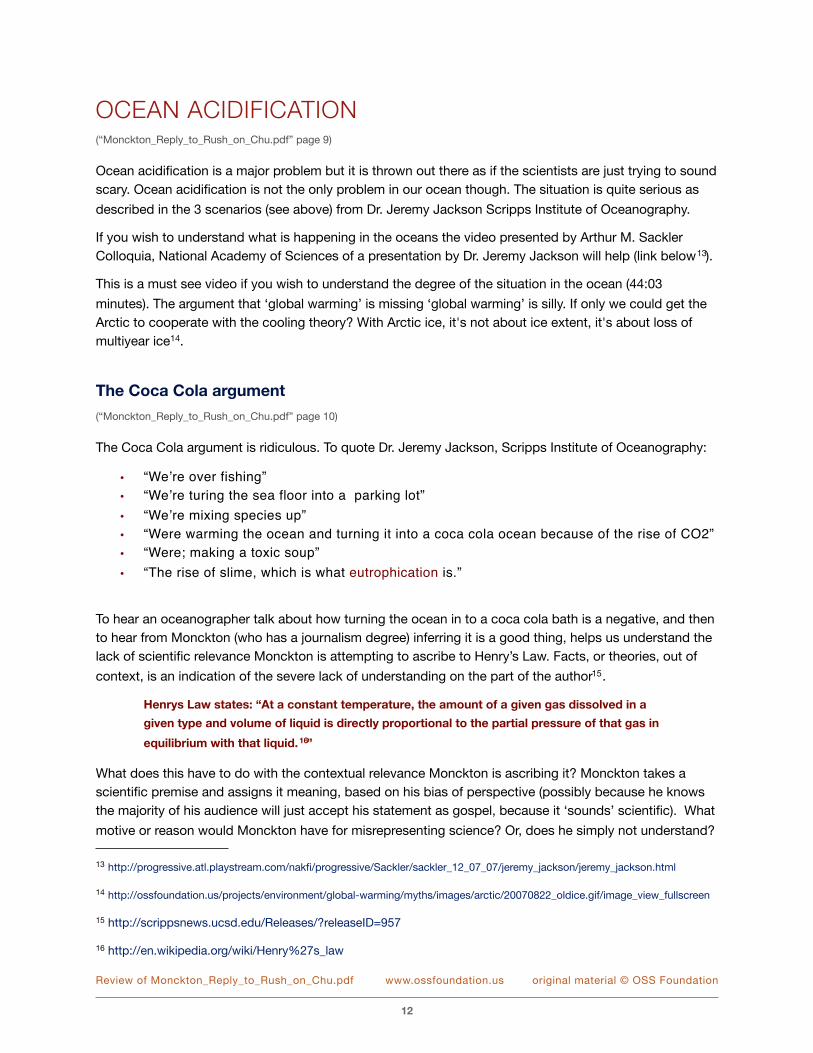
The Coca Cola argument is ridiculous. To quote Dr. Jeremy Jackson, Scripps Institute of Oceanography:
• “We!re over fishing”
• “We!re turing the sea floor into a parking lot”
• “We!re mixing species up”
• “Were warming the ocean and turning it into a coca cola ocean because of the rise of CO2”
• “Were; making a toxic soup”
• “The rise of slime, which is what eutrophication is.”
To hear an oceanographer talk about how turning the ocean in to a coca cola bath is a negative, and then
to hear from Monckton (who has a journalism degree) inferring it is a good thing, helps us understand the
lack of scientific relevance Monckton is attempting to ascribe to Henry’s Law. Facts, or theories, out of
context, is an indication of the severe lack of understanding on the part of the author15.
Henrys Law states: “At a constant temperature, the amount of a given gas dissolved in a
given type and volume of liquid is directly proportional to the partial pressure of that gas in
equilibrium with that liquid.16”
What does this have to do with the contextual relevance Monckton is ascribing it? Monckton takes a
scientific premise and assigns it meaning, based on his bias of perspective (possibly because he knows
the majority of his audience will just accept his statement as gospel, because it ‘sounds’ scientific). What
motive or reason would Monckton have for misrepresenting science? Or, does he simply not understand?
Review of Monckton_Reply_to_Rush_on_Chu.pdf www.ossfoundation.us! original material © OSS Foundation
12
13 http://progressive.atl.playstream.com/nakfi/progressive/Sackler/sackler_12_07_07/jeremy_jackson/jeremy_jackson.html
14 http://ossfoundation.us/projects/environment/global-warming/myths/images/arctic/20070822_oldice.gif/image_view_fullscreen
15 http://scrippsnews.ucsd.edu/Releases/?releaseID=957
16 http://en.wikipedia.org/wiki/Henry%27s_law
SEA LEVEL
Sea level has stopped rising: UN wrong again
(“Monckton_Reply_to_Rush_on_Chu.pdf” page 10)
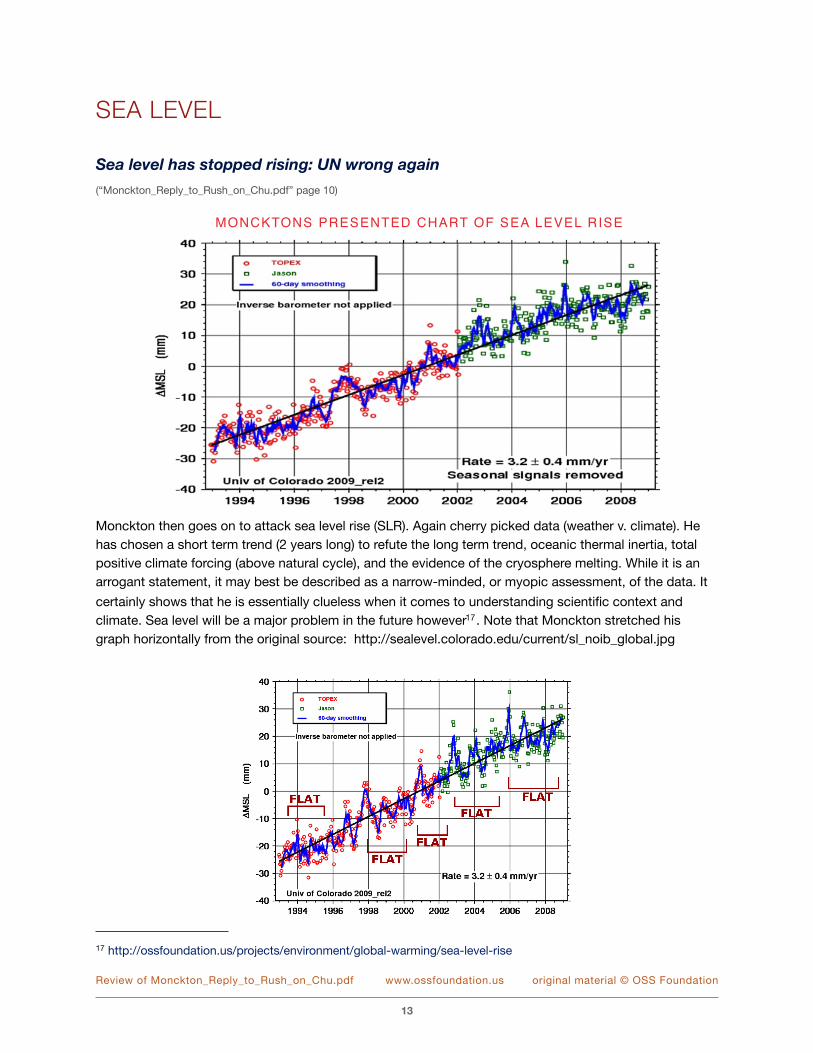
MONCKTONS PRESENTED CHART OF SEA LEVEL RISE
Monckton then goes on to attack sea level rise (SLR). Again cherry picked data (weather v. climate). He
has chosen a short term trend (2 years long) to refute the long term trend, oceanic thermal inertia, total
positive climate forcing (above natural cycle), and the evidence of the cryosphere melting. While it is an
arrogant statement, it may best be described as a narrow-minded, or myopic assessment, of the data. It
certainly shows that he is essentially clueless when it comes to understanding scientific context and
climate. Sea level will be a major problem in the future however17. Note that Monckton stretched his
graph horizontally from the original source: http://sealevel.colorado.edu/current/sl_noib_global.jpg
Review of Monckton_Reply_to_Rush_on_Chu.pdf www.ossfoundation.us! original material © OSS Foundation
13
17 http://ossfoundation.us/projects/environment/global-warming/sea-level-rise
Jim Hansen - 246 feet of Sea Level Rise (SLR)
I don't know anywhere James Hansen has ‘predicted’ 246 feet of sea level rise. Most likely a fact taken
out of context. May have been a question like, ‘if Greenland and Antarctica melted completely’ how much
would sea level rise? The answer would be either approximately 75 meters (246 feet), or specifically 79.6
meters (based on ice volume estimations with uncertainties regarding coverage area which would reduce
the volumetric (thus 75 meters is a good estimate); though this does not fully address thermal
expansion18).
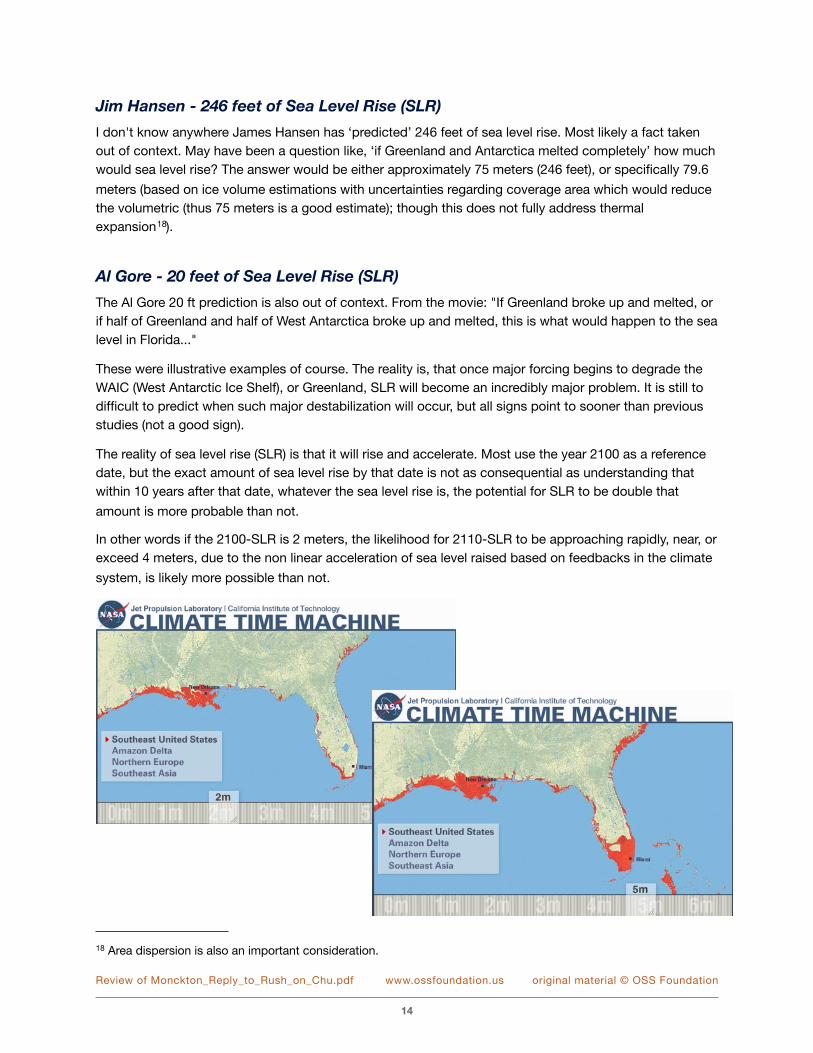
Al Gore - 20 feet of Sea Level Rise (SLR)
The Al Gore 20 ft prediction is also out of context. From the movie: "If Greenland broke up and"melted,"or
if half of Greenland and half of West Antarctica broke up and melted, this is what would happen to the sea
level in Florida..."
These were illustrative examples of course. The reality is, that once major forcing begins to degrade the
WAIC (West Antarctic Ice Shelf), or Greenland, SLR will become an incredibly major problem. It is still to
difficult to predict when such major destabilization will occur, but all signs point to sooner than previous
studies (not a good sign).
The reality of sea level rise (SLR) is that it will rise and accelerate. Most use the year 2100 as a reference
date, but the exact amount of sea level rise by that date is not as consequential as understanding that
within 10 years after that date, whatever the sea level rise is, the potential for SLR to be double that
amount is more probable than not.
In other words if the 2100-SLR is 2 meters, the likelihood for 2110-SLR to be approaching rapidly, near, or
exceed 4 meters, due to the non linear acceleration of sea level raised based on feedbacks in the climate
system, is likely more possible than not.
Review of Monckton_Reply_to_Rush_on_Chu.pdf www.ossfoundation.us! original material © OSS Foundation
14
18 Area dispersion is also an important consideration.
CRYOSPHERE - ARCTIC SEA ICE
Arctic sea-ice extent: an 8 year record high
(“Monckton_Reply_to_Rush_on_Chu.pdf” page 11)
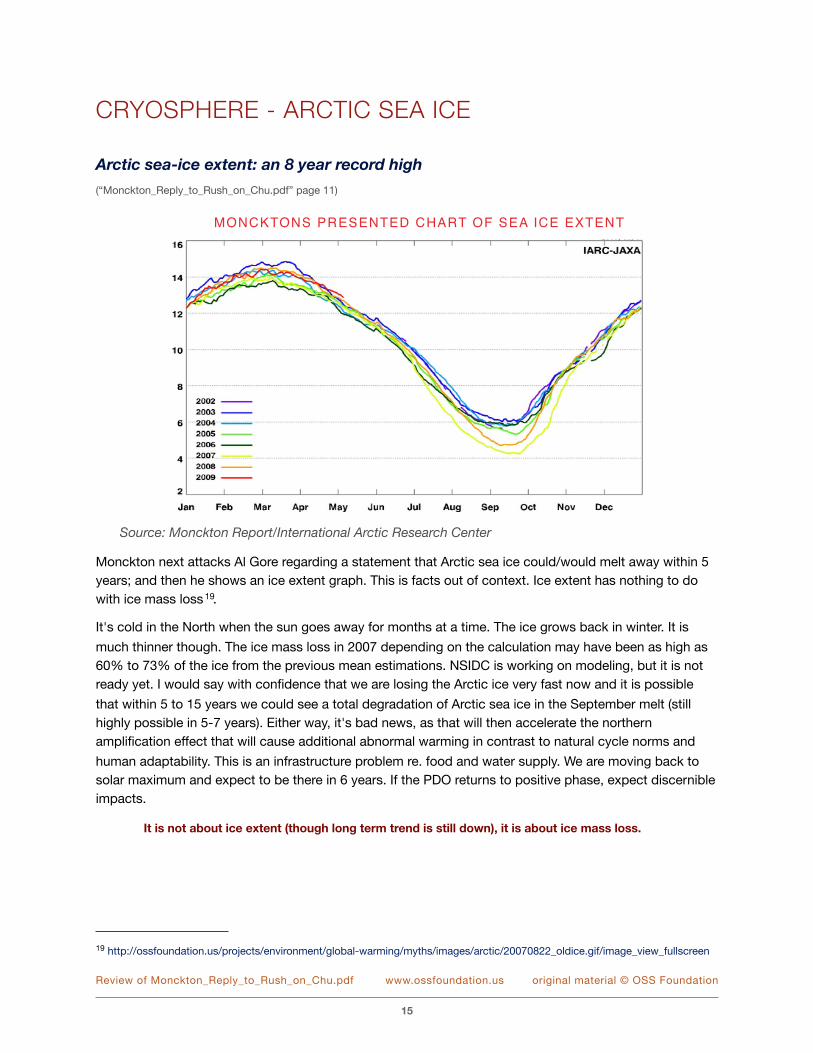
MONCKTONS PRESENTED CHART OF SEA ICE EXTENT
Source: Monckton Report/International Arctic Research Center
Monckton next attacks Al Gore regarding a statement that Arctic sea ice could/would melt away within 5
years; and then he shows an ice extent graph. This is facts out of context. Ice extent has nothing to do
with ice mass loss19."
It's cold in the North when the sun goes away for months at a time. The ice grows back in winter. It is
much thinner though. The ice mass loss in 2007 depending on the calculation may have been as high as
60% to 73% of the ice from the previous mean estimations. NSIDC is working on modeling, but it is not
ready yet. I would say with confidence that we are losing the Arctic ice very fast now and it is possible
that within 5 to 15 years we could see a total degradation of Arctic sea ice in the September melt (still
highly possible in 5-7 years). Either way, it's bad news, as that will then accelerate the northern
amplification effect that will cause additional abnormal warming in contrast to natural cycle norms and
human adaptability. This is an infrastructure problem re. food and water supply. We are moving back to
solar maximum and expect to be there in 6 years. If the PDO returns to positive phase, expect discernible
impacts.
It is not about ice extent (though long term trend is still down), it is about ice mass loss.
Review of Monckton_Reply_to_Rush_on_Chu.pdf www.ossfoundation.us! original material © OSS Foundation
15
19 http://ossfoundation.us/projects/environment/global-warming/myths/images/arctic/20070822_oldice.gif/image_view_fullscreen
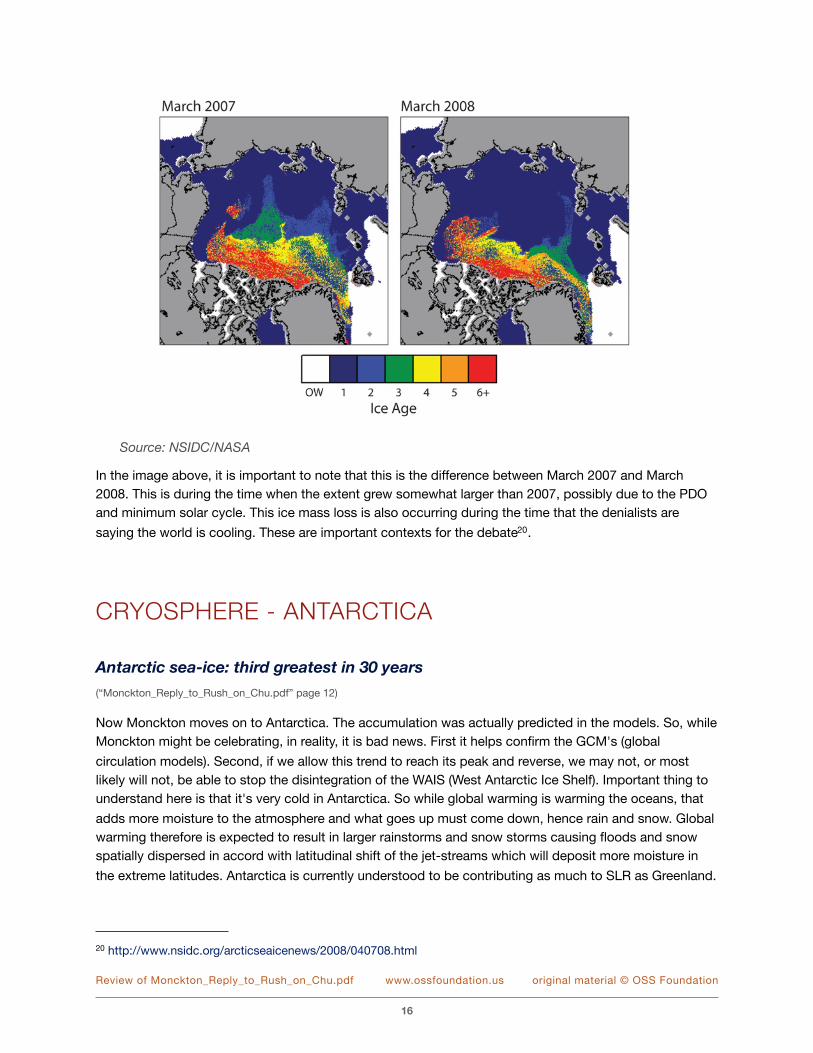
Source: NSIDC/NASA
In the image above, it is important to note that this is the difference between March 2007 and March
2008. This is during the time when the extent grew somewhat larger than 2007, possibly due to the PDO
and minimum solar cycle. This ice mass loss is also occurring during the time that the denialists are
saying the world is cooling. These are important contexts for the debate20.
CRYOSPHERE - ANTARCTICA
Antarctic sea-ice: third greatest in 30 years
(“Monckton_Reply_to_Rush_on_Chu.pdf” page 12)
Now Monckton moves on to Antarctica. The accumulation was actually predicted in the models. So, while
Monckton might be celebrating, in reality, it is bad news. First it helps confirm the GCM's (global
circulation models). Second, if we allow this trend to reach its peak and reverse, we may not, or most
likely will not, be able to stop the disintegration of the WAIS (West Antarctic Ice Shelf). Important thing to
understand here is that it's very cold in Antarctica. So while global warming is warming the oceans, that
adds more moisture to the atmosphere and what goes up must come down, hence rain and snow. Global
warming therefore is expected to result in larger rainstorms and snow storms causing floods and snow
spatially dispersed in accord with latitudinal shift of the jet-streams which will deposit more moisture in
the extreme latitudes. Antarctica is currently understood to be contributing as much to SLR as Greenland.
Review of Monckton_Reply_to_Rush_on_Chu.pdf www.ossfoundation.us! original material © OSS Foundation
16
20 http://www.nsidc.org/arcticseaicenews/2008/040708.html
Source: NSIDC/NASA
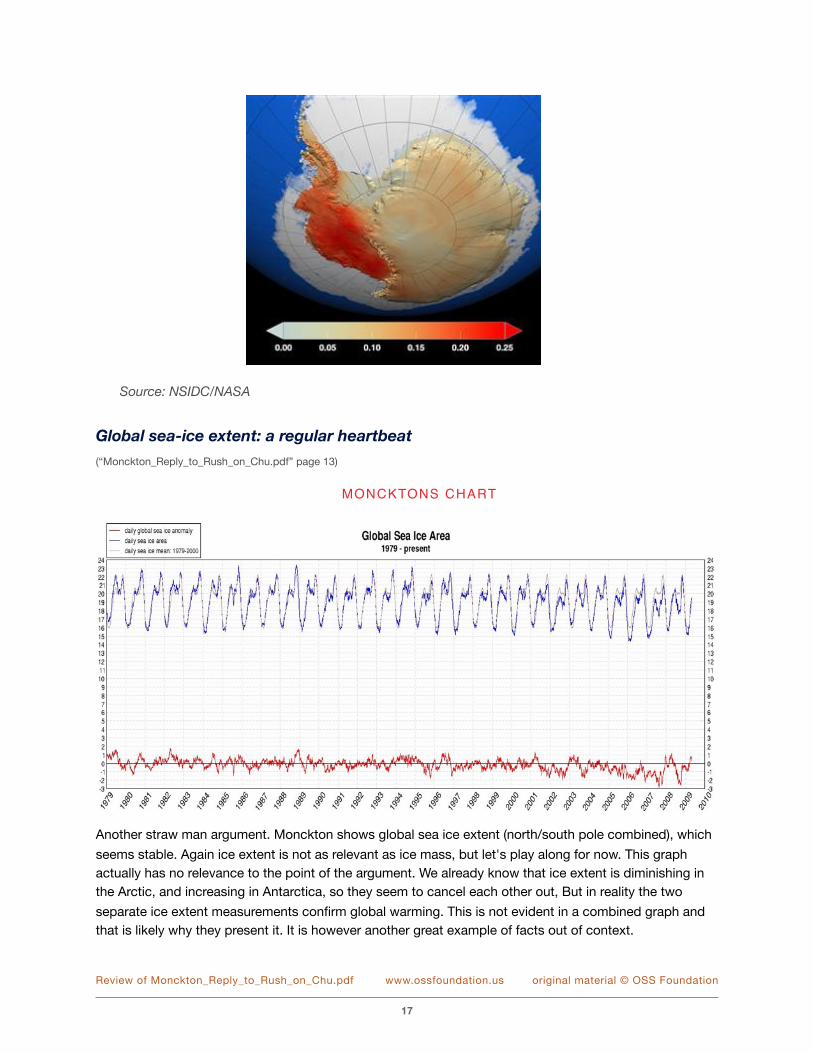
Global sea-ice extent: a regular heartbeat
(“Monckton_Reply_to_Rush_on_Chu.pdf” page 13)
MONCKTONS CHART
Another straw man argument. Monckton shows global sea ice extent (north/south pole combined), which
seems stable. Again ice extent is not as relevant as ice mass, but let's play along for now. This graph
actually has no relevance to the point of the argument. We already know that ice extent is diminishing in
the Arctic, and increasing in Antarctica, so they seem to cancel each other out, But in reality the two
separate ice extent measurements confirm global warming. This is not evident in a combined graph and
that is likely why they present it. It is however another great example of facts out of context.
Review of Monckton_Reply_to_Rush_on_Chu.pdf www.ossfoundation.us! original material © OSS Foundation
17
CRYOSPHERE - GREENLAND
“Greenland ice sheet actually grew by 2 inches per year from 1993-2003”
(“Monckton_Reply_to_Rush_on_Chu.pdf” page 13)
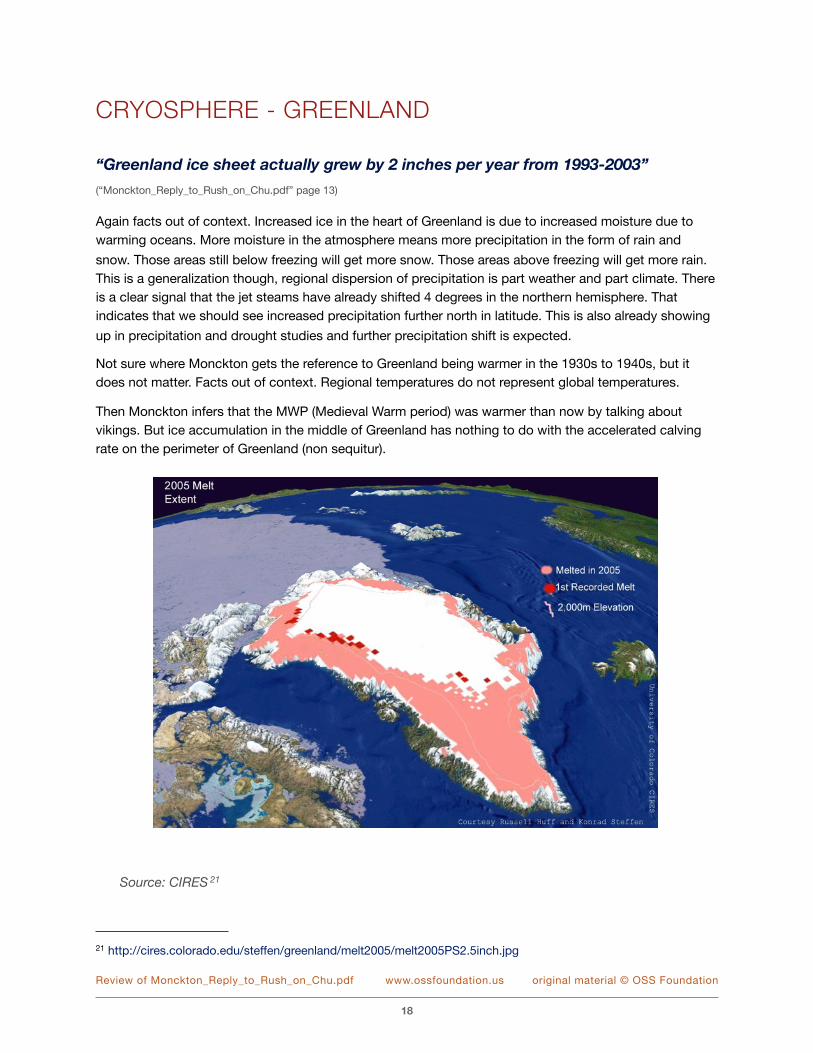
Again facts out of context. Increased ice in the heart of Greenland is due to increased moisture due to
warming oceans. More moisture in the atmosphere means more precipitation in the form of rain and
snow. Those areas still below freezing will get more snow. Those areas above freezing will get more rain.
This is a generalization though, regional dispersion of precipitation is part weather and part climate. There
is a clear signal that the jet steams have already shifted 4 degrees in the northern hemisphere. That
indicates that we should see increased precipitation further north in latitude. This is also already showing
up in precipitation and drought studies and further precipitation shift is expected.
Not sure where Monckton gets the reference to Greenland being warmer in the 1930s to 1940s, but it
does not matter. Facts out of context. Regional temperatures do not represent global temperatures.
Then Monckton infers that the MWP (Medieval Warm period) was warmer than now by talking about
vikings. But ice accumulation in the middle of Greenland has nothing to do with the accelerated calving
rate on the perimeter of Greenland (non sequitur).
Source: CIRES 21
Review of Monckton_Reply_to_Rush_on_Chu.pdf www.ossfoundation.us! original material © OSS Foundation
18
21 http://cires.colorado.edu/steffen/greenland/melt2005/melt2005PS2.5inch.jpg
HURRICANES
Hurricane activity is at a 30-year record low
(“Monckton_Reply_to_Rush_on_Chu.pdf” page 14)
TC's (tropical cyclones) are next: TC's are subject to many influences. Dust off of the sahara (for
hurricanes), sea surface temperatures, wind sheer rates and angles, and many other things. Again,
hypothetically, one may find that the negative PDO and solar minimum are playing a hand in current
trends, but that would be oversimplifying it. The lack of TC (tropical cyclone) numbers are not fully
attributed, but that does not mean global warming is not happening. The basic statement that global
warming can increase the power of TC' is still applicable but spatially dispersed in time based on
applicable factors as they occur. In other words expect periodic trends and more powerful storms.
Conversely, some storms may be impeded by global warming. While this sounds contradictory it is not.
When the heat energy is there and the dust/wind sheer is not, storms may then generate. There are many
other factors though.
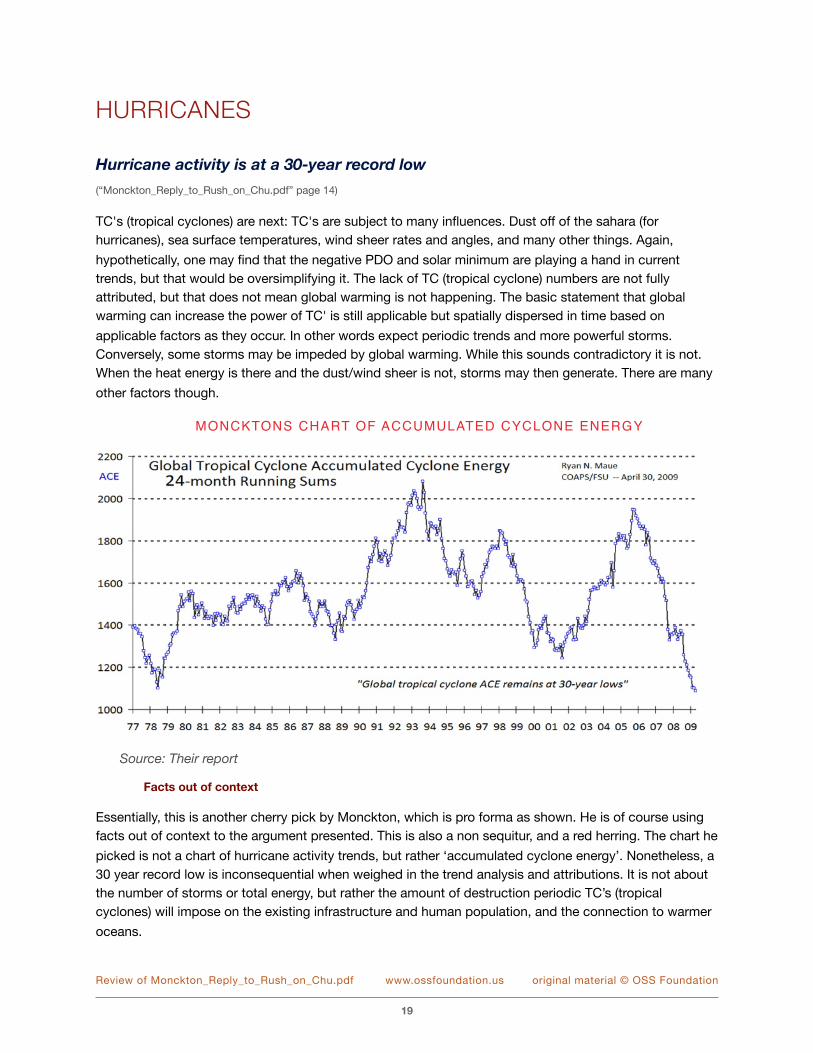
MONCKTONS CHART OF ACCUMULATED CYCLONE ENERGY
Source: Their report
Facts out of context
Essentially, this is another cherry pick by Monckton, which is pro forma as shown. He is of course using
facts out of context to the argument presented. This is also a non sequitur, and a red herring. The chart he
picked is not a chart of hurricane activity trends, but rather ‘accumulated cyclone energy’. Nonetheless, a
30 year record low is inconsequential when weighed in the trend analysis and attributions. It is not about
the number of storms or total energy, but rather the amount of destruction periodic TC’s (tropical
cyclones) will impose on the existing infrastructure and human population, and the connection to warmer
oceans.
Review of Monckton_Reply_to_Rush_on_Chu.pdf www.ossfoundation.us! original material © OSS Foundation
19
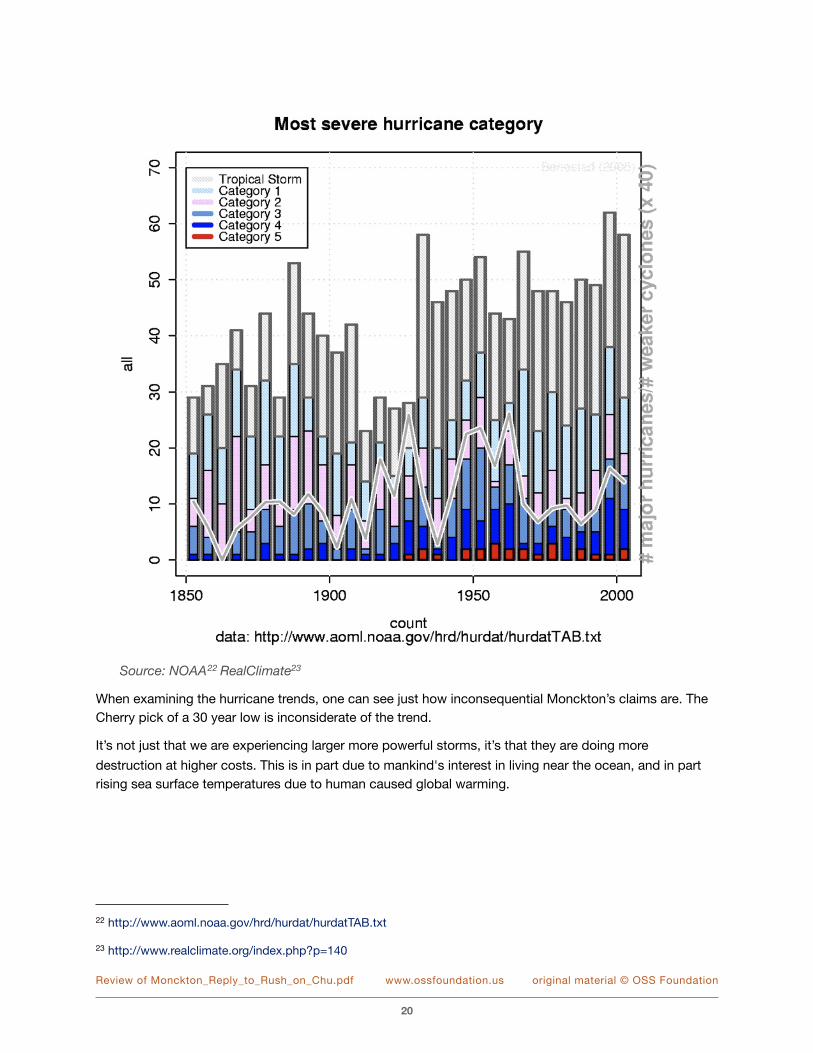
Source: NOAA22 RealClimate23
When examining the hurricane trends, one can see just how inconsequential Monckton’s claims are. The
Cherry pick of a 30 year low is inconsiderate of the trend.
It’s not just that we are experiencing larger more powerful storms, it’s that they are doing more
destruction at higher costs. This is in part due to mankind's interest in living near the ocean, and in part
rising sea surface temperatures due to human caused global warming.
Review of Monckton_Reply_to_Rush_on_Chu.pdf www.ossfoundation.us! original material © OSS Foundation
20
22 http://www.aoml.noaa.gov/hrd/hurdat/hurdatTAB.txt
23 http://www.realclimate.org/index.php?p=140
CARBON DIOXIDE
CO2 concentration well below UN predictions!
(“Monckton_Reply_to_Rush_on_Chu.pdf” page 14)
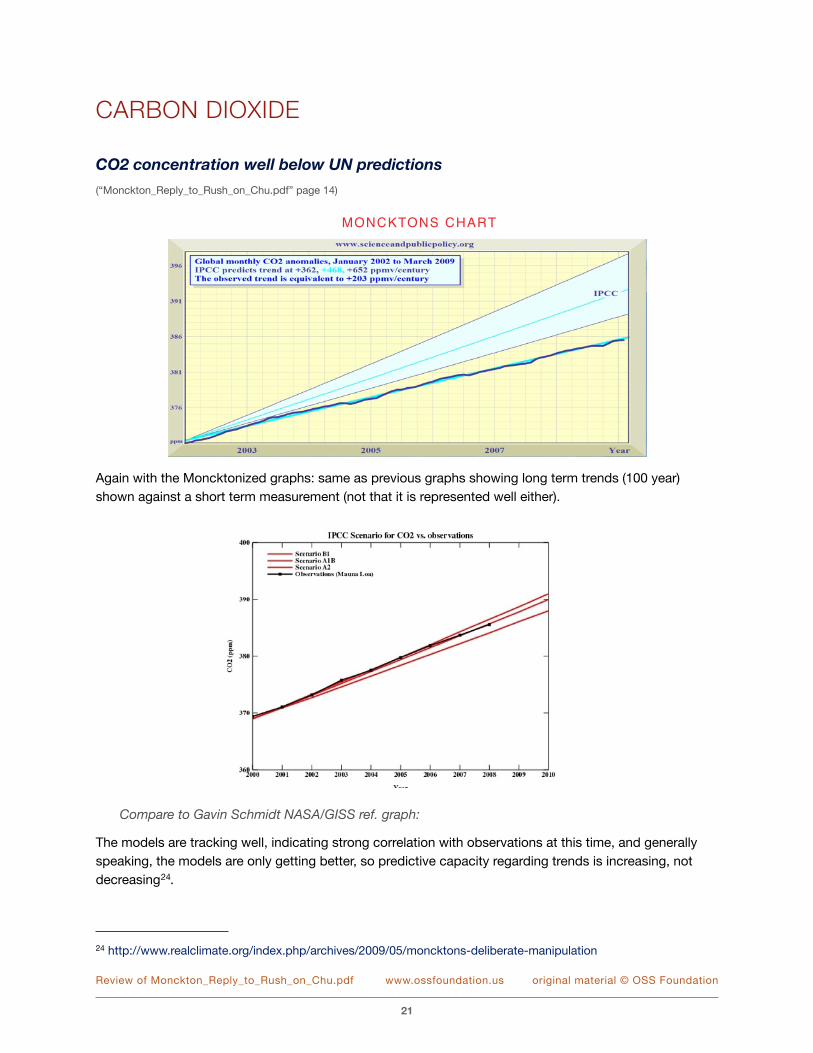
MONCKTONS CHART
Again with the Moncktonized graphs: same as previous graphs showing long term trends (100 year)
shown against a short term measurement (not that it is represented well either).
Compare to Gavin Schmidt NASA/GISS ref. graph:
The models are tracking well, indicating strong correlation with observations at this time, and generally
speaking, the models are only getting better, so predictive capacity regarding trends is increasing, not
decreasing24.
Review of Monckton_Reply_to_Rush_on_Chu.pdf www.ossfoundation.us! original material © OSS Foundation
21
24 http://www.realclimate.org/index.php/archives/2009/05/moncktons-deliberate-manipulation
SUMMARY
The bottom line: "It's not about climatology, it's about freedom"
(“Monckton_Reply_to_Rush_on_Chu.pdf” page 15)
This is simply an appeal to emotions argument. Your living the good life so global warming can’t be real,
because if we deal with the problem, we don't get to throw away as much plastic garbage. Another way
to say it is that we have become so accustomed to being wasteful, that we can not live without wasting
anymore. This is the opposite of being conservative however.
All things considered, the authors/contributors to the paper ‘Monckton_Reply_to_Rush_on_Chu.pdf’, are
either participating in a deliberate manipulation of the data involved (the science of global warming as well
known and well understood), or they are naive and/or ignorant of the contextually relevant science. There
is also the possibility of agenda orientation.
Science is not about agenda, it is about the well reasoned understanding of the evidentiary record and
the scientific method used to achieve that understanding. Science is not about opinion or rhetoric.
When Ockhams Razor is applied to the arguments presented in ‘Monckton_Reply_to_Rush_on_Chu.pdf’,
as well as Einstein's limiter to Ockhams Razor, one finds that the writer of this paper
‘Monckton_Reply_to_Rush_on_Chu.pdf’ is far outside the realm of reason, and suspect of severe naivete,
ignorance and/or unprofessionalism, and possibly even some degree of scientific fraud.
Ockhams Razor: “Entia non sunt multiplicanda praeter necesita tatum” Entities should not
be multiplied more than necessary.
Einstein's Limiter: “Things should be made as simple as possible, but not any simpler”
The paper, ‘Monckton_Reply_to_Rush_on_Chu.pdf’, brings into question the integrity and intent of the
author, as well as the information presented, and the web sites such information is derived from.
There are no reasonable explanations available for the lack of scientific relevance of the paper presented
(Monckton_Reply_to_Rush_on_Chu.pdf). The most reasonable conclusion that might be drawn is that the
author is either ignorant, naive, or fraudulent; or some combination of the three. It should be incumbent
upon him, and he should be called upon, to explain which, and to what degree.
The totality of the Monckton argument, when viewed holistically, is largely out of context with the known
and well understood reality; that is the scientific understanding and the body of evidence pertaining to
anthropogenic global warming. The science is well understood. Monckton is merely using facts out of
context to apparently manipulate the cause or perception, or reasons, behind his own suppositions, in
order to refute the well understood science.
The near constant barrage of non sequitur arguments, cherry picked data, red herrings, facts out of
context, and straw man constructions, clearly implicates an agenda of disinformation, or a near complete
incapacity to understand the contexts involved regarding the science of climate, and human caused
(anthropogenic) global warming. This, in and of itself, is an indictment on Monckton’s chosen stance.
One is seriously challenged to not call the paper, or the intentions of it’s author, fraudulent.
Review of Monckton_Reply_to_Rush_on_Chu.pdf www.ossfoundation.us! original material © OSS Foundation
22
APPENDIX
Synthesis Report - Copenhagen 2009, 10-12 March
This is the leading edge of assessment on trends and impacts as well as strategy, capabilities and
warnings regarding delayed action:
Key Message 1:
Climatic TrendsRecent observations show that greenhouse gas emissions and many aspects of the climate are changing
near the upper boundary of the IPCC range of projections. Many key climate indicators are already
moving beyond the patterns of natural variability within which contemporary society and economy have
developed and thrived. These indicators include global mean surface temperature, sea-level rise, global
ocean temperature, Arctic sea ice extent, ocean acidification, and extreme climatic events. With unabated
emissions, many trends in climate will likely accelerate, leading to an increasing risk of abrupt or
irreversible climatic shifts.
Key Message 2:
Social and Environmental DisruptionThe research community provides much information to support discussions on “dangerous climate
change”. Recent observations show that societies and ecosystems are highly vulnerable to even modest
levels of climate change, with poor nations and communities, ecosystem services and biodiversity
particularly at risk. Temperature rises above 2oC will be difficult for contemporary societies to cope with,
and are likely to cause major societal and environmental disruptions through the rest of the century and
beyond.
Key Message 3:
Long-term strategy : Global Targets and TimetablesRapid, sustained, and effective mitigation based on coordinated global and regional action is required to
avoid “dangerous climate change” regardless of how it is defined. Weaker targets for 2020 increase the
risk of serious impacts, including the crossing of tipping points, and make the task of meeting 2050
targets more difficult and costly. Setting a credible long-term price for carbon and the adoption of policies
that promote energy efficiency and low-carbon technologies are central to effective mitigation.
Key Message 4:
Equity DimensionsClimate change is having, and will have, strongly differential effects on people within and between
countries and regions, on this generation and future generations, and on human societies and the natural
world. An effective, well-funded adaptation safety net is required for those people least capable of coping
with climate change impacts, and equitable mitigation strategies are needed to protect the poor and most
vulnerable. Tackling climate change should be seen as integral to the broader goals of enhancing
socioeconomic development and equity throughout the world.
Review of Monckton_Reply_to_Rush_on_Chu.pdf www.ossfoundation.us! original material © OSS Foundation
23
Key Message 5:
Inaction is InexcusableSociety already has many tools and approaches – economic, technological, behavioural, and managerial
– to deal effectively with the climate change challenge. If these tools are not vigorously and widely
implemented, adaptation to the unavoidable climate change and the societal transformation required to
decarbonize economies will not be achieved. A wide range of benefits will flow from a concerted effort to
achieve effective and rapid adaptation and mitigation. These include job growth in the sustainable energy
sector; reductions in the health, social, economic and environmental costs of climate change; and the
repair of ecosystems and revitalization of ecosystem services.
Key Message 6:
Meeting the Challenge
If the societal transformation required to meet the climate change challenge is to be achieved, then a
number of significant constraints must be overcome and critical opportunities seized. These include
reducing inertia in social and economic systems; building on a growing public desire for governments to
act on climate change; reducing activities that increase greenhouse gas emissions and reduce resilience
(e.g. subsidies); and enabling the shifts from ineffective governance and weak institutions to innovative
leadership in government, the private sector and civil society. Linking climate change with broader
sustainable consumption and production concerns, human rights issues and democratic values is crucial
for shifting societies towards more sustainable development pathways.
Leading edge assessment of projections if no significant action is taken.
The following assessment combines reasonable projections from multiple reports pertaining to probability
based on current level of political will, or lack thereof for global security.
Global Security Combined Assessment: This combined assessment addresses global security
implications surrounding likely warming in the event that political will remains stymied by a general lack of
understanding of the scientific understanding and confidence levels in the evidence of human caused
global warming. It is considerate of implications including the magnitude of impacts including: economic,
resource scarcity, human migration and related issues including energy, healthcare, and associated
potentials.
Nov. 2007 – Center for Strategic & International Studies Pentagon Report (including
former CIA director R. James Woolsey)25:
• 1.3°C – Case I: Heightened cross-border tensions, large scale migrations, resource scar-
city, increased disease proliferation, economic consequences, some geopolitical reorder-
ing.
• 2.6°C – Case II: Massive societal events: pandemic disease, coastal flooding, armed con-
flict over resources
• 5.6°C – Case III: This catastrophic scenario would pose almost inconceivable challenges as
human society struggles to adapt.
Review of Monckton_Reply_to_Rush_on_Chu.pdf www.ossfoundation.us! original material © OSS Foundation
24
25 CSIS - http://www.csis.org/component/option,com_csis_pubs/task,view/id,4154/type,1/
Apr. 2009 – Copenhagen Congress - The main impediment/lack of political will, 182
climate specialists polled26:
• Almost nine out of 10 climate scientists do not believe political efforts to restrict global
warming to 2C will succeed. An average rise of 4-5C by the end of this century is more
likely.
• 60% of respondents argued that, in theory, it was still technically and economically possible
to meet the target, which represents an average global warming of 2C since the industrial
revolution.
• 84 of the 182 specialists (46%) who answered the question said it would reach 3-4C by the
end of the century; 47 (26%) suggested a rise of 2-3C, while a handful said 6C or more.
While 24 experts predicted a catastrophic rise of 4-5C, just 18 thought it would stay at 2C
or under.
May 2009 – Report from MIT (Massachusetts Institute of Technology) Center for
Global Change Science27:
• Probability of surface warming of 5.2°C by 2100, with a 90% probability range of 3.5 to 7.4
degrees.
• Ronald Prinn, Dir. MIT!s Center for Global Change Science: “there is significantly more risk
than we previously estimated” - “This increases the urgency for significant policy action.” -
“There!s no way the world can or should take these risks,”
Combined Assessment SummaryCombined, the cases presented (CSIS, Copenhagen 04-2009, MIT) indicate significant meaningful action
is required. The global security threat of global warming will far outweigh other important issues
(education, healthcare, energy, economy,) but combined assessment of available information indicates
that addressing these issues synergistically will provide significant benefits.
Significant meaningful action is required at this point to mitigate potentials to the degree possible based
on the action taken. Less action increases cost and risk in all areas. More action decreases cost and risk
in all areas.
Review of Monckton_Reply_to_Rush_on_Chu.pdf www.ossfoundation.us! original material © OSS Foundation
25
26 Copenhagen - http://www.guardian.co.uk/environment/2009/apr/14/global-warming-target-2c
27 MIT - http://web.mit.edu/newsoffice/2009/roulette-0519.html