Embed Size (px)
Citation preview
Review of Literature
9
REVIEW OF LITERATURE
2.1 History of diabetes mellitus
The first mention of diabetes as a condition causing 'polyuria' was first made
about 1500 B.C. in Papyrus Eber's found at Luxor in Egypt. A report from China
indicated that the urine of diabetic patients was so sweet that dogs were attracted
to it and a little later, around 400 B.C., the sweetness was referred to as "honey
urine". Around the sixth century AD, the association between excessive
indulgence in food and drinks and the development of diabetes led to its
description as the "disease of the rich".
The first complete clinical description of diabetes was given by the Ancient
Greek physician Aretaeus of Cappadocia (about 81-138 AD), who noted the
excessive amount of urine which passed through the kidneys and gave the
disease the name "diabetes."
Diabetes mellitus appears to have been a death sentence in the ancient era.
Hippocrates makes no mention of it, which may indicate that he felt the disease
was incurable. Aretaeus did attempt to treat it but could not give a good
prognosis; he commented that "life with diabetes is short, disgusting and
painful"(Medvei,1993).
In medieval Persia, Avicenna (980-1037) provided a detailed account on diabetes
mellitus in The Canon of Medicine, "describing the abnormal appetite and the
collapse of sexual functions," and he documented the sweet taste of diabetic
urine. Like Aretaeus before him, Avicenna recognized a primary and secondary
diabetes. He also described diabetic gangrene, and treated diabetes using a
mixture of lupine, trigonella (fenugreek), and zedoary seed, which produces a
considerable reduction in the excretion of sugar, a treatment which is still
prescribed in modern times. Avicenna also "described diabetes insipidus very
precisely for the first time", though it was later Johann Peter Frank (1745-1821)
who first differentiated between diabetes mellitus and diabetes insipidus
(Nabipour, 2003).
Review of Literature
10
Although diabetes has been recognized since antiquity, and treatments of various
efficacy have been known in various regions since the Middle Ages, and in
legend for much longer, pathogenesis of diabetes has only been understood
experimentally since about 1900 (Patlak, 2002). The discovery of a role for the
pancreas in diabetes is generally ascribed to Joseph von Mering and Oskar
Minkowski, who in 1889 found that dogs whose pancreas was removed
developed all the signs and symptoms of diabetes and died shortly afterwards. In
1910, Sir Edward Albert Sharpey-Schafer suggested that people with diabetes
were deficient in a single chemical that was normally produced by the pancreas.
He proposed calling this substance insulin, from the Latin insula, meaning
island, in reference to the insulin-producing islets of Langerhans in the pancreas.
The endocrine role of the pancreas in metabolism, and indeed the existence of
insulin, was not further clarified until 1921, when Sir Frederick Grant Banting
and Charles Herbert Best repeated the work of Von Mering and Minkowski, and
went further to demonstrate they could reverse induced diabetes in dogs by
giving them an extract from the pancreatic islets of Langerhans of healthy dogs
(Banting et al., 1991).They purified the hormone insulin from bovine pancreases
at the University of Toronto. This led to the availability of an effective
treatment-insulin injections-and the first patient was treated in 1922.
The distinction between what is now known as type 1 diabetes and type 2
diabetes was first clearly made by Sir Harold Percival Himsworth, and published
in January 1936.
Other landmark discoveries include:
• Identification of the first of the sulfonylureas in 1942.
• Reintroduction of the use of biguanides for type 2 diabetes in the late
1950s. The initial phenformin was withdrawn worldwide (in the U.S. in
1977) due to its potential for sometimes fatal lactic acidosis and
metformin was first marketed in France in 1979, but not until 1994 in the
US.
• The determination of the amino acid sequence of insulin by Sir Frederick
Sanger, for which he received a Nobel Prize.
Review of Literature
11
• The radioimmunoassay for insulin, as discovered by Rosalyn Yalow and
Solomon Berson (gaining Yalow the 1977 Nobel Prize in Physiology or
Medicine).
• The three-dimensional structure of insulin.
• Dr Gerald Reaven's identification of the constellation of symptoms now
called metabolic syndrome in 1988.
• Demonstration that intensive glycemic control in type 1 diabetes reduces
chronic side effects more as glucose levels approach 'normal' in a large
longitudinal study, and also in type 2 diabetics in other large studies.
• Identification of the first thiazolidinedione as an effective insulin
sensitizer during the 1990s.
In 1980, U.S. biotech company Genentech developed biosynthetic human insulin.
The insulin was isolated from genetically altered bacteria (the bacteria contain
the human gene for synthesizing synthetic human insulin), which produce large
quantities of insulin. The purified insulin is distributed to pharmacies for use by
diabetes patients. Initially, this development was not regarded by the medical
profession as a clinically meaningful development. However, by 1996, the
advent of insulin analogues which had vastly improved absorption, distribution,
metabolism, and excretion (ADME) characteristics which were clinically
meaningful based on this early biotechnology development.
2.2 Definition
Diabetes mellitus is a group of metabolic diseases characterized by
hyperglycemia resulting from defects in insulin secretion, insulin action, or both
(Holt, 2004; Craig et al., 2009). The chronic hyperglycemia-of diabetes is
associated with long-term damage, dysfunction, and failure of various organs,
especially the eyes, kidneys, nerves, heart, and blood vessels. In developed
countries, 10% or more of total health budget is spent on the management of
diabetes and its complications (Johnson, 2002; Zimmet et al., 2003). Several
pathogenic processes are involved in the development of diabetes. These range
from autoimmune destruction of the β-cells of the pancreas with consequent
Review of Literature
12
insulin deficiency to abnormalities that result in resistance to insulin action
(ADA, 2010). The abnormalities in carbohydrate, fat, and protein metabolism
that are found in diabetes are due to deficient action of insulin on target tissues
(Craig et al., 2009). Deficient insulin action results from inadequate insulin
secretion and/or diminished tissue responses to insulin at one or more points in
the complex pathways of hormone action.
Symptoms of marked hyperglycemia include polyuria, polydipsia, weight loss,
sometimes with polyphagia, and blurred vision. Impairment of growth and
susceptibility to certain infections may also accompany chronic hyperglycemia.
Acute, life-threatening consequences of uncontrolled diabetes are hyperglycemia
with ketoacidosis or the nonketotic hypersomolar syndrome. Diabetic
ketoacidosis is the leading cause of morbity and mortality in children with
diabetes (Dunger et al., 2004).Unlike in adult population, paediartric mortality is
mainly due to the development of cerebral oedema (Rosenbloom, 2007).
2.3 Classification
According to American Diabetes Association (ADA, 2010), diabetes mellitus is
classified into four main subtypes. These are as follows.
2.3.1 Type 1 diabetes
Type 1 diabetes is a multi-factorial autoimmune disease characterized by insulin
deficiency, due to the T-cell mediated destruction of pancreatic β-cells (Mathis
et al., 2001; Urcelary et al., 2005).
This form of diabetes, accounts for only 5-10% of all cases of diabetes
(Gillespie, 2006). This form of diabetes was previously known by the terms
insulin-dependent diabetes, type I diabetes, or juvenile-onset diabetes. The
various markers which causes destruction of the pancreatic β-cell include islet
cell autoantibodies (ICA), antibodies to insulin (IAA), autoantibodies to
glutamic acid decarboxylase (GAD65), and autoantibodies to the tyrosine
phosphatases IA-2 and IA-2β (Wilkin, 1990; Verge et al., 1996; Christie et al.,
1997). One and usually more of these autoantibodies are present in 85-90% of
individuals when fasting hyperglycemia is initially detected.
Review of Literature
13
In this form of diabetes, the rate of β-cell destruction is quite variable, being
rapid in some individuals mainly infants and children and slow in others mainly
adults. The symptom appears when the β-cell mass gets reduced by
approximately 90 percent leading to severe insulin deficiency and
hyperglycaemia. The latter is due to hepatic overproduction of glucose by
glycogenolysis and gluconeogenesis and decreased cellular uptake of glucose
from the circulation. In the absence of insulin, there is also an increase in fat
breakdown and fatty acid oxidation, resulting in the excessive production of
Ketones. If not treated, these metabolic disturbances lead progressively to central
nervous system depression, coma and death. Therefore, type 1 DM requires life
long treatment with exogenous insulin for survival (Mehra et al., 2007).Some
patients, particularly children and adolescents, may present with ketoacidosis as
the first manifestation of the disease. Others have modest fasting hyperglycemia
that can rapidly change to severe hyperglycemia and/or ketoacidosis in the
presence of infection or other stress. Immune-mediated diabetes commonly
occurs in childhood and adolescence, but it can occur at any age, even in the 8th
and 9th
decades of life.
These patients are also prone to other autoimmune disorders such as Graves'
disease, Hashimoto's thyroiditis, Addison's disease, vitiligo, celiac sprue,
autoimmune hepatitis, myasthenia gravis, and pernicious anemia (ADA, 2010).
2.3.2 Type 2 diabetes
This form of diabetes, which accounts for 90-95% of those with diabetes,
previously referred to as non-insulin-dependent diabetes, type II diabetes, or
adult-onset diabetes, is due to the combination of insulin resistance and defective
secretion of insulin by pancreatic β-cells (Grundy et al., 1999). These
individuals do not need insulin treatment to survive initially, and often
throughout their lifetime.
Most patients with this form of diabetes are obese, and obesity itself causes some
degree of insulin resistance. Patients who are not obese by traditional weight
criteria may have an increased percentage of body fat distributed predominantly
in the abdominal region. Unlike type 1 diabetes ketoacidosis seldom occurs
spontaneously in this type of diabetes. It usually arises in association with the
Review of Literature
14
stress of another illness such as infection (Fasanmade et al., 2008). This form of
diabetes frequently goes undiagnosed for many years because the hyperglycemia
develops gradually and at earlier stages is often not severe enough for the patient
to notice any of the classic symptoms of diabetes (ADA, 2010). Nevertheless;
such patients are at increased risk of developing macrovascular and
microvascular complications. Insulin secretion is defective in these patients and
insufficient to compensate for insulin resistance. Insulin resistance may improve
with weight reduction and/or pharmacological treatment of hyperglycemia but is
seldom restored to normal. The risk of developing this form of diabetes increases
with age, obesity, and lack of physical activity (Hawkin and Rossetti, 2005). It
occurs more frequently in women with prior GDM and in individuals with
hypertension or dyslipidemia and its frequency varies in different racial/ethnic
subgroups.
2.3.3 Other types of diabetes
It covers a wide range of specific types of diabetes including the various genetic
defects of beta cell functions, genetic defects in insulin action, diseases of the
exocrine pancreas and medication use.
A. Genetic defects of β-cell function
B. Genetic defects in insulin action
C. Diseases of the exocrine pancreas
D. Endocrinopathies
E. Drug- or chemical-induced
F. Infections
G. Uncommon forms of immune-mediated diabetes
H. Other genetic syndromes sometimes associated with diabetes
2.3.4 Gestational diabetes mellitus
Glucose intolerance may develop during pregnancy, Insulin resistance is related
to the metabolic change of late pregnancy and the increased insulin requirements
Review of Literature
15
may lead to IGT. GDM occurs in ~ 4 % of pregnancies in the united states; most
women revert to normal glucose tolerance post –partum but have a substantial
risk (30-60 %) of developing DM later in life.
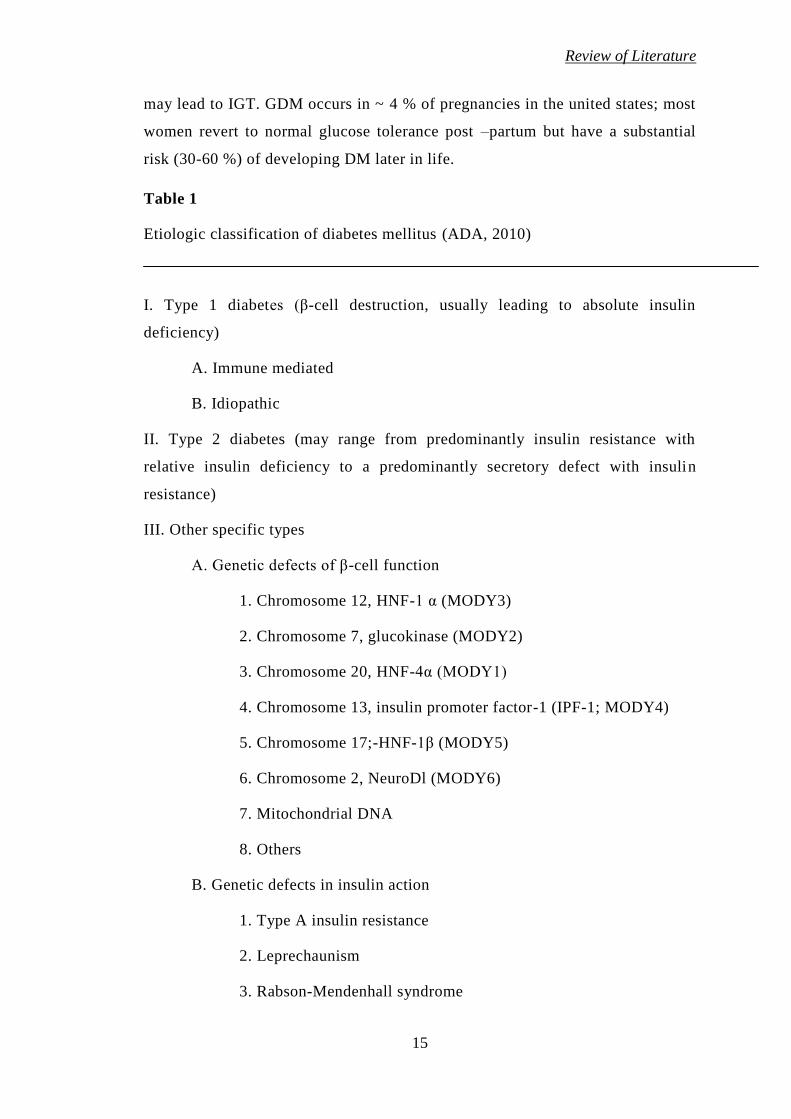
Table 1
Etiologic classification of diabetes mellitus (ADA, 2010)
I. Type 1 diabetes (β-cell destruction, usually leading to absolute insulin
deficiency)
A. Immune mediated
B. Idiopathic
II. Type 2 diabetes (may range from predominantly insulin resistance with
relative insulin deficiency to a predominantly secretory defect with insulin
resistance)
III. Other specific types
A. Genetic defects of β-cell function
1. Chromosome 12, HNF-1 α (MODY3)
2. Chromosome 7, glucokinase (MODY2)
3. Chromosome 20, HNF-4α (MODY1)
4. Chromosome 13, insulin promoter factor-1 (IPF-1; MODY4)
5. Chromosome 17;-HNF-1β (MODY5)
6. Chromosome 2, NeuroDl (MODY6)
7. Mitochondrial DNA
8. Others
B. Genetic defects in insulin action
1. Type A insulin resistance
2. Leprechaunism
3. Rabson-Mendenhall syndrome

Review of Literature
16
4. Lipoatrophic diabetes
5. Others
C. Diseases of the exocrine pancreas
1. Pancreatitis
2. Trauma/pancreatectomy
3. Neoplasia
4. Cystic fibrosis
5. Hemochromatosis
6. Fibrocalculous pancreatopathy
7. Others
D. Endocrinopathies
1. Acromegaly
2. Cushing's syndrome
3. Glucagonoma
4. Pheochromocytoma
5. Hyperthyroidism
6. Somatostatinoma
7. Aldosteronoma
8. Others
E. Drug- or chemical-induced
1. Vacor
2. Pentamidine
3. Nicotinic acid
4. Glucocorticoids
5. Thyroid hormone
6. Diazoxide

Review of Literature
17
7. β-adrenergic agonists
8. Thiazides
9. Dilantin
10. α-Interferon
11. Others
F. Infections
1. Congenital rubella
2. Cytomegalovirus
3. Others
G. Uncommon forms of immune-mediated diabetes
1. "Stiff-man" syndrome
2. Anti-insulin receptor antibodies
3. Others
H. Other genetic syndromes sometimes associated with diabetes
1. Down's syndrome
2. Klinefelter's syndrome
3. Turner's syndrome
4. Wolfram's syndrome
5. Friedreich's ataxia
6. Huntington's chorea
7. Laurence-Moon-Biedl syndrome
8. Myotonic dystrophy
9. Porphyria
10. Prader-Willi syndrome
11. Others
IV. Gestational diabetes mellitus (GDM)
Review of Literature
18
2.4 Clinical manifestation of diabetes
Generally, the injurious effects of hyperglycemia are separated into
macrovascular complications (coronary artery disease, peripheral arterial disease,
and stroke) and microvascular complications (diabetic nephropathy, neuropathy,
and retinopathy).
2.4.1 Microvascular complications of diabetes
2.4.1.1 Diabetic retinopathy
Diabetic retinopathy may be the most common microvascular complications of
diabetes. The risk of developing diabetic retinopathy or other microvascular
complications of diabetes depends on both the duration and the severity of
hyperglycemia. Development of diabetic retinopathy in patients with type 2
diabetes was found to be related to both severity of hyperglycemia and presence
of hypertension in the U.K. Prospective Diabetes Study (UKPDS), and most
patients with type 1 diabetes develop evidence of retinopathy within 20 years of
diagnosis (UKPDS 33, 1998; Keenan et al., 2007). Retinopathy may begin to
develop as early as 7 years before the diagnosis of diabetes in patients with type
2 diabetes (Fong et al., 2004).
2.4.1.2 Diabetic nephropathy
Diabetic nephropathy is the leading cause or renal failure in the United States. It
is defined by proteinuria>500 mg in 24 hours in the setting of diabetes, but this
is preceded by lower degree of proteinuria, or “microalbuminuria.”
Microalbuminuria is defined as albumin excretion of 30-299 mg/24 hours.
Without intervention, diabetic patients with microalbuminuria typically progress
to proteinuria and overt diabetic nephropathy. This progression occurs in both
type 1 and type 2 diabetes. As many as 7% of patients with type 2 diabetes may
already have microalbiuminuria at the time they are diagnosed with diabetes
(Gross et al., 2005). In the European Diabetes Prospective Complications Study,
the cumulative incidence of microalbuminuria in patients with type 1 diabetes
was ~12% during a period of 7 years (Chaturvedi et al., 2001; Gross et al.,
2005). In the UKPDS, the incidence of microalbuminuria was 2% per year in
patients with type 2 diabetes, and the 10-year prevalence after diagnosis was
Review of Literature
19
25% (Adler et al., 2003; Gross et al., 2005). The pathological changes to the
kidney include increased glomerular basement membrane thickness,
microaneurysm formation, mesangial nodule formation (Kimmelsteil -Wilson
bodies) and other changes.
2.4.1.3 Diabetic neuropathy
Diabetic neuropathy is recognized by the American Diabetes Association (ADA)
as “the presence of symptoms and/or signs of peripheral nerve dysfunction in
people with diabetes after the exclusion of other causes” (ADA, 2010). As with
other microvascular complications, risk of developing diabetic neuropathy is
proportional to both the magnitude and duration of hyperglycemia, and some
individuals may possess genetic attributes that affect their predisposition to
developing such complications.
Several other forms of neuropathy may mimic the findings in diabetic sensory
neuropathy and mononeuropathy. Chronic inflammatory polyneuropathy, vitamin
B12 deficiency, hyperthyroidism, and uremia should be ruled out in the process
of evaluating diabetic peripheral neuropathy (Boulton et al., 2005).
Diabetic autonomic neuropathy also causes significant morbidity and even
mortality in patients with diabetes. Neurological dysfunction may occur in most
organ system and can be manifest by gastroparesis, constipation, diarrhea,
anhidrosis, bladder dysfunction, erectile dysfunction, exercise intolerance,
resting tachycardia, silent ischemia, and even sudden cardiac death (Boulton et
al., 2005). Cardiovascular autonomic dysfunction is associated with increased
risk of silent myocardial ischemia and mortality (Maser et al., 2003).
2.4.2 Macrovascular complications of diabetes
2.4.2.1 Cardiovascular diseases
Diabetes increases the risk that an individual will develop cardiovascular disease
(CVD). CVD is the primary cause of death in people with either type 1 or type 2
diabetes (Laing et al., 2003; Paterson et al., 2007). In fact, CVD accounts for the
greatest component of health care expenditures in people with diabetes (Hogan et
al., 2003; Paterson et al., 2007). Studies in type 1 diabetes have shown that
intensive diabetes control is associated with a lower resting heart rate and that
Review of Literature
20
patients with higher degrees of hyperglycemia tend to have a higher heart rate,
which is associated with higher risk of CVD (Paterson et al., 2007).
2.4.2.2 Metabolic syndrome
Type 2 diabetes typically occurs in the setting of the metabolic syndrome, which
also includes abdominal obesity, hypertension, hyperlipidemia, and increased
coagulability. These other factors can also act to promote CVD. Even in this
setting of multiple risk factors, type 2 diabetes acts as an independent risk factors
for the development of ischemic disease, stroke, and death (Almdal et al., 2004).
Among people with type 2 diabetes, women may be at higher risk for coronary
heart disease than men. The presence of microvascular disease is also a predictor
of coronary heart events (Avogaro et al., 2007).
2.4.2.3 Cerebrovascular diseases
Diabetes is also a strong independent predictor of risk of stroke and
Cerebrovascular diseases, as in coronary artery disease (Lehto et al., 1996).
Patients with type 2 diabetes have a much risk of 150-400%. Risk of stroke-
related dementia and recurrence, as well as stroke-related mortality, is elevated
in patients with diabetes (Beckman et al., 2002). Observational studies have
shown that the cerebrovascular mortality rate is elevated at all ages in patients
with type 1 diabetes (Laing et al., 2003).
2.5 Etiology of diabetes mellitus
In both types of diabetes environmental factors interact with genetic factors in
genetically susceptible individuals and hence result in development of diabetes
mellitus. It is contemplated that several genes, each with a small contribution,
play a role in inducing susceptibility to diabetes development and hence the
condition is referred to as polygenic.
The environmental and genetic factors contributing to the development of type 1
and type 2 differ from each other, and hence the two conditions are distinct
entities.
Review of Literature
21
2.5.1 Etiology of type 1
The factors, which contribute to the development of type 1 include genetic
factors autoimmunity, age and sex and viral infections. Each of these factors is
discussed below:
2.5.1.1 Genetic factors
Type 1 diabetes is considered by some as polygenic while others consider it as
an oligogenic, but heterogeneous disease. To date, several loci in different
chromosomes are related to the genetic susceptibility of this type of diabetes
(Todd et al., 2007). Such loci are denominated IDDM1, IDDM2, IIDM3, etc.
The most important genes are located inside the major complex of
histocompatibilty (MHC) in the region of class II of the HLA system,
particularly molecules DR, DQ and DP in chromosome 6p21.31 (Noble et al.,
1996). These are called IDDM1 and are responsible for about 45% of the genetic
susceptibility of type 1 diabetes. Most of these data come from Caucasian
populations from Europe and North-America. In these studies, approximately
95% of patients have class II antigens HLADR3 or - DR4 and 55 - 60% of them
are heterozygote DR3/DR4. Genotype DR3/DR4 offers higher risk for type 1
diabetes, with a synergic mode of action, followed by homozygote DR4 or DR3,
respectively.
The data suggest that DR4 may offer this susceptibility in a dominant manner,
while DR3 as a recessive feature. The latest studies using molecular biology
techniques have demonstrated that the locus HLA-DQ is more narrowly
associated with the susceptibility to type 1 diabetes. Such locus codifies
important proteins at the presentation and recognition of antigens by the immune
system. In Caucasians, the heterodimers HLA-DQ (alpha chains denominated
DQA1 and beta chains, DQB1) codified by the alleles DQA1*0301, DQB1*0302
and DQA1*0501, DQB1*0201 have the strongest association with type 1
diabetes and are respectively not balanced at the connection to alleles HLADR4
and DR3. On the other hand, among four common DR2 haplotypes, observed in
Caucasians, DQA1*0102, DQB1*0602, DR61*1501 are negatively associated
with type 1 diabetes and are related in less than 1% of the majority of
Review of Literature
22
populations studied, including Asians, Afro-Americans and Mexican-Americans.
This protection seems to have a dominant effect, as the presence of DQB1*0602
protects from diabetes, with rare exceptions, even in the concomitance of alleles
of the HLA system of high risk of the disease (Volpini et al., 2001).
For nearly 20 years, Bell et al. (1982) found out that variations in the number of
nucleotide elements repeated (Variable Number of Tanden Repeats - VNTR) of
the 5' portion of the insulin gene were associated with the development of type 1
diabetes. A longer group of repetitions was associated with a reduced risk of
diabetes. Such studies have been replicated and have demonstrated that the
important locus is clearly limited to the insulin gene (Pugliese et al., 1997). It is
denominated IDDM2, located in chromosome 11p15.5 and contributes with
approximately 10%of this disease susceptibility. One of the mechanisms
suggested for the susceptibility and resistance associated with IDDM2 is related
to the influence of VNTR in the transcription of insulin in the thymus, necessary
to establish self-tolerance during body growth and development.
In a third place of this disease prediction is a lymphocyte specific phosphatase
(PTPN22) gene (Bottini et al., 2004). Another locus associated with a
modulation of the immune response and with type 1 diabetes, in some
populations, is IDDM12 in chromosome 2q33, related to a protein 4 of cytotoxic
T lymphocytes (Marron et al., 1997).
2.5.1.2 Autoimmune process
The anti-islet antibodies circulating also express the inflammatory lesion taking
place in the pancreas. In type 1 diabetes mellitus the most studied autoantibodies
are classical anti-islet, glutamic acid decarboxylase antibodies (GADA), anti-
tyrosine-phosphatase (IA2/ICA512) antibodies and anti-insulin autoantibodies.
The presence of autoimmunity against the pancreatic islets is considered when
the individual has one or more antibodies persistent for at least 3 to 6 months. It
is important to confirm these antibodies at least two times in three different
occasions.
Antigens ICA512 (IA-2) and later IA-2β (fogrin-phosphatase of insulinoma
granules) were isolated independently by different investigators (Castano et al.,
Review of Literature
23
1993; Wasmeier and Hutton, 1996; Lu et al., 1996). Almost all antibodies which
react with IA-2β also react with IA-2, while approximately 10% of patients who
develop T1DM have antibodies reacting against IA2, but not IA-2β. Thus, during
the routine, the IA-2β essay is unnecessary.
2.5.1.3 Age and sex
Several studies have revealed that type 1 occurs more in male in the age group 0-
4 years and 11-15 years compared to the female (Fleeger et al., 1979; Spencer
and Cudworth, 1983). In addition, the incidence varies in different age groups. A
major peak is obtained at 5 years and 20 years of age (Rotter et al., 1992). In
addition, differences in the prevalence of type 1 in the male and female in
different populations are identified.
2.5.1.4 Viral infections
Certain viruses have been implicated as a possible cause of diabetes mellitus.
Several epidemiological studies confirmed a seasonal prevalence in the
development of type 1 which was suggested to be due to an association with
epidemic viral infection. An increased frequency and elevated antibodies to
Coxsachie B4 virus have been reported in some type 1 patients (EI-Hagrassy et
al.,1980) and in other studies the incidence of diabetes is found to be higher in
patients with congenital rubella infection and with CMV (Menser et al., 1978;
Pak et al., 1988). Other viruses implicated in type 1 development include EMC
virus, and mengo virus.
2.5.2 Etiology of type 2 diabetes mellitus
Epidemiological investigations have confirmed that type 2 diabetes is a
polyetiological disorder. Both genetic and environmental factors and the
interaction between these influence the development of disease. These factors
include obesity, genetic factors lack of exercise, excessive food intake, age and
pregnancy.
2.5.2.1 Obesity
Obesity or weight gain plays an important role in type 2 diabetes. The frequency
of type 2 diabetes is more in obese individuals as compared to nonobese
Review of Literature
24
individuals and the frequency of type 2 diabetes is shown to be higher in women
compared to men and it is believed to be due to higher number of over weight
women. In different populations both the prevalence and incidence of type 2
diabetes are positively associated with the measurement of obesity such as body
mass index (BMI), waist circumference, waist hip ratio, whole or visceral fat
mass etc (Meisinger et al., 2006; Ni Mhurchu et al., 2006). In a US study 12%
increased risk of diabetes was associated with each unit increase in BMI (Ford et
al., 1997) and in Chinese, the conversion rate from 1GT to diabetes in subjects
with a high baseline waist circumference was about 3 times higher than in those
with a low one (Wat et al., 2001). In Pima Indians who attained a BMI/30Kg/m2,
the risk of type 2 diabetes increased from 24.8 per 1,000 persons-years in those
who were obese for <5years, to 35.2 per 1,000 for obesity of 5-10 years to 59.8
per 1,000 for >10 years of obesity (Everhart et al., 1992). Weight reductions can
prevant or delay the onset of diabetes have been confirmed from strong evidence
from clinical trials (Knowler et al., 2002; Li et al., 2008). It is notice able that
not all patients with type 2 diabetes are obese at the onset of the disease and not
all obese people develop diabetes. The prevalence of diabetes varied largely
among different ethnic groups, which is highest in Indians and lowest in
Caucasians, given the same degree of obesity defined by either BMI or waist
circumference (Nakagami et al., 2003; Nyamdorj et al., 2010).
2.5.2.2 Genetic factors
Type 2 diabetes is a genetic predisposed disease. The prevalence of diabetic is
higher in certain ethnic groups than in others suggesting the genetic
predisposition (Dowse et al., 1991; Lee, 2000). Individual with family history of
diabetes in their parents or siblings were observed to have 2-6 times high risk of
diabetes (Thorand et al., 2001; Harrison et al., 2003; Valdez et al., 2007). In
monozygotic twins the concordance rate in type 2 diabetes might be 70–80%
(Matsuda and Kuzuya, 1994; Ghosh and Schork, 1996). With the advanced
technology the genome wide association studies suggested that many of gene
variants might be associated with a high risk for type 2 diabetes (Zeggini et al.
2007; Lango et al., 2008; Grant et al., 2009).
Review of Literature
25
2.5.2.3 Physical inactivity
In different populations the risk for diabetes is higher in people with sedentary
lifestyle (Chien et al., 2009; Gimeno et al., 2009). Diabetes risk was reported to
be positively associated with prolonged television watching, as a surrogate of
sedentary lifestyle. In women every 2 hour per day increment in television
watching was associated with 14% increase in risk of diabetes (Hu, 2003) while
in men, the risk increased progressively to 187% higher incidence among those
watching TV >40 hour per week than among those spending 0-1 hour per week
(Hu et al., 2001). Several clinical traits have shown that moderate physical
activity might reduce the progression of 1GT to diabetes by 30-58% (Yamaoka
and Tango, 2005; Ramachandran et al., 2006; Li et al., 2008).Higher level of
physical activity is associated with a lower risk of diabetes.
2.5.2.4 Age
With age both the prevalence and incidence of type 2 diabetes increase in most
of populations but the age at peak varies among different ethnic group. It is
observed that in Chinese and Caucasians, the incidence of diabetes increased
with age up to 65-74 years (Ubink-Veltmaat et al., 2003; Liu et al., 2007) in
Pima and Asian Indian it is 40-50 years (Pavkov et al., 2007; Mohan et al.,
2008). The incidence and prevalence started to decline after the age at peak. It
might be caused by decline in glucose utility (Ruiz-Torres et al., 1996) and
increase in mortality after the age at peak.
2.5.2.5 Diet
Excess Caloric intake has been considered as an important risk factor for
diabetes and promotes the onset of both obesity and diabetes. Some studies have
linked the prevalence of diabetes to the amount of carbohydrates, fat and fibre
intake. Low carbohydrates, high fat diet might increase the risk of diabetes. The
westernized dietary pattern, rich in saturated fat, and simple carbohydrate and
scare in fibres is associated with a high risk of type 2 diabetes (Mc Naughton et
al., 2008; Liese et al., 2009). People consuming lot of vegetables, fruits, whole
grain products, fish etc which have low energy density, and low glycemic index
but high fibre and unsaturated fatty acid are at low risk for diabetes (de Munter
Review of Literature
26
et al., 2007; Villegas et al., 2008; Patel et al., 2009). Diabetes pattern depends
on the local food resource and the cooking procedure, which is closely related to
the folk custom, religion and culture etc. the results from different studies were
not always consistent. Diet intervention and moderate or intensive activity have
been proceed to be effective on the prevention of diabetes (Li et al., 2008). The
antioxidant such as vitamin C and E unsaturated fatty acid, flavonoid etc might
also have protecting effect (Stote and Baer, 2008).
2.5.2.6 Alcohol consuming
Compared with abstainers, moderate alcohol consuming had about 30% reduced
risk of diabetes (Crandall et al., 2009; Imamura et al., 2009). However, daily
consumption of alcohol has no protecting effect and might reversely increase the
risk for diabetes (Beulens et al., 2005; Hodge et al., 2006).
2.5.2.7 Smoking
Type 2 diabetes is associated with smoking. However the results are not
consistent. Recently, metabolic analysis including 25 perspective studies showed
that current smoking associated with 44% increased risk of diabetes (Willi et al.,
2007).
2.5.2.8 Other environmental factors
It is observed that prevalence of diabetes is observed to increase with the
urbanization in the developing countries. As compared to rural population, urban
population in India, had 2-5 times higher prevalence of diabetes (Mohan et al.,
2008). Although the social-economic status has been suggested to modify the
risk of diabetes, the affects are different in developing and developed regions. In
Qingdao city, for example, low socio-economic classes associated with a higher
prevalence of diabetes in urban areas but a lower prevalence in rural areas (Ning
et al., 2009).
2.6 Thyroid gland; Historical resume
The thyroid gland plays, a pivotal role in tissue metabolism and development,
and in doing so affects various organ systems.
Review of Literature
27
The initial description of the thyroid was given by Galen in his “DEVOCE”.
After that many significant milestones related to thyroid gland and its related
diseases have been achieved which are given below in brief.
VES ALIUS gave a detailed description of the thyroid.
WHARTON named organ as thyroid i.e., oblong shield.
KING described the internal secretary function of the thyroid.
GRAVE correlated symptoms of hyperthyroidism with thyroid gland
in1835.
GULL first described clinical syndrome of hypothyroidism in 1874.
BAUMANN described the association of the iodine with the working of
the thyroid in 1896.
HASHIMOTO described chronic thyroiditis in 1912.
HARRITON & BAYER described the chemical structure of the thyroxine
in 1926.
STEWART described the merits of aspiration biopsy of the thyroid in
1933.
DEQUER VAIN first described acute or subacute non–suppurative
thyroiditis in 1936.
1956 ROSE & WITEDSKY described experimental thyroiditis.
ROITT described anti – thyroid antibodies in 1962.
Other subsequent milestones included
Substantiation that circulating T3 was derived largely from peripheral
monodeiodination of T4 in 1970.
Identification of T3-binding receptors in tissues in 1972 and their
homology to the viral oncogene erbA in 1986.
Demonstrations that point mutations in the thyroid-hormone receptor
accounted for hormone resistance in 1989 and 1990.
The thyrotropin (TSH) receptor was cloned in 1989; studies since have
identified both loss of function and gain of function mutations in the
TSH receptor that account for specific types of hypothyroidism and
hyperthyroidism, respectively.
Review of Literature
28
The gene for the β subunit of TSH was then cloned, facilitating the
development of human recombinant TSH (rhTSH).
2.7 Anatomy
The normal adult thyroid gland consists of two lobes connected by an isthmus.
The normal gland is surrounded by a delicate fibrous capsule and weighs 15 to
25 g. The normal thyroid is attached loosely to neighboring structures, and the
fascial planes are distinct .Four parathyroid glands, which produce parathyroid
hormone, are located in the posterior region of each pole of the thyroid. The
recurrent laryngeal nerves traverse, the lateral borders of the thyroid gland and
must be identified during thyroid surgery to avoid, vocal cord paralysis.
2.8 Development
The thyroid gland develops from the floor of the primitive pharynx during the
third week of gestation. The gland migrates from the foramen caecum, at the
base of the tongue, along the thyroglossal duct to reach its final location in, the
neck. This feature accounts for the rare ectopic location of thyroid tissue at the
base of the tongue (lingual thyroid), as well as for the presence of thyroglossal
duct cysts along this developmental tract. Thyroid hormone synthesis normally
begins at about 11th week of gestation.
The mature thyroid gland contains numerous follicles composed of thyroid
follicular cells that surround secreted colloid, a proteinaceous fluid that contains
large amounts of thyroglobulin, the protein precursor of thyroid hormones
(Jameson and Weetman, 2005).
The thyroid gland stores T4 and T3 incorporated in thyroglobulin, and can
therefore secrete T4 and T3 more quickly than if they had to be synthesized.
2.9 Thyroid Regulation
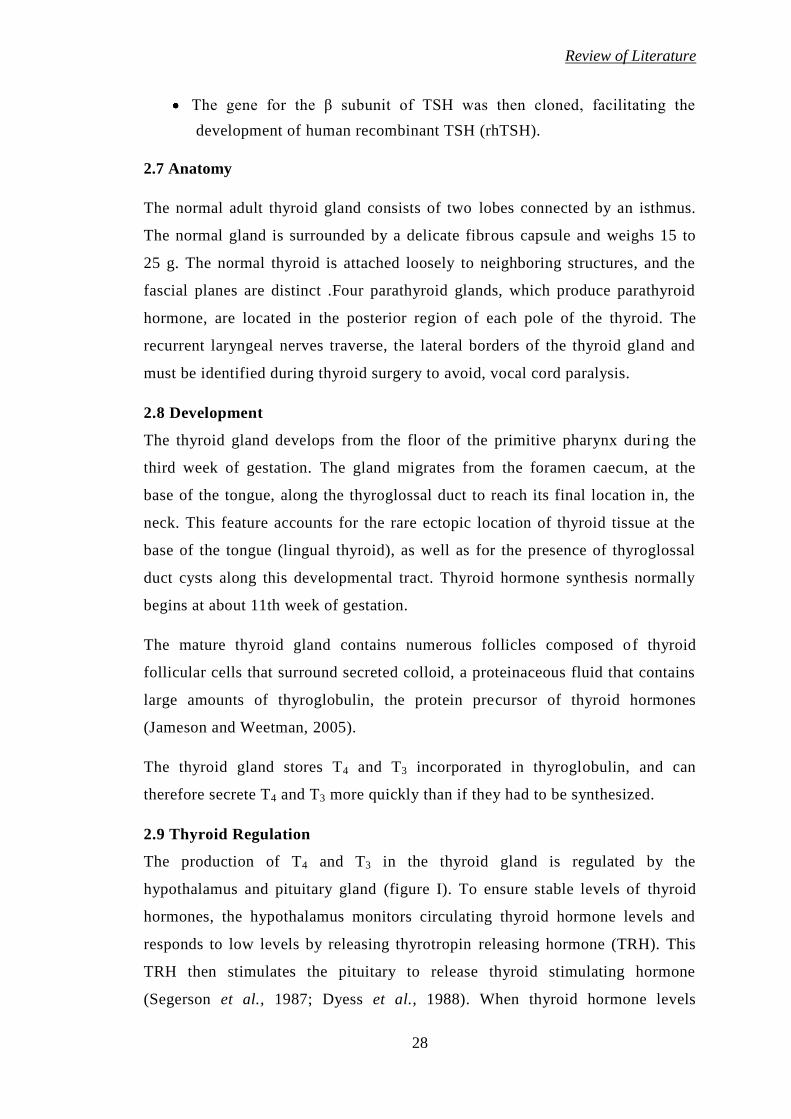
The production of T4 and T3 in the thyroid gland is regulated by the
hypothalamus and pituitary gland (figure I). To ensure stable levels of thyroid
hormones, the hypothalamus monitors circulating thyroid hormone levels and
responds to low levels by releasing thyrotropin releasing hormone (TRH). This
TRH then stimulates the pituitary to release thyroid stimulating hormone
(Segerson et al., 1987; Dyess et al., 1988). When thyroid hormone levels
Review of Literature
29
increase, production of TSH decreases, which in turn slows the release of new
hormone from the thyroid gland. Cold temperatures can also increase TRH
levels. This is thought to be an intrinsic mechanism that helps keep us warm in
cold weather (Arancibia et al.,1996).Elevated levels of cortisol, as seen during
stress and in conditions such as Cushing's syndrome, lowers TRH, TSH and
thyroid hormone levels as well (Tsigos and Chrousos, 2002; Roelfsema et al.,
2009).
The thyroid gland needs iodine and the amino acid L-tyrosine to make T4 and T3.
A diet deficient in iodine can limit how much T4 the thyroid gland can produce
and lead to hypothyroidism (Angermayr and Clar, 2004).T3 is the biologically
active form of thyroid hormone. The majority of T3 is produced in the peripheral
tissues by conversion of T4 to T3 by a selenium-dependent enzyme. Various
factors including nutrient deficiencies, drugs, and chemical toxicity may
interfere with conversion of T4 to T3 (Kelly, 2000).Another related enzyme
converts T4 to an inactive form of T3 called reverse T3 (rT3). Reverse T3 does not
have thyroid hormone activity; instead it blocks the thyroid hormone receptors in
the cell hindering action of regular T3 (Kohrle, 1996).
Figure I: Regulation of thyroid hormone
Review of Literature
30
Ninety-nine percent of circulating thyroid hormones are bound to carrier
proteins, rendering them metabolically inactive. The remaining "free" thyroid
hormone, the majority of which is T3, binds to and activates thyroid hormone
receptors, exerting biological activity (Nussey and Whitehead, 2001). Very small
changes in the amount of carrier proteins will affect the percentage of unbound
hormones. Oral contraceptives, pregnancy, and conventional female hormone
replacement therapy may increase thyroid carrier protein levels and, thereby,
lower the amount of free thyroid hormone available (Arafah, 2001).
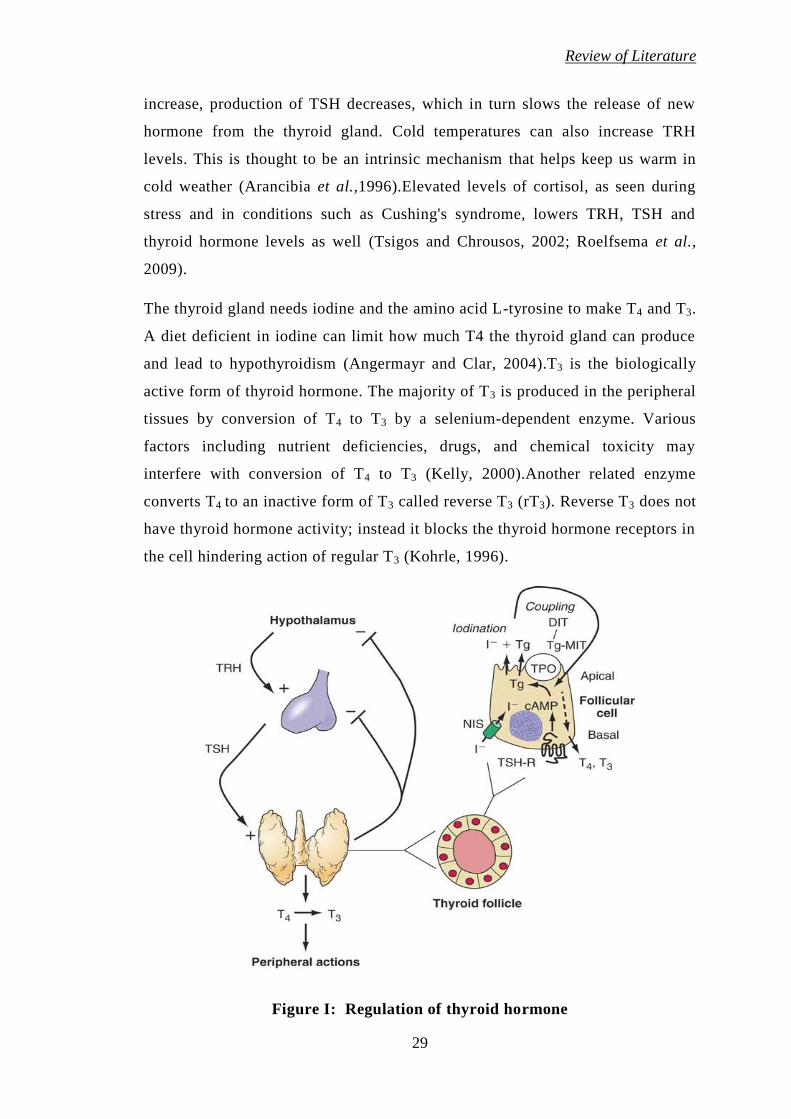
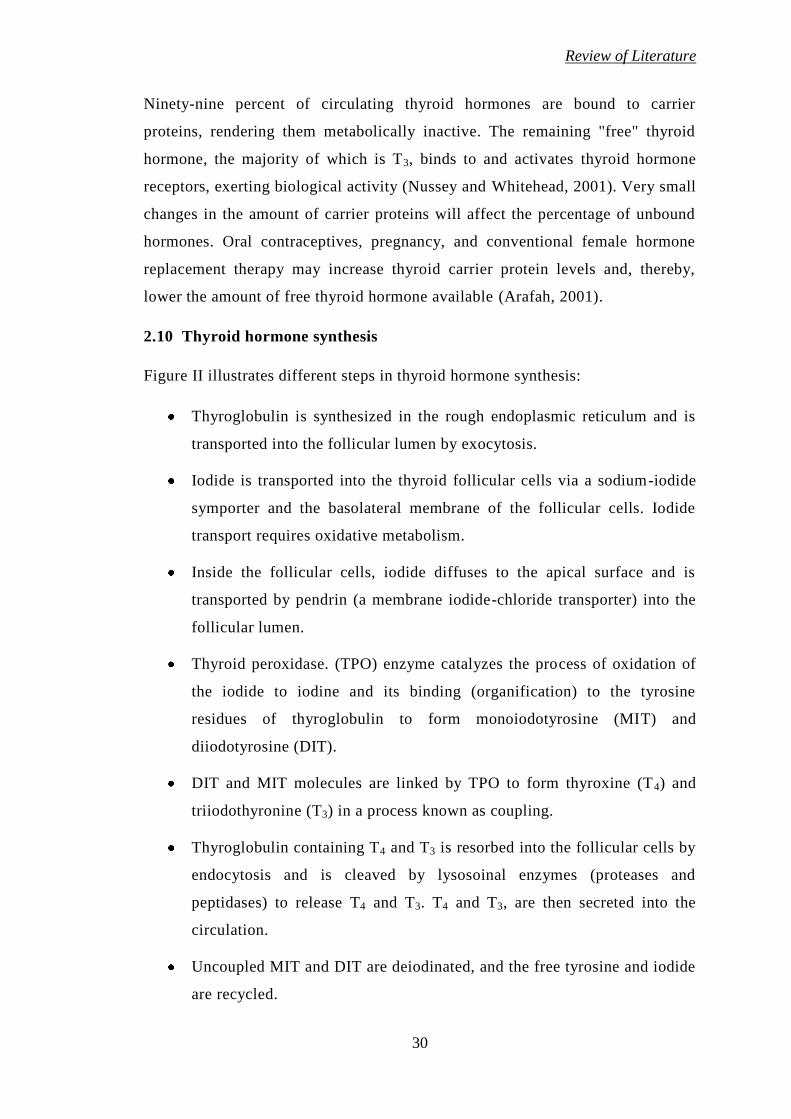
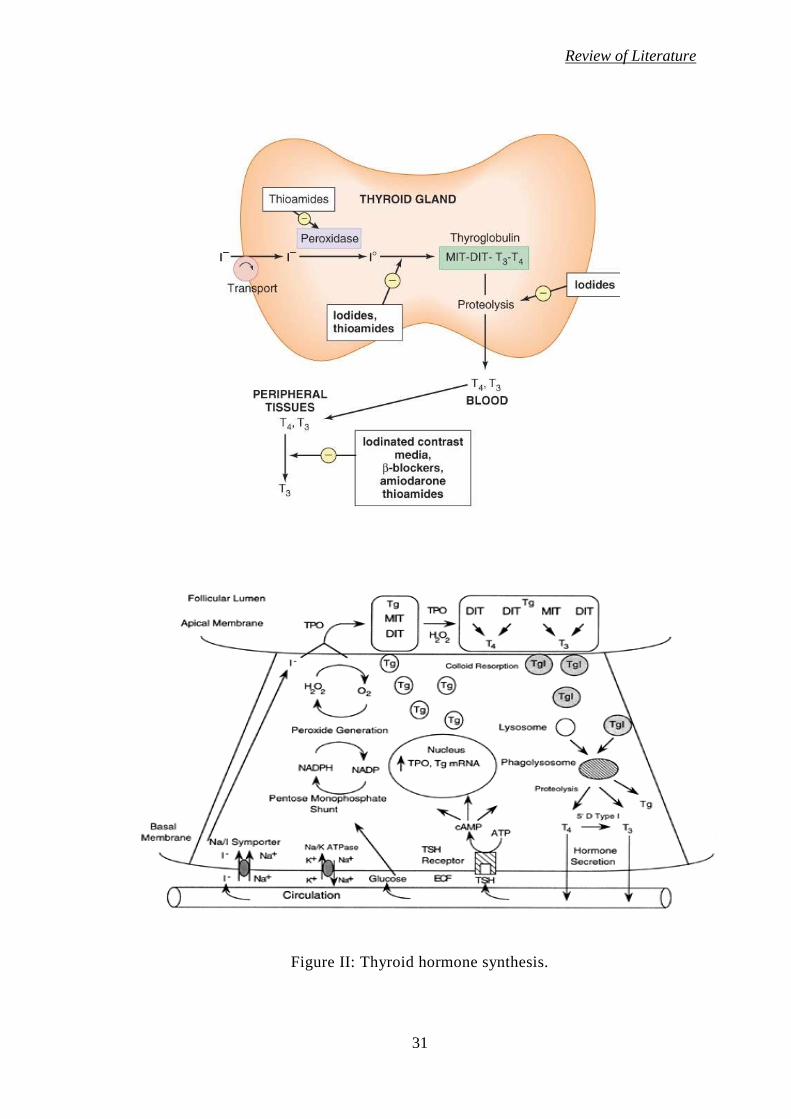
2.10 Thyroid hormone synthesis
Figure II illustrates different steps in thyroid hormone synthesis:
Thyroglobulin is synthesized in the rough endoplasmic reticulum and is
transported into the follicular lumen by exocytosis.
Iodide is transported into the thyroid follicular cells via a sodium-iodide
symporter and the basolateral membrane of the follicular cells. Iodide
transport requires oxidative metabolism.
Inside the follicular cells, iodide diffuses to the apical surface and is
transported by pendrin (a membrane iodide-chloride transporter) into the
follicular lumen.
Thyroid peroxidase. (TPO) enzyme catalyzes the process of oxidation of
the iodide to iodine and its binding (organification) to the tyrosine
residues of thyroglobulin to form monoiodotyrosine (MIT) and
diiodotyrosine (DIT).
DIT and MIT molecules are linked by TPO to form thyroxine (T4) and
triiodothyronine (T3) in a process known as coupling.
Thyroglobulin containing T4 and T3 is resorbed into the follicular cells by
endocytosis and is cleaved by lysosoinal enzymes (proteases and
peptidases) to release T4 and T3. T4 and T3, are then secreted into the
circulation.
Uncoupled MIT and DIT are deiodinated, and the free tyrosine and iodide
are recycled.
Review of Literature
31
Figure II: Thyroid hormone synthesis.
Review of Literature
32
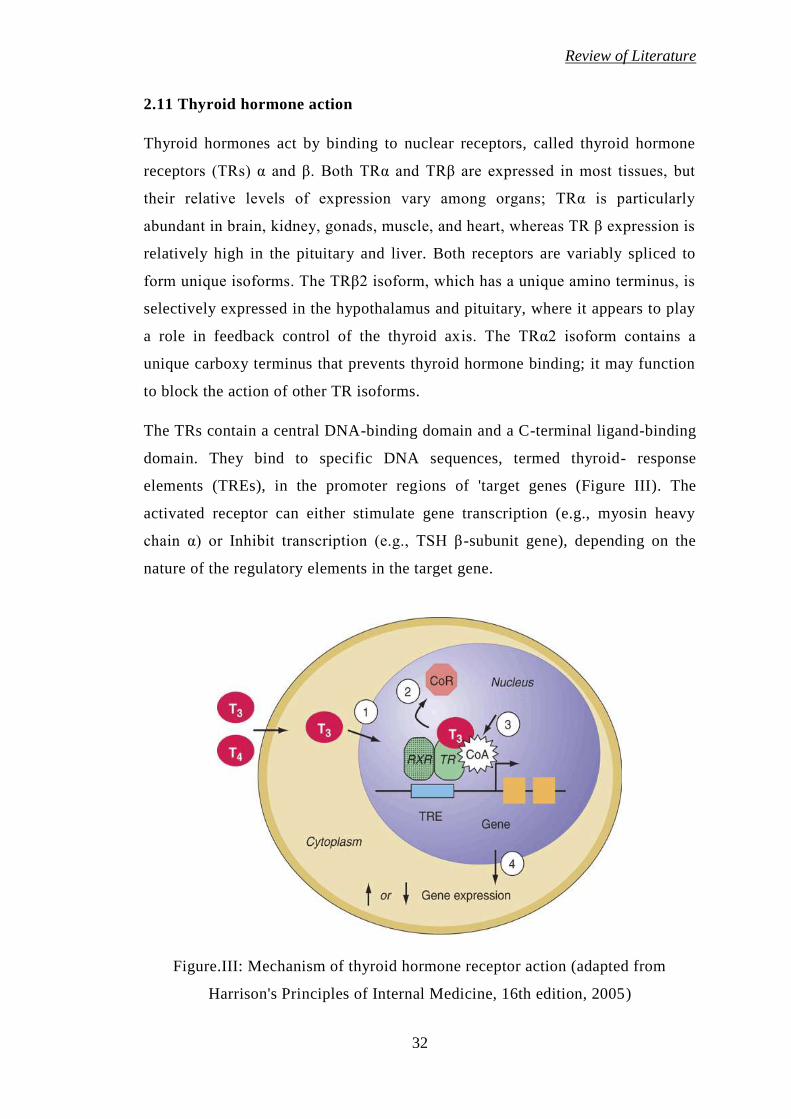
2.11 Thyroid hormone action
Thyroid hormones act by binding to nuclear receptors, called thyroid hormone
receptors (TRs) α and β. Both TRα and TRβ are expressed in most tissues, but
their relative levels of expression vary among organs; TRα is particularly
abundant in brain, kidney, gonads, muscle, and heart, whereas TR β expression is
relatively high in the pituitary and liver. Both receptors are variably spliced to
form unique isoforms. The TRβ2 isoform, which has a unique amino terminus, is
selectively expressed in the hypothalamus and pituitary, where it appears to play
a role in feedback control of the thyroid axis. The TRα2 isoform contains a
unique carboxy terminus that prevents thyroid hormone binding; it may function
to block the action of other TR isoforms.
The TRs contain a central DNA-binding domain and a C-terminal ligand-binding
domain. They bind to specific DNA sequences, termed thyroid- response
elements (TREs), in the promoter regions of 'target genes (Figure III). The
activated receptor can either stimulate gene transcription (e.g., myosin heavy
chain α) or Inhibit transcription (e.g., TSH β-subunit gene), depending on the
nature of the regulatory elements in the target gene.
Figure.III: Mechanism of thyroid hormone receptor action (adapted from
Harrison's Principles of Internal Medicine, 16th edition, 2005)
Review of Literature
33
Thyroid hormones bind with similar affinities to TRα and TRβ. However, T3 is
bound to its receptors with about 10 to 15 times greater affinity than T4, which
explains its increased hormonal potency. Though T4 is produced in excess of T3,
receptors are occupied mainly by T3 reflecting T4 to T3 conversion by peripheral
tissues, greater T3 bioavailability in the plasma, and receptors greater affinity for
T3. After binding to TRs, thyroid hormone induces conformational changes in the
receptors that modify its interactions with accessory -transcription factors. In the
absence of thyroid hormone binding, the aporeceptors bind to corepressor
proteins that inhibit gene transcription. Hormone binding dissociates the
corepressors and allows the recruitment of coactivators that enhance
transcription. The discovery of TR interactions with corepressors explains the
fact that TR silences gene expression in the absence of hormone binding.
Consequently, hormone deficiency has a profound effect on gene expression
because it causes active gene repression as well as loss of hormone-induced
stimulation. This concept has been corroborated by the finding that targeted
deletion of the TR genes in mice has a less pronounced phenotypic effect than
hormone deficiency (Jameson and Weetman, 2005).
2.12 Thyroid dysfunctions
There are mainly two types of thyroid dysfunction
1. Hypothyroidism
2. Hyperthyroidism
2.12.1 Hypothyroidism
Hypothyroidism is a clinical state due to the decreased secretion of thyroid
hormones viz., thyroxine (T4) and triiodothyronine (T3) or very rarely due to the
decreased action of these hormones at tissue levels. Hypothyroidism dating from
birth and resulting in developmental abnormalities is termed cretinism.
Hypothyroidism is found 1 in 4000 new born (Larsen et al., 2003).Acquired
impairment of thyroid function affects about 2% of adult women and about 0.1 to
0.2% of adult men. Sex ratio is variably described as 2:1 to 10:1 (Edward et al.,
1999; Irwin, 2005). It is reported that hypothyroidism affects 1 in every 100
Review of Literature
34
women at child bearing age. Although disease can occur at any age, most
patients present between 30-60 years (Hall and Scanlon, 1979).
2.12.1.1 Clinical manifestation of hypothyroidism
The clinical expression of thyroid harmone deficiency varies considerably
between individuals, depending on the cause, duration and severity of the
hypothyroid state. Virtually every organ system can be affected. The onset of
symptoms may be rapid or gradual; severity varies considerably and correlates
poorly with biochemical changes. The main clinical manifestation are as follows
2.12.1.1.1 Nervous system
Most of hypothyroid patients complain of fatigue, loss of energy, lethargy,
forgetfulness, reduced memory. Their level of physical activity decreases, and
they may speak and move slowly. Mental activity declines and there is
inattentiveness, decreased intellectual function, and sometimes may be
depression (Dugbartey,1998).
Neurological symptoms include also hearing loss, parasthesias, objective
neuropathy, particularly the carpal tunnel syndrome, ataxia (Frymoyer and
Bland, 1973).
2.12.1.1.2 Skin and Hair
Hypothyroidism results in dry, thick and silk skin, which is often cool and pale.
Glycosoamynoglicanes, mainly hyaluronic acid accumulate in skin and
subcutaneous tissues retaining sodium and water (Smith et al., 1981). So, there is
nonpitting edema of the hands, feet and periorbital regions (myxedema). Pitting
edema also may be present. The faces are puffy and features are coarse. Skin
may be orange due to accumulation of carotene. Hair may become course and
brittle, hair growth slows and hair loss may occur.
2.12.1.1.3 Cardiovascular system
There may be bradycardia, reduced cardiac output, quiet heart sounds, a flabby
myocardium, pericardial effusion, cardiac wall is thick. It is frequently suggested
that accelerated atherosclerosis occur in hypothyroidism (Cappola and
Ladenson,2003). Increased peripheral resistance may result in hypertension.
Review of Literature
35
Hypercholesterolaemia is common but whether or not there is an increased
prevalence of ischemic heart disease is controversial (Vanderpump et al., 1996).
Angina symptoms characteristically occur less often after the onset of
hypothyroidism, probably because of decreased activity (Levine, 1980).
2.12.1.1.4 Gastrointestinal system
Hypothyroidism does not cause obesity, but modest weight gain from fluid
retention and fat deposition often occurs. Gastrointestinal motility is decreased
leading to constipation and abdominal distension. Abdominal distension may be
caused by ascities as well and CEA levels are also increased (Depczynski et al.,
1996). Symptoms or signs of disturbed liver or exocrine pancreatic function are
usually not encountered, but chemical examination may suggest disease. Serum
enzymes are elevated (Saha and Maity, 2002). Achlorhydria occurs, often
associated with pernicious anemia.
2.12.1.1.5 Renal system
Reduced excretion of a water load may be associated with hyponatriemia (Hanna
and Scanlon, 1997). Renal blood flow and glomerular filtration rate are reduced,
but in some patients inappropriately high levels of serum vasopressin have been
demonstrated (Iwasaki et al., 1990). Serum creatinine is normal.
2.12.1.1.6 Respiratory system
Dyspnea is common. This complaint may be caused by enlargement of the
tongue and larynx, causing upper airway obstruction (Pelttari et al., 1994).
Myxedematous patients are more subjects to respiratory infections. Obstructive
sleep apnea has been documented in about 7% hypothyroid subjects and is
reversible with therapy (Orr et al., 1981).Hoarseness from vocal cord
enlargement often occurs.
2.12.1.1.7 Musculoskeletal system
Muscle symptoms like myalgia, muscle weakness, stiffness, cramps and easy
fatiguability are common in hypothyroid patients (Madariaga, 2002; Cakir et al.,
2003). Weakness in one or more muscles groups is present in 38% as evident
from manual muscle strength testing (Duyff et al., 2000). Objective myopathy
Review of Literature
36
and joint swelling or effusions are less often present. The relaxation phase of the
tendon reflexes is prolonged.
2.12.1.1.8 Hemopoetic system
In patients with moderate hypothyroidism a hypofibrinolytic state has been
found, which carries a risk of developing thrombosis (Chadarevian et al., 2001).
In contrast, patient with severe hypothyroidism have low levels of Von
Willebrand factor and activation of fibrinolyctic system. Hypothyroid patients
may have bleeding symptoms such as easy bruising, menorrhagia,or prolonged
bleeding after tooth extraction (Ford and Carter,1990).Anemia, usually
normocytic, caused by decreased red blood cell production, may occur. It is
probably from decreased need of peripheral oxygen delivery rather than
hematopoetic defect. Megaloblastic anemia suggests coexistent pernicious
anemia. Most patients have no evidence of iron, folic acid or cyancobalamin
deficiency.
2.12.1.1.9 Endocrine system
There may be menorrhagia, secondary amenorrhea, infertility and rarely
galactorrhea. Hyperprolactinemia occurs because of the absence of the inhibitory
effect of thyroid hormone on prolactin secretion and causes galactorrhea and
amenorrhea (Raber et al., 2003).
Pituitary-adrenal function is usually normal. Pituitary enlargement from
hyperplasia of the thyrotropes occurs rarely in patients with primary
hypothyroidism.
Enlargement of thyroid gland in young children with hypothyroidism suggests a
biosynthetic defect. Hypothyroidism in adults is caused by Hashimoto
thyroiditis.
Secretion of growth hormone is deficient because thyroid hormone is necessary
for synthesis of growth hormone. Growth and development of children are
retarded resulting in low serum IGF-1 concentration (Miell et al., 1993).
Review of Literature
37
2.12.1.1.10 Metabolic system
Hypothermia is common. Hyperlipidemia with increase of serum cholesterol and
triglyceride occurs because of reduced lipoprotein lipase activity (O’Brien et al.,
1997).
2.12.1.2 Subclinical (laboratory) hypothyroidism
It is a state in which we can't find clinical features of hypothyroidism and
euthyroidism is reached by compensatory increasing of TSH secretion and that's
why synthesis and secretion of such level of thyroid hormone will be enough for
organism. It is an asymptomatic state in which serum T3, T4, free T3 and free T4
are normal, but serum TSH is elevated. The therapy may provide the patient with
more energy, a feeling of well being, desirable weight reduction, improved
bowel function or other signs of better health even though the patient is not
aware of these symptoms before therapy.
2.12.2 Hyperthyroidism
When the thyroid gland becomes affected by disease, sometimes the production
or release of thyroxine and tri-iodothyronine can be abnormally high, leading to
increased levels in the blood; a state of thyroid overactivity known as
hyperthyroidism or thyrotoxicosis. If this happens, the body's metabolism speeds
up and this can be manifest by changes in various, and seemingly unrelated
tissues. In this state of hyperthyroidism, a blood test will show an elevated
amount of these thyroid hormones circulating. Conversely, the TSH level in the
blood almost always becomes suppressed, because the pituitary gland senses the
abnormally high levels of thyroid hormones, which are more than is needed by
the brain.
The prevalence of hyperthyroidism is about 1% and it is about six times more
common in women.
There are two main causes of hyperthyroidism:
1) Autoimmunity causing stimulation of the thyroid gland.
2) Overproduction of hormones by benign tumor in the thyroid gland.
Review of Literature
38
1) In autoimmune thyroid over activity, the thyroid cells are stimulated by an
abnormal antibody which is specifically targeted at the TSH-receptor on the
thyroid gland causing stimulation of the thyroid to produce excess hormones.
This also causes the thyroid cells to grow, and together with immune cells
congregating in the gland, this leads to thyroid enlargement, called goitre.
An early description of this form of autoimmune thyroid disease was made by an
Irish physician called Robert Graves, so it is often termed Graves' disease.
Graves' disease is almost always accompanied by the presence of the TSH-
receptor autoantibodies in the blood and very frequently by thyroid peroxidase
(TPO) autoantibodies which may both be a useful tool for diagnosis. In addition,
about a third of people with Graves' disease develop a variety of eye problems
including a staring appearance, grittiness and soreness, protruding eyeballs, and
(rarely) double vision or sight problems. This is termed "thyroid eye disease" or
"Graves' ophthalmopathy". Cigarette smoking increases the risk of developing
thyroid eye disease in patients with Graves' disease.
2) The other common cause of thyroid overactivity is that the thyroid develops
one or more benign tumours often simply called "nodules" that secrete excess
thyroid hormone in an unregulated manner. This nodular hyperthyroidism
becomes commoner with advancing age and is termed "solitary toxic nodule" or
"toxic multinodular goitre", depending on the number of nodules.
Together these two types of hyperthyroidism account for well over 90% of all
cases. Rarer causes include inflammatory conditions of the thyroid called
thyroiditis, which sometimes is the result of pregnancy, viruses 'or drugs such as
amiodarone or interferon. All the types of hyperthyroidism just mentioned are
usually classified as primary, meaning that they result from an excess stimulation
or release of thyroid hormone from the thyroid gland. Very rarely, there may be
secondary thyroid overactivity as a result of a pituitary problem where the
pituitary gland manufactures an excess amount of TSH. This leads to thyroid
overactivity with normal or high blood TSH.
2.12.2.1 Clinical manifestations of hyperthyroidism
The clinical presentation may be dramatic or subtle.
Review of Literature
39
2.12.2.1.1 Cardiovascular system
Dysfunction of the cardiovascular system is common, and in some instances, the
only manifestation of hyperthyroidism. Heart rate and cardiac output are
increased, and peripheral resistance is decreased (Klien and Ojamaa, 2001).
These changes result in:
- Constant palpitation
- Sinus tachycardia or atrial fibrillation
- Heart failure
O’Malley et al. (1986) reported a case that presented solely as heart failure
before the more classic manifestation of hyperthyroidism appeared.
2.12.2.1.2 Neuromuscular symptoms
Thyrotoxic periodic paralysis is another rare complication of hyperthyroidism. It
is seen mainly in Asian men between 20 and 40 years of age, with a male/ female
ratio of approximately 20:1, despite the higher incidence of hyperthyroidism in
women. Thyrotoxic periodic paralysis is a reversible disorder characterized by
acute muscle weakness and hypokalemia. The attacks of periodic paralysis are
precipitated by hypokalemia that is caused by a transcellular shift rather than
total body depletion of potassium. Attacks often are preceded by symptoms of
muscle weakness and cramps (Lin,2005).
Also a fine tremor is often evident in the hands and fingers and performance of
skills requiring fine coordination becomes difficult.
2.12.2.1.3 Skin
The skin is warm, fine, moist and its texture is smooth or velvety erythema and
pruritus may be present (Heymann,1992). Increased sweating is common
complaint. Hair may become thin and fine, and alopecia occurs. Infiltrative
dermopathy, also known as pretibial mixedema is characterized by nonpitting
infiltration of proteinaceous ground substance, usually in the pretibial area. The
lesion is very pruritic and erythematous in its early stages and subsequently
becomes browny (Collet et al., 1995).
Review of Literature
40
2.12.2.1.4 Eyes
Eye sings include:
- Stare (Schtelvag's symptom)
- Lid lag
- Lid retraction
which results in "apparent" proptosis, (Shah,2011)and is often accompanied by
symptoms of:
- Conjunctival irritation.
These eye signs are largely due to excessive adrenergic stimulation
2.12.2.1.5 Respiratory function
Abnormalities of respiration include:
- Decreased vital capacity;
- Decreased pulmonary compliance.
This result in dyspnoea and hyperventilation during exercise and sometimes at
rest (Ayres et al.,1982).
2.12.2.1.6 Gastrointestinal system
Increased caloric utilization is almost always present. It results in increased
appetite and food intake, but compensation is usually inadequate.
Increased gastrointestinal motility may result in increased frequency of bowel
movements and even frank diarrhea (Miller, 2003).
Minor abnormalities in hepatic function are often found.
2.12.2.1.7 Hematopoetic system
Some patients have a modest anemia, caused by mild deficiency in one or more
hematopoetic nutrients or increased plasma volume. Mild granulocytopenia and
thrombocytopenia may be present (Nightingale et al., 1978).
Review of Literature
41
2.12.2.1.8 Endocrine system
In women, hypomenorrhea or amenorrhea may occur, although no changes are
noted (Koutras, 1997). In men, there may be loss of libido, gynecomastia and
erectile dysfunction may occur (Carani et al., 2005).
2.12.2.2 Sub clinical hyperthyroidism
Subclinical hyperthyroidism is defined as persistently suppressed serum TSH
with normal thyroxine and triiodothyronine in patients who do not have
symptoms. While the diagnostic criteria and treatment modalities for overt
hyperthyroidism are well known
2.13 Studies on type 1 diabetes and thyroid dysfunction
Fuji et al. (1981) investigated thyroid hormone abnormalities in serum in 47
patients with diabetes mellitus and reported that no significant differences in T4
but significantly higher reverse T3 (rT3) and lower T3 levels were found between
diabetics and healthy controls. Moreover, patients in diabetic ketoacidosis
showed markedly high rT3 with low T3 levels. They found that with insulin
treatment, these levels returned to normal in several days.
Gray et al. (1981) investigated clinical features of diabetics with coexisting
Graves' disease, or primary hypothyroidism and found that those with Graves’
disease developed thyroid dysfunction and diabetes at an earlier age than patients
with primary hypothyroidism. There was, however, no difference between the
two groups in respect of sex ratio or proportion of subjects requiring insulin
treatment. They found a strong correlation between age at diagnosis of diabetes
and that of hyperthyroidism or hypothyroidism.
Bagchi (1982) found several alterations in thyroid function in diabetes mellitus.
The most profound changes occur in patients with insulin-dependent diabetes.
Plasma T4 is normal, plasma T3 is diminished, and the plasma level of rT3 is
elevated in diabetic ketoacidosis or in patients with severely uncontrolled
diabetes. They suggested that these changes arise from alterations in the
monodeiodination pathways of T4 and both hypo- and hyperthyroidism occur
Review of Literature
42
with increased frequency in diabetes. Also there is an increased prevalence of
thyroid autoantibodies in insulin-dependent diabetes.
Cardoso et al. (1995) determined thyroid function and the prevalence of thyroid
autoimmunity in IDDM Africans and the results were compared with those of a
non diabetic group and a group with non-insulin dependent diabetes mellitus
(NIDDM). Thyroid hormone levels were significantly lower in IDDM patients
than in the control population and the NIDDM population. Subclinical
hypothyroidism was present in 21 % of the 28 IDDM patients, whereas one
patient was hypothyroid and another hyperthyroid. Of the 60 NIDDM patients, 5
(8.3%) had subclinical hypothyroidism. Forty-six percent of the IDDM patients
had significant levels of serum thyroid autoantibodies (TAAB). This was
significantly higher than the 1.4% and 1.7%, respectively in the controls and
NIDDMs. Presence of TAAB in the patients was strongly associated with thyroid
dysfunction, female preponderance, and duration of diabetes mellitus.
Lorini et al. (1996) assessed Th-Ab thyroid autoantibodies (MsA and TgA)
cross-sectionally in 212 children and adolescents (93 girls and 119 boys) aged
1.2-21 years with IDDM from 0-18 years, and longitudinally in 90/212 (43 girls
and 47 boys) at diagnosis and during a 3-10 year follow-up. In the cross-
sectional study, they found that Th-AAb were present in 22/93 girls (23.7%) and
13/119 boys (10.9%). In the longitudinal study Th-AAb were observed at
diagnosis in 6 patients, and during the follow-up in 9 girls. In 11/15 Th-AAb
positive patient’s anti-nuclear antibodies were also present. Thyrotoxicosis also
occurs with increased frequency in diabetic children than in the general
population.
Chang et al. (1998) in their study among 243 type 1 diabetic patients found, 53
(21.8%) were positive for antiTPO. Among the type 1 diabetic patients with
thyroid autoimmunity, anti-TPO tended to occur in those of older age or with
long-standing disease. The frequency of anti-GAD was 45.6% (99 of 217),
without gender preponderance (males: females, 18.0% vs 27.6%).Thus they
reported that the presence of anti-TPO in 21.8% of type 1 diabetic patients
confirmed the strong association of ATD and type 1 diabetes mellitus without
ethnic differences.
Review of Literature
43
Maugendre et al. (2000) during their study showed that thyroperoxidase (TPO)
antibodies were present in 45 of the 258 diabetic patients (17%) whereas
thyroglobulin (Tg) antibodies were found in 19 patients (7%), including 13 cases
with TPO antibodies. They found that prevalence of TPO antibodies were not
influenced by such factors as gender, duration of disease, age at screening and at
diabetes diagnosis, positivity of familial history. Thyroglobulin (Tg) antibodies
were found in 19 patients (7%), including 13 cases with TPO antibodies. All
patients without TPO antibody (n=213), including Tg-positive patients displayed
TSH values in normal range. From the 45 TPO-positive patients they studied, 11
shows thyroid dysfunction. During their 5-year follow-up, only 2/45 patients
became anti-TPO negative whereas thirteen of the 45 patients developed
subclinical or clinical thyroid diseases (4 Graves'disease and 9 thyroiditis with
hypothyroidism).
Rattarasarn et al. (2000) in their study of 50 Thai type 1 diabetic patients found
that thyroglobulin (Tg-Ab) and thyroproxidase antibodies (TPO-Ab) were
positive in nine (18%) and 15 (30%) patients respectively whereas eight patients
(16%) were positive for both antibodies. None of 34 patients without thyroid
antibodies had thyroid dysfunction. They followed up eight patients with
positive thyroid antibodies but without clinical thyroid dysfunction and 21
patients without thyroid antibodies for up to 3 years and found that two patients
of the first group developed hypothyroidism, whereas none of the latter
developed thyroid dysfunction.
Kordonouri et al. (2002) in their multi center survey of 118 pediatric diabetic
center in Germany and Austria reported the results of 7097 type1 diabetic
patients and found that in 1,530 patients, thyroid antibody levels were elevated
on at least one occasion, whereas 5,567 were antibody-negative during the
observation period. Thyroid-stimulating hormone (TSH) levels were higher in
patients with thyroid autoimmunity (3.34 pU/ml, range 0.0-615.0 pU/ml) than in
control subjects (1.84.pU/ml, range 0.0-149.0 pU/ml) (P < 0.001). Even higher
TSH levels were observed in patients with both anti-TPO and anti-TG (4.55
uU/ml, range 0.0-197.0 pU/ml).Thus they found that thyroid autoimmunity
seems to be particularly common in girls with diabetes during the second decade
Review of Literature
44
of life and may be associated with elevated TSH levels, indicating subclinical
hypothyroidism.
Radaideh et al. (2003) investigated the prevalence of thyroid dysfunction and
autoimmunity in 79 type 1 diabetic patients and compared with normal control.
They found a significant difference in thyroid function variables between
diabetics and controls. Among type 1 diabetic patients, 7 (9.2%) had thyroid
autoantibodies, 5 with positive TPOAb only and 2 with positive TgAb, compared
with 8 (6.3%) in the control group, 4 with positive TPOAb only and 4 with
positive TgAb.
Umpierrez et al. (2003) in cross sectional studies have reported that risk of
thyroid dysfunction in patients with type 1 diabetes is Two to Three fold higher
then in general population They analyzed the incidence of thyroid dysfunction
over time in a cohort of 58 patients (26 men and 32 women) and prospectively
followed them for 18 years and reported that 18 patients had hypothyroidism,
and 1 patient experienced transient hyperthyroidism. They found that
hypothyroidism was more common in female (41 %) than in male (19%) subjects
and in patients with positive TPO antibodies. Patients who were TPO positive
were 17.91 times as likely to develop hypothyroidism as patients who were TPO
negative (95% CI 3.89-82.54). There were no differences in BMI, lipid profile,
and HbA (lc) between patients with and without thyroid dysfunction.
Shomon (2003) has confirmed the linkage between autoimmune thyroid disease
and type 1 diabetes, suggesting that diabetic patients should receive regular
screening for thyroid dysfunction.
Hawa et al. (2006) in their study evaluated disease-associated autoantibodies in
both type 1 diabetes and thyrotoxicosis attending the Central Hospital of
Yaounde in Cameroon. They collected samples from a total of 101 subjects, 47
of whom clinically had established type 1 diabetes, 18 had thyrotoxicosis and 36
normal subjects and tested for diabetes-associated glutamic acid decarboxylase
(GAD) and tyrosine phosphatase (IA2) autoantibodies, thyroiditis-associated
thyroglobulin (Tg) and thyroid peroxidase (TPO) autoantibodies .They reported
that out of 47 patients with type 1 diabetes, 16 (34%) had GAD autoantibodies
(Abs), 3 (6.4%) had IA2 Abs, and 2 (4.3%) had TPO Abs. Out of 18 patients
Review of Literature
45
with thyrotoxicosis 4 (22.2%) had GAD Abs, 5 (27.8%) showed IA2 Abs, while
8 patients (44.4%) were TPO Abs positive. No patients in either group had Tg
Abs. Among normal subjects, 2 (5.6%) showed GAD Abs, and one of these was
also IA2 Abs positive, but none had thyroid autoantibodies.
Volzke et al. (2007) studied the spectrum of thyroid disorders in 224 adult type 1
diabetic subjects and compared them with results obtained from a sample of
3481 general adult population. They concluded that type 1 diabetic subjects had
a higher risk of known thyroid disease, a lower risk of goiter and nodules and a
higher risk of anti-TPO-Ab >200 IU/mL compared to the reference population.
Furthermore, diabetic subjects had lower serum FT3 levels than the non-diabetic
references.
Araujo et al. (2008) investigated the prevalence of thyroid autoantibodies in 214
children, adolescents, and young adult with type1 diabetes from north eastern
Brazil as well as their significance for the development of thyroid disorder. They
found that anti-TPO antibody test was positive in 54 out of the 214 patients
studied, resulting in an overall prevalence of 25.2%,with females were
predominance (72%) over males (28%). A total of 55.5% patients with positive
anti-TPO antibodies had abnormal TSH levels.
Korner et al. (2008) investigate the prevalence of thyroid autoimmunity as well
as the frequency of autoimmune thyroid disease in patients with type 1 diabetes
mellitus and compared the prevalence of autoimmune thyroid disease in patients
with type 1 diabetes mellitus and in those with type 1 diabetes mellitus and
celiac disease. Their results concluded that frequency of autoantibody positivity
was significantly higher in diabetic patients suffering from celiac disease (type 1
diabetes mellitus: 43 (16%), type 1 diabetes mellitus + celiac disease: 16 (33.3%,
p < 0.01). Hypothyroidism due to thyroiditis was also more prevalent in patients
with type 1 diabetes mellitus and celiac disease.
Monajemzadeh et al. (2009) investigated the prevalence of thyroid dysfunction
among children and adolescents with newly diagnosed type 1 diabetes in Iran for
which they had compared 75 newly diagnoset type1 diabetic subjects with 105
healthy control children. They reported the prevalence of thyroid dysfunction in
Review of Literature
46
diabetics was 14.6% (9.3% were subclinical hypothyroidism, 4% hypothyroidism
and 1.3% subclinical hyperthyroidism) which were higher than normal controls.
Muralidhara Krishna et al. (2011) evaluates the levels of TSH, TmAb and lipid
parameters in 36 type l diabetes cases and found that TSH was significantly
elevated in cases and TmAb was identified in 7 of the 36 cases studied. Presence
of TmAb and elevation in TSH were more pronounced in female cases. They also
reported that serum total cholesterol as well as LDL- cholesterol levels were
significantly elevated and serum HDL-cholesterol was significantly lowered in
type 1 diabetics.
Joshap et al. (2011) assessed thyroid function at the diagnosis of type 1 diabetes
and reported that 21/110 (19.0%) patients had abnormal thyroid function at
diagnosis of TIDM. They found that abnormalities of thyroid function occurred
more commonly in children with diabetic ketoacidosis (DKA) than those who did
not have DKA( 31.0% vs. 14.8%,).
2.14 Studies on type 2 diabetes and thyroid dysfunction
Bazrafshan et al. (2000) in their study of 210 type 2 diabetics assessed the
relationship between thyroid dysfunction and NIDDM. They observed disorders
included goiter (30%), sub-clinical hypothyroidism 13%), clinical
hypothyroidism (4%), and clinical hyperthyroidism (0.5%). They divided the
patients into two groups according to HbA lc: Group 1 with HbA1c<8 and group
II with HbA1c≥8 and found that a significant difference was observed in TSH
serum concentration between group I and II whereas the concentration of T4 and
T3 were not significantly different between the two groups. The mean
concentration of HbAlc in patients with hypothyroidism was significantly higher
than those that of non-hypothyroid subjects. A significant positive correlation
was observed between HbA1c concentration and TSH levels by them
Bal et al. (2003) studied 184 cases of DM-II without known clinical thyroid
disease for assessing the thyroid dysfunction and tried to correlate it with
complications of DM-II. They found that thyroid diseases were present in 78
(40.4%) cases (50 males, 28 females), but auto-immune thyroidits were present
in 32 (17.4%) cases (8 males, 24 females). There was positive correlation with
Review of Literature
47
age of patient in TD group but no correlation was found with complication of
diabetes.
Radaideh et al. (2004) investigated the prevalence of thyroid dysfunction and
autoimmunity in 908 type 2 diabetic patients and compared with 304 non-
diabetics, of those 282 had performed thyroid antibodies. They reported the
overall prevalence of thyroid disease to be 12.5%out of which fifty-three (5.9%)
of diabetic patients were known to have thyroid disease and fifty- nine(6.6%)
new thyroid disease cases were diagonsed with most common cases were of
subclinical hypothyroidism (4.1 %). In the control group, the prevalence of
thyroid disease was 6.6% with most common cases were also of subclinical
hypothyroidism (5%). Positive TPOab was found in 8.3%. of T2DM patients
(N=600) versus 10.3% in the control group (N=282) Positivity for both TPOab
and Tgab was found to be 2.5% of T2DM versus 6% of the control subjects
Pimenta et al. (2005) evaluated thyroid function and morphology in all diabetic
outpatients and reported that the diabetic patients (n= 256) differed from controls
(n= 75) by presenting a greater frequency of thyroid disorders (51.6% vs. 38.7%;
P<0.05). In diabetic patients with thyroid disorders there were a higher
frequency of women. Thus they suggested thyroid evaluations in all diabetic
patients
Akbar et al. (2006) investigated the association between thyroid dysfunction and
thyroid autoimmunity in 100 Saudi type 2 diabetics 100 age- and sex-matched
controls. They reported that GAD65ab were found in 26% diabetics and 2%
controls, thyroid autoimmunity were detected in 10% diabetics vs. 5% controls
while thyroid dysfunction was found in 16% and 7% respectively. In GAD65ab-
positive diabetics, thyroid autoimmunity was observed in 27% vs. 4% GAD65ab-
negative diabetics and thyroid dysfunction was reported in 42% and 7%
respectively.
Udiong et al. (2007) determine the incidence of abnormal thyroid hormone
levels in diabetics in Calabar, Nigeria for which they selected 161 diabetic
subjects and 105 non-diabetic controls. The reported TSH levels (1.80 ± 1.62) in
diabetics were significantly lower (p=0.016) than the level in non-diabetic
controls (2.34 ± 1.24). Male diabetics had lower (p < 0.05) levels of TSH (1.192
Review of Literature
48
± 0.68 miu/ml) than diabetic females (1.90 ± 1.70 mlu/ml). The level of T3 in
diabetic males (125 ± 97 ng/ml) was higher than the level in females (98 ± 75
ng/dl).They reported a high incidence (46.5%) of abnormal thyroid hormone
levels among the diabetics in Nigeria (hypothyroidism 26.6%, hyperthyroidism,
19.9%) with prevalence of hypothyroidism was higher in women (16.8%) than in
men (9.9%), while hyperthyroidism was higher in males (11%) than in females
(8%).
Pashupati et al. (2008) investigated the effect of diabetes mellitus on thyroid
hormone levels and other biochemical variables. They reported significant
increase in the levels of blood glucose, HbA1C, serum cholesterol, triglyceride,
low-density lipoprotein (LDL-C), very low-density lipoprotein (VLDL-C), urea,
creatinine, and microalbuminurea were observed in diabetic patients compared to
non-diabetic subjects whereas the levels of total protein, albumin, and high-
density lipoprotein (HDL-C) were significantly decreased in diabetics. Moreover
the level of TSH was significantly decreased whereas the levels of T4 and FT4,
were significantly increased in diabetic patients compared to control subjects.
However, the T3 and FT3 levels did not differ significantly between groups.
They reported 28% had low plasma thyroid hormone levels, 17% had high
thyroid hormone, and 55% had euthyroid levels.
Islam et al. (2008) investigated thyroid hormone levels in fifty-two uncontrolled
diabetic patients and fifty controls subjects. They reported patients with type 2
diabetes had significantly lower serum FT3 levels compared to the control group
but no significant differences observed in serum FT4 and TSH levels between the
control and study subjects.
Alwazzan et al. (2010) conducted a study to examine the prevalence and
associated factors of the most frequent thyroid dysfunction among type 2
diabetic patients in Quwait and reported that the prevalence rate of thyroid
dysfunction in type 2 diabetic patients was 12.9%, the most common was
subclinical hypothyroidism (45.1%).
Papazafiropoulou et al. (2010) determined the prevalence of thyroid
dysfunction in 1092 patients with type 2 diabetes (T2D) and reported the
prevalence rate of thyroid dysfunction as 12.3% with women more frequently
Review of Literature
49
affected then men. They also found that patients with thyroid dysfunction had
higher values of body mass index and HDL-cholesterol levels, and lower values
of LDL-cholesterol levels in comparison with patients without thyroid
dysfunction cholesterol concentrations.
Shaikh et al. (2010) evaluate the frequency of hypothyroidism in patients of type
2 diabetes mellitus for which they selected 60 type2 diabetic patients and 60
healthy controls. They reported that in diabetic population 7(11.66%) patients
were of sub-clinical hypothyroidism and 21(35%) patients were hypothyroid.
Diez et al. (2011) assessed the prevalence of thyroid dysfunction in patients with
type 2 diabetes and reported that total thyroid dysfunction was present in 32.4%
and newly diagnosed thyroid dysfunction was present in 9.7%. They found no
significant relationship between the present of thyroid dysfunction and duration
of diabetes HbA1c levels and presents of diabetic complications.
2.15 Lipids abnormalities in diabetes
Diabetic dyslipidemia is characterised by:
High triglyceride concentrations, particularly post-prandially (post-prandial
lipaemia)
Low high density lipoprotein-cholestrol (HDL concentrations
Increased low density lipoprotein cholesterol (LDL-c) concentrations
Although treated type 1 diabetes is not characterised by these lipid
abnormalities (Valabhji et al., 2001). Many features of' diabetic dyslipidaemia
can be explained by reduced action of insulin at the tissue level. This could be
due to insulin resistance, although relative insulin deficiency associated with
pancreatic beta-cell dysfunction also contributes (DeFronzo, 1988). Some
features of diabetic dyslipidaemia, however, may not be due to insulin
resistance.
2.15.1 Epidemiology of diabetic dyslipidemia
In the Framingham Heart Study (Kannel, 1985), the prevalence of high plasma
triglyceride levels (defined as values above the corresponding 90th
percentile for
Review of Literature
50
the US population) in individuals with diabetes mellitus (19% in amen and 17%
in. women) was significantly higher than in those without diabetes mellitus (9%
of men and 8% of women.). Similarly the prevalence of low HDL-cholesterol
level (defined as a value below the 10th
percentile for the US population) in those
with diabetes mellitus was almost twice as high as the prevalence in non diabetic
individuals (21% versus 12% in men and. 25% versus 10% in women,
respectively) in the above study.
The increased total plasma cholesterol levels (13% of men and 24% of women)
in diabetic individuals is comparable with non diabetic individuals (14% of men
and 21% of women) in the above mentioned study. The prevalence of high LDL-
cholesterol levels in men and women with diabetes mellitus (9% and 15%,
respectively) did not differ significantly from the rates in non diabetic men and
women (11% and 16%, respectively).
Thus, both men and women with diabetes had an increased prevalence of
hypertrigyceridemia and low HDL-cholesterol levels, but their total cholesterol
and. LDL-cholesterol levels did not differ from those in non-diabetic
counterparts.
A similar pattern of altered plasma lipid profiles was observed in the UK
Prospective Diabetes Study (UKPDS, 1997). In this study, women with type 2
DM had markedly higher LDL-cholesterol levels than women who were not
diabetic. The plasma triglyceride levels of patients with type 2 DM were
substantially increased, whereas HDL-cholesterol levels were markedly reduced
in both men and women with diabetes mellitus compared with the non diabetic
controls. Total cholesterol levels of those with diabetes mellitus and control
individuals did not differ.
2.15.2 Pathophysiology of diabetic dyslipidemia
The pathophysiology of underlying diabetic dyslipidemia is closely linked to
insulin resistance, which in turn leads to increased release of fatty acid from
adipose tissue (Taskinen, 2003; Krauss and Siri, 2004; Chahil and Ginsberg,
2006). Increased plasma levels of fatty acids increase production of VLDL, TG
and cholesterol by the liver. Increased plasma TG levels are then the “driving
Review of Literature
51
force” for low HDL C and abnormal, small dense LDL. Insulin resistance fat
cells first undergo breakdown of their stored triglycerides and greater release of
free fatty acids into the circulation. Increased fatty acids in the plasma lead to
increase fatty acid uptake by the liver. The liver takes those fatty acids and
synthesizes them into triglycerides. The presence of increased triglycerides
stimulates the assembly and secretion of the apolipoprotein (apo) B and very low
density lipoprotein (Goldberg, 2001). The impaired ability of insulin to inhibit
free fatty acid release leads to enhanced hepatic VLDL-cholesterol production
(Frayn, 2001), which correlates with the degree of hepatic fat accumulation
(Adiels et al., 2007).The result is an increased number of VLDL particles and
increased levels of triglycerides in the plasma, which leads to the rest of the
diabetic dyslipidemic picture. In the presence of increased VLDL in the plasma
and normal levels of activity of the plasma protein cholesterol ester transfer
protein (CETP), VLDL triglycerides can be exchanged for HDL-cholesterol.
That is, a VLDL particle will give up a molecules of triglycerides, donating it to
the HDL, in return for one of the cholesterol ester molecules from HDL (Hayek
et al., 1993). This leads to two outcomes: a cholesterol-rich VLDL remnant
particle that is atherogenic, and a triglycerides-rich cholesterol-depleted HDL
Particle. Triglyceride-rich HDL particles are converted by the triglycerides lipase
activity of hepatic lipase into smaller particles which are better substrates for
catabolic pathways (Patsch et al., 1984). In the insulin resistant
hypertriglyceridaemic state, HDL particle therefore tend to be small and dense
and so more likely to undergo catabolism, so that HDL particle numbers and
HDL-c concentrations are reduced.
The increased concentration of small dense LDL-cholesterol particles is
explained by a similar lipid exchange. Increased levels of VLDL-transported
triglyceride enable CETP to promote the transfer of triglyceride into LDL in
exchange for LDL-transported cholesteryl ester. The triglyceride-rich LDL
undergoes hydrolysis by hepatic lipase or lipoprotein lipase, which results in
lipid-depleted small dense LDL particles.
2.16 Renal abnormalities in diabetes
Diabetic nephropathy is a syndrome of albuminuria, declining glomerular
filtration rate (GFR), arterial hypertension and increased cardiovascular risk that
Review of Literature
52
affect 20-40% of type 1 and type 2 diabetic patients (Parving et al., 1996;
Ruggenenti and Remuzzi, 1998; Ritz and Orth, 1999). Diabetes mostly type 2 ,
account for about one third of the patients requiring chronic renal replacements
therapy in western countries.Type 2 diabetes with end stage renal disease
(ESRD) are rapidly increasing because of the continuing increase in the
prevalence of type 2 diabetes. Racial difference in the prevalence of diabetic
renal disease has been reported. Asian subjects have significantly higher
prevalence (52.6%) of diabetic ESRD when compared with Caucasians (36.4%)
(Young et al., 2003).Migrant Asian Indians had 40 times greater risk of
developing ESRD when compared with the caucasians (Chandie Shaw et al.,
2002). The prevalence of diabetic nephropathy in type 2 diabetic subjects is
reported to be 5-9% from various Indian studies (Chugh et al., 1989; John et al.,
1991).
2.16.1 Pathophysiology
There are three major histologic changes occur in the glomerular in diabetic
nephropathy. These are:-
1. Mesangial expansion which is directly induced by hyperglycemia, perhaps
via increased matrix production or glycosylation of matrix proteins.
2. Glomerular basement membrane thickening occur.
3. Glomerular sclerosis which is caused by intraglomerular hypertension.
Diabetes produces qualitative and quantitative changes in the composition of
capillary basement membrane and this altered material undergoes accelerated
glycosylation and further rearrangement to from advanced glycosylation end
products (AGE), which stimulate protein synthesis (Doi et al., 1992), further
decreases degradability of basement membrane (Brownlee et al., 1988), increase
its permeability (Esposito et al., 1989) and causes endothelial dysfunction
(Bucala et al., 1991).
2.16.2 Etiology
The exact cause of diabetic nephropathy is unknown, but various postulated
mechanisms are hyperglycemia, advanced glycosylation products and activation
of cytokines.
Review of Literature
53
Hyperglycemia increase the expression of transforming growth factor beta (TGF-
β) in the glomeruli and of matrix protein specifically stimulated by cytokine.
TGF-β and vascular endothelial growth factor (VEGF) may contribute to the
cellular hypertrophy, enhanced collagen synthesis and vascular changes observed
in person with diabetic nephropathy (Chiarelli et al., 2009; Rask-Madsen and
King, 2010). Hyperglycemia also activates protein kinase C which may
contribute to renal disease and other vascular complication of diabetes.
Familiar factor may play a role in the development of diabetic nephropathy.
Certain ethnic groups, particularly American blacks, Hispanics and Native
American may be particularly predisposed to renal involvement or complication
of diabetes.
Some evidence has suggested that polymorphism in gene for angiotensin-
converting enzyme (ACE) contribute in either predisposing to nephropathy or
accelerating its cause.
2.17 Liver abnormalities in diabetes
Diabetes mellitus is known to be associated with a number of liver disorders
(Adami et al., 1996; Caldwell et al., 1999; Trombetta et al., 2005). These include
Isolated elevation of liver enzyme levels.
Non alcoholic fatty liver disease (NAFLD).
Chronic liver disorders like hepatitis C infection.
Cirrhosis.
Hepatocellular carcinoma.
NAFLD is a common indolently progressive liver condition characterised by
insulin resistance and hepatic fat accumulation in the absence of other
identifiable causes of fat accumulation, such as alcohol abuse, viral hepatitis,
autoimmune hepatitis, alpha 1 antitrypsin deficiency, medication like
corticosteroids and estrogens and other conditions (Cusi, 2009). Hepatic steatosis
may range from a benign indolent deposition of fat to more severe non alcoholic
steato hepatitis (NASH). NASH is frequently associated with fibrosis and
approximately 10% of patients develops cirrhosis (Angulo, 2002). The risk of
hepatocellular carcinoma is also increased in patients with type 2 DM and NASH
Review of Literature
54
(Bugianesi et al., 2007). The causes of hepatic steatosis may be due to the
decreased insulin sensitivity found in type 2 DM which activates lipolysis.
Lypolysis leads to increased plasma levels of non esterified fatty acids which
results in chronic increase in fatty acid flux from the fat store to non adipose
tissues such as liver (De Fronzo, 1988; Coppack et al., 1994).
Elevated activities of two serum enzymes, serum glutamate oxaloacetate
transaminase (SGOT) also called aspartate transaminase (AST) and serum
glutamate pyruvate transaminase (SGPT) also called alanine transaminase (ALT)
may be associated with liver diseases. Elevation of levels of any two enzymes
has been found in 7.9% of the general population (Clark et al., 2003), whereas
the prevalence of high SGPT levels may reaches 20% in diabetes (Kejariwal et
al., 2008). Elevation of these enzyme act as sarrogate marker of NAFLD
presence (Trombetta et al., 2005).
Clark et al.(2003) proposed that elevated SGOT & SGPT levels are predictive of
the presence of NAFLD if two basic criteria are
I. Exclusion of alternative chronic liver disease for eg. alcoholic liver
disease, hepatitis B and C infection and hemochromatosis.
II. Presence of features of metabolic syndromes.
Few reports showing association between insulin resistance and liver disorders,
such as fatty liver and high amino transaminases are.
1) Knobler et al. (1999) reported that fatty liver was strongly associated with
many features of insulin resistance and that abnormalities of serum liver
enzymes (ALT-92%; AST-77% and GGT-52%).
2) Marchesini et al. (1999) reported that non alcoholic fatty liver was closely
associated with insulin resistance independent of body mass index and fat
distribution.
3) Meltzer and Everhart. (1997) showed that association between DM and
high ALT was found among Mexican-Americans.
These reports formed the basis to study liver enzymes abnormalities in diabetes.