Embed Size (px)
Citation preview

May 2003
NASA/CR-2003-212414
Review of Integrated Noise Model (INM)Equations and Processes
David W. ForsythBoeing Commercial Airplane Company, Seattle, Washington
John Gulding, and Joseph DiPardoFederal Aviation Administration, Washington DC
The NASA STI Program Office . . . in Profile
Since its founding, NASA has been dedicated to theadvancement of aeronautics and space science. TheNASA Scientific and Technical Information (STI)Program Office plays a key part in helping NASAmaintain this important role.
The NASA STI Program Office is operated byLangley Research Center, the lead center for NASA’sscientific and technical information. The NASA STIProgram Office provides access to the NASA STIDatabase, the largest collection of aeronautical andspace science STI in the world. The Program Office isalso NASA’s institutional mechanism fordisseminating the results of its research anddevelopment activities. These results are published byNASA in the NASA STI Report Series, whichincludes the following report types:
• TECHNICAL PUBLICATION. Reports of
completed research or a major significant phaseof research that present the results of NASAprograms and include extensive data ortheoretical analysis. Includes compilations ofsignificant scientific and technical data andinformation deemed to be of continuingreference value. NASA counterpart of peer-reviewed formal professional papers, but havingless stringent limitations on manuscript lengthand extent of graphic presentations.
• TECHNICAL MEMORANDUM. Scientific
and technical findings that are preliminary or ofspecialized interest, e.g., quick release reports,working papers, and bibliographies that containminimal annotation. Does not contain extensiveanalysis.
• CONTRACTOR REPORT. Scientific and
technical findings by NASA-sponsoredcontractors and grantees.
• CONFERENCE PUBLICATION. Collected
papers from scientific and technicalconferences, symposia, seminars, or othermeetings sponsored or co-sponsored by NASA.
• SPECIAL PUBLICATION. Scientific,
technical, or historical information from NASAprograms, projects, and missions, oftenconcerned with subjects having substantialpublic interest.
• TECHNICAL TRANSLATION. English-
language translations of foreign scientific andtechnical material pertinent to NASA’s mission.
Specialized services that complement the STIProgram Office’s diverse offerings include creatingcustom thesauri, building customized databases,organizing and publishing research results ... evenproviding videos.
For more information about the NASA STI ProgramOffice, see the following:
• Access the NASA STI Program Home Page athttp://www.sti.nasa.gov
• E-mail your question via the Internet to
[email protected] • Fax your question to the NASA STI Help Desk
at (301) 621-0134 • Phone the NASA STI Help Desk at
(301) 621-0390 • Write to:
NASA STI Help Desk NASA Center for AeroSpace Information 7121 Standard Drive Hanover, MD 21076-1320

National Aeronautics andSpace Administration
Langley Research Center Prepared for Langley Research CenterHampton, Virginia 23681-2199 under Contract NAS1-97040, Task 16
May 2003
NASA/CR-2003-212414
Review of Integrated Noise Model (INM)Equations and Processes
David W. ForsythBoeing Commercial Airplane Company, Seattle, Washington
John Gulding, and Joseph DiPardoFederal Aviation Administration, Washington DC

Available from:
NASA Center for AeroSpace Information (CASI) National Technical Information Service (NTIS)7121 Standard Drive 5285 Port Royal RoadHanover, MD 21076-1320 Springfield, VA 22161-2171(301) 621-0390 (703) 605-6000
Table of Contents 1 Summary ................................................................................................................................. 3 2 Introduction............................................................................................................................. 5
2.1 Historical Noise Model Guidance Documents ............................................................. 6 3 Study Tasks ............................................................................................................................ 7
3.1 Examination of SAE AIR-1845 Methodology................................................................ 7 3.2 Noise Analysis................................................................................................................. 9
3.2.1 Evaluate the Effects of Low Power on Approach ...................................................... 9 3.2.2 Extrapolation of NPD Data to Long Range/High Altitude ........................................ 10 3.2.3 Application of Directivity to Spectral Class Extrapolation ........................................ 13
3.3 Automation of Processing of Aircraft Data ................................................................ 16 3.3.1 Developing generic converter for Boeing data ........................................................ 16 3.3.2 Source Test Matrix for Coefficient Generation ........................................................ 16
3.4 Reference Data Development and Assessment ........................................................ 18 3.4.1 Historical and Present Default Weights for Flight Profiles ....................................... 20 3.4.2 Proposed New Default Weights for Flight Profiles................................................... 21 3.4.3 Representative Procedures for Flight Profiles ......................................................... 22
3.5 SAE AIR-1845 Method for Approach Procedures...................................................... 22 3.6 SAE Equation A1 Coefficients ..................................................................................... 23
3.6.1 Below the Engine Breakpoint Temperature............................................................. 24 3.6.2 SAE General Thrust Coefficients............................................................................. 29 3.6.3 Above the Breakpoint Temperature......................................................................... 33
3.7 SAE Equation A8 and A10 Parameters ....................................................................... 33 3.7.1 SAE Equation A10 Parameters ............................................................................... 34 3.7.2 Equation A8/A10 Power Cutback Height ................................................................. 34
3.8 Overall SAE Equation/Boeing Performance Agreement........................................... 35 3.9 Process to Extract Aircraft State from Flight Data .................................................... 39 3.10 Source Noise Data Development ................................................................................... 39
4 Summary of Development Process.................................................................................... 40 Appendix A Sample Output Developed from LSPS ................................................................. 42 Appendix B INM Database Request Form................................................................................. 43 Bibliography................................................................................................................................. 51
1
List of Figures and Tables
Figure 1: Max dBA Decay with Altitude for Flight Extrapolations vs. Spectral Class 105............ 11 Figure 2: Max dBA Decay with Altitude for Flight Extrapolations vs. Spectral Class 102............ 11 Figure 3: Max dBA Decay with Altitude for Flight Extrapolations vs. Spectral Class 104............ 12 Figure 4: Max dBA Decay with Altitude for Flight Extrapolations vs. Spectral Class 203............ 12 Figure 5: Max dBA Decay with Altitude for Flight Extrapolations vs. Spectral Class 205............ 12 Figure 6: Max dBA Decay for Flight Data, Fixed Directivity Angle vs. Spectral Class 105.......... 14 Figure 7: Max dBA Decay for Flight Data, Fixed Directivity Angle vs. Spectral Class 102.......... 14 Figure 8: Max dBA Decay for Flight Data, Fixed Directivity Angle vs. Spectral Class 104.......... 15 Figure 9: Max dBA Decay for Flight Data, Fixed Directivity Angle vs. Spectral Class 203.......... 15 Figure 10: Max dBA Decay for Flight Data, Fixed Directivity Angle vs. Spectral Class 205........ 15 Figure 11: SAE Equation A1 - Corrected Net Thrust – Standard Day ......................................... 25 Figure 12: SAE Equation A1 - Corrected Net Thrust – Standard Hot Day (FAR36) .................... 25 Figure 13: SAE Equation A1 - Corrected Net Thrust – Standard Day at 2000 Feet .................... 26 Figure 14: SAE Equation A1 - Corrected Net Thrust – Standard Hot Day at 4000 Feet ............. 26 Figure 15: SAE Equation A1 - Corrected Net Thrust – Standard Day ......................................... 27 Figure 16: SAE Equation A1 - Corrected Net Thrust – Standard Hot Day (FAR36) .................... 27 Figure 17: SAE Equation A1 - Corrected Net Thrust – Standard Day at 2000 Feet .................... 28 Figure 18: SAE Equation A1 - Corrected Net Thrust – Standard Hot Day at 4000 Feet ............. 28 Figure 19: Boeing 777-300 “HiTemp” Coefficient Generation (Max Takeoff Power, 150kt) ........ 31 Figure 20: Improvement of Flight Prediction at Sea Level by Adding High Temperature Data .... 31 Figure 21: Improvement of SEL Prediction at Sea Level by Adding High Temperature Data ...... 32 Figure 22: Improvement of Flight Prediction at Altitude by Adding High Temperature Data ........ 32 Figure 23: Improvement of SEL Prediction at Altitude by Adding High Temperature Data .......... 33 Figure 24: SAE Sea Level Equations and Boeing LSPS Data for Sea Level Airport................... 36 Figure 25: SEL Under the Flight Path Comparison for Sea Level Airport .................................... 36 Figure 26: Sea Level Equations and Boeing LSPS Data for 4000ft Airport .................................. 37 Figure 27: SEL Under the Flight Path Comparison for 4000ft Airport .......................................... 37 Figure 28: 4000ft SAE Equations and Boeing LSPS Data for 4000ft Airport............................... 38 Figure 29: SEL Under the Flight Path Comparison for 4000ft Airport ........................................... 38 Table 1: SAE Aerodynamics Performance Equations.................................................................... 8 Table 2: Approach Contour Areas with Full NPD and with Lowest Power Point Truncated .......... 9 Table 3: INM Spectral Class Assignments for Study Aircraft ....................................................... 10 Table 4: Detailed Flight Procedure Dataset by Aircraft and Flap Setting..................................... 17 Table 5: Takeoff Weights (lb) for Each Airplane in Boeing Flight Profile Matrices....................... 17 Table 6: Atmospheric Conditions for Detailed Flight Profile Data ................................................ 18 Table 7: Listing Summarizing Number of Detailed Flight Profiles ................................................ 18 Table 8: INM Database Trip Lengths............................................................................................ 20 Table 9: Summary of Boeing Aircraft Weight to Stage Length Assumptions............................... 20 Table 10: INM Database Trip Lengths ......................................................................................... 21 Table 11: Summary of Proposed Aircraft Weight to Stage Length Assumptions......................... 21 Table 12: Supplied Test Matrix Rationale .................................................................................... 22 Table 13: SAE Coefficient Comparison by Source Data Procedure ............................................ 24 Table 14: SAE Percent Difference from Boeing Performance ..................................................... 29 Table 15: ICAO B Accelerate to Zero Flaps SAE Procedure Step............................................... 34 Table 16: ICAO B Power Cutback after Acceleration to Zero Flaps ............................................ 35
2

1 Summary The FAA’s Integrated Noise Model (INM) relies on the methods of the SAE AIR-1845 “Procedure for the Calculation of Airplane Noise in the Vicinity of Airports” issued in 1986. Simplifying assumptions for aerodynamics and noise calculation were made in the SAE standard and the INM based on the limitations of computing power commonly available then. One objective of this study is to test some of those assumptions against Boeing source data to see where improvements might be needed and propose methods to obtain those improvements. The second objective of the task is to automate the manufacturer’s methods of data development to enable the maintenance of a consistent INM database over time. The third objective is to supply data for newly certified Boeing airplanes using these new automated methods. Six airplane types have been added to the INM database. The 737-700 (CFM56-7 24K), 767-400ER (CF6-80C2BF), 777-300 (Trent 892), 717-200 (BR715), 757-300 (RR535E4B), and the 737-800 (CFM56-7 26K) have been included for INM submission. An automated tool was created to allow for conversion of Boeing aerodynamics data to the INM format without manually entering the data. An additional software tool was modified to extract Noise-Power-Distance (NPD) data directly from the certification database in the form used by the INM. The FAA developed a linear regression tool to extract SAE AIR-1845 aerodynamics coefficients and flight profile information over a wide range of weights, airport altitudes, and atmospheric conditions. The source data are a matrix of flight profiles for a range of weights representing INM stage lengths for runway altitudes between sea level and 4000ft and atmospheres with temperature increments between 0 and 50 degrees Fahrenheit above the ISO standard. The SAE AIR-1845 coefficients were developed directly from the test matrix data set thus eliminating differences that could occur from different analysts using different assumptions from different software programs. This analysis was limited to a subset of the complete SAE-AIR-1845 process. Although most of the elements of SAE AIR-1845 are addressed, not all are addressed to the same level of review. As this study evolved different subsets of the Boeing source data were subjected to the various analyses. The most emphasis is placed on the aerodynamics equations since no amount of cleverness in noise modeling matters if the aircraft cannot be placed correctly in the sky at the proper power setting.
3

4

2 Introduction The INM calculates flight profiles from a database of statistical coefficients. These coefficients are developed from proprietary flight profile data for a set of reference conditions. The coefficients for takeoff are taken for a reference aircraft weight of 85% maximum takeoff weight at sea level using the ISO standard atmosphere for temperature, pressure and density. The airport conditions include an 8-knot headwind. It is an assumption in the INM model process that profiles for other weights, atmospheres, and procedures may be modeled by modifying the default procedures contained in INM. There is, however, not a clear description on how to do this in existing noise model guidance documents [1-3], the INM Database Report [4] or the INM 6.0 Users Guide [5]. In fact, they indicated that modeling these other conditions would require the development of new coefficients. One objective of this analysis is to develop a comprehensive set of profiles for a broad range of atmospheric conditions, takeoff weights, and procedures based on detailed Boeing source data. Using algorithms based on current guidance, this study develops a reference set of coefficients and performs sensitivity tests on how aircraft performance and, more importantly, the predicted noise impact change as we move away from the reference conditions. For this exercise, the detailed profiles were obtained from the Boeing software tools used for certification of flight performance. The second objective is to devise an automated scheme to generate the coefficients used in the equations and supply supporting processes to create the necessary data. Boeing processes were modified to include the lift and drag coefficients in new profile matrices for this part of the study. Previously the complete ground roll on takeoff was added to aid in calculation of the thrust and takeoff flap coefficients. Ground roll is not yet available for the approach data using present Boeing production tools. But the new approach matrices supplied should make it possible to model typical approaches with level segments as well as other noise abatement approach procedures under consideration. The INM database does not have enough data at low power approach conditions to model noise abatement approach procedures well. An analysis was performed to examine the effect of a lower power setting on noise contour areas. The other part of the noise study provides a quick look at the differences between extrapolation of 1/3-octave band time history flight data and the spectral class spectrum data used to correct for weather effects in the INM. Additional noise analysis investigated the differences between extrapolation of 1/3-octave band time history data and the spectral data picked at a fixed directivity angle and that occurring at peak dBA level. Before this task, it was unknown whether the SAE methods were even applicable for airports at high elevation, or at temperature extremes. The analysis of the large volume of flight profile data demonstrated the fundamental soundness of the SAE methods over a wide range of conditions. This fundamental soundness makes it possible to extract the required thrust (and therefore noise) at any point in the flight profile if the aircraft configuration and position are known. Using a balance of forces on the airplane modeled as a point mass makes it unnecessary to construct an engine deck to correlate operational fan speed (RPM) or engine pressure ratio (EPR) to thrust. A potential limitation of the spectral class method used for weather correction of noise data over distances beyond 5000 feet was uncovered. The peak dBA spectrum as a representative spectrum does not propagate like flight extrapolations of 1/3-octave band time histories. When a spectrum at a single directivity angle is chosen to represent each power setting, the match is better for takeoff power and cutback power, but not so good for approach conditions. In conclusion, for the areas of study addressed here, the simplifying assumptions in the INM did not result in serious bias errors that would jeopardize use of the tool for airport noise assessment.
5

2.1 Historical Noise Model Guidance Documents For the majority of the world’s airports that make use of noise models, the guidance and underlying database/noise calculation methodology is given in three related documents. These include the Society of Automotive Engineers (SAE) Aerospace Information Report (AIR), SAE-1845, titled “Procedure for the Calculation of Airplane Noise in the Vicinity of Airports” [1]. This document shares similar material with European Civil Aviation Conference (ECAC) Doc 29 [2] and International Civil Aviation Organization (ICAO) Circular 205 [3]. The Society of Automotive Engineers (SAE) issued its guidance document in March of 1986. In its 15-year history, it has been reaffirmed once, but not within the last five years. There is active research and development and the SAE committee (Aircraft Noise, A-21) responsible for this document is currently reviewing all components including source material given by reference. SAE AIR-1845 outlines a methodology that, for each observer location, performs a single calculation between source and receiver at the closest point of approach. This logic is modified in Appendix C of the reference to model noise for turning flight paths and introduces a method for dividing a flight track into segments to approximate a simulation methodology. Calculations are kept to a minimum, most likely, to reflect the computer processing speeds that were in existence in 1986. Appendixes A and B of the reference provide a specification for the core noise databases required to support the methodology. Appendix A specifies aircraft performance data that provide basic aircraft position and engine power setting information for approach and takeoff. Appendix B relates the engine power setting provided by the Appendix A equations to noise propagated to different distances. These “prepropagated” noise values take the form of Noise-Power-Distance (NPD) curves. It is assumed that noise relates to these “power” parameters and the NPD curve relationship adequately represents the atmospherics and flight segments of the airport study area. This “prepropagating” the noise to fixed distances and then interpolating provides the practical computational efficiency needed to evaluate the thousands of flight tracks that comprise an average annual day and for the thousands of receiver locations required to create a noise contour. Like SAE AIR-1845, ECAC Doc 29, was published in 1986. Unlike SAE AIR-1845, it has undergone a complete revision and a second edition was adopted by ECAC in July of 1997. Both English and French language versions are available and may be downloaded from the ECAC web site at http://www.ecac-ceac.org. In areas of overlap, SAE AIR-1845 and ECAC 29 contain identical equations. ECAC 29 contains a similar if not identical method for developing noise and performance data as SAE AIR-1845. There are also identical equations for calculating noise on takeoff roll and both use SAE AIR-1751 [6] for modeling lateral attenuation. ECAC 29 also contains a well-documented test case for verifying the implementation of the algorithms contained in the document. It is comprehensive and has proven useful in examining changes to noise algorithms that have occurred in the FAA noise model from INM 3.10 to the current INM 6.0c release. ICAO Circular 205 was developed in June of 1986 and issued and approved in March of 1987. This places it in the timeframe of SAE AIR-1845 and the first edition of ECAC 29. The revised ECAC 29, second edition cites Circular 205 as a source and both share an identical Appendix C on the definitions and equations for airplane performance data. With a view towards a world audience, Circular 205 provides definitions of metrics used throughout the world in its Appendix A. Several of these metrics are based on EPNL and Appendix B provides a methodology for developing this metric.
6
3 Study Tasks
3.1 Examination of SAE AIR-1845 Methodology SAE AIR-1845, Appendix A, gives a series of equations and parameters that may be assembled to predict the flight performance of an aircraft. SAE AIR-1845 does not give explicit guidance or a worked example of the last part of assembling a procedure. For this task, Boeing developed a very large test matrix of performance profiles, which is described in Section 3.3.2. From this test matrix, it is possible to analyze the sub elements of SAE AIR-1845 Appendix A, quantify the accuracy of the model algorithms, and then make recommendations for possible improvement. To quantify the accuracy of the algorithms, three parts of the model process are considered:
1) The form of the equations. The degree to which the equations support all elements of the flight regime that are required by noise model users is evaluated. This includes modeling aircraft for different cutback/flap retraction schedules, different power settings, different takeoff weights and different trade-offs of climb vs. acceleration. On approach, aircraft may intercept the glideslope at different speeds at different altitudes. For distances away from the airport, it may also be necessary to model level flight. In quantifying the error associated with the form of the equations, the manufacturer’s source data is used as the benchmark. Similarly, any proposed new equation forms should be tested against the same benchmark data for judging the accuracy of the results.
2) Coefficient/Parameters that accompany the equations The SAE equations may be adequate and flight performance theory may verify that the equation form should be able to replicate takeoff roll and aircraft climb/acceleration. However, these equations will have aircraft specific parameters associated with them and the method used to calculate these parameters may introduce error into the model. The large performance data test matrix developed for this task allows for the testing of parameters developed for one set of procedures and weights to be tested across a much more extensive set of profiles. Particular attention was given to the parameters required for the SAE Acceleration Equation (A10).
3) The Use of the Equations and Coefficients to Model a Procedure The equation form and parameters may be developed correctly but the modeler may still have to assemble the SAE equations to create a profile. Errors in one equation may propagate to others augmenting the error seen downstream. This error may be easily quantified by simply comparing the fit along the profile generated from the manufacturer’s source data with the SAE predicted profile. However, differences will not be uniform along the flight path and a large difference that may appear in an acceleration phase could be due to an error upstream in the takeoff equation or climb phase.
For this study, the combined equations matched the manufacturer’s source data very well and it was not necessary to examine each SAE equation and parameter specifically and build up error bounds around all the different ways in which equations can be combined. This can be accomplished under future work.
7

A summary of the SAE AIR-1845 Appendix A equations that were evaluated is given below.
Table 1: SAE Aerodynamics Performance Equations SAE Equation Equation Type Purpose/Use
A1 Thrust Equation Equation giving Corrected Net Thrust as a function of calibrated airspeed, pressure altitude above sea level and ambient air temperature.
Requires statistical coefficients: E, F, G and H.
A2 Thrust Equation Equation giving Corrected Net Thrust as a function of calibrated airspeed, pressure altitude above sea level, ambient air temperature and Engine Pressure Ratio (EPR).
Requires statistical coefficients: E, F, G, H and K1
A3 Thrust Equation Equation giving Corrected Net Thrust as a function of calibrated airspeed, pressure altitude above sea level, ambient air temperature and Low Pressure Rotor Speed (N1)
Requires statistical coefficients: E, F, G, H, K2 and K3.
A4 Thrust Equation For propeller driven airplanes, this equation relates corrected net thrust to propeller efficiency, true flight speed, and installed net propulsive power.
A5 Speed Equation Gives an approximation of true airspeed from equivalent or calibrated airspeed.
A6 Takeoff Roll Given a representative thrust during climbout and a takeoff flap coefficient, calculates an “equivalent” ground roll distance.
Requires takeoff flap coefficient: B
A7 Speed Equation Calculates an initial calibrated climb-out speed by relating a statistical aircraft flap coefficient to the square root of the aircraft weight.
Requires flap/speed coefficient: C
A8 Climb Equation Calculates the climb gradient of an aircraft given aircraft thrust, weight and a drag/lift coefficient.
Requires aircraft state, Drag/Lift Parameter (R).
A9 Distance Equation (Climb)
Given a climb gradient from equation A8 and change in altitude, calculates the distance along the ground track traversed by the aircraft during climb.
A10 Distance Equation (Acceleration)
Given a change in speeds, thrust, weight, Drag/Lift, calculates the distance along the ground track as an aircraft is accelerating.
Requires: Aircraft state drag/lift parameter: R
Requires: Target acceleration speed and rate-of-climb over acceleration distance.
8

An objective of this study was to determine the degree to which all of the required SAE statistical coefficients and parameters identified in Table 1 could be calculated with a single process and single data source thus expediting SAE data development and validation. The FAA linear regression method for the calculation of aerodynamics performance coefficients was tested, validated, and refined for the six study airplanes. Since the regression is developed using procedures for a wide range of airport altitudes, airplane weights, and temperatures, the resulting coefficients are able to reproduce flight profiles over a similar range of conditions. A key attribute of the FAA method is the use of the manufacturer’s flight profile data directly, which are easier and more intuitive for industry to produce than the SAE coefficients. This distinction also simplifies error checking, and the bounds of the matrix of flight profile data determine the range of applicability of the coefficients. Because of this, Boeing abandoned its proprietary method of coefficient generation and instead, adopted and refined the FAA procedure so that coefficient generation could be made repeatable and consistent across the aircraft industry. Section 3.3.2 describes a method for producing SAE AIR-1845 coefficients directly from operational profiles. When the SAE AIR-1845 equations are used with coefficients generated by this method, the match is excellent provided that the power settings used in the predicted procedure are comparable to those used in the matrix of profiles.
3.2 Noise Analysis
3.2.1 Evaluate the Effects of Low Power on Approach Realistic approach profiles involve transient thrust reductions that can result in thrust levels below the lowest thrust levels supplied in typical NPDs. In some approach procedures, it is possible to temporarily operate at zero (even negative) thrust. In earlier INM submissions, the lowest thrust in NPDs usually reflects the thrust level required to maintain the 3-degree glideslope at the lowest certified approach flap setting for the 90% landing weight condition. The truncated NPD represents the range of thrusts in Boeing’s previous INM data (Table 2). Data developed for this study represents the range of required thrusts for all certified flap settings and landing weights developed for existing Boeing noise certifications.
The effect of this additional data is shown to reduce approach noise contours where thrust drops to very low levels. If a pure airframe noise (zero thrust) NPD curve could be generated, contours may shrink further since the lowest available NPD point reflects a low weight, low approach flap condition. Even the study airplanes do not have NPD data for zero thrust. Table 2: Approach Contour Areas with Full NPD and with Lowest Power Point Truncated
INM Approach Contour Level
737-700 Contour Area (sq mi)
767-400ER Contour Area (sq mi)
777-300ER Contour Area (sq mi)
Peak dBA Level Truncated Full NPD Truncated Full NPD Truncated Full NPD
55.0 27.338 26.261 53.026 54.124 40.185 38.381 60.0 14.330 13.966 28.042 28.173 20.819 19.480 65.0 7.349 7.187 12.100 11.313 8.830 8.807 70.0 3.721 3.681 4.771 4.754 4.857 4.843 75.0 1.857 1.855 2.062 2.047 2.202 2.191 80.0 0.877 0.876 0.893 0.883 0.998 0.991 85.0 0.410 0.409 0.383 0.376 0.443 0.439
9

3.2.2 Extrapolation of NPD Data to Long Range/High Altitude Aircraft certification NPD data are derived from 1/3-octave band time history flight test data where the airplane is flown at altitudes below 2000ft. The extrapolation to higher altitudes is accomplished using the flight geometry and SAE ARP-866A [7] atmospheric absorption based on the standard acoustic day atmosphere of 25 degrees C and 70% relative humidity. Boeing uses atmospheric layering for the raw flight test data, but once the data are averaged among collocated microphones and normalized to the standard atmosphere, the layering is ignored. This effect is small since the altitudes relevant to certification are around 1000 feet. After a typical certification, NPDs are calculated using this method up to 10000 feet. For some older Boeing airplanes, the maximum NPD altitude is only 6000 feet. For a typical Boeing INM submission, data for the NPD request is extracted from the certification NPD database. For altitudes above 10000 feet the Boeing NPD software extrapolates using spherical divergence to calculate the decrease in noise with distance. This is the most conservative approach (erring on the side of more noise), but at other times various other methods have also been used to generate the 16000 foot altitude and 25000 foot altitude data for the INM. The approach used to investigate the consequences of the these assumptions is to compare extrapolated NPDs using the time history over the flight path with the result of extrapolating the spectral class spectrum assigned by the FAA to the study aircraft over the same distance. This is a simple way to see how well behaved the extrapolated flight data are at those altitudes and compare that behavior against the spectral class assumption applied to the NPD data. The INM spectral classes assigned to the study airplanes result in this matrix:
Table 3: INM Spectral Class Assignments for Study Aircraft
INM Aircraft Approach Cutback Takeoff 717200 203 105 105 737300 203 104 104 767400 205 102 102 777300 203 105 105
The 767 is the only airplane with unique spectral classes in this study. Interestingly, the smallest and largest airplanes (717 and 777) in the study share the same spectral classes for all three flight conditions. It is unclear whether the noise source components that create those peak spectra are the same for both engines. Detailed component modeling of the study airplanes is beyond the scope of this study, but the importance of the source composition will become apparent later in the discussion. Since the objective is to evaluate the decay of noise with increasing distance, the extrapolations are normalized to 0 dBA at 1000 feet distance. This is the altitude that best matches the standard altitude used in the spectral class definition with the altitude range for most of the flight data. To show the effect of other atmospheric absorption standards on the spectral class data, the SAE AIR-1845 absorption was removed and SAE ARP-866A [7] using lower 1/3 octave band edge absorption (designated ARP866E) and ANSI S1.26-1995 [8] absorption were applied over the standard INM distances for standard day conditions.
10

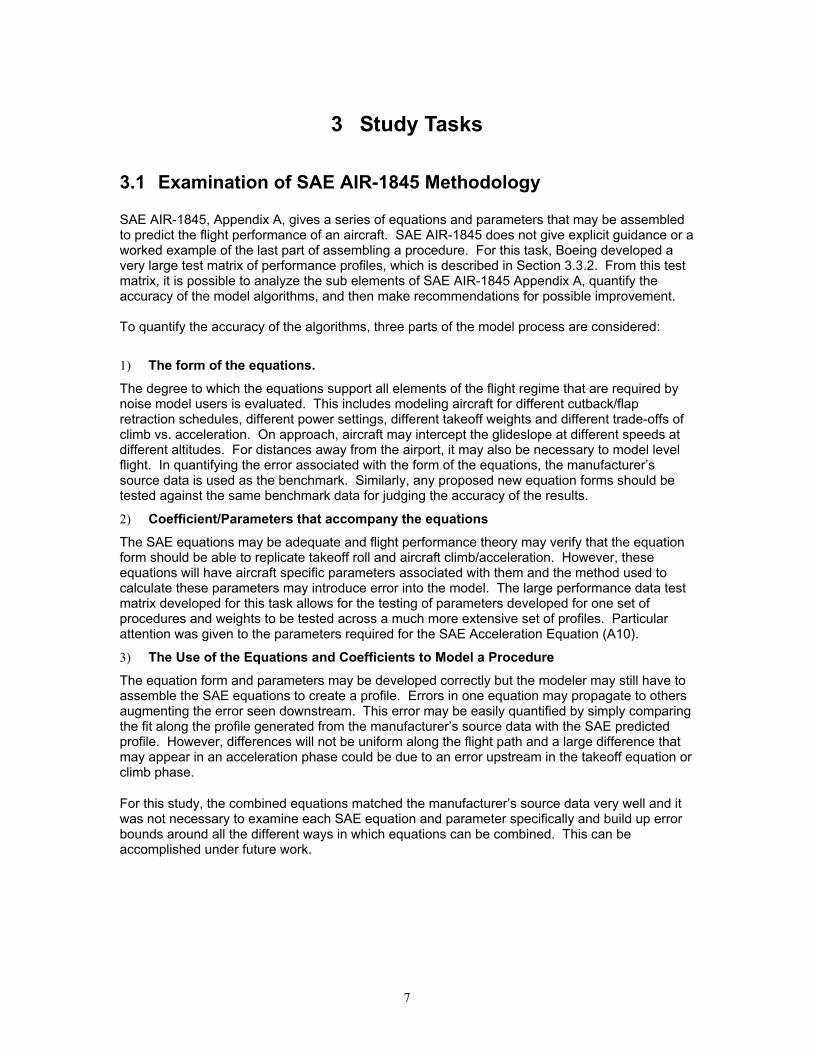
For the departure Spectral Class 105 shown in Figure 1, the strongest evidence that there are different sources at play is the reversal in the decay rates between takeoff and cutback power for the two airplanes. Since jet noise is a source with wide directivity and bandwidth, its contribution to the peak should be relatively independent of altitude and directivity. One would expect lower decay rates at takeoff power where jet noise is dominant. However the trend reverses for the 717. For the departure Spectral Class 102 in Figure 2 the ordering of the decay rates is consistent with the 777 and the expectation that increased jet noise would result in lower decay rates. But the decay rate predicted from the spectral class is much higher. For Spectral Class 104 in Figure 3 the decay rates for the two power settings are essentially the same. The other thing to note is that the decay rates for the wing-mounted twins are fairly close to the flight extrapolation, but generally higher levels at all distances. For the approach Spectral Class 203 in Figure 4 the decay rates behave similarly with the rate of decay increasing with decreasing aircraft size. For the remaining Spectral Class in Figure 5 for the 767 the match is good. The shape and amount of decay is not unlike the other three airplanes’ flight extrapolations.
-25.00
-20.00
-15.00
-10.00
-5.00
0.00
0 5000 10000 15000 20000 25000
Altitude Above Airport (ft)
Dec
ay in
dBA
717 CUTBACK717 TAKEOFF777 CUTBACK777 TAKEOFFARP866E 105ANSI86 105SAE-AIR-1845 105
Figure 1: Max dBA Decay with Altitude for Flight Extrapolations vs. Spectral Class 105
-25.00
-20.00
-15.00
-10.00
-5.00
0.00
0 5000 10000 15000 20000 25000
Altitude Above Airport (ft)
Dec
ay in
dB
A 767 CUTBACK767 TAKEOFFARP866E 102ANSI86 102SAE-AIR-1845 102
Figure 2: Max dBA Decay with Altitude for Flight Extrapolations vs. Spectral Class 102
11
-25.00
-20.00
-15.00
-10.00
-5.00
0.00
0 5000 10000 15000 20000 25000
Altitude Above Airport (ft)
Dec
ay in
dB
A 737 CUTBACK737 TAKEOFFARP866E 104ANSI86 104SAE-AIR-1845 104
Figure 3: Max dBA Decay with Altitude for Flight Extrapolations vs. Spectral Class 104
-25.00
-20.00
-15.00
-10.00
-5.00
0.00
0 5000 10000 15000 20000 25000
Altitude Above Airport (ft)
Dec
ay in
dB
A
717 APPROACH737 APPROACH777 APPROACHARP866E 203ANSI86 203SAE-AIR-1845 203
Figure 4: Max dBA Decay with Altitude for Flight Extrapolations vs. Spectral Class 203
-25.00
-20.00
-15.00
-10.00
-5.00
0.00
0 5000 10000 15000 20000 25000Altitude Above Airport (ft)
Dec
ay in
dB
A 767 APPROACHARP866E 205ANSI86 205SAE-AIR-1845 205
Figure 5: Max dBA Decay with Altitude for Flight Extrapolations vs. Spectral Class 205
12

What immediately becomes apparent overall is that the flight extrapolations do not decay like the spectral classes, and there is no consistent pattern to the differences for the different spectral classes. The spectral class extrapolations decay in a consistent fashion relative to the choice of atmospheric absorption model (i.e., ANSI [8] model causes slower decay than ARP-866A or SAE AIR-1845). But there are fundamental differences in the behavior of the flight extrapolations. An unstated assumption of the spectral class method is the directivity angle at which the peak noise occurs does not change much with power setting, or with increasing propagation distance. The results of this study indicate this is a poor assumption and has a much bigger effect at long distances than the choice of atmospheric absorption model when the weather is close to standard day conditions. These findings do not invalidate the spectral class method. But they suggest the spectral data supplied to the FAA to assign spectral classes should probably use a more representative directivity angle for each flight condition. The directivity angle associated with the peak spectrum is likely to change with altitude in unpredictable ways due to changes in the component source composition. Choosing a representative directivity angle would improve the chances that airplanes put in the same spectral class have similar source characteristics. A full-spectral method may appear more technically satisfying, but even that would be a prisoner of the assumption that the noise sources themselves do not change at altitudes far above those flown for the certification flight tests. The only way to validate that assumption is flight testing under those conditions, which would be cost prohibitive.
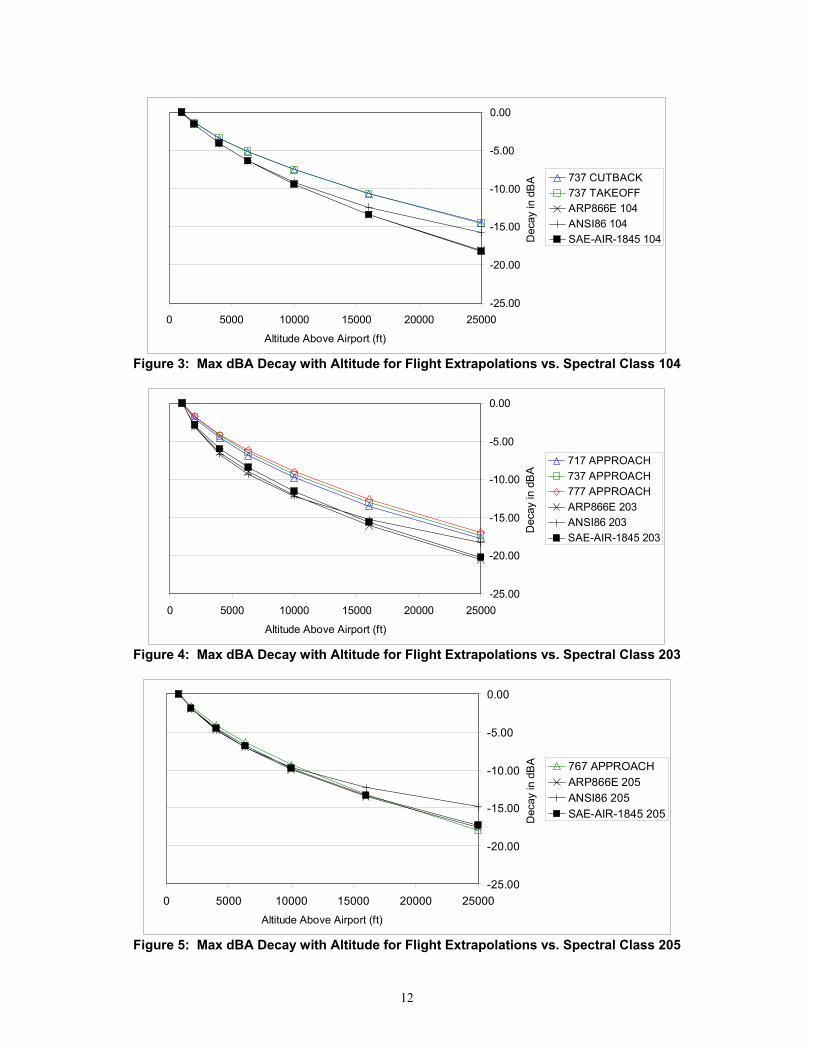
3.2.3 Application of Directivity to Spectral Class Extrapolation In the previous section, it was shown that the spectral class spectra do not extrapolate over long distances in the same way as full-flight extrapolations. In this section the effects of directivity on single spectra extrapolations are addressed. First, we choose a spectrum corresponding to a specific directivity angle for each flight regime, and then we attempt to get a match with flight extrapolations by extrapolating that spectrum to longer distances. For approach conditions the noise is assumed to be radiated primarily forward of the aircraft and hence the directivity angle was chosen to be 60 degrees, for cutback power 90 degrees and for full-power takeoff 120 degrees was used. In the plots the black line with bold symbols represent the INM Spectral Class spectrum extrapolated over the distances listed on the X axis. The colored dotted lines represent a single spectrum at the designated directivity angle extrapolated in a similar fashion. The solid colored lines are the full-flight extrapolation using all third octave band spectra for all directivity angles. Where curves of the same color are close together, the chosen directivity angle is a good representation of the full-flight extrapolation. Where curves line up with the black curve, the standard spectral class represents that flight condition well. For the departure Spectral Class 105 in Figure 6 the agreement between the 120 degrees extrapolation and the full-flight extrapolation is good. For the cutback power condition using the same Spectral Class, the agreement is good using the 90 degrees polar angle. For the departure Spectral Class 102 in Figure 7 the full-power condition is well modeled by the choice of 120 degrees polar angle. The cutback condition is a poorer match. The Spectral Class extrapolation is a serious mismatch. For Spectral Class 104 in Figure 8 the decay rates for the two power settings at the chosen polar angles are essentially the same. The spectral class decay rate does not match any of these extrapolations.
13

For the approach Spectral Class 203 in Figure 9 the choice of 60 degrees doesn’t produce a good match for the closely clustered flight extrapolations. It is more difficult to pick a representative angle for approach spectra given the differences in directivity are more dramatic between the different airplanes. For the approach Spectral Class 205 in Figure 10 the choice of 60 degrees does not capture the behavior of noise with increasing distance. The peak angle for full-flight extrapolations does not correspond well with the sources that propagate noise out to long range. There is some indication that choice of a common directivity angle(s) for departure would help extrapolation using spectral classes, but approach is more difficult as the sources have sharper directivity that is harder to capture with one generic angle, including the peak angle as is used in the standard spectral class method.
-25.00
-20.00
-15.00
-10.00
-5.00
0.00
0 5000 10000 15000 20000 25000
Altitude Above Airport (ft)
Dec
ay in
dB
A 777 CUTBACK 90DEG777 TAKEOFF 120DEG777 CUTBACK777 TAKEOFFARP866E 105
Figure 6: Max dBA Decay for Flight Data, Fixed Directivity Angle vs. Spectral Class 105
-25.00
-20.00
-15.00
-10.00
-5.00
0.00
0 5000 10000 15000 20000 25000
Altitude Above Airport (ft)
Dec
ay in
dBA
767 CUTBACK 90DEG767 TAKEOFF 120DEG767 CUTBACK767 TAKEOFFARP866E 102
Figure 7: Max dBA Decay for Flight Data, Fixed Directivity Angle vs. Spectral Class 102
14
-25.00
-20.00
-15.00
-10.00
-5.00
0.00
0 5000 10000 15000 20000 25000
Altitude Above Airport (ft)
Dec
ay in
dBA
737 CUTBACK 90DEG737 TAKEOFF 120DEG737 CUTBACK737 TAKEOFFARP866E 104
Figure 8: Max dBA Decay for Flight Data, Fixed Directivity Angle vs. Spectral Class 104
-25.00
-20.00
-15.00
-10.00
-5.00
0.00
0 5000 10000 15000 20000 25000
Altitude Above Airport (ft)
Dec
ay in
dB
A
717 APPROACH 60DEG737 APPROACH 60DEG777 APPROACH 60DEG717 APPROACH737 APPROACH777 APPROACHARP866E 203
Figure 9: Max dBA Decay for Flight Data, Fixed Directivity Angle vs. Spectral Class 203
-25.00
-20.00
-15.00
-10.00
-5.00
0.00
0 5000 10000 15000 20000 25000Altitude Above Airport (ft)
Dec
ay in
dB
A
767 APPROACH 60DEG767 APPROACHARP866E 205
Figure 10: Max dBA Decay for Flight Data, Fixed Directivity Angle vs. Spectral Class 205
15

3.3 Automation of Processing of Aircraft Data
3.3.1 Developing generic converter for Boeing data Historically, coefficient generation and NPD generation has been difficult due to the large amount of manual handling of the ASCII text files for flight performance and noise tables. A PC based software tool was developed to read in the ASCII data and output directly in the INM’s dBASE format or .CSV format for the experimental coefficient generator routine. An example of the formatted output from the Boeing performance programs is provided in Appendix A.
3.3.2 Source Test Matrix for Coefficient Generation A question for SAE research has been the degree to which the aircraft performance equations in SAE AIR-1845 can be adapted to different conditions. At its basic level, a single set of SAE parameters for 85% max gross takeoff weight with a sea level 59 °F atmosphere can be developed. The procedure could then be adapted to other atmospheric conditions, other takeoff weights and other procedures with alternative thrust cutback and flap retraction schedules. There were some known limitations prior to initiating this study.
1) SAE AIR-1845 parameters such as those required in the acceleration step involve rate of climb and target speed parameters. These are known to change with weight and atmosphere. The rate of climb will decrease with increased weight and increased temperature. However, the SAE method provides no mechanism for adjusting these parameters as conditions deviate from the reference 85% Max Takeoff weight, Sea Level 59 °F reference condition. This study includes a sufficient number of profiles to determine any additional SAE coefficients that vary these parameters with aircraft weight or atmosphere.
2) Appendix A of SAE AIR-1845 does not provide good information on how to interpret the “H” coefficient from Equation A1. This is the parameter that varies corrected net thrust as temperature varies. There is potential codependence on the altitude coefficient as the temperature coefficient in INM is a function of altitude. It is also known that for flat rated engines, the behavior of the engine changes above and below the engine breakpoint temperature. It is currently proposed that SAE AIR-1845 be modified to provide two sets of equation A1 parameters for above and below the engine break point. The test matrix developed for this task contains a sufficient range of temperatures and altitudes to test the effects of the “H” coefficient for conditions both above and below the break point.
3) SAE Equations (A1-A3) are developed for a specific power setting. If the 85% Takeoff weight procedure cited above contains two power settings (Max Takeoff and Max Climb), then it is believed that noise models will only be able to adapt to other procedures that use Max Takeoff and Max Climb. There are no SAE equations that scale the equation power parameters to other settings such as those used for derate takeoffs and those reduced- power settings used in noise abatement procedures such as the ICAO B or FAA Advisory Circular 91-53A. Here the required minimum thrust is based on one engine out conditions. The SAE equations have no way to know what the trim drag will be to handle asymmetric thrust. Calculating the required thrust to maintain the necessary climb gradient will under-predict the true minimum cutback thrust required.
Therefore, this study was limited to changes in weight, atmosphere and flap retraction schedule.
The test matrix contains detailed aircraft performance data for multiple procedures over multiple takeoff weights for different airport elevations and temperatures. The study airport altitudes were for Sea Level, 2000 feet and 4000 feet. The study temperatures were for 59°F, 77°F and 109°F, where 109°F is above the engine breakpoint temperature. The procedures consisted of the
16

standard ICAO A, and ICAO B and a representative procedure with thrust cutback at 1000 feet above field elevation. Table 4 shows the test matrix of aircraft procedure by takeoff flap setting.
Table 4: Detailed Flight Procedure Dataset by Aircraft and Flap Setting
Aircraft Name
Procedure Takeoff Flap #1
Takeoff Flap #2
Takeoff Flap #3
Takeoff Flap #4
Takeoff Flap #5
717-200 (18K) ICAO B 1000 ft Cutback
Flap 5 Flap 9 Flap 13 Flap 15 Flap 18
717-200 (21K) ICAO B 1000 ft Cutback
Flap 5 Flap 9 Flap 13 Flap 15 Flap 18
737-700 / CFM56-7B ICAO A ICAO B 1000 ft Cutback
Flap 5
767-400 / CF6-80C2B ICAO A ICAO B 1000 ft Cutback
Flap 5
Flap 15
Flap 20
777-300 / Trent 892 ICAO A ICAO B 1000 ft Cutback
Flap 5
Flap 15
Flap 20
Each takeoff procedure at a given takeoff flap setting was varied by takeoff weight. Table 5 shows the takeoff weights in pounds that were provided for each procedure/takeoff flap setting. Takeoff weights were provided to match the INM definition of trip length (1-7) and use the development rules given in Section 3.4.1.
Table 5: Takeoff Weights (lb) for Each Airplane in Boeing Flight Profile Matrices
Aircraft Name
Weight 1
Weight 2
Weight 3
Weight 4
Weight 5
Weight 6
Weight 7
Max Weight
717-200 18,000 lb. Thrust
94,900 99,700 104,900 110,400 112,700 121,000
717-200 21,000 lb. Thrust
94,900 99,700 104,900 110,400 112,700 121,000
737-700 / CFM56-7B
115,600 120,400 125,500 134,800 146,400 154,500
767-400 / CF6-80C2B
288,818 299,037 310,125 329,861 354,427 380,906 422,420
777-300 / Trent 892
435,100 449,700 465,300 493,100 527,700 564,500 636,100
17
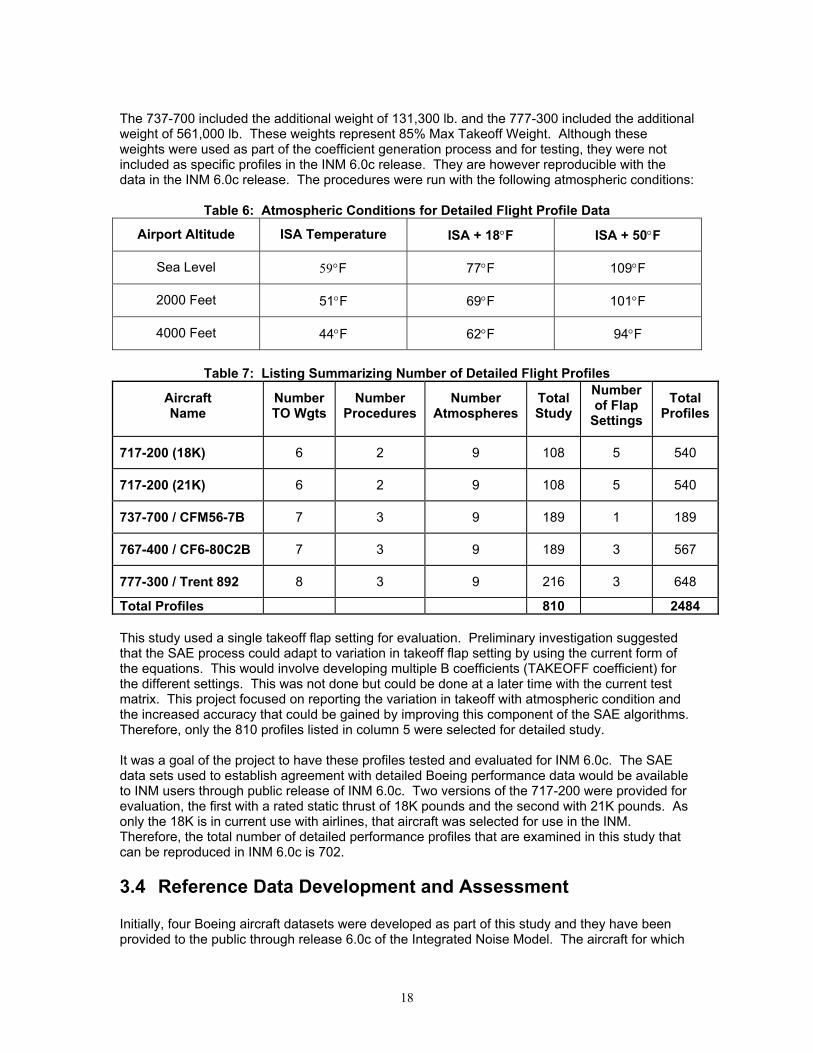
The 737-700 included the additional weight of 131,300 lb. and the 777-300 included the additional weight of 561,000 lb. These weights represent 85% Max Takeoff Weight. Although these weights were used as part of the coefficient generation process and for testing, they were not included as specific profiles in the INM 6.0c release. They are however reproducible with the data in the INM 6.0c release. The procedures were run with the following atmospheric conditions:
Table 6: Atmospheric Conditions for Detailed Flight Profile Data
Airport Altitude ISA Temperature ISA + 18°F ISA + 50°F
Sea Level 59°F 77°F 109°F
2000 Feet 51°F 69°F 101°F
4000 Feet 44°F 62°F 94°F
Table 7: Listing Summarizing Number of Detailed Flight Profiles
Aircraft Name
Number TO Wgts
Number Procedures
Number Atmospheres
Total Study
Number of Flap
Settings Total
Profiles
717-200 (18K) 6 2 9 108 5 540
717-200 (21K) 6 2 9 108 5 540
737-700 / CFM56-7B 7 3 9 189 1 189
767-400 / CF6-80C2B 7 3 9 189 3 567
777-300 / Trent 892 8 3 9 216 3 648
Total Profiles 810 2484 This study used a single takeoff flap setting for evaluation. Preliminary investigation suggested that the SAE process could adapt to variation in takeoff flap setting by using the current form of the equations. This would involve developing multiple B coefficients (TAKEOFF coefficient) for the different settings. This was not done but could be done at a later time with the current test matrix. This project focused on reporting the variation in takeoff with atmospheric condition and the increased accuracy that could be gained by improving this component of the SAE algorithms. Therefore, only the 810 profiles listed in column 5 were selected for detailed study. It was a goal of the project to have these profiles tested and evaluated for INM 6.0c. The SAE data sets used to establish agreement with detailed Boeing performance data would be available to INM users through public release of INM 6.0c. Two versions of the 717-200 were provided for evaluation, the first with a rated static thrust of 18K pounds and the second with 21K pounds. As only the 18K is in current use with airlines, that aircraft was selected for use in the INM. Therefore, the total number of detailed performance profiles that are examined in this study that can be reproduced in INM 6.0c is 702.
3.4 Reference Data Development and Assessment Initially, four Boeing aircraft datasets were developed as part of this study and they have been provided to the public through release 6.0c of the Integrated Noise Model. The aircraft for which
18

data were developed include the 717-200/BR715, 737-700/CFM56-7B, 767-400ER/CF6-80CB(F) and the 777-300/Trent 892. Data developed for the 737-700 replaced existing data in INM covering a greater range of aircraft weight and procedure profiles. Later, data for the 737-800/CFM56-7B26 and 757-300/RR535-211E4B were generated for ICAO-A, ICAO-B, and AC91-53 procedures for airport altitudes of Sea Level, 2000ft, and 4000ft for two ranges of weights associated with 65% and 75% total payload capacity. The addition of the AC91-93 takeoff will allow the calculation of performance coefficients for deeper cutback power than was available with the previous study. Temperatures in the matrices are ISO Standard Atmosphere (ISA), the engine breakpoint temperature and ISA+50F. By selecting the breakpoint temperature specifically, no guesswork is needed in determining the temperature lapse rate above break point. The later datasets include lift and drag coefficients, flap position as well as engine speed. The data files are otherwise similar to those used earlier in the study. Details for each of the newer requested profiles are given below. ICAO-A Takeoff Procedure · Full takeoff thrust, Flaps 5 to cutback altitude (1,500 ft AGL), climb at V2 + 20 kt for the 737-800 and V2 + 15 kt for the 757-300 · Select MCLT · Constant speed climb to 3,000 ft AGL · At 3,000ft AGL, accelerate to 250 KIAS while climbing with 45% of available thrust while retracting flaps on schedule · Constant speed climb to 10,000ft AGL at 250 KIAS ICAO-B Takeoff Procedure · Full takeoff thrust, Flaps 5 to cutback altitude (1,000ft AGL), climb at V2 + 20 kt for the 737-800 and V2 + 15 kt for the 757-300 · Retract flaps on schedule while climbing with 45% available thrust · Select MCLT · Constant speed climb to 3000ft AGL · At 3,000 ft AGL, accelerate to 250 KIAS while climbing with 45% of available thrust · Constant speed climb to 10000ft AGL at 250 KIAS AC91-53A Takeoff Procedure · Full takeoff thrust, Flaps 5 to cutback altitude (1,000ft AGL), climb at V2 + 20 kt for the 737-800 and V2 + 15 kt for the 757-300 · Cutback to 1.2% Engine Inoperative Climb Gradient · Constant Speed climb to 3,000ft AGL · Select MCLT · Accelerate to 250 KIAS while climbing with 45% of available thrust while retracting flaps on schedule · Constant speed climb to 10000ft AGL at 250 KIAS The aircraft data development included a review of existing guidance of the SAE AIR-1845 document and the INM Database Request Form, which is listed in Appendix B. During the data development, it was recognized that these are not self-contained documents. In developing INM datasets, there are ambiguities in establishing representative weights and procedures. There is also latitude in the operational range and conditions for the source data collected and regression analyses performed to obtain the performance coefficients. The following sections describe the additional assumptions necessary to complete development of an aircraft dataset given the specifications of the current INM Database Request Form.
19

3.4.1 Historical and Present Default Weights for Flight Profiles Since the INM relies on range of the mission as a proxy for airplane weight, the assumptions used to determine load factor and fuel load will influence the predicted noise and aerodynamic performance. The basis for that assumption is that on average, aircraft weight will increase with mission trip length. By providing a range of trip lengths, a corresponding range of weights for the INM user can be inferred. The INM Database request form seeks weights for the following mission trip lengths:
Table 8: INM Database Trip Lengths
INM Stage Length No. 1 2 3 4 5 6 7
Trip Length (nm X 1000) 0-.5 .5-1 1-1.5 1.5-2.5 2.5-3.5 3.5-4.5 4.5-Max
Weight (lb X 1000) ____ _____ ____ _____ _____ _____ _____
No other rules or guidance is provided which results in ambiguities in the choice of representative weights. For the given range, it is not clear if this should be the average range, maximum range, or a range likely to give an average noise dose. For example, for Stage length 2 (500-1000 nautical miles) 750 is the midpoint, but a slightly larger value may result in a more “average” noise dose given the logarithmic nature of noise contours. For INM submissions, Boeing uses a representative range at the 70% point between the bracketing ranges for each INM stage length. For Stage length 2, a value of 850nm would be used resulting in more conservative contours and one more likely to reflect the average noise dose for that range.
Other assumptions include those for average airplane load factor, passenger payload weight (pounds per passenger with bags), fuel load including reserves and cargo weight above and beyond the pounds per passenger assumption. For this study, Boeing utilized the assumptions in the following table to complete the INM submission.
Table 9: Summary of Boeing Aircraft Weight to Stage Length Assumptions
Parameter Assumption Representative Trip Length Min Range + 0.70*(Max Range – Min Range) Load Factor 80% Passenger Weight 200 Pounds per Passenger Fuel Load Fuel Required for Representative Trip Length + ATA
Domestic Reserves Typical reserves include 5% contingency fuel, 200 nm alternate landing with 30 minutes of holding.
Cargo No additional cargo over and above the assumed 200 pounds per passenger
Presently, there is a lack of information on operational weights that would help guide these assumptions. However, it is proposed that the SAE adopt a common set of default weight assumptions to remove uncertainty and thus harmonizing procedures across the aircraft industry.
20

The lack of a standard specification can result in “guessing” which may confuse and slow down the process. Historically, the load factor assumptions used to build the INM database have changed over time to reflect changes in design requirements. In other words, each INM data entry reflects the state of the airline industry and operations at the time of the submission. They may not reflect present day operations. This variation can allow a novice INM user to prove that newer aircraft are “noisier” if the newer aircraft assume higher load factors, cargo, and fuel reserves than older ones.
3.4.2 Proposed New Default Weights for Flight Profiles Under the aegis of the SAE A-21 Committee assumptions on weights are under review. A proposal to standardize on a fixed total payload percentage between 65% and 75% as opposed to passenger load factor is being studied. The percentage to be used has not yet been decided. Two sets of coefficient matrices supplied for this study for departures have been supplied to allow calculation of coefficients for either case or interpolation between. The INM Database Request Form seeks weights for the following mission trip lengths:
Table 10: INM Database Trip Lengths
Stage Length No. 1 2 3 4 5 6 7
Trip Length (nm X 1000) 0-.5 .5-1 1-1.5 1.5-2.5 2.5-3.5 3.5-4.5 4.5-Max
Weight (lb X 1000) ____ _____ ____ _____ _____ _____ _____
The proposed standard uses a representative range at the 70% point between the bracketing ranges for each INM stage length. For Stage length 2, a value of 850 would be used resulting in more conservative contours and one more likely to reflect the average noise dose for that range.
The new assumptions eliminate the need for average airplane load factor or assumed pounds per passenger or cargo assumptions. They are derived by the basic load carrying capacity of the airplane. The assumptions for fuel and reserves will not change from previous submissions. For this study, Boeing utilized the assumptions in the following table to complete the coefficient matrices.
Table 11: Summary of Proposed Aircraft Weight to Stage Length Assumptions
Parameter Assumption Representative Trip Length Min Range + 0.70*(Max Range – Min Range) Load Factor 65% and 75% Total Payload Fuel Load Fuel Required for Representative Trip Length + ATA
Domestic Reserves Typical reserves include 5% contingency fuel, 200 nm alternate landing with 30 minutes of holding.
Cargo No additional cargo over and above the assumed
payload percentage
21
Presently, a standard payload has not been chosen for operational weights that would help guide these assumptions. Data from U.S. domestic operators tend toward lighter weights. However, if the INM is to be applied to operators outside the US, higher operating weights may be needed. Once a standard is selected the INM database can be updated to the new standard.
3.4.3 Representative Procedures for Flight Profiles The INM Database Request Form asks that departure procedures be defined using SAE procedure steps for the given takeoff weights developed for trip lengths (see 3.1.2). Typically, the `STANDARD’ departure procedure listed in the INM involves two throttle settings: Max Takeoff and Max Climb. Since the results of the FAA regression method are a strong function of the chosen power settings, but not the chosen procedure, the most recent INM submissions include the ICAO-A and ICAO-B procedures since those were the profiles used in the coefficient generation test matrices. Coefficients generated from a matrix of profiles from one procedure can be used to successfully replicate the flight profiles of the others. If future international standard procedures for noise abatement are widely adopted, it may be necessary to develop different coefficients to reflect the thrust settings associated with the new procedures. As mentioned before in Section 3.3.2, the SAE equations cannot predict the correct cutback thrust settings if the cutback thrust is determined by an engine-out condition. Boeing has supplied approach profile points for the twin-aisle airplanes with a 3000ft level segment for deceleration to be more consistent with actual operations. For the single-aisle airplanes, some Boeing processes will need to be updated to incorporate this change.
3.5 SAE AIR-1845 Method for Approach Procedures The current SAE methods assume an approach profile that resembles a Continuous Descent Approach (CDA). But there is no method to develop coefficients to model such a procedure and presently it is not a standard approach procedure at most airports. Data based on the following test matrix were submitted to help evaluate the form of any new equations and the parameters that would be required.
The following table describes the rationale for the variables used in the test matrix:
Table 12: Supplied Test Matrix Rationale
Aircraft Weight 3 Different Approach landing weights were supplied.
60%, 90% (SAE AIR-1845 Standard) and 100% Max Landing Weight
Deceleration Speed Range
The level flight segment slows the airplane from the 250kt initial speed down to the speed required to arrive at the approach speed and configuration at 1000ft (usually < 160kt EAS).
Altitude (AFE) Glideslope Intercept
Data was supplied at intercept heights of 1500, 3000, and 6000 feet (AFE). In addition, two segment descent data with the initial segment at 1.5 degrees glide slope was added.
Atmosphere These procedures would be modeled over the same range of atmospheric conditions given in Table 6 of Section 3.3.2, but without the ISA+50F condition.
22

This test matrix is designed to represent what is typically flown in airport operations and what might be possible in future noise abatement landing procedures. The Continuous Descent Approach procedures correspond to the 6000ft glideslope intercept. Flap deployments during these approaches were triggered by deceleration to the reference speed for that flap setting. The flap setting at glideslope intercept was the lowest flap that would allow deceleration to that flap’s reference speed at idle power on the glideslope. Only flap settings used in the Flight Crew Training Manual’s standard schedule were used for the supplied approach data. The existing NPD database will have difficulty resolving the noise difference between the true CDA approach and a Low Drag Low Power (LDLP), as there is no pure airframe noise data (zero thrust) in the Boeing NPD databases. But, such a study should be able to resolve the effects of larger throttle excursions required for the other procedures. The SAE process correlates the state of the aircraft with the source noise and in the current procedure noise is determined by corrected net thrust. Future work would need to examine the noise source to confirm that this is adequate or whether the NPD method needs extending to include aircraft configuration as an additional parameter.
3.6 SAE Equation A1 Coefficients Section 3.1 provides a brief overview of the SAE AIR-1845 performance equations. For jet aircraft, equations A1, A2 and A3 are used for calculating corrected net thrust as a function of aircraft state parameters. These state parameters are related to corrected net thrust through coefficients. Although it is not stated directly, these coefficients may be obtained through ordinary linear regression analysis or Ordinary Least Squares (OLS). This task examined an appropriate data source for performing the linear regressions and to identify the software and error analysis that could be used by an aircraft performance or noise engineer to develop and evaluate the quality of the data that would be developed for the FAA’s Integrated Noise Model (INM). This section addresses the A1 equation specifically. Two sources of data that have been examined in the past are engine deck parameters and operational profiles. The use of engine deck parameters appears to be the most straight forward as they directly address the question of how corrected net thrust relates to parameters such as speed, altitude and temperature. However, only the parameters for Equations A1, A2 and A3 may be satisfied with such a data source as the other equations and how those equations relate to each other, can only be developed with the full operational profile. For the other SAE equations the overall quality of the fit of the system of equations is determined through comparisons with operational profiles. It is natural to ask if all SAE method data could be developed through the same set of operational profile data. To test this process Boeing supplied a comprehensive set of operational profiles that is described in Section 3.2.2. These profiles span multiple atmospheric conditions and there is opportunity to obtain a substantial range of corrected net thrust values as they might relate to the aircraft state parameters of speed, altitude and temperature. They have the further advantage of being presented in the same manner in which INM would use for processing SAE performance data. In INM, aircraft position information from a climb equation is in turn used to develop thrust information. INM, in a way, builds up aircraft performance data from the operational profile it is attempting to build. Operational profiles therefore, are a natural candidate to consider as a data source for developing the SAE A1, A2 and A3 equations.
23
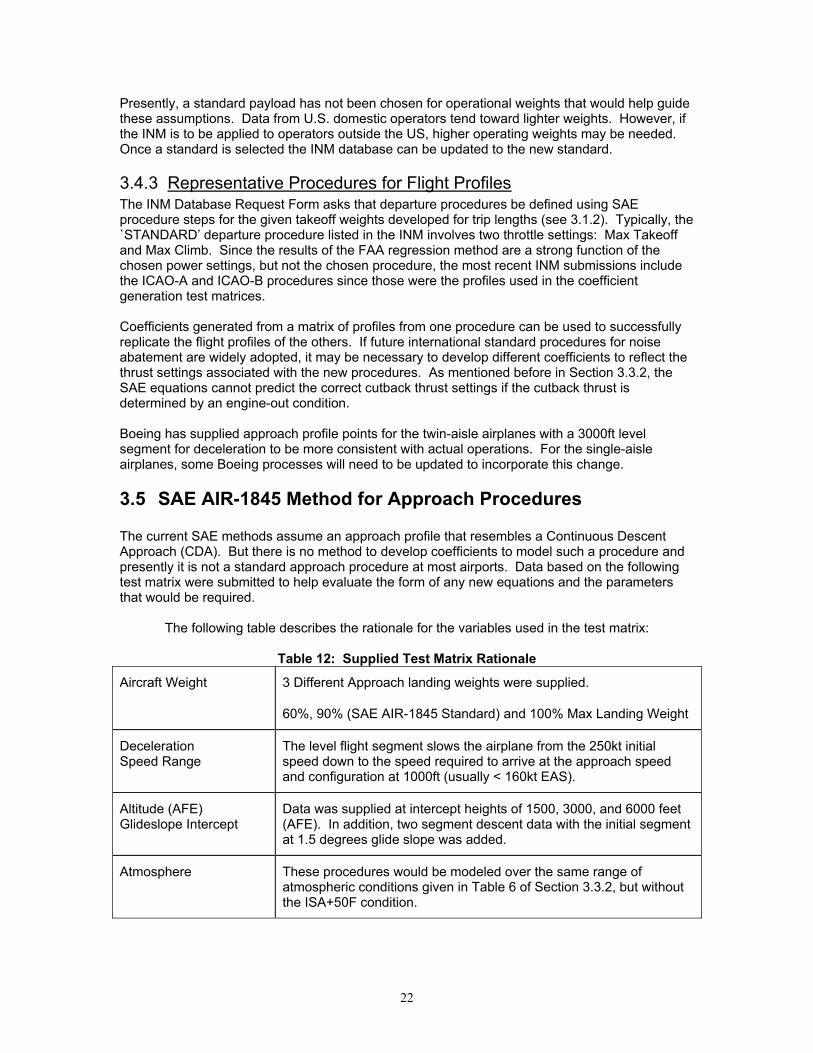
3.6.1 Below the Engine Breakpoint Temperature Table 13 below shows the agreement between corrected net thrust developed by the Boeing aircraft performance program and the SAE Equation A1. Data for the regression came from a multitude of ICAO B procedures. ICAO B procedures contain regions of flight in which both climb and acceleration occur for both Maximum Takeoff and Maximum climb power. For this reason, it is possible to develop both the SAE F coefficient (thrust change with CAS) & G coefficient (thrust change with altitude) from a single procedure type. This contrasts with the ICAO A procedure which contains a constant climb to 1500 feet AFE before cutback. The only opportunity for developing a relationship for how thrust changes with velocity would be to use the acceleration during takeoff roll.
In developing coefficients, it is possible to perform a statistical regression over all procedures, all weights and all atmospheres. For this exercise, SAE AIR-1845 Equation A1 coefficients were developed over all weights and all atmospheres for the ICAO B procedure only. The coefficients from these procedures were then used to develop an ICAO A procedure using the same power settings but with different flap/retraction schedules. The test was to examine the sensitivity of the regression to procedure type. The table below compares the SAE coefficients developed for each procedure set.
Table 13: SAE Coefficient Comparison by Source Data Procedure
Procedure Power Setting E F G
ICAO B Max Takeoff 60475.4 -56.8041 0.478788 ICAO A Max Takeoff 60523.7 -57.5770 0.487121
ICAO B Max Climb 45902.7 -39.5895 0.633446 ICAO A Max Climb 47573.0 -48.6421 0.705748
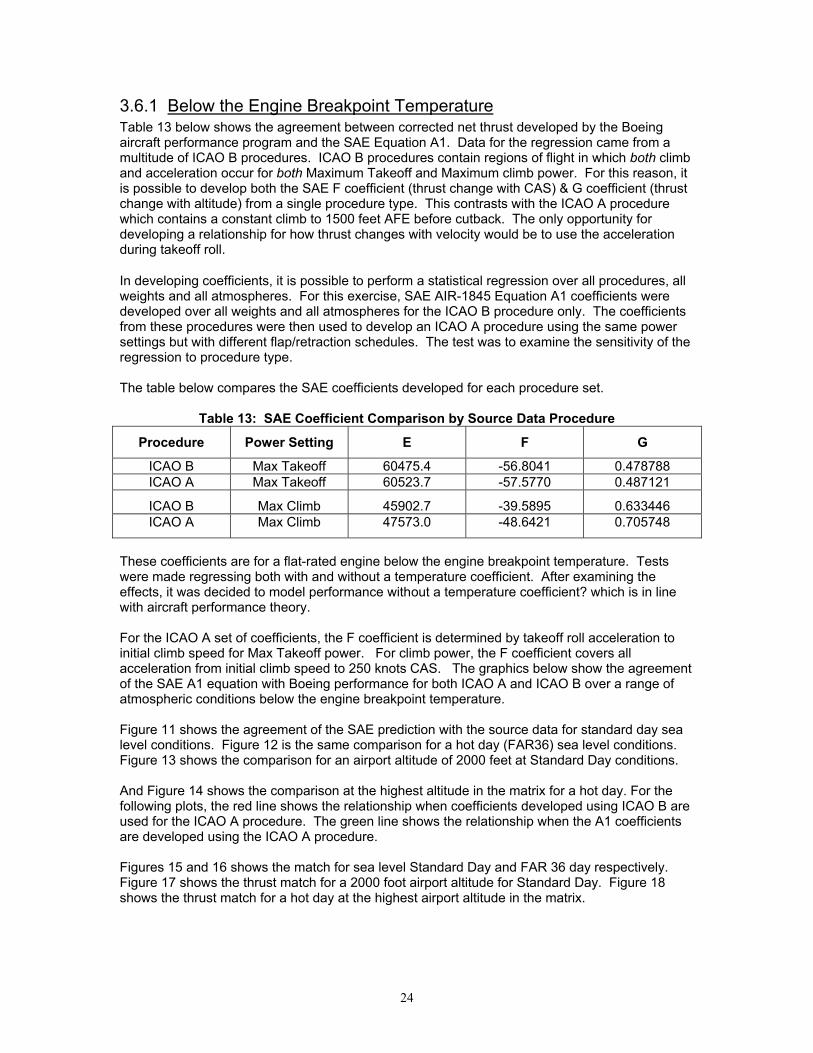
These coefficients are for a flat-rated engine below the engine breakpoint temperature. Tests were made regressing both with and without a temperature coefficient. After examining the effects, it was decided to model performance without a temperature coefficient? which is in line with aircraft performance theory. For the ICAO A set of coefficients, the F coefficient is determined by takeoff roll acceleration to initial climb speed for Max Takeoff power. For climb power, the F coefficient covers all acceleration from initial climb speed to 250 knots CAS. The graphics below show the agreement of the SAE A1 equation with Boeing performance for both ICAO A and ICAO B over a range of atmospheric conditions below the engine breakpoint temperature. Figure 11 shows the agreement of the SAE prediction with the source data for standard day sea level conditions. Figure 12 is the same comparison for a hot day (FAR36) sea level conditions. Figure 13 shows the comparison for an airport altitude of 2000 feet at Standard Day conditions. And Figure 14 shows the comparison at the highest altitude in the matrix for a hot day. For the following plots, the red line shows the relationship when coefficients developed using ICAO B are used for the ICAO A procedure. The green line shows the relationship when the A1 coefficients are developed using the ICAO A procedure. Figures 15 and 16 shows the match for sea level Standard Day and FAR 36 day respectively. Figure 17 shows the thrust match for a 2000 foot airport altitude for Standard Day. Figure 18 shows the thrust match for a hot day at the highest airport altitude in the matrix.
24

767-400/CF6-80C2B, ICAO B Procedure, 354,427 Pound Takeoff Weight Sea Level Airport, ISA Temperature (15C)
20000
25000
30000
35000
40000
45000
50000
55000
60000
65000
0 1 2 3 4 5 6 7 8 9 10 11 12 13 14 15 16 17
Distance from Brake Release ( )
Cor
rect
Net
Thr
ust p
er E
ngin
e (P
ound
s)
LSPS - Fnd SAE - Fnd
Max Climb Thrust E i
Max Takeoff Thrust
Figure 11: SAE Equation A1 - Corrected Net Thrust – Standard Day
Power Cutback Region
Power Cutback Region
767-400/CF6-80C2B, ICAO B Procedure, 354,427 Pound Takeoff Weight Sea Level Airport, ISA+10C Temperature (25C)
20000
25000
30000
35000
40000
45000
50000
55000
60000
65000
0 1 2 3 4 5 6 7 8 9 10 11 12 13 14 15 16 17
Distance from Brake Release ( )
Cor
rect
Net
Thr
ust p
er E
ngin
e (P
ound
s)
LSPS - Fnd SAE - Fnd
Max Takeoff Thrust
Max Climb Thrust
Figure 12: SAE Equation A1 - Corrected Net Thrust – Standard Hot Day (FAR36)
25

767-400/CF6-80C2B, ICAO B Procedure, 354,427 Pound Takeoff Weight
2000 Feet Airport, ISA Temperature (11C)
20000
25000
30000
35000
40000
45000
50000
55000
60000
65000
0 1 2 3 4 5 6 7 8 9 10 11 12 13 14 15 16 17
Distance from Brake Release ( )
Cor
rect
Net
Thr
ust p
er E
ngin
e (P
ound
s)
LSPS - Fnd SAE - Fnd
Max Takeoff Thrust
Max Climb Thrust
Figure 13: SAE Equation A1 - Corrected Net Thrust – Standard Day at 2000 Feet
Power Cutback
Power Cutback Region
767-400/CF6-80C2B, ICAO B Procedure, 354,427 Pound Takeoff Weight 4000 Feet Airport, ISA + 10C Temperature (17.1C)
20000
25000
30000
35000
40000
45000
50000
55000
60000
65000
0 1 2 3 4 5 6 7 8 9 10 11 12 13 14 15 16 17
Distance from Brake Release ( )
Cor
rect
Net
Thr
ust p
er E
ngin
e (P
ound
s)
LSPS - Fnd SAE - Fnd
Max Takeoff Thrust
Max Climb Thrust
Figure 14: SAE Equation A1 - Corrected Net Thrust – Standard Hot Day at 4000 Feet
26
Figure 15: SAE Equation A1 - Corrected Net Thrust – Standard Day
Figure 16: SAE Equation A1 - Corrected Net Thrust – Standard Hot Day (FAR36)
767-400/CF6-80C2B, ICAO A Procedure, 354,427 Pound Takeoff Weight
Sea Level Airport, ISA+10C Temperature (25C)
20000
25000
30000
35000
40000
45000
50000
55000
60000
65000
0 1 2 3 4 5 6 7 8 9 10
Distance from Brake Release ( )
Cor
rect
ed N
et T
hrus
t per
Eng
ine
LSPS - Fnd SAE/ICAO_B - Fnd SAE/ICAO_A - Fnd
Max Takeoff Thrust
Max Climb Thrust
Power Cutback
Power Cutback
767-400/CF6-80C2B, ICAO A Procedure, 354,427 Pound Takeoff Weight
Sea Level Airport, ISA Temperature (15C)
20000
25000
30000
35000
40000
45000
50000
55000
60000
65000
0 1 2 3 4 5 6 7 8 9 10
Distance from Brake Release ( )
Cor
rect
ed N
et T
hrus
t per
Eng
ine
LSPS - Fnd SAE/ICAO_B - Fnd SAE/ICAO_A - Fnd
Max Takeoff Thrust
Max Climb Thrust
27

767-400/CF6-80C2B, ICAO A Procedure, 354,427 Pound Takeoff Weight 2000 Feet Airport, ISA Temperature (11C)
20000
25000
30000
35000
40000
45000
50000
55000
60000
65000
0 1 2 3 4 5 6 7 8 9 10
Distance from Brake Release ( )
Cor
rect
ed N
et T
hrus
t per
Eng
ine
LSPS - Fnd SAE/ICAO_B - Fnd SAE/ICAO_A - Fnd
Max Takeoff Thrust
Max Climb Thrust E i
Figure 17: SAE Equation A1 - Corrected Net Thrust – Standard Day at 2000 Feet
Power Cutback
Power Cutback R i
767-400/CF6-80C2B, ICAO A Procedure, 354,427 Pound Takeoff Weight
4000 Feet Airport, ISA Temperature (17.1C)
20000
25000
30000
35000
40000
45000
50000
55000
60000
65000
0 1 2 3 4 5 6 7 8 9 10
Distance from Brake Release ( )
Cor
rect
ed N
et T
hrus
t per
Eng
ine
LSPS - Fnd SAE/ICAO_B - Fnd SAE/ICAO_A - Fnd
Max Takeoff Thrust
Max Climb Thrust E i
Figure 18: SAE Equation A1 - Corrected Net Thrust – Standard Hot Day at 4000 Feet For these atmospheric conditions, the regressions produced using only the ICAO A procedure show a visibly better fit for the max climb setting. A summary of the percent difference between Boeing source data and the SAE Equation A1 prediction using coefficients derived from ICAO-B procedures for the plots above is in Table 14.
28
Table 14: SAE Percent Difference from Boeing Performance
767-400/CF6-80C2B (354,427lb TOW)
Procedure Power State SL/15C SL/25C 2000 ft/11C 4000 ft/17.1C
ICAO B Max Takeoff -1.91% +2.02% -1.29% +2.52% -2.00% +0.72% -1.02% +1.03%
Max Climb -0.33% +0.50% 0.01% +0.72% -0.33% +-0.12% -0.20% +0.72%
ICAO A Max Takeoff -1.22% +2.02% -0.69% +2.52% -2.00% +0.72% -1.02% +1.02%
Max Climb -0.89% +0.15% -0.71% +0.43% -1.52% +-0.31% -1.63% +-0.04%
The error difference across all weights and atmospheric conditions for the 767-400 ICAO B procedure was:
Max Takeoff -2.27% +2.52%
Max Climb -0.47% +1.76%
3.6.2 Above the Breakpoint Temperature The SAE AIR-1845 methodology for the calculation of corrected net thrust is described by a regression equation of the form:
Fnd = E + FVc + Gh +HTam where
Fnd = corrected net thrust; Vc = calibrated airspeed; h = pressure altitude at which the aircraft is operating; Tam = ambient air temperature in which the aircraft is operating; E = constant of the regression equation, and
F,G, and H = coefficients which describe the variation in corrected net thrust with airspeed, altitude, and ambient temperature respectively.
The current SAE AIR-1845 documentation sets a limit on airport surface ambient temperatures to less than ISA + 15o C. Since most jet engines maintain rated thrust to approximately ISA + 15o C, commonly referred to as the breakpoint temperature, the temperature term in the regression equation in most cases is unnecessary. However, there is no reason to limit the SAE AIR-1845 methodology to airport temperatures below ISA + 15o C. The methodology is valid as long as there is data available to describe the variation in corrected net thrust with ambient temperature beyond the breakpoint temperature. Engine performance could be fully represented for all ambient temperatures using two forms of the SAE thrust equation, one for ambient temperatures below the breakpoint, and one for ambient temperatures above the breakpoint. Figure 19 illustrates how the two forms of the equation would be used. Corrected net thrust as a function of ambient temperature is shown for the Boeing 777-300 at Maximum Power and 150 knots calibrated airspeed.
29

The engines maintain rated thrust below the breakpoint; therefore the form of the equation used to describe engine performance in this temperature regime does not require the temperature term. Corrected net thrust decreases as ambient temperature increases above the breakpoint and the form of the regression equation used to represent this region includes a temperature term. It should be noted that the variation in corrected net thrust with altitude and airspeed (described by the F and G coefficients) will be different for the two temperature regimes. Consequently, a new set of E, F and G coefficients must be generated along with the H coefficient for the above breakpoint regression equation. The method for calculating the regression coefficients for above the breakpoint is essentially the same as described in Section 3.3.2 for below the breakpoint. The only differences are the form of the equation (the extra H term) and the data range used for the regression. Departure data should be provided for various airport altitudes and ambient temperatures at and above the breakpoint temperature. Data for airport temperatures below the breakpoint should not be used in this regression since the engine behaves differently below the breakpoint. Figure 20 gives aircraft performance for the 757-300 operating at a sea level airport with an ambient temperature of 42.8C (above breakpoint temperature). The solid line labeled “Boeing” represents the aircraft performance as predicted by the Boeing performance model under this temperature condition. The “INM_No_HiTemp_Coeff” curves illustrate how the SAE coefficients would predict performance if there were no modifications to the engine coefficients to account for high temperature conditions above the breakpoint. The results indicate that the SAE coefficients would over-predict engine net thrust, and consequently over-predict the aircraft climb angle. The “INM_HiTemp_Coeff” curves describe the aircraft performance predicted using a new set of engine coefficients developed for ambient temperatures above the breakpoint as described in this section. The results show much better agreement with the Boeing performance curves. The SAE methodology requires additional parameters to predict aircraft performance, namely rate-of-climb and aircraft target speed (See Section 3.8.1 on Equation A10). These parameters will also change under high temperature conditions. The “INM_HiTemp_Coeff_MOD” curves show performance prediction under the SAE methodology with high temperature engine coefficients and with rate-of-climb and speed modified for high temperatures. The results indicate minimal improvement in the prediction of aircraft performance. The biggest improvement is in the prediction of the location of engine power reduction from Maximum Takeoff Power to Maximum Climb Power. Figure 21 gives Sound Exposure Level (SEL) predictions under the aircraft flight path for the 757-300 at a sea level elevation, 42.8C ambient temperature airport for the three methods described. The results are presented as a differential for each method from the Boeing profile. Note that the high temperature coefficients yield results that are less than one dB from the Boeing profile except for the area right near the engine cutback where the difference is more dramatic. The errors for the “INM_No_HiTemp_Coeff” case are in the range of 1.0 - 1.5 dB. In this analysis, large errors in performance are not reflected as large errors in SEL due to the two gross errors in performance working in opposite directions. The over-prediction in thrust will lead to higher source noise levels, however, the over-prediction in climb angle increases source-to-receiver distances leading to a lower noise level. Figures 22 and 23 illustrate the same analysis for an airport at 4000 feet elevation, 35C ambient temperature (above breakpoint temperature). The results are similar to those at the sea level airport. Both airport scenarios demonstrate the need for developing high temperature engine coefficients for aircraft operating above breakpoint temperatures. The results also indicate there is minimal gain in accuracy when modifying the rate-of-climb and speed parameters for high temperature conditions.
30

50000
55000
60000
65000
70000
75000
80000
85000
90000
95000
100000
-20 -10 0 10 20 30 40 50 60 70
Ambient Temperature - deg C
Cor
rect
ed N
et T
hrus
t - lb
s.
Sea Level 10000 Feet
Fnd = E + F*V + G*h
Fnd = E + F*V + G*h + H*T
Breakpoint Temperature (ISA + 15C)
Figure 19: Boeing 777-300 “HiTemp” Coefficient Generation (Max Takeoff Power, 150kt)
757-300/RB211-535E4B, ICAO B Procedure, 203900 Pound Takeoff WeightSea Level Airport, ISA + 27.8C Temperature (42.8C)
0
5000
10000
15000
20000
25000
30000
35000
40000
45000
0 5 10 15 20
Distance from Brake Release (nm)
Cor
rect
ed N
et T
hrus
t per
Eng
ine
(Pou
nds)
0
2000
4000
6000
8000
10000
12000
Altitude - A
FE (ft) / True Airspeed (kts*10)
Boeing INM_No_HiTemp_CoeffINM_HiTemp_Coeff INM_HiTemp_Coeff_MOD
Thrust Altitude
Speed
Figure 20: Improvement of Flight Prediction at Sea Level by Adding High Temperature Data
31
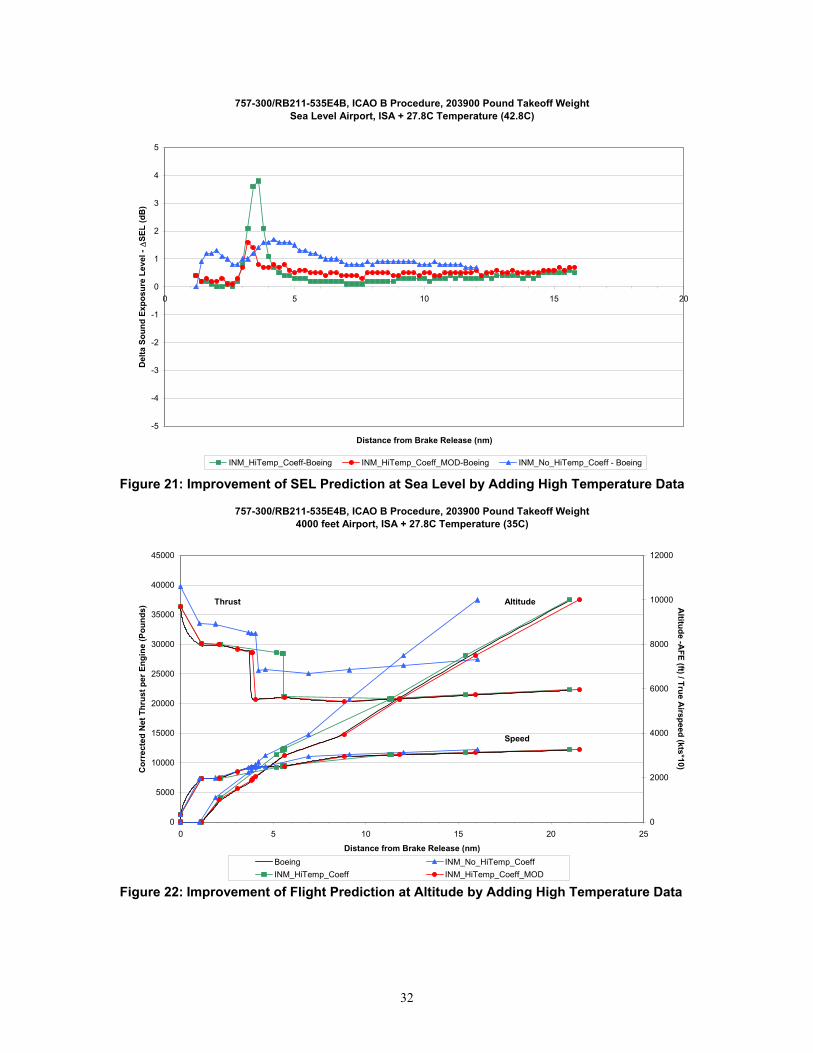
757-300/RB211-535E4B, ICAO B Procedure, 203900 Pound Takeoff WeightSea Level Airport, ISA + 27.8C Temperature (42.8C)
-5
-4
-3
-2
-1
0
1
2
3
4
5
0 5 10 15 20
Distance from Brake Release (nm)
Del
ta S
ound
Exp
osur
e Le
vel -
∆SE
L (d
B)
INM_HiTemp_Coeff-Boeing INM_HiTemp_Coeff_MOD-Boeing INM_No_HiTemp_Coeff - Boeing
Figure 21: Improvement of SEL Prediction at Sea Level by Adding High Temperature Data
757-300/RB211-535E4B, ICAO B Procedure, 203900 Pound Takeoff Weight4000 feet Airport, ISA + 27.8C Temperature (35C)
0
5000
10000
15000
20000
25000
30000
35000
40000
45000
0 5 10 15 20 25
Distance from Brake Release (nm)
Cor
rect
ed N
et T
hrus
t per
Eng
ine
(Pou
nds)
0
2000
4000
6000
8000
10000
12000
Altitude -A
FE (ft) / True Airspeed (kts*10)
Boeing INM_No_HiTemp_CoeffINM_HiTemp_Coeff INM_HiTemp_Coeff_MOD
Thrust Altitude
Speed
Figure 22: Improvement of Flight Prediction at Altitude by Adding High Temperature Data
32

757-300/RB211-535E4B, ICAO B Procedure, 203900 Pound Takeoff Weight4000 feet Airport, ISA + 27.8C Temperature (35C)
-5
-4
-3
-2
-1
0
1
2
3
4
5
0 5 10 15 20 25
Distance from Brake Release (nm)
Del
ta S
ound
Exp
osur
e Le
vel -
∆SE
L (d
B)
INM_HiTemp_Coeff-Boeing INM_HiTemp_Coeff_MOD-Boeing INM_No_HiTemp_Coeff-Boeing
Figure 23: Improvement of SEL Prediction at Altitude by Adding High Temperature Data
3.6.3 SAE General Thrust Coefficients Boeing has avoided using generalized thrust coefficients to avoid compounding the difficulties associated with generating coefficients from the A1 equation using the original Boeing method. In the future it should be possible to implement a similar procedure to the FAA regressions to the generalized thrust coefficients to operational profiles. 3.7 SAE Equation A8 and A10 Parameters Given a set of engine thrust coefficients, an INM modeler may assemble an aircraft profile with a Takeoff Roll Equation (A6) assuming an initial climb speed (A7). This takeoff roll is then followed by a series of climb (A8) and acceleration equations (A10) to model the full aircraft takeoff profile.
Different profiles will result depending on how these climb and acceleration equations are linked together. They are furthermore dependent on special climb and acceleration parameters that are necessary for these equations. These parameters may be thought of as “unadvertised” SAE coefficients in that they are required by the manufacturer to complete a default aircraft profile but are not identified as an “SAE coefficient” that varies with the weight of the aircraft or atmospheric conditions at the airport.
It is known these parameters do in fact vary with weight and atmospheric conditions. With the extensive test matrix developed for this project it is possible to view how these parameters vary with weight and atmosphere and to study their potential effect on noise contours. In real-world situations, aircraft performance will be more complicated than that given in the test matrix for this study. How an aircraft climbs and accelerates will depend on tradeoffs between engine power used for climb and engine power used for acceleration. In this exercise, the test matrix uses a
33

fixed set of assumptions on climb/acceleration tradeoffs in an effort to attribute changes in rate-of-climb to weight and atmosphere. In this way experience can be gained on how the SAE equations can reproduce profiles developed from a validated set of inputs such as generated by Boeing’s proprietary performance code (LSPS). Based on the results of this exercise, techniques may be developed for overriding default INM/SAE parameters with parameters taken from Flight Data Recorders (FDR data) or if accuracy can be made acceptable, aircraft speed and rate-of-climb as determined by the radar data available to airport noise modelers.
3.7.1 SAE Equation A10 Parameters The SAE Acceleration Equation (A10) requires a target acceleration speed and average rate of climb over an acceleration distance. INM data submissions develop these parameters for a specific weight and atmospheric conditions. Typically, aircraft manufacturers will provide takeoff profiles for a series of aircraft weights. In this way, noise modelers may view how rate-of-climb varies with weight for a particular procedure and takeoff/climb power settings. These parameters vary further with atmospheric conditions. However, the data required to model this is not provided. For Boeing aircraft developed for release to the INM user community, Equation A10 parameters were developed assuming Sea Level 15C atmospheric conditions. Table 15 shows how rate of climb and target speed vary with aircraft weight and atmospheric conditions for the 757-300/RB211-535E4B aircraft using an ICAO B Procedure.
Table 15: ICAO B Accelerate to Zero Flaps SAE Procedure Step 737-300/RB211-535E4B – Variation in parameter by weight and atmospheric conditions
Sea Level ISA 2000 Feet ISA 4000 Feet ISA Takeoff Weight
Rate-of-Climb
Target Speed
Rate-of-Climb
Target Speed
Rate-of Climb
Target Speed
203,900 2273.9 215.4 2104.9 215.3 1943.7 215.3 212,700 2184.4 218.6 2013.4 218.5 1861.6 218.2 222,100 2093.2 221.8 1935.3 221.6 1782.3 221.4 239,100 1946.2 228.0 1794.7 227.8 1644.9 227.6 260,700 1787.1 236.7 1643.3 236.2 1502.9 236.2 269,400 1727.4 240.1 1586.0 239.9 1448.0 239.6
The rate-of-climb and target speed for sea level ISA is representative of what is contained in an INM submission. If a noise modeler believes better agreement can be achieved though a different weight, the user may interpolate on weight to different rate-of-climb for this procedure at this atmosphere. The ability to vary this parameter by atmospheric conditions is not currently part of the SAE performance set of equations. As can be shown in the table, for similar zero flap target speeds, rate-of-climb decreases with airport altitude.
3.7.2 Equation A8/A10 Power Cutback Height Equations A8 and A10 are assembled with the appropriate parameters to match an overall takeoff procedure such as ICAO A, ICAO B or to a procedure specific to an airline. Part of this procedure will establish where power-cut-back occurs and it may occur at the end of a climb segment such as ICAO A (cutback at 1500 feet AFE) or it may occur in the middle of an acceleration segment. This is a user-supplied parameter that is identified by a switch in power setting between one SAE equation and its successor.
Table 16 shows how cutback altitude in terms of above field elevation (AFE) varies with aircraft weight and airport elevation. This example is for an ICAO B procedure, which initiates cutback some point after an acceleration to minimum zero flaps speed.
34
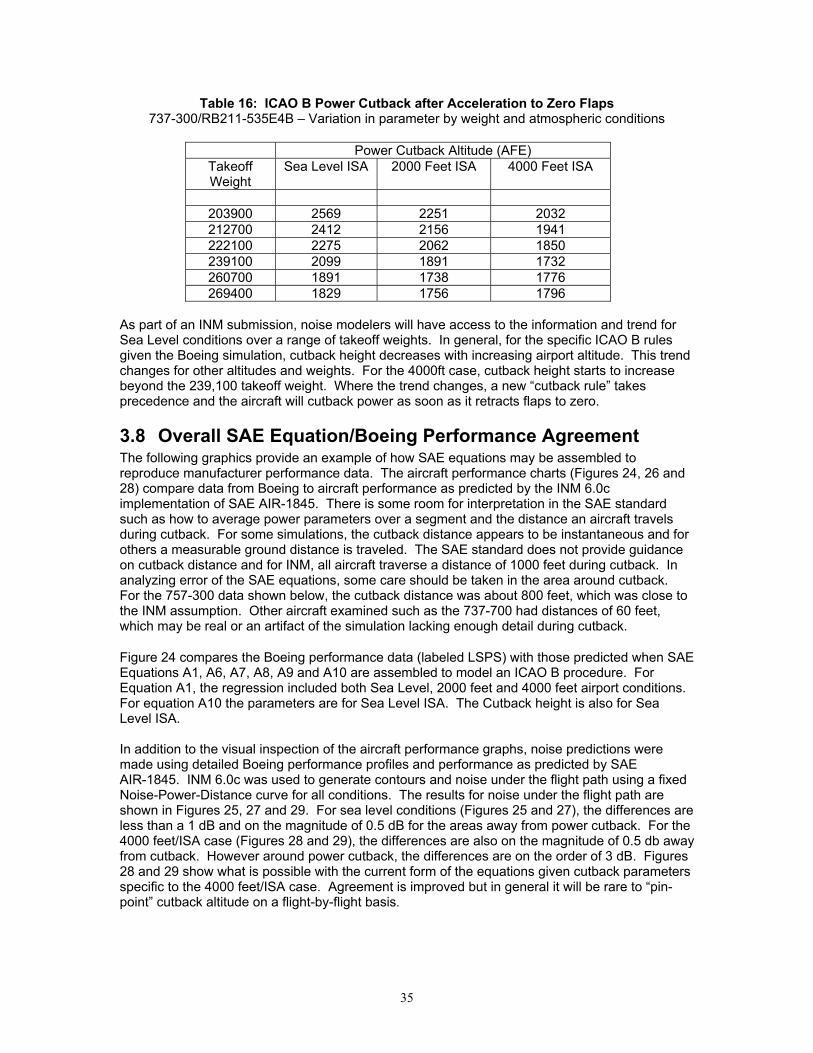
Table 16: ICAO B Power Cutback after Acceleration to Zero Flaps 737-300/RB211-535E4B – Variation in parameter by weight and atmospheric conditions
Power Cutback Altitude (AFE) Takeoff Weight
Sea Level ISA 2000 Feet ISA 4000 Feet ISA
203900 2569 2251 2032 212700 2412 2156 1941 222100 2275 2062 1850 239100 2099 1891 1732 260700 1891 1738 1776 269400 1829 1756 1796
As part of an INM submission, noise modelers will have access to the information and trend for Sea Level conditions over a range of takeoff weights. In general, for the specific ICAO B rules given the Boeing simulation, cutback height decreases with increasing airport altitude. This trend changes for other altitudes and weights. For the 4000ft case, cutback height starts to increase beyond the 239,100 takeoff weight. Where the trend changes, a new “cutback rule” takes precedence and the aircraft will cutback power as soon as it retracts flaps to zero.
3.8 Overall SAE Equation/Boeing Performance Agreement The following graphics provide an example of how SAE equations may be assembled to reproduce manufacturer performance data. The aircraft performance charts (Figures 24, 26 and 28) compare data from Boeing to aircraft performance as predicted by the INM 6.0c implementation of SAE AIR-1845. There is some room for interpretation in the SAE standard such as how to average power parameters over a segment and the distance an aircraft travels during cutback. For some simulations, the cutback distance appears to be instantaneous and for others a measurable ground distance is traveled. The SAE standard does not provide guidance on cutback distance and for INM, all aircraft traverse a distance of 1000 feet during cutback. In analyzing error of the SAE equations, some care should be taken in the area around cutback. For the 757-300 data shown below, the cutback distance was about 800 feet, which was close to the INM assumption. Other aircraft examined such as the 737-700 had distances of 60 feet, which may be real or an artifact of the simulation lacking enough detail during cutback.
Figure 24 compares the Boeing performance data (labeled LSPS) with those predicted when SAE Equations A1, A6, A7, A8, A9 and A10 are assembled to model an ICAO B procedure. For Equation A1, the regression included both Sea Level, 2000 feet and 4000 feet airport conditions. For equation A10 the parameters are for Sea Level ISA. The Cutback height is also for Sea Level ISA. In addition to the visual inspection of the aircraft performance graphs, noise predictions were made using detailed Boeing performance profiles and performance as predicted by SAE AIR-1845. INM 6.0c was used to generate contours and noise under the flight path using a fixed Noise-Power-Distance curve for all conditions. The results for noise under the flight path are shown in Figures 25, 27 and 29. For sea level conditions (Figures 25 and 27), the differences are less than a 1 dB and on the magnitude of 0.5 dB for the areas away from power cutback. For the 4000 feet/ISA case (Figures 28 and 29), the differences are also on the magnitude of 0.5 db away from cutback. However around power cutback, the differences are on the order of 3 dB. Figures 28 and 29 show what is possible with the current form of the equations given cutback parameters specific to the 4000 feet/ISA case. Agreement is improved but in general it will be rare to “pin-point” cutback altitude on a flight-by-flight basis.
35
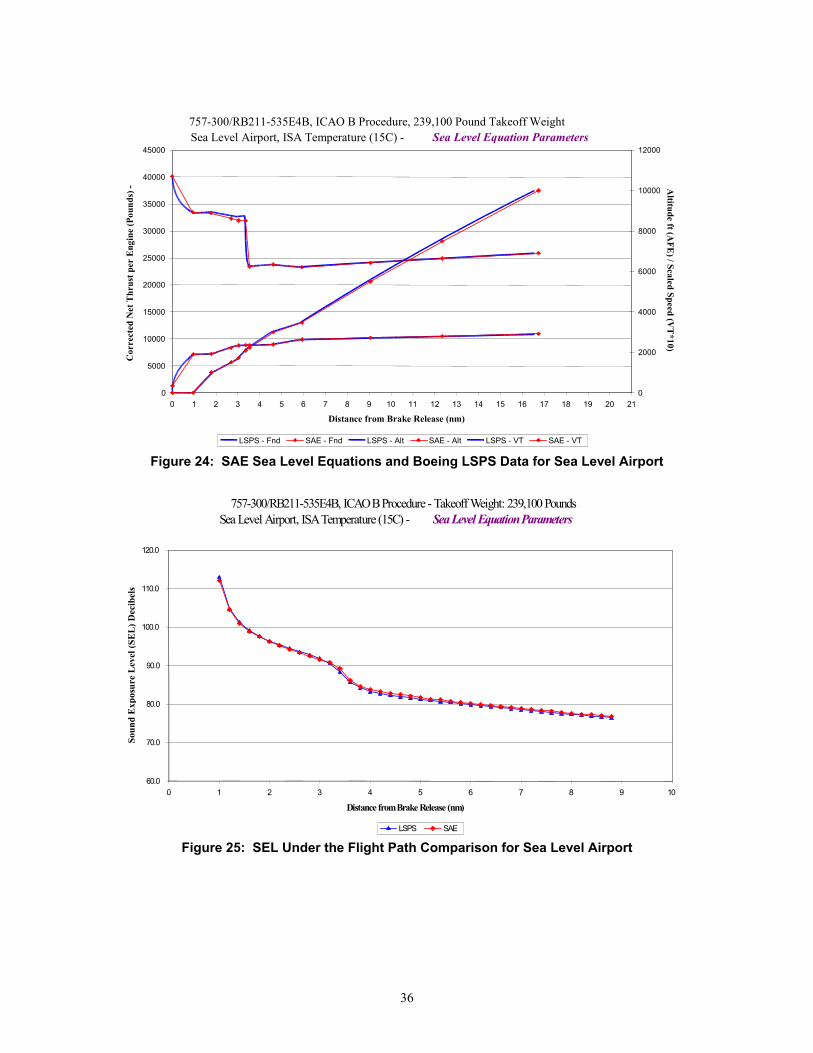
757-300/RB211-535E4B, ICAO B Procedure, 239,100 Pound Takeoff WeightSea Level Airport, ISA Temperature (15C) - Sea Level Equation Parameters
0
5000
10000
15000
20000
25000
30000
35000
40000
45000
0 1 2 3 4 5 6 7 8 9 10 11 12 13 14 15 16 17 18 19 20 21 Distance from Brake Release (nm)
0
2000
4000
6000
8000
10000
12000A
ltitude ft (AFE
) / Scaled Speed (VT
*10)
LSPS - Fnd SAE - Fnd LSPS - Alt SAE - Alt LSPS - VT SAE - VT
Cor
rect
ed N
et T
hrus
t per
Eng
ine
(Pou
nds)
-
Figure 24: SAE Sea Level Equations and Boeing LSPS Data for Sea Level Airport
757-300/RB211-535E4B, ICAO B Procedure - Takeoff Weight: 239,100 Pounds Sea Level Airport, ISA Temperature (15C) - Sea Level Equation Parameters
60.0
70.0
80.0
90.0
100.0
110.0
120.0
0 1 2 3 4 5 6 7 8 9 10
Distance from Brake Release (nm)
Soun
d E
xpos
ure
Lev
el (S
EL
) Dec
ibel
s
LSPS SAE
Figure 25: SEL Under the Flight Path Comparison for Sea Level Airport
36

757-300/RB211-535E4B, ICAO B Procedure, Takeoff Weight 239,100 Pounds4000 Feet Airport, ISA Temperature (7.1C) - Sea Level Equation Parameters
0
5000
10000
15000
20000
25000
30000
35000
40000
45000
0 1 2 3 4 5 6 7 8 9 10 11 12 13 14 15 16 17 18 19 20 21
Distance from Brake Release (nm)
0
2000
4000
6000
8000
10000
12000A
ltitude ft (AFE
) / Scaled Speed (VT
*10)
LSPS - Fnd SAE - Fnd LSPS - Alt SAE - Alt LSPS - VT SAE - VT
Cor
rect
ed N
et T
hrus
t per
Eng
ine
(Pou
nds)
-
Figure 26: Sea Level Equations and Boeing LSPS Data for 4000ft Airport In the above graphic, the default INM Sea Level profile has been adjusted to 4000 feet ISA using the existing INM implementation of SAE methodology. The cutback height does not change and a small divergence due to different rates-of-climb may be detected. This results in up to 3 dB differences in noise under the flight path as shown below. In this case the SAE method tends to over-predict up to 3 dB but the opposite can occur as well.
757-300/RB211-535E4B, ICAO B Procedure, Takeoff Weight: 239,100 Pounds4000 Feet Airport, ISA Temperature (7.1C) - Sea Level Equation Parameters
60.0
70.0
80.0
90.0
100.0
110.0
120.0
0 1 2 3 4 5 6 7 8 9
Distance from Brake Release (nm)
Soun
d SE
xpou
sre
leve
l (SE
L) -
Dec
ibel
s
LSPS SAE
10
Figure 27: SEL Under the Flight Path Comparison for 4000ft Airport
37

757-300/RB211-535E4B, ICAO B Procedure, 239,100 Pound Takeoff Weight4000 Feet Airport, ISA Temperature (7.1C) - 4000 ft/ISA Equation Parameters
0
5000
10000
15000
20000
25000
30000
35000
40000
45000
0 1 2 3 4 5 6 7 8 9 10 11 12 13 14 15 16 17 18 19 20 21
Distance from Brake Release (nm)
0
2000
4000
6000
8000
10000
12000A
ltitude ft (AFE
) / Scaled Speed (VT
*10)
LSPS - Fnd SAE - Fnd LSPS - Alt SAE - Alt LSPS - VT SAE - VT
Cor
rect
ed N
et T
hrus
t per
Eng
ine
(Pou
nds)
-
Figure 28: 4000ft SAE Equations and Boeing LSPS Data for 4000ft Airport In the above graphic the cutback height (as given by the climb equation in this case) and the rate-of-climb/target speed parameters for Equation A10 have been adjusted using the 4000 Feet/ISA performance profile.
757-300/RB211-535E4B, ICAO B Procedure, Takeoff Weight: 239,100 Pounds4000 Feet Airport, ISA Temperature (7.1C) - 4000 ft/ISA Equation Parameters
60.0
70.0
80.0
90.0
100.0
110.0
120.0
0.0 1.0 2.0 3.0 4.0 5.0 6.0 7.0 8.0 9.0 10.0
Distance from Brake Release (nm)
Soun
d SE
xpou
sre
leve
l (SE
L) -
Dec
ibel
s
LSPS SAE
Figure 29: SEL Under the Flight Path Comparison for 4000ft Airport The agreement is now back to the same as the Sea Level ISA case and demonstrates what can be done given more detailed data.
38
3.9 Process to Extract Aircraft State from Flight Data The simplest approach in determining aircraft state from flight data recorder output is to assume the INM coefficients are correct and use this assumption to map the recorded state from the airplane data to one of the discrete states predicted using the INM. The method depends on the quality of the coefficients generated by the new method. The new coefficient predictions match within 2.5% of Boeing calculated data over a wide range of altitudes and temperatures. Standard thrust derates tend to be increments of 10% so it should be possible to account for thrust derate simply by applying the ground roll equation for takeoff. Flight data recorder data gives a detailed time history of the airplane state, location and derivatives (velocity and acceleration) that could be used to extract both takeoff thrust and the thrust lapse rates for velocity. The airplane weight is known, as is the flap configuration. Using the INM flap coefficients calculated for the airplane, thrust could be calculated independent of the RPM or EPR data in the flight data. For departures, it is imporant to capture the ground roll and initial climb as these conditions are least subject to pilot action and allow confirmation of the engine lapse rate and initial power setting. A primary source of error for the method lies in the ground track taken by the airplane. The INM presently cannot handle the additional lift required for turns. This raises the importance of capturing the engine behavior early in the profile before any turns are initiated. Real flight tracks are rarely perfectly straight, and the actual locations of turns over many operations usually result in dispersion of the flight tracks.
3.10 Source Noise Data Development The INM database request calls for the development of Noise Power Distance curves and for representative 1/3-octave band spectra that will be used to either develop spectral class datasets or assign aircraft to existing spectral class data sets. Creation of the NPD data for altitudes up to 10000 feet is straightforward since standard? Boeing processes create NPD data up to that altitude. At present there is no elegant way to get data at higher altitudes. Manually extrapolating the flight spectral data at the higher altitudes and interpolating on thrust is the only way to get data for 16000 and 25000 feet. Spectral class data is supplied from the 1/3 octave band peak spectral data at a representative thrust and flight condition. The thrust level does not have to match exactly the level in the NPDs nor is any directivity information presently required for the spectrum.
39

4 Summary of Development Process The primary finding of this study is that the FAA method of generating aerodynamic coefficients (SAE AIR-1845) from operational procedures is effective and that the equations are valid for the types of procedures investigated. The method should be applicable to approach procedures and also for developing coefficients for the other thrust equations used in the SAE method. This is important since this was the primary barrier for industry to supply data for the INM database. In the development of NPD data it was discovered that previous assumptions on the range of power required for approach are inadequate for modeling newer low-power approach procedures. The present database will likely err on the side of conservatism (larger contours). The database will need updating to take advantage of improvements in flight procedures. The other problem posed by the INM versus flight certification is the extrapolation over long distances. Simple comparisons of decay of flight extrapolations versus spectral class extrapolations show substantial differences between the two. When the simplistic assumption that full-power takeoff directivity is chiefly aft, cutback directivity is chiefly at overhead and approach directivity is in the forward arc, the match improves for takeoff and cutback, but not approach. The peak spectrum at low altitude (certification measurements) may not be the most representative spectrum for propagation over long distances. Since the initial airplane datasets were supplied, lift and drag coefficient data has been supplied with the aerodynamics matrices. Because the SAE `R’ coefficient (drag/lift) and flap state can now be extracted from the manufacturer’s source data, the SAE aerodynamics coefficients may be calculated from a single source of vendor aerodynamics data. NPD generation has been updated using newly automated processes as well. Error checking of the process can be automated since the goal is to have the coefficient based profiles reproduce the source data. When the FAA coefficient generator is adapted to accept the new inputs, the profile matrices alone will be sufficient to define the INM aerodynamics coefficients. It will also be possible to do error checking of the complete system of equations since the lift and drag coefficients are now included in the data. The influence of altitude and temperature on each coefficient can be dealt with separately. The newer aerodynamics matrices for the last two study airplanes also include procedures with deeper cutback than max climb power. This will enable modeling of noise abatement procedures that rely on derated thrust. Approach data have been supplied for development of a similar coefficient generation scheme for application to low-noise approach procedures. The process of developing the approach matrices uncovered a potential problem in implementing Continuous Descent Approach for the 757-300. The aerodynamic capability of the aircraft is not the only limitation in implementing such procedures unless crew training and pilot workload issues are also covered. Since no decision has been issued yet from the SAE A21 Committee on the choice of representative payload percentage, the newer matrices were supplied at weights to cover the possible range (65% payload and 75% payload). When the value is chosen the data will be available to run matrices for either case (or interpolated from both). The approach matrices are benchmarked against Maximum Landing Weight and are not affected by payload assumptions. A side benefit of the study was to review the SAE and INM documents themselves apart from the equation definitions. The SAE document does not provide much detail on how to handle approach, and there is room for interpretation in the INM Database Request Form for the definitions of weights for stage lengths. The SAE standard makes passing reference to calculating bank angle and turn radius, but provides no guidance as to why this is significant.
40

The INM ignores the additional lift required to maintain a bank angle in a turn. This is the primary reason for using bank angle for turning flight. The results of this study will make it possible to model the airplane’s position more accurately as the database is updated using the techniques in the study. Further improvements in the NPD database are possible, but the model cannot be taken much further than the assumptions inherent to any NPD-based noise modeling system.
41

Appendix A Sample Output Developed from LSPS MODEL = 737 ENGINE = CFM56-7B24 BRGW = 115 000 FLAP = 5 TEMP = 59 ALT = 0 6/7/2001 DWF9406 HEADER TOW 120000 ELEV 0 TEMP 59 PROC MICAO-B
Dist Alt TAS CAS Fnd Time 0 0 6.3 6.3 22405 0.0 2 0 10.1 10.1 22266 0.6
19 0 17.7 17.7 21989 1.9 27 0 19.6 19.6 21919 2.2 35 0 21.5 21.5 21850 2.6
556 0 65.2 65.2 20377 10.4 1058 0 86.1 86.1 19752 14.5 1978 0 112.7 112.7 19005 20.0 2138 0 116.5 116.5 18896 20.9 2222 0 118.4 118.4 18842 21.3 2913 0 132.1 132.1 18488 24.5 3717 35 141.9 141.8 18233 28.0 4306 109 144.2 143.9 18200 30.5 4427 124 144.7 144.4 18193 31.0 4548 139 145.1 144.8 18186 31.5 4669 154 145.5 145.3 18179 32.0 4914 184 146.5 146.1 18166 33.0 5159 214 147.3 147.0 18152 34.0 5283 229 147.8 147.3 18145 34.5 5407 245 148.3 147.7 18138 35.0 5630 280 148.9 148.2 18136 35.9 5722 300 148.9 148.2 18141 36.3 6091 380 149.1 148.2 18162 37.8 6275 420 149.2 148.2 18173 38.5 6646 500 149.3 148.2 18193 40.0 6924 560 149.4 148.2 18209 41.2 7203 620 149.5 148.2 18225 42.3 7482 680 149.7 148.2 18240 43.4 7762 740 149.8 148.2 18256 44.6 8042 800 150.0 148.2 18271 45.7 8417 880 150.1 148.2 18292 47.2 8887 980 150.4 148.2 18319 49.1 8981 1000 150.4 148.2 18324 49.5 8988 1001 150.5 148.3 18299 49.5 9052 1007 151.0 148.8 17427 49.8 9243 1024 152.4 150.1 17403 50.5 9631 1059 155.1 152.8 17357 52.0 9762 1070 156.1 153.7 17341 52.5
The above example is displayed as viewed in MS EXCEL. In an ASCII editor, all columns of profile data would be separated by a ‘,’. This profile is displayed from ground roll to approximately 1000 feet of altitude where, in this example, cutback occurs. The sample file supplied is not actual 737 data.
42
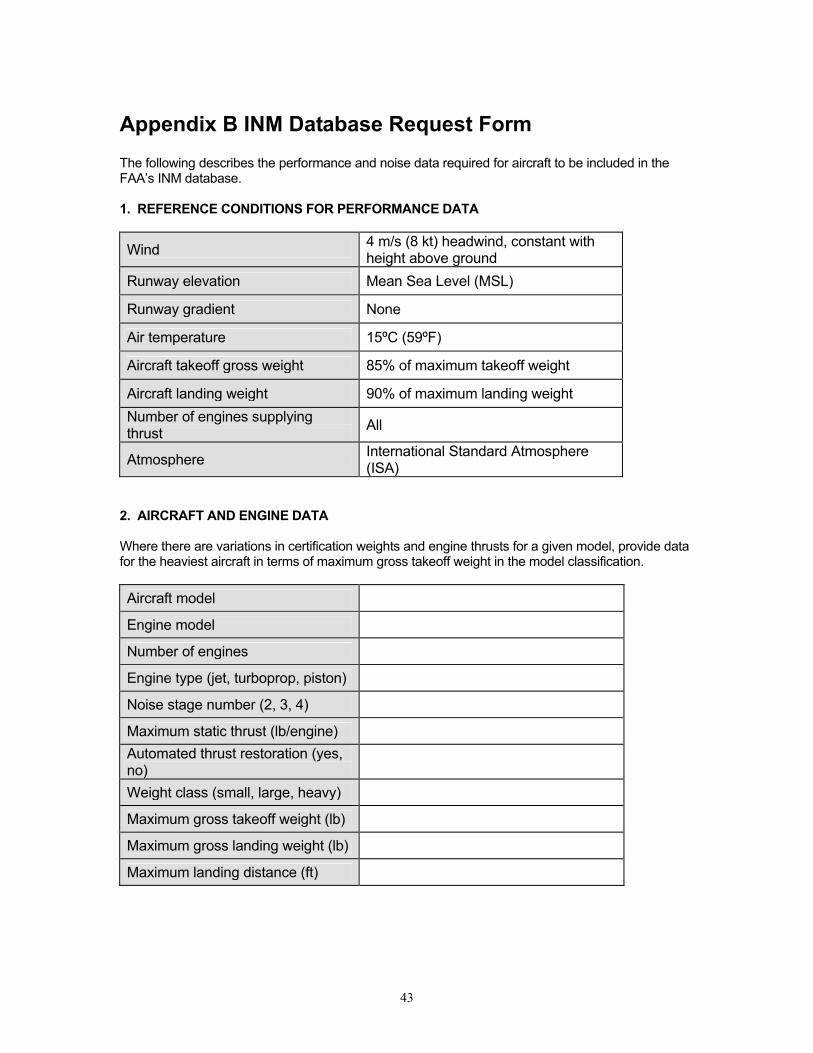
Appendix B INM Database Request Form
The following describes the performance and noise data required for aircraft to be included in the FAA’s INM database. 1. REFERENCE CONDITIONS FOR PERFORMANCE DATA
Wind 4 m/s (8 kt) headwind, constant with height above ground
Runway elevation Mean Sea Level (MSL)
Runway gradient None
Air temperature 15ºC (59ºF)
Aircraft takeoff gross weight 85% of maximum takeoff weight
Aircraft landing weight 90% of maximum landing weight Number of engines supplying thrust All
Atmosphere International Standard Atmosphere (ISA)
2. AIRCRAFT AND ENGINE DATA Where there are variations in certification weights and engine thrusts for a given model, provide data for the heaviest aircraft in terms of maximum gross takeoff weight in the model classification. Aircraft model
Engine model
Number of engines
Engine type (jet, turboprop, piston)
Noise stage number (2, 3, 4)
Maximum static thrust (lb/engine)
Automated thrust restoration (yes, no)
Weight class (small, large, heavy)
Maximum gross takeoff weight (lb)
Maximum gross landing weight (lb)
Maximum landing distance (ft)
43

Departure Takeoff Weights
Stage number Trip length (nmi) Weight (lb)
1 0-500 lb 2 500-1000 lb 3 1000-1500 lb 4 1500-2500 lb 5 2500-3500 lb 6 3500-4500 lb 7 >4500 lb
Takeoff weights should be developed so as to increase with an increase in mission trip length. Weight assumptions should use industry planning assumptions for load factor, average passenger weight, excess cargo beyond passenger weight, and fuel required to complete mission trip length. 3. AERODYNAMIC COEFFICIENTS Aerodynamic coefficients for use with the SAE AIR 1845 equations are required for available flap settings. The flap settings may be identified in degrees and abbreviations. Please provide data for all flap settings specified in Sections 5 and 6.
Flap Configuration Identifier
Operation
(A, D)1
Gear
Takeoff B (ft/lb)
Takeoff C (kt/√lb)
Land D (kt/√lb)
Drag/Lift R
D down D down D up 2 D up D up A up A up A down A down A down
1 A = Approach, D = Depart 2 Not applicable
44

4. ENGINE COEFFICIENTS For jet aircraft, engine coefficients in accordance with SAE AIR 1845 equations are required for maximum takeoff, maximum climb, and general thrust in terms of EPR or N1. The Max-Takeoff coefficients should be valid to 6,000 ft MSL, the Max-Climb and General Thrust coefficients should be valid to 16,000 ft MSL. This is necessary so that the INM accurately models operations at high altitude airports such as Denver and Salt Lake City. In addition, high temperature coefficients are required for operations above the thrust break temperature. INM uses the Max-Takeoff and Max-Climb coefficients below the breakpoint temperature and uses the Hi-Temp coefficients above the breakpoint temperature. The breakpoint temperature is at the intersection of the two curves. An example of Max-Takeoff and Hi-Temp Max-Takeoff curves is shown in Figure 20.
Thrust Type E (lb)
F (lb/kt)
Ga (lb/ft)
Gb (lb/ft2)
H (lb/ºC)
Max-Takeoff
Hi-Temp Max-Takeoff
Max-Climb
Hi-Temp Max-Climb
General Thrust
Hi-Temp General Thrust
K1a (lb/EPR)
K1b (lb/EPR2) or K2
lb/(N1/√θ) K3
lb/(N1/√θ)2 General Thrust
Hi-Temp General Thrust
For propeller-driven aircraft, engine coefficients in accordance with SAE AIR 1845 equations are required for propeller efficiency and installed net propulsive power.
Thrust Type Propeller Efficiency
Installed net propulsive horsepower (hp)
Max-Takeoff
Max-Climb
45

5. DEPARTURE PROCEDURES Departure procedures consist of a takeoff segment, and a combination of climb and acceleration segments up to an altitude of 10,000 ft AFE. A climb segment is defined by its endpoint altitude. An acceleration segment is defined by its rate-of-climb and the calibrated airspeed at its endpoint. The flap settings are indicated for endpoints of segments. These flap settings should coincide with those given in Section 3 above. Please provide procedural data for each stage length given in Section 2 above.
Stage
Number
Repeat table for each takeoff stage number (takeoff weight) listed in Section 2
Segment Type1
Thrust Type2 (T/C)
Flap Configuration
Identifier3
Endpoint Altitude (ft AFE)
Rate-of-Climb (ft/min)
Endpoint Speed (KCAS)
Start Thrust4 (lb)
Takeoff lb
Climb ft lb
Accelerate fpm kt lb
Accelerate fpm kt lb
Climb lb
Accelerate fpm kt lb
Climb ft lb
Climb ft lb
Climb 10000 lb 1 Add, delete, and sequence the segments as necessary to represent a takeoff procedure 2 T = Max-Takeoff, C = Max-Climb, as defined in Section 4 3 Use the identifiers in Section 3 4 These data are used to compare to INM-computed thrust values
46

6. APPROACH PROCEDURES
A landing profile should be calculated for a starting altitude of 6000 feet above field elevation (AFE). The flap settings should coincide with those given in Section 3 above.
Landing weight (lb) lbStopping distance
(ft) ft
Profile Point Operation Altitude
(ft AFE)
Distance fromTouchdown1
(ft)
Start Speed(KTAS)
Flap Configuration2
Start Thrust3 (lb)
1 Descend 6000 -114487 kt lb
2 Descend 3000 -57243 kt lb
3 Descend 1500 -28622 kt lb
4 Descend 1000 -19081 kt lb
5 Land 0 0 4kt lb
6 Reverse Thrust 0 ft kt lb
7 Start Taxi 0 ft kt lb
1 Glideslope is 3.0 degrees 2 Use identifiers in Section 3 3 These data are used to compare to INM-computed thrust values 4 Landing speed is for reference only; INM calculates landing speed using the D coefficient
(Section 3) and landing weight
47
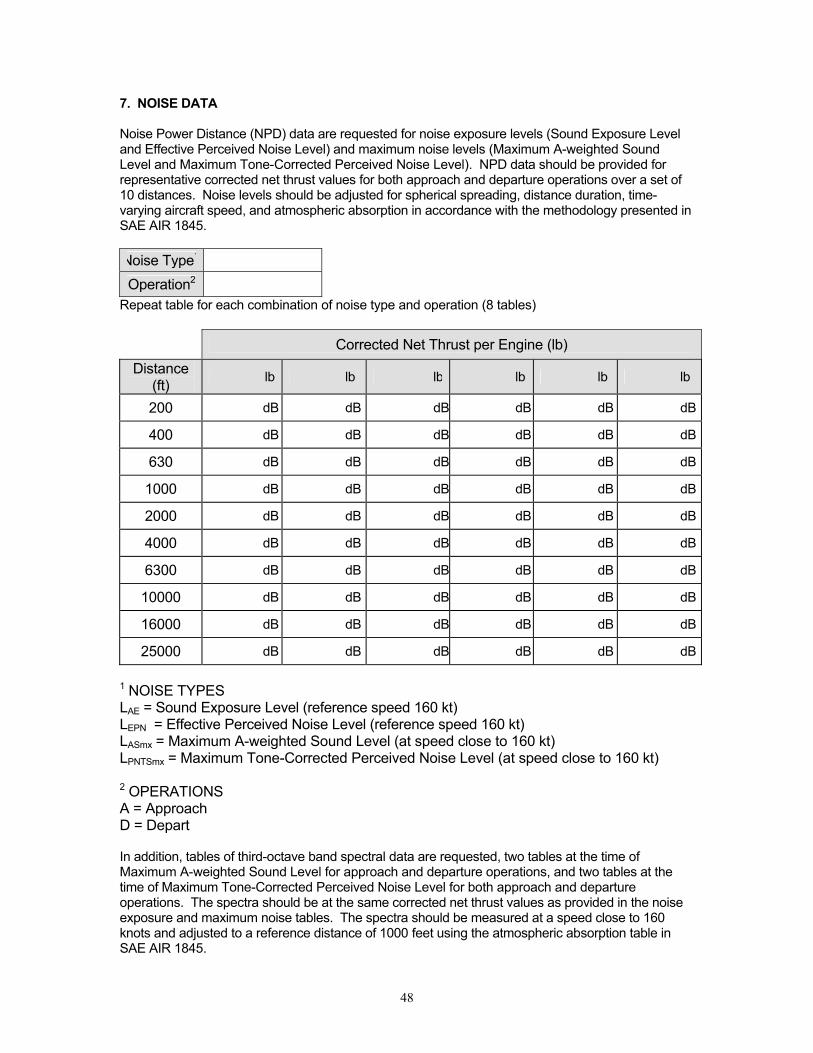
7. NOISE DATA Noise Power Distance (NPD) data are requested for noise exposure levels (Sound Exposure Level and Effective Perceived Noise Level) and maximum noise levels (Maximum A-weighted Sound Level and Maximum Tone-Corrected Perceived Noise Level). NPD data should be provided for representative corrected net thrust values for both approach and departure operations over a set of 10 distances. Noise levels should be adjusted for spherical spreading, distance duration, time-varying aircraft speed, and atmospheric absorption in accordance with the methodology presented in SAE AIR 1845. Noise Type1
Operation2 Repeat table for each combination of noise type and operation (8 tables)
Corrected Net Thrust per Engine (lb)
Distance (ft) lb lb lb lb lb lb
200 dB dB dB dB dB dB
400 dB dB dB dB dB dB
630 dB dB dB dB dB dB
1000 dB dB dB dB dB dB
2000 dB dB dB dB dB dB
4000 dB dB dB dB dB dB
6300 dB dB dB dB dB dB
10000 dB dB dB dB dB dB
16000 dB dB dB dB dB dB
25000 dB dB dB dB dB dB
1 NOISE TYPES LAE = Sound Exposure Level (reference speed 160 kt) LEPN = Effective Perceived Noise Level (reference speed 160 kt) LASmx = Maximum A-weighted Sound Level (at speed close to 160 kt) LPNTSmx = Maximum Tone-Corrected Perceived Noise Level (at speed close to 160 kt) 2 OPERATIONS A = Approach D = Depart In addition, tables of third-octave band spectral data are requested, two tables at the time of Maximum A-weighted Sound Level for approach and departure operations, and two tables at the time of Maximum Tone-Corrected Perceived Noise Level for both approach and departure operations. The spectra should be at the same corrected net thrust values as provided in the noise exposure and maximum noise tables. The spectra should be measured at a speed close to 160 knots and adjusted to a reference distance of 1000 feet using the atmospheric absorption table in SAE AIR 1845.
48
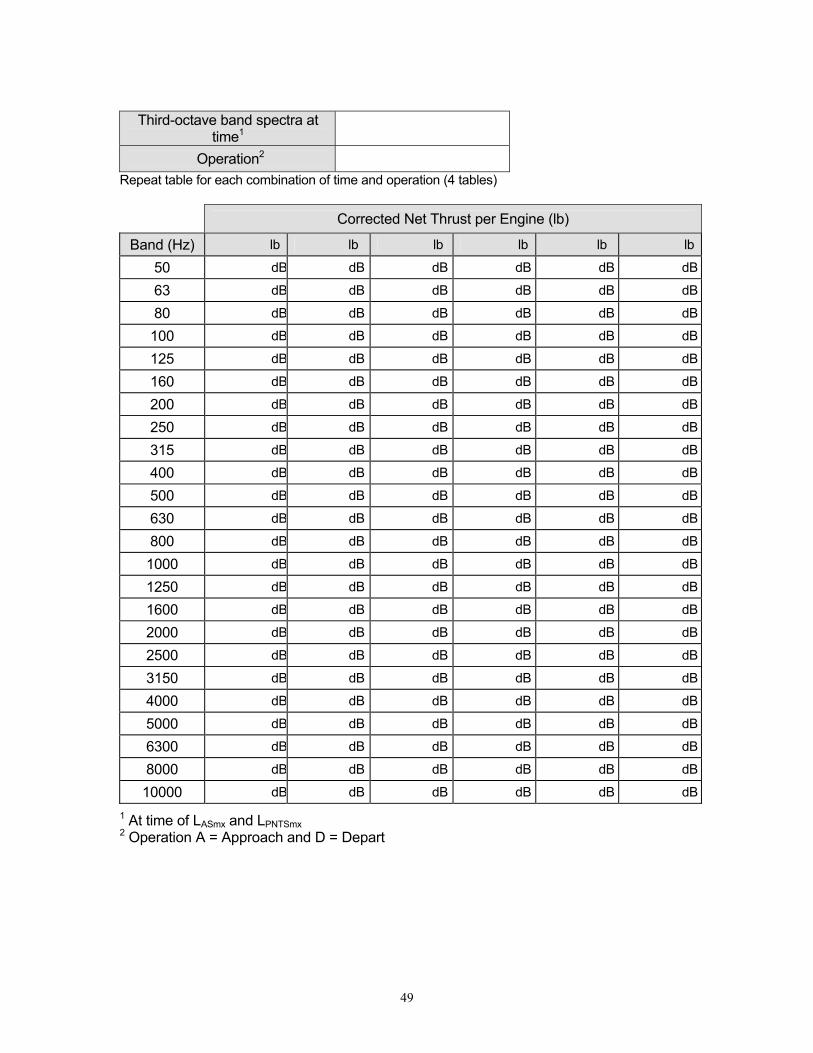
Third-octave band spectra at
time1
Operation2 Repeat table for each combination of time and operation (4 tables)
Corrected Net Thrust per Engine (lb)
Band (Hz) lb lb lb lb lb lb
50 dB dB dB dB dB dB
63 dB dB dB dB dB dB
80 dB dB dB dB dB dB
100 dB dB dB dB dB dB
125 dB dB dB dB dB dB
160 dB dB dB dB dB dB
200 dB dB dB dB dB dB
250 dB dB dB dB dB dB
315 dB dB dB dB dB dB
400 dB dB dB dB dB dB
500 dB dB dB dB dB dB
630 dB dB dB dB dB dB
800 dB dB dB dB dB dB
1000 dB dB dB dB dB dB
1250 dB dB dB dB dB dB
1600 dB dB dB dB dB dB
2000 dB dB dB dB dB dB
2500 dB dB dB dB dB dB
3150 dB dB dB dB dB dB
4000 dB dB dB dB dB
5000 dB dB dB dB dB dB
6300 dB dB dB dB dB dB
8000 dB dB dB dB dB dB
10000 dB dB dB dB dB dB
dB
1 At time of LASmx and LPNTSmx 2 Operation A = Approach and D = Depart
49

Example Maximum Takeoff Thrust vs. Temperature
Example of MAX and HI TEMP curves
16000
17000
18000
19000
20000
21000
22000
0 10 20 30 40 50 60 70 80 90 10
Airport Temperature (F)
Cor
rect
ed N
et T
rust
per
Eng
ine
(lb)
MAX TAKEOFF
HI TEMP TAKEOFF
Modern Jet AircraftSea LevelMax Takeoff160 Kcas
Break Point
0
50

Bibliography 1. Society of Automotive Engineers, Committee A-21, “Procedure for the Calculation of
Airplane Noise in the Vicinity of Airports”, Aerospace Information Report No. 1845, SAE Inc., 400 Commonwealth Drive, Warrendale, PA 15096, March 1986.
2. European Civil Aviation Conference, “Report on Standard Method of Computing Noise Contours around Civil Airports”, ECAC Doc 29, European Civil Aviation Conference, July, 1997.
3. ICAO, “Recommended Method for Computing Noise Contours around Airports”, Circular 205-AN/1/25, March 1987.
4. U.S. Department of Transportation (DOT), “Update of Aircraft Profile Data for the Integrated Noise Model Computer Program”, US DOT, Volpe National Transportation Systems Center, Cambridge, MA 02142, March 1992.
5. Federal Aviation Administration (FAA), Office of Environment and Energy (AEE), “INM 6.0 User’s Guide”, Federal Aviation Administration, Noise Division, AEE-100, 800 Independence Avenue, S.W., Washington DC, 20591, September, 1999.
6. Society of Automotive Engineers, Committee A-21, “Prediction Method for Lateral Attenuation of Airplane Noise During Takeoff and Landing”, Aerospace Information Report No. 1751, SAE Inc., 400 Commonwealth Drive, Warrendale, PA 15096, March 1981.
7. Society of Automotive Engineers, Committee A-21, “Standard Values of Atmospheric
Absorption as a Function of Temperature and Humidity”, Aerospace Recommended Practice No. 866A, SAE Inc., 400 Commonwealth Drive, Warrendale, PA 15096, March 1975.
8. American National Standards Institute. "Method for the Calculation of the Absorption of Sound by the Atmosphere", ANSI S1.26-1995, 1819 L Street NW, Washington, DC, 20036, 1995.
51

REPORT DOCUMENTATION PAGE Form ApprovedOMB No. 0704-0188
2. REPORT TYPE
Contractor Report 4. TITLE AND SUBTITLE
Review of Integrated Noise Model (INM) Equations and Processes5a. CONTRACT NUMBER
NAS1-97040
6. AUTHOR(S)
Forsyth, David W.; Gulding, John; and DiPardo, Joseph
7. PERFORMING ORGANIZATION NAME(S) AND ADDRESS(ES)
Boeing Commercial Airplane Company Federal Aviation AdministrationSeattle, Washington 98124-2207 Office of Environment and Energy 800 Independence Ave. S.W. Washington DC 20591
9. SPONSORING/MONITORING AGENCY NAME(S) AND ADDRESS(ES)
National Aeronautics and Space AdministrationLangley Research CenterHampton, VA 23681-2199
8. PERFORMING ORGANIZATION REPORT NUMBER
10. SPONSOR/MONITOR'S ACRONYM(S)
NASA
13. SUPPLEMENTARY NOTESNASA Langley technical monitor: Kevin P. Shepherd
12. DISTRIBUTION/AVAILABILITY STATEMENTUnclassified-UnlimitedSubject Category 71 Distribution: NonstandardAvailability: NASA CASI (301) 621-0390
19a. NAME OF RESPONSIBLE PERSON
STI Help Desk (email: [email protected])
14. ABSTRACT
The FAA's Integrated Noise Model (INM) relies on the methods of the SAE AIR-1845 'Procedure for the Calculation of Airplane Noise in the Vicinity of Airports' issued in 1986. Simplifying assumptions for aerodynamics and noise calculation were made in the SAE standard and the INM based on the limited computing power commonly available then. The key objectives of this study are 1) to test some of those assumptions against Boeing source data, and 2) to automate the manufacturer's methods of data development to enable the maintenance of a consistent INM database over time. These new automated tools were used to generate INM database submissions for six airplane types :737-700 (CFM56-7 24K), 767-400ER (CF6-80C2BF), 777-300 (Trent 892), 717-200 (BR715), 757-300 (RR535E4B), and the 737-800 (CFM56-7 26K).
15. SUBJECT TERMS
Aircraft Noise, Aircraft Noise Prediction
18. NUMBER OF PAGES
56
19b. TELEPHONE NUMBER (Include area code)
(301) 621-0390
a. REPORT
Unclassified
c. THIS PAGE
Unclassified
b. ABSTRACT
Unclassified
17. LIMITATION OF ABSTRACT
UL
Prescribed by ANSI Std. Z39.18Standard Form 298 (Rev. 8-98)
3. DATES COVERED (From - To)
5b. GRANT NUMBER
5c. PROGRAM ELEMENT NUMBER
5d. PROJECT NUMBER
5e. TASK NUMBER
165f. WORK UNIT NUMBER
781-20-11-01
11. SPONSOR/MONITOR'S REPORT NUMBER(S)
NASA/CR-2003-212414
16. SECURITY CLASSIFICATION OF:
The public reporting burden for this collection of information is estimated to average 1 hour per response, including the time for reviewing instructions, searching existing data sources, gathering and maintaining the data needed, and completing and reviewing the collection of information. Send comments regarding this burden estimate or any other aspect of this collection of information, including suggestions for reducing this burden, to Department of Defense, Washington Headquarters Services, Directorate for Information Operations and Reports (0704-0188), 1215 Jefferson Davis Highway, Suite 1204, Arlington, VA 22202-4302. Respondents should be aware that notwithstanding any other provision of law, no person shall be subject to any penalty for failing to comply with a collection of information if it does not display a currently valid OMB control number.PLEASE DO NOT RETURN YOUR FORM TO THE ABOVE ADDRESS.
1. REPORT DATE (DD-MM-YYYY)
05 - 200301-