Embed Size (px)
Citation preview
1
Technical Advances of Fluoroscopy with Special Interests in Automatic Dose Rate Control (ADRC) Logic of Cardiovascular
Angiography Systems
Pei-Jan Paul LinDepartment of Radiology
Beth Israel Deaconess Medical Centerand
Harvard Medical SchoolBoston, MA 02215
Beth Israel Deaconess Medical center Harvard Medical School
PART I.
Review of Basic Automatic Brightness Controlled Fluoroscopy
Systems.
And
Some historical overview.
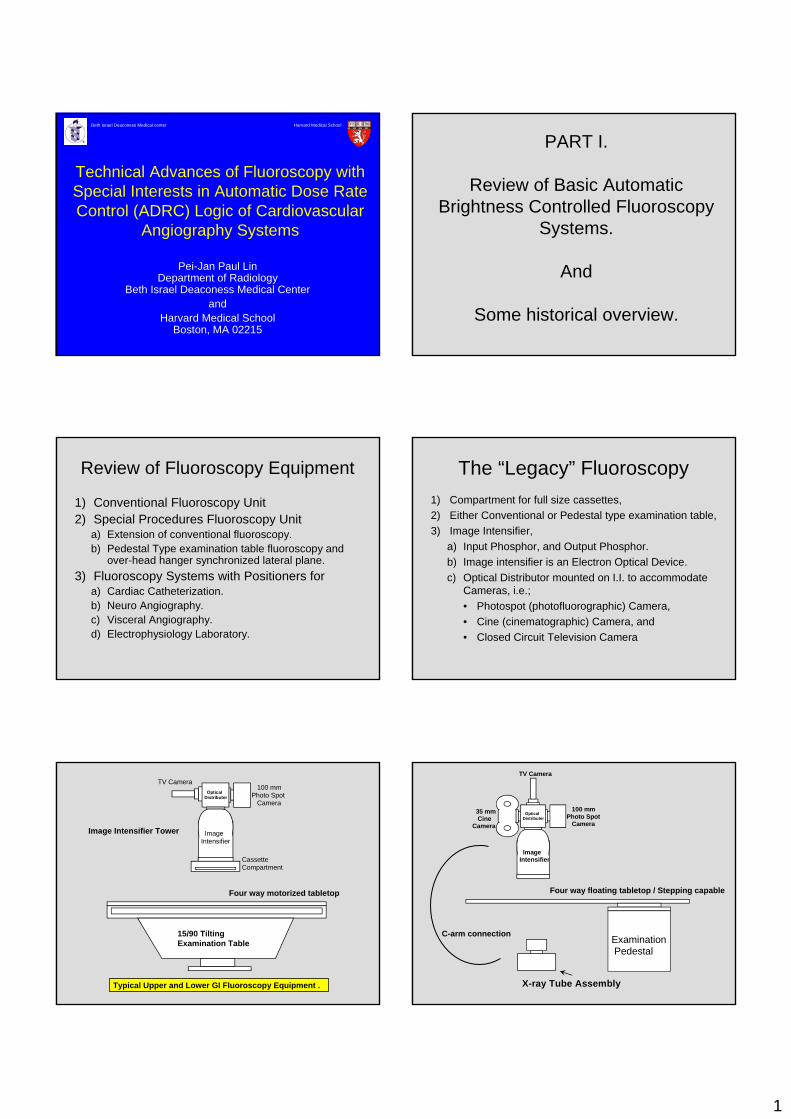
Review of Fluoroscopy Equipment
1) Conventional Fluoroscopy Unit2) Special Procedures Fluoroscopy Unit
a) Extension of conventional fluoroscopy.b) Pedestal Type examination table fluoroscopy and
over-head hanger synchronized lateral plane.3) Fluoroscopy Systems with Positioners for
a) Cardiac Catheterization.b) Neuro Angiography.c) Visceral Angiography.d) Electrophysiology Laboratory.
The “Legacy” Fluoroscopy1) Compartment for full size cassettes,2) Either Conventional or Pedestal type examination table,3) Image Intensifier,
a) Input Phosphor, and Output Phosphor.b) Image intensifier is an Electron Optical Device.c) Optical Distributor mounted on I.I. to accommodate
Cameras, i.e.;• Photospot (photofluorographic) Camera, • Cine (cinematographic) Camera, and• Closed Circuit Television Camera
Typical Upper and Lower GI Fluoroscopy Equipment .
100 mmPhoto Spot Camera
TV Camera
ImageIntensifier
OpticalDistributer
Cassette Compartment
Image Intensifier Tower
15/90 Tilting Examination Table
Four way motorized tabletop
35 mm CineCamera
100 mmPhoto Spot Camera
TV Camera
ImageIntensifier
OpticalDistributer
Examination Pedestal
X-ray Tube Assembly
Four way floating tabletop / Stepping capable
C-arm connection
2
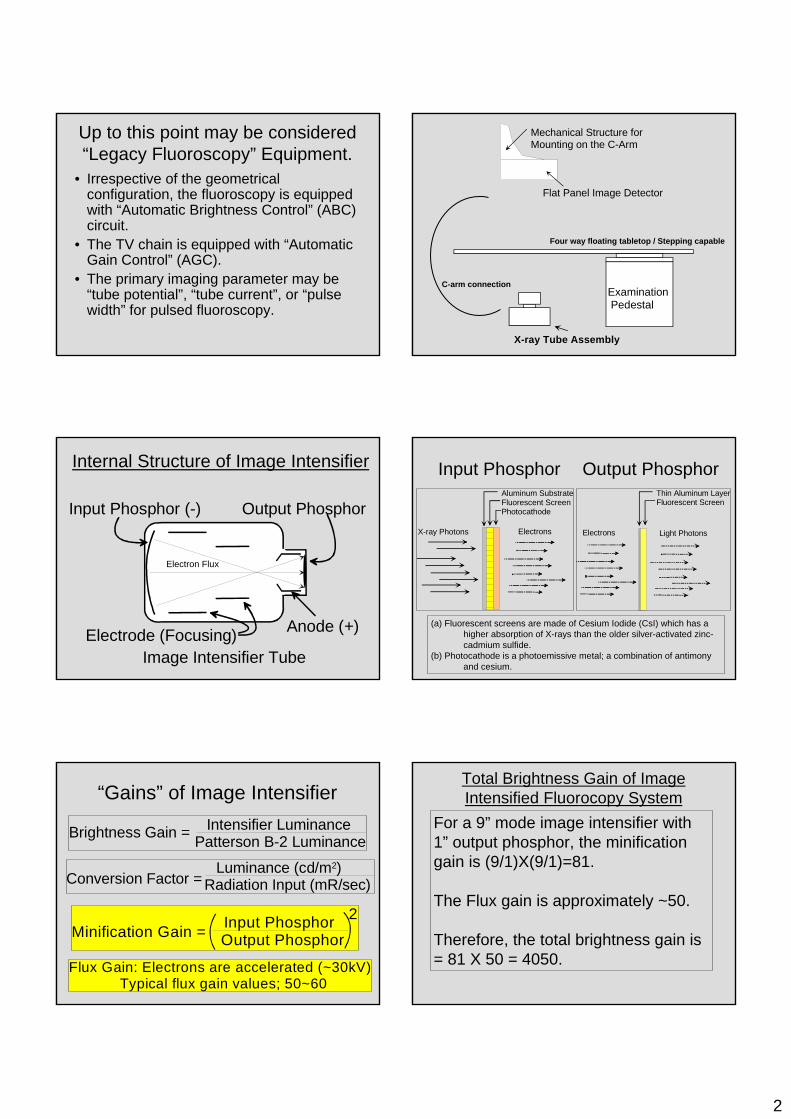
Up to this point may be considered “Legacy Fluoroscopy” Equipment.
• Irrespective of the geometrical configuration, the fluoroscopy is equipped with “Automatic Brightness Control” (ABC) circuit.
• The TV chain is equipped with “Automatic Gain Control” (AGC).
• The primary imaging parameter may be “tube potential”, “tube current”, or “pulse width” for pulsed fluoroscopy.
Examination Pedestal
X-ray Tube Assembly
Flat Panel Image Detector
Mechanical Structure forMounting on the C-Arm
C-arm connection
Four way floating tabletop / Stepping capable
Input Phosphor (-) Output Phosphor
Anode (+)
Image Intensifier TubeElectrode (Focusing)
Internal Structure of Image Intensifier
Electron Flux
Aluminum SubstrateFluorescent ScreenPhotocathode
X-ray Photons Electrons
Output Phosphor
Electrons Light Photons
Thin Aluminum LayerFluorescent Screen
Input Phosphor
(a) Fluorescent screens are made of Cesium Iodide (CsI) which has a higher absorption of X-rays than the older silver-activated zinc-cadmium sulfide.
(b) Photocathode is a photoemissive metal; a combination of antimony and cesium.
“Gains” of Image Intensifier
Brightness Gain = Intensifier LuminancePatterson B-2 Luminance
Conversion Factor =Luminance (cd/m2)
Radiation Input (mR/sec)
Minification Gain = Input PhosphorOutput Phosphor
2
Flux Gain: Electrons are accelerated (~30kV) Typical flux gain values; 50~60
Total Brightness Gain of Image Intensified Fluorocopy System
For a 9” mode image intensifier with 1” output phosphor, the minificationgain is (9/1)X(9/1)=81.
The Flux gain is approximately ~50.
Therefore, the total brightness gain is = 81 X 50 = 4050.
3
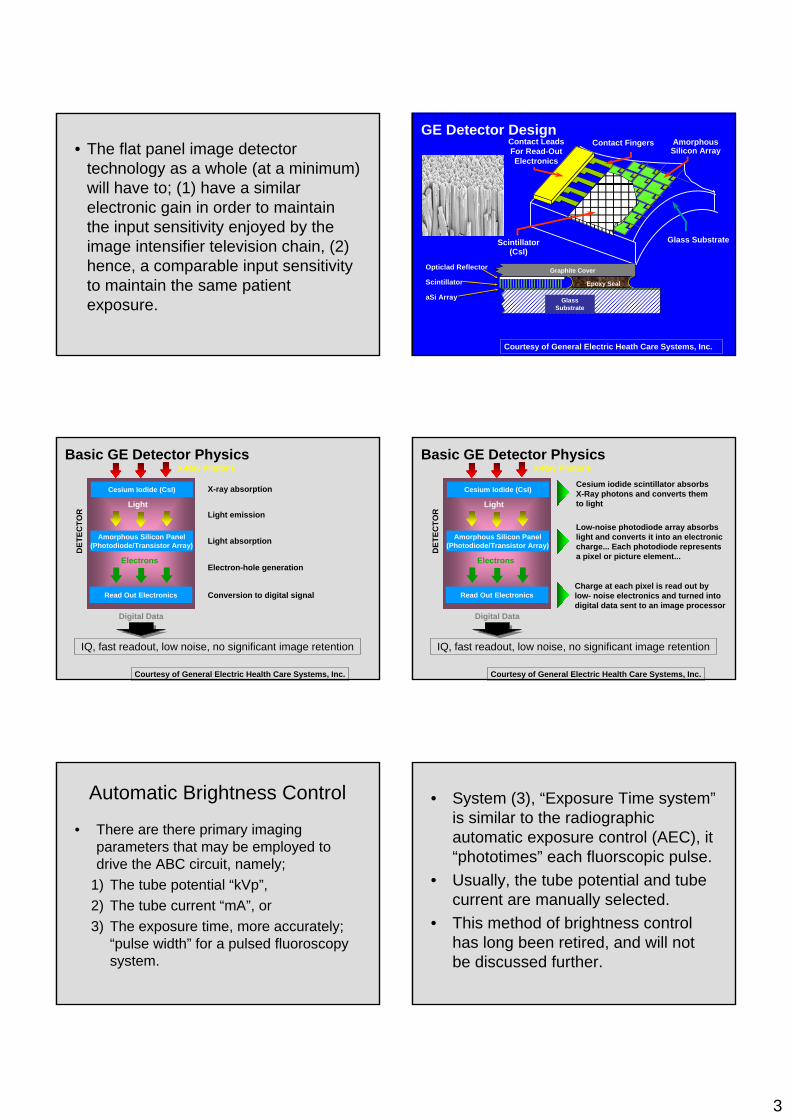
• The flat panel image detector technology as a whole (at a minimum) will have to; (1) have a similar electronic gain in order to maintain the input sensitivity enjoyed by the image intensifier television chain, (2) hence, a comparable input sensitivity to maintain the same patient exposure.
Glass Substrate
AmorphousSilicon Array
Contact Fingers
Scintillator(CsI)
Contact LeadsFor Read-OutElectronics
Scintillator
aSi Array
Opticlad Reflector
Glass Substrate
Graphite Cover
Epoxy Seal
GE Detector Design
Courtesy of General Electric Heath Care Systems, Inc.
X-ray absorption
Light emission
Light absorption
Electron-hole generation
Conversion to digital signal
X-Ray Photons
Cesium Iodide (CsI)
Light
Amorphous Silicon Panel(Photodiode/Transistor Array)
Electrons
Digital Data
Read Out Electronics
DET
ECTO
R
IQ, fast readout, low noise, no significant image retention
Basic GE Detector Physics
Courtesy of General Electric Health Care Systems, Inc.
X-Ray Photons
Cesium Iodide (CsI)
Light
Amorphous Silicon Panel(Photodiode/Transistor Array)
Electrons
Digital Data
Read Out Electronics
DET
ECTO
R
IQ, fast readout, low noise, no significant image retention
Basic GE Detector Physics
Cesium iodide scintillator absorbs X-Ray photons and converts them to light
Low-noise photodiode array absorbs light and converts it into an electronic charge... Each photodiode represents a pixel or picture element...
Charge at each pixel is read out by low- noise electronics and turned into digital data sent to an image processor
Courtesy of General Electric Health Care Systems, Inc.
Automatic Brightness Control
• There are there primary imaging parameters that may be employed to drive the ABC circuit, namely;
1) The tube potential “kVp”, 2) The tube current “mA”, or 3) The exposure time, more accurately;
“pulse width” for a pulsed fluoroscopy system.
• System (3), “Exposure Time system”is similar to the radiographic automatic exposure control (AEC), it “phototimes” each fluorscopic pulse.
• Usually, the tube potential and tube current are manually selected.
• This method of brightness control has long been retired, and will not be discussed further.
4
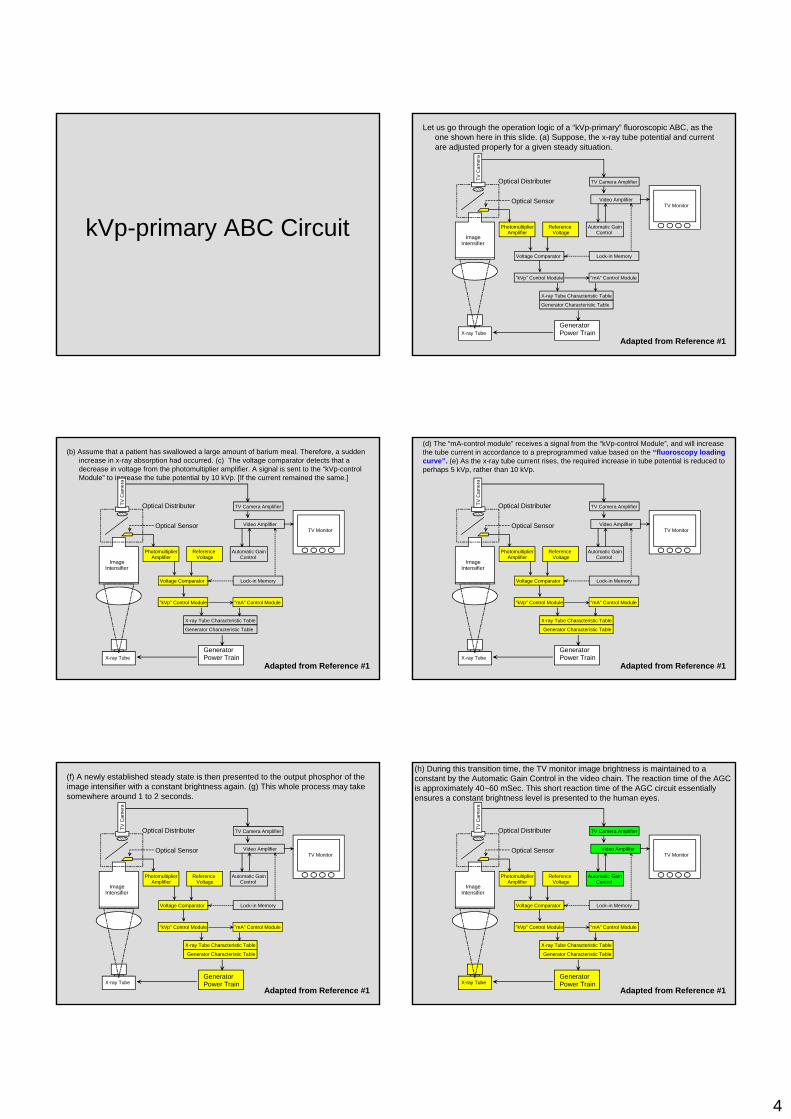
kVp-primary ABC Circuit TV CameraImageIntensi fierOptical Sensor,Photomultiplier.TV Video Signal TrainTV CameraPre-amplifier TV M VideoAmplifierPhotomultiplie rAmprefier Reference VoltageVoltage Compara torAutomatic Gain Control Lock-in Memory
ImageIntensifier
TV Camera Amplifier
Video AmplifierTV Monitor
Photomultiplier Amplifier
Voltage Comparator
TV C
amer
a
Optical Distributer
Reference Voltage
Automatic Gain Control
Lock-in Memory
"kVp" Control Module "mA" Control Module
X-ray Tube Characteristic Table
Generator Characteristic Table
Generator Power TrainX-ray Tube
Optical Sensor
Adapted from Reference #1
Let us go through the operation logic of a “kVp-primary” fluoroscopic ABC, as the one shown here in this slide. (a) Suppose, the x-ray tube potential and current are adjusted properly for a given steady situation.
TV CameraImageIntensi fierOptical Sensor,Photomultiplier.TV Video Signal TrainTV CameraPre-amplifier TV M VideoAmplifierPhotomultiplie rAmprefier Reference VoltageVoltage Compara torAutomatic Gain Control Lock-in Memory
Adapted from Reference #1
(b) Assume that a patient has swallowed a large amount of barium meal. Therefore, a sudden increase in x-ray absorption had occurred. (c) The voltage comparator detects that a decrease in voltage from the photomultiplier amplifier. A signal is sent to the “kVp-control Module” to increase the tube potential by 10 kVp. [If the current remained the same.]
ImageIntensifier
TV Camera Amplifier
Video AmplifierTV Monitor
Photomultiplier Amplifier
Voltage Comparator
TV C
amer
a
Optical Distributer
Reference Voltage
Automatic Gain Control
Lock-in Memory
"kVp" Control Module "mA" Control Module
X-ray Tube Characteristic Table
Generator Characteristic Table
Generator Power TrainX-ray Tube
Optical Sensor
TV CameraImageIntensi fierOptical Sensor,Photomultiplier.TV Video Signal TrainTV CameraPre-amplifier TV M VideoAmplifierPhotomultiplie rAmprefier Reference VoltageVoltage Compara torAutomatic Gain Control Lock-in Memory
Adapted from Reference #1
(d) The “mA-control module” receives a signal from the “kVp-control Module”, and will increase the tube current in accordance to a preprogrammed value based on the “fluoroscopy loading curve”. (e) As the x-ray tube current rises, the required increase in tube potential is reduced to perhaps 5 kVp, rather than 10 kVp.
ImageIntensifier
TV Camera Amplifier
Video AmplifierTV Monitor
Photomultiplier Amplifier
Voltage Comparator
TV C
amer
a
Optical Distributer
Reference Voltage
Automatic Gain Control
Lock-in Memory
"kVp" Control Module "mA" Control Module
X-ray Tube Characteristic Table
Generator Characteristic Table
Generator Power TrainX-ray Tube
Optical Sensor
TV CameraImageIntensi fierOptical Sensor,Photomultiplier.TV Video Signal TrainTV CameraPre-amplifier TV M VideoAmplifierPhotomultiplie rAmprefier Reference VoltageVoltage Compara torAutomatic Gain Control Lock-in Memory
Adapted from Reference #1
(f) A newly established steady state is then presented to the output phosphor of the image intensifier with a constant brightness again. (g) This whole process may take somewhere around 1 to 2 seconds.
ImageIntensifier
TV Camera Amplifier
Video AmplifierTV Monitor
Photomultiplier Amplifier
Voltage Comparator
TV C
amer
a
Optical Distributer
Reference Voltage
Automatic Gain Control
Lock-in Memory
"kVp" Control Module "mA" Control Module
X-ray Tube Characteristic Table
Generator Characteristic Table
Generator Power TrainX-ray Tube
Optical Sensor
TV CameraImageIntensi fierOptical Sensor,Photomultiplier.TV Video Signal TrainTV CameraPre-amplifier TV M VideoAmplifierPhotomultiplie rAmprefier Reference VoltageVoltage Compara torAutomatic Gain Control Lock-in Memory
Adapted from Reference #1
(h) During this transition time, the TV monitor image brightness is maintained to a constant by the Automatic Gain Control in the video chain. The reaction time of the AGC is approximately 40~60 mSec. This short reaction time of the AGC circuit essentially ensures a constant brightness level is presented to the human eyes.
ImageIntensifier
TV Camera Amplifier
Video AmplifierTV Monitor
Photomultiplier Amplifier
Voltage Comparator
TV C
amer
a
Optical Distributer
Reference Voltage
Automatic Gain Control
Lock-in Memory
"kVp" Control Module "mA" Control Module
X-ray Tube Characteristic Table
Generator Characteristic Table
Generator Power TrainX-ray Tube
Optical Sensor
5
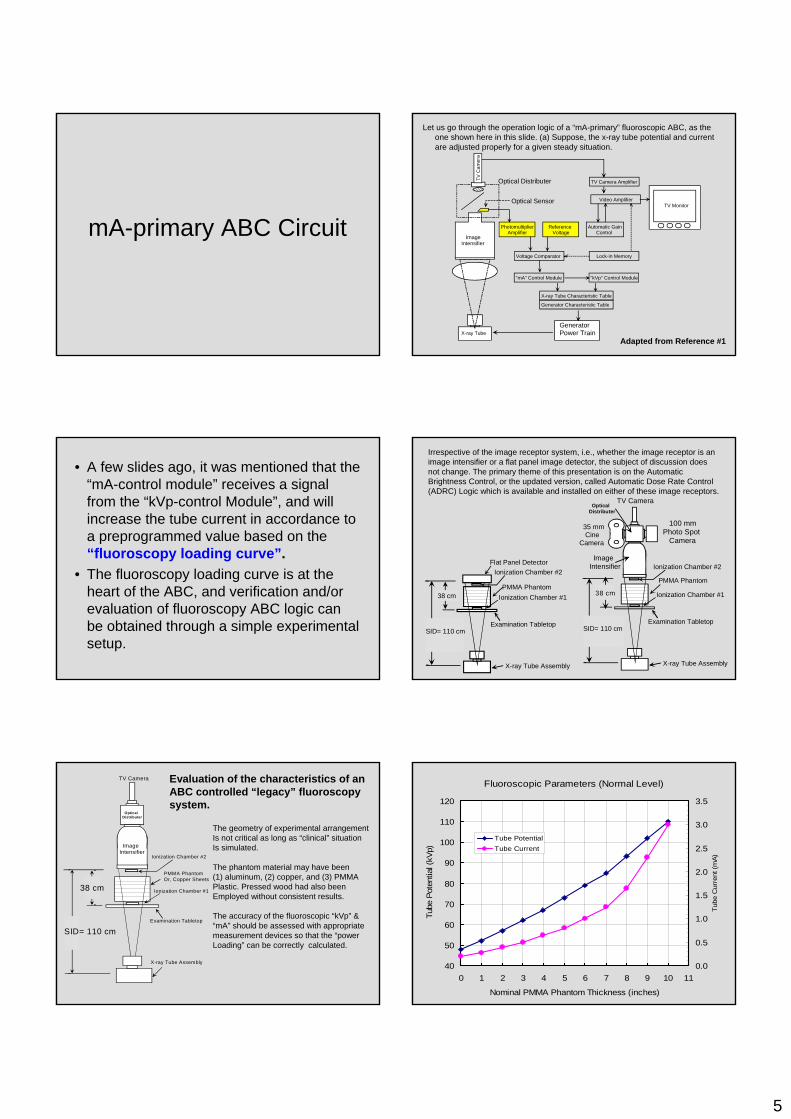
mA-primary ABC Circuit TV CameraImageIntensi fierOptical Sensor,Photomultiplier.TV Video Signal TrainTV CameraPre-amplifier TV M VideoAmplifierPhotomultiplie rAmprefier Reference VoltageVoltage Compara torAutomatic Gain Control Lock-in Memory
ImageIntensifier
TV Camera Amplifier
Video AmplifierTV Monitor
Photomultiplier Amplifier
Voltage Comparator
TV C
amer
a
Optical Distributer
Reference Voltage
Automatic Gain Control
Lock-in Memory
"mA" Control Module "kVp" Control Module
X-ray Tube Characteristic Table
Generator Characteristic Table
Generator Power TrainX-ray Tube
Optical Sensor
Adapted from Reference #1
Let us go through the operation logic of a “mA-primary” fluoroscopic ABC, as the one shown here in this slide. (a) Suppose, the x-ray tube potential and current are adjusted properly for a given steady situation.
• A few slides ago, it was mentioned that the “mA-control module” receives a signal from the “kVp-control Module”, and will increase the tube current in accordance to a preprogrammed value based on the “fluoroscopy loading curve”.
• The fluoroscopy loading curve is at the heart of the ABC, and verification and/or evaluation of fluoroscopy ABC logic can be obtained through a simple experimental setup.
PMMA Phantom
Ionization Chamber #1
Examination Tabletop
X-ray Tube Assembly
2.07
inSID= 110 cm
Ionization Chamber #2
35 mm CineCamera
100 mmPhoto Spot Camera
TV Camera
ImageIntensifier
OpticalDistributer
Flat Panel Detector
PMMA PhantomIonization Chamber #1
Examination Tabletop
X-ray Tube Assembly
2.07
in
SID= 110 cm
Ionization Chamber #2
38 cm 38 cm
Irrespective of the image receptor system, i.e., whether the image receptor is an image intensifier or a flat panel image detector, the subject of discussion does not change. The primary theme of this presentation is on the Automatic Brightness Control, or the updated version, called Automatic Dose Rate Control (ADRC) Logic which is available and installed on either of these image receptors.
PMMA PhantomOr, Copper Sheets
Ionization Chamber #1
Examination Tabletop
X-ray Tube Assembly
3.97
in
1.31
in
SID= 110 cm
38 cm
Ionization Chamber #2
TV Camera
ImageIntensifier
OpticalDistributer
The geometry of experimental arrangementIs not critical as long as “clinical” situationIs simulated.
The phantom material may have been(1) aluminum, (2) copper, and (3) PMMAPlastic. Pressed wood had also been Employed without consistent results.
The accuracy of the fluoroscopic “kVp” &“mA” should be assessed with appropriatemeasurement devices so that the “power Loading” can be correctly calculated.
Evaluation of the characteristics of anABC controlled “legacy” fluoroscopy system.
Fluoroscopic Parameters (Normal Level)
40
50
60
70
80
90
100
110
120
0 1 2 3 4 5 6 7 8 9 10 11
Nominal PMMA Phantom Thickness (inches)
Tube
Pot
entia
l (kV
p)
0.0
0.5
1.0
1.5
2.0
2.5
3.0
3.5
Tube
Cur
rent
(mA)
Tube PotentialTube Current
6
Power Loading Rate
0
50
100
150
200
250
300
350
0 2 4 6 8 10 12
Nominal PMMA Phantom Thickness (inches)
Pow
er L
oadi
ng R
ate
(W/s
ec)
Power Loading
Fluoroscopy Loading Curves
0.0
0.5
1.0
1.5
2.0
2.5
3.0
3.5
40 50 60 70 80 90 100 110 120Tube Potential (kVp)
Tube
Cur
rent
(mA)
Fluoroscopy Curve, Normal Level
Fluoroscopy Curve, High Level
These two fluoroscopy loading curves can be compared to verify the system operation against the manufacturer supplied Technical Data Sheets.
Exposure Rate vs. PMMA Phantom Thickness
0
1
2
3
4
5
6
7
8
9
0 2 4 6 8 10Nominal PMMA Phantom Thickness (inches)
Pat
ienn
Ent
ranc
e E
xpos
ure
Rat
e(R
/min
)
50
60
70
80
90
100
110
120
130
140
Imag
e In
tens
ifier
Inpu
t Exp
osur
eR
ate
( μR
/sec
)
Patient Entrance Exposure Rate
Image Intensifier Input Exposure Rate
The image intensifier input exposure rate (air kerma rate) beyond the 10” phantom thickness will starts to fall down due to the ABC Logic that limits generator to 110 kVp/3.0 mA
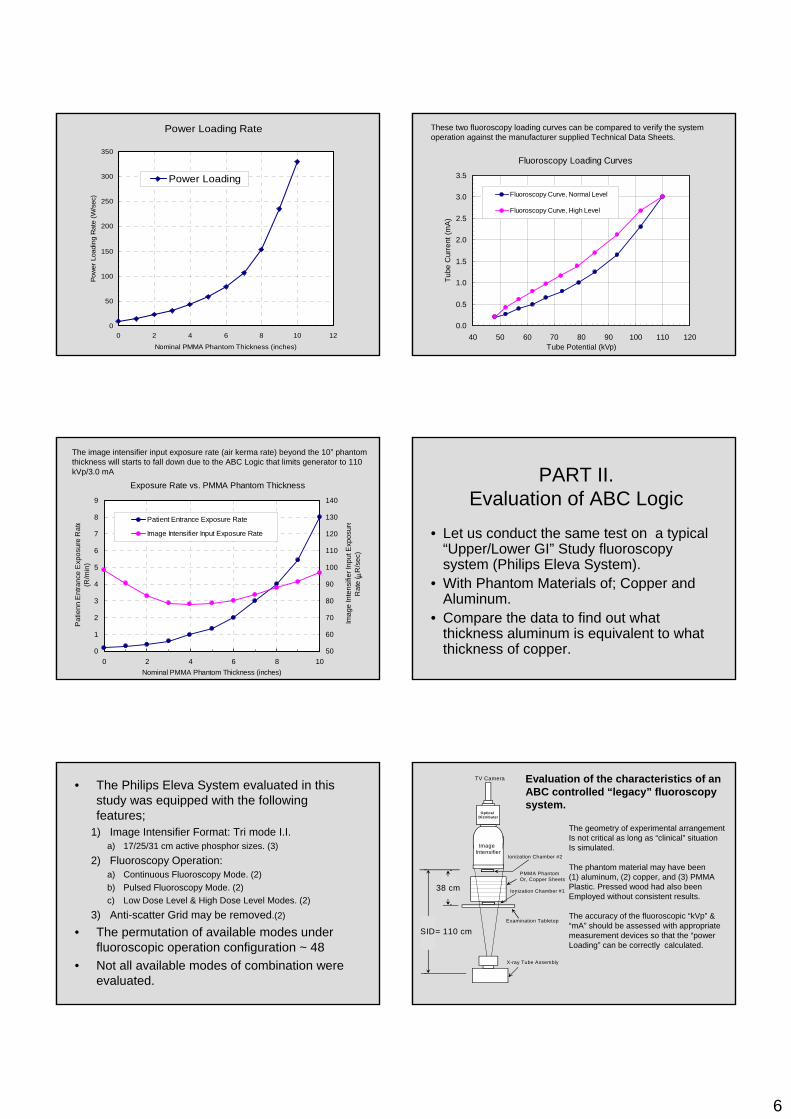
• Let us conduct the same test on a typical “Upper/Lower GI” Study fluoroscopy system (Philips Eleva System).
• With Phantom Materials of; Copper and Aluminum.
• Compare the data to find out what thickness aluminum is equivalent to what thickness of copper.
PART II.Evaluation of ABC Logic
• The Philips Eleva System evaluated in this study was equipped with the following features;
1) Image Intensifier Format: Tri mode I.I.a) 17/25/31 cm active phosphor sizes. (3)
2) Fluoroscopy Operation:a) Continuous Fluoroscopy Mode. (2)b) Pulsed Fluoroscopy Mode. (2)c) Low Dose Level & High Dose Level Modes. (2)
3) Anti-scatter Grid may be removed.(2)
• The permutation of available modes under fluoroscopic operation configuration ~ 48
• Not all available modes of combination were evaluated.
PMMA PhantomOr, Copper Sheets
Ionization Chamber #1
Examination Tabletop
X-ray Tube Assembly
3.97
in
1.31
in
SID= 110 cm
38 cm
Ionization Chamber #2
TV Camera
ImageIntensifier
OpticalDistributer
The geometry of experimental arrangementIs not critical as long as “clinical” situationIs simulated.
The phantom material may have been(1) aluminum, (2) copper, and (3) PMMAPlastic. Pressed wood had also been Employed without consistent results.
The accuracy of the fluoroscopic “kVp” &“mA” should be assessed with appropriatemeasurement devices so that the “power Loading” can be correctly calculated.
Evaluation of the characteristics of anABC controlled “legacy” fluoroscopy system.
7
Tube Potential vs. Phantom Thickness
40
50
60
70
80
90
100
110
120
0 2 4 6 8 10 12 14 16
Nominal PMMA Phantom Thickness (inches)
Tube
Pot
entia
l (kV
p)
17 cm Mode, (N) 25 cm Mode, (N) 31 cm Mode, (N) 17 cm Mode, (L) 25 cm Mode, (L) 31 cm Mode, (L)
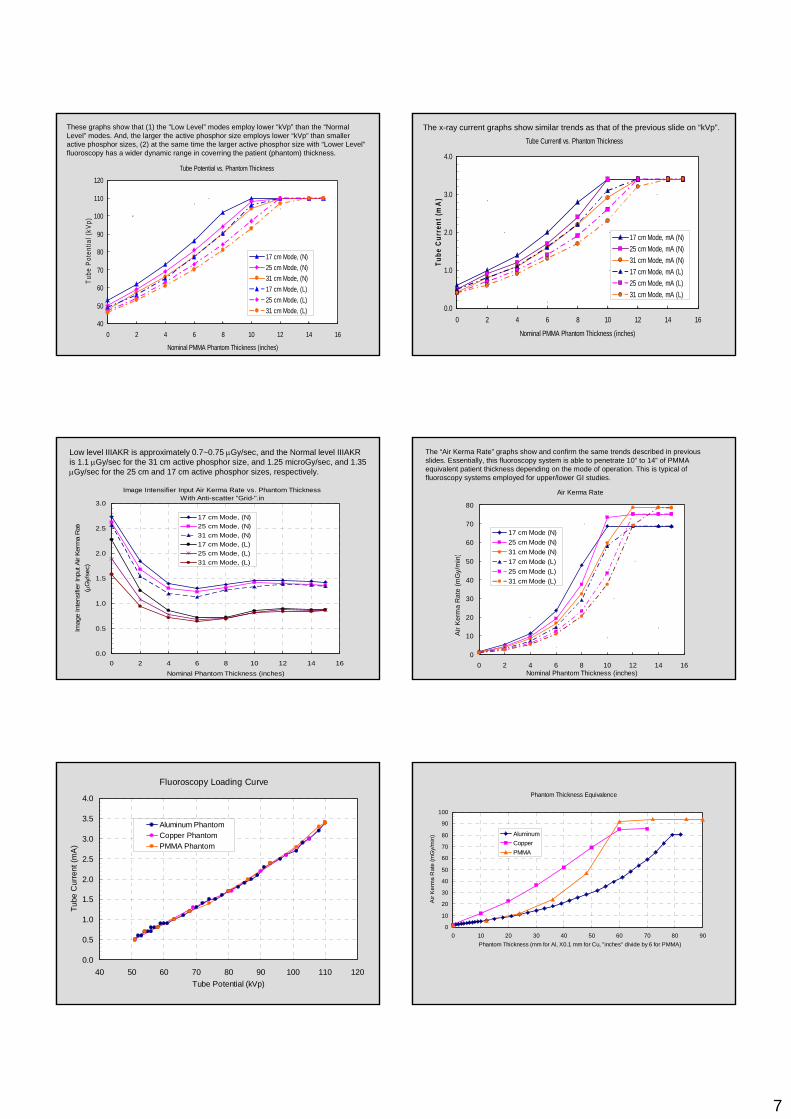
These graphs show that (1) the “Low Level” modes employ lower “kVp” than the “Normal Level” modes. And, the larger the active phosphor size employs lower “kVp” than smaller active phosphor sizes, (2) at the same time the larger active phosphor size with “Lower Level”fluoroscopy has a wider dynamic range in coverring the patient (phantom) thickness.
Tube Currentl vs. Phantom Thickness
0.0
1.0
2.0
3.0
4.0
0 2 4 6 8 10 12 14 16
Nominal PMMA Phantom Thickness (inches)
Tube
Cur
rent
(mA
)
17 cm Mode, mA (N) 25 cm Mode, mA (N) 31 cm Mode, mA (N) 17 cm Mode, mA (L) 25 cm Mode, mA (L) 31 cm Mode, mA (L)
The x-ray current graphs show similar trends as that of the previous slide on “kVp”.
Image Intensifier Input Air Kerma Rate vs. Phantom ThicknessWith Anti-scatter "Grid-".in
0.0
0.5
1.0
1.5
2.0
2.5
3.0
0 2 4 6 8 10 12 14 16Nominal Phantom Thickness (inches)
Imag
e In
tens
ifier
Inpu
t Air
Ker
ma
Rat
e( μ
Gy/
sec)
17 cm Mode, (N) 25 cm Mode, (N) 31 cm Mode, (N) 17 cm Mode, (L) 25 cm Mode, (L) 31 cm Mode, (L)
Low level IIIAKR is approximately 0.7~0.75 μGy/sec, and the Normal level IIIAKR is 1.1 μGy/sec for the 31 cm active phosphor size, and 1.25 microGy/sec, and 1.35 μGy/sec for the 25 cm and 17 cm active phosphor sizes, respectively.
Air Kerma Rate
0
10
20
30
40
50
60
70
80
0 2 4 6 8 10 12 14 16Nominal Phantom Thickness (inches)
Air
Ker
ma
Rat
e (m
Gy/
min
)
17 cm Mode (N) 25 cm Mode (N) 31 cm Mode (N) 17 cm Mode (L) 25 cm Mode (L) 31 cm Mode (L)
The “Air Kerma Rate” graphs show and confirm the same trends described in previous slides. Essentially, this fluoroscopy system is able to penetrate 10” to 14” of PMMA equivalent patient thickness depending on the mode of operation. This is typical of fluoroscopy systems employed for upper/lower GI studies.
Fluoroscopy Loading Curve
0.0
0.5
1.0
1.5
2.0
2.5
3.0
3.5
4.0
40 50 60 70 80 90 100 110 120Tube Potential (kVp)
Tube
Cur
rent
(mA
)
Aluminum PhantomCopper PhantomPMMA Phantom
Phantom Thickness Equivalence
0
10
20
30
40
50
60
70
80
90
100
0 10 20 30 40 50 60 70 80 90Phantom Thickness (mm for Al, X0.1 mm for Cu, "inches" divide by 6 for PMMA)
Air
Ker
ma
Rat
e (m
Gy/
min
) AluminumCopperPMMA
8
Thickness Equivalence (Philips Eleva System)
9.3[9-1/2]
3765.680
7.3[7-1/2]
2-1/4583.240
5-1/21-1/2381.620
3.67[3-3/4]
3/4190.810
PMMA (inches)
Aluminum (inches)
Aluminum (mm)
Copper (mm)
Air Kerma Rate
(mGy/min)
ImageIntensifier
TV Camera Amplifier
Video AmplifierTV Monitor
Photomultiplier Amplifier
Voltage Comparator
TV C
amer
a
Optical Distributer
Reference Voltage
Automatic Gain Control
Lock-in Memory
"mA" Control Module "kVp" Control Module
X-ray Tube Characteristic Table
Generator Characteristic Table
Generator Power TrainX-ray Tube
Optical Sensor
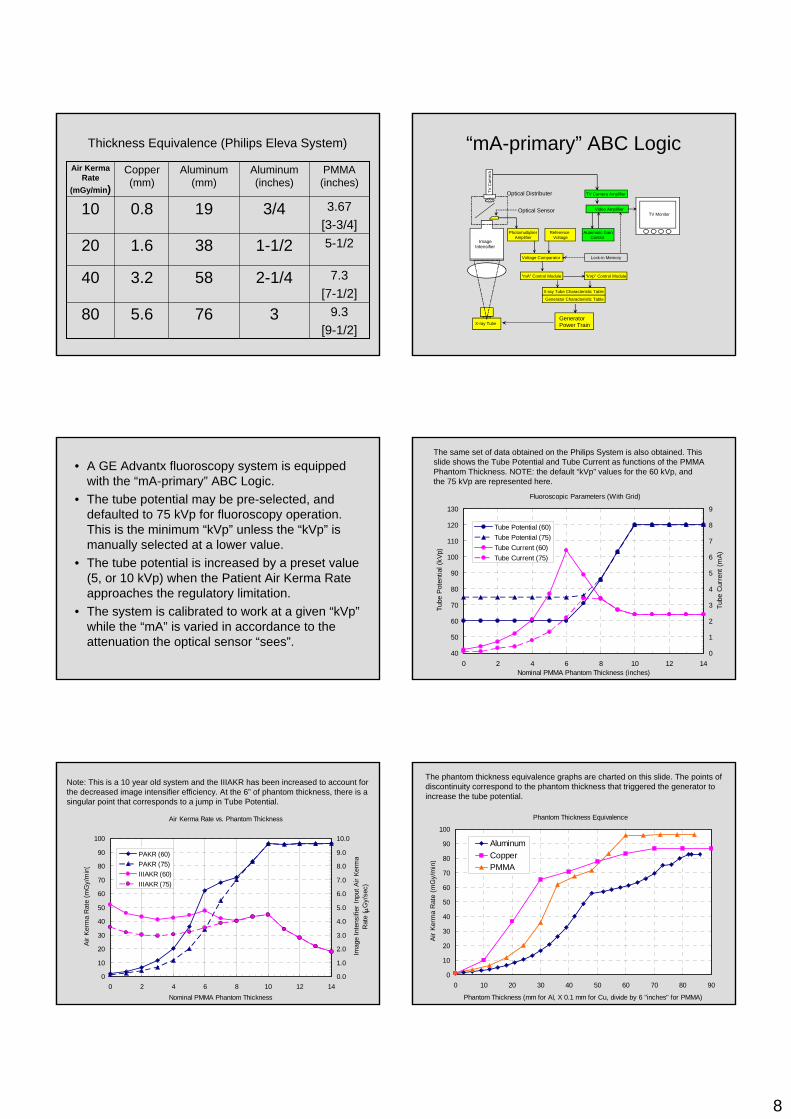
“mA-primary” ABC Logic
• A GE Advantx fluoroscopy system is equipped with the “mA-primary” ABC Logic.
• The tube potential may be pre-selected, and defaulted to 75 kVp for fluoroscopy operation. This is the minimum “kVp” unless the “kVp” is manually selected at a lower value.
• The tube potential is increased by a preset value (5, or 10 kVp) when the Patient Air Kerma Rate approaches the regulatory limitation.
• The system is calibrated to work at a given “kVp”while the “mA” is varied in accordance to the attenuation the optical sensor “sees”.
Fluoroscopic Parameters (With Grid)
40
50
60
70
80
90
100
110
120
130
0 2 4 6 8 10 12 14Nominal PMMA Phantom Thickness (inches)
Tube
Pot
entia
l (kV
p)
0
1
2
3
4
5
6
7
8
9
Tube
Cur
rent
(mA)
Tube Potential (60)Tube Potential (75)Tube Current (60)Tube Current (75)
The same set of data obtained on the Philips System is also obtained. This slide shows the Tube Potential and Tube Current as functions of the PMMA Phantom Thickness. NOTE: the default “kVp” values for the 60 kVp, and the 75 kVp are represented here.
Air Kerma Rate vs. Phantom Thickness
0
10
20
30
40
50
60
70
80
90
100
0 2 4 6 8 10 12 14Nominal PMMA Phantom Thickness
Air K
erm
a R
ate
(mG
y/m
in)
0.0
1.0
2.0
3.0
4.0
5.0
6.0
7.0
8.0
9.0
10.0
Imag
e In
tens
ifier
Inpu
t Air
Kerm
aR
ate
( μG
y/se
c)
PAKR (60)PAKR (75)IIIAKR (60)IIIAKR (75)
Note: This is a 10 year old system and the IIIAKR has been increased to account for the decreased image intensifier efficiency. At the 6” of phantom thickness, there is a singular point that corresponds to a jump in Tube Potential.
Phantom Thickness Equivalence
0
10
20
30
40
50
60
70
80
90
100
0 10 20 30 40 50 60 70 80 90
Phantom Thickness (mm for Al, X 0.1 mm for Cu, divide by 6 "inches" for PMMA)
Air K
erm
a R
ate
(mG
y/m
in)
AluminumCopperPMMA
The phantom thickness equivalence graphs are charted on this slide. The points of discontinuity correspond to the phantom thickness that triggered the generator to increase the tube potential.
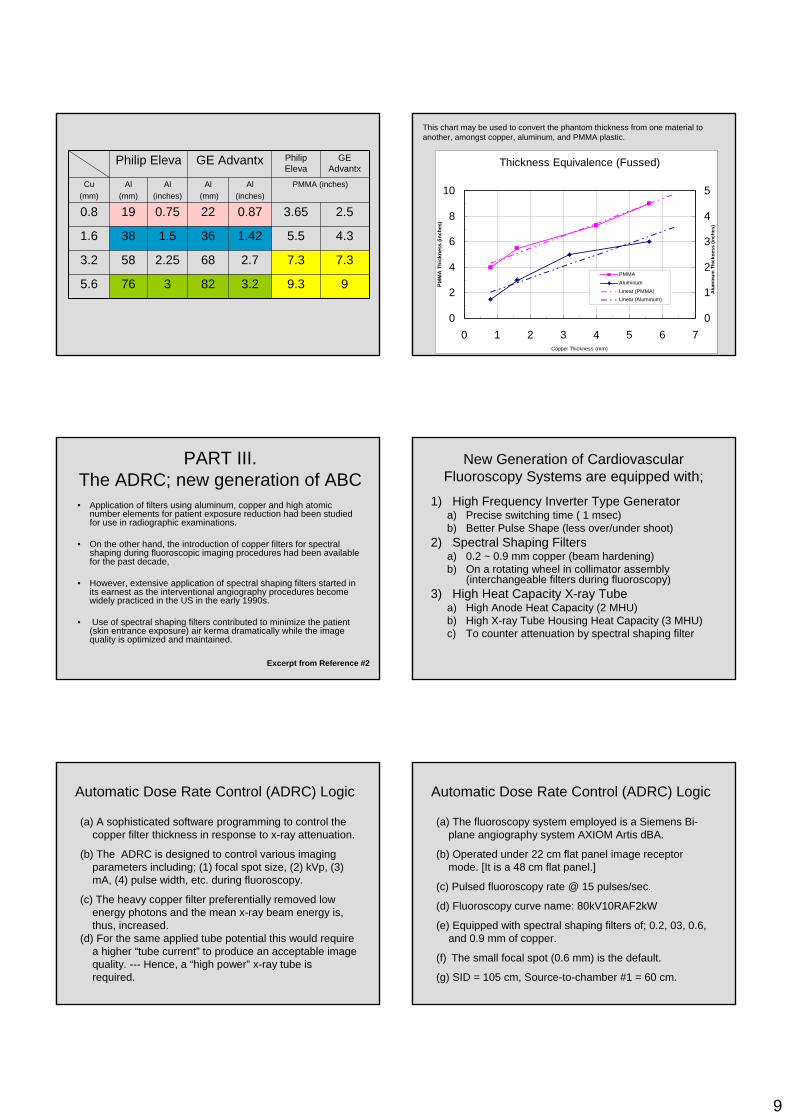
9
99.33.2823765.6
PMMA (inches)Al(inches)
Al(mm)
Al(inches)
Al (mm)
Cu (mm)
7.37.32.7682.25583.2
4.35.51.42361.5381.6
2.53.650.87220.75190.8
GE Advantx
Philip Eleva
GE AdvantxPhilip Eleva Thickness Equivalence (Fussed)
0
2
4
6
8
10
0 1 2 3 4 5 6 7Copper Thickness (mm)
PM
MA
Thic
knes
s (in
ches
)
0
1
2
3
4
5
Alu
min
um T
hick
ness
(inc
hes)
PMMAAluminumLinear (PMMA)Linear (Aluminum)
This chart may be used to convert the phantom thickness from one material to another, amongst copper, aluminum, and PMMA plastic.
PART III.The ADRC; new generation of ABC• Application of filters using aluminum, copper and high atomic
number elements for patient exposure reduction had been studied for use in radiographic examinations.
• On the other hand, the introduction of copper filters for spectral shaping during fluoroscopic imaging procedures had been available for the past decade,
• However, extensive application of spectral shaping filters started in its earnest as the interventional angiography procedures become widely practiced in the US in the early 1990s.
• Use of spectral shaping filters contributed to minimize the patient (skin entrance exposure) air kerma dramatically while the image quality is optimized and maintained.
Excerpt from Reference #2
New Generation of Cardiovascular Fluoroscopy Systems are equipped with;
1) High Frequency Inverter Type Generatora) Precise switching time ( 1 msec)b) Better Pulse Shape (less over/under shoot)
2) Spectral Shaping Filtersa) 0.2 ~ 0.9 mm copper (beam hardening)b) On a rotating wheel in collimator assembly
(interchangeable filters during fluoroscopy)3) High Heat Capacity X-ray Tube
a) High Anode Heat Capacity (2 MHU)b) High X-ray Tube Housing Heat Capacity (3 MHU)c) To counter attenuation by spectral shaping filter
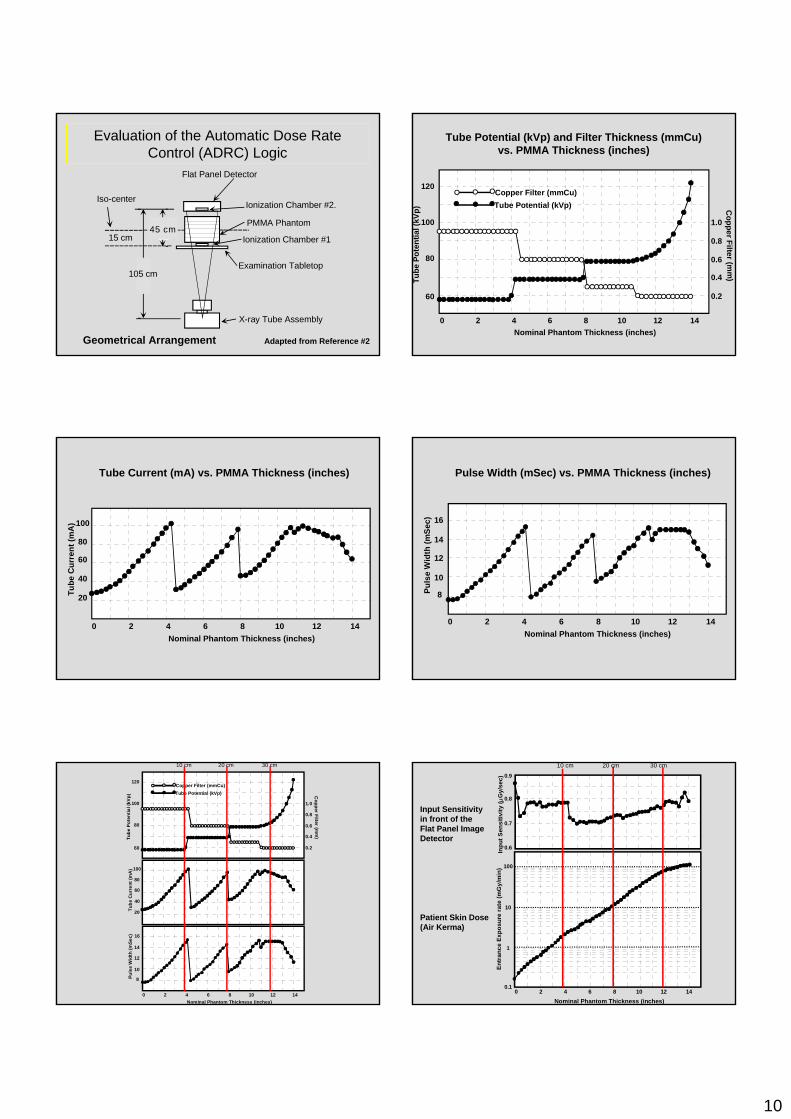
Automatic Dose Rate Control (ADRC) Logic
(a) A sophisticated software programming to control the copper filter thickness in response to x-ray attenuation.
(b) The ADRC is designed to control various imaging parameters including; (1) focal spot size, (2) kVp, (3) mA, (4) pulse width, etc. during fluoroscopy.
(c) The heavy copper filter preferentially removed low energy photons and the mean x-ray beam energy is, thus, increased.
(d) For the same applied tube potential this would require a higher “tube current” to produce an acceptable image quality. --- Hence, a “high power” x-ray tube is required.
Automatic Dose Rate Control (ADRC) Logic
(a) The fluoroscopy system employed is a Siemens Bi-plane angiography system AXIOM Artis dBA.
(b) Operated under 22 cm flat panel image receptor mode. [It is a 48 cm flat panel.]
(c) Pulsed fluoroscopy rate @ 15 pulses/sec.
(d) Fluoroscopy curve name: 80kV10RAF2kW
(e) Equipped with spectral shaping filters of; 0.2, 03, 0.6, and 0.9 mm of copper.
(f) The small focal spot (0.6 mm) is the default.
(g) SID = 105 cm, Source-to-chamber #1 = 60 cm.
10
Evaluation of the Automatic Dose Rate Control (ADRC) Logic
Geometrical Arrangement
Flat Panel Detector
PMMA Phantom
Ionization Chamber #1
Examination Tabletop
X-ray Tube Assembly
2.75
in
.95
in
Ionization Chamber #2.
105 cm
Iso-center
15 cm45 cm
Adapted from Reference #2
120
100
80
60 0.2
0.4
0.6
0.8
1.0
Tube Potential (kVp)Copper Filter (mmCu)
Copper Fi lt er (m
m)Tu
be P
oten
tial (
kVp)
0 2 4 6 8 10 12 14Nominal Phantom Thickness (inches)
Tube Potential (kVp) and Filter Thickness (mmCu) vs. PMMA Thickness (inches)
0 2 4 6 8 10 12 14Nominal Phantom Thickness (inches)
100
80
60
40
20Tube
Cur
rent
(mA
)
Tube Current (mA) vs. PMMA Thickness (inches)
0 2 4 6 8 10 12 14Nominal Phantom Thickness (inches)
10
12
14
16
8Puls
e W
idth
(mSe
c)
Pulse Width (mSec) vs. PMMA Thickness (inches)
120
100
80
60 0.2
0.4
0.6
0.8
1.0
Tube Potential (kVp)Copper Filter (mmCu)
Coppe r F il ter (m
m)Tu
be P
oten
tial (
kVp)
0 2 4 6 8 10 12 14Nominal Phantom Thickness (inches)
100
80
60
40
20
10
12
14
16
Tube
Cur
rent
(mA
)
8Puls
e W
idth
(mSe
c)
10 cm 20 cm 30 cm
0.9
0.8
0.7
0.6Inpu
t Sen
sitiv
ity (μ
Gy/
sec)
Nominal Phantom Thickness (inches)0 2 4 6 8 10 12 14
0.1
1
10
100
Entr
ance
Exp
osur
e ra
te (m
Gy/
min
)
10 cm 20 cm 30 cm
Input Sensitivity in front of the Flat Panel Image Detector
Patient Skin Dose (Air Kerma)
11
Why is it possible to have a “Better Image Quality” & “Lower Patient Dose” at the same time?
• Image quality is “better” because of consistently lower tube potential is employed---higher image contrast!
• Radiation dose to the patients, especially, small and average size patient, is significantly reduced due to the use of spectral shaping filters --- considerably amount of low energy portion of spectrum is removed before hitting the patient.
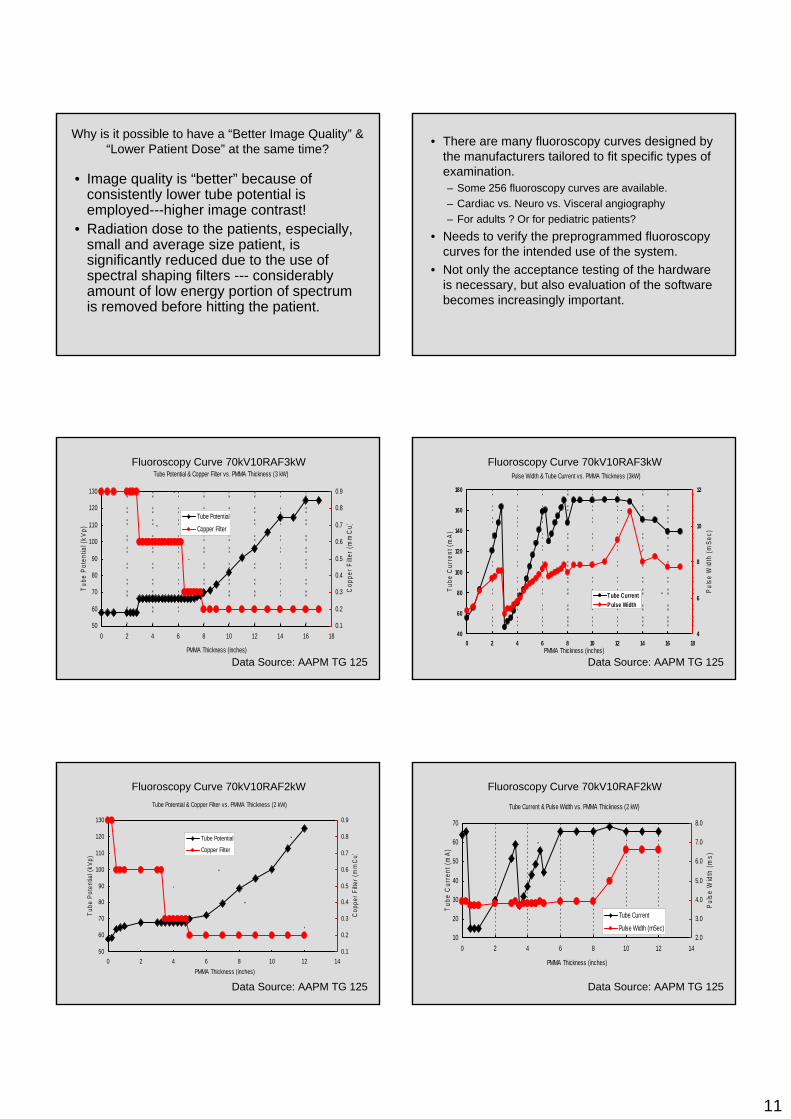
• There are many fluoroscopy curves designed by the manufacturers tailored to fit specific types of examination.– Some 256 fluoroscopy curves are available.– Cardiac vs. Neuro vs. Visceral angiography– For adults ? Or for pediatric patients?
• Needs to verify the preprogrammed fluoroscopy curves for the intended use of the system.
• Not only the acceptance testing of the hardware is necessary, but also evaluation of the software becomes increasingly important.
Tube Potential & Copper Filter vs. PMMA Thickness (3 kW)
50
60
70
80
90
100
110
120
130
0 2 4 6 8 10 12 14 16 18
PMMA Thickness (inches)
Tube
Pot
entia
l (kV
p)
0.1
0.2
0.3
0.4
0.5
0.6
0.7
0.8
0.9
Cop
per F
ilter (
mm
Cu)
Tube Potential
Copper Filter
Fluoroscopy Curve 70kV10RAF3kW
Data Source: AAPM TG 125
Pulse Width & Tube Current vs. PMMA Thickness (3kW)
40
60
80
100
120
140
160
180
0 2 4 6 8 10 12 14 16 18PMMA Thickness (inches)
Tube
Cur
rent
(mA)
4
6
8
10
12
Puls
e W
idth
(mSe
c)
Tube CurrentP ulse Width
Fluoroscopy Curve 70kV10RAF3kW
Data Source: AAPM TG 125
Fluoroscopy Curve 70kV10RAF2kW
Data Source: AAPM TG 125
Tube Potential & Copper Filter vs. PMMA Thickness (2 kW)
50
60
70
80
90
100
110
120
130
0 2 4 6 8 10 12 14PMMA Thickness (inches)
Tube
Pot
entia
l (kV
p)
0.1
0.2
0.3
0.4
0.5
0.6
0.7
0.8
0.9
Cop
per F
ilter (
mm
Cu)
Tube Potential
Copper Filter
Fluoroscopy Curve 70kV10RAF2kW
Data Source: AAPM TG 125
Tube Current & Pulse Width vs. PMMA Thickness (2 kW)
10
20
30
40
50
60
70
0 2 4 6 8 10 12 14
PMMA Thickness (inches)
Tube
Cur
rent
(mA)
2.0
3.0
4.0
5.0
6.0
7.0
8.0
Puls
e W
idth
(ms)
Tube Current
Pulse Width (mSec)
12
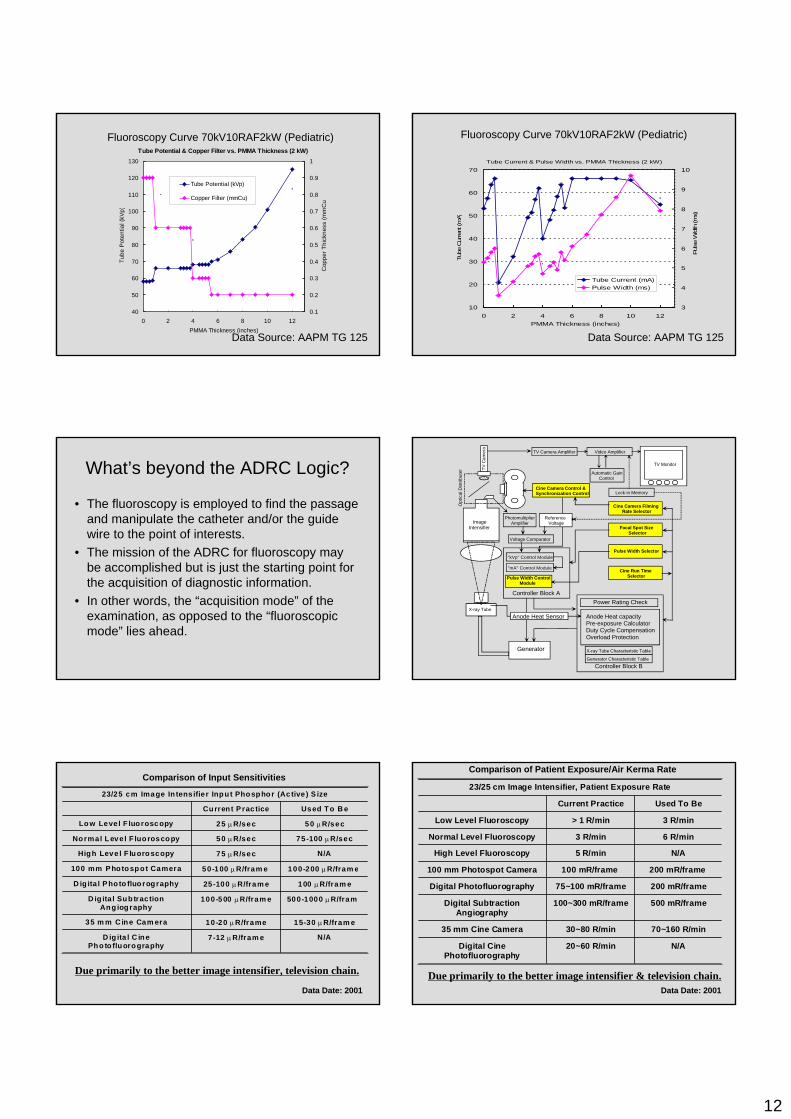
Fluoroscopy Curve 70kV10RAF2kW (Pediatric)
Data Source: AAPM TG 125
Tube Potential & Copper Filter vs. PMMA Thickness (2 kW)
40
50
60
70
80
90
100
110
120
130
0 2 4 6 8 10 12PMMA Thickness (inches)
Tube
Pot
entia
l (kV
p)
0.1
0.2
0.3
0.4
0.5
0.6
0.7
0.8
0.9
1
Cop
per T
hick
ness
(mm
Cu
Tube Potential (kVp)
Copper Filter (mmCu)
Fluoroscopy Curve 70kV10RAF2kW (Pediatric)
Data Source: AAPM TG 125
Tube Current & Pulse Width vs. PMMA Thickness (2 kW)
10
20
30
40
50
60
70
0 2 4 6 8 10 12PMMA Thickness (inches)
Tube
Cur
rent
(mA)
3
4
5
6
7
8
9
10
Pul
se W
idth
(ms)
Tube Current (mA)Pulse Width (ms)
What’s beyond the ADRC Logic?
• The fluoroscopy is employed to find the passage and manipulate the catheter and/or the guide wire to the point of interests.
• The mission of the ADRC for fluoroscopy may be accomplished but is just the starting point for the acquisition of diagnostic information.
• In other words, the “acquisition mode” of the examination, as opposed to the “fluoroscopic mode” lies ahead.
ImageIntensifier
TV Camera Amplifier Video Amplifier
TV Monitor
Photomultiplier Amplifier
Voltage Comparator
TV C
amer
a
Opt
ical
Dis
tribu
ter
Reference Voltage
Automatic Gain Control
Lock-in Memory
"kVp" Control Module
"mA" Control Module
Generator
X-ray Tube
Cine Camera Control &Synchronization Control
Cine Camera Filming Rate Selector
Pulse Width Control Module
Focal Spot Size Selector
Pulse Width Selector
Cine Run Time Selector
Controller Block A
Controller Block B
Power Rating Check
Anode Heat capacityPre-exposure CalculatorDuty Cycle CompensationOverload Protection
X-ray Tube Characteristic Table
Generator Characteristic Table
Anode Heat Sensor
N/A7-12 μR/fram eD ig ita l C inePho to fluorography
15-30 μR/fram e10 -20 μR/frame35 m m C ine Cam era
500-1000 μR/fram100 -500 μR/fram eD ig ita l SubtractionAng iography
100 μR/fram e25-100 μR/fram eD ig ita l P hoto fluorography
100-200 μR/fram e50-100 μR/fram e 100 mm P hotospot Camera
N/A75 μR/secHigh Leve l F luoroscopy
75 -100 μR/sec50 μR/secNormal L eve l F luoroscopy
50 μR/sec25 μR/secLo w Leve l F luoroscopy
Used To B eCurren t P rac tice
23/25 cm Image In tens ifie r Inpu t Phosphor (Ac tive ) S ize
Due primarily to the better image intensifier, television chain.
Comparison of Input Sensitivities
Data Date: 2001
N/A20~60 R/minDigital CinePhotofluorography
70~160 R/min30~80 R/min35 mm Cine Camera
500 mR/frame100~300 mR/frameDigital SubtractionAngiography
200 mR/frame75~100 mR/frameDigital Photofluorography
200 mR/frame 100 mR/frame 100 mm Photospot Camera
N/A5 R/minHigh Level Fluoroscopy
6 R/min3 R/minNormal Level Fluoroscopy
3 R/min> 1 R/minLow Level Fluoroscopy
Used To BeCurrent Practice
23/25 cm Image Intensifier, Patient Exposure Rate
Due primarily to the better image intensifier & television chain.Data Date: 2001
Comparison of Patient Exposure/Air Kerma Rate
13
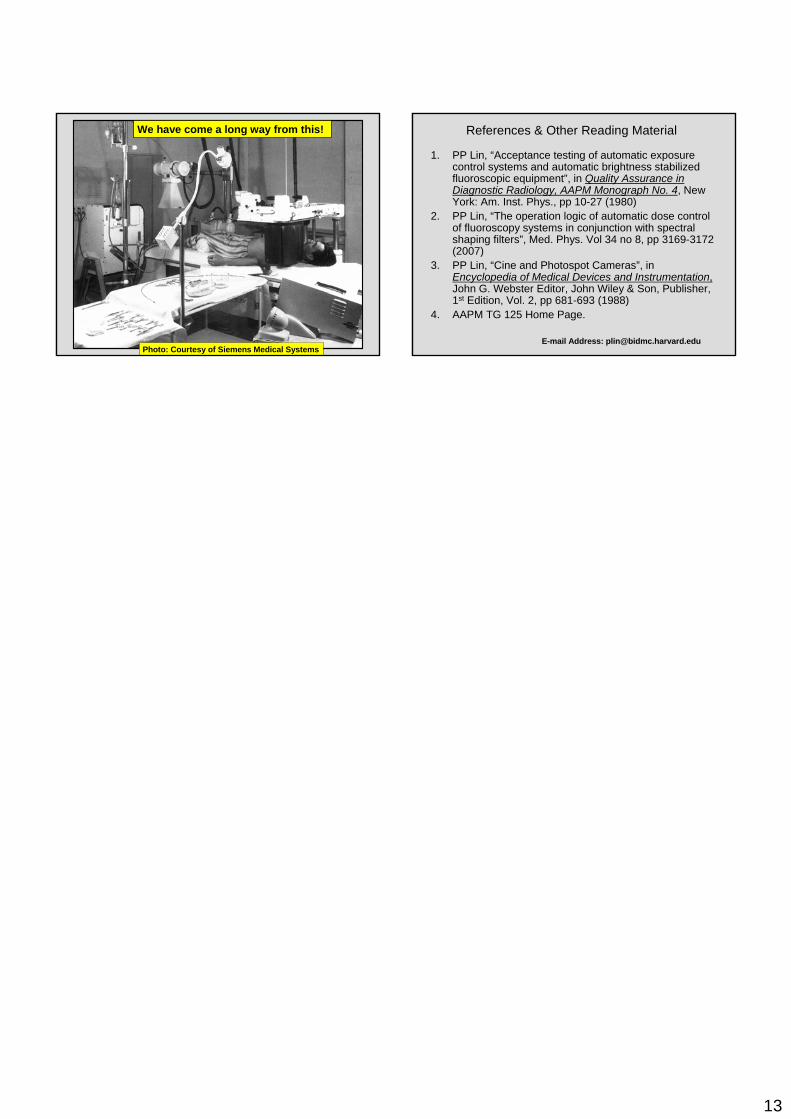
Photo: Courtesy of Siemens Medical Systems
We have come a long way from this!
1. PP Lin, “Acceptance testing of automatic exposure control systems and automatic brightness stabilized fluoroscopic equipment”, in Quality Assurance in Diagnostic Radiology, AAPM Monograph No. 4, New York: Am. Inst. Phys., pp 10-27 (1980)
2. PP Lin, “The operation logic of automatic dose control of fluoroscopy systems in conjunction with spectral shaping filters”, Med. Phys. Vol 34 no 8, pp 3169-3172 (2007)
3. PP Lin, “Cine and Photospot Cameras”, in Encyclopedia of Medical Devices and Instrumentation,John G. Webster Editor, John Wiley & Son, Publisher, 1st Edition, Vol. 2, pp 681-693 (1988)
4. AAPM TG 125 Home Page.
References & Other Reading Material
E-mail Address: [email protected]