Embed Size (px)
Citation preview
Review Of Bus Access To Queen's And King George Hospitals
TfL Surface Transport – Buses Directorate
July 2016
2
1 INTRODUCTION 1.1 Healthcare Provision in the Barking, Havering and Redbridge University
Hospitals NHS Trust (BHRUT) Area
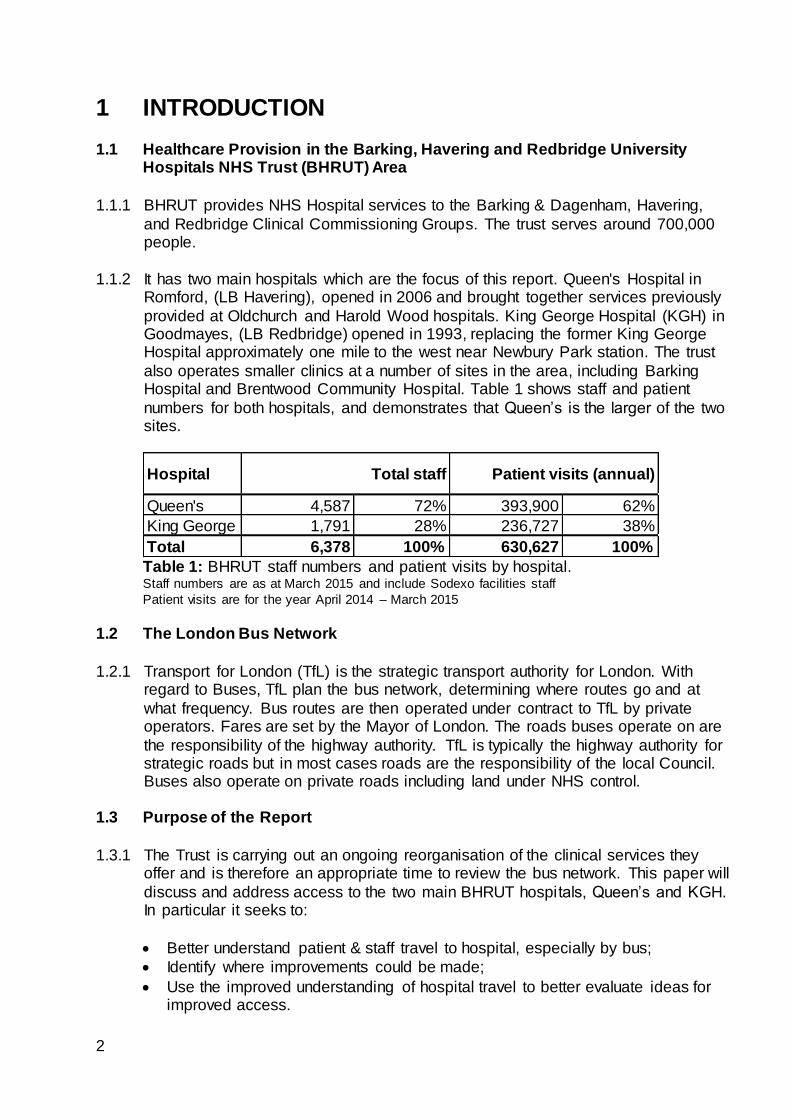
1.1.1 BHRUT provides NHS Hospital services to the Barking & Dagenham, Havering,
and Redbridge Clinical Commissioning Groups. The trust serves around 700,000 people.
1.1.2 It has two main hospitals which are the focus of this report. Queen's Hospital in Romford, (LB Havering), opened in 2006 and brought together services previously
provided at Oldchurch and Harold Wood hospitals. King George Hospital (KGH) in Goodmayes, (LB Redbridge) opened in 1993, replacing the former King George Hospital approximately one mile to the west near Newbury Park station. The trust
also operates smaller clinics at a number of sites in the area, including Barking Hospital and Brentwood Community Hospital. Table 1 shows staff and patient
numbers for both hospitals, and demonstrates that Queen’s is the larger of the two sites.
Table 1: BHRUT staff numbers and patient visits by hospital. Staff numbers are as at March 2015 and include Sodexo facilities staff
Patient visits are for the year April 2014 – March 2015
1.2 The London Bus Network
1.2.1 Transport for London (TfL) is the strategic transport authority for London. With
regard to Buses, TfL plan the bus network, determining where routes go and at
what frequency. Bus routes are then operated under contract to TfL by private operators. Fares are set by the Mayor of London. The roads buses operate on are
the responsibility of the highway authority. TfL is typically the highway authority for strategic roads but in most cases roads are the responsibility of the local Council. Buses also operate on private roads including land under NHS control.
1.3 Purpose of the Report
1.3.1 The Trust is carrying out an ongoing reorganisation of the clinical services they
offer and is therefore an appropriate time to review the bus network. This paper will
discuss and address access to the two main BHRUT hospitals, Queen’s and KGH. In particular it seeks to:
Better understand patient & staff travel to hospital, especially by bus;
Identify where improvements could be made;
Use the improved understanding of hospital travel to better evaluate ideas for improved access.
Hospital
Queen's 4,587 72% 393,900 62%
King George 1,791 28% 236,727 38%
Total 6,378 100% 630,627 100%
Total staff Patient visits (annual)
3
2 METHODOLOGY AND DATA SOURCES 2.1 Methodology
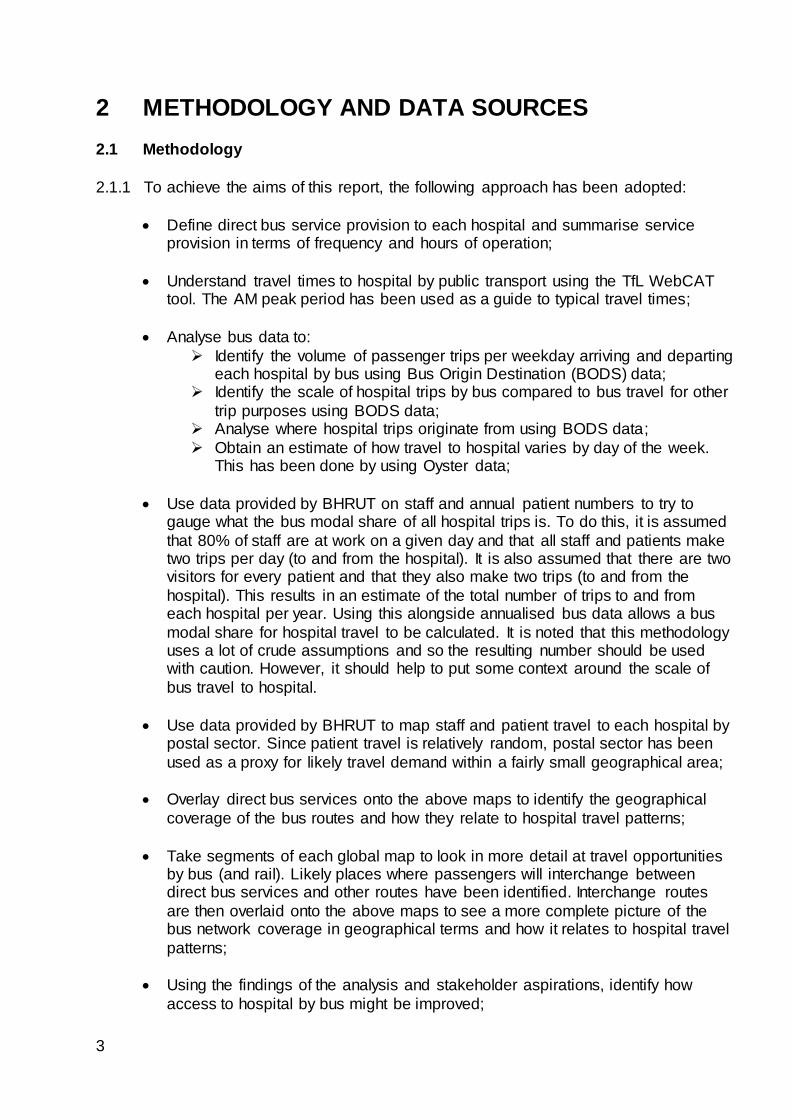
2.1.1 To achieve the aims of this report, the following approach has been adopted:
Define direct bus service provision to each hospital and summarise service provision in terms of frequency and hours of operation;
Understand travel times to hospital by public transport using the TfL WebCAT tool. The AM peak period has been used as a guide to typical travel times;
Analyse bus data to:
Identify the volume of passenger trips per weekday arriving and departing each hospital by bus using Bus Origin Destination (BODS) data;
Identify the scale of hospital trips by bus compared to bus travel for other
trip purposes using BODS data; Analyse where hospital trips originate from using BODS data;
Obtain an estimate of how travel to hospital varies by day of the week. This has been done by using Oyster data;
Use data provided by BHRUT on staff and annual patient numbers to try to gauge what the bus modal share of all hospital trips is. To do this, it is assumed
that 80% of staff are at work on a given day and that all staff and patients make two trips per day (to and from the hospital). It is also assumed that there are two visitors for every patient and that they also make two trips (to and from the
hospital). This results in an estimate of the total number of trips to and from each hospital per year. Using this alongside annualised bus data allows a bus
modal share for hospital travel to be calculated. It is noted that this methodology uses a lot of crude assumptions and so the resulting number should be used with caution. However, it should help to put some context around the scale of
bus travel to hospital.
Use data provided by BHRUT to map staff and patient travel to each hospital by postal sector. Since patient travel is relatively random, postal sector has been
used as a proxy for likely travel demand within a fairly small geographical area;
Overlay direct bus services onto the above maps to identify the geographical
coverage of the bus routes and how they relate to hospital travel patterns;
Take segments of each global map to look in more detail at travel opportunities by bus (and rail). Likely places where passengers will interchange between direct bus services and other routes have been identified. Interchange routes
are then overlaid onto the above maps to see a more complete picture of the bus network coverage in geographical terms and how it relates to hospital travel
patterns;
Using the findings of the analysis and stakeholder aspirations, identify how
access to hospital by bus might be improved;
4
Evaluate bus service ideas in more detail.
2.2 Data Sources
2.2.1 Data on bus routes, frequencies and vehicle types have been taken from the TfL database on bus services. Hours of operation have been taken from the bus schedule for each individual route.
2.2.2 Data on travel times by public transport has been obtained by interrogating the TfL
WebCAT online tool. https://tfl.gov.uk/info-for/urban-planning-and-construction/planning-with-webcat/webcat?scenario=2011%20%28Base%20year%29&Type=TIM
2.2.3 Bus Origin-Destination Survey (BODS) data has been used to identify daily
numbers of bus trips per weekday on each route and the number boarding and alighting at each hospital. BODS has also been used to identify where hospital trips start / end. BODS is a one day survey on a bus route that occurs approximately
every 5 years. Passengers are handed a survey card with a unique number when they board the bus and they return it to a surveyor when they alight. Travel patterns
and their volume can therefore be calculated. For ease, it has been assumed that all bus passengers boarding and alighting at the stops closest to both hospitals are making hospital related trips. This is considered a reasonable assumption given the
location and nature of these stops. However, some trips may be for other reasons, e.g. to access other land uses nearby.
2.2.4 Since BODS is a weekday survey, Oyster data has been used to identify how trip
volumes change at weekends compared to weekdays.
2.2.5 Data on staff has been provided by BHRUT and is a snapshot from March 2015. It
also includes Sodexo facilities staff. In the main staff are based at one hospital but some do travel between sites. It is thought that, as clinical services are rationalised, travel between sites by staff is likely to reduce.
2.2.6 Patient data has been provided by BHRUT and covers hospital attendances during
the period April 2014 to March 2015. The data is broken down by hospital and whether they were an inpatient, outpatient or visited A&E. Since individual patient travel is relatively random, postal sectors have been used as a proxy for likely travel
demand within a fairly small geographical area. A postal sector is the first half of the postcode and the numbers at the start of the second half of the postcode. For
instance, Romford town centre is part of the RM1 1 postal sector, while Ilford Town Centre is part of the IG1 1 postal sector.
2.2.7 One dataset that is not available is hospital visitors, i.e. those who are not attending as a member of staff or for a medical procedure. It has been assumed that there
are two visitors for every patient
5
3 QUEEN’S HOSPITAL 3.1 Direct bus service provision
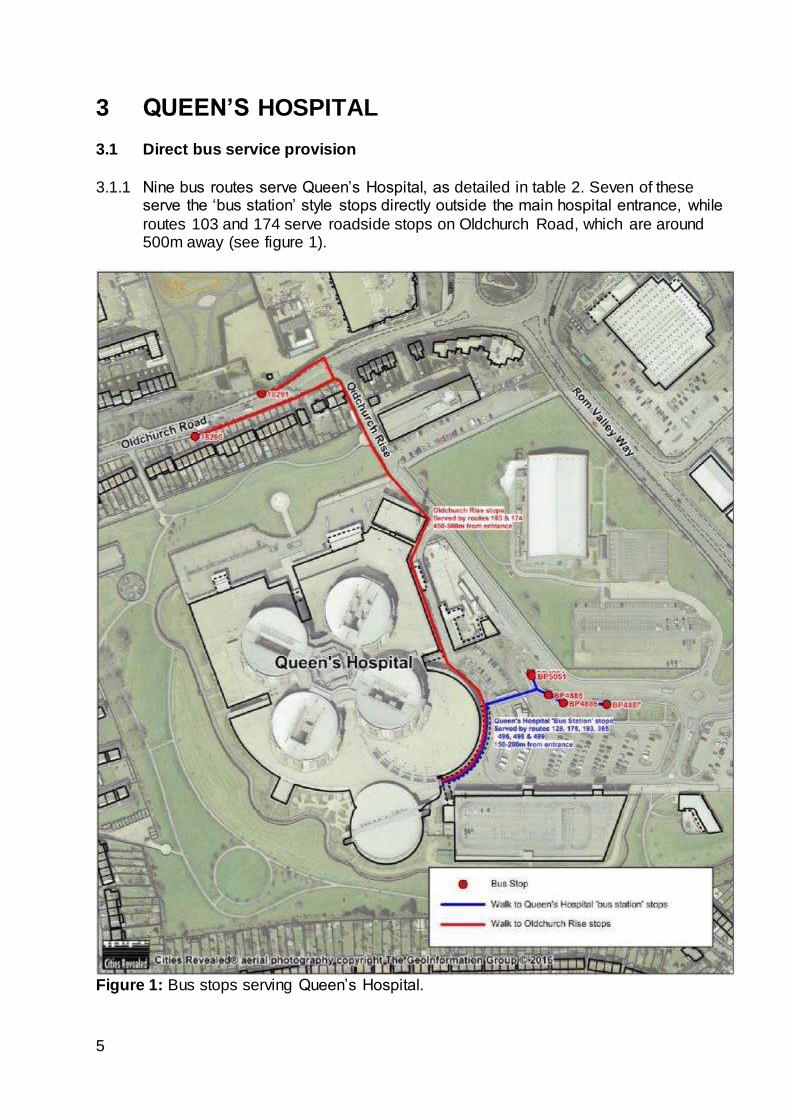
3.1.1 Nine bus routes serve Queen’s Hospital, as detailed in table 2. Seven of these serve the ‘bus station’ style stops directly outside the main hospital entrance, while
routes 103 and 174 serve roadside stops on Oldchurch Road, which are around 500m away (see figure 1).
Figure 1: Bus stops serving Queen’s Hospital.
6
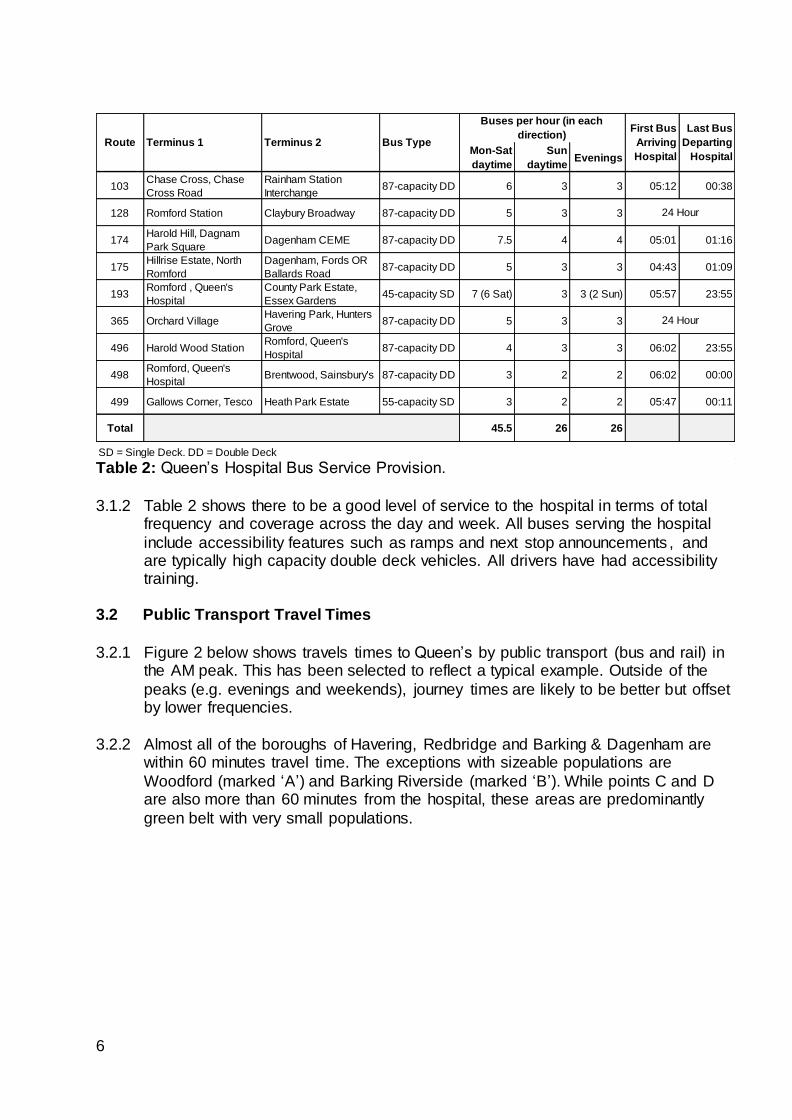
Table 2: Queen’s Hospital Bus Service Provision.
3.1.2 Table 2 shows there to be a good level of service to the hospital in terms of total frequency and coverage across the day and week. All buses serving the hospital
include accessibility features such as ramps and next stop announcements , and are typically high capacity double deck vehicles. All drivers have had accessibility training.
3.2 Public Transport Travel Times
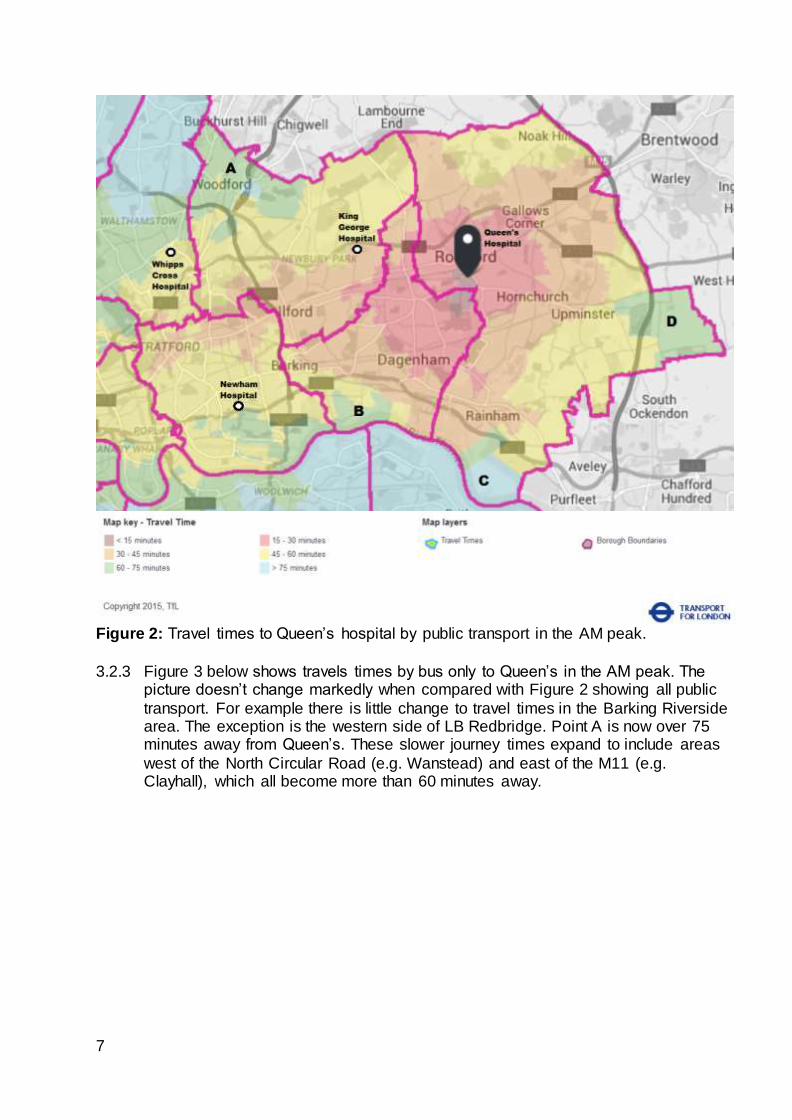
3.2.1 Figure 2 below shows travels times to Queen’s by public transport (bus and rail) in
the AM peak. This has been selected to reflect a typical example. Outside of the
peaks (e.g. evenings and weekends), journey times are likely to be better but offset by lower frequencies.
3.2.2 Almost all of the boroughs of Havering, Redbridge and Barking & Dagenham are
within 60 minutes travel time. The exceptions with sizeable populations are
Woodford (marked ‘A’) and Barking Riverside (marked ‘B’). While points C and D are also more than 60 minutes from the hospital, these areas are predominantly
green belt with very small populations.
Mon-Sat
daytime
Sun
daytimeEvenings
103Chase Cross, Chase
Cross Road
Rainham Station
Interchange87-capacity DD 6 3 3 05:12 00:38
128 Romford Station Claybury Broadway 87-capacity DD 5 3 3
174Harold Hill, Dagnam
Park SquareDagenham CEME 87-capacity DD 7.5 4 4 05:01 01:16
175Hillrise Estate, North
Romford
Dagenham, Fords OR
Ballards Road87-capacity DD 5 3 3 04:43 01:09
193Romford , Queen's
Hospital
County Park Estate,
Essex Gardens45-capacity SD 7 (6 Sat) 3 3 (2 Sun) 05:57 23:55
365 Orchard VillageHavering Park, Hunters
Grove87-capacity DD 5 3 3
496 Harold Wood StationRomford, Queen's
Hospital87-capacity DD 4 3 3 06:02 23:55
498Romford, Queen's
HospitalBrentwood, Sainsbury's 87-capacity DD 3 2 2 06:02 00:00
499 Gallows Corner, Tesco Heath Park Estate 55-capacity SD 3 2 2 05:47 00:11
Total 45.5 26 26
SD = Single Deck. DD = Double Deck
Terminus 1Route
24 Hour
24 Hour
Buses per hour (in each
direction)Bus TypeTerminus 2
First Bus
Arriving
Hospital
Last Bus
Departing
Hospital
7
Figure 2: Travel times to Queen’s hospital by public transport in the AM peak.
3.2.3 Figure 3 below shows travels times by bus only to Queen’s in the AM peak. The picture doesn’t change markedly when compared with Figure 2 showing all public
transport. For example there is little change to travel times in the Barking Riverside area. The exception is the western side of LB Redbridge. Point A is now over 75 minutes away from Queen’s. These slower journey times expand to include areas
west of the North Circular Road (e.g. Wanstead) and east of the M11 (e.g. Clayhall), which all become more than 60 minutes away.
8
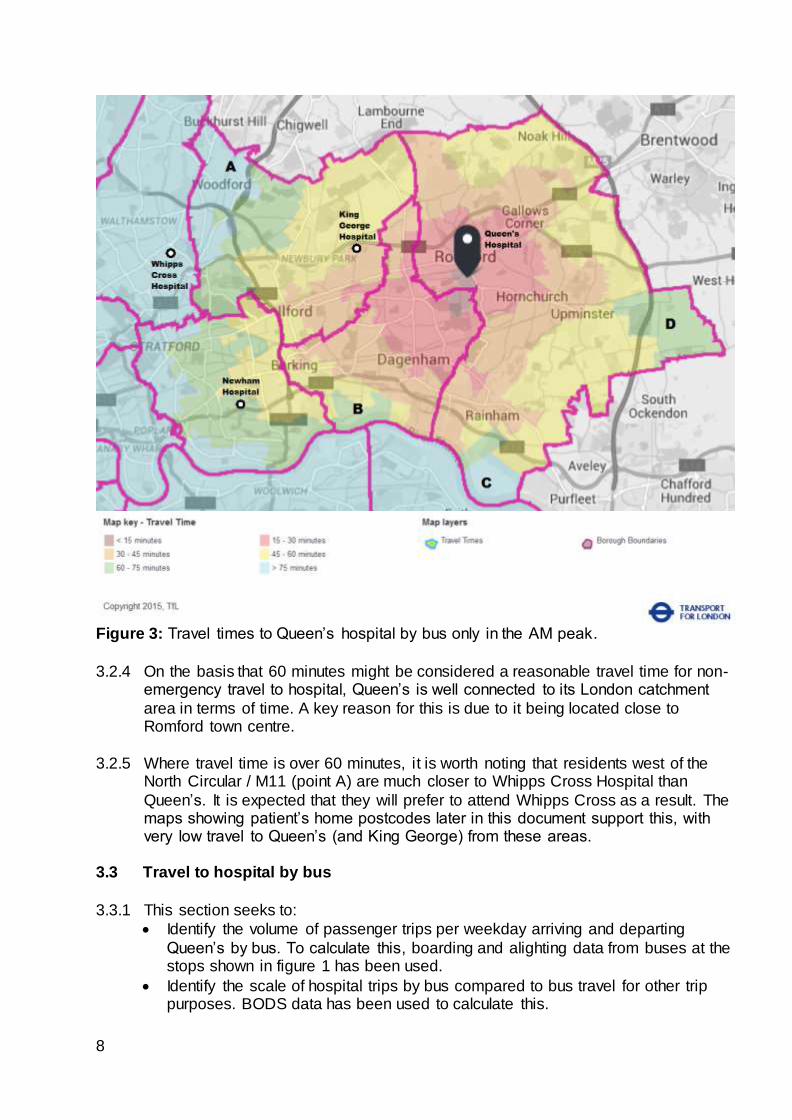
Figure 3: Travel times to Queen’s hospital by bus only in the AM peak.
3.2.4 On the basis that 60 minutes might be considered a reasonable travel time for non-emergency travel to hospital, Queen’s is well connected to its London catchment
area in terms of time. A key reason for this is due to it being located close to Romford town centre.
3.2.5 Where travel time is over 60 minutes, it is worth noting that residents west of the North Circular / M11 (point A) are much closer to Whipps Cross Hospital than
Queen’s. It is expected that they will prefer to attend Whipps Cross as a result. The maps showing patient’s home postcodes later in this document support this, with very low travel to Queen’s (and King George) from these areas.
3.3 Travel to hospital by bus
3.3.1 This section seeks to:
Identify the volume of passenger trips per weekday arriving and departing
Queen’s by bus. To calculate this, boarding and alighting data from buses at the stops shown in figure 1 has been used.
Identify the scale of hospital trips by bus compared to bus travel for other trip purposes. BODS data has been used to calculate this.
9
Analyse where hospital trips originate from using BODS data.
Obtain an estimate of how travel to hospital varies by day of the week. This has
been done by comparing boarding data only (Oyster tap-ins) by day of the week. Oyster data has been used for this purpose as BODS is a weekday only survey.
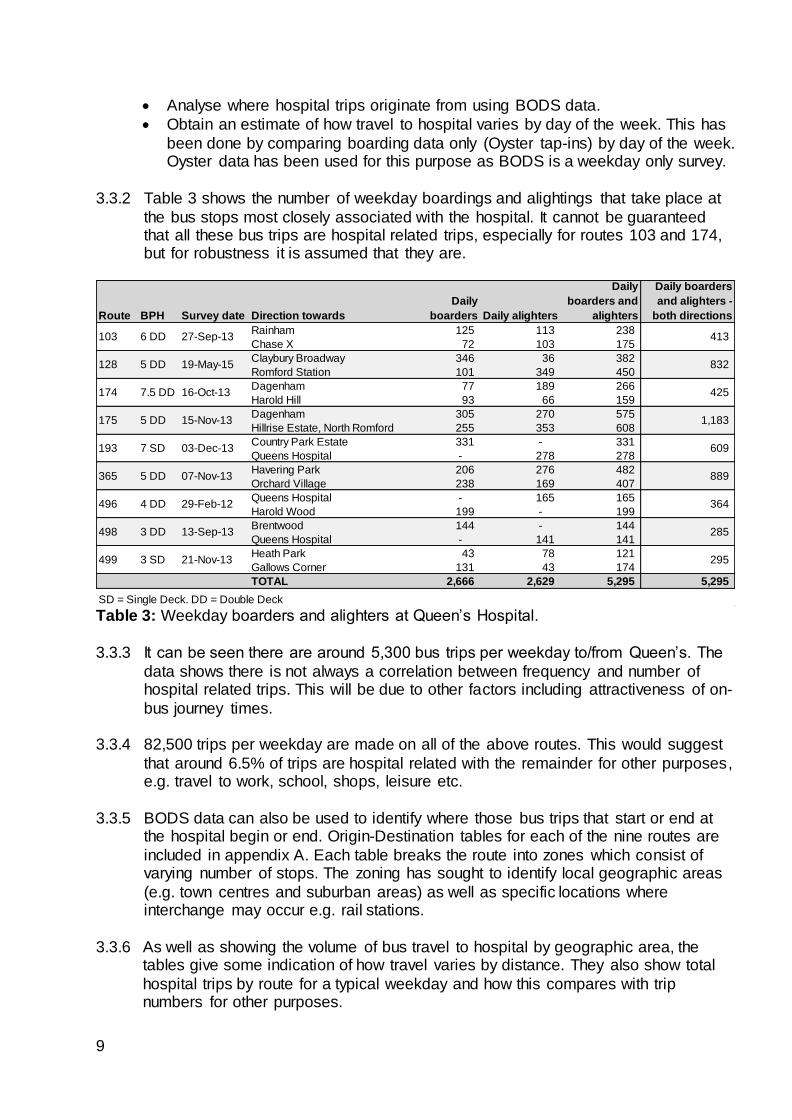
3.3.2 Table 3 shows the number of weekday boardings and alightings that take place at
the bus stops most closely associated with the hospital. It cannot be guaranteed that all these bus trips are hospital related trips, especially for routes 103 and 174, but for robustness it is assumed that they are.
Table 3: Weekday boarders and alighters at Queen’s Hospital.
3.3.3 It can be seen there are around 5,300 bus trips per weekday to/from Queen’s. The
data shows there is not always a correlation between frequency and number of hospital related trips. This will be due to other factors including attractiveness of on-
bus journey times.
3.3.4 82,500 trips per weekday are made on all of the above routes. This would suggest
that around 6.5% of trips are hospital related with the remainder for other purposes, e.g. travel to work, school, shops, leisure etc.
3.3.5 BODS data can also be used to identify where those bus trips that start or end at
the hospital begin or end. Origin-Destination tables for each of the nine routes are
included in appendix A. Each table breaks the route into zones which consist of varying number of stops. The zoning has sought to identify local geographic areas
(e.g. town centres and suburban areas) as well as specific locations where interchange may occur e.g. rail stations.
3.3.6 As well as showing the volume of bus travel to hospital by geographic area, the tables give some indication of how travel varies by distance. They also show total
hospital trips by route for a typical weekday and how this compares with trip numbers for other purposes.
Route BPH Survey date Direction towards
Daily
boarders Daily alighters
Daily
boarders and
alighters
Daily boarders
and alighters -
both directions
Rainham 125 113 238
Chase X 72 103 175
Claybury Broadway 346 36 382
Romford Station 101 349 450
Dagenham 77 189 266
Harold Hill 93 66 159
Dagenham 305 270 575
Hillrise Estate, North Romford 255 353 608
Country Park Estate 331 - 331
Queens Hospital - 278 278
Havering Park 206 276 482
Orchard Village 238 169 407
Queens Hospital - 165 165
Harold Wood 199 - 199
Brentwood 144 - 144
Queens Hospital - 141 141
Heath Park 43 78 121
Gallows Corner 131 43 174
TOTAL 2,666 2,629 5,295 5,295
SD = Single Deck. DD = Double Deck
499
498
496
365
193
4 DD
3 DD
174
128
103
175
3 SD
16-Oct-13
19-May-15
27-Sep-136 DD
5 DD
7.5 DD
21-Nov-13
13-Sep-13
29-Feb-12
07-Nov-13
03-Dec-13
15-Nov-135 DD
7 SD
5 DD
1,183
425
832
413
295
285
364
889
609
10
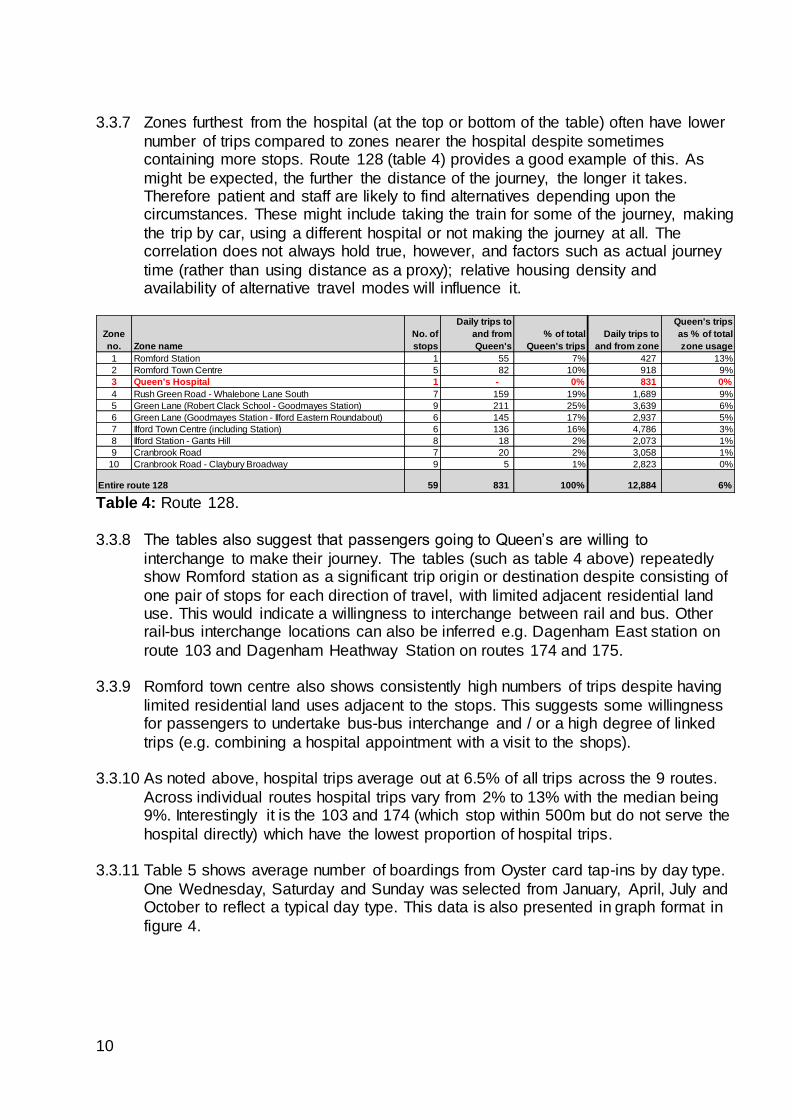
3.3.7 Zones furthest from the hospital (at the top or bottom of the table) often have lower
number of trips compared to zones nearer the hospital despite sometimes containing more stops. Route 128 (table 4) provides a good example of this. As
might be expected, the further the distance of the journey, the longer it takes. Therefore patient and staff are likely to find alternatives depending upon the circumstances. These might include taking the train for some of the journey, making
the trip by car, using a different hospital or not making the journey at all. The correlation does not always hold true, however, and factors such as actual journey
time (rather than using distance as a proxy); relative housing density and availability of alternative travel modes will influence it.
Table 4: Route 128.
3.3.8 The tables also suggest that passengers going to Queen’s are willing to
interchange to make their journey. The tables (such as table 4 above) repeatedly show Romford station as a significant trip origin or destination despite consisting of
one pair of stops for each direction of travel, with limited adjacent residential land use. This would indicate a willingness to interchange between rail and bus. Other rail-bus interchange locations can also be inferred e.g. Dagenham East station on
route 103 and Dagenham Heathway Station on routes 174 and 175.
3.3.9 Romford town centre also shows consistently high numbers of trips despite having
limited residential land uses adjacent to the stops. This suggests some willingness for passengers to undertake bus-bus interchange and / or a high degree of linked
trips (e.g. combining a hospital appointment with a visit to the shops).
3.3.10 As noted above, hospital trips average out at 6.5% of all trips across the 9 routes.
Across individual routes hospital trips vary from 2% to 13% with the median being 9%. Interestingly it is the 103 and 174 (which stop within 500m but do not serve the
hospital directly) which have the lowest proportion of hospital trips.
3.3.11 Table 5 shows average number of boardings from Oyster card tap-ins by day type.
One Wednesday, Saturday and Sunday was selected from January, April, July and October to reflect a typical day type. This data is also presented in graph format in
figure 4.
Zone
no. Zone name
No. of
stops
Daily trips to
and from
Queen's
% of total
Queen's trips
Daily trips to
and from zone
Queen's trips
as % of total
zone usage
1 Romford Station 1 55 7% 427 13%
2 Romford Town Centre 5 82 10% 918 9%
3 Queen's Hospital 1 - 0% 831 0%
4 Rush Green Road - Whalebone Lane South 7 159 19% 1,689 9%
5 Green Lane (Robert Clack School - Goodmayes Station) 9 211 25% 3,639 6%
6 Green Lane (Goodmayes Station - Ilford Eastern Roundabout) 6 145 17% 2,937 5%
7 Ilford Town Centre (including Station) 6 136 16% 4,786 3%
8 Ilford Station - Gants Hill 8 18 2% 2,073 1%
9 Cranbrook Road 7 20 2% 3,058 1%
10 Cranbrook Road - Claybury Broadway 9 5 1% 2,823 0%
59 831 100% 12,884 6%Entire route 128
11
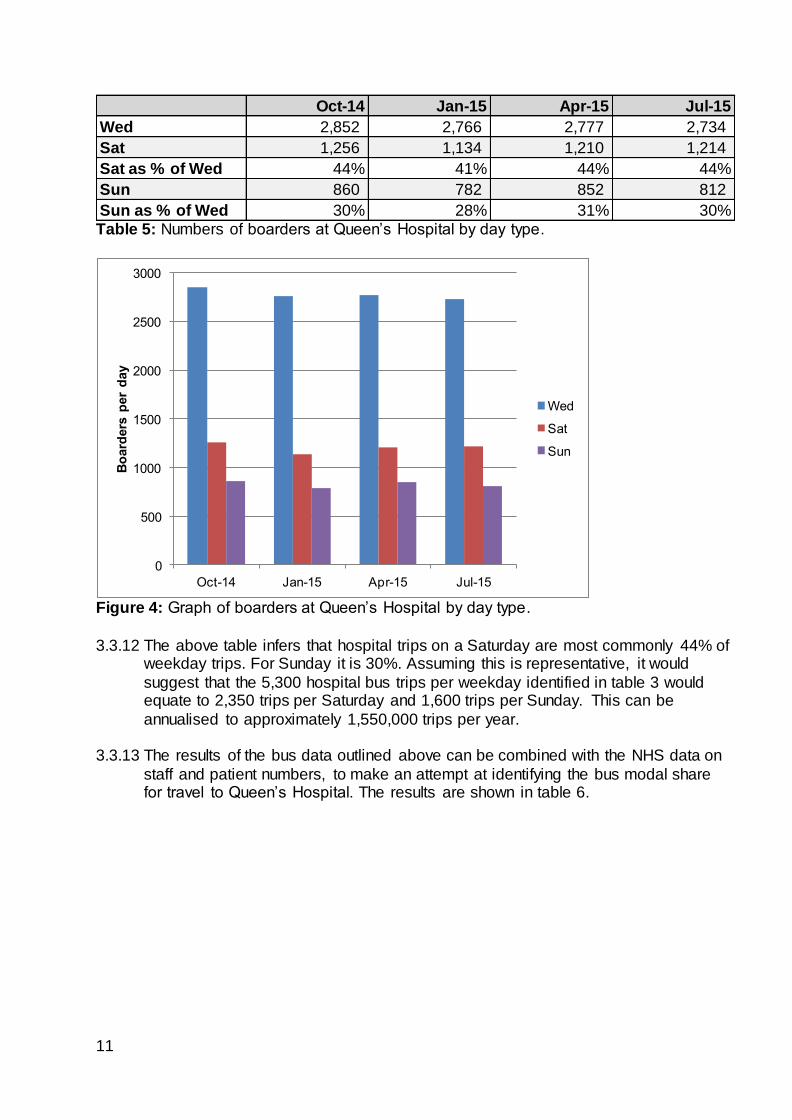
Table 5: Numbers of boarders at Queen’s Hospital by day type.
Figure 4: Graph of boarders at Queen’s Hospital by day type.
3.3.12 The above table infers that hospital trips on a Saturday are most commonly 44% of
weekday trips. For Sunday it is 30%. Assuming this is representative, it would
suggest that the 5,300 hospital bus trips per weekday identified in table 3 would equate to 2,350 trips per Saturday and 1,600 trips per Sunday. This can be
annualised to approximately 1,550,000 trips per year.
3.3.13 The results of the bus data outlined above can be combined with the NHS data on
staff and patient numbers, to make an attempt at identifying the bus modal share for travel to Queen’s Hospital. The results are shown in table 6.
Oct-14 Jan-15 Apr-15 Jul-15
Wed 2,852 2,766 2,777 2,734
Sat 1,256 1,134 1,210 1,214
Sat as % of Wed 44% 41% 44% 44%
Sun 860 782 852 812
Sun as % of Wed 30% 28% 31% 30%
0
500
1000
1500
2000
2500
3000
Oct-14 Jan-15 Apr-15 Jul-15
Bo
ard
ers
per
day
Wed
Sat
Sun
12
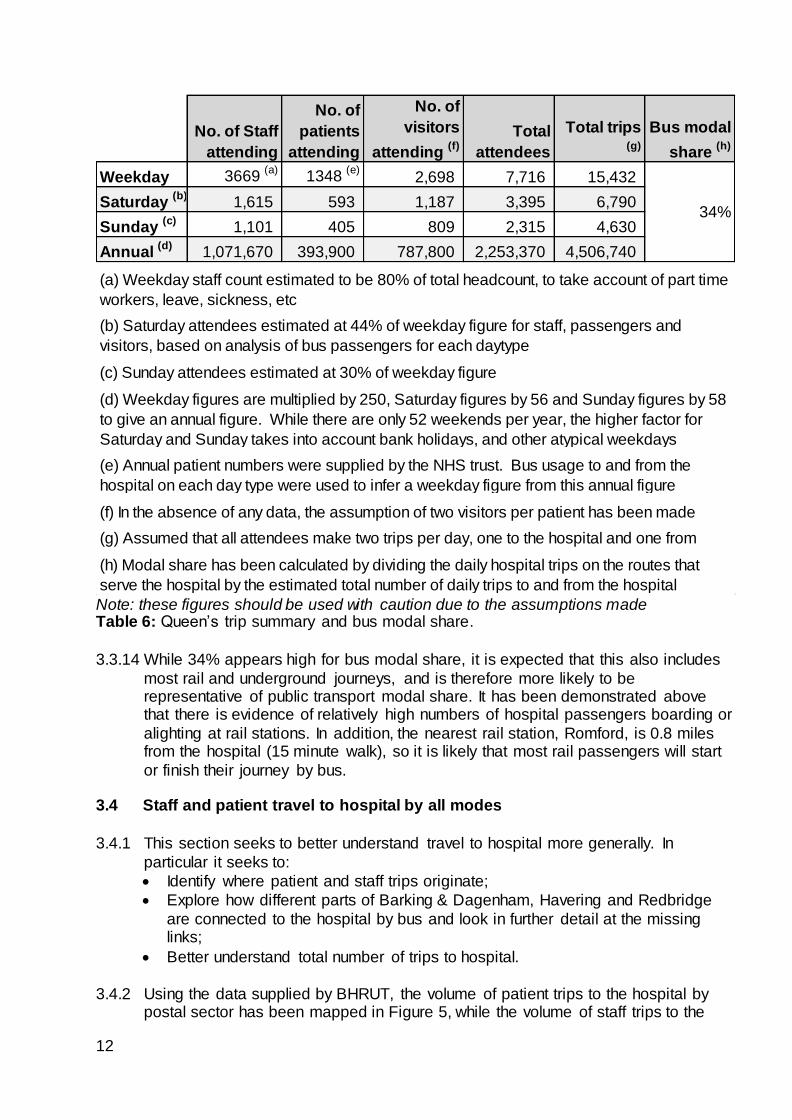
Note: these figures should be used with caution due to the assumptions made Table 6: Queen’s trip summary and bus modal share.
3.3.14 While 34% appears high for bus modal share, it is expected that this also includes
most rail and underground journeys, and is therefore more likely to be representative of public transport modal share. It has been demonstrated above that there is evidence of relatively high numbers of hospital passengers boarding or
alighting at rail stations. In addition, the nearest rail station, Romford, is 0.8 miles from the hospital (15 minute walk), so it is likely that most rail passengers will start
or finish their journey by bus. 3.4 Staff and patient travel to hospital by all modes
3.4.1 This section seeks to better understand travel to hospital more generally. In
particular it seeks to:
Identify where patient and staff trips originate;
Explore how different parts of Barking & Dagenham, Havering and Redbridge
are connected to the hospital by bus and look in further detail at the missing links;
Better understand total number of trips to hospital.
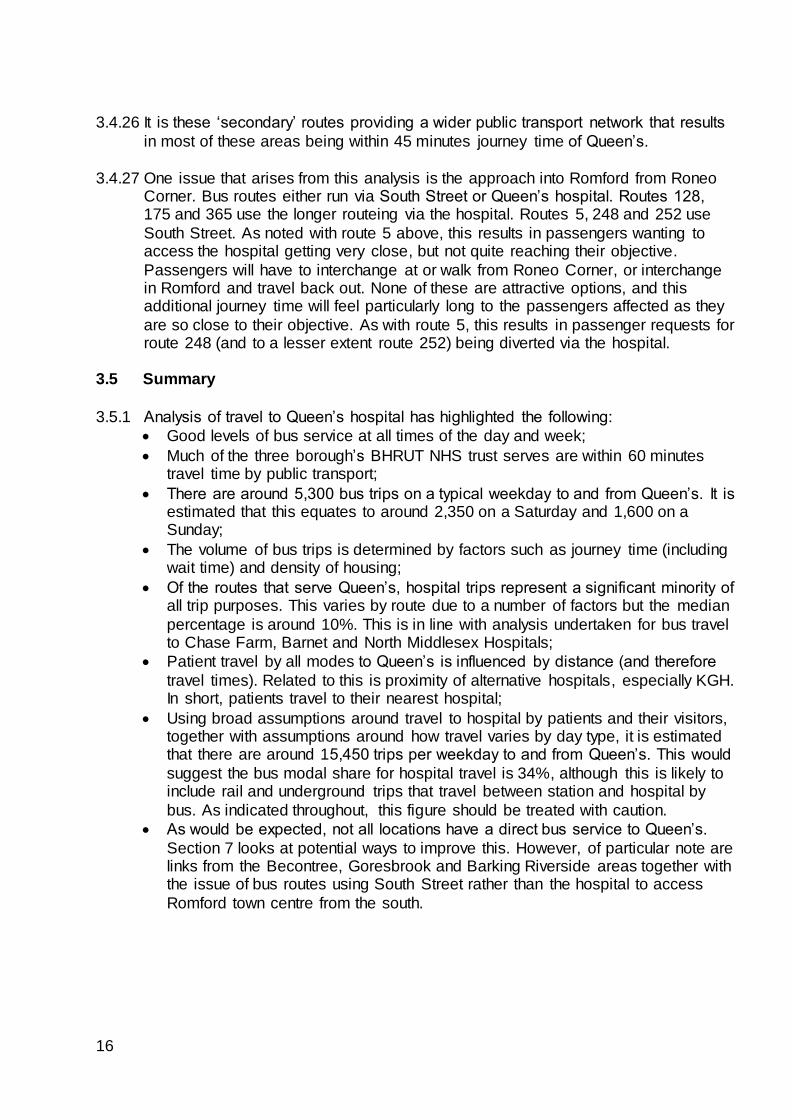
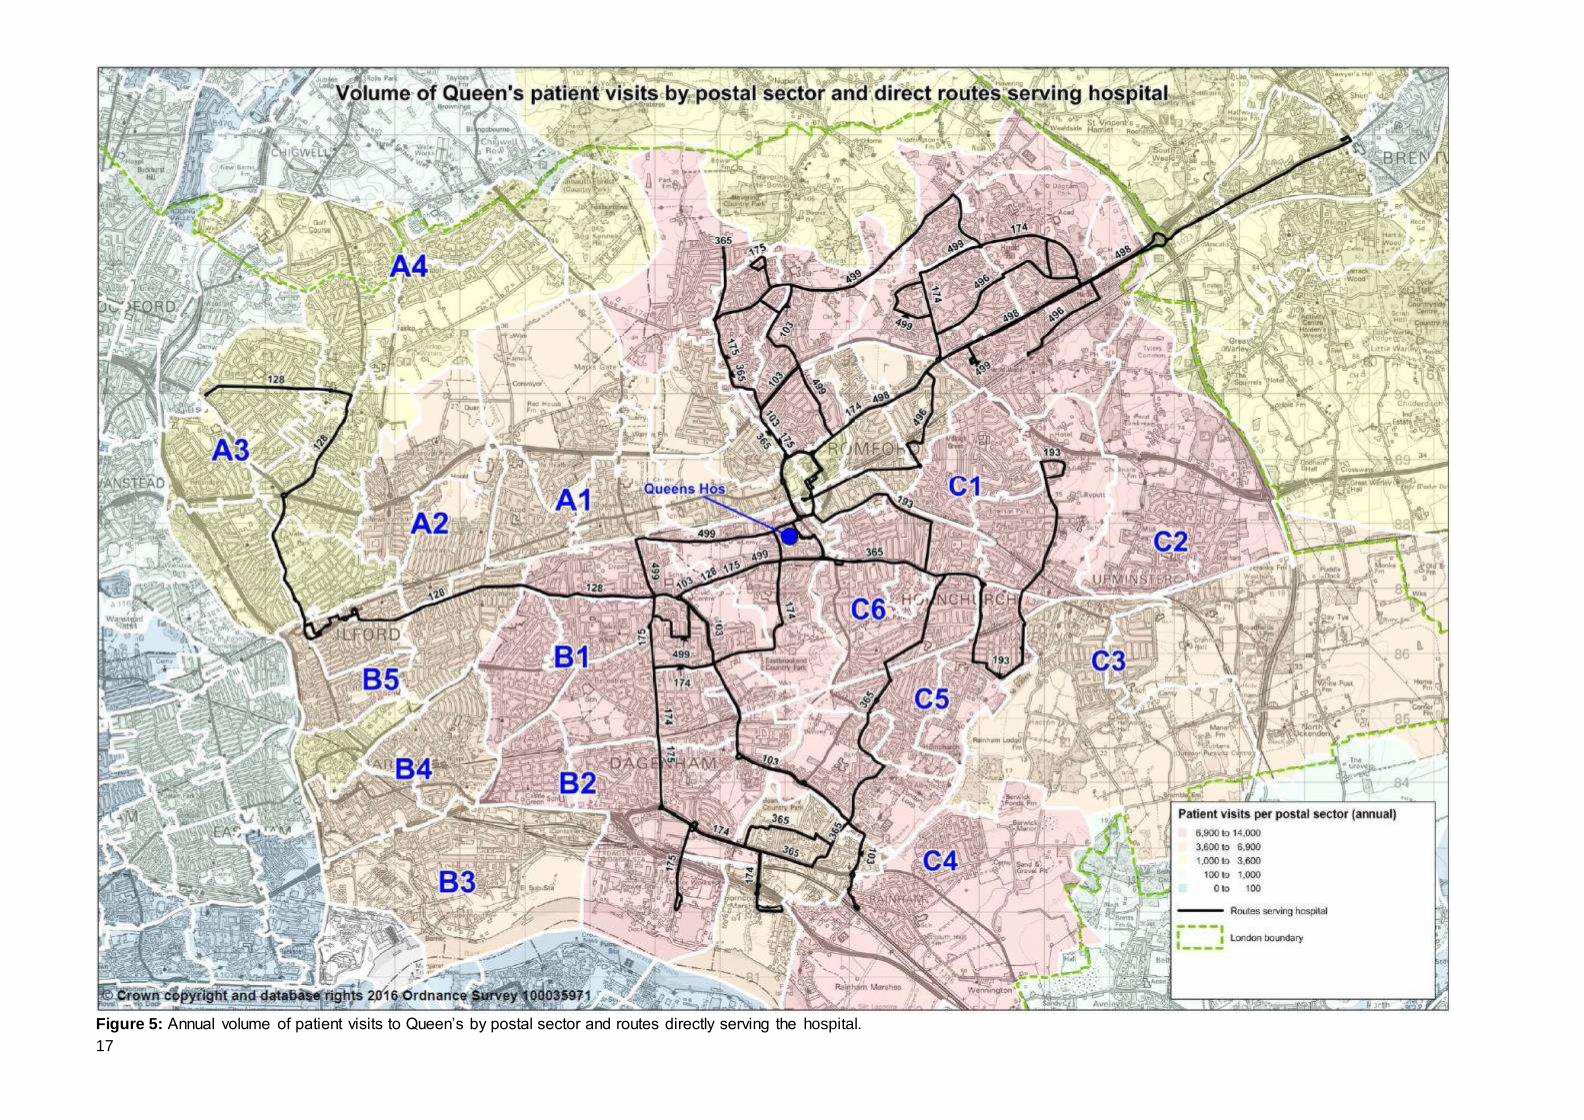
3.4.2 Using the data supplied by BHRUT, the volume of patient trips to the hospital by postal sector has been mapped in Figure 5, while the volume of staff trips to the
No. of Staff
attending
No. of
patients
attending
No. of
visitors
attending (f)
Total
attendees
Total trips (g)
Bus modal
share (h)
Weekday 3669 (a)
1348 (e)
2,698 7,716 15,432
Saturday (b)
1,615 593 1,187 3,395 6,790
Sunday (c)
1,101 405 809 2,315 4,630
Annual (d)
1,071,670 393,900 787,800 2,253,370 4,506,740
(f) In the absence of any data, the assumption of two visitors per patient has been made
(g) Assumed that all attendees make two trips per day, one to the hospital and one from
(e) Annual patient numbers were supplied by the NHS trust. Bus usage to and from the
hospital on each day type were used to infer a weekday figure from this annual figure
(h) Modal share has been calculated by dividing the daily hospital trips on the routes that
serve the hospital by the estimated total number of daily trips to and from the hospital
34%
(a) Weekday staff count estimated to be 80% of total headcount, to take account of part time
workers, leave, sickness, etc
(b) Saturday attendees estimated at 44% of weekday figure for staff, passengers and
visitors, based on analysis of bus passengers for each daytype
(c) Sunday attendees estimated at 30% of weekday figure
(d) Weekday figures are multiplied by 250, Saturday figures by 56 and Sunday figures by 58
to give an annual figure. While there are only 52 weekends per year, the higher factor for
Saturday and Sunday takes into account bank holidays, and other atypical weekdays
13
hospital by both postal sector and full postcode has been mapped in Figure 6. This data covers travel by all modes and data for patients is an annual figure not daily.
The maps show a similarity between the concentrations of where patients and staff reside. For this reason, this section mainly focuses on interpreting patient data.
3.4.3 There is a strong correlation between distance and volume of trips, with the
greatest number of patient visits, (shown in red), coming from areas local to the
hospital. As distance from the hospital increases, trip numbers decrease. The result is fairly concentric circles emanating from Queen’s except in the NW quadrant
where trip numbers are markedly lower. As will be seen in Figure 14, this is primarily due to patients opting to use KGH instead.
3.4.4 Also depicted on the maps are the bus routes directly serving the hospital, shown in black. Together, these routes provide a reasonably comprehensive coverage of the
BHRUT catchment area, with strong correlation between the areas with the highest levels of patient visits / staff home address and the availability of a direct bus service.
3.4.5 However, as would be expected, there are locations which do not have a direct bus
service to Queen’s. These include the NW area of the map (labelled A); the SW area (labelled B) and parts of the East / SE of the map (labelled C).
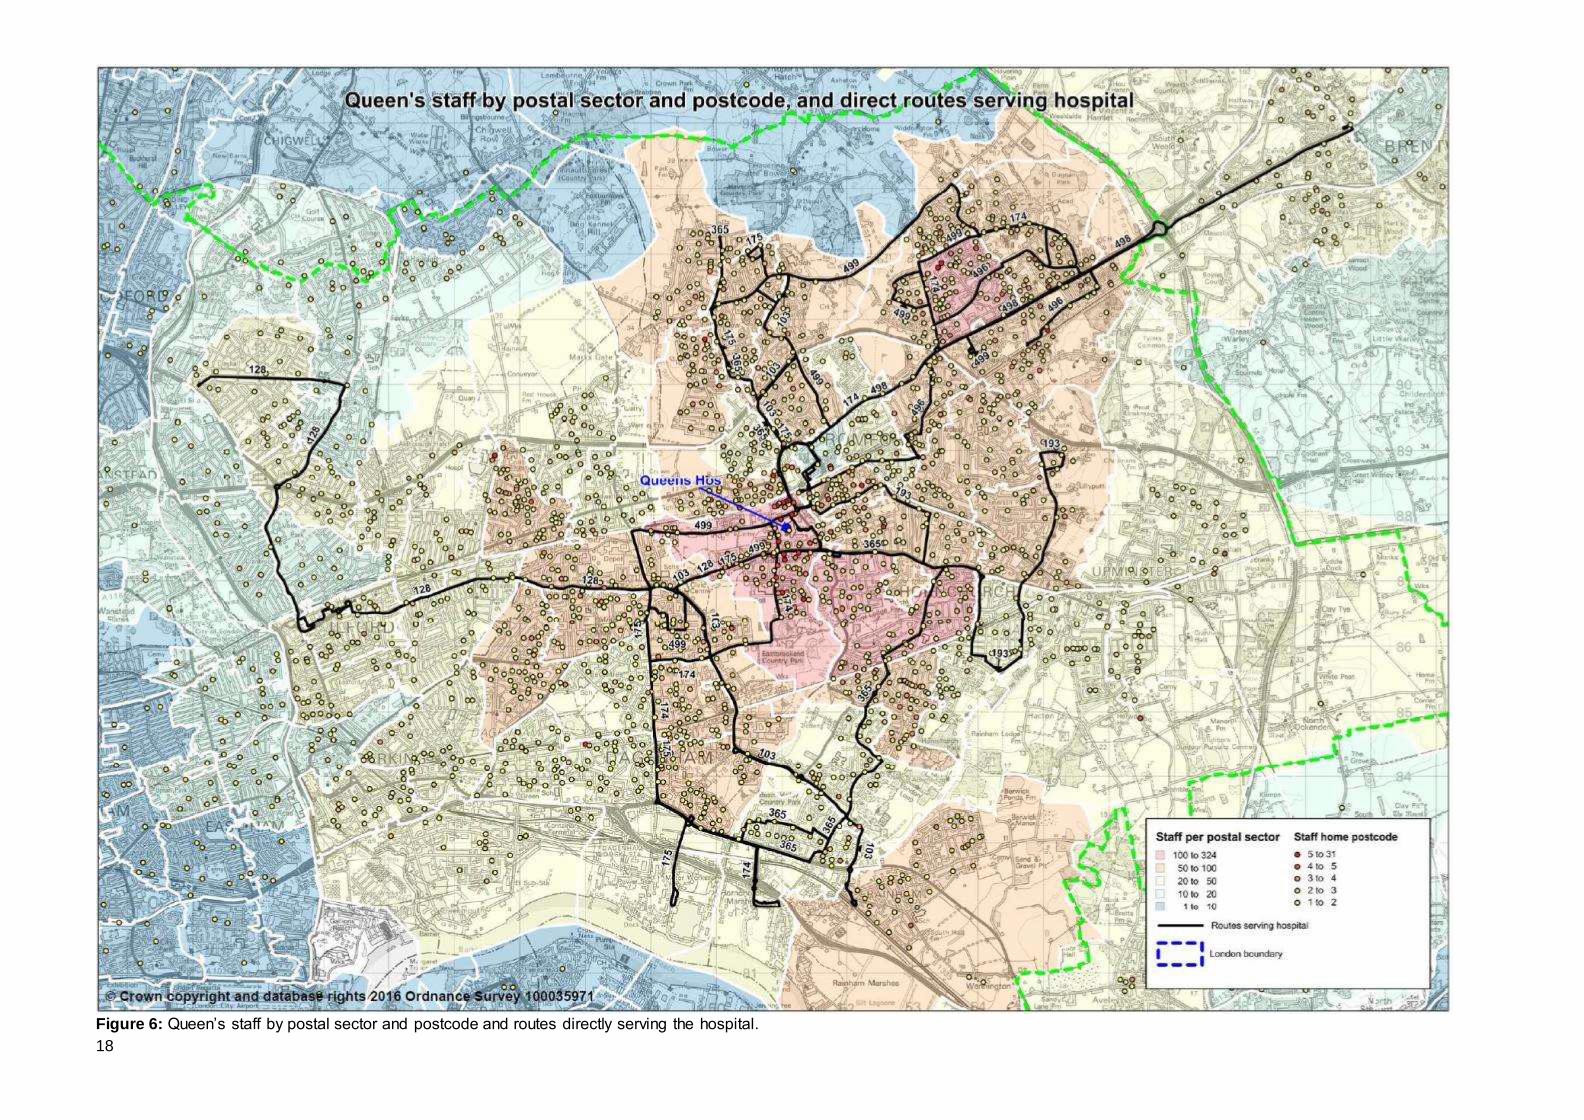
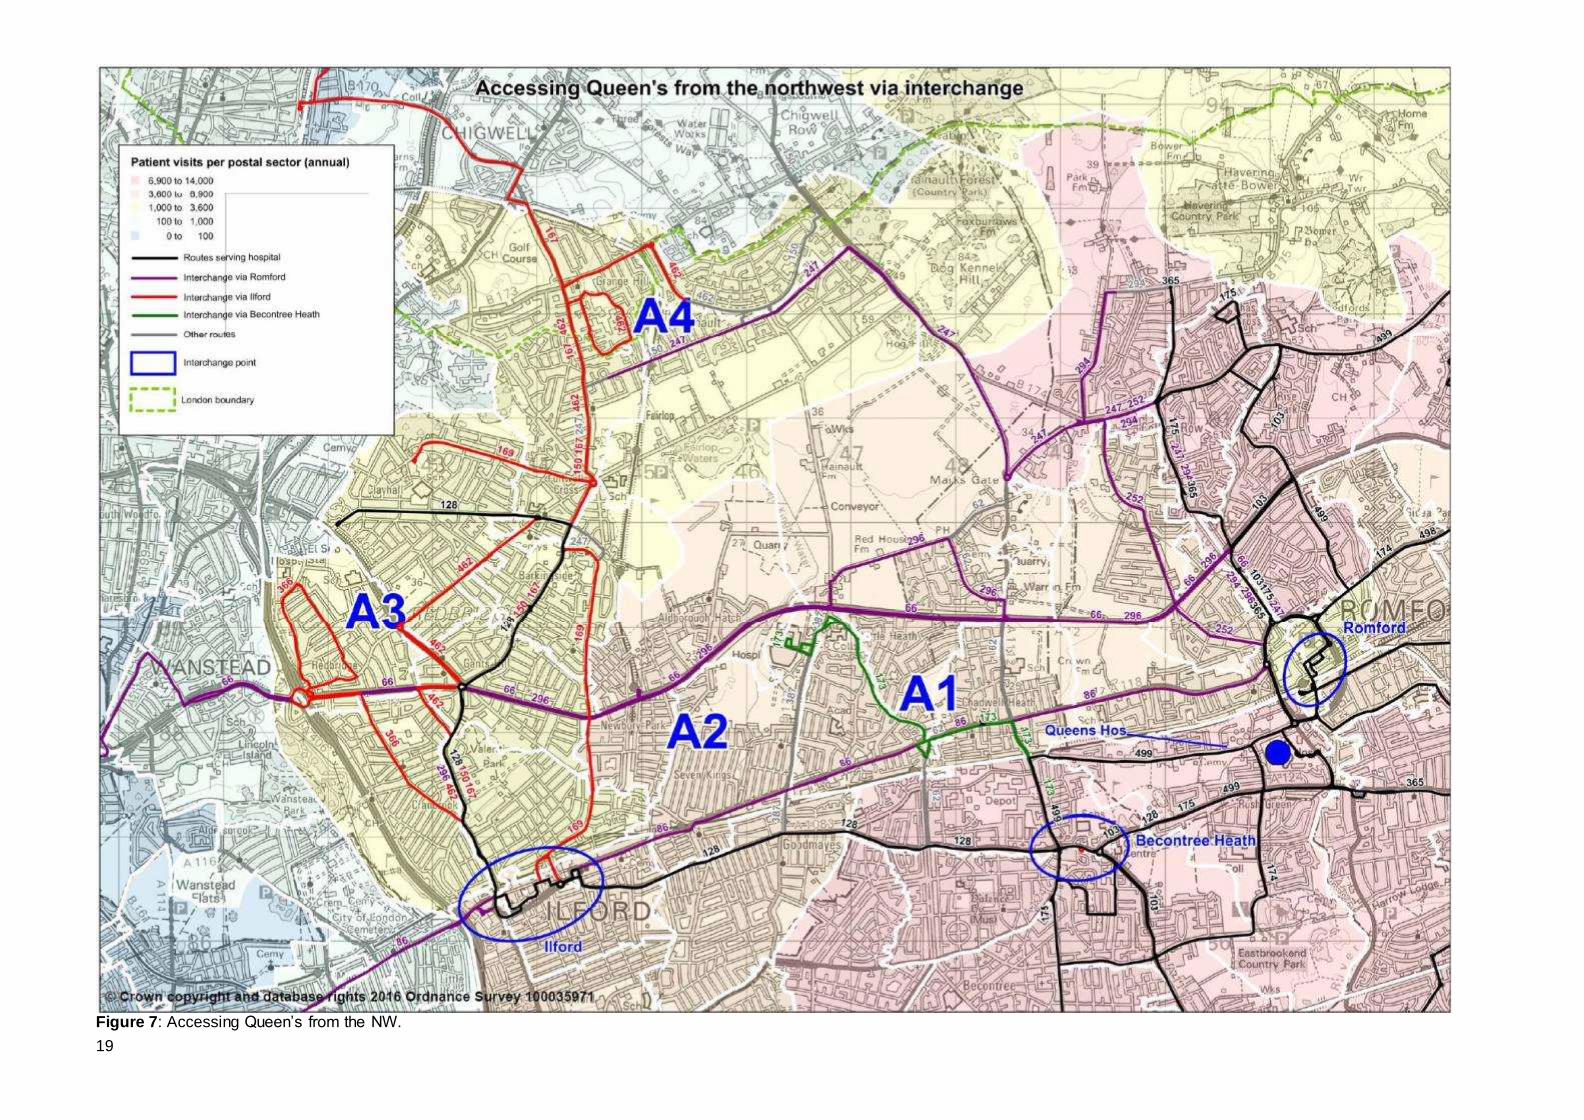
NW of Queen’s (Area A) [See Figure 7] 3.4.6 This shows the area in more detail. As noted from the bus origin-destination tables,
passengers are prepared to interchange to make their hospital journey. It has been assumed that passengers are prepared to make only one bus-bus interchange and that this would occur in locations where passengers feel most comfortable doing so
e.g. local centres.
3.4.7 Informed in part by the BODS data, it has been assumed that Romford and Ilford town centres and Becontree Heath would be reasonable places for interchange. Romford town centre is an obvious interchange location for Queen’s Hospital, as all
nine of the routes that serve the hospital also serve the town centre. Ilford is large town centre which is directly linked to Queen’s by the 128 but also by rail to
Romford. Becontree Heath is a local centre where a number of bus routes that serve Queen’s concentrate. These routes are the 128, 175 and 499 and together provide around 13 bph to Queen’s. Key bus services feeding into these interchange
nodes have been plotted to show the wider coverage of the bus network.
3.4.8 The general Chadwell Heath area (labelled A1 in figure 7) has a mid-range of patient trips to Queens (3,600 – 6,900 per annum). Travel times are around 30 – 45 minutes. There is quite a high concentration of staff living close to KGH. It is
thought this is in part due to NHS accommodation being provided here but possibly also because some staff work at both Queen’s and KGH. Travel between hospital
sites for medical staff is expected to reduce as medical services are rationalised. It is not expected there will be much need for patients to travel between hospital sites either.
3.4.9 It can be seen that this area is linked by route 173 into Becontree Heath from where
routes 128, 175 and (to some extent) 499 can be used for onward travel to
14
Queen’s. Route 173 was converted to double deck operation and increased in frequency in October 2015 thus improving interchange. To the north and south of
the A1 area are the high frequency routes 66 (5 bph) and 86 (10 bph). Also to the south is the railway line with fast links into Romford for onward interchange.
3.4.10 The hospital also operates an hourly minibus service between the two hospital
sites. First bus is around 7.30 am and the last bus is at 18.50.
3.4.11 The Seven Kings area (labelled A2) also has a mid-range of patient trips but low
numbers of staff living there (20 – 50). Travel times are around 30 – 45 minutes. Many are within 400m walk distance of the 66, 86 and railway line to Romford. Those who have longer walk times are more closely served by route 364 (6 bph).
The route provides links to Goodmayes station.
3.4.12 The wider Gants Hill area (labelled A3) is directly linked to Queen’s by route 128. This area has the lowest number of patient trips – 100 – 1,000 per year. It has 45 – 60 minute travel times by public transport. However, there are a number of
locations which are remote from the 128. Instead these areas are served by routes into Ilford from where interchange onto rail or the 128 can be made. These
secondary routes include the 150 (5 bph), route 167 (3 bph), route 169 (6 bph), route 366 (increased in frequency to 6 bph from April 2016) and route 462 (4 bph).
3.4.13 The Hainault area (labelled A4) also has very low patient and staff trips. Despite its seeming remoteness from Queen’s, route 247 (6 bph) provides direct links into
Romford for onward interchange. This in part explains why typical travel times to Queen’s are under 1 hour.
3.4.14 As previously discussed, it is the Woodford area that has the longest public transport travel times to Queen’s. However the number of patient trips is neglibile –
less than 100 per year. Since this is travel by all modes, it suggests that people living in his area use Whipps Cross instead.
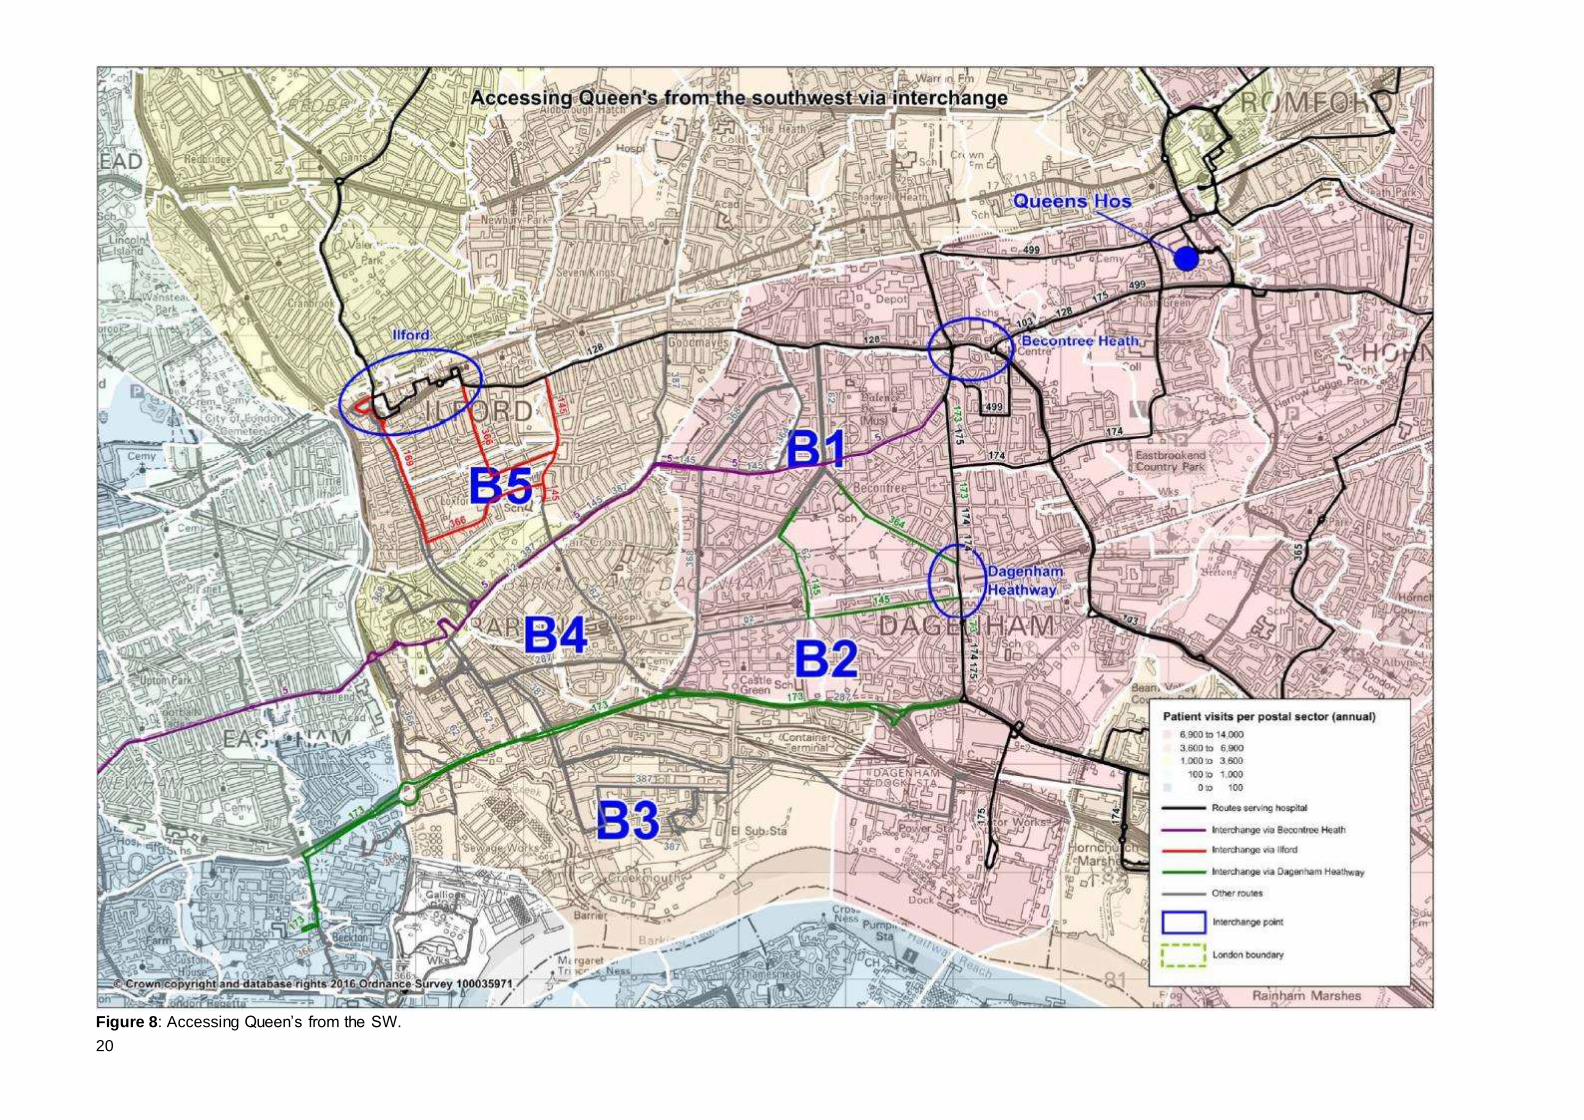
SW of Queen’s (Area B) [See figure 8] 3.4.15 As with area A, a similar approach has been made with regard to the area bounded
by Green Lane (route 128) to the north, the Heathway (routes 173, 174 and 175) to the east, the Thames to the south and Roding Valley to the west. Ilford, and Becontree Heath have again be selected as interchange nodes, as has Dagenham
Heathway which is a local centre and served by the District Line.
3.4.16 Becontree (the area around where Longbridge Road, Valence Avenue, Parsloes Avenue and Porters Avenue and labelled B1) has high numbers of patient visits (6,900 – 14,000 per year). Typical travel times are up to 30 minutes. However, it
does not benefit from direct bus services. Route 5 provides very high frequency (9bph+) into Becontree Heath. It actually runs quite close to Queen’s Hospital but
enters Romford via South Street rather than via the hospital. Rom Valley Way and the River Rom impede pedestrian movement between the areas. This proximity to the hospital without serving it has resulted in many stakeholder requests to divert
route 5 via the Hospital.
15
3.4.17 The area also has links via the 364 (6 bph) to Dagenham Heathway for onward connection to Queen’s. However, this is a less attractive option for passengers as it
is not direct.
3.4.18 The Goresbrook area (labelled B2) has similar characteristics to Becontree with the exception that travel via Dagenham Heathway is more progressive and therefore likely to be more attractive to passengers. Routes 173, 145 and the District Line
provide links into Dagenham Heathway for onward connection to Queen’s via the 174 and 175. Route 173 provides direct links to KGH.
3.4.19 A feature of Goresbrook is that some parts of it are more than 400m from any bus
service. Previous attempts to introduce a route have failed but the Borough is now
looking more favourably on such a scheme and TfL are working with LB Barking & Dagenham regarding a potential bus priority scheme that would allow better bus
access into Goresbrook.
3.4.20 Thames View Estate and Barking Riverside (labelled B3) have mid-level numbers
of patient trips and low staff trips. However, this is likely to increase once 10,900 homes are built in Barking Riverside by 2031. As noted above, journey times to
Queen’s can be over an hour for some. The EL2 has been rerouted to provide a direct link between Thames View Estate and Becontree Heath from March 2016.
3.4.21 Barking Riverside will see significant new development from 2017 onwards including provision of new roads. It is envisaged that bus routes will be amended
over time to provide for the associated travel demand. As well as amendments to the EL2 to better serve the new development, TfL planning work also envisages a new route linking Barking Riverside and Goresbrook from around 2026. Such a
route could provide more direct links to Becontree Heath via Becontree for onward interchange.
3.4.22 Areas like Gascoigne Estate and Fair Cross (labelled B4) have mid-level numbers
of patient trips and fairly low staff trips. Good links exist onto the route 5 corridor
but, as noted above, the 5 does not directly serve Queen’s.
3.4.23 The Loxford area (labelled B5) has mid-level numbers of patient trips and fairly low staff trips. It has good links into Ilford for onwards connection to Queen’s by route 128 or by rail to Romford.
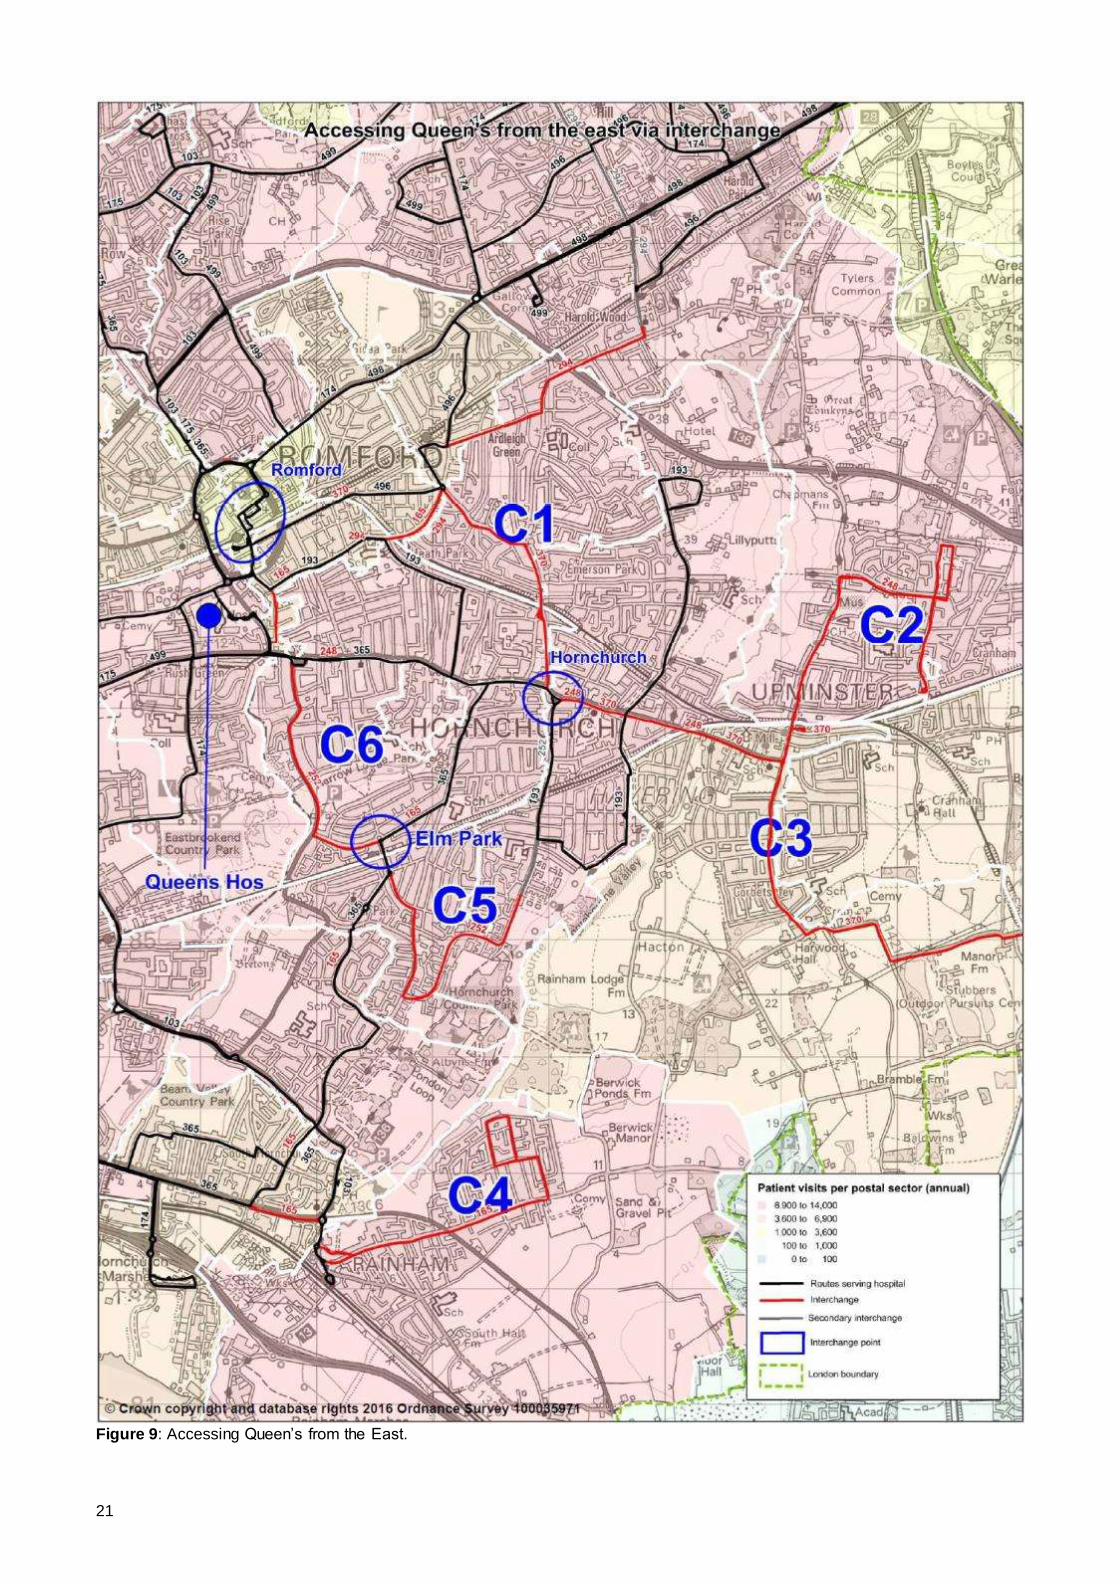
East of Queen’s (Area C) [See Figure 9]
3.4.24 This area is broadly defined by the Greater London Boundary, A13, Beam / Rom Valleys and the A12. With the exception of the South Upminster / Corbets Tey area (labelled C3), patient trips to Queen’s hospital are high (6,900 – 14,000 per year).
Staff are also located here in relatively high numbers, especially in the Elm Park and Hornchurch areas. Romford, Elm Park and Hornchurch have been selected as
reasonable interchange points where no direct bus service exists.
3.4.25 In broad terms, where direct bus services are not available, there are good links
into the local interchange hubs. Examples include route 370 (4 bph) from areas labelled C1 (Ardleigh Green / Emerson Park) and C3 (South Upminster / Corbets
Tey) into Romford and the 165 from Abbey Wood Lane (C4) into Elm Park.
16
3.4.26 It is these ‘secondary’ routes providing a wider public transport network that results
in most of these areas being within 45 minutes journey time of Queen’s.
3.4.27 One issue that arises from this analysis is the approach into Romford from Roneo Corner. Bus routes either run via South Street or Queen’s hospital. Routes 128, 175 and 365 use the longer routeing via the hospital. Routes 5, 248 and 252 use
South Street. As noted with route 5 above, this results in passengers wanting to access the hospital getting very close, but not quite reaching their objective.
Passengers will have to interchange at or walk from Roneo Corner, or interchange in Romford and travel back out. None of these are attractive options, and this additional journey time will feel particularly long to the passengers affected as they
are so close to their objective. As with route 5, this results in passenger requests for route 248 (and to a lesser extent route 252) being diverted via the hospital.
3.5 Summary
3.5.1 Analysis of travel to Queen’s hospital has highlighted the following:
Good levels of bus service at all times of the day and week;
Much of the three borough’s BHRUT NHS trust serves are within 60 minutes travel time by public transport;
There are around 5,300 bus trips on a typical weekday to and from Queen’s. It is estimated that this equates to around 2,350 on a Saturday and 1,600 on a Sunday;
The volume of bus trips is determined by factors such as journey time (including wait time) and density of housing;
Of the routes that serve Queen’s, hospital trips represent a significant minority of all trip purposes. This varies by route due to a number of factors but the median
percentage is around 10%. This is in line with analysis undertaken for bus travel to Chase Farm, Barnet and North Middlesex Hospitals;
Patient travel by all modes to Queen’s is influenced by distance (and therefore
travel times). Related to this is proximity of alternative hospitals, especially KGH. In short, patients travel to their nearest hospital;
Using broad assumptions around travel to hospital by patients and their visitors, together with assumptions around how travel varies by day type, it is estimated that there are around 15,450 trips per weekday to and from Queen’s. This would
suggest the bus modal share for hospital travel is 34%, although this is likely to include rail and underground trips that travel between station and hospital by
bus. As indicated throughout, this figure should be treated with caution.
As would be expected, not all locations have a direct bus service to Queen’s.
Section 7 looks at potential ways to improve this. However, of particular note are links from the Becontree, Goresbrook and Barking Riverside areas together with the issue of bus routes using South Street rather than the hospital to access
Romford town centre from the south.
17
Figure 5: Annual volume of patient visits to Queen’s by postal sector and routes directly serving the hospital.
18
Figure 6: Queen’s staff by postal sector and postcode and routes directly serving the hospital.
19
Figure 7: Accessing Queen’s from the NW.
20
Figure 8: Accessing Queen’s from the SW.
21
Figure 9: Accessing Queen’s from the East.
22
4 KING GEORGE HOSPITAL 4.1 Direct bus service provision
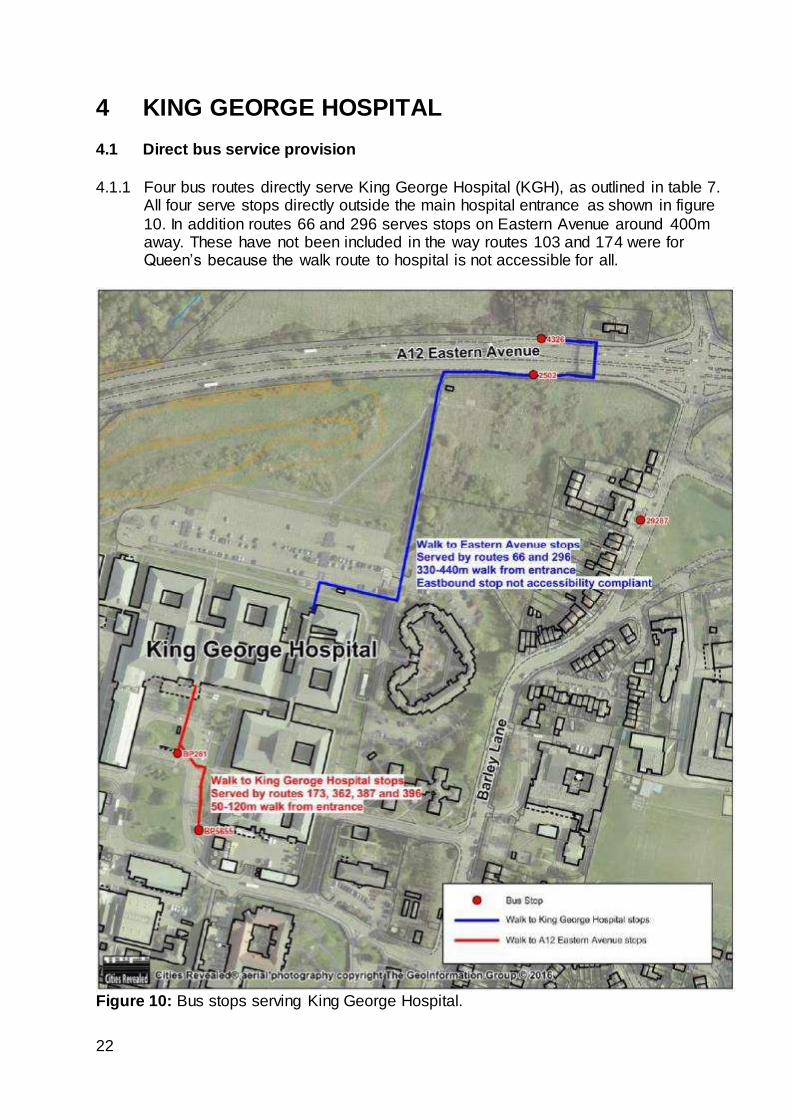
4.1.1 Four bus routes directly serve King George Hospital (KGH), as outlined in table 7. All four serve stops directly outside the main hospital entrance as shown in figure
10. In addition routes 66 and 296 serves stops on Eastern Avenue around 400m away. These have not been included in the way routes 103 and 174 were for Queen’s because the walk route to hospital is not accessible for all.
Figure 10: Bus stops serving King George Hospital.
23
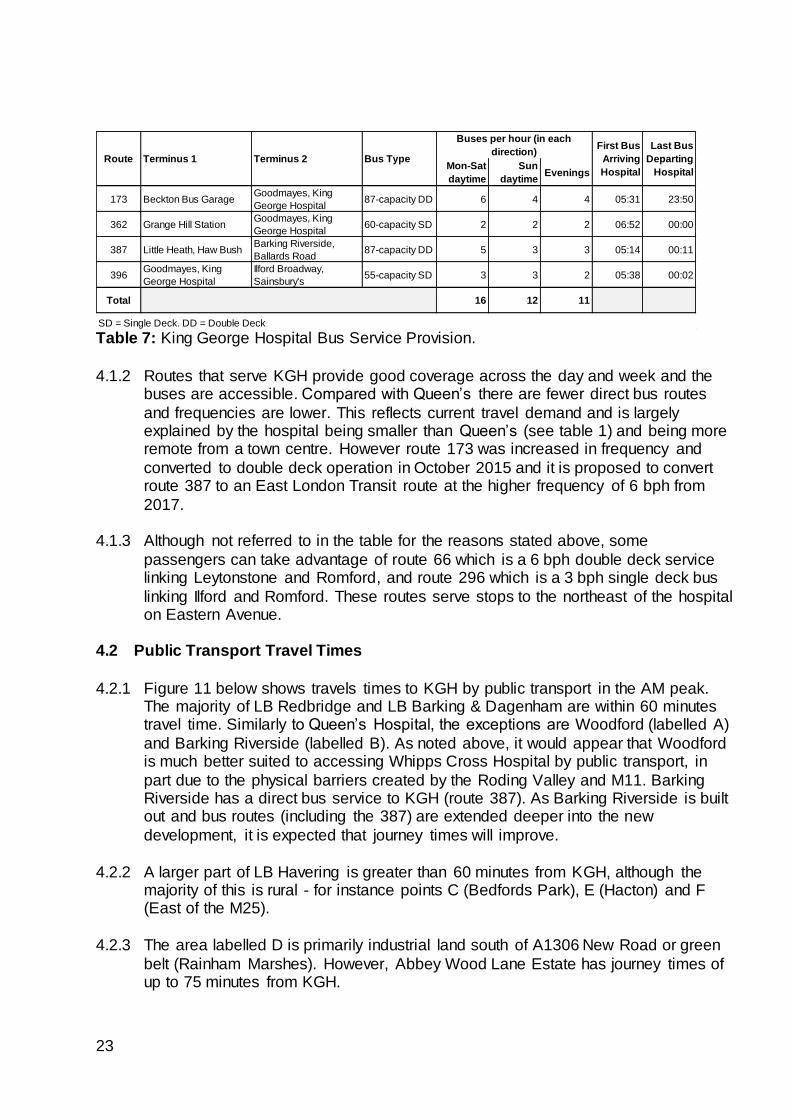
Table 7: King George Hospital Bus Service Provision.
4.1.2 Routes that serve KGH provide good coverage across the day and week and the buses are accessible. Compared with Queen’s there are fewer direct bus routes
and frequencies are lower. This reflects current travel demand and is largely explained by the hospital being smaller than Queen’s (see table 1) and being more remote from a town centre. However route 173 was increased in frequency and
converted to double deck operation in October 2015 and it is proposed to convert route 387 to an East London Transit route at the higher frequency of 6 bph from
2017.
4.1.3 Although not referred to in the table for the reasons stated above, some
passengers can take advantage of route 66 which is a 6 bph double deck service linking Leytonstone and Romford, and route 296 which is a 3 bph single deck bus
linking Ilford and Romford. These routes serve stops to the northeast of the hospital on Eastern Avenue.
4.2 Public Transport Travel Times
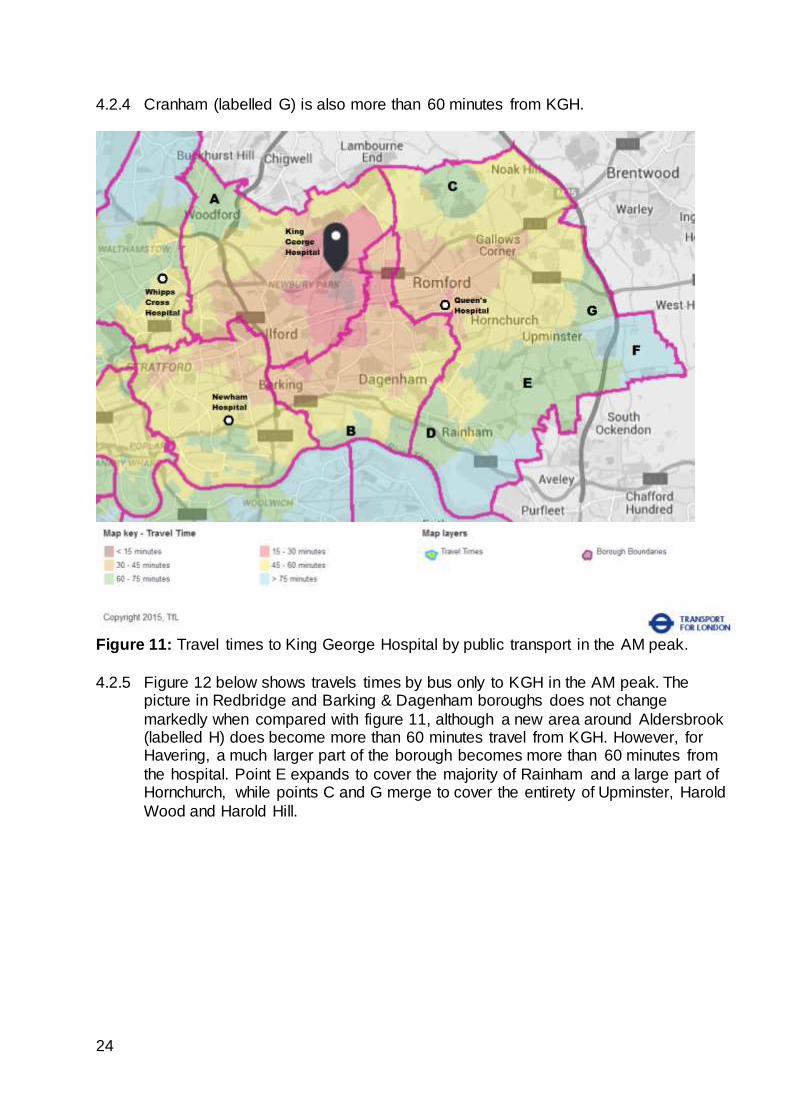
4.2.1 Figure 11 below shows travels times to KGH by public transport in the AM peak. The majority of LB Redbridge and LB Barking & Dagenham are within 60 minutes travel time. Similarly to Queen’s Hospital, the exceptions are Woodford (labelled A)
and Barking Riverside (labelled B). As noted above, it would appear that Woodford is much better suited to accessing Whipps Cross Hospital by public transport, in
part due to the physical barriers created by the Roding Valley and M11. Barking Riverside has a direct bus service to KGH (route 387). As Barking Riverside is built out and bus routes (including the 387) are extended deeper into the new
development, it is expected that journey times will improve.
4.2.2 A larger part of LB Havering is greater than 60 minutes from KGH, although the majority of this is rural - for instance points C (Bedfords Park), E (Hacton) and F (East of the M25).
4.2.3 The area labelled D is primarily industrial land south of A1306 New Road or green
belt (Rainham Marshes). However, Abbey Wood Lane Estate has journey times of up to 75 minutes from KGH.
Mon-Sat
daytime
Sun
daytimeEvenings
173 Beckton Bus GarageGoodmayes, King
George Hospital87-capacity DD 6 4 4 05:31 23:50
362 Grange Hill StationGoodmayes, King
George Hospital60-capacity SD 2 2 2 06:52 00:00
387 Little Heath, Haw BushBarking Riverside,
Ballards Road87-capacity DD 5 3 3 05:14 00:11
396Goodmayes, King
George Hospital
Ilford Broadway,
Sainsbury's55-capacity SD 3 3 2 05:38 00:02
Total 16 12 11
SD = Single Deck. DD = Double Deck
First Bus
Arriving
Hospital
Last Bus
Departing
Hospital
Route Terminus 1 Terminus 2 Bus Type
Buses per hour (in each
direction)
24
4.2.4 Cranham (labelled G) is also more than 60 minutes from KGH.
Figure 11: Travel times to King George Hospital by public transport in the AM peak.
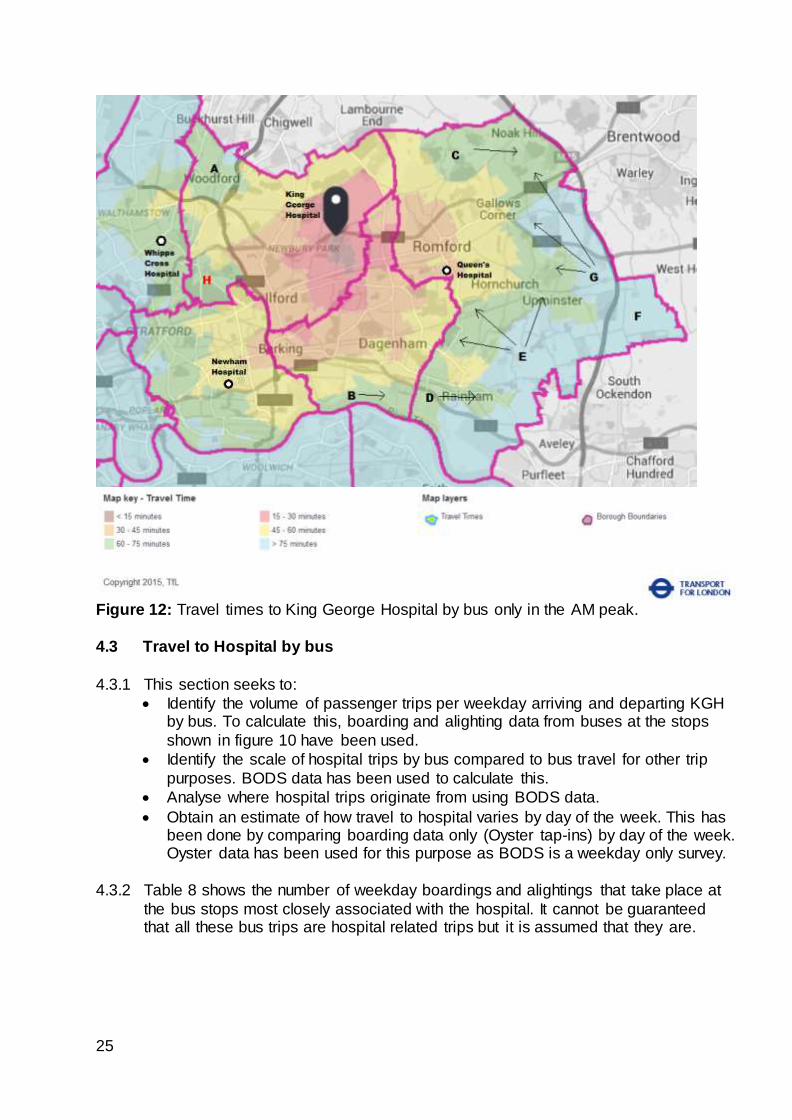
4.2.5 Figure 12 below shows travels times by bus only to KGH in the AM peak. The picture in Redbridge and Barking & Dagenham boroughs does not change
markedly when compared with figure 11, although a new area around Aldersbrook (labelled H) does become more than 60 minutes travel from KGH. However, for Havering, a much larger part of the borough becomes more than 60 minutes from
the hospital. Point E expands to cover the majority of Rainham and a large part of Hornchurch, while points C and G merge to cover the entirety of Upminster, Harold
Wood and Harold Hill.
25
Figure 12: Travel times to King George Hospital by bus only in the AM peak.
4.3 Travel to Hospital by bus
4.3.1 This section seeks to:
Identify the volume of passenger trips per weekday arriving and departing KGH by bus. To calculate this, boarding and alighting data from buses at the stops
shown in figure 10 have been used.
Identify the scale of hospital trips by bus compared to bus travel for other trip
purposes. BODS data has been used to calculate this.
Analyse where hospital trips originate from using BODS data.
Obtain an estimate of how travel to hospital varies by day of the week. This has been done by comparing boarding data only (Oyster tap-ins) by day of the week. Oyster data has been used for this purpose as BODS is a weekday only survey.
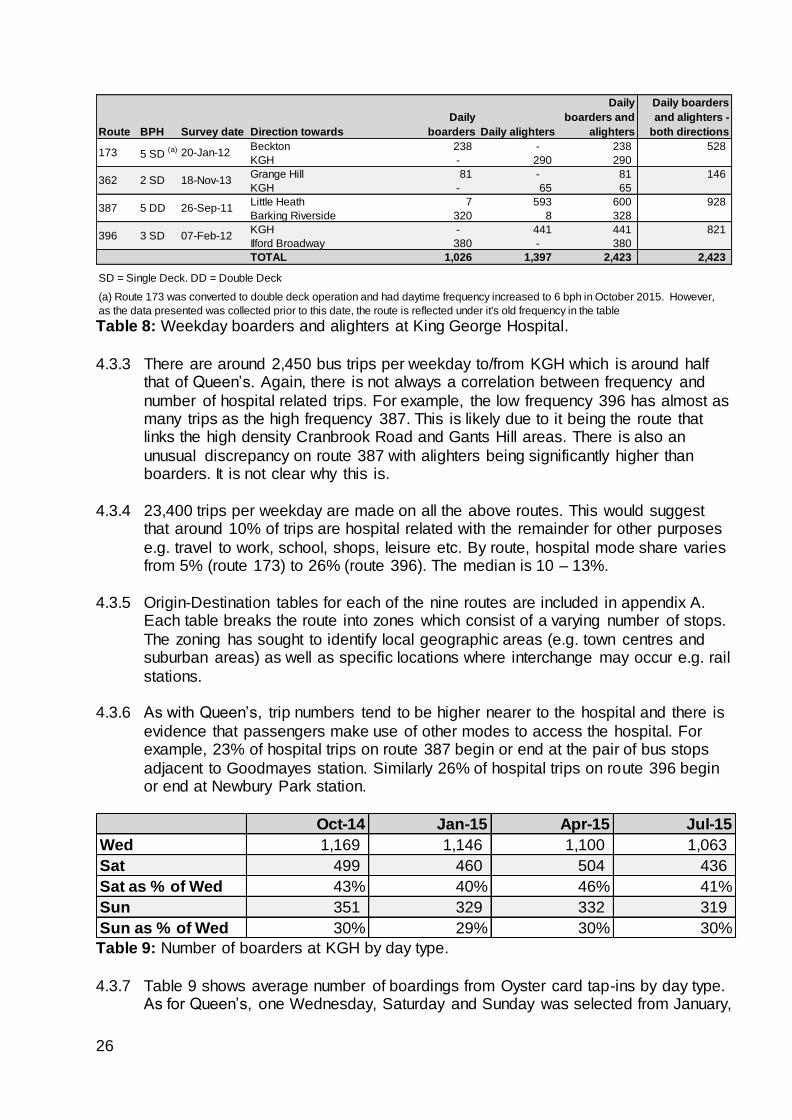
4.3.2 Table 8 shows the number of weekday boardings and alightings that take place at
the bus stops most closely associated with the hospital. It cannot be guaranteed that all these bus trips are hospital related trips but it is assumed that they are.
26
Table 8: Weekday boarders and alighters at King George Hospital.
4.3.3 There are around 2,450 bus trips per weekday to/from KGH which is around half that of Queen’s. Again, there is not always a correlation between frequency and
number of hospital related trips. For example, the low frequency 396 has almost as many trips as the high frequency 387. This is likely due to it being the route that links the high density Cranbrook Road and Gants Hill areas. There is also an
unusual discrepancy on route 387 with alighters being significantly higher than boarders. It is not clear why this is.
4.3.4 23,400 trips per weekday are made on all the above routes. This would suggest
that around 10% of trips are hospital related with the remainder for other purposes
e.g. travel to work, school, shops, leisure etc. By route, hospital mode share varies from 5% (route 173) to 26% (route 396). The median is 10 – 13%.
4.3.5 Origin-Destination tables for each of the nine routes are included in appendix A.
Each table breaks the route into zones which consist of a varying number of stops.
The zoning has sought to identify local geographic areas (e.g. town centres and suburban areas) as well as specific locations where interchange may occur e.g. rail
stations.
4.3.6 As with Queen’s, trip numbers tend to be higher nearer to the hospital and there is
evidence that passengers make use of other modes to access the hospital. For example, 23% of hospital trips on route 387 begin or end at the pair of bus stops
adjacent to Goodmayes station. Similarly 26% of hospital trips on route 396 begin or end at Newbury Park station.
Table 9: Number of boarders at KGH by day type.
4.3.7 Table 9 shows average number of boardings from Oyster card tap-ins by day type. As for Queen’s, one Wednesday, Saturday and Sunday was selected from January,
Route BPH Survey date Direction towards
Daily
boarders Daily alighters
Daily
boarders and
alighters
Daily boarders
and alighters -
both directions
Beckton 238 - 238 528
KGH - 290 290
Grange Hill 81 - 81 146
KGH - 65 65
Little Heath 7 593 600 928
Barking Riverside 320 8 328
KGH - 441 441 821
Ilford Broadway 380 - 380
TOTAL 1,026 1,397 2,423 2,423
SD = Single Deck. DD = Double Deck
(a) Route 173 was converted to double deck operation and had daytime frequency increased to 6 bph in October 2015. However,
as the data presented was collected prior to this date, the route is reflected under it's old frequency in the table
173 5 SD (a) 20-Jan-12
362 2 SD 18-Nov-13
387 5 DD 26-Sep-11
396 3 SD 07-Feb-12
Oct-14 Jan-15 Apr-15 Jul-15
Wed 1,169 1,146 1,100 1,063
Sat 499 460 504 436
Sat as % of Wed 43% 40% 46% 41%
Sun 351 329 332 319
Sun as % of Wed 30% 29% 30% 30%
27
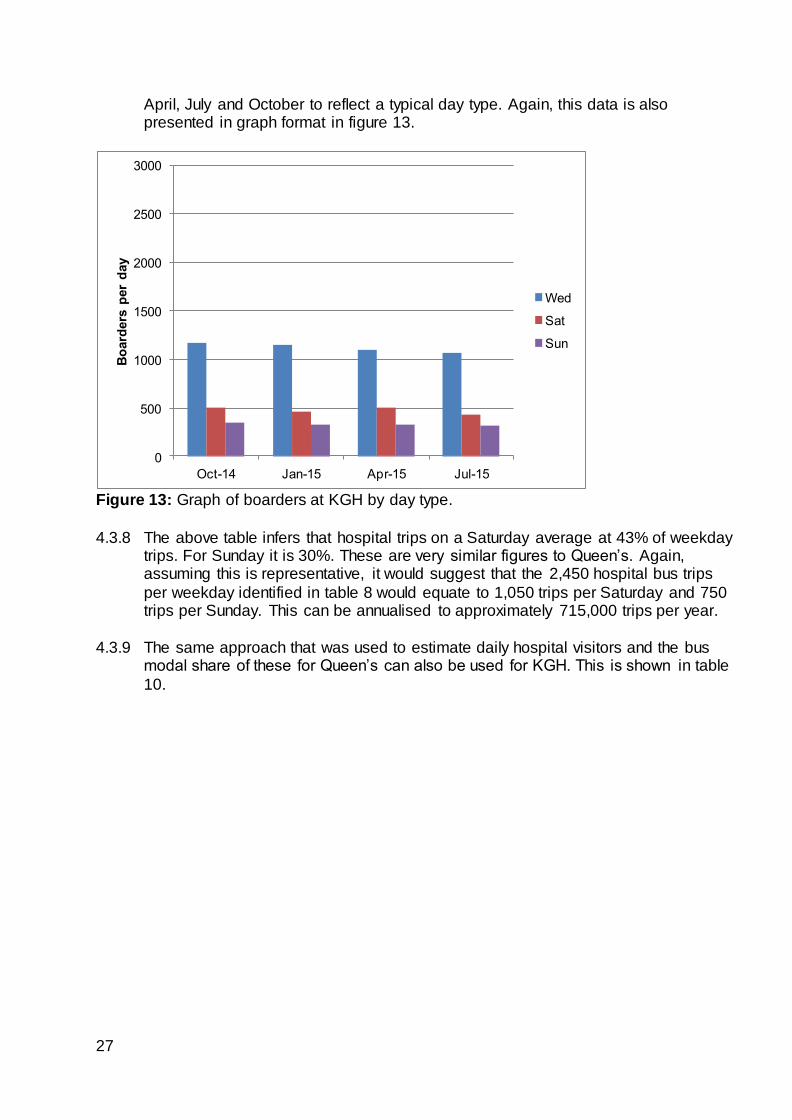
April, July and October to reflect a typical day type. Again, this data is also presented in graph format in figure 13.
Figure 13: Graph of boarders at KGH by day type.
4.3.8 The above table infers that hospital trips on a Saturday average at 43% of weekday trips. For Sunday it is 30%. These are very similar figures to Queen’s. Again, assuming this is representative, it would suggest that the 2,450 hospital bus trips
per weekday identified in table 8 would equate to 1,050 trips per Saturday and 750 trips per Sunday. This can be annualised to approximately 715,000 trips per year.
4.3.9 The same approach that was used to estimate daily hospital visitors and the bus
modal share of these for Queen’s can also be used for KGH. This is shown in table
10.
0
500
1000
1500
2000
2500
3000
Oct-14 Jan-15 Apr-15 Jul-15
Bo
ard
ers
per
day
Wed
Sat
Sun
28
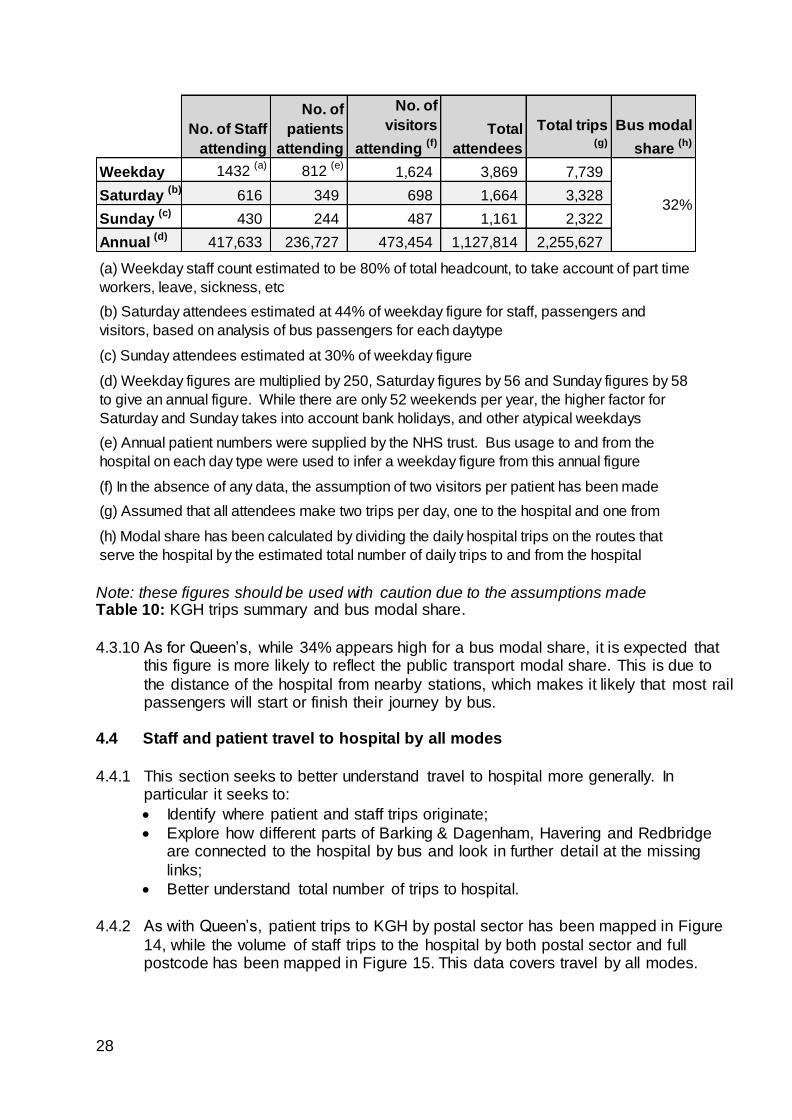
Note: these figures should be used with caution due to the assumptions made Table 10: KGH trips summary and bus modal share.
4.3.10 As for Queen’s, while 34% appears high for a bus modal share, it is expected that
this figure is more likely to reflect the public transport modal share. This is due to
the distance of the hospital from nearby stations, which makes it likely that most rail passengers will start or finish their journey by bus.
4.4 Staff and patient travel to hospital by all modes
4.4.1 This section seeks to better understand travel to hospital more generally. In particular it seeks to:
Identify where patient and staff trips originate;
Explore how different parts of Barking & Dagenham, Havering and Redbridge are connected to the hospital by bus and look in further detail at the missing
links;
Better understand total number of trips to hospital.
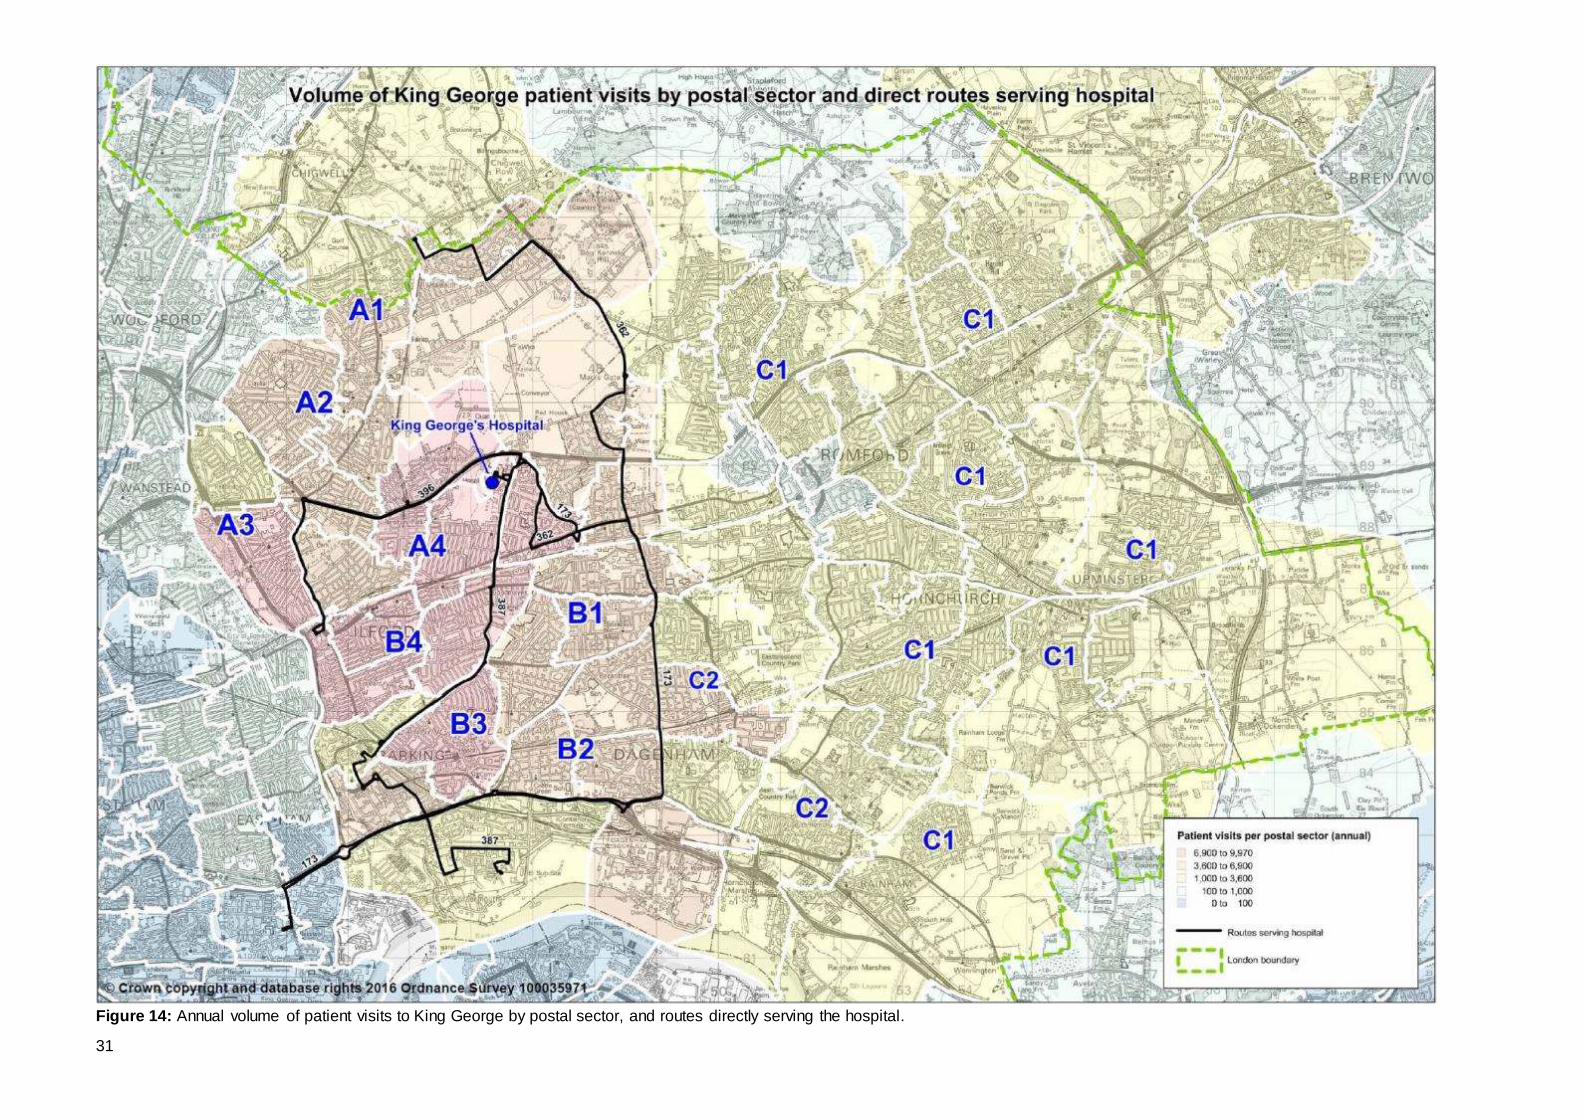
4.4.2 As with Queen’s, patient trips to KGH by postal sector has been mapped in Figure
14, while the volume of staff trips to the hospital by both postal sector and full postcode has been mapped in Figure 15. This data covers travel by all modes.
No. of Staff
attending
No. of
patients
attending
No. of
visitors
attending (f)
Total
attendees
Total trips (g)
Bus modal
share (h)
Weekday 1432 (a)
812 (e)
1,624 3,869 7,739
Saturday (b)
616 349 698 1,664 3,328
Sunday (c)
430 244 487 1,161 2,322
Annual (d)
417,633 236,727 473,454 1,127,814 2,255,627
(f) In the absence of any data, the assumption of two visitors per patient has been made
(g) Assumed that all attendees make two trips per day, one to the hospital and one from
32%
(a) Weekday staff count estimated to be 80% of total headcount, to take account of part time
workers, leave, sickness, etc
(b) Saturday attendees estimated at 44% of weekday figure for staff, passengers and
visitors, based on analysis of bus passengers for each daytype
(c) Sunday attendees estimated at 30% of weekday figure
(d) Weekday figures are multiplied by 250, Saturday figures by 56 and Sunday figures by 58
to give an annual figure. While there are only 52 weekends per year, the higher factor for
Saturday and Sunday takes into account bank holidays, and other atypical weekdays
(e) Annual patient numbers were supplied by the NHS trust. Bus usage to and from the
hospital on each day type were used to infer a weekday figure from this annual figure
(h) Modal share has been calculated by dividing the daily hospital trips on the routes that
serve the hospital by the estimated total number of daily trips to and from the hospital
29
4.4.3 When looking at both figures 5 and 14, it becomes apparent why the volume of trips to Queen’s is much lower from the NW quadrant as this is the main catchment area
of KGH. Most trips originate from the areas labelled A and B with much lower volumes of trips from the areas marked ‘C’, which, as has been shown, is the main
catchment area for Queen’s.
4.4.4 Volumes of patient trips tend to correlate with distance and density of housing.
Patient visits drop to very low numbers once you move into LBs Newham and Waltham Forest. This will be due both to these locations being outside the Trust’s
administration boundary and them falling more naturally within the catchment areas of Newham and Whipps Cross hospitals. As noted above, the Woodford area is in LB Redbridge but has low volumes of trips to the BHRUT hospitals.
4.4.5 The direct services to KGH are shown in black. It can be seen there is good
correlation between these bus routes and the highest concentration of patient trips. Route 173 might be considered an exception as it forms a boundary between the mid range of patient trips (shown in tan) and the low range of patient trips (shown in
yellow) rather than better penetrating the higher trip areas.
4.4.6 Figure 15 shows a particularly strong concentration of staff living near KGH, which was also observed with Queen’s. Otherwise figure 15 has similarities with figure 14 with the exception of some pockets of slightly higher concentrations of staff e.g.
Elm Park, Collier Row and Harold Wood. Again, there are good direct bus connections between where the highest numbers of staff live and KGH. This time,
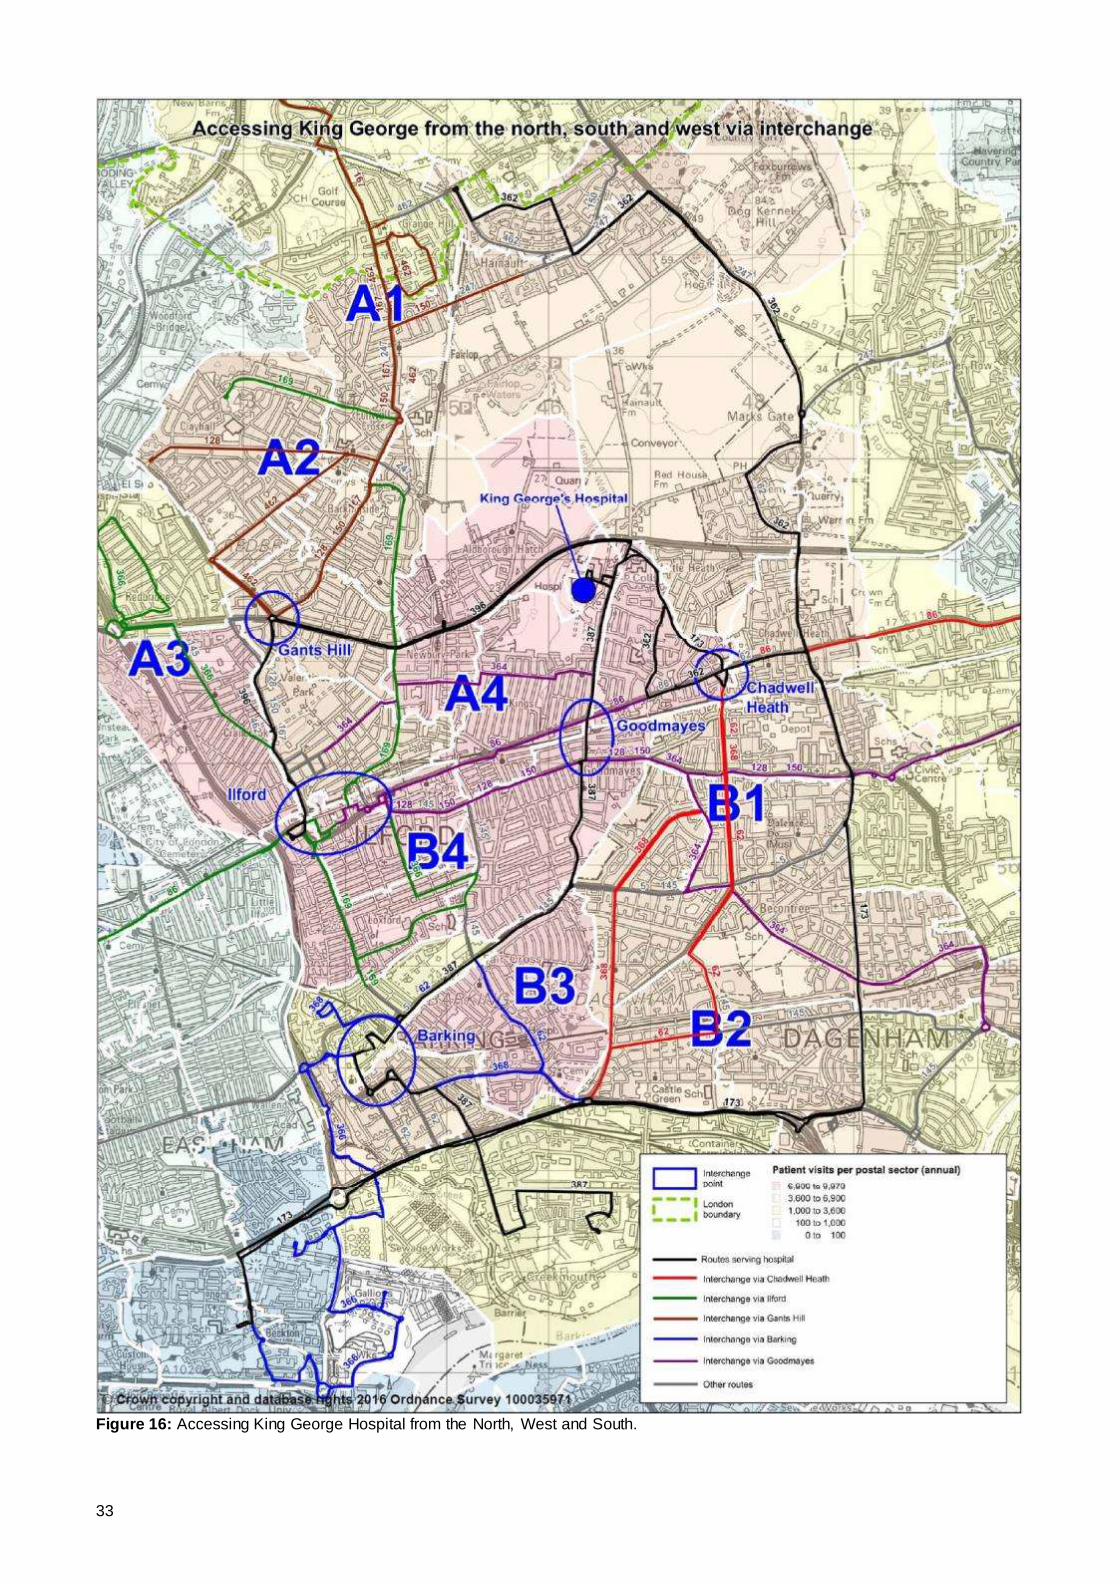
the 173 routeing is arguably better suited for where staff live than it is for patients. West of KGH (Areas A and B) [See Figure 16]
4.4.7 This looks in more detail at bus links from the west. Barking and Ilford town centres and the district centres of Gants Hill, Goodmayes and Chadwell Heath have been
selected as places where interchange can be reasonably made. Each of these locations also have rail stations.
4.4.8 The wider Barkingside area (labelled A1 and A2) have a medium range of patient and staff trips and a journey of less than hour to KGH. The bus network provides
high frequency links into Gants Hill for onwards connection to the hospital by route 396. Routes 66 and 296 provide alternative onward connection. Improving the walk routes from the 66 and 296 bus stops to the hospital would improve access further.
4.4.9 The Redbridge and Cranbrook areas (labelled A3) have relatively high patient trips.
For those not able to walk direct to the 396 (or 66), route 366 provides a high frequency interchange. Route 366 was increased to 6 bph in April 2016.
4.4.10 The Seven Kings area (labelled A4) has relatively high patient and staff trips. Route 364 (6 bph) operates through the heart of the area providing interchange
opportunities with the 387 on Barley Lane. Route 387 is expected to be enhanced in 2017 as part of improvements to bus services as a result of the ongoing construction of Barking Riverside.
4.4.11 The Becontree and Goresbrook areas (labelled B1 & B2) have a medium range of
patient and staff trips. Routes 62 and 368 provide links to Chadwell Heath for
30
onward interchange to the 173 and 362. Route 364 provides links to Goodmayes and the 387. It was noted in Section 3 that B1 and B2 also have relatively high
numbers of trips to Queen’s but no direct service.
4.4.12 There are relatively high patient trips from the area labelled B3. For those unable to walk to Longbridge Road for the 387, there are good links into Barking town centre for onward interchange.
4.4.13 The Loxford area south of Ilford town centre (labelled B4) has good links into Ilford
town centre by routes 169 and 366 or links into Goodmayes by routes 86, 128 and 150. This area has relative high patient numbers and is less than 45 minutes from KGH.
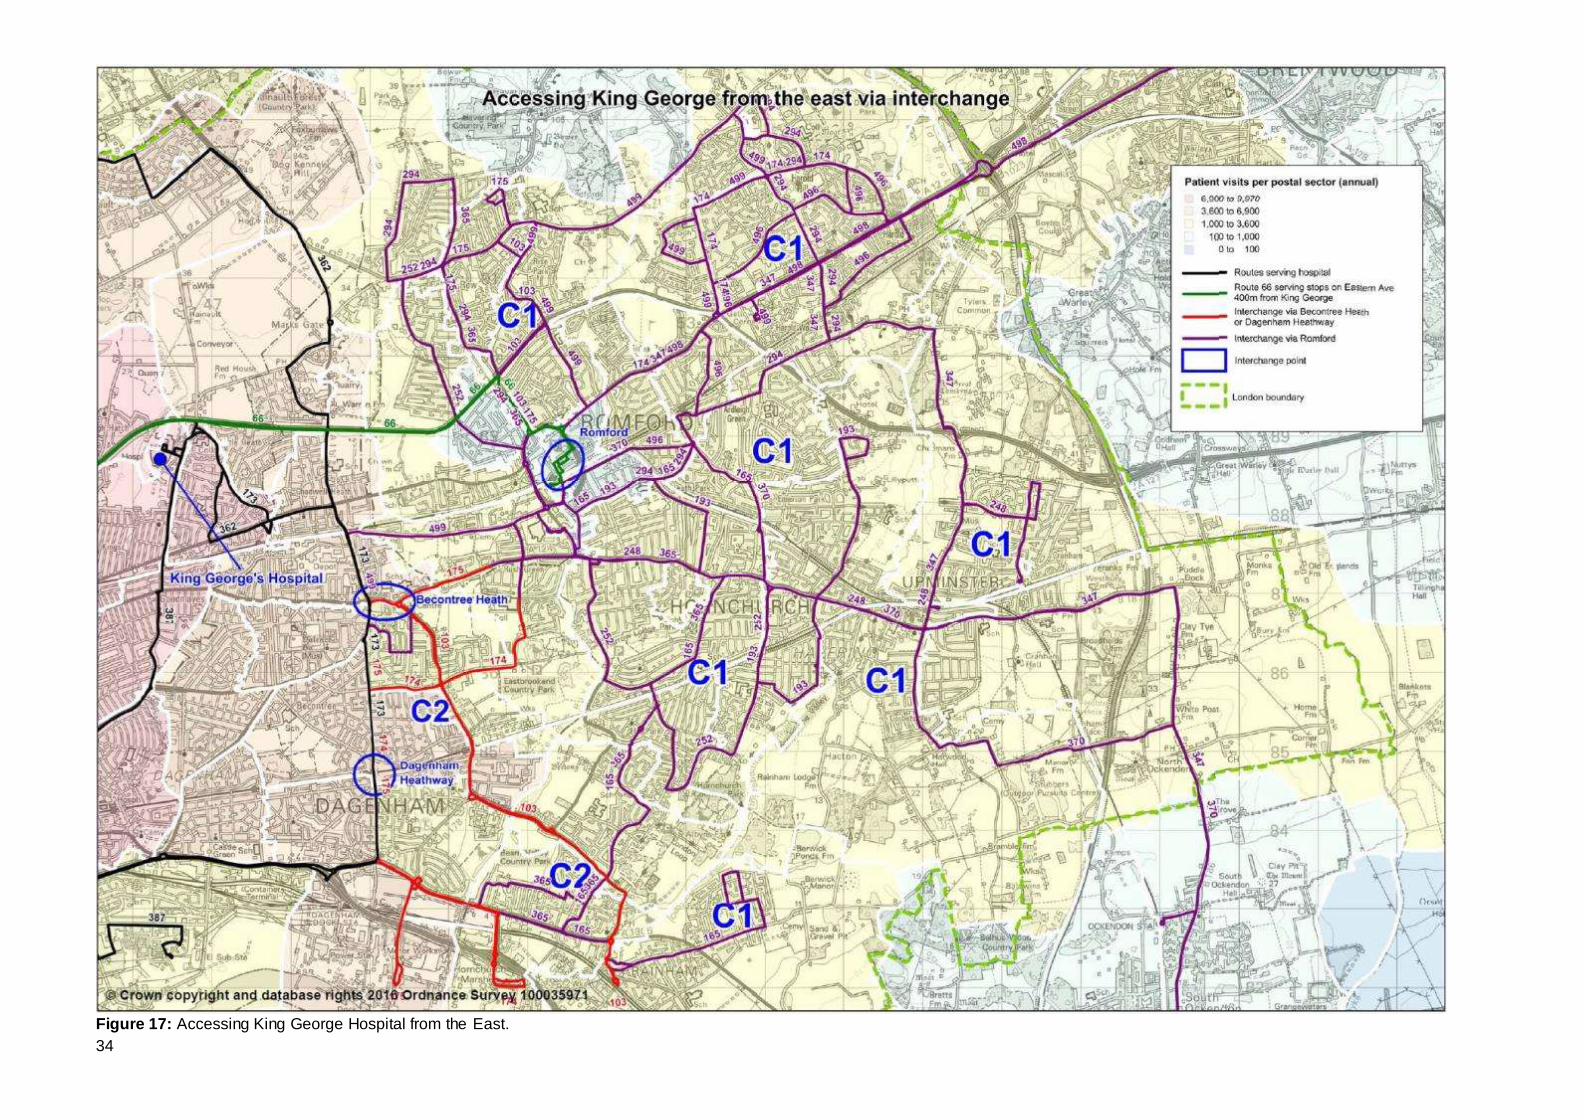
East of KGH (Area C) [See Figure 17]
4.4.14 Most of this area (labelled C1) is within the Queen’s hospital catchment area and consequently has low trip numbers. However, a comprehensive network of bus routes provides good links into Romford. Routes 66 and 296 provide links from
Romford town centre to near KGH.
4.4.15 The Dagenham East area (labelled C2) has slightly higher patient numbers but there are good links by tube to Dagenham Heathway or by bus to Becontree Heath for onward connection to the 173.
4.5 Summary
4.5.1 Analysis of travel to King George hospital has highlighted the following:
Good levels of bus service at all times of the day and week but fewer routes
compared to Queen’s due to its location and KGH being smaller;
Much of Redbridge, Barking & Dagenham and Havering are within 60 minutes
travel time by public transport. However areas of southeast Havering are more than 60 minutes;
There are around 2,500 bus trips on a typical weekday to and from KGH. It is estimated that this translates to around 1,050 on a Saturday and 750 on a Sunday;
The volume of bus trips is determined by factors such as journey time (including wait time) and density of housing;
Of the routes that serve KGH, hospital trips represent a significant minority of all trip purposes. This varies by route due to a number of factors but the median
percentage is around 10 – 13%, making it similar to Queen’s.
Patient travel to KGH by all modes is influenced by distance (and therefore travel times). Related to this is proximity of alternative hospitals, especially
Queen’s. Broadly, people living in Havering use Queen’s and not KGH.
Using broad assumptions around travel to hospital by patients and their visitors,
together with assumptions around how travel varies by day type, it is estimated that there are around 7,750 trips per weekday to and from KGH. This would suggest the bus modal share for hospital travel is 32%. As noted throughout,
this figure should be treated with caution.
As will be expected, not all locations have a direct bus service to KGH. Section
7 looks at potential ways to improve this. However, of particular note are links from the Becontree and Goresbrook areas.
31
Figure 14: Annual volume of patient visits to King George by postal sector, and routes directly serving the hospital.
32
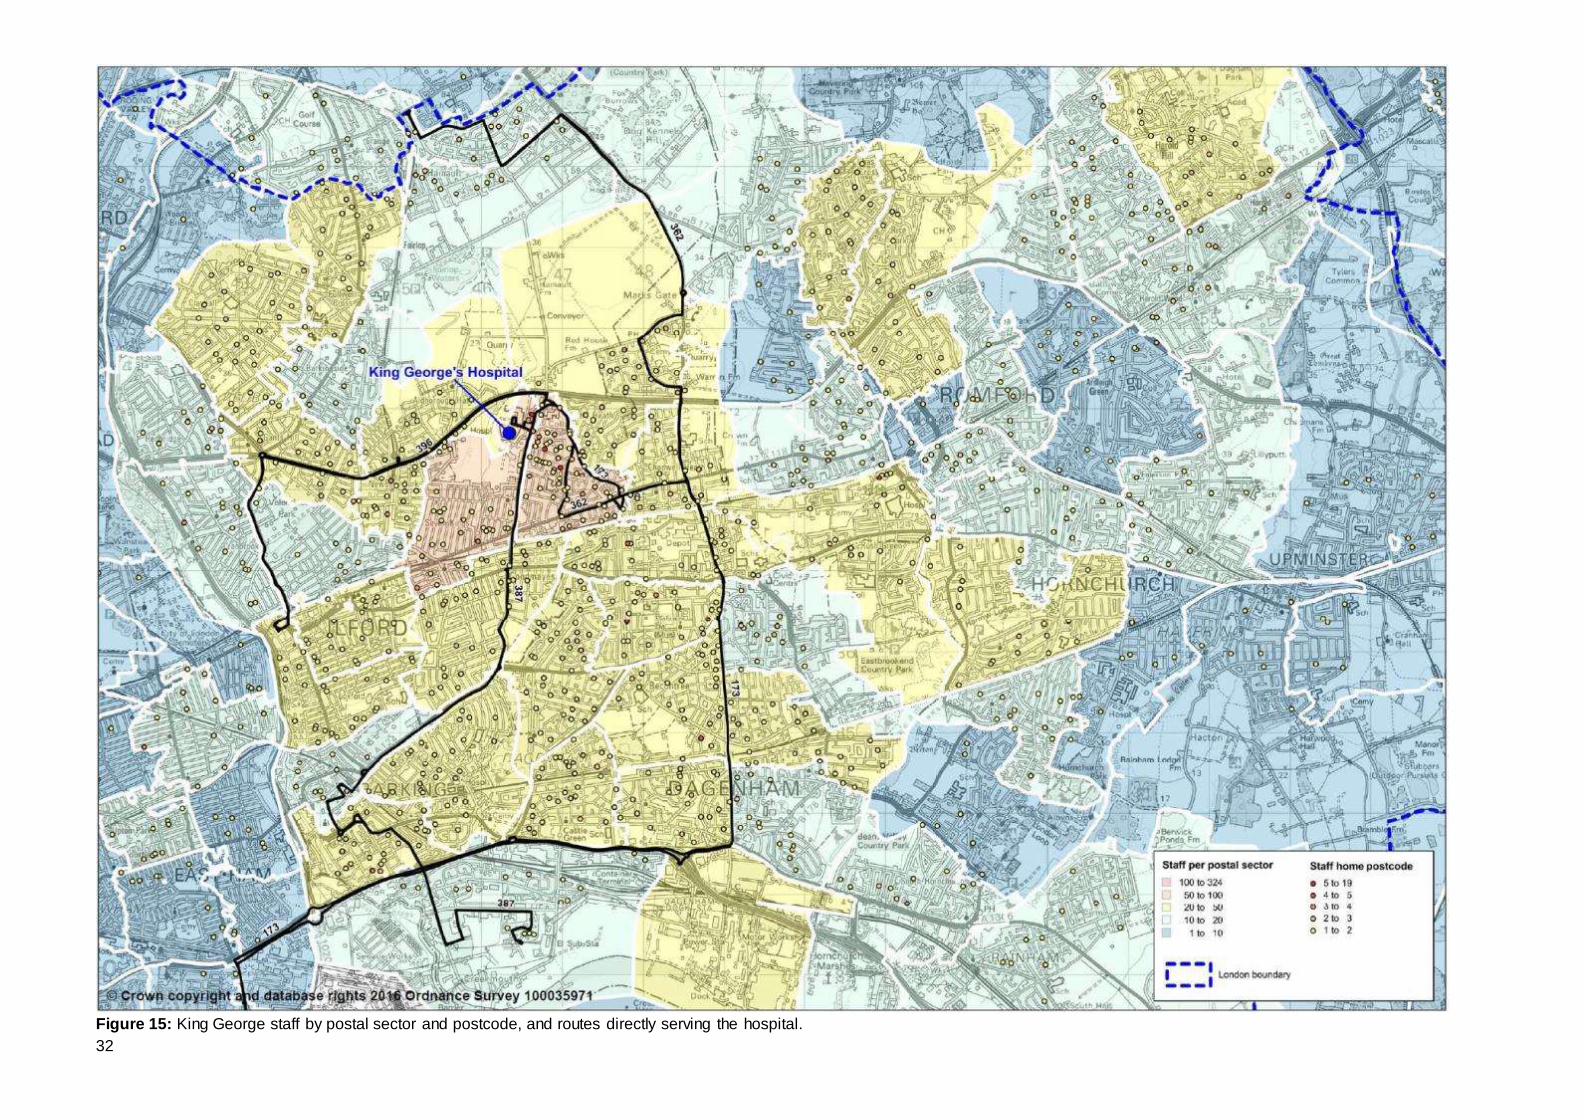
Figure 15: King George staff by postal sector and postcode, and routes directly serving the hospital.
33
Figure 16: Accessing King George Hospital from the North, West and South.
34
Figure 17: Accessing King George Hospital from the East.
35
5 FUTURE CHANGES 5.1 NHS Acute Reconfiguration
5.1.1 BHRUT are reconfiguring acute and emergency services in line with the implementation of the recommendations from the Health for North East London
review. The implementation will see Queen’s Hospital becoming the Trust’s acute and hyper acute centre with all A&E activity consolidated at that site. As a result the Trust is looking to develop the KGH site into a specialist unit focused on
rehabilitation, elderly care and elective surgery. A timescale for these changes has not yet been fixed. However, it is expected that they will be implemented in the
medium-term. The current plan is that the changes will be implemented in phases, the first seeing the A&E consolidate overnight with a full A&E department left on the KGH site between 8am and 10pm.
5.1.2 BHRUT are presently working through the implications of the re-organisation on
travel to hospital. However, the present understanding is:
A&E trips will focus on Queen’s. Presently there are approximately 135,000
patient visits per year to Queen’s A&E and 70,000 patient visits per annum using KGH. Using the same weekday-to-weekend ratios as used in sections 3.3
and 4.3, this equates to approximately 460 patients per weekday at Queen’s and approximately 240 per weekday at KGH. KGH will offer an enhanced Urgent Care Centre that treats non-emergency patients and therefore not all of
the existing KGH A&E patients are expected to transfer to Queen’s. Further, of those transferring, not all will be dependent upon bus services. There are nearly
17,000 A&E patients are transferred by ambulance for example.
In-patient stays at KGH are likely to be longer. This might increase the number
of visitor trips to KGH and widen the catchment area.
Movement of medical staff between sites should reduce as services are rationalised at one location rather than spread over two sites. However, this may
not apply to non-medical staff.
5.1.3 As has been shown previously, patient numbers are disparate. It is not expected
that the changes proposed will have a significant impact on bus usage to the hospitals. Both are expected to attract patient, staff and visitor numbers at similar
levels to the present, subject to local population changes. Therefore analysis and service change options based on current usage patterns will be applicable to post reorganisation trip patterns.
5.2 General Population Growth
5.2.1 All three boroughs served by BHRUT hospitals have seen significant population
changes in recent years as shown in table 11. The London Plan forecasts
continued growth.
36
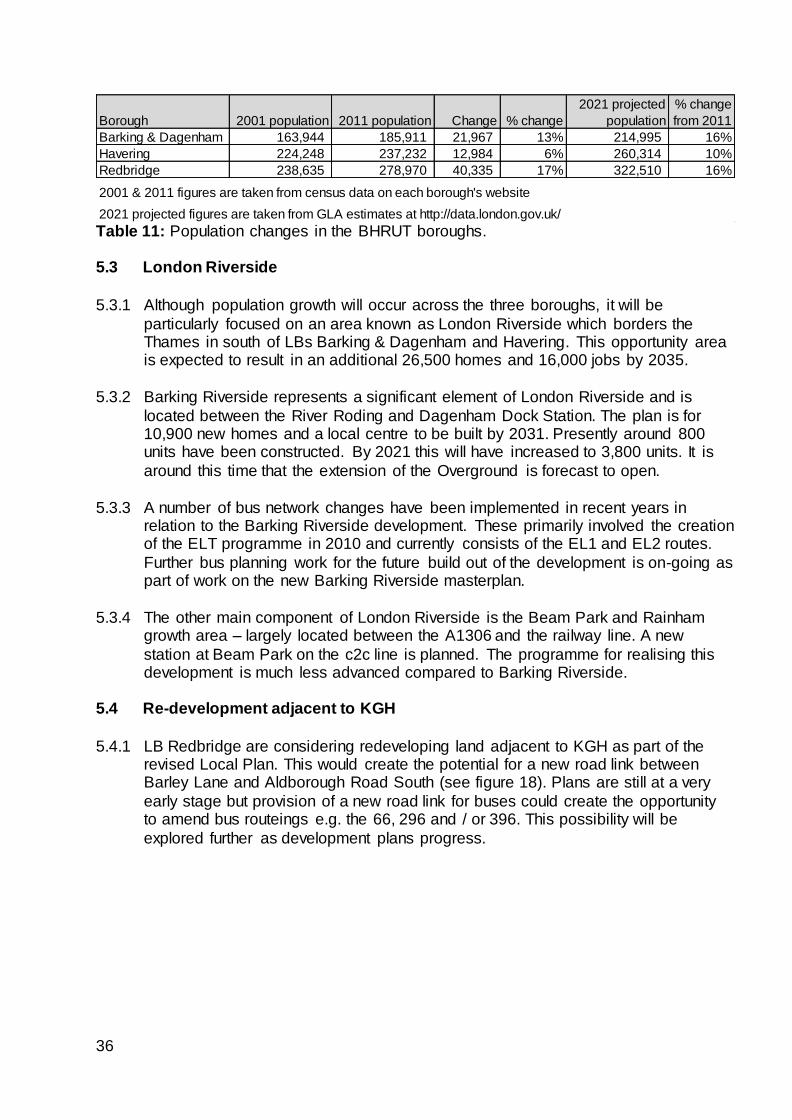
Table 11: Population changes in the BHRUT boroughs.
5.3 London Riverside
5.3.1 Although population growth will occur across the three boroughs, it will be
particularly focused on an area known as London Riverside which borders the Thames in south of LBs Barking & Dagenham and Havering. This opportunity area is expected to result in an additional 26,500 homes and 16,000 jobs by 2035.
5.3.2 Barking Riverside represents a significant element of London Riverside and is
located between the River Roding and Dagenham Dock Station. The plan is for 10,900 new homes and a local centre to be built by 2031. Presently around 800 units have been constructed. By 2021 this will have increased to 3,800 units. It is
around this time that the extension of the Overground is forecast to open.
5.3.3 A number of bus network changes have been implemented in recent years in relation to the Barking Riverside development. These primarily involved the creation of the ELT programme in 2010 and currently consists of the EL1 and EL2 routes.
Further bus planning work for the future build out of the development is on-going as part of work on the new Barking Riverside masterplan.
5.3.4 The other main component of London Riverside is the Beam Park and Rainham
growth area – largely located between the A1306 and the railway line. A new
station at Beam Park on the c2c line is planned. The programme for realising this development is much less advanced compared to Barking Riverside.
5.4 Re-development adjacent to KGH
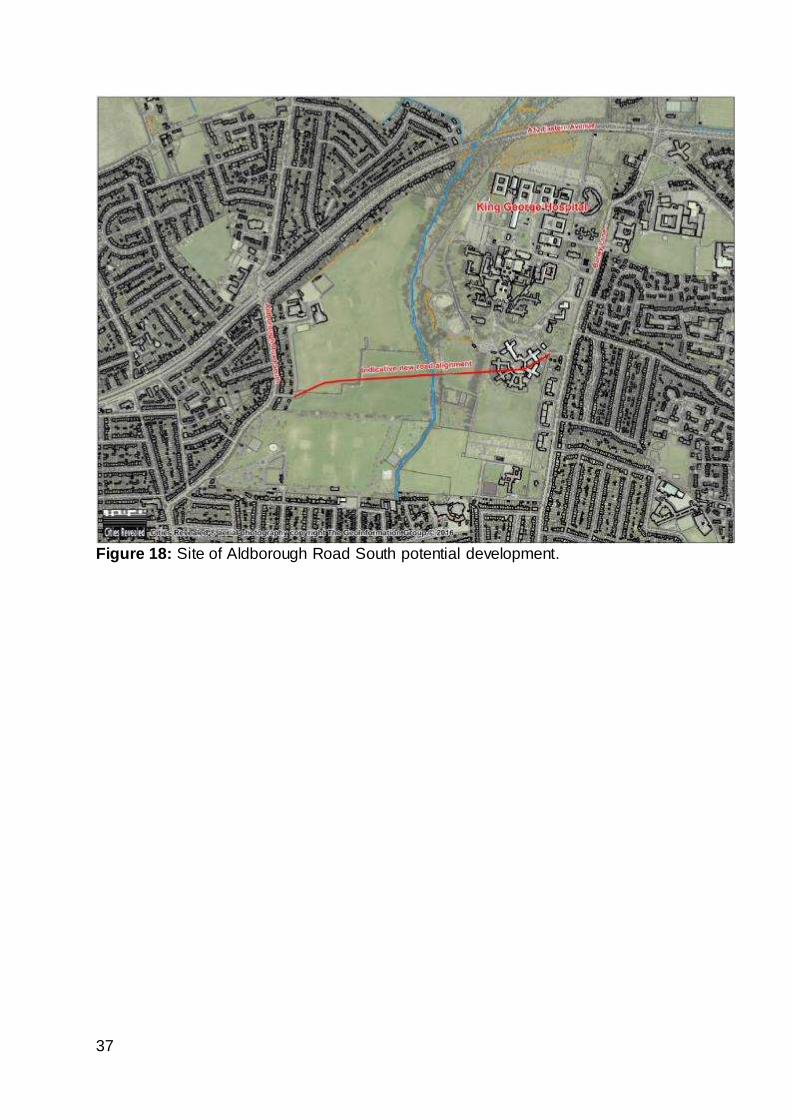
5.4.1 LB Redbridge are considering redeveloping land adjacent to KGH as part of the revised Local Plan. This would create the potential for a new road link between Barley Lane and Aldborough Road South (see figure 18). Plans are still at a very
early stage but provision of a new road link for buses could create the opportunity to amend bus routeings e.g. the 66, 296 and / or 396. This possibility will be
explored further as development plans progress.
Borough 2001 population 2011 population Change % change
2021 projected
population
% change
from 2011
Barking & Dagenham 163,944 185,911 21,967 13% 214,995 16%
Havering 224,248 237,232 12,984 6% 260,314 10%
Redbridge 238,635 278,970 40,335 17% 322,510 16%
2001 & 2011 figures are taken from census data on each borough's website
2021 projected figures are taken from GLA estimates at http://data.london.gov.uk/
37
Figure 18: Site of Aldborough Road South potential development.
38
6 STAKEHOLDER ASPIRATIONS 6.1 Bus routeing ideas
6.1.1 Stakeholders such as BHRUT NHS Trust, LBs Havering, Redbridge and Barking & Dagenham, local MPs and passengers have provided suggestions and aspirations
of bus service changes they would like to see. A copy of BHRUT’s aspirations can be found in appendix B. The service change suggestions can be summarised as:
Re-route the 5 via Queen’s hospital rather than South Street. This has been
requested by local residents, Margaret Hodge MP, LB Havering, LB Barking & Dagenham and BHRUT NHS Trust;
Re-route the 248 via Queen’s hospital rather than South Street. This has been suggested by local residents, LB Havering and BHRUT NHS Trust;
A direct bus service between Queen’s and King George Hospitals. This has been suggested by BHRUT NHS Trust;
Curtail route 387 at KGH to make the route shorter and so improve reliability.
This has been suggested by BHRUT NHS Trust;
Re-route the 103 and 174 into Queen’s hospital. This has been suggested by
BHRUT NHS Trust;
Frequent requests from many passengers and stakeholders are received about
increasing the frequency of bus routes serving the hospitals and in the wider area.
6.2 Infrastructure improvement ideas
6.2.1 Bus routes can also be enhanced by improving the associated infrastructure e.g. walk routes to bus stops. BHRUT NHS Trust have suggested the following:
Extending the bus island at Queen’s to accommodate more terminating buses;
Retiming the Oldchurch Rise traffic lights to reduce congestion and wait time for buses using the junction. LB Havering have also undertaken work to improve
the enforcement of the bus priority measures through the hospital;
Introduce a road crossing to allow passengers on routes 66 and 296 convenient
and level access to and from KGH;
Re-timing of traffic signals and implementation of traffic management around
Little Heath to reduce congestion.
6.3 Whipps Cross
6.3.1 Although outside the scope of the report, LB Redbridge (and BHRUT NHS Trust)
have raised the issue of improved links to Whipps Cross, especially from the NW of Redbridge Borough. This area is covered by the Central Line loop which provides links into Leytonstone from where routes W15 and W19 provide a combined 11 –
12 buses per hour to the hospital. This will increase from November 2016 when it is planned to increase the frequency of route W19. This will provide additional
capacity.
6.3.2 In addition route 20 provides links to the hospital from the Woodford Road corridor
and the W12 provide links from the hospital to South Woodford which is a local transport hub.

39
6.3.3 There have long been plans mooted for re-designing the hospital site but there are
no indications of this happening soon. TfL’s aspiration has been the removal of the low bridge to enable double deck buses to run through the site and the creation of
bus standing facilities to provide the flexibility for future improved access to the hospital. The creation of a new bus stand at the nearby Whipps Cross roundabout will go some way to assisting also.
40
7 OPTION DEVELOPMENT 7.1 Introduction
7.1.1 Data analysis of travel to hospital or stakeholder feedback have identified the following issues for further investigation:
Links from Becontree, Goresbrook and Barking Riverside to Queen’s
Access to Romford via Queen’s rather than South Street and Oldchurch Road
Links from Becontree / Goresbrook to KGH
Links from Barking Riverside to KGH
Frequency enhancements to bus services
A direct bus link between Queen’s and KGH hospitals
7.2 Becontree, Goresbrook & Barking Riverside to Queens
7.2.1 As identified in section 3 and by stakeholders, there are no direct bus links from the
above areas to Queen’s. Figure 5 shows this area as labelled B1, B2 and B3.
Becontree (B1) and Goresbrook (B2) have relatively high numbers of patient trips. Barking Riverside (B3) has less but as explained in section 5, this area is forecast
to have a significant increase in population and therefore an increase in hospital trips.
Route 5 7.2.2 Route 5 provides a very high frequency bus service (9bph+) through Barking town
centre and the southwest catchment for Queen’s, then via Becontree Heath and Romford town centre. By serving Barking town centre and the Longbridge Road corridor, it provides good onward interchange to the south, including Barking
Riverside. It runs close to Queen’s Hospital but enters Romford via South Street rather than via the hospital. Rom Valley Way and the River Rom form a barrier to
pedestrian movement between the two areas. This proximity to the hospital without serving it has resulted in many stakeholder requests to divert route 5 via the Hospital. Diverting route 5 into Queen’s has been evaluated (see figure 19).
41
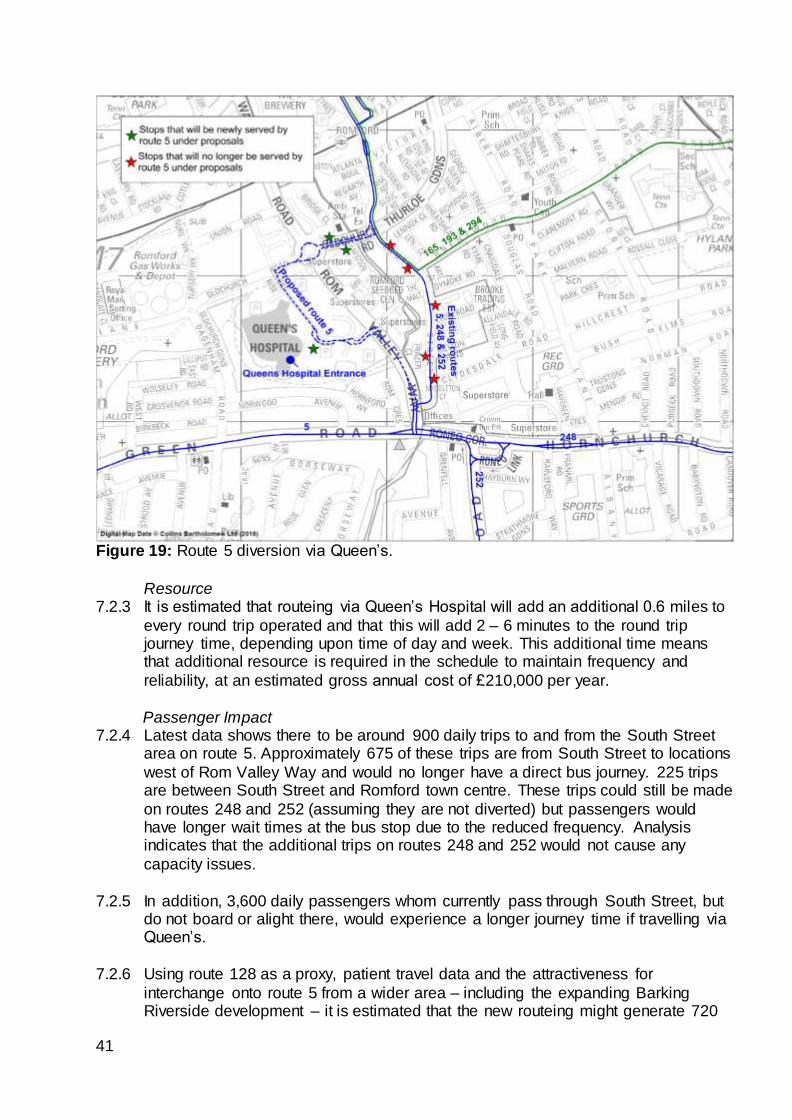
Figure 19: Route 5 diversion via Queen’s.
Resource 7.2.3 It is estimated that routeing via Queen’s Hospital will add an additional 0.6 miles to
every round trip operated and that this will add 2 – 6 minutes to the round trip journey time, depending upon time of day and week. This additional time means that additional resource is required in the schedule to maintain frequency and
reliability, at an estimated gross annual cost of £210,000 per year.
Passenger Impact 7.2.4 Latest data shows there to be around 900 daily trips to and from the South Street
area on route 5. Approximately 675 of these trips are from South Street to locations
west of Rom Valley Way and would no longer have a direct bus journey. 225 trips are between South Street and Romford town centre. These trips could still be made
on routes 248 and 252 (assuming they are not diverted) but passengers would have longer wait times at the bus stop due to the reduced frequency. Analysis indicates that the additional trips on routes 248 and 252 would not cause any
capacity issues.
7.2.5 In addition, 3,600 daily passengers whom currently pass through South Street, but do not board or alight there, would experience a longer journey time if travelling via Queen’s.
7.2.6 Using route 128 as a proxy, patient travel data and the attractiveness for
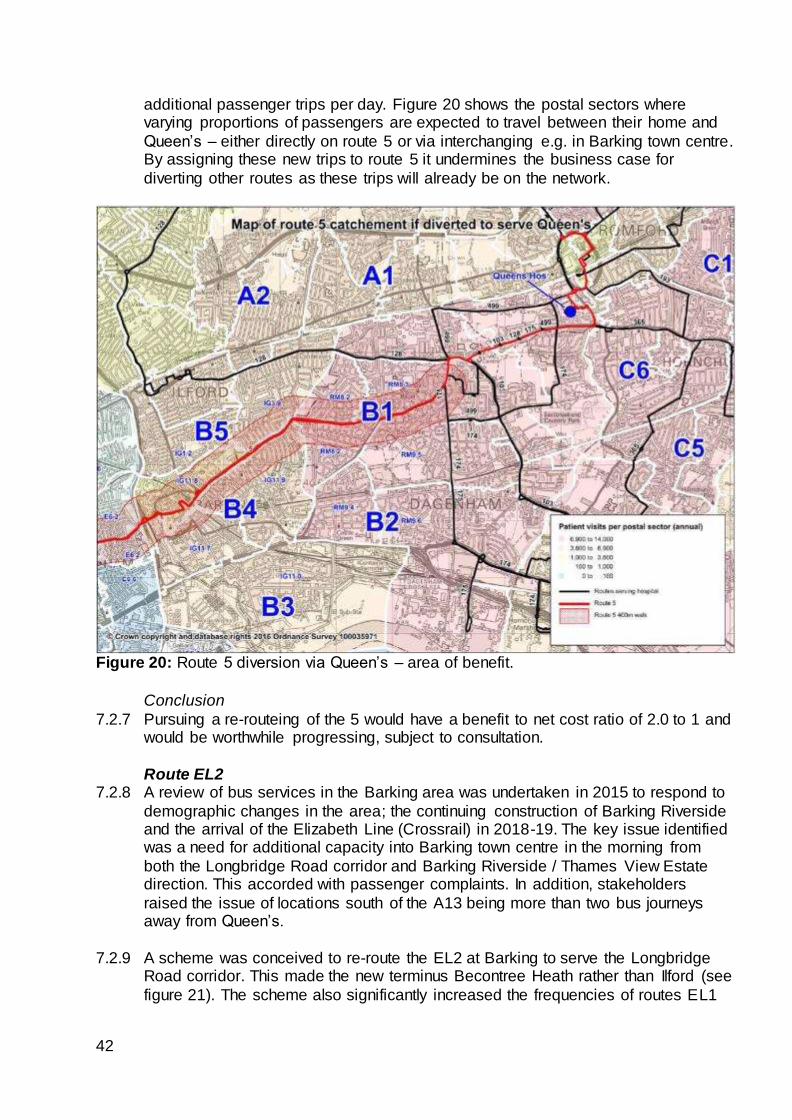
interchange onto route 5 from a wider area – including the expanding Barking Riverside development – it is estimated that the new routeing might generate 720
42
additional passenger trips per day. Figure 20 shows the postal sectors where varying proportions of passengers are expected to travel between their home and
Queen’s – either directly on route 5 or via interchanging e.g. in Barking town centre. By assigning these new trips to route 5 it undermines the business case for
diverting other routes as these trips will already be on the network.
Figure 20: Route 5 diversion via Queen’s – area of benefit.
Conclusion
7.2.7 Pursuing a re-routeing of the 5 would have a benefit to net cost ratio of 2.0 to 1 and would be worthwhile progressing, subject to consultation.
Route EL2 7.2.8 A review of bus services in the Barking area was undertaken in 2015 to respond to
demographic changes in the area; the continuing construction of Barking Riverside and the arrival of the Elizabeth Line (Crossrail) in 2018-19. The key issue identified was a need for additional capacity into Barking town centre in the morning from
both the Longbridge Road corridor and Barking Riverside / Thames View Estate direction. This accorded with passenger complaints. In addition, stakeholders
raised the issue of locations south of the A13 being more than two bus journeys away from Queen’s.
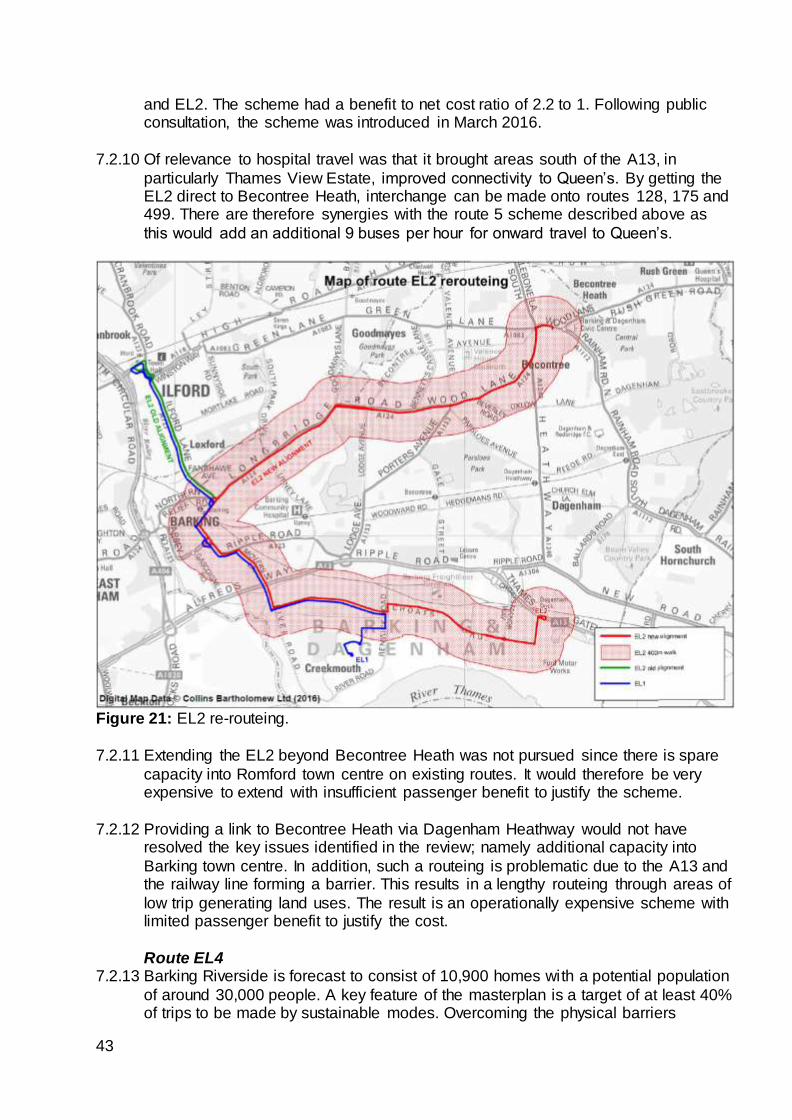
7.2.9 A scheme was conceived to re-route the EL2 at Barking to serve the Longbridge Road corridor. This made the new terminus Becontree Heath rather than Ilford (see
figure 21). The scheme also significantly increased the frequencies of routes EL1
43
and EL2. The scheme had a benefit to net cost ratio of 2.2 to 1. Following public consultation, the scheme was introduced in March 2016.
7.2.10 Of relevance to hospital travel was that it brought areas south of the A13, in
particularly Thames View Estate, improved connectivity to Queen’s. By getting the EL2 direct to Becontree Heath, interchange can be made onto routes 128, 175 and 499. There are therefore synergies with the route 5 scheme described above as
this would add an additional 9 buses per hour for onward travel to Queen’s.
Figure 21: EL2 re-routeing.
7.2.11 Extending the EL2 beyond Becontree Heath was not pursued since there is spare
capacity into Romford town centre on existing routes. It would therefore be very expensive to extend with insufficient passenger benefit to justify the scheme.
7.2.12 Providing a link to Becontree Heath via Dagenham Heathway would not have
resolved the key issues identified in the review; namely additional capacity into
Barking town centre. In addition, such a routeing is problematic due to the A13 and the railway line forming a barrier. This results in a lengthy routeing through areas of
low trip generating land uses. The result is an operationally expensive scheme with limited passenger benefit to justify the cost.
Route EL4 7.2.13 Barking Riverside is forecast to consist of 10,900 homes with a potential population
of around 30,000 people. A key feature of the masterplan is a target of at least 40% of trips to be made by sustainable modes. Overcoming the physical barriers
44
described above and connecting the development with adjacent areas will be an important factor in achieving this objective.
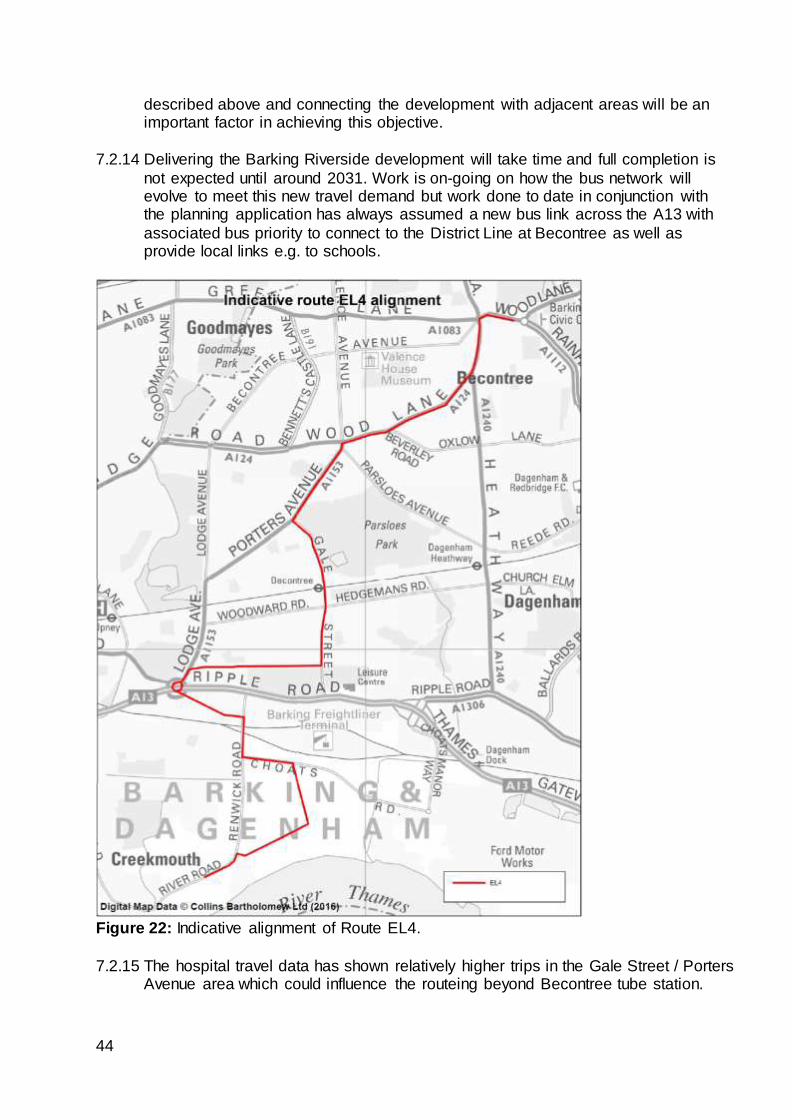
7.2.14 Delivering the Barking Riverside development will take time and full completion is
not expected until around 2031. Work is on-going on how the bus network will evolve to meet this new travel demand but work done to date in conjunction with the planning application has always assumed a new bus link across the A13 with
associated bus priority to connect to the District Line at Becontree as well as provide local links e.g. to schools.
Figure 22: Indicative alignment of Route EL4.
7.2.15 The hospital travel data has shown relatively higher trips in the Gale Street / Porters Avenue area which could influence the routeing beyond Becontree tube station.
45
7.2.16 Figure 22 shows a potential new route – provisionally named EL4 – which provides connections from Barking Riverside over the A13 and railway line to Becontree tube
station, Porters Avenue and Becontree Heath via Porters Avenue.
Conclusion 7.2.17 As well as funding and a detailed evaluation of value for money, implementing route
EL4 is dependent upon new housing and new infrastructure being delivered. The
timescales for this are still a number of years away. Work will continue on the scheme as part of the Barking Riverside planning work.
7.3 Access Romford via Queen’s rather than South Street and Oldchurch Road
7.3.1 Entry into Romford town centre from the south is by four corridors: Oldchurch Road, Queen’s hospital, Rom Valley Way and South Street. Rom Valley Way is not used
as a bus route due to the nature of the road being unsuitable to board and alight passengers. The hospital is relatively accessible from the Oldchurch Rise bus stops on Oldchurch Road (see Figure 1). South Street, however, is much less so due to
Rom Valley Way and the River Rom forming a barrier to pedestrian movement. Stakeholders have requested some or all routes to enter Romford via Queen’s.
Route 5
7.3.2 Re-routeing the 5 via Queen’s instead of South Street has been evaluated above,
and is recommended for implementation, subject to consultation.
Route 248 7.3.3 Route 248 provides a high frequency bus service (7.5bph) from Cranham and
Upminster via Hornchurch to Romford town centre. As with route 5, it runs fairly
close to Queen’s Hospital but enters Romford via the South Street corridor rather than via the hospital. As noted in section 3, access to Queen’s from route 248
requires walking from or interchanging at Roneo Corner or Romford town centre. Although overall journey times are broadly up to 45 minutes from Hornchurch and Upminster, getting so close to the hospital, but not quite reaching their objective,
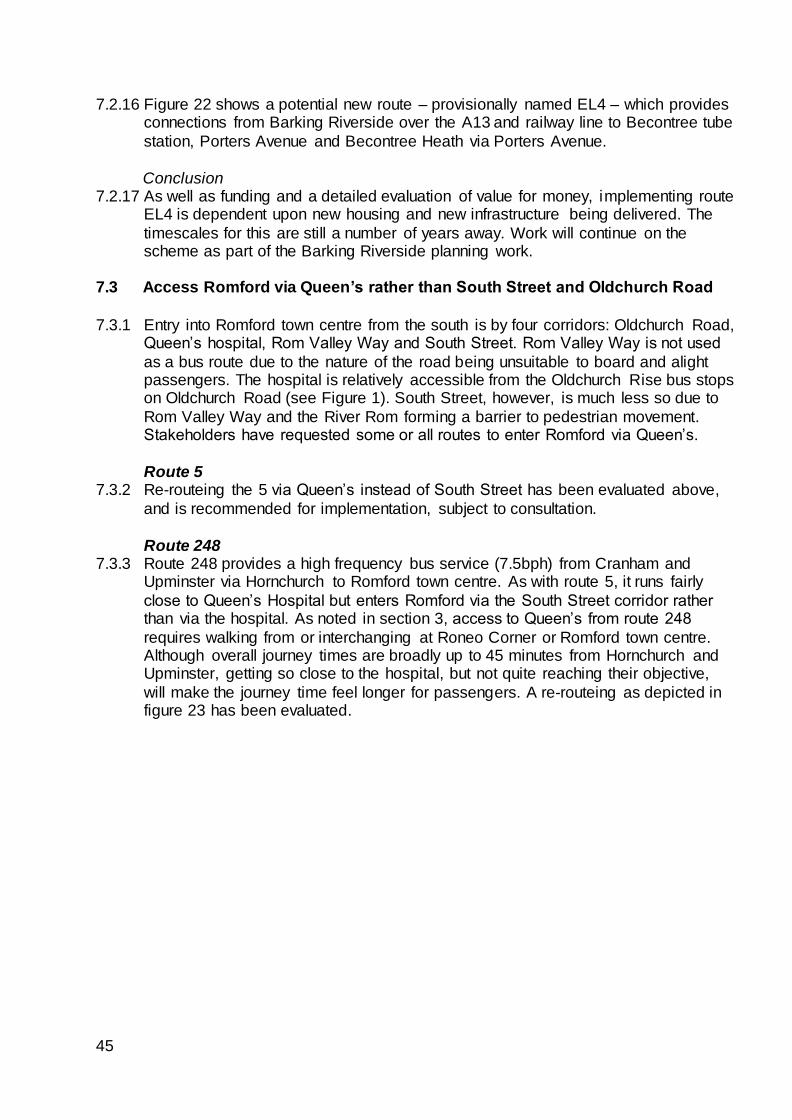
will make the journey time feel longer for passengers. A re-routeing as depicted in figure 23 has been evaluated.
46
Figure 23: Route 248 diversion via Queen’s.
Resource 7.3.4 It is estimated that routeing via Queen’s Hospital will add an additional 0.6 miles to
every round trip operated and that this will add 2 – 6 minutes to the round trip journey time depending upon time of day and week. This additional time means that additional resource is required in the schedule to maintain frequency and reliability,
at an estimated gross annual cost of £185,000 per year.
Passenger Impact 7.3.5 There are approximately 675 daily trips to and from the South Street area on route
248. Around 325 of these trips are to/from locations east of Roneo Corner and
would no longer be able to make their journey using one bus route. A further 150 trips are to/from locations east of Roneo Corner and can be made using other bus
routes, e.g. Upminster to South Street is also possible via route 370. These passengers will be subject to a reduced frequency, which will increase the time they have to wait for their bus. The remaining 200 trips are travelling between South
Street and Romford town centre. These trips would still be possible on route 252 but at a much reduced level of bus service, especially if it is assumed that route 5 is
already diverted. Current bus frequency across routes 5, 248 and 252 is 22.5 bph during the weekday interpeak. If both route 5 and route 248 were rerouted via Queen’s this would reduce to 6 bph, which represents a significant increase in wait
time at the bus stop.
47
7.3.6 In addition, 4,250 daily passengers whom currently pass through South Street, but do not board or alight there, would experience a longer journey time if travelling via
Queen’s.
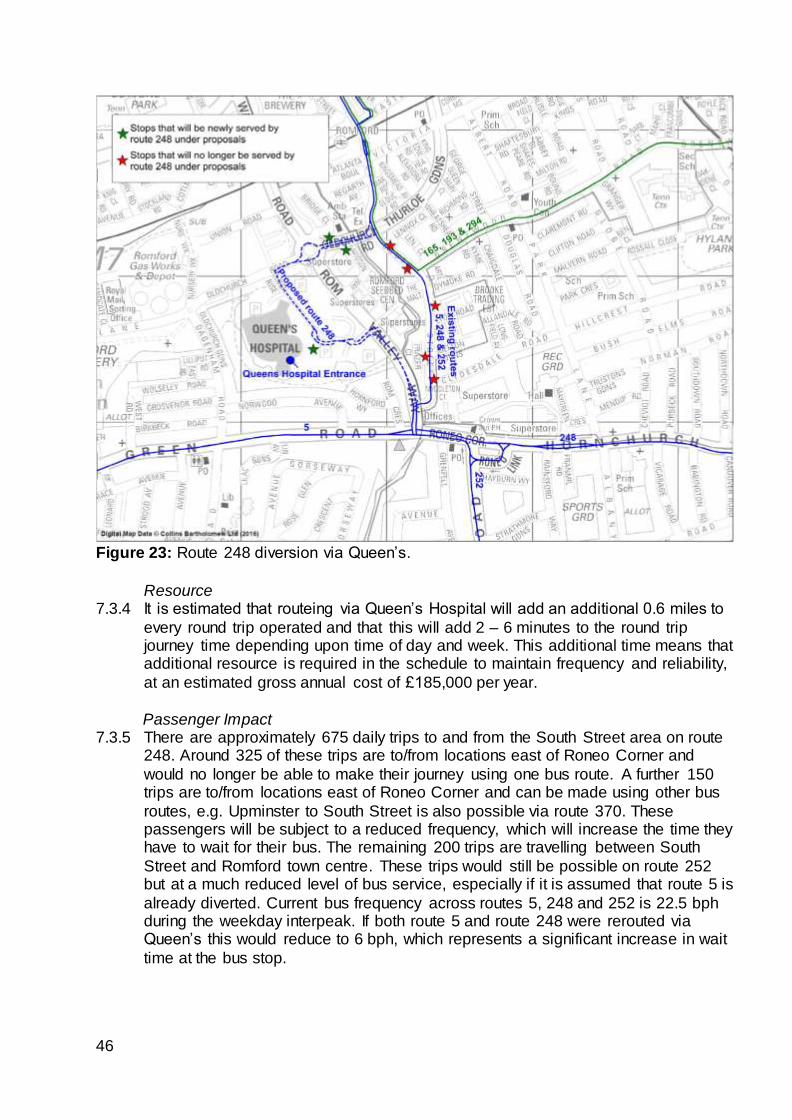
7.3.7 To offset the above disbenefit to existing passengers and justify the additional operating costs, around 1,100 trips would need to be generated by the route serving the hospital. The data analysis in section 3 has been used to estimate that
only around 350 additional trips would likely be generated. This is partly due to the nature of the route and the impact of route 365 reducing the size of the catchment
area which in turn influences the likely level of demand. Figure 24 shows the postal sectors where a proportion of passengers are expected to travel between their home and Queen’s via route 248.
Figure 24: Route 248 diversion via Queen’s – area of benefit.
Route 252
7.3.8 Route 252 provides a high frequency bus service (6bph) from Hornchurch via Elm
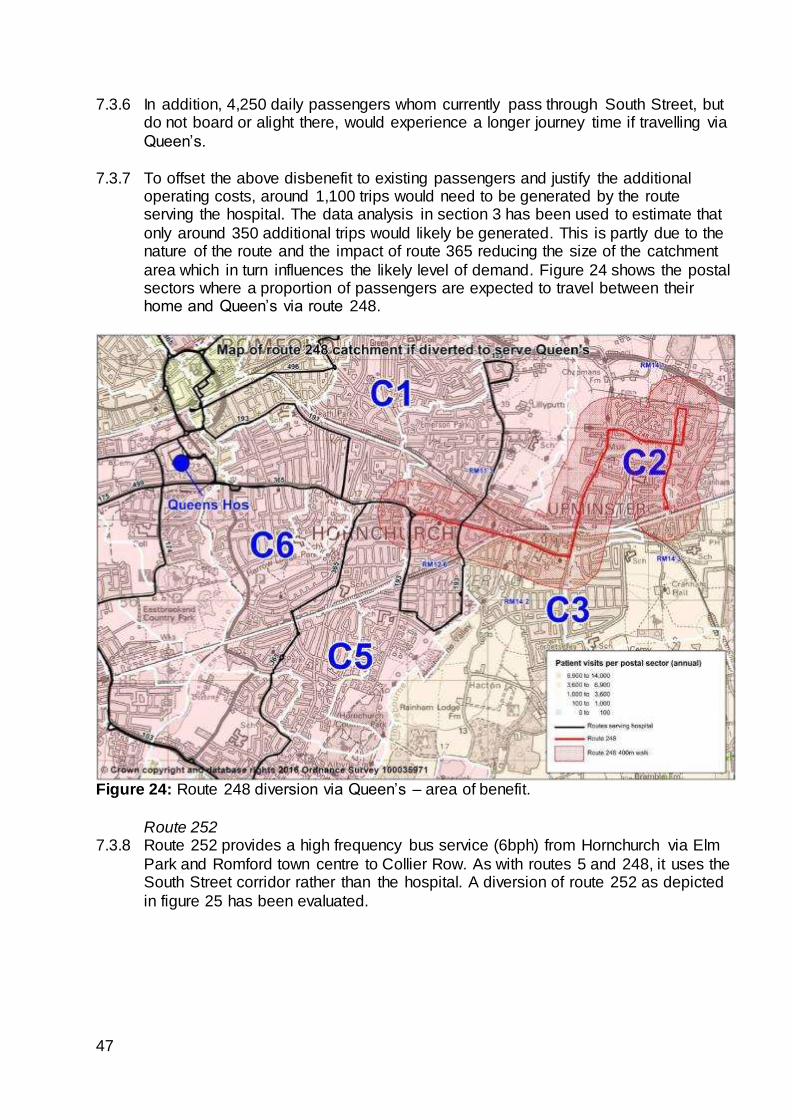
Park and Romford town centre to Collier Row. As with routes 5 and 248, it uses the South Street corridor rather than the hospital. A diversion of route 252 as depicted
in figure 25 has been evaluated.
48
Figure 25: Route 252 diversion via Queen’s.
Resource 7.3.9 The same additional mileage and journey time has been assumed as routes 5 and
248. The estimated cost of the additional resource required to maintain frequency and reliability is just under £250,000 in this case.
Passenger Impact 7.3.10 There are approximately 450 daily trips to and from the South Street area on route
252. Around 275 of these trips are to/from locations south of Roneo Corner or north of Romford town centre. These passengers would no longer have a direct bus service. A further 50 trips are to/from locations south of Roneo Corner or north of
Romford town centre and can be made using other bus routes, e.g. Chase Cross to South Street is also possible via route 294. These passengers would be subject to
a reduced frequency, which would increase the time they have to wait for their bus. The remaining 125 trips are travelling between South Street and Romford town centre. These passengers would also have longer wait times, much more so if the 5
is re-routed as well.
7.3.11 In addition, 3,175 daily passengers whom currently pass through South Street, but do not board or alight there, would experience a longer journey time if travelling via Queen’s.
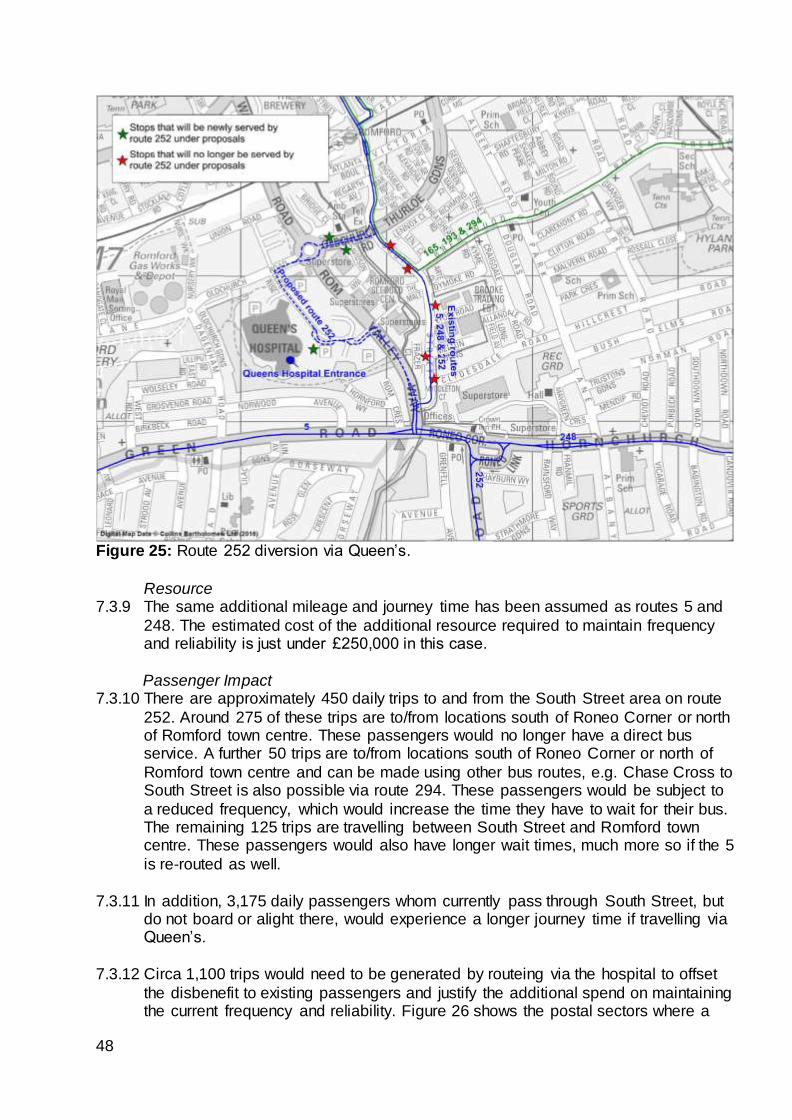
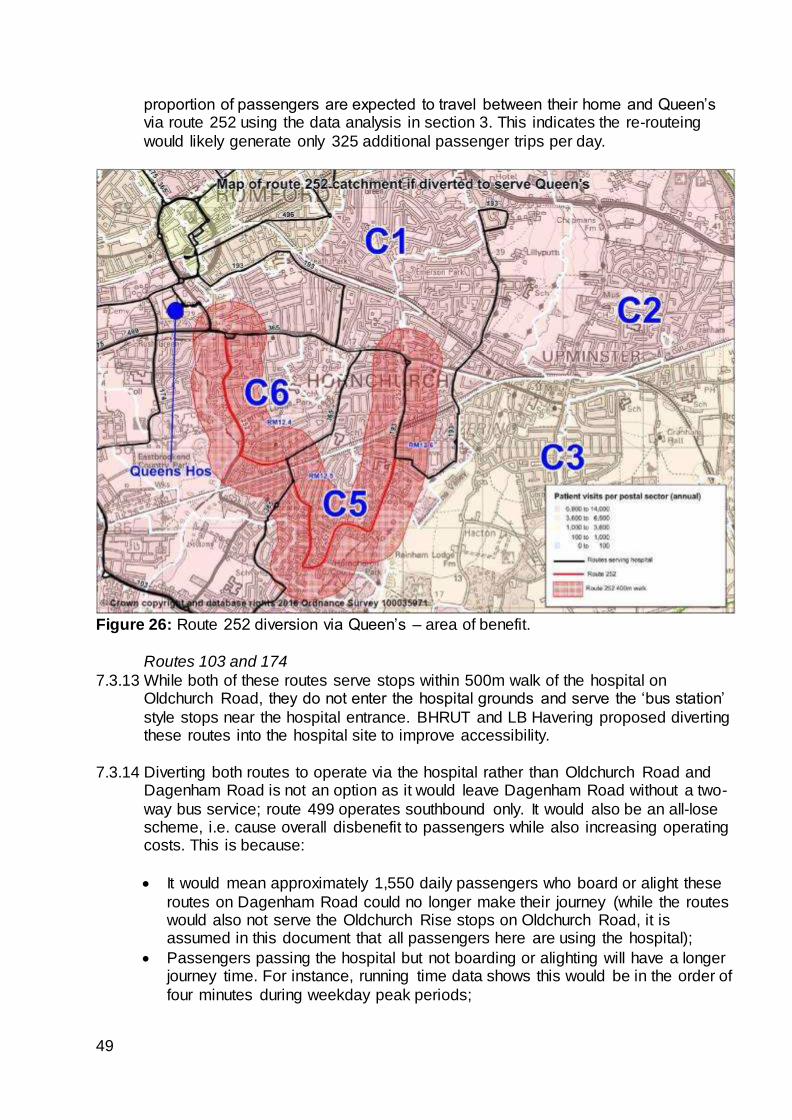
7.3.12 Circa 1,100 trips would need to be generated by routeing via the hospital to offset
the disbenefit to existing passengers and justify the additional spend on maintaining the current frequency and reliability. Figure 26 shows the postal sectors where a
49
proportion of passengers are expected to travel between their home and Queen’s via route 252 using the data analysis in section 3. This indicates the re-routeing
would likely generate only 325 additional passenger trips per day.
Figure 26: Route 252 diversion via Queen’s – area of benefit.
Routes 103 and 174
7.3.13 While both of these routes serve stops within 500m walk of the hospital on Oldchurch Road, they do not enter the hospital grounds and serve the ‘bus station’
style stops near the hospital entrance. BHRUT and LB Havering proposed diverting these routes into the hospital site to improve accessibility.
7.3.14 Diverting both routes to operate via the hospital rather than Oldchurch Road and Dagenham Road is not an option as it would leave Dagenham Road without a two-
way bus service; route 499 operates southbound only. It would also be an all-lose scheme, i.e. cause overall disbenefit to passengers while also increasing operating costs. This is because:
It would mean approximately 1,550 daily passengers who board or alight these
routes on Dagenham Road could no longer make their journey (while the routes would also not serve the Oldchurch Rise stops on Oldchurch Road, it is assumed in this document that all passengers here are using the hospital);
Passengers passing the hospital but not boarding or alighting will have a longer journey time. For instance, running time data shows this would be in the order of
four minutes during weekday peak periods;
50
The additional passengers using the routes to and from the hospital (and the other newly served stops) would be very unlikely to outweigh the disbenefit to
the two groups above;
Both routes would require additional resource due to the longer journey time.
7.3.15 Therefore ‘double running’ the routes from Oldchurch Road via Oldchurch Rise and
the hospital, then back along the same roads to Oldchurch Road, is the only feasible option.
Resource 7.3.16 It is estimated that this proposal would add one mile to every round trip operated.
Through comparison with route 499 (which currently operates this double run), this is estimated to add an average of five-and-a-half minutes to the round trip journey time (two-and-a-half minutes westbound and three minutes eastbound), and up to 8
minutes in the weekday PM peak. This additional time means that additional resource is required in the schedules to maintain frequency and reliability. This is
estimated to have a gross annual cost of £210,000 - £225,000 per year for each route.
Passenger Impact 7.3.17 All passengers would continue to have a direct bus route to make their current
journeys. However, just under 8,550 passengers pass the hospital daily without boarding or alighting (3,200 on route 103 and 5,350 on route 174). These passengers would have longer journey times of five-and-a-half minutes on average,
and up to eight minutes during the weekday PM peak.
7.3.18 To offset the disbenefit to existing passengers and justify the additional operating costs around 1,875 new trips would need to be generated by running into the hospital grounds (825 on route 103 and 1,050 on route 174). On the basis that the
routes already pass close to the hospital, these new passengers are likely to be those who either cannot walk the current 500m; are unaware the Oldchurch Rise
stops are close to Queen’s or those for whom the reduced walk time is such as to influence their travel patterns e.g. travel more frequently or change modes. To quantify those trips we have evaluated the existing 850 daily trips that board or
alight at the ‘hospital’ stops on Oldchurch Road as benefiting from an improved travel time of four minutes. This suggests just fewer than 200 additional daily
passenger trips would be generated, which is insufficient to make diverting the bus routes value for money.
Conclusion 7.3.19 Re-routeing services other than route 5 does not represent good value for money.
7.4 Becontree / Goresbrook to KGH
7.4.1 The analysis in section 4 showed the area of Becontree / Goresbrook having no direct link to KGH but the number of patient trips was of a mid-level. Of note was that route 173 skirted the eastern side of this travel demand.
51
Route 368 7.4.2 Route 368 provides a high frequency bus service (6bph) from Barking via Lodge
Avenue and Becontree Avenue to Chadwell Heath. Unlike route 173, this route better serves the postal sectors where patient travel demand is relatively high (see
figure 16). It is worth noting that route 173 does run very close to a lot of places where staff live (see figure 15). Extending route 368 to KGH has been evaluated.
Resource and infrastructure 7.4.3 It is estimated that the extension via Chadwell Heath Lane will add an additional 2.9
miles to every round trip operated and that this will add up to 21 minutes round trip journey time. This additional time means that additional resource is required in the schedule to maintain frequency and reliability, at an estimated annual cost of
around £540,000 per year.
7.4.4 Space would be required in the vicinity of King George Hospital to enable up to two buses to stand and turn around. This space is not known to be available at the present time.
Passenger Impact
7.4.5 As the scheme is a route extension there would be no negative impact on existing passenger journeys.
7.4.6 To justify the additional operating cost, around 1,000 new trips would need to be generated on the bus network by the scheme of which circa 400 would likely be
generated from the significant increase in frequency on Chadwell Heath Lane.
7.4.7 Figure 27 shows the postal sectors where a proportion of passengers are expected
to travel between their home and KGH via route 368. This results in an estimate of around 275 new trips to the hospital.
7.4.8 The extension would also create new, direct bus links to other land uses e.g. travel
to Redbridge College and Chadwell Heath Lane. It is considered that these new
links might be sufficiently attractive as to generate the remaining trips required to justify the scheme.
7.4.9 The result is a scheme with an estimated benefit to net cost ratio of 2.3 to 1. The
scheme is not immediately achievable due to the lack of space to terminate and
turn the route. This could be resolved by removing an existing route from the hospital. For example route 173 could be curtailed at Chadwell Heath to enable the
368 to be extended. This would reduce the cost of the scheme but create disbenefit by ‘breaking’ existing direct bus trips and, as already noted, the route runs close to where many staff live. It would also remove that element of benefit related to
increased frequencies on Chadwell Heath Lane.
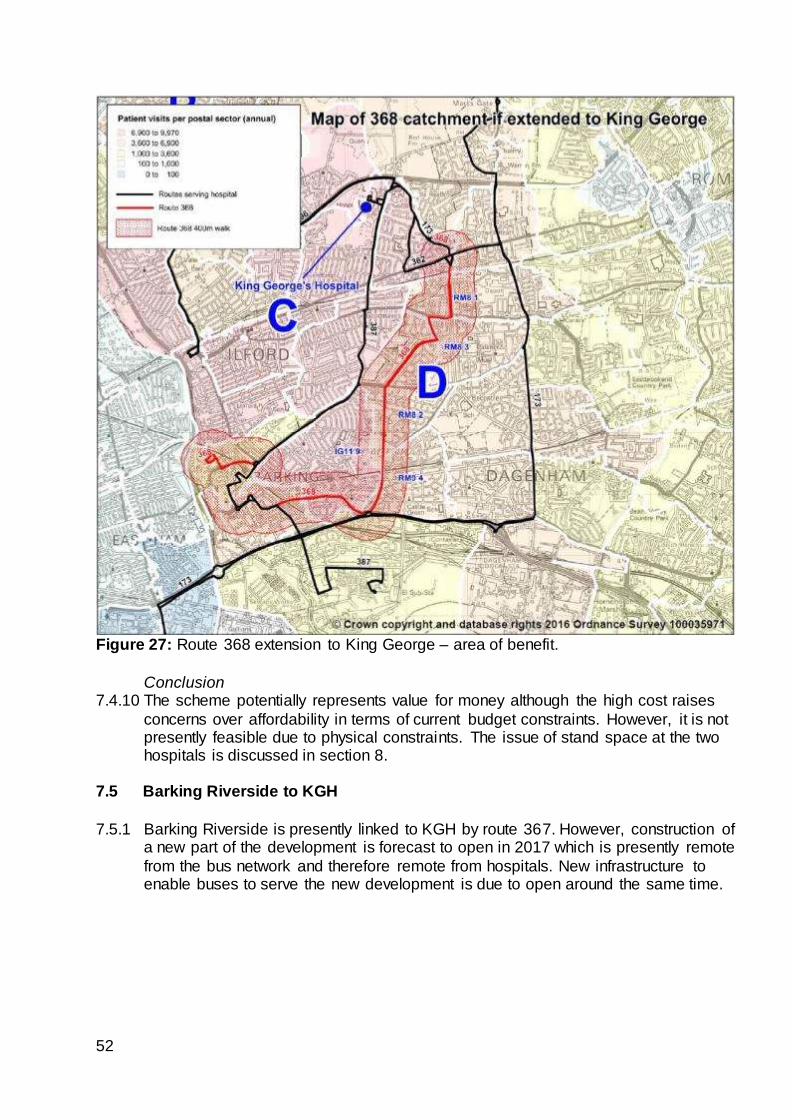
52
Figure 27: Route 368 extension to King George – area of benefit.
Conclusion 7.4.10 The scheme potentially represents value for money although the high cost raises
concerns over affordability in terms of current budget constraints. However, it is not presently feasible due to physical constraints. The issue of stand space at the two hospitals is discussed in section 8.
7.5 Barking Riverside to KGH
7.5.1 Barking Riverside is presently linked to KGH by route 367. However, construction of
a new part of the development is forecast to open in 2017 which is presently remote
from the bus network and therefore remote from hospitals. New infrastructure to enable buses to serve the new development is due to open around the same time.
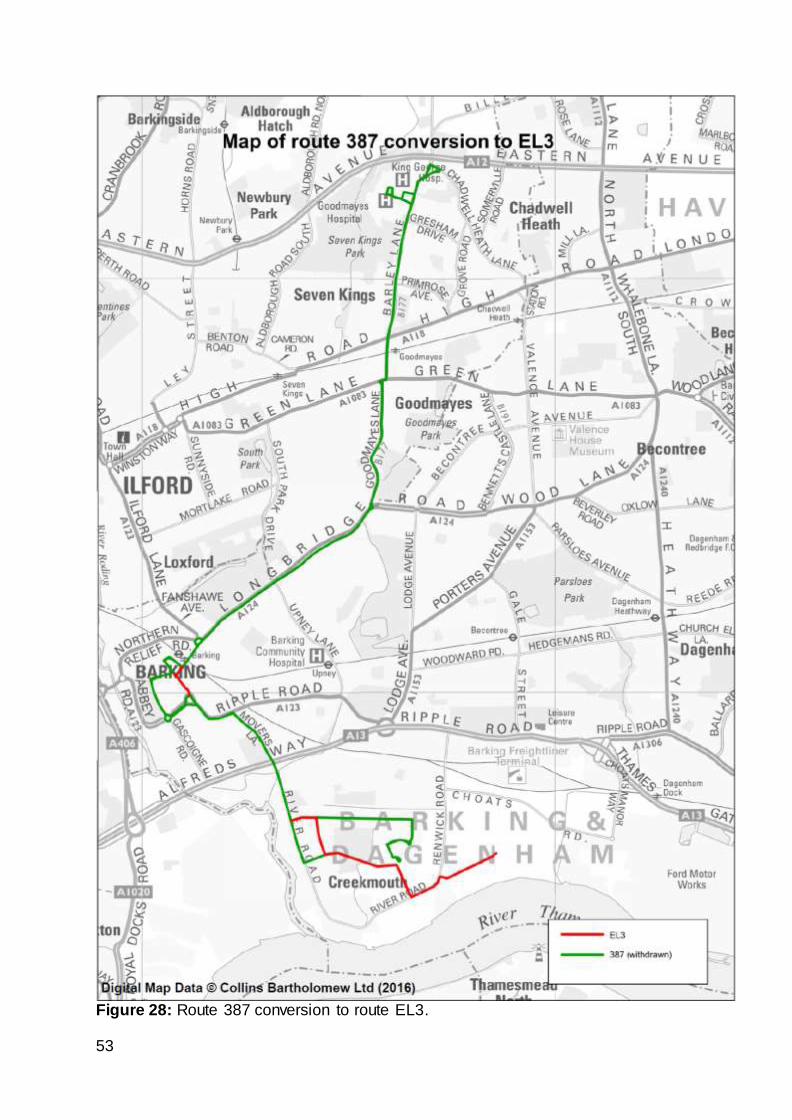
53
Figure 28: Route 387 conversion to route EL3.
54
Route 387 conversion to route EL3 7.5.2 It is proposed to convert route 387 to an ELT route, numbered EL3. It would
operate through the highly bus-optimised ELT alignment in Barking town centre and be restructured at the Barking Riverside end of the route to operate via bus-only
infrastructure to better penetrate the new development. Improved bus priority will also be provided between Barking and Little Heath. Together this provides a more direct and attractive service. Monday to Saturday frequencies would increase from
5 to 6 bph. The new routeing is shown in Figure 28.
7.5.3 The scheme has an estimated cost of £310,000 per annum and is expected to generate a net increase of circa 1,100 passenger trips per day. The scheme has a benefit to net cost ratio of 4.5 to 1. Consultation on implementing the scheme is
expected to commence in summer 2016.
Route 387 curtailment 7.5.4 Stakeholders have suggested curtailing route 387 (or EL3) at KGH rather than its
current terminus slightly to the north at Little Heath. The reason for this is high
levels of traffic congestion at Little Heath, related in part to Eastern Avenue, resulting in lengthy journey times to complete the final section of route. This can
affect reliability across the whole route.
7.5.5 Reliability has deteriorated in the past year but historically it has been possible to
run the route well. Bus priority as part of the EL3 scheme should assist reliability and LB Redbridge are considering local interventions to assist.
7.5.6 Curtailing the route would take the route away from the expanding Redbridge
College campus and disrupt 880 trips per day which is high. It is therefore intended
to keep the route as it is and pursue alternative ways of improving reliability. 7.6 Frequency enhancements to bus services
7.6.1 Stakeholders have requested frequency enhancements to bus services since this
improves the overall journey time by bus for staff, patients and visitors. TfL seek to run as frequent a network as possible within the budget available. This implies
running fewer routes at high frequency compared to many routes at low frequency. This results in lower wait times which are a significant element of overall journey times and therefore attractive to more passengers. Higher frequencies, in
conjunction with other factors like simple ticketing, means passengers are more likely to treat bus services as a network and so increase the destinations on offer
even if there is not a direct bus.
7.6.2 The above analysis of hospital travel has shown that the majority of trips on the bus
network are not hospital related; daily trips to/from hospital from postal sectors are relatively low and that passengers show a propensity to change buses to complete
their journey. This makes allocating additional scarce resource to enhance services difficult to justify for hospital travel only. Current budget constraints intensify the pressure to optimise the bus network. For example, the level of saving in
comparison to the disbenefit to passengers would justify withdrawing route 362. This is not being proposed at the present time due to the unique journey
opportunities it currently provides, including to KGH.
55
7.6.3 However, section 5 has illustrated the scale of growth East London is forecast to
experience. It is this growth and the corresponding increase in bus travel demand that can justify allocating scarce resource on enhancing bus services. A regular
programme of reviewing the bus network has resulted in the following frequency improvements to bus routes relevant to this study area since October 2015:
173 – 5 to 6 bph; extended hours of operation and conversion to double-deck
buses (October 2015);
368 – 5 to 6 bph and conversion to double-deck buses (April 2016);
366 – 5 to 6 bph (April 2016);
EL1 – 6 to 10 bph (March 2016);
EL2 – 6 to 7.5 bph (March 2016);
62 – Sunday and evening frequencies from 3 to 4 bph and conversion to double-
deck buses (April 2016). n.b. quoted frequencies are for Monday to Saturday daytime except where indicated. Frequencies were also increased at other times for these changes, e.g.
Sunday daytime and evenings.
7.7 Queen’s to KGH bus service
7.7.1 A direct bus service between the two hospitals has been requested by
stakeholders. BHRUT currently operate their own shuttle bus.
7.7.2 Travel between hospitals is primarily undertaken by staff as patients are likely to go straight from home or work to the hospital they require. An objective of the hospital re-organisation will be to rationalise medical services across the two sites. It is
assumed this will reduce the need for medical staff to swap to the other hospital during their shift although other staff may be less affected. This is likely to reduce
demand to travel between the hospital sites making it harder to justify operating such a service.
7.7.3 Extending route 66 or 296 from Romford town centre to Queen’s are ways that a link between the hospitals could be created. The costs would be in the region of
£400,000 - £600,000 per annum. At present there is not space to terminate any more services at Queen’s.
7.7.4 LB Redbridge plans for creating a new road link through KGH to Aldborough Road South as part of a wider masterplan could create the opportunity to provide better
access to KGH from Romford.
56
8 INFRASTRUCTURE 8.1 Bus Infrastructure
8.1.1 With regard to this report, infrastructure typically means bus stands. A bus stand has a number of functions. Primarily it is space at the end of a bus route where the
bus can turn round and wait until it is time to make the return journey. The waiting time is essential to operating a reliable service as it allows buses arriving at the terminus late (or early) to set off on time thus regulating the service. While buses
wait at the stand it also provides the opportunity for drivers to check their vehicle, change shifts with other drivers or make use of driver facilities – often a toilet but
sometimes a room to take their meal break.
8.1.2 The previous section has demonstrated that changing bus routes can be very
expensive but that cost can be justified when passenger demand is sufficiently high. However, there can still remain physical constraints to delivering bus service
changes once the issue of a business case has been overcome.
8.1.3 For example, section 7 looked at extensions to routes 66 and 368. Irrespective of
the business case, there is no space at either Queen’s or KGH to accommodate additional terminating routes. Requiring bus routes to travel further to reach a stand
then requires the cost of additional vehicles and drivers which then undermines the business case. Similarly, as bus routes get more frequent, more stand space is required.
8.1.4 BHRUT, as managers of their estate, and the local Boroughs as planning
authorities have the scope to influence how land is allocated for various competing uses. As and when projects to change land uses within the hospital and adjacent areas is reviewed, it is advised that consideration be given to expanding available
space for buses.
8.1.5 BHRUT’s own idea for amending the layout of the highway near the Queen’s Hospital bus stops to better utilise space is therefore worth looking at in more detail.
8.2 Bus Priority
8.2.1 Previous sections have shown how time is a fundamental component of bus travel. From a passenger perspective congestion and delay result in unreliable bus services and so longer wait times at bus stops. Hence the recent stakeholder
complaints regarding route 387. It also means slower journey times when on the bus. Together, the wait time and journey time form the total journey time and it has
been seen that this influences decisions on travel to hospital. From an operational perspective more time getting from A to B means paying for more vehicles and the drivers to drive them. This makes it harder to justify bus route extensions or
increases in frequency in terms of value for money.
8.2.2 High quality bus priority is one method of protecting buses from delay and improving total journey times. The work done on bus priority within Queen’s hospital by LB Havering and the delivery of ELT standard priority within the Barking
57
Riverside development are two good examples of delivering improvements. TfL would welcome further project ideas from stakeholders.
8.2.3 Part of the scheme for the recent diversion of route EL2 to Becontree Heath and
the proposal to convert route 387 to be part of the ELT network will involve a significant upgrading of bus priority. This would benefit travel to KGH on the EL3 and travel to Queen’s on route 5 as it parallels the EL2 between Becontree Heath
and Barking.
8.3 Walking Routes & Interchanges
8.3.1 Section 7 has demonstrated how re-routeing buses to access hospital can have a
very expensive on-going cost and incur a lot of disruption to existing passengers whose journey is not hospital related.
8.3.2 An alternative, in some instances, may be to improve the walking route from the
hospital to the nearest bus stop so as to make them more direct, attractive, secure
and accessible.
8.3.3 Another alternative to is to enhance the waiting environment at key interchanges to minimise the aggravation of having to change buses.
8.3.4 This report has highlighted the following as potential schemes the Boroughs and BHRUT may want to pursue further:
Improved walk routes between Queen’s and South Street;
Improved walk routes between Eastern Avenue and KGH;
Improved walk routes between Queen’s and Romford town centre, especially the rail station;
Improved waiting environments at the key interchanges of Roneo Corner, Romford, Ilford and Becontree Heath.
58
9 CONCLUSION 9.1 Summary
9.1.1 It has been seen that the comprehensive nature of the London bus network means that connections to both Queen’s and KGH within their catchment areas are of a
very high standard.
9.1.2 The majority of trips on the bus network are not hospital related. The bus network is
most effective when it serves corridors where a variety of trip purposes become concentrated. Inevitably this will create hubs (often town centres) from which
interchange between bus routes (and other modes) can extend the journey offer while still remaining attractive to potential passengers. Through unified branding, passenger information, integrated ticketing, service planning and vastly improved
service reliability, many of the issues around interchanging are substantially mitigated, allowing bus services to perform as an effective network.
9.1.3 Providing more direct links to hospitals will always be welcomed by passengers and
stakeholders but justifying bus service changes in terms of value for money or in
terms of disruption to existing passengers can be difficult to achieve.
9.1.4 However, regular monitoring and review of the bus network can and does result in incremental improvements that also give better access to healthcare in a cost effective way. Recent examples include the re-routeing of the EL2 and frequency
increases on route 173. 9.2 Way forward
9.2.1 This report highlights the following as priorities as ways of further improving access
to Queen's and King George Hospitals:
Divert route 5 via Queen’s hospital
Extend route 387 into the new Barking Riverside development; convert into an
ELT service and re-name EL3. As well as providing direct bus links from new housing to KGH; the higher level of bus priority along the route will make the service faster and so more attractive to passengers.
Investigate the potential to increase stand capacity at both hospitals to create the flexibility for more terminating bus routes to be accommodated.
Investigate a programme of bus priority schemes to improve journey times to hospital and reduce pressure to shorten bus routes which then reduce the number of direct links to hospital.
Investigate a programme of schemes to enhance the interchange hubs and key walking routes identified in section 8.
Investigate the scope for a bus only link through KGH as part of the wider land use planning strategy for the area.
In the longer term investigate the creation of a new route connecting the final stages of Barking Riverside with Becontree Heath bus hub for onward connection to Queen’s e.g. via the route 5 proposal above.
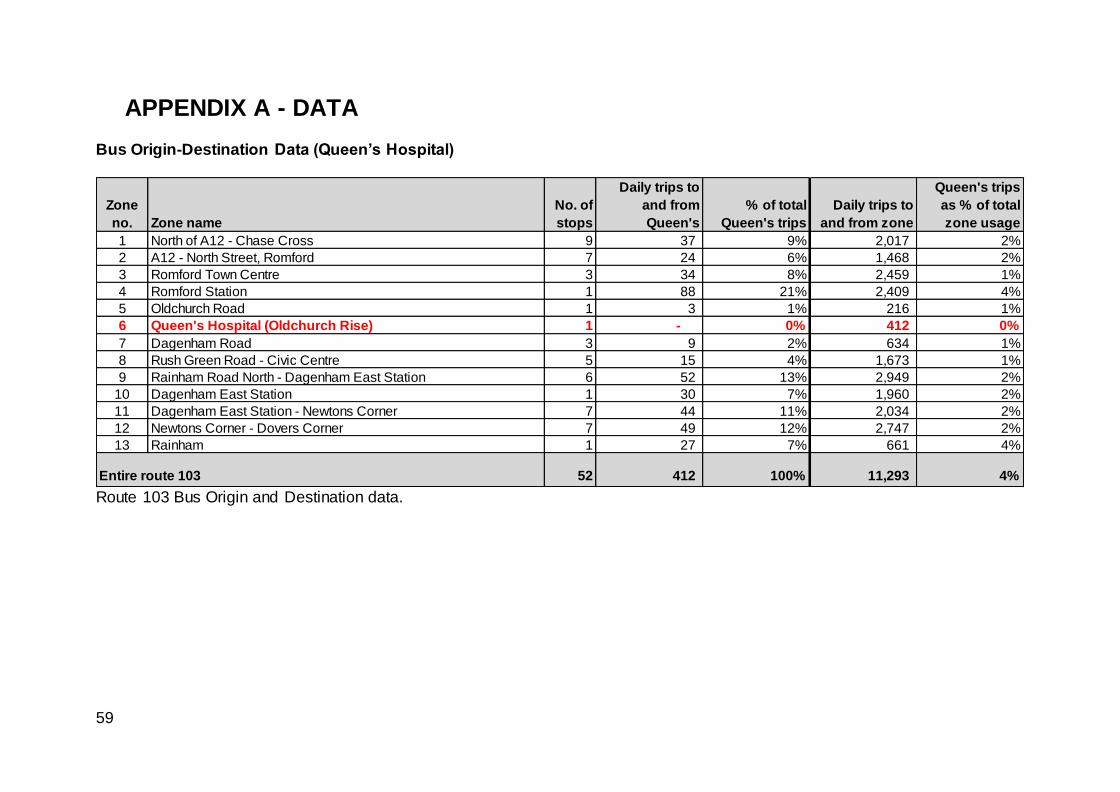
59
APPENDIX A - DATA Bus Origin-Destination Data (Queen’s Hospital)
Route 103 Bus Origin and Destination data.
Zone
no. Zone name
No. of
stops
Daily trips to
and from
Queen's
% of total
Queen's trips
Daily trips to
and from zone
Queen's trips
as % of total
zone usage
1 North of A12 - Chase Cross 9 37 9% 2,017 2%
2 A12 - North Street, Romford 7 24 6% 1,468 2%
3 Romford Town Centre 3 34 8% 2,459 1%
4 Romford Station 1 88 21% 2,409 4%
5 Oldchurch Road 1 3 1% 216 1%
6 Queen's Hospital (Oldchurch Rise) 1 - 0% 412 0%
7 Dagenham Road 3 9 2% 634 1%
8 Rush Green Road - Civic Centre 5 15 4% 1,673 1%
9 Rainham Road North - Dagenham East Station 6 52 13% 2,949 2%
10 Dagenham East Station 1 30 7% 1,960 2%
11 Dagenham East Station - Newtons Corner 7 44 11% 2,034 2%
12 Newtons Corner - Dovers Corner 7 49 12% 2,747 2%
13 Rainham 1 27 7% 661 4%
52 412 100% 11,293 4%Entire route 103
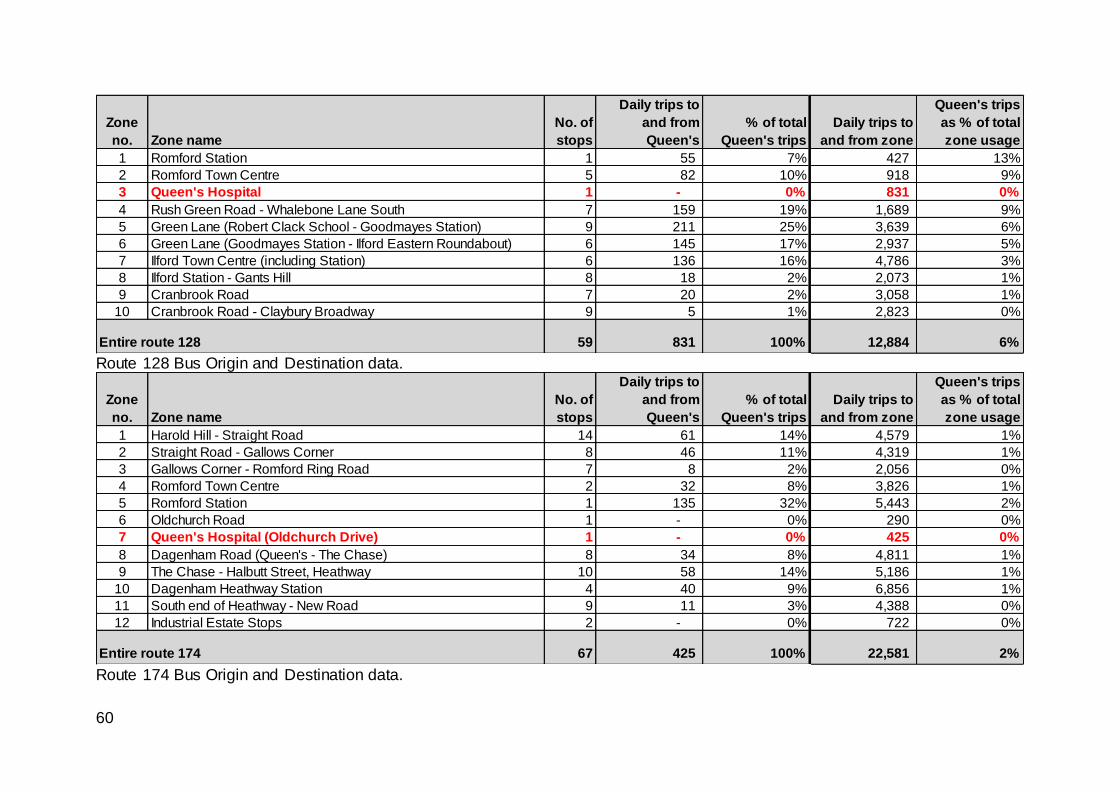
60
Route 128 Bus Origin and Destination data.
Route 174 Bus Origin and Destination data.
Zone
no. Zone name
No. of
stops
Daily trips to
and from
Queen's
% of total
Queen's trips
Daily trips to
and from zone
Queen's trips
as % of total
zone usage
1 Romford Station 1 55 7% 427 13%
2 Romford Town Centre 5 82 10% 918 9%
3 Queen's Hospital 1 - 0% 831 0%
4 Rush Green Road - Whalebone Lane South 7 159 19% 1,689 9%
5 Green Lane (Robert Clack School - Goodmayes Station) 9 211 25% 3,639 6%
6 Green Lane (Goodmayes Station - Ilford Eastern Roundabout) 6 145 17% 2,937 5%
7 Ilford Town Centre (including Station) 6 136 16% 4,786 3%
8 Ilford Station - Gants Hill 8 18 2% 2,073 1%
9 Cranbrook Road 7 20 2% 3,058 1%
10 Cranbrook Road - Claybury Broadway 9 5 1% 2,823 0%
59 831 100% 12,884 6%Entire route 128
Zone
no. Zone name
No. of
stops
Daily trips to
and from
Queen's
% of total
Queen's trips
Daily trips to
and from zone
Queen's trips
as % of total
zone usage
1 Harold Hill - Straight Road 14 61 14% 4,579 1%
2 Straight Road - Gallows Corner 8 46 11% 4,319 1%
3 Gallows Corner - Romford Ring Road 7 8 2% 2,056 0%
4 Romford Town Centre 2 32 8% 3,826 1%
5 Romford Station 1 135 32% 5,443 2%
6 Oldchurch Road 1 - 0% 290 0%
7 Queen's Hospital (Oldchurch Drive) 1 - 0% 425 0%
8 Dagenham Road (Queen's - The Chase) 8 34 8% 4,811 1%
9 The Chase - Halbutt Street, Heathway 10 58 14% 5,186 1%
10 Dagenham Heathway Station 4 40 9% 6,856 1%
11 South end of Heathway - New Road 9 11 3% 4,388 0%
12 Industrial Estate Stops 2 - 0% 722 0%
67 425 100% 22,581 2%Entire route 174
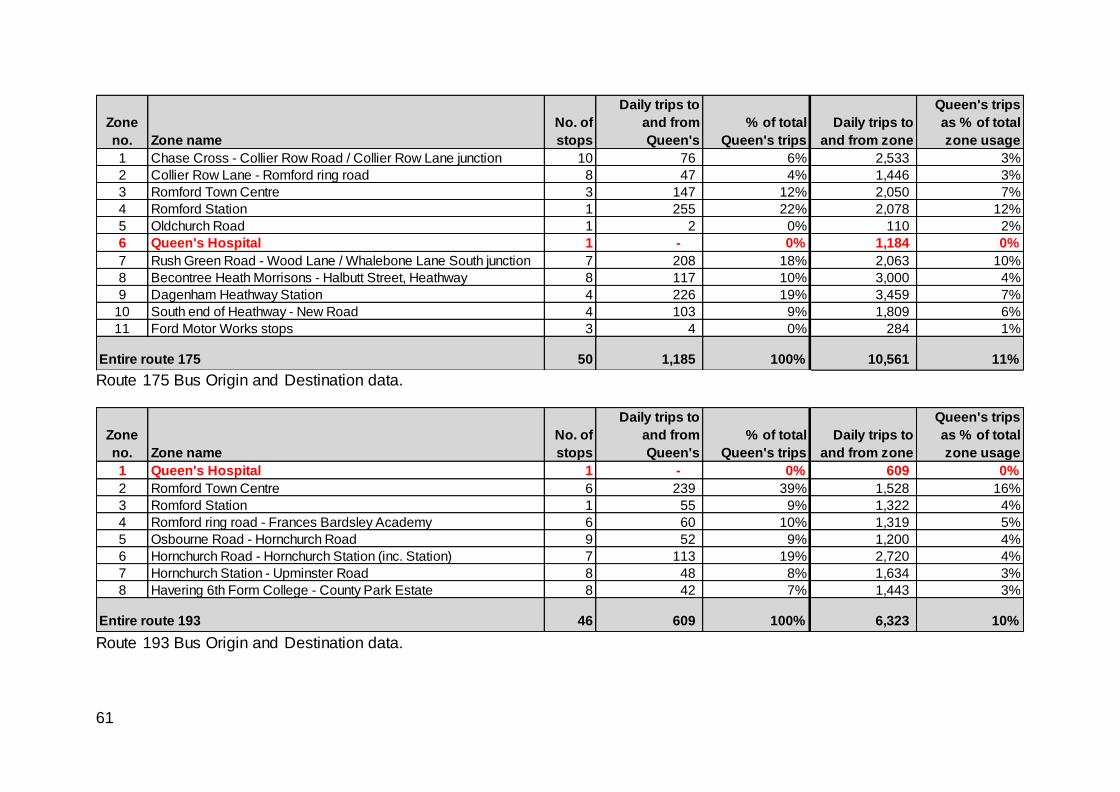
61
Route 175 Bus Origin and Destination data.
Route 193 Bus Origin and Destination data.
Zone
no. Zone name
No. of
stops
Daily trips to
and from
Queen's
% of total
Queen's trips
Daily trips to
and from zone
Queen's trips
as % of total
zone usage
1 Chase Cross - Collier Row Road / Collier Row Lane junction 10 76 6% 2,533 3%
2 Collier Row Lane - Romford ring road 8 47 4% 1,446 3%
3 Romford Town Centre 3 147 12% 2,050 7%
4 Romford Station 1 255 22% 2,078 12%
5 Oldchurch Road 1 2 0% 110 2%
6 Queen's Hospital 1 - 0% 1,184 0%
7 Rush Green Road - Wood Lane / Whalebone Lane South junction 7 208 18% 2,063 10%
8 Becontree Heath Morrisons - Halbutt Street, Heathway 8 117 10% 3,000 4%
9 Dagenham Heathway Station 4 226 19% 3,459 7%
10 South end of Heathway - New Road 4 103 9% 1,809 6%
11 Ford Motor Works stops 3 4 0% 284 1%
50 1,185 100% 10,561 11%Entire route 175
Zone
no. Zone name
No. of
stops
Daily trips to
and from
Queen's
% of total
Queen's trips
Daily trips to
and from zone
Queen's trips
as % of total
zone usage
1 Queen's Hospital 1 - 0% 609 0%
2 Romford Town Centre 6 239 39% 1,528 16%
3 Romford Station 1 55 9% 1,322 4%
4 Romford ring road - Frances Bardsley Academy 6 60 10% 1,319 5%
5 Osbourne Road - Hornchurch Road 9 52 9% 1,200 4%
6 Hornchurch Road - Hornchurch Station (inc. Station) 7 113 19% 2,720 4%
7 Hornchurch Station - Upminster Road 8 48 8% 1,634 3%
8 Havering 6th Form College - County Park Estate 8 42 7% 1,443 3%
46 609 100% 6,323 10%Entire route 193
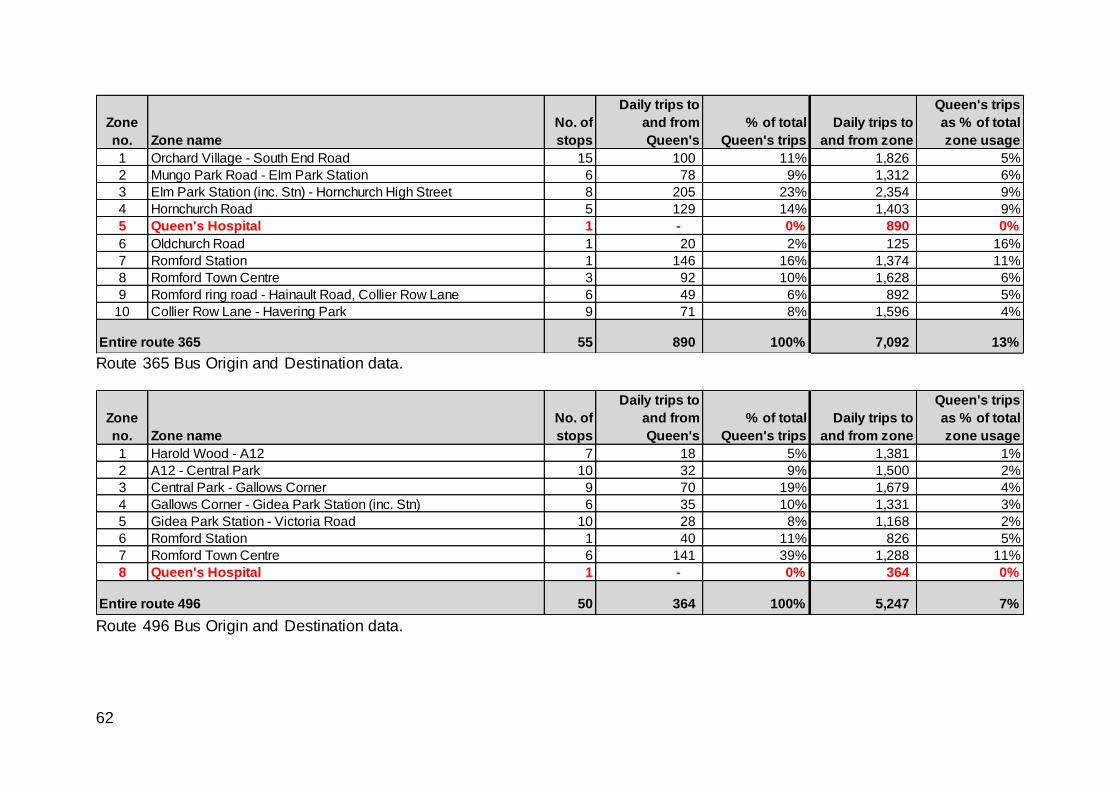
62
Route 365 Bus Origin and Destination data.
Route 496 Bus Origin and Destination data.
Zone
no. Zone name
No. of
stops
Daily trips to
and from
Queen's
% of total
Queen's trips
Daily trips to
and from zone
Queen's trips
as % of total
zone usage
1 Orchard Village - South End Road 15 100 11% 1,826 5%
2 Mungo Park Road - Elm Park Station 6 78 9% 1,312 6%
3 Elm Park Station (inc. Stn) - Hornchurch High Street 8 205 23% 2,354 9%
4 Hornchurch Road 5 129 14% 1,403 9%
5 Queen's Hospital 1 - 0% 890 0%
6 Oldchurch Road 1 20 2% 125 16%
7 Romford Station 1 146 16% 1,374 11%
8 Romford Town Centre 3 92 10% 1,628 6%
9 Romford ring road - Hainault Road, Collier Row Lane 6 49 6% 892 5%
10 Collier Row Lane - Havering Park 9 71 8% 1,596 4%
55 890 100% 7,092 13%Entire route 365
Zone
no. Zone name
No. of
stops
Daily trips to
and from
Queen's
% of total
Queen's trips
Daily trips to
and from zone
Queen's trips
as % of total
zone usage
1 Harold Wood - A12 7 18 5% 1,381 1%
2 A12 - Central Park 10 32 9% 1,500 2%
3 Central Park - Gallows Corner 9 70 19% 1,679 4%
4 Gallows Corner - Gidea Park Station (inc. Stn) 6 35 10% 1,331 3%
5 Gidea Park Station - Victoria Road 10 28 8% 1,168 2%
6 Romford Station 1 40 11% 826 5%
7 Romford Town Centre 6 141 39% 1,288 11%
8 Queen's Hospital 1 - 0% 364 0%
50 364 100% 5,247 7%Entire route 496
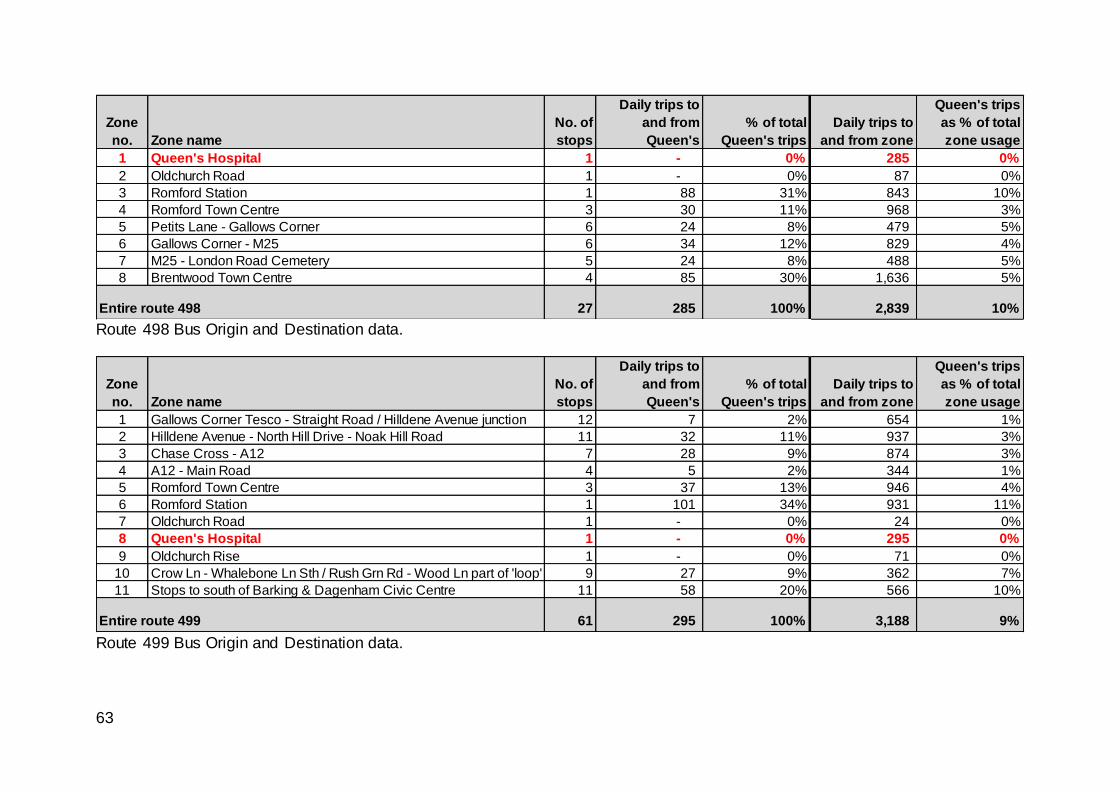
63
Route 498 Bus Origin and Destination data.
Route 499 Bus Origin and Destination data.
Zone
no. Zone name
No. of
stops
Daily trips to
and from
Queen's
% of total
Queen's trips
Daily trips to
and from zone
Queen's trips
as % of total
zone usage
1 Queen's Hospital 1 - 0% 285 0%
2 Oldchurch Road 1 - 0% 87 0%
3 Romford Station 1 88 31% 843 10%
4 Romford Town Centre 3 30 11% 968 3%
5 Petits Lane - Gallows Corner 6 24 8% 479 5%
6 Gallows Corner - M25 6 34 12% 829 4%
7 M25 - London Road Cemetery 5 24 8% 488 5%
8 Brentwood Town Centre 4 85 30% 1,636 5%
27 285 100% 2,839 10%Entire route 498
Zone
no. Zone name
No. of
stops
Daily trips to
and from
Queen's
% of total
Queen's trips
Daily trips to
and from zone
Queen's trips
as % of total
zone usage
1 Gallows Corner Tesco - Straight Road / Hilldene Avenue junction 12 7 2% 654 1%
2 Hilldene Avenue - North Hill Drive - Noak Hill Road 11 32 11% 937 3%
3 Chase Cross - A12 7 28 9% 874 3%
4 A12 - Main Road 4 5 2% 344 1%
5 Romford Town Centre 3 37 13% 946 4%
6 Romford Station 1 101 34% 931 11%
7 Oldchurch Road 1 - 0% 24 0%
8 Queen's Hospital 1 - 0% 295 0%
9 Oldchurch Rise 1 - 0% 71 0%
10 Crow Ln - Whalebone Ln Sth / Rush Grn Rd - Wood Ln part of 'loop' 9 27 9% 362 7%
11 Stops to south of Barking & Dagenham Civic Centre 11 58 20% 566 10%
61 295 100% 3,188 9%Entire route 499
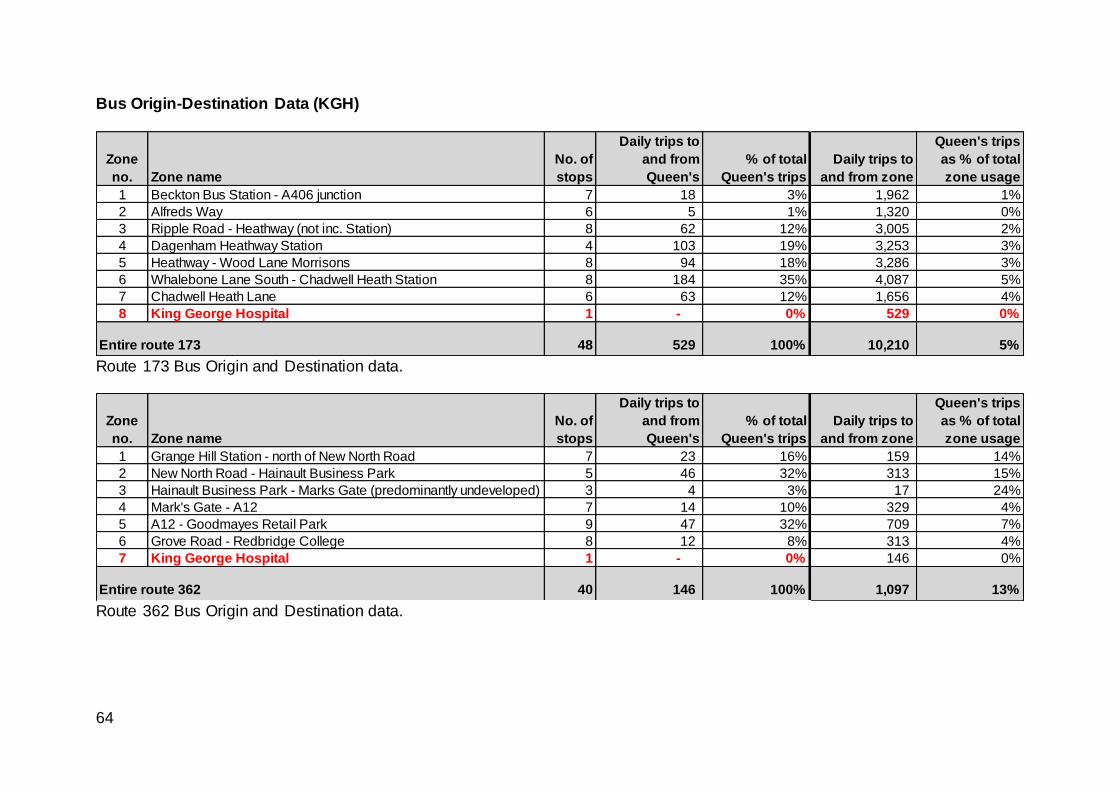
64
Bus Origin-Destination Data (KGH)
Route 173 Bus Origin and Destination data.
Route 362 Bus Origin and Destination data.
Zone
no. Zone name
No. of
stops
Daily trips to
and from
Queen's
% of total
Queen's trips
Daily trips to
and from zone
Queen's trips
as % of total
zone usage
1 Beckton Bus Station - A406 junction 7 18 3% 1,962 1%
2 Alfreds Way 6 5 1% 1,320 0%
3 Ripple Road - Heathway (not inc. Station) 8 62 12% 3,005 2%
4 Dagenham Heathway Station 4 103 19% 3,253 3%
5 Heathway - Wood Lane Morrisons 8 94 18% 3,286 3%
6 Whalebone Lane South - Chadwell Heath Station 8 184 35% 4,087 5%
7 Chadwell Heath Lane 6 63 12% 1,656 4%
8 King George Hospital 1 - 0% 529 0%
48 529 100% 10,210 5%Entire route 173
Zone
no. Zone name
No. of
stops
Daily trips to
and from
Queen's
% of total
Queen's trips
Daily trips to
and from zone
Queen's trips
as % of total
zone usage
1 Grange Hill Station - north of New North Road 7 23 16% 159 14%
2 New North Road - Hainault Business Park 5 46 32% 313 15%
3 Hainault Business Park - Marks Gate (predominantly undeveloped) 3 4 3% 17 24%
4 Mark's Gate - A12 7 14 10% 329 4%
5 A12 - Goodmayes Retail Park 9 47 32% 709 7%
6 Grove Road - Redbridge College 8 12 8% 313 4%
7 King George Hospital 1 - 0% 146 0%
40 146 100% 1,097 13%Entire route 362
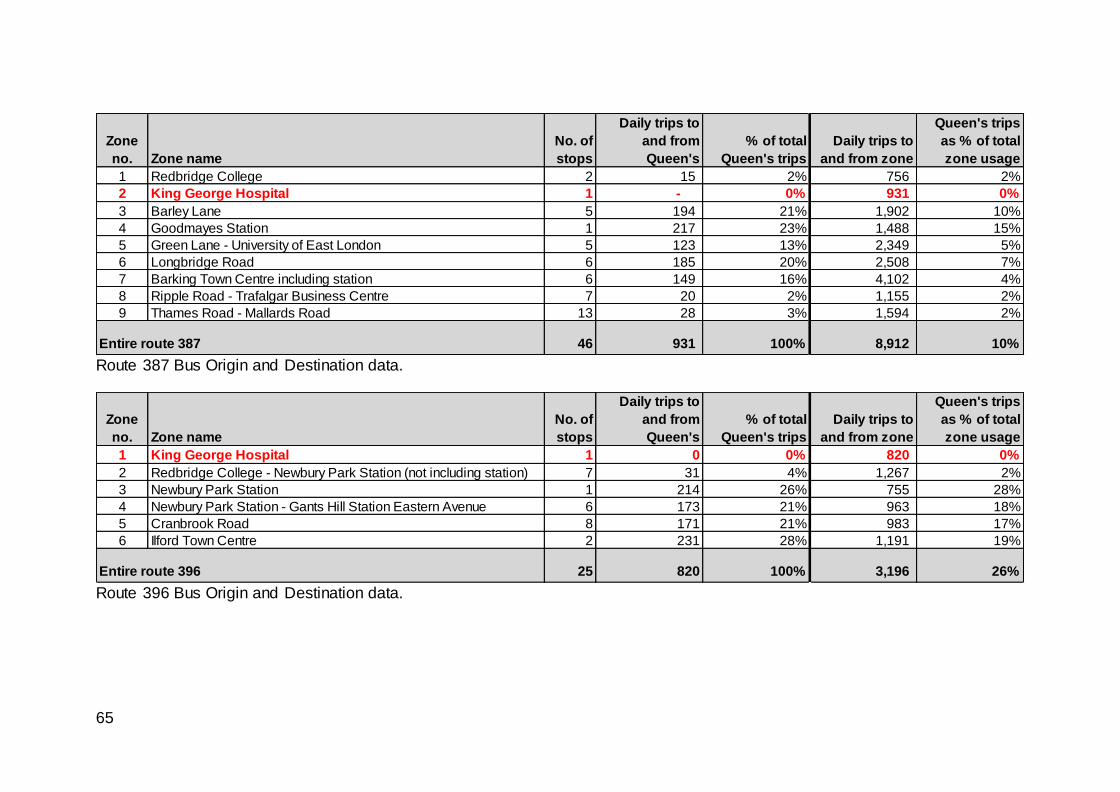
65
Route 387 Bus Origin and Destination data.
Route 396 Bus Origin and Destination data.
Zone
no. Zone name
No. of
stops
Daily trips to
and from
Queen's
% of total
Queen's trips
Daily trips to
and from zone
Queen's trips
as % of total
zone usage
1 Redbridge College 2 15 2% 756 2%
2 King George Hospital 1 - 0% 931 0%
3 Barley Lane 5 194 21% 1,902 10%
4 Goodmayes Station 1 217 23% 1,488 15%
5 Green Lane - University of East London 5 123 13% 2,349 5%
6 Longbridge Road 6 185 20% 2,508 7%
7 Barking Town Centre including station 6 149 16% 4,102 4%
8 Ripple Road - Trafalgar Business Centre 7 20 2% 1,155 2%
9 Thames Road - Mallards Road 13 28 3% 1,594 2%
46 931 100% 8,912 10%Entire route 387
Zone
no. Zone name
No. of
stops
Daily trips to
and from
Queen's
% of total
Queen's trips
Daily trips to
and from zone
Queen's trips
as % of total
zone usage
1 King George Hospital 1 0 0% 820 0%
2 Redbridge College - Newbury Park Station (not including station) 7 31 4% 1,267 2%
3 Newbury Park Station 1 214 26% 755 28%
4 Newbury Park Station - Gants Hill Station Eastern Avenue 6 173 21% 963 18%
5 Cranbrook Road 8 171 21% 983 17%
6 Ilford Town Centre 2 231 28% 1,191 19%
25 820 100% 3,196 26%Entire route 396
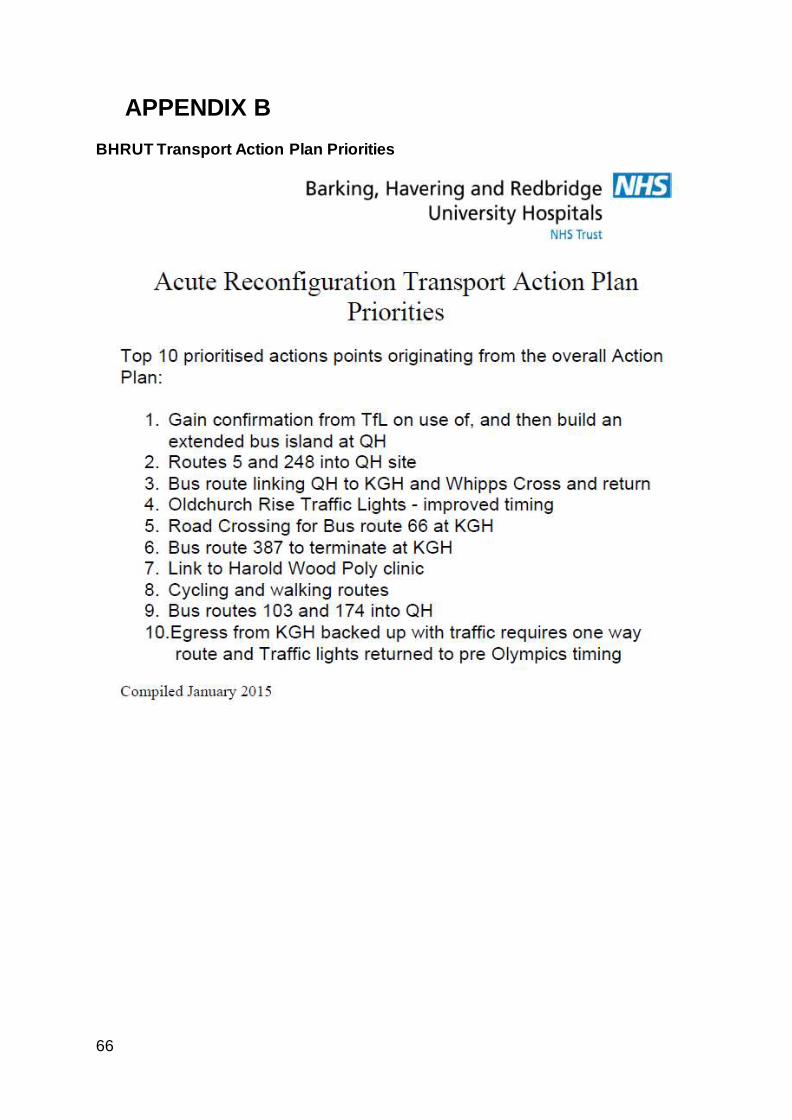
66
APPENDIX B BHRUT Transport Action Plan Priorities