Embed Size (px)
Citation preview
NREL is a national laboratory of the U.S. Department of Energy Office of Energy Efficiency & Renewable Energy Operated by the Alliance for Sustainable Energy, LLC
This report is available at no cost from the National Renewable Energy Laboratory (NREL) at www.nrel.gov/publications.
Contract No. DE-AC36-08GO28308
Review of Biojet Fuel Conversion Technologies Wei-Cheng Wang, Ling Tao, Jennifer Markham, Yanan Zhang, Eric Tan, Liaw Batan, Ethan Warner, and Mary Biddy National Renewable Energy Laboratory
Technical Report NREL/TP-5100-66291 July 2016
NREL is a national laboratory of the U.S. Department of Energy Office of Energy Efficiency & Renewable Energy Operated by the Alliance for Sustainable Energy, LLC
This report is available at no cost from the National Renewable Energy Laboratory (NREL) at www.nrel.gov/publications.
Contract No. DE-AC36-08GO28308
National Renewable Energy Laboratory 15013 Denver West Parkway Golden, CO 80401 303-275-3000 • www.nrel.gov
Review of Biojet Fuel Conversion Technologies Wei-Cheng Wang, Ling Tao, Jennifer Markham, Yanan Zhang, Eric Tan, Liaw Batan, Ethan Warner, and Mary Biddy National Renewable Energy Laboratory
Prepared under Task No. BB14.4420
Technical Report NREL/TP-5100-66291 July 2016
NOTICE
This report was prepared as an account of work sponsored by an agency of the United States government. Neither the United States government nor any agency thereof, nor any of their employees, makes any warranty, express or implied, or assumes any legal liability or responsibility for the accuracy, completeness, or usefulness of any information, apparatus, product, or process disclosed, or represents that its use would not infringe privately owned rights. Reference herein to any specific commercial product, process, or service by trade name, trademark, manufacturer, or otherwise does not necessarily constitute or imply its endorsement, recommendation, or favoring by the United States government or any agency thereof. The views and opinions of authors expressed herein do not necessarily state or reflect those of the United States government or any agency thereof.
This report is available at no cost from the National Renewable Energy Laboratory (NREL) at www.nrel.gov/publications.
Available electronically at SciTech Connect http:/www.osti.gov/scitech
Available for a processing fee to U.S. Department of Energy and its contractors, in paper, from:
U.S. Department of Energy Office of Scientific and Technical Information P.O. Box 62 Oak Ridge, TN 37831-0062 OSTI http://www.osti.gov Phone: 865.576.8401 Fax: 865.576.5728 Email: [email protected]
Available for sale to the public, in paper, from:
U.S. Department of Commerce National Technical Information Service 5301 Shawnee Road Alexandria, VA 22312 NTIS http://www.ntis.gov Phone: 800.553.6847 or 703.605.6000 Fax: 703.605.6900 Email: [email protected]
Cover Photos by Dennis Schroeder: (left to right) NREL 26173, NREL 18302, NREL 19758, NREL 29642, NREL 19795.
NREL prints on paper that contains recycled content.

iii This report is available at no cost from the National Renewable Energy Laboratory (NREL) at www.nrel.gov/publications.
Acknowledgments Author Wei-Cheng Wang is now with National Cheng Kung University in Taiwan. Any questions about this report should be directed to co-author and principal investigator Dr. Ling Tao ([email protected]) at the National Renewable Energy Laboratory. We appreciate all the technical review from Tom Foust, Robert McCormick, Anelia Milbrandt, Steve Phillips, Joan Tarud, and Yimin Zhang. We also appreciate all the editing help from our technical editors, Kathy L. Cisar, Sara M. Havig, and Kathryn Ruckman.
iv
This report is available at no cost from the National Renewable Energy Laboratory (NREL) at www.nrel.gov/publications.
List of Acronyms ABE acetone-butanol-ethanol ADBP Advanced Drop-in Biofuel Production Project AFRL U.S. Air Force Research Laboratory APR aqueous phase reforming ASTM ASTM International ATJ alcohol-to-jet BDT biomass dry ton BTL biomass-to-liquid CAAFI Commercial Aviation Alternative Fuels Initiative CCC USDA’s Commodity Credit Corporation CH catalytic hydrothermolysis CLEEN Continuous Lower Energy, Emissions, and Noise CO carbon monoxide CO2 carbon dioxide CSTR continuous stirred tank reactors CTL coal-to-liquid DARPA Defense Advanced Research Projects Agency DCN derived cetane number DPA Defense Production Act DMF 2,5-dimethylfuran DOD U.S. Department of Defense DOE U.S. Department of Energy DOT Department of Transportation DSHC direct sugar to hydrocarbons E. coli Escherichia coli EIA U.S. Energy Information Administration EISA Energy Independence and Security Act of 2007 EPA Environmental Protection Agency FAA Federal Aviation Administration FFA free fatty acid FT Fischer-Tropsch gCO2e grams carbon dioxide equivalent GGE gallon of gasoline equivalent GHG greenhouse gas GJ gigajoules GTJ gas-to-jet GTL gas-to-liquid H2 hydrogen HDCJ hydrotreated depolymerized cellulosic jet HEFA hydroprocessed esters and fatty acids HMF 5-hydroxymethylfurfural HRJ hydroprocessed renewable jet HTFT high temperature Fischer-Tropsch HTL hydrothermal liquefaction IATA International Air Transport Association
v
This report is available at no cost from the National Renewable Energy Laboratory (NREL) at www.nrel.gov/publications.
LCA life-cycle assessment LHV lower heating value LPG liquefied petroleum gas LTFT low temperature Fischer-Tropsch LUC land use change MASBI Midwest Aviation Sustainable Biofuels Initiative MIL military MJ megajoules MM million MOU memorandum of understanding MSW municipal solid waste MTO methanol-to-oil MYPP Biomass Multiple Year Program Plan NAWCWD Naval Air Warfare Center Weapons Division NARA Northwest Advanced Renewable Alliance NOx oxides of nitrogen NRC National Research Council Canada NREL National Renewable Energy Laboratory OTJ oil-to-jet PNNL Pacific Northwest National Laboratory RIN Renewable Identification Number RTP rapid thermal processing RFS Renewable Fuel Standards SAPO silicoaluminophosphates SAFN Sustainable Aviation Fuels Northwest SCP single cell proteins SIP synthetic iso-parafin SPK synthetic paraffinic kerosene STJ sugar-to-jet TEA techno-economic analysis USDA U.S. Department of Agriculture WTW well-to-wake WWTP wastewater treatment plant
vi This report is available at no cost from the National Renewable Energy Laboratory (NREL) at www.nrel.gov/publications.
Executive Summary Biomass-derived jet (biojet) fuel has become a key element in the aviation industry’s strategy to reduce operating costs and environmental impacts. Researchers from the oil-refining industry, the aviation industry, government, biofuel companies, agricultural organizations, and academia are working toward developing commercially viable and sustainable processes that produce long-lasting renewable jet fuels with low production costs and low greenhouse gas emissions. Additionally, jet fuels must meet ASTM International specifications and potentially be a 100% drop-in replacement for the current petroleum jet fuel. The combustion characteristics and engine tests demonstrate the benefits of running the aviation gas turbine with biojet fuels.
In this study, the current technologies for producing renewable jet fuels, categorized by alcohols-to-jet, oil-to-jet, syngas-to-jet, and sugar-to-jet pathways, are reviewed. The main challenges for each technology pathway, including feedstock availability, conceptual process design, process economics, life-cycle assessment of greenhouse gas emissions, and commercial readiness, are discussed. Although the feedstock price and availability and energy intensity of the process are significant barriers, biomass-derived jet fuel has the potential to replace a significant portion of conventional jet fuel required to meet commercial and military demand.
vii This report is available at no cost from the National Renewable Energy Laboratory (NREL) at www.nrel.gov/publications.
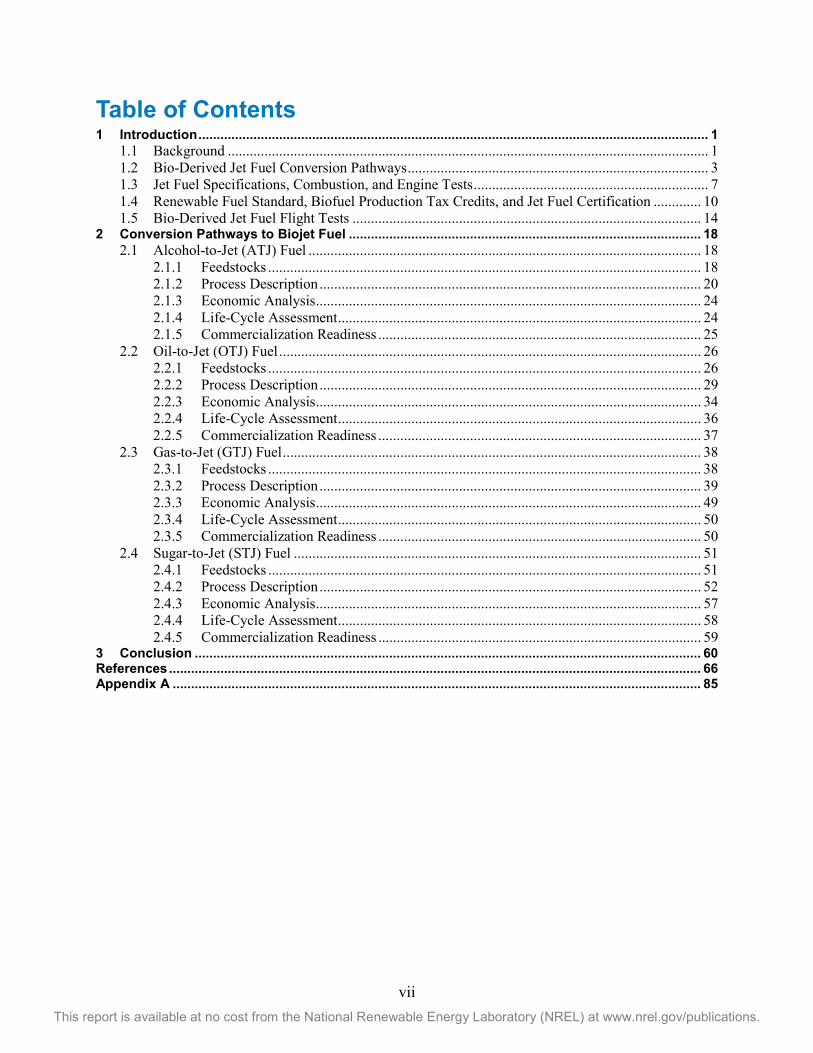
Table of Contents 1 Introduction ........................................................................................................................................... 1
1.1 Background ................................................................................................................................... 1 1.2 Bio-Derived Jet Fuel Conversion Pathways .................................................................................. 3 1.3 Jet Fuel Specifications, Combustion, and Engine Tests ................................................................ 7 1.4 Renewable Fuel Standard, Biofuel Production Tax Credits, and Jet Fuel Certification ............. 10 1.5 Bio-Derived Jet Fuel Flight Tests ............................................................................................... 14
2 Conversion Pathways to Biojet Fuel ................................................................................................ 18 2.1 Alcohol-to-Jet (ATJ) Fuel ........................................................................................................... 18
2.1.1 Feedstocks ...................................................................................................................... 18 2.1.2 Process Description ........................................................................................................ 20 2.1.3 Economic Analysis ......................................................................................................... 24 2.1.4 Life-Cycle Assessment ................................................................................................... 24 2.1.5 Commercialization Readiness ........................................................................................ 25
2.2 Oil-to-Jet (OTJ) Fuel ................................................................................................................... 26 2.2.1 Feedstocks ...................................................................................................................... 26 2.2.2 Process Description ........................................................................................................ 29 2.2.3 Economic Analysis ......................................................................................................... 34 2.2.4 Life-Cycle Assessment ................................................................................................... 36 2.2.5 Commercialization Readiness ........................................................................................ 37
2.3 Gas-to-Jet (GTJ) Fuel .................................................................................................................. 38 2.3.1 Feedstocks ...................................................................................................................... 38 2.3.2 Process Description ........................................................................................................ 39 2.3.3 Economic Analysis ......................................................................................................... 49 2.3.4 Life-Cycle Assessment ................................................................................................... 50 2.3.5 Commercialization Readiness ........................................................................................ 50
2.4 Sugar-to-Jet (STJ) Fuel ............................................................................................................... 51 2.4.1 Feedstocks ...................................................................................................................... 51 2.4.2 Process Description ........................................................................................................ 52 2.4.3 Economic Analysis ......................................................................................................... 57 2.4.4 Life-Cycle Assessment ................................................................................................... 58 2.4.5 Commercialization Readiness ........................................................................................ 59
3 Conclusion .......................................................................................................................................... 60 References ................................................................................................................................................. 66 Appendix A ................................................................................................................................................ 85
1 This report is available at no cost from the National Renewable Energy Laboratory (NREL) at www.nrel.gov/publications.
1 Introduction 1.1 Background Aviation fuel, a petroleum-based fuel used to power aircraft, has stricter quality requirements than fuels used in road transport. Jet fuel is a type of aviation fuel designed specifically to power gas-turbine engines and is the primary subject of this review. According to a report from the U.S. Energy Information Administration (EIA) (U.S. Energy Information Administration 2013), 4 gallons out of every 42-gallon barrel of crude oil are used to produce jet fuel. The worldwide aviation industry consumes approximately 1.5–1.7 billion barrels of conventional jet fuel per year (Stratton, Wong, et al. 2010; Air Transportation Action Group 2011). Fuel is the largest operating cost in the aviation industry, and the unstable prices of crude oil hamper long-term planning and expense budgeting. Renewable feedstock-derived jet fuels can reduce the dependency of the aviation industry on one single energy source, avoiding the volatility of petroleum prices, and potentially reducing greenhouse gas (GHG) emissions (Air Transportation Action Group 2011).
For the U.S. Department of Defense (DOD) alternative fuel initiatives, the U.S. Air Force has set goals to test and certify all aircrafts and systems on a 50:50 alternative fuel blend by 2012, and to ensure that 50% of the domestic aviation fuel of the Air Force comes from an alternative fuel blend by 2025 (Blakeley 2012; Lane 2014a). The U.S. Navy’s goal is to run ships and aircraft entirely on alternative fuel blends by 2016 and to achieve 50% of the Navy’s total energy use from alternative sources by 2020 (Blakeley 2012).
A diversified, homegrown, and renewable feedstock-based fuel system is crucial in the strategy to achieve energy security and to increase environmental stewardship. In 2010, the U.S. Department of Agriculture (USDA) and the Navy inaugurated a joint venture called "Farm-to-Fleet" to develop domestic, competitively priced "drop-in" diesel and jet fuel replacements (USDA News Release 2013). The Farm-to-Fleet program announced in 2013 that it incorporates the acquisition of biofuel blends into regular DOD domestic solicitations for jet engine and marine diesel fuels (USDA News Release 2013). The Navy will seek to purchase JP-5 and F-76 advanced drop-in biofuels blended with 10%–50% conventional fuels, with funding assistance from USDA's Commodity Credit Corporation (CCC) (USDA News Release 2013). The CCC funds aim to "buy down" the cost of the biofuels component of any fuel procurement that is above the current price of fuel paid by the Navy, which can use appropriated domestic U.S. feedstocks to fill in any gaps in fuel quantities. This provides a consistent market and allows the industry to scale up gradually until these homegrown biomass-based biofuels match conventional fuel prices without reliance on USDA support.
In 2011, the USDA, the U.S. Department of Energy (DOE), and the Navy executed a memorandum of understanding (MOU) to invest up to $510 million (MM) in partnerships with the private sector to produce advanced drop-in aviation and marine biofuels to power military and commercial transportation (USDA-NAVY-DOE 2011). DOE and the Navy’s funding portions came through the Defense Production Act (DPA) Title III office to build biorefineries, in order to assure that capital would be available to build production capacity and offset feedstock costs for drop-in biofuels that would meet the Navy’s needs, timelines, and cost goals. The USDA’s portion was included with CCC funds to address feedstock development through a $161 MM innovative program. In 2013, DOD awarded $20.1 MM in contracts to Emerald
2 This report is available at no cost from the National Renewable Energy Laboratory (NREL) at www.nrel.gov/publications.
Biofuels, Natures BioReserve, Fulcrum Biofuels, and Red Rock Biofuels for planning, preliminary designing, environmental assessment, front-end engineering and permitting, and development of detailed business cases. These projects are part of Phase 1 of the DPA Title III Advanced Drop-in Biofuels Production Project (ADBPP), which aims to establish domestic chains to produce drop-in replacement biofuels to the U.S. military. In 2014, DOD awarded $210 MM to Emerald Biofuels, Fulcrum BioEnergy, and Red Rock Biofuels as Phase 2 of the ADBPP project. These grants target the construction of biorefineries with a combined capacity of 100 MM gallons of military-specified jet fuels and marine diesel, at a cost-competitive rate (less than $4 per gallon) and with 50% reduction of emissions compared to conventional fuels (Lane 2014a).
"Farm-to-Fly" is another established initiative that comprises USDA, Airlines for America, and Boeing to promote the production of renewable jet fuels that do not require jet engine modifications and to target the production of 1 billion gallons of drop-in aviation biofuels a year by 2018 (USDA 2012). The program has been extended until 2019 with the addition of DOE, the Department of Transportation (DOT) Federal Aviation Administration (FAA), and major private partners such as the Commercial Aviation Alternative Fuels Initiative (CAAFI) (Green Air 2014; U.S. Department of Energy 2014). In 2014, advanced drop-in biofuel blends were incorporated into the standard procurement practices of DOD, which increases business opportunities of biofuel suppliers.
There are a few regional and national working groups for jet fuel developments. CAAFI was the first organization to establish a structure inclusive of all stakeholders from industry and government involved in sustainable aviation fuel deployment, and it has completed pioneering work in many areas (e.g., in the certification of biojet fuel pathways and establishing commercialization models) (IATA 2015).
The Midwest Aviation Sustainable Biofuels Initiative (MASBI) is a collaboration of 40-plus public and private organizations that came together in 2012, led by United Airlines, Boeing, Honeywell’s UOP, the Chicago Department of Aviation, and the Clean Energy Trust (Midwest Aviation Sustainable Biofuels Initiative 2013). MASBI works across the biofuels value chain to address ways to best leverage regional assets through collaboration across public-private entities for sustainable aviation biofuels (www.masbi.org). The Midwest is a hub of vibrant financial, academic, and agricultural communities, enabling the region to lead in clean energy development (www.masbi.org).
Boeing Company, Alaska Airlines, Portland International Airport, Seattle-Tacoma International Airport, Spokane International Airport, Washington State University, and Climate Solutions also created a regional working group, Sustainable Aviation Fuels Northwest (SAFN), to develop sustainable and economically viable aviation biofuels in the Northwest (http://climatesolutions.org/programs/saf/resources/safn) (SAFN 2011).
Led by Washington State University, the Northwest Advanced Renewables Alliance (NARA) works on building a supply chain of the Pacific Northwest (Washington, Oregon, Idaho, and Montana) region for aviation biofuel with the goal of increasing efficiency in everything from forestry operations to conversion processes, funded through a 5-year grant provided by USDA
3 This report is available at no cost from the National Renewable Energy Laboratory (NREL) at www.nrel.gov/publications.
National Institute of Food and Agriculture (https://nararenewables.org) (Northwest Advanced Renewables Alliance 2015).
The European Commission, in partnership and cooperation with leading European airlines, launched the European Advanced Biofuels Flightpath (http://ec.europa.eu/energy/en). The EU Biofuels Flightpath set a target of two MM tonnes per year of aviation biofuels by 2020, which is approximately 3%-4% of total jet fuel use in Europe (International Air Transport Association 2013). Twenty-five EU countries were expected to meet their 2013/2014 interim renewable energy targets, and the projected share of renewable energy in the gross final energy consumption was 15.3% in 2014 (European Commission 2015).
Several public reports addressed a variety of the jet fuel volumetric goals as well as the blending ratio of biofuels with conventional jet fuels. Analysis suggests that a viable market for biofuels can be maintained when as little as 1% of world jet fuel supply is substituted by a biofuel (Air Transportation Action Group 2011), with aggregation of higher blending ratio for future years, such as 25% by 2020, 30% by 2030, and 50% by 2040 (Air Transportation Action Group 2009). The farm-to-fly effort targets at a 5% replacement in 2018 (USDA 2012). For instance, based on the upper estimate of jet fuel demand, it is generically estimated that between 35%–100% of global jet fuel demand could be provided by biofuel by 2050 (Bauen, Howes, et al. 2009). EU is projecting low-carbon sustainable fuels in aviation to reach 40 % by 2050 (European Commission 2011). The volumetric targets in the most recent publications or reports are more conservative and are moved from volumetric targets to a GHG emission reduction target of a 50% reduction in carbon emissions by 2050 relative to a 2005 baseline (IATA 2015).
Feedstock costs contribute a large portion to the overall biofuel production cost. Rising prices for food, surface transportation, and power generation are sources of increasing demand on energy crops (a plant used to produce biofuels or to generate electricity or heat) and one of the reasons for increasing feedstock prices (Hileman, Ortiz, et al. 2009). Appropriate plantation, cultivation, and harvesting are required before the feedstocks are processed into fuel (Air Transportation Action Group 2009). Estimates show that 8% of U.S. energy crop and residue resources would be required to fully supply the biojet fuel demand in 2050 (Bauen, Howes, et al. 2009). Potential feedstocks for producing biojet fuel are classified as (a) oil-based feedstocks, such as vegetable oils, waste oils, algal oils, and pyrolysis oils; (b) solid-based feedstocks, such as lignocellulosic biomass (including wood products, forestry waste, and agricultural residue) and municipal waste (the organic portion) (Leuphana 2011); or (c) gas-based feedstocks, such as biogas and syngas. The key to the successful implementation of biojet fuel is the availability of feedstock at a large and sustainable scale and low price. Improved yields and reduced plantation or transportation costs would promote commercialization of biojet fuel conversion processes and, therefore, would allow the industry and government to assess and address the feedstocks’ potential and impacts.
1.2 Bio-Derived Jet Fuel Conversion Pathways Biomass-derived jet fuel can provide a near-term and even a long-term solution to the airline industry and the military with a lower environmental impact than petroleum fuels. Many biojet fuel conversion technologies, whether in the research and development, demonstration, or commercial stages, are described in the literature.

4 This report is available at no cost from the National Renewable Energy Laboratory (NREL) at www.nrel.gov/publications.
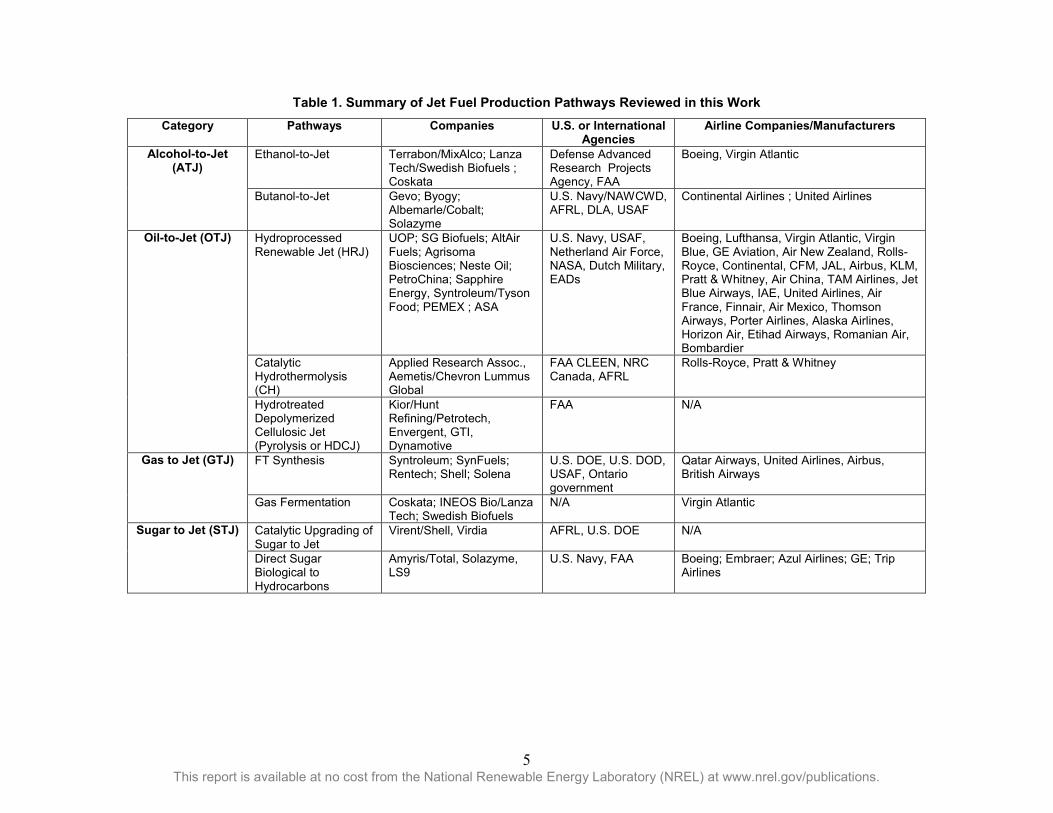
In this review, the upgrading pathways are classified as one of four types, based on the feedstocks and conversion processes: (1) alcohol-to-jet (ATJ), (2) oil-to-jet (OTJ), (3) gas-to-jet (GTJ), and (4) sugar-to-jet (STJ) (shown in Table 1). Some of the technologies that convert bio-based feedstocks to jet fuel have been reviewed in the literature in areas including feedstock availability, upgrading technology, process economics, lifecycle GHG analysis, and commercial progress (Bauen, Howes, et al. 2009; Hileman, Ortiz, et al. 2009; International Air Transport Association 2010; Rye, Blakey, et al. 2010; Agusdinata, Zhao, et al. 2011; Leuphana 2011; Whitman, Yanni, et al. 2011; European Biofuels Technology Platform 2012; Rosillo-Calle, Thrän, et al. 2012). Most literature has focused on approved technologies such as Fischer-Tropsch (FT) synthesis and hydroprocessed renewable jet (HRJ) processes; few literature references are available for either ATJ or STJ processes because they are still in the development stage.
5 This report is available at no cost from the National Renewable Energy Laboratory (NREL) at www.nrel.gov/publications.
Table 1. Summary of Jet Fuel Production Pathways Reviewed in this Work Category Pathways Companies U.S. or International
Agencies Airline Companies/Manufacturers
Alcohol-to-Jet (ATJ)
Ethanol-to-Jet Terrabon/MixAlco; Lanza Tech/Swedish Biofuels ; Coskata
Defense Advanced Research Projects Agency, FAA
Boeing, Virgin Atlantic
Butanol-to-Jet Gevo; Byogy; Albemarle/Cobalt; Solazyme
U.S. Navy/NAWCWD, AFRL, DLA, USAF
Continental Airlines ; United Airlines
Oil-to-Jet (OTJ) Hydroprocessed Renewable Jet (HRJ)
UOP; SG Biofuels; AltAir Fuels; Agrisoma Biosciences; Neste Oil; PetroChina; Sapphire Energy, Syntroleum/Tyson Food; PEMEX ; ASA
U.S. Navy, USAF, Netherland Air Force, NASA, Dutch Military, EADs
Boeing, Lufthansa, Virgin Atlantic, Virgin Blue, GE Aviation, Air New Zealand, Rolls-Royce, Continental, CFM, JAL, Airbus, KLM, Pratt & Whitney, Air China, TAM Airlines, Jet Blue Airways, IAE, United Airlines, Air France, Finnair, Air Mexico, Thomson Airways, Porter Airlines, Alaska Airlines, Horizon Air, Etihad Airways, Romanian Air, Bombardier
Catalytic Hydrothermolysis (CH)
Applied Research Assoc., Aemetis/Chevron Lummus Global
FAA CLEEN, NRC Canada, AFRL
Rolls-Royce, Pratt & Whitney
Hydrotreated Depolymerized Cellulosic Jet (Pyrolysis or HDCJ)
Kior/Hunt Refining/Petrotech, Envergent, GTI, Dynamotive
FAA N/A
Gas to Jet (GTJ) FT Synthesis Syntroleum; SynFuels; Rentech; Shell; Solena
U.S. DOE, U.S. DOD, USAF, Ontario government
Qatar Airways, United Airlines, Airbus, British Airways
Gas Fermentation Coskata; INEOS Bio/Lanza Tech; Swedish Biofuels
N/A Virgin Atlantic
Sugar to Jet (STJ) Catalytic Upgrading of Sugar to Jet
Virent/Shell, Virdia AFRL, U.S. DOE N/A
Direct Sugar Biological to Hydrocarbons
Amyris/Total, Solazyme, LS9
U.S. Navy, FAA Boeing; Embraer; Azul Airlines; GE; Trip Airlines
6 This report is available at no cost from the National Renewable Energy Laboratory (NREL) at www.nrel.gov/publications.
Many process technologies that convert biomass-based materials into jet fuel substitutes are available. Some are available at commercial or pre-commercial scale, and others are still in the research and development stage. These technologies are varied and depend strongly on the type of feedstock. Oil-based feedstocks are converted into biojet fuels through hydroprocessing technologies, including hydrotreating, deoxygenation, and isomerization and hydrocracking. Processes such as catalytic hydrothermolysis (CH) have also been developed to treat triglyceride-based oils. Solid-based feedstocks are converted into biomass-derived intermediate through gasification, into alcohols through biochemical or thermochemical processes, into sugars through biochemical processes, and into bio-oils through pyrolysis processes. Syngas, alcohols, sugars, and bio-oils can be further upgraded to biojet fuel via a variety of synthesis, either fermentative or catalytic processes. So far, biojet fuels from Fischer-Tropsch biomass-to-liquid (FT BTL) synthesis and hydroprocessed esters and fatty acids (HEFA) have been approved by ASTM International (ASTM) Method D7566 for blending into jet at levels up to 50% (IEA 2012). Hydroprocessing technologies using vegetable and waste oils represent the only conversion pathways that are ready for large-scale deployment (Leuphana 2011). Industries are currently working on developing optimal processes that utilize sustainable feedstocks and can be produced economically.
Production cost is a key parameter of the commercial feasibility of a biojet fuel. U.S. passenger and cargo airlines consume more than 20 billion gallons of jet fuel annually. Therefore, every penny increase in the price of jet fuel results in an additional $200 MM in annual fuel costs for U.S. airlines (Airlines for America 2013). In 2012, the annual fuel cost for all airlines was around $47 billion (Research and Innovative Technology Administration and Bureau of Transportation Statustics 2013). It is predicted that by 2030, the biojet fuel production cost may drop to as low as $2.5/gal due to improved conversion technology (Caldecott and Tooze 2009), and 30% of annual airline fuel consumption can be replaced by biojet fuel (Air Transportation Action Group 2009). Following the same pattern for bioethanol production (Gnansounou and Dauriat 2010), the variation in the biojet production cost would be highly dependent on the following parameters: (a) composition and cost of feedstock; (b) process design; (c) conversion efficiency or product yield; (d) valorization of co-products; and (e) energy conservation. Therefore, decreasing the production cost of biojet fuel depends on synergistic efforts in all areas, including improvements in the areas of feedstock productivity, extraction yield of oil or sugar yield from the crops, process energy conservation, and balance between jet fuel product and value-added co-products.
In addition, there is a growing awareness of important environmental issues, including improving air quality in and around airports and determining the aviation industry’s contribution to GHG emissions globally. Aircraft emissions strongly impact the GHG emissions that lead to climate change. It has been estimated that commercial aviation has contributed approximately 2%–6% to total global carbon emissions (Rosillo-Calle, Thrän, et al. 2012). Atmospheric emissions from aircraft are (a) direct emissions such as carbon dioxide (CO2) and water vapor; (b) emission of oxidizing chemical species, such as oxides of nitrogen (NOx); and (c) emission of substances that trigger the generation of aerosol particles or lead to changes in natural clouds, such as contrails (Rosillo-Calle, Thrän, et al. 2012). Jet fuels derived from renewable resources may offer the potential to reduce the GHG emissions from aviation industry.
7 This report is available at no cost from the National Renewable Energy Laboratory (NREL) at www.nrel.gov/publications.
A life cycle assessment (LCA) that considers emissions from the field where the feedstock is harvested to the wake behind the aircraft can identify the change in GHG emissions due to the use of alternative fuels (Stratton, Wong, et al. 2010), usually known as well-to-wake (WTW) analysis. The WTW analysis can be split into two parts: well-to-tank and tank-to-wake (Bauen, Howes et al. 2009). To compare the GHG emissions from biojet fuels with those of conventional jet fuels, it is necessary to consider emissions from the whole production supply chain. In the well-to-tank portion, feedstock production, land use change, and conversion processes contribute significantly to GHG emissions. In the tank-to-wake portion, emissions from burning jet fuels are considered (Bauen, Howes, et al. 2009). The WTW GHG emissions from conventional jet fuel are reported to be 14.3 grams carbon dioxide equivalent/megajoule (gCO2e/MJ) for well-to-tank GHG emissions and 73.2 gCO2e/MJ for tank-to-well GHG emissions (Skone and Gerdes 2008), summing up to a total of 87.5 grams CO2 equivalent per megajoule (gCO2e/MJ) (Skone and Gerdes 2008; Hileman 2009). When biojet fuel is used for aviation, the GHG emissions can be reduced to 8.5 gCO2e/MJ (produced from sugar cane), a 90% reduction relative to conventional jet fuel (Moreira, Gurgel, et al. 2014). Different conversion technologies may result in different amounts and types of GHG emissions due to the variety of feedstocks and reaction processes. Reviewing the GHG emissions data from the conversion pathways will help determine the optimal platforms for producing biojet fuel.
Groups such as aircraft manufacturers, airline companies, academic institutions, fuel refining companies, agricultural companies, farmers groups, and local/regional/national departments of agriculture, defense, transport, economic development, and enterprise are working together to develop commercially feasible biojet fuel (Air Transportation Action Group 2012). The level of biojet fuel commercialization depends on feedstock availability, conversion technology development, reduction of GHG emissions, and policy. Conversion technologies for transportation biofuels such as ethanol and biodiesel have been reviewed and compared extensively (Bender 1999; Department of Energy 2011). For future development and deployment of biojet fuel, it is important to review and understand the maturity and uncertainty of all pathways to assess impacts on commercialization.
1.3 Jet Fuel Specifications, Combustion, and Engine Tests In addition to defined target compositions, jet fuel specifications and requirements are mostly defined in terms of required performance properties. The specifications required for jet fuels are (1) acceptable minimum energy density by mass, (2) maximum allowable freeze point temperature, (3) maximum allowable deposits in standard heating tests, (4) maximum allowable viscosity, (5) maximum allowable sulfur and aromatics content, (6) maximum allowable amount of wear in standardized test, (7) maximum acidity and mercaptan concentration, (8) minimum aromatics content, (9) minimum fuel electrical conductivity, and (10) minimum allowable flash point (U.S. Department of Defense 2011). There are three standards for certifying aviation fuel: ASTM D1655, International Air Transport Association Guidance Material (Kerosene Type), and the United Kingdom Ministry of Defence, Defence Standard (Def Stan) 91-91 (ONGC and Quality Control Laboratory 2008; Agusdinata, Zhao, et al. 2011; American Society for Testing and Materials 2013). ASTM Specification D7566 (Standard Specification for Aviation Turbine Fuel Containing Synthesized Hydrocarbons), which targets alternative jet fuel, lists the fuel properties and criteria required to control the production and quality of a renewable fuel for aviation safety (American Society for Testing and Materials 2013).
8 This report is available at no cost from the National Renewable Energy Laboratory (NREL) at www.nrel.gov/publications.
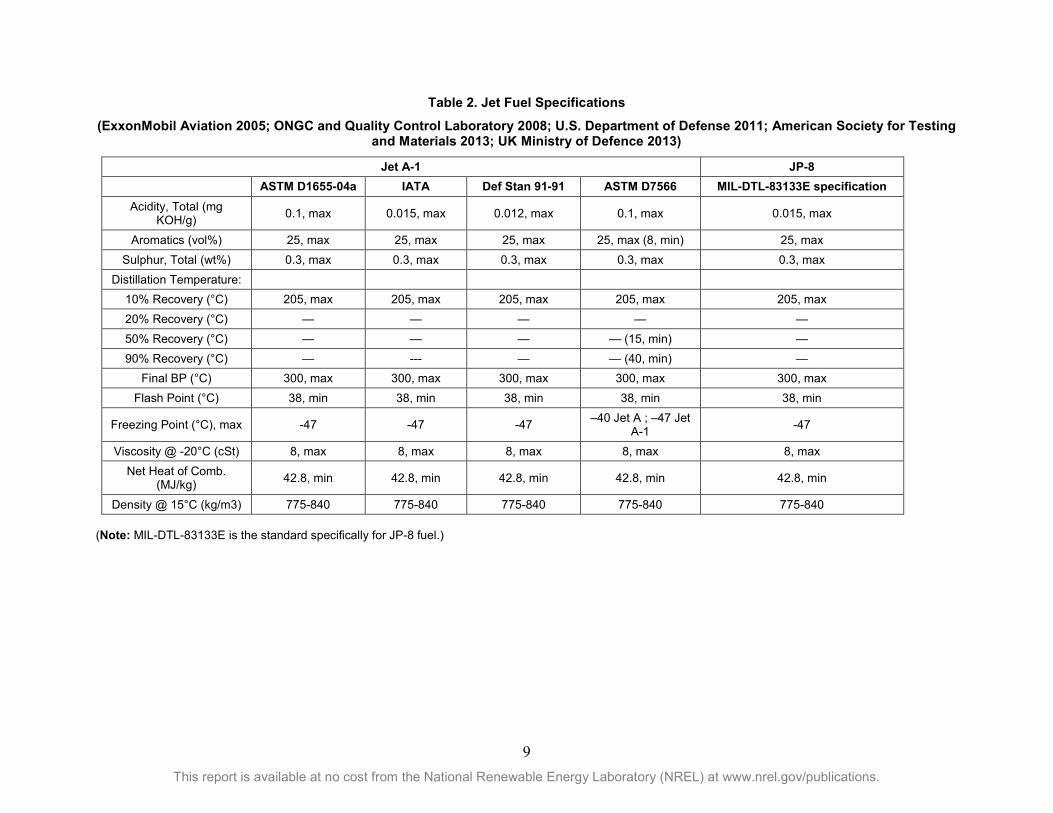
Table 2 shows the jet specifications for two typical jet fuels for commercial (Jet A) and military aircraft (JP-8). Jet A-1 is a civilian grade nearly identical to JP-8. Jet fuel requires a high flash point for the fire-hazard consideration (ExxonMobil Aviation 2005). Detailed specifications can be found in the documentations from ASTM. Major fuel properties are similar across different standards, but there are some differences. For instance, D7566 is an expansion of D1655 to include fuel specifications required of the synthetic paraffinic kerosene (SPK) blendstocks. ASTM D1655 (Table 2) is for conventional jet fuel from petroleum and ASTM D7566 is for jet fuel with SPK blending. IATA is the International Air Transport Association Guidance Material, Def Stan 91-91 is the United Kingdom Ministry of Defense, and Defense Standard. MIL-DTL-83133E is military turbine fuels, for JP-8.
The jet fuel cannot be mixed with diesel; it is kerosene-based with specified carbon chain length, and has a relatively higher flash point due to fire-hazard consideration and relatively lower freeze point to ensure good cold flow properties at high altitude. In addition, jet fuel needs to meet cold flow properties, such as a lower freezing point, to ensure the fuel can flow at high altitude (ASTM International 2013).
9 This report is available at no cost from the National Renewable Energy Laboratory (NREL) at www.nrel.gov/publications.
Table 2. Jet Fuel Specifications
(ExxonMobil Aviation 2005; ONGC and Quality Control Laboratory 2008; U.S. Department of Defense 2011; American Society for Testing and Materials 2013; UK Ministry of Defence 2013)
Jet A-1 JP-8 ASTM D1655-04a IATA Def Stan 91-91 ASTM D7566 MIL-DTL-83133E specification
Acidity, Total (mg KOH/g) 0.1, max 0.015, max 0.012, max 0.1, max 0.015, max
Aromatics (vol%) 25, max 25, max 25, max 25, max (8, min) 25, max Sulphur, Total (wt%) 0.3, max 0.3, max 0.3, max 0.3, max 0.3, max
Distillation Temperature: 10% Recovery (°C) 205, max 205, max 205, max 205, max 205, max 20% Recovery (°C) — — — — — 50% Recovery (°C) — — — — (15, min) — 90% Recovery (°C) — --- — — (40, min) —
Final BP (°C) 300, max 300, max 300, max 300, max 300, max Flash Point (°C) 38, min 38, min 38, min 38, min 38, min
Freezing Point (°C), max -47 -47 -47 –40 Jet A ; –47 Jet A-1 -47
Viscosity @ -20°C (cSt) 8, max 8, max 8, max 8, max 8, max Net Heat of Comb.
(MJ/kg) 42.8, min 42.8, min 42.8, min 42.8, min 42.8, min
Density @ 15°C (kg/m3) 775-840 775-840 775-840 775-840 775-840 (Note: MIL-DTL-83133E is the standard specifically for JP-8 fuel.)
10 This report is available at no cost from the National Renewable Energy Laboratory (NREL) at www.nrel.gov/publications.
Combustion characteristics of alternative and conventional jet fuels have been investigated in many literatures (Kahandawala, DeWitt, et al. 2008; Kumar and Sung 2010; Allen, Toulson, et al. 2012; Hui, Kumar, et al. 2012; Wang and Oehlschlaeger 2012; Allen, Valco, et al. 2013). Derived cetane numbers (DCNs), autoignition characteristics, laminar flame speeds, and extinction stretch rates of conventional jet fuel and alternative jet fuels derived from FT and hydroprocessing of oil are experimentally determined (Hui, Kumar, et al. 2012). The DCNs of alternative jet fuels are higher than conventional jet fuel because conventional jet fuel contains more than 20% of aromatics. The alternative fuels with higher n-paraffin content will be more reactive, resulting in higher DCNs. The ignition behavior, which depends strongly on the fuel composition and structure, shows that alternative fuels have shorter ignition delay than conventional jet fuel (Kumar and Sung 2010; Allen, Toulson, et al. 2012; Hui, Kumar, et al. 2012; Wang and Oehlschlaeger 2012; Allen, Valco, et al. 2013), and the pressure increase due to ignition in the combustion chamber is higher than that of convention jet fuel (Hui, Kumar, et al. 2012). The amount of n-paraffins contained in the fuels determines the order of ignition delay (Hui, Kumar, et al. 2012). On the other hand, Allen et al. (Allen, Valco, et al. 2013) suggested that the ignition properties depend on the cycloparaffin content and the fraction of higher hydrocarbons. For the laminar flame speed, which is controlled by the heat of combustion, there is no difference between conventional and alternative jet fuels (Hui, Kumar, et al. 2012). For the extinction stretch rates, camelina-derived jet fuel is 8% higher in resistance to extinction than conventional Jet A. The amount of aromatics is the cause of lower resistance because aromatics, which have slow decomposition of aromatic rings and therefore lower reactivity, are less resistant to extinction than paraffins (Kumar and Sung 2010; Won, Dooley, et al. 2011; Hui, Kumar, et al. 2012).
The impacts of biojet fuel on engine performance, operability, hardware, and emissions are also studied (Rahmes, Kinder, et al. 2009; Quintero, Ricklick, et al. 2012). For the engine performance tests, the Bio-SPK derived from jatropha and algae shows an improvement in the specific fuel consumption and fuel flow compared to the Jet A (Rahmes, Kinder, et al. 2009).The 25% and 50% Bio-SPK blends demonstrate the reduction in fuel flow by 0.7% and 1.2%, respectively (Rahmes, Kinder, et al. 2009). There are no significant differences in engine acceleration response time with these blends. For the emission tests, there is a slight reduction in NOx by 1%–5% due to the differences in ambient conditions and flame characteristics. The emissions of carbon monoxide (CO) and unburned hydrocarbons are increased by 5%–9% and 20%–45%, respectively, because of the reduction of flame temperature, the influence of spray quality and flame location (Rahmes, Kinder, et al. 2009). The smoke emission is reduced by 13%–30% due to the lower aromatic content and higher H/C ratio (Rahmes, Kinder, et al. 2009). In addition, there is no engine degeneration or unusual odors found when testing the biojet fuel in engines. However, the lack of aromatic components could lead to damage to the elastomer materials in the fuel system (Rahmes, Kinder, et al. 2009). Blending the biojet with conventional jet fuels would ensure elastomer swelling.
1.4 Renewable Fuel Standard, Biofuel Production Tax Credits, and Jet Fuel Certification
In 2007, the U.S. Congress passed the Energy Independence and Security Act (EISA) of 2007 (U.S. Congress 2007), which was intended to increase U.S. energy independence and reduce GHG emissions. In 2011, the Environmental Protection Agency (EPA) implemented the
11 This report is available at no cost from the National Renewable Energy Laboratory (NREL) at www.nrel.gov/publications.
Renewable Fuel Standard 2 (RFS2)1 program in order to meet EISA 2007 requirements (EPA 2010). The RFS2 program consists of a system of annual volumetric requirements for biofuel use by petroleum fuel (i.e., gasoline and diesel)2 producers and importers. The four biofuel categories required are (EPA 2010):
• Renewable fuel: Biomass-based fuel with lifecycle GHG emissions that are at least 20% less than the petroleum fuel replaced
• Advanced biofuel: Biomass-based fuel, other than corn starch ethanol, that has lifecycle GHG emissions that are at least 50% less than the petroleum fuel replaced
• Biomass-based diesel: Biomass-based renewable diesel or biodiesel fuel that has lifecycle GHG emissions that are at least 50% less than the petroleum fuel replaced
• Cellulosic biofuel: Biomass-based fuel from cellulosic biomass that has lifecycle GHG emissions that are at least 60 percent less than the petroleum fuel replaced.
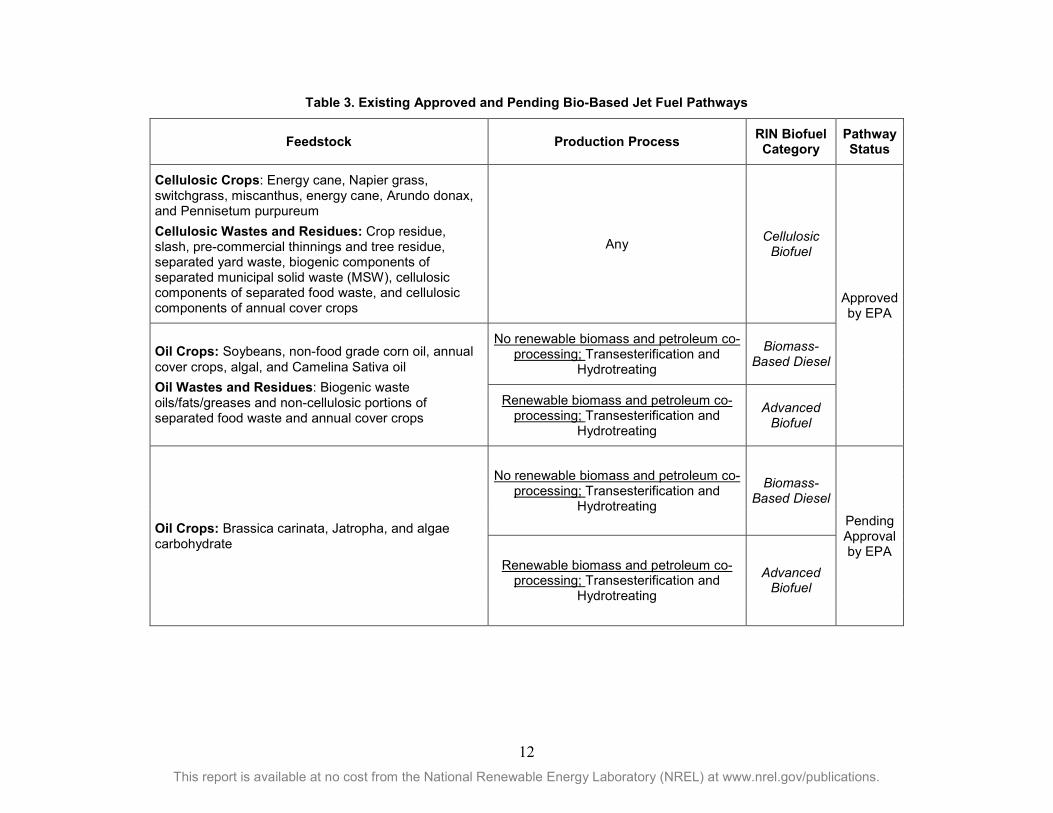
The RFS2 program also consists of a credit trading system. In 2007, EISA required EPA to create a credit program that allows for the generation of credits that may be used to demonstrate compliance with volumetric requirements or to be traded on a credit market (EISA 2007). Renewable identification numbers (RINs) are the basis of the RFS2 program’s credit trading systems. Each RIN is classified as one of the four biofuel categories listed above. Table 3 shows jet fuel pathways and the RIN biofuel category produced.
1 The Energy Independence and Security Act of 2007 modified the Energy Policy Act of 2005 passed by congress (U.S. Congress 2005), which led to the establishment of the Renewable Fuel Standard (RFS1) program. 2 The RFS2 program does directly regulate petroleum jet fuel production or import.
12 This report is available at no cost from the National Renewable Energy Laboratory (NREL) at www.nrel.gov/publications.
Table 3. Existing Approved and Pending Bio-Based Jet Fuel Pathways
Feedstock Production Process RIN Biofuel Category
Pathway Status
Cellulosic Crops: Energy cane, Napier grass, switchgrass, miscanthus, energy cane, Arundo donax, and Pennisetum purpureum Cellulosic Wastes and Residues: Crop residue, slash, pre-commercial thinnings and tree residue, separated yard waste, biogenic components of separated municipal solid waste (MSW), cellulosic components of separated food waste, and cellulosic components of annual cover crops
Any Cellulosic Biofuel
Approved by EPA
Oil Crops: Soybeans, non-food grade corn oil, annual cover crops, algal, and Camelina Sativa oil Oil Wastes and Residues: Biogenic waste oils/fats/greases and non-cellulosic portions of separated food waste and annual cover crops
No renewable biomass and petroleum co-processing; Transesterification and
Hydrotreating
Biomass-Based Diesel
Renewable biomass and petroleum co-processing; Transesterification and
Hydrotreating
Advanced Biofuel
Oil Crops: Brassica carinata, Jatropha, and algae carbohydrate
No renewable biomass and petroleum co-processing; Transesterification and
Hydrotreating
Biomass-Based Diesel
Pending Approval by EPA
Renewable biomass and petroleum co-processing; Transesterification and
Hydrotreating
Advanced Biofuel
13 This report is available at no cost from the National Renewable Energy Laboratory (NREL) at www.nrel.gov/publications.
The market prices of each RIN biofuel category are interdependent because of the "nesting" of RIN biofuel categories. Nesting refers to the fact that biomass-based diesel and cellulosic biofuel RINs can be used to demonstrate compliance for the required volumes of advanced biofuel and renewable biofuel. Advanced biofuel RINs can be used to demonstrate compliance for the required volumes of renewable fuel. Therefore, the RIN market price of renewable fuel will not be higher than other biofuel categories, and an advanced biofuel RIN will not be priced higher than a biomass-based diesel and cellulosic biofuel RIN.
The market price for a RIN indirectly impacts revenue for the generator of the RIN (i.e., the biofuel producer or importer). Usually, the generator of the RIN does not trade the RIN they generate on the RIN market. The RIN remains attached to the biofuel until the fuel is used as a "transportation fuel, heating oil, or jet fuel" blended with petroleum fuel, or obtained by a petroleum fuel producer or importer (EPA 2010). RIN market prices increase the willingness to pay for the biofuel.
Roughly 1.7 billion RINs3 would be generated if the FAA goal (Elgowainy, Han, et al. 2012) of replacing 1 billion gallons of petroleum jet fuel with alternative jet fuel in 2018 are met. In 2014, RIN prices for all biofuel categories ranged between about $0.5 and $1.0 per RIN. The 1.7 billion RINs could generate between $0.8 billion to $1.6 billion in revenue when using 2014 prices, depending on the feedstocks and production processes used to produce the bio-based jet fuel. Three federal biofuel production tax credits potentially apply to biomass-derived jet fuel (Department of Energy 2015):
• The "Biodiesel Income Tax Credit" is $1.0/gal of pure biodiesel or renewable diesel fuel consumed
• The "Biodiesel Mixture Excise Tax Credit" is the same tax credit (i.e., $1.0/gal of fuel) except for blended biodiesel or renewable diesel fuel
• The "Second Generation Producer Tax Credit" is $1.0/gal of non-alcohol cellulosic-based biofuel produced.
All biofuel tax credits lapsed at the beginning of 2015. However, these lapsed biofuel taxes credits and tariffs have historically been retroactively reinstated (Department of Energy 2015).
Technical certification of alternative fuels is primarily led by ASTM with support from CAAFI and the U.S. Air Force. In 2009, ASTM approved fuels produced by the Fischer-Tropsch process as the first biojet fuel for use in commercial flights, up to a blend percentage of 50% (Bauen, Howes, et al. 2009; Zheng, Li, et al. 2009; de Klerk 2010; Viljoen and Ajam 2012; IATA 2015). Biojet fuels from hydroprocessing technologies such as HEFA or HRJ and also for up to a 50% blending ratio were approved in 2011. In June 2014, the third production pathway for biojet fuel was approved by ASTM, namely "Synthetic Iso-paraffin from Fermented Hydroprocessed Sugar (SIP)," (also known as Direct Sugar to Hydrocarbon [DSHC] fuel) (IATA 2015). All these certifications are under the ASTM D7566 specification, which are recognized automatically as 3 One RIN is equivalent to a gallon of ethanol-equivalent fuel, and one gallon of bio-based jet is about 1.7 gallons of ethanol-equivalent fuel.
14 This report is available at no cost from the National Renewable Energy Laboratory (NREL) at www.nrel.gov/publications.
meeting the ASTM D1655 specification for conventional jet fuel (IATA 2015). There are three pathways approved by ASTM by year 2015, and many others are currently being tested for the certification process. The next section discusses previous and current commercial and military flight tests using biojet fuels.
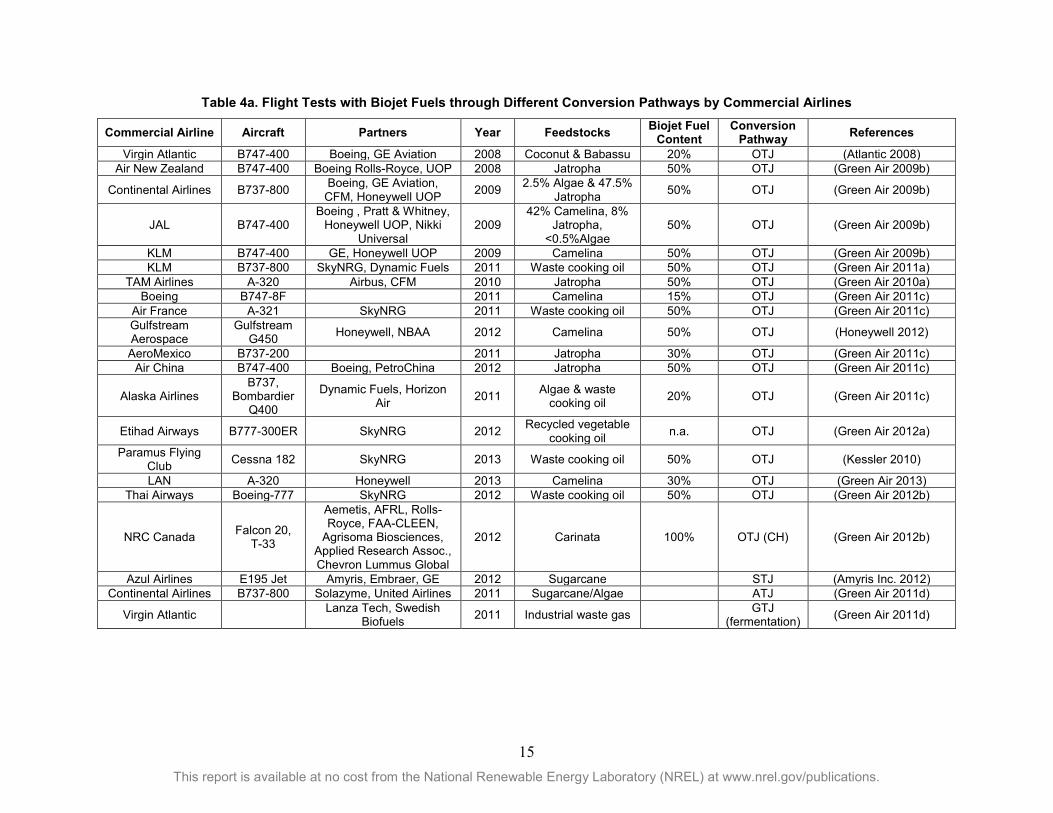
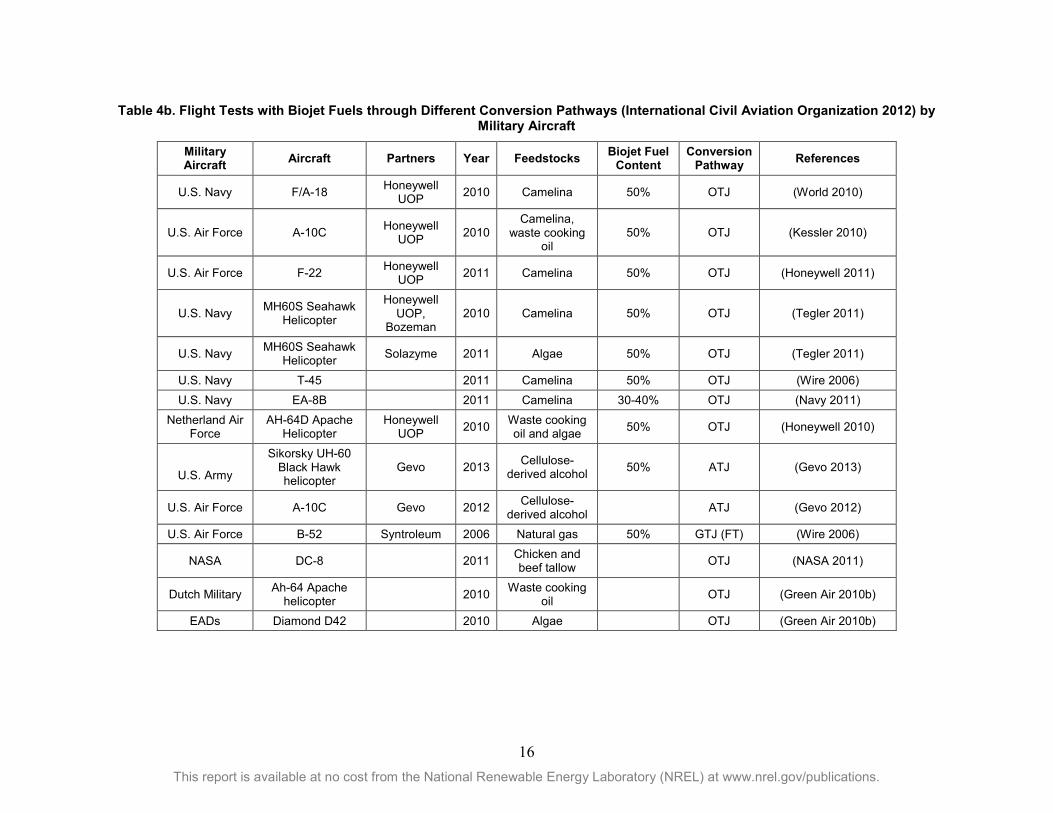
1.5 Bio-Derived Jet Fuel Flight Tests Biojet fuels from OTJ (HRJ or HEFA), ATJ, and GTJ (either via FT synthesis or gas fermentation) have been used for commercial (shown in Table 4a) and military flights (shown in Table 4b). The first commercial-scale biofuel plant in the United States, Dynamic Fuels, a 50/50 joint venture between Syntroleum and Tyson Food, achieved production of 5.4 MM gallons per month of renewable fuels, which equals to 65 MM gallons per year (Syntroleum 2012).
Conversion of ATJ has also been developed at commercial scale and was flight-tested by the U.S. Air Force in July 2012 (Wright, Harvey, et al. 2008; Byogy Renewables 2011; Gevo 2011; EcoSeed 2012; Synfuels International Inc. 2013). The ATJ process is expected to be approved by 2013–2014 (Byogy Renewables 2011). Fuel produced by two recently proposed sugar-to-jet (STJ) fuel processes—fermentation of sugars to hydrocarbons (Department of Energy 2012) and catalytic conversion of sugars to fuels (Department of Energy 2012)—have been developed in joint ventures by biofuel and oil companies (Blommel, Keenan, et al. 2008; Newsmax 2011; Bauldreay 2012; Knovel 2012; Nassar, Granco, et al. 2012; Timmer 2012; Total and Amyris 2012; Virent 2012). Two recently proposed processes, catalytic hydrothermolysis (CH) and hydrotreated depolymerized cellulosic jet (HDCJ), also called pyrolysis, have not yet been approved by ASTM, but several companies and research institutes are working on this technology (Applied Research Associates Inc. 2011; Applied Research Associates Inc. 2012; Biodiesel Magazine 2012; Elgowainy, Han, et al. 2012).
15 This report is available at no cost from the National Renewable Energy Laboratory (NREL) at www.nrel.gov/publications.
Table 4a. Flight Tests with Biojet Fuels through Different Conversion Pathways by Commercial Airlines
Commercial Airline Aircraft Partners Year Feedstocks Biojet Fuel Content
Conversion Pathway References
Virgin Atlantic B747-400 Boeing, GE Aviation 2008 Coconut & Babassu 20% OTJ (Atlantic 2008) Air New Zealand B747-400 Boeing Rolls-Royce, UOP 2008 Jatropha 50% OTJ (Green Air 2009b)
Continental Airlines B737-800 Boeing, GE Aviation, CFM, Honeywell UOP 2009 2.5% Algae & 47.5%
Jatropha 50% OTJ (Green Air 2009b)
JAL B747-400 Boeing , Pratt & Whitney,
Honeywell UOP, Nikki Universal
2009 42% Camelina, 8%
Jatropha, <0.5%Algae
50% OTJ (Green Air 2009b)
KLM B747-400 GE, Honeywell UOP 2009 Camelina 50% OTJ (Green Air 2009b) KLM B737-800 SkyNRG, Dynamic Fuels 2011 Waste cooking oil 50% OTJ (Green Air 2011a)
TAM Airlines A-320 Airbus, CFM 2010 Jatropha 50% OTJ (Green Air 2010a) Boeing B747-8F 2011 Camelina 15% OTJ (Green Air 2011c)
Air France A-321 SkyNRG 2011 Waste cooking oil 50% OTJ (Green Air 2011c) Gulfstream Aerospace
Gulfstream G450 Honeywell, NBAA 2012 Camelina 50% OTJ (Honeywell 2012)
AeroMexico B737-200 2011 Jatropha 30% OTJ (Green Air 2011c) Air China B747-400 Boeing, PetroChina 2012 Jatropha 50% OTJ (Green Air 2011c)
Alaska Airlines B737,
Bombardier Q400
Dynamic Fuels, Horizon Air 2011 Algae & waste
cooking oil 20% OTJ (Green Air 2011c)
Etihad Airways B777-300ER SkyNRG 2012 Recycled vegetable cooking oil n.a. OTJ (Green Air 2012a)
Paramus Flying Club Cessna 182 SkyNRG 2013 Waste cooking oil 50% OTJ (Kessler 2010)
LAN A-320 Honeywell 2013 Camelina 30% OTJ (Green Air 2013) Thai Airways Boeing-777 SkyNRG 2012 Waste cooking oil 50% OTJ (Green Air 2012b)
NRC Canada Falcon 20, T-33
Aemetis, AFRL, Rolls-Royce, FAA-CLEEN,
Agrisoma Biosciences, Applied Research Assoc., Chevron Lummus Global
2012 Carinata 100% OTJ (CH) (Green Air 2012b)
Azul Airlines E195 Jet Amyris, Embraer, GE 2012 Sugarcane STJ (Amyris Inc. 2012) Continental Airlines B737-800 Solazyme, United Airlines 2011 Sugarcane/Algae ATJ (Green Air 2011d)
Virgin Atlantic Lanza Tech, Swedish
Biofuels 2011 Industrial waste gas GTJ
(fermentation) (Green Air 2011d)
16 This report is available at no cost from the National Renewable Energy Laboratory (NREL) at www.nrel.gov/publications.
Table 4b. Flight Tests with Biojet Fuels through Different Conversion Pathways (International Civil Aviation Organization 2012) by Military Aircraft
Military Aircraft Aircraft Partners Year Feedstocks Biojet Fuel
Content Conversion
Pathway References
U.S. Navy F/A-18 Honeywell UOP 2010 Camelina 50% OTJ (World 2010)
U.S. Air Force A-10C Honeywell UOP 2010
Camelina, waste cooking
oil 50% OTJ (Kessler 2010)
U.S. Air Force F-22 Honeywell UOP 2011 Camelina 50% OTJ (Honeywell 2011)
U.S. Navy MH60S Seahawk Helicopter
Honeywell UOP,
Bozeman 2010 Camelina 50% OTJ (Tegler 2011)
U.S. Navy MH60S Seahawk Helicopter Solazyme 2011 Algae 50% OTJ (Tegler 2011)
U.S. Navy T-45
2011 Camelina 50% OTJ (Wire 2006) U.S. Navy EA-8B
2011 Camelina 30-40% OTJ (Navy 2011)
Netherland Air Force
AH-64D Apache Helicopter
Honeywell UOP 2010 Waste cooking
oil and algae 50% OTJ (Honeywell 2010)
U.S. Army
Sikorsky UH-60 Black Hawk helicopter
Gevo 2013 Cellulose-derived alcohol 50% ATJ (Gevo 2013)
U.S. Air Force A-10C Gevo 2012 Cellulose-derived alcohol
ATJ (Gevo 2012)
U.S. Air Force B-52 Syntroleum 2006 Natural gas 50% GTJ (FT) (Wire 2006)
NASA DC-8
2011 Chicken and beef tallow
OTJ (NASA 2011)
Dutch Military Ah-64 Apache helicopter
2010 Waste cooking oil
OTJ (Green Air 2010b)
EADs Diamond D42
2010 Algae
OTJ (Green Air 2010b)
17 This report is available at no cost from the National Renewable Energy Laboratory (NREL) at www.nrel.gov/publications.
In summary, to fully understand the current biomass-to-jet fuel development, it is necessary to have an overview of the state of technology for all the biojet pathway technologies, either the three approved pathways or those for which approval is pending. For the categories defined in previous section, analysis and reviews are performed for ATJ, OTJ, GTJ, and STJ in each individual section. Please note that some pathway technologies may belong to two categories defined here, but will be discussed in only one section to avoid redundancy. For instance, alcohol is derived from cellulosic sugar, but alcohol upgrading to jet pathways are discussed in the ATJ section, not in the STJ section. Detailed information and literature data, such as potential feedstocks, process technologies, cost analysis comparisons, life-cycle assessment studies, and pre-commercial or commercial demonstrations for each pathway, are described and analyzed in the following sections.
18 This report is available at no cost from the National Renewable Energy Laboratory (NREL) at www.nrel.gov/publications.
2 Conversion Pathways to Biojet Fuel 2.1 Alcohol-to-Jet (ATJ) Fuel ATJ fuel, also called alcohol oligomerization, is fuel converted from alcohols such as methanol, ethanol, butanol, and long-chain fatty alcohols. The maximum use of ethanol is 10%-15% for the majority of gasoline-powered vehicles on the road today, which creates a blend wall that makes it difficult to achieve further market penetration of ethanol as a blend stock for gasoline. Therefore, upgrading ethanol to jet fuel blend stock presents a potential pathway for developing drop-in or fungible fuels for the jet fuel market. In this review, ethanol and butanol are the two primary alcohols discussed for jet fuel conversion.
2.1.1 Feedstocks Alcohols can be produced through many conversion pathways, but each pathways starts with a biomass feedstock. Feedstock choice can impact many factors such as pretreatment methods, microorganism choice, alcohol yield, and process economics. Feedstocks used for alcohol production include fermentable sugars such as sugar cane and sugar beet, hydrolyzed grain starch from wheat or corn, hydrolyzed polysaccharides from lignocellulosic biomass, or wood sent through thermochemical conversion (Cardona and Sanchez 2007; Dutta, Talmadge, et al. 2011; Phillips, Tarud, et al. 2011). The majority of fuel-alcohol in the United States is produced from fermented corn grain (Cardona and Sanchez 2007). Once produced, alcohols can then be further processed into aviation fuel.
Ethanol is the main fuel-alcohol produced commercially in the United States, with 14.3 billion gallons produced in 2014 (Renewable Fuels Association 2015). In addition to corn grain, lignocellulosic biomass is a widely available feedstock that can be converted into ethanol. Several commercial production facilities that use lignocellulosic biomass as the main feedstock to produce ethanol are in operation or under construction today including Abengoa Bioenergy Corp. in Hugoton, Kansas; DuPont in Nevada, Iowa; INEOS Bio – Indian River Bioenergy in Vero Beach, Florida; and Project Liberty in Emmetsburg, Iowa (Renewable Fuels Association 2015). Ethanol can be produced both biochemically (using chemicals, enzymes, and fermentative microorganisms) and through thermochemical conversion (using heat and chemicals) (Dutta, Talmadge, et al. 2011; Humbird, Davis, et al. 2011). In the biochemical process, the cellulose and hemicellulose are enzymatically hydrolyzed into soluble sugars and then fermented by yeast or bacteria to produce ethanol (Wyman 1996; Lloyd and Wyman 2005; Dutta, Dowe, et al. 2010; Kazi, Fortman, et al. 2010; Humbird, Davis, et al. 2011). Conversely, the thermochemical process produces ethanol via gasification and mixed alcohol synthesis (Phillips 2007; Dutta, Talmadge, et al. 2011). One drawback to ethanol is its low compatibility as a blendstock for aviation fuel because of its high volatility, high water absorption, low flash point, corrosion, and elastomeric decomposition (Hileman, Ortiz, et al. 2009). In addition, ethanol’s energy density is 40% lower than conventional jet fuel, and if an aircraft shifted to using ethanol instead of Jet A the operational capabilities of the aircraft would be reduced by 5%–55% (depending on aircraft type). To be considered an aviation fuel blendstock or replacement, ethanol needs to be upgraded to high-grade, long-chain kerosene. Nevertheless, ethanol should still be considered as an intermediate to jet fuel because of the maturity of the ethanol industry and availability of ethanol.
Other interest in alcohols to fuels is via butanol, a four carbon alcohol. Butanol as a blendstock can lower the vapor pressure of gasoline, is less miscible with water and is simple to store
19 This report is available at no cost from the National Renewable Energy Laboratory (NREL) at www.nrel.gov/publications.
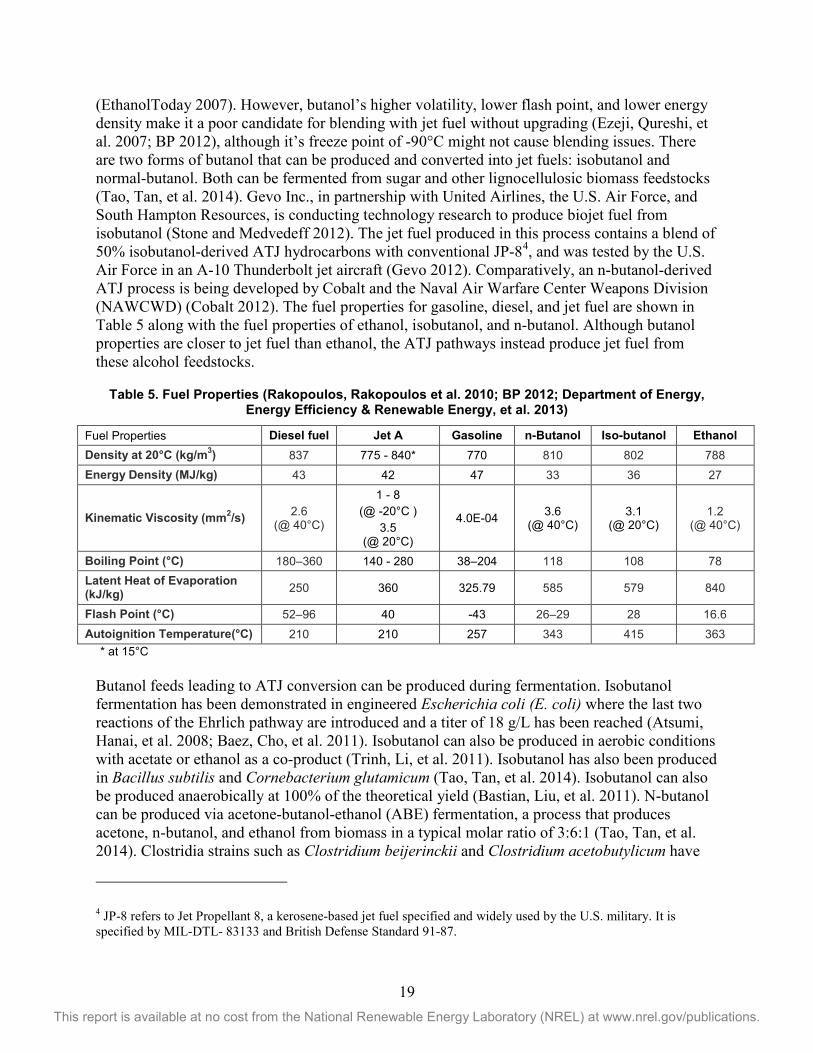
(EthanolToday 2007). However, butanol’s higher volatility, lower flash point, and lower energy density make it a poor candidate for blending with jet fuel without upgrading (Ezeji, Qureshi, et al. 2007; BP 2012), although it’s freeze point of -90°C might not cause blending issues. There are two forms of butanol that can be produced and converted into jet fuels: isobutanol and normal-butanol. Both can be fermented from sugar and other lignocellulosic biomass feedstocks (Tao, Tan, et al. 2014). Gevo Inc., in partnership with United Airlines, the U.S. Air Force, and South Hampton Resources, is conducting technology research to produce biojet fuel from isobutanol (Stone and Medvedeff 2012). The jet fuel produced in this process contains a blend of 50% isobutanol-derived ATJ hydrocarbons with conventional JP-84, and was tested by the U.S. Air Force in an A-10 Thunderbolt jet aircraft (Gevo 2012). Comparatively, an n-butanol-derived ATJ process is being developed by Cobalt and the Naval Air Warfare Center Weapons Division (NAWCWD) (Cobalt 2012). The fuel properties for gasoline, diesel, and jet fuel are shown in Table 5 along with the fuel properties of ethanol, isobutanol, and n-butanol. Although butanol properties are closer to jet fuel than ethanol, the ATJ pathways instead produce jet fuel from these alcohol feedstocks.
Table 5. Fuel Properties (Rakopoulos, Rakopoulos et al. 2010; BP 2012; Department of Energy, Energy Efficiency & Renewable Energy, et al. 2013)
Fuel Properties Diesel fuel Jet A Gasoline n-Butanol Iso-butanol Ethanol Density at 20°C (kg/m3) 837 775 - 840* 770 810 802 788 Energy Density (MJ/kg) 43 42 47 33 36 27
Kinematic Viscosity (mm2/s) 2.6 (@ 40°C)
1 - 8 (@ -20°C )
3.5 (@ 20°C)
4.0E-04 3.6 (@ 40°C)
3.1 (@ 20°C)
1.2 (@ 40°C)
Boiling Point (°C) 180–360 140 - 280 38–204 118 108 78 Latent Heat of Evaporation (kJ/kg) 250 360 325.79 585 579 840
Flash Point (°C) 52–96 40 -43 26–29 28 16.6 Autoignition Temperature(°C) 210 210 257 343 415 363
* at 15°C Butanol feeds leading to ATJ conversion can be produced during fermentation. Isobutanol fermentation has been demonstrated in engineered Escherichia coli (E. coli) where the last two reactions of the Ehrlich pathway are introduced and a titer of 18 g/L has been reached (Atsumi, Hanai, et al. 2008; Baez, Cho, et al. 2011). Isobutanol can also be produced in aerobic conditions with acetate or ethanol as a co-product (Trinh, Li, et al. 2011). Isobutanol has also been produced in Bacillus subtilis and Cornebacterium glutamicum (Tao, Tan, et al. 2014). Isobutanol can also be produced anaerobically at 100% of the theoretical yield (Bastian, Liu, et al. 2011). N-butanol can be produced via acetone-butanol-ethanol (ABE) fermentation, a process that produces acetone, n-butanol, and ethanol from biomass in a typical molar ratio of 3:6:1 (Tao, Tan, et al. 2014). Clostridia strains such as Clostridium beijerinckii and Clostridium acetobutylicum have
4 JP-8 refers to Jet Propellant 8, a kerosene-based jet fuel specified and widely used by the U.S. military. It is specified by MIL-DTL- 83133 and British Defense Standard 91-87.
20 This report is available at no cost from the National Renewable Energy Laboratory (NREL) at www.nrel.gov/publications.
been shown to produce ABE solvents at a max yield of 9-27 g/L (Tao, Tan, et al. 2014). One of clostridium advantages is its ability to use a wide range of substrates, such as glucose, fructose, mannose, sucrose, lactose, and starch (Tao, Tan, et al. 2014). However, continuous fermentation of ABE at industrial scale has yet to be realized commercially. One technique currently being explored to increase solvent titer in isobutanol and n-butanol fermentation is using simultaneous fermentation and vacuum stripping to maintain a lower titer of butanols in the fermentation broth (Tao, Tan, et al. 2014).
Bio-butene can also be produced catalytically instead of by fermentation. Researchers at the University of Wisconsin–Madison have produced γ-valerolactone, which can be converted to 1-butene (Bond, Alonso, et al. 2010). The γ-valerolactone produced from biomass-derived carbohydrates is converted into 96% butene and CO2 through the decarboxylation process over a silica/alumina catalyst at a pressure of 36 bar and temperature of 375°C (Bond, Alonso, et al. 2010).
Other potential feedstocks for ATJ include methanol, isopropanol, and long-chain fatty alcohols. For instance, a process that turns syngas into gasoline via methanol has been developed by ExxonMobil (MTO process) (ExxonMobil 2012) and Sasol (Tait 2006). Light olefins such as ethylene and propylene can be catalytically converted to gasoline blendstock through catalytic polymerization in the presence of solid phosphoric acid catalyst (Ipatieff, Corson, et al. 1935; Ipatieff and Corson 1936).
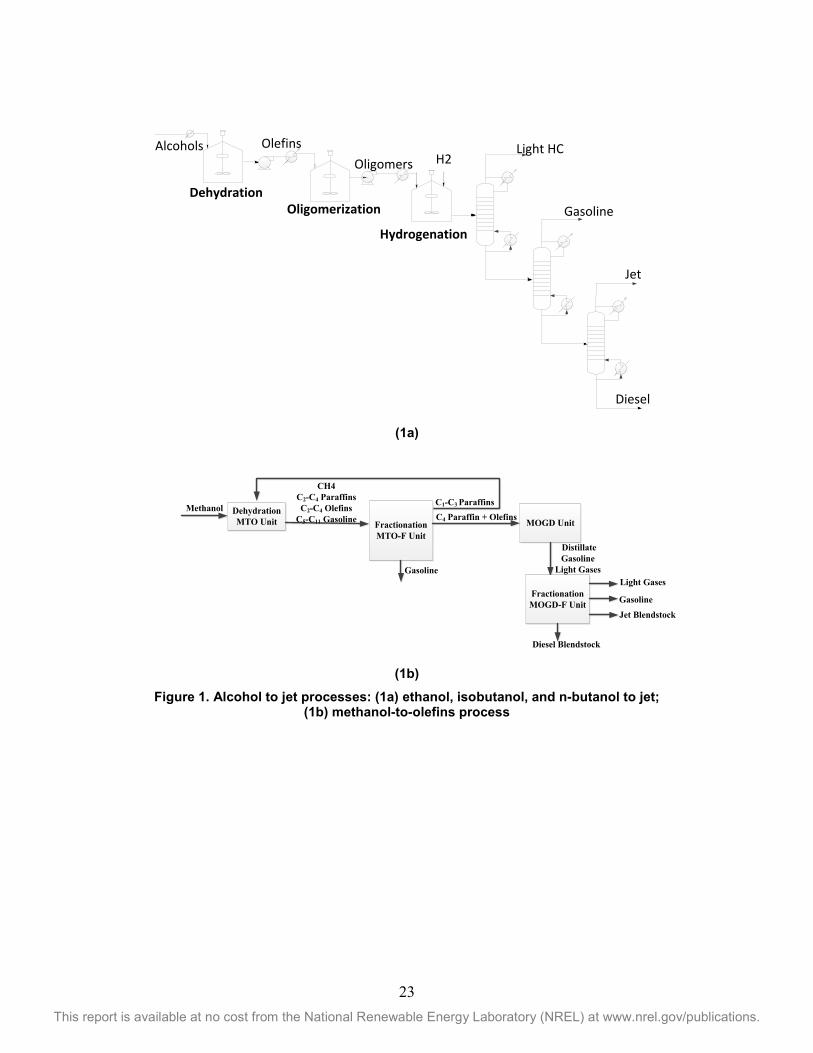
2.1.2 Process Description To make drop-in alternative jet fuel from alcohols, the differences in the physical and chemical properties between alcohols and conventional jet fuel have to be minimized. In the United States, anhydrous ethanol, at 99.5%–99.9% purity, is required to blend with gasoline to avoid separation (Rutz and Janssen 2007). However, for upgrading to jet fuel products, the necessity of high-purity ethanol is still uncertain. A typical three-step ATJ process that converts alcohols to jet fuel has been demonstrated (Byogy Renewables 2011). The process includes alcohol dehydration, oligomerization, and hydrogenation. Figure 1a shows the overall process diagram for ethanol, isobutanol, and n-butanol conversion to fuels. One advantage with dehydration, oligomerization, and hydrotreating process steps is that they have been demonstrated on a commercially relevant scale and the risk of scale-up is expected to be reduced. However, the development and demonstration of the integrated process on biomass-derived intermediates is necessary (Byogy Renewables 2011).
Research on ethanol dehydration catalysis started with alumina and transition metal oxides and moved to silicoaluminophosphates (SAPO), H-ZSM-5 zeolite catalyst, and heteropolyacid catalysts. In one case, 100% of the ethanol was dehydrated to ethylene with a 99.9% selectivity at 250°C and 2 h-1 weight hourly space velocity using a 0.5% La-2%PH-ZSM-5 catalyst (Zhan, Hu, et al. 2010). The resulting ethylene can then undergo a catalytic oligomerization process to linear α-olefins (Weissermel and Arpe 2008; Byogy Renewables 2011). Commercial oligomerization processes have used both homogeneous and heterogeneous catalysts (Weissermel and Arpe 2008; Byogy Renewables 2011). The Chevron Phillips Ziegler one-step process uses the homogenous Ziegler-Natta catalyst. In 2002, the process was used to produced 680,000 tonnes of ethylene oligomers with a Schulz-Flory distribution (Weissermel and Arpe 2008; Forestière, Olivier-Bourbigou, et al. 2009). In the Ziegler one-step process, the catalyst is
21 This report is available at no cost from the National Renewable Energy Laboratory (NREL) at www.nrel.gov/publications.
at such low concentrations that it is not regenerated and recycled, but converted to sodium aluminate and disposed of (van Os 1997). The reaction occurs at 200oC, 250 bar, and at 1x10⁻⁴ catalyst per mole of ethylene (Fernald, Gall, et al. 1972; Weissermel and Arpe 2008).
Another commercial process, the Ziegler two-step process (used by INEOS) has a capacity of 470,000 tonnes per year of ethylene oligomers with a Poisson product distribution (Weissermel and Arpe 2008; Forestière, Olivier-Bourbigou, et al. 2009). Unlike the one-step Ziegler process, the two-step process uses a stoichiometric amount of catalyst to ethylene and is regenerated and recycled after use (Stache 1995; Weissermel and Arpe 2008). The reaction occurs at 90 o–120oC and 100 bar (Stache 1995; Weissermel and Arpe 2008). A third commercial ethylene oligomerization process is the Shell Higher Olefins Process developed by Shell (Forestière, Olivier-Bourbigou, et al. 2009). The process has a capacity of 320,000 tons per year, and produces oligomers with a Schulz-Flory distribution using a homogeneous nickel/phosphorous ligand catalyst (Weissermel and Arpe 2008; Forestière, Olivier-Bourbigou, et al. 2009). Jet fuel can be made from these oligomers after hydrotreating and isomerization to branched alkanes. (van Os 1997)
Isobutanol can be dehydrated to a mixture of isobutene, n-butene (1-butene), and 2-butene (cis-2-butene and trans-2-butene) (Taylor, Jenni, et al. 2010). Acidic catalysts such as alumina-based, ZSM-5 zeolites, γ -type zeolites, and Amberlyst acidic resins can be used to catalyze a dehydration reaction (Armstrong, Bhatt, et al. 1993; Pearlson 2007; Taylor, Jenni, et al. 2010). The selectivity of isobutene over liner butenes can be dictated by catalyst choice (Armstrong, Bhatt, et al. 1993; Pearlson 2007; Taylor, Jenni, et al. 2010). Additionally, strong acidic catalysts such as ZSM-5 and Amberlyst 35 can initiate butene oligomerization, as well (Taylor, Jenni, et al. 2010; Peters and Taylor 2013). However, if only one reaction step is used for dehydration and oligomerization, the resulting isomers have inferior fuel/chemical properties compared to ones obtained when the two reactions occur in series (Taylor, Jenni, et al. 2010). In one case, isobutanol is dehydrated with a yield of 99.1%5, and a selectivity of 95.1% to isobutene, 1.6% to 1-butene, 0.5% to trans-2-butene, and 1.9% to cis-2-butene at 325°C, 60 psig and using a γ-alumina catalyst at 2 h-1 WHSV (Taylor, Jenni, et al. 2010). In addition, isobutanol can be converted into isobutylene through the dehydration process operated at 310°C over γ-alumina catalyst, resulting in 98% isobutanol conversion and 92 mole% isobutylene selectivity (Armstrong, Bhatt, et al. 1993). After dehydration, the butenes can undergo oligomerization to jet range alkenes. In one instance, isobutene can be converted to dimers, trimers, and tetramers at 100°C using an Amberlyst-35 catalyst at a WHSV of 2 h-1, producing C8, C12, and C16 olefins at 20%, 70%, and 10%, respectively (Gruber, Peters, et al. 2012). The conversion of 1-butene into to C8, C12, C16, and C20 olefins results in an overall 1-butene conversion of 96%, with 4% unreacted (Wright, Harvey, et al. 2008). To increase the jet and diesel yields, the C8 olefins can be distilled and sent to a separate dimerization process or recycled back to the oligomerization reactor. The dimerization process operates at 116°C over a Nafion catalyst (Harvey and Quintana 2010). After oligomerization, the resulting products are hydrotreated to saturate carbon double bonds.
5 Unless specified, all selectivities are mass percentage.
22 This report is available at no cost from the National Renewable Energy Laboratory (NREL) at www.nrel.gov/publications.
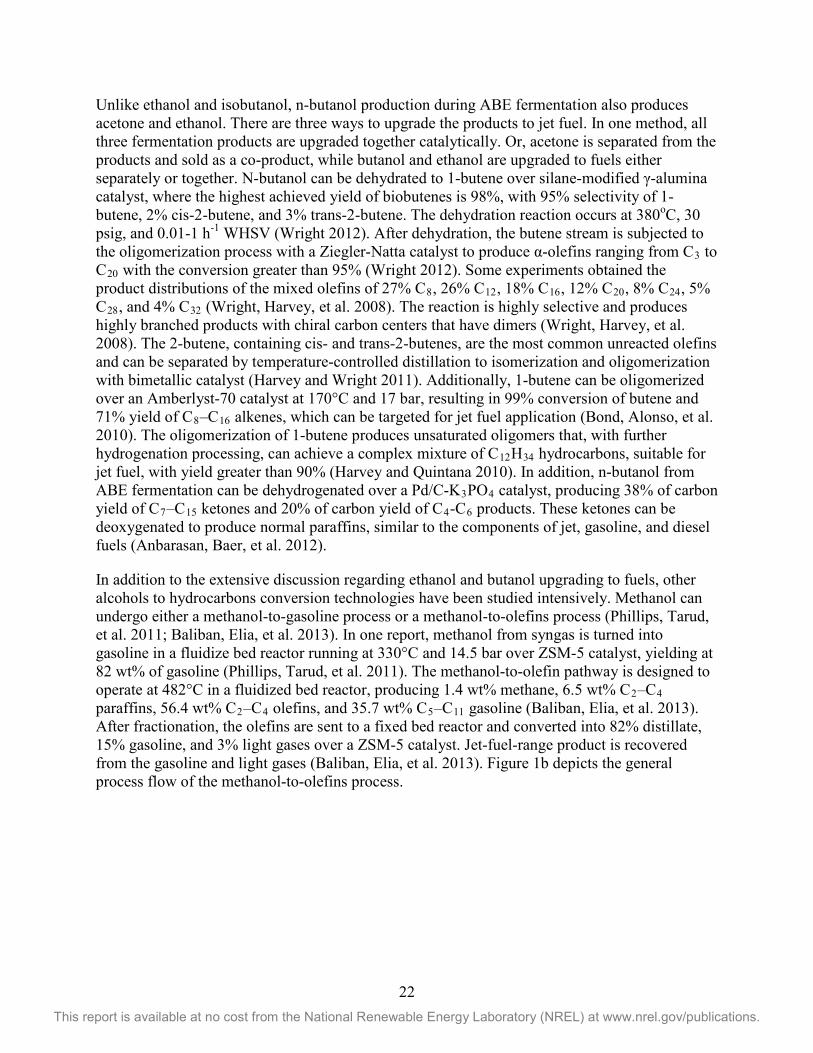
Unlike ethanol and isobutanol, n-butanol production during ABE fermentation also produces acetone and ethanol. There are three ways to upgrade the products to jet fuel. In one method, all three fermentation products are upgraded together catalytically. Or, acetone is separated from the products and sold as a co-product, while butanol and ethanol are upgraded to fuels either separately or together. N-butanol can be dehydrated to 1-butene over silane-modified γ-alumina catalyst, where the highest achieved yield of biobutenes is 98%, with 95% selectivity of 1-butene, 2% cis-2-butene, and 3% trans-2-butene. The dehydration reaction occurs at 380oC, 30 psig, and 0.01-1 h-1 WHSV (Wright 2012). After dehydration, the butene stream is subjected to the oligomerization process with a Ziegler-Natta catalyst to produce α-olefins ranging from C3 to C20 with the conversion greater than 95% (Wright 2012). Some experiments obtained the product distributions of the mixed olefins of 27% C8, 26% C12, 18% C16, 12% C20, 8% C24, 5% C28, and 4% C32 (Wright, Harvey, et al. 2008). The reaction is highly selective and produces highly branched products with chiral carbon centers that have dimers (Wright, Harvey, et al. 2008). The 2-butene, containing cis- and trans-2-butenes, are the most common unreacted olefins and can be separated by temperature-controlled distillation to isomerization and oligomerization with bimetallic catalyst (Harvey and Wright 2011). Additionally, 1-butene can be oligomerized over an Amberlyst-70 catalyst at 170°C and 17 bar, resulting in 99% conversion of butene and 71% yield of C8–C16 alkenes, which can be targeted for jet fuel application (Bond, Alonso, et al. 2010). The oligomerization of 1-butene produces unsaturated oligomers that, with further hydrogenation processing, can achieve a complex mixture of C12H34 hydrocarbons, suitable for jet fuel, with yield greater than 90% (Harvey and Quintana 2010). In addition, n-butanol from ABE fermentation can be dehydrogenated over a Pd/C-K3PO4 catalyst, producing 38% of carbon yield of C7–C15 ketones and 20% of carbon yield of C4-C6 products. These ketones can be deoxygenated to produce normal paraffins, similar to the components of jet, gasoline, and diesel fuels (Anbarasan, Baer, et al. 2012).
In addition to the extensive discussion regarding ethanol and butanol upgrading to fuels, other alcohols to hydrocarbons conversion technologies have been studied intensively. Methanol can undergo either a methanol-to-gasoline process or a methanol-to-olefins process (Phillips, Tarud, et al. 2011; Baliban, Elia, et al. 2013). In one report, methanol from syngas is turned into gasoline in a fluidize bed reactor running at 330°C and 14.5 bar over ZSM-5 catalyst, yielding at 82 wt% of gasoline (Phillips, Tarud, et al. 2011). The methanol-to-olefin pathway is designed to operate at 482°C in a fluidized bed reactor, producing 1.4 wt% methane, 6.5 wt% C2–C4 paraffins, 56.4 wt% C2–C4 olefins, and 35.7 wt% C5–C11 gasoline (Baliban, Elia, et al. 2013). After fractionation, the olefins are sent to a fixed bed reactor and converted into 82% distillate, 15% gasoline, and 3% light gases over a ZSM-5 catalyst. Jet-fuel-range product is recovered from the gasoline and light gases (Baliban, Elia, et al. 2013). Figure 1b depicts the general process flow of the methanol-to-olefins process.
23 This report is available at no cost from the National Renewable Energy Laboratory (NREL) at www.nrel.gov/publications.
Dehydration Oligomerization
Alcohols Olefins
Hydrogenation
H2OligomersLight HC
Gasoline
Jet
Diesel
(1a)
DehydrationMTO Unit Fractionation
MTO-F Unit
Gasoline
Methanol
CH4C2-C4 ParaffinsC2-C4 Olefins
C5-C11 Gasoline
C1-C3 ParaffinsC4 Paraffin + Olefins MOGD Unit
DistillateGasoline
Light Gases
FractionationMOGD-F Unit Gasoline
Jet Blendstock
Diesel Blendstock
Light Gases
(1b)
Figure 1. Alcohol to jet processes: (1a) ethanol, isobutanol, and n-butanol to jet; (1b) methanol-to-olefins process
24 This report is available at no cost from the National Renewable Energy Laboratory (NREL) at www.nrel.gov/publications.
2.1.3 Economic Analysis To evaluate the production cost for the biojet fuel derived from alcohols, the cost of making alcohols, such as ethanol, butanol (n-butanol and iso-butanol), and methanol, needs to be determined. The techno-economic analysis (TEA) of both biochemical and thermochemical processes for ethanol production (from starch or cellulosic feedstocks) has been studied extensively (Renewable Fuels Association 2015; Phillips 2007; Zhu and Jones 2009; Anex, Aden, et al. 2010; Dutta, Bain, et al. 2010; Dutta, Dowe, et al. 2010; Gnansounou and Dauriat 2010; Kazi, Fortman, et al. 2010; Dutta, Talmadge, et al. 2011; Humbird, Davis, et al. 2011; Oak Ridge National Laboratory 2011; Valdes 2011; Vicari, Tallam, et al. 2012; Crawford 2013; Atsonios, Kougioumtzis, et al. 2015; de Jong, Hoefnagels, et al. 2015). Most reports calculate a minimum selling price of the fuel based on a number of economic assumptions. The minimum ethanol selling price for the biochemical conversion of lignocellulosic biomass was recently reported to be $2.8/gal or $4.2/gallon of gasoline equivalent (GGE) (in 2011 U.S. dollars) (Humbird, Davis, et al. 2011). The minimum ethanol selling price for the thermochemical route was reported to be $2.5/gal or $3.9/GGE (in 2011 U.S. dollars) (Dutta, Talmadge, et al. 2011).
The selling price of butanol from ABE fermentation using corn grain with an ABE molar ratio of 3:6:1 is $2.9/gal butanol ($3.5/GGE); using cellulosic biomass with an ABE molar ratio of 3:6:1 results in a price of $4.1/gal butanol ($5.0/GGE); and using cellulosic biomass with an ABE molar ratio of 0.5:9:0.5 has a price of $3.8/gal butanol ($4.6/GGE), respectively, in 2011 dollars (Tao, He, et al. 2012). Comparatively, the selling price of isobutanol from cellulosic biomass is estimated at $3.7 per gallon of butanol or $4.5/ GGE (2011 U.S. dollars) (Tao, Tan, et al. 2014). The alcohol selling price for butanols are subject to conversion yields, feedstock costs, credits for co-products, solvent recovery, and product molar ratio (Tao, Tan, et al. 2014). According to the current market demand and the fluctuation of agricultural prices, cheaper feedstocks such as agricultural waste (Lenz and Morelra 1980) or algal biomass (Kumar and Gayen 2011) are desired due to their renewability and non-competition with food. Other butanol economic models consider the revenues produced if the butanol selling price is set, and then determine the internal rate of return at around 14% (Pereira, Dias, et al. 2015).
To evaluate the overall ATJ conversion pathway and estimate its commercial feasibility, the economics of the fuel upgrading processes such as dehydration, oligomerization, dimerization, and hydrogenation also have to be considered. Because these processes are still under development, more research efforts are required to complete this target goal.
2.1.4 Life-Cycle Assessment LCA studies for the ATJ process are primarily focused on production of ethanol (Borrion, McManus et al. 2012), n-butanol (Pereira, Chagas, et al. 2015), and isobutanol (Tao, Aden, et al. 2012), via conventional biochemical conversion pathways (i.e., sugar fermentation). The LCA for fuel alcohol production can be categorized into four areas: (1) feedstock (land-use-change), (2) on-site enzyme production, (3) biorefinery process, and (4) biorefinery co-product credits (Tao, Aden, et al. 2012). Alcohols can also be produced via thermochemical conversion pathways, and if this is considered, obviously the biochemical process will have different performance from the thermochemical process with respect to GHG emissions, fossil fuel consumption, and water consumption (Mu, Seager, et al. 2010).
25 This report is available at no cost from the National Renewable Energy Laboratory (NREL) at www.nrel.gov/publications.
For n-butanol and iso-butanol conversion, studies have focused on emissions, consumptive water use, global warming potential, and fossil energy consumption. When using similar assumptions and comparing the n-butanol and isobutanol processes, n-butanol (produced at a molar ratio of 0.5:9:0.5 ABE) releases more direct emissions, such as CO2, nitrogen dioxide, and sulfur dioxide, than the iso-butanol production process does (Tao, Aden, et al. 2012). Ethanol releases the smallest emissions when all three are compared (Tao, Aden, et al. 2012). CO2 is produced during the cellulase (or enzyme) production and cellulase seed fermentation, but is largely from combustion. Nitrogen dioxide is formed through high temperature oxidation of the diatomic nitrogen in the combustion air. Sulfur dioxide emissions strongly depend on the amount of sulfuric acid used in the pretreatment process. The biomass feedstock is responsible for most of supply chain carbon footprint and fossil energy consumption. The LCA of the ATJ fuel upgrading processes is still unknown and requires more attention in future studies.
2.1.5 Commercialization Readiness In July 2011, Terrabon, Inc. was awarded a $9.6 MM grant to design a more economical and renewable jet-fuel production solution for the Defense Advanced Research Projects Agency (DARPA) (Terrabon 2011). However, in 2012 Terrabon filed for Chapter 7 bankruptcy (Voegele 2012). Before its bankruptcy, Terrabon’s goal was to produce 6,000 liters of $2.0/gal jet fuel using its MixAlco process (Terrabon 2011). In 2011, LanzaTech, a company that produces sustainable alcohols and chemicals from waste gas resources, received a $3 MM contract from the FAA through the U.S. Department of Transportation to accelerate commercialization of ATJ technology (LanzaTech 2011). In 2015, AcelorMittal, in partnership with LanzaTech and Primetals Technologies, invested €87 MM in an ethanol fermentation pilot plant in Ghent, Belgium (ArcelorMittal 2015). This project will utilize gasses from AcelorMittal’s steel plant and convert it into 47,000 tons ethanol/year by 2018 (ArcelorMittal 2015). LanzaTech also partnered with Virgin Atlantic to provide low carbon jet fuels (LanzaTech 2013). The ethanol could be further processed into jet fuel (ArcelorMittal 2015).
Another company working on ATJ technology is Gevo, Inc. In 2011, Gevo was awarded a contract by the Defense Logistics Agency to supply jet fuel to the U.S. Air Force (Gevo 2011). The Gevo process uses isobutanol-to-jet and has demonstrated it at its biorefinery plant in Silsbee, Texas (Gevo 2015). Its plant in Luverne, Minnesota, will be scaled in 2016 to produce 750,000–1,000,000 gallons of biofuel (Gevo 2015). The ATJ fuel is planned to be produced from iso-butanol at Gevo’s hydrocarbon processing demonstration plant in Silsbee, Texas. In March 2012, the NAWCWD announced a contract award to Albemarle Corporation to complete its first biojet fuel production run from bio n-butanol provided by Cobalt Technologies. The team from Cobalt and NAWCWD focused on scaling and optimizing dehydration chemistry for the conversion of bio n-butanol to 1-butene, followed by oligomerization of the biobutene into jet fuel, based on a process developed by NAWCWD (Cobalt 2012). Alaska Airlines partnered with Gevo to use biojet fuel after Gevo received ASTM certification at the end of 2015 (Gevo 2015).
In June 2012, the U.S. Air Force conducted successfully the first test flight of a new ATJ fuel-powered A-10C Thunderbolt II aircraft, shown in Table 4b. ATJ fuel is the third alternative fuel tested by the Air Force for use as a replacement for petroleum-derived JP-8 aviation fuel, after HRJ/HEFA and FT technologies (EcoSeed 2012). Although the ATJ process is not yet certified for blending with conventional Jet A/A-1, there are task forces in ASTM for straight alkane mixture to be certified up to a 50% as well as task force for aromatics to be used as a 100% blend
26 This report is available at no cost from the National Renewable Energy Laboratory (NREL) at www.nrel.gov/publications.
with Jet A/A-1. ASTM's International Committee passed a concurrent ballot in March 2016, approving the revision of ASTM D7566 (Standard Specification for Aviation Turbine Fuel Containing Synthesized Hydrocarbons) to include ATJ synthetic paraffinic kerosene derived from renewable isobutanol (Gevo 2016).
2.2 Oil-to-Jet (OTJ) Fuel In this review paper, three processes are classified into the OTJ conversion pathway: hydroprocessed renewable jet (HRJ, also known as hydroprocessed esters and fatty acids or HEFA); catalytic hydrothermolysis (CH, also termed hydrothermal liquefaction); and pyrolysis (also known as hydrotreated depolymerized cellulosic jet [HDCJ]). Currently, only products from the HRJ pathway have been approved for blending and have a defined ASTM specification (International Air Transport Association 2010).
2.2.1 Feedstocks Generally speaking, oil-derived jet fuels must compete with biodiesel and hydroprocessed renewable diesel for feedstock availability. In this review paper, the feedstocks considered for OTJ conversion pathways include plant oils, waste oils, algal oils, and pyrolysis oils.
Plant oil. Various feedstocks are becoming a promising alternative to diesel fuels production such as canola, soybean, rapeseed, palm oils, and corn oil (Westbrook, Naik, et al. 2011; Yusuf, Kamarudin, et al. 2011). Soybean oil has been used extensively in the United States for biodiesel production, using 27% (in 2013) and 23% (in 2014) of total soybean oil production (U.S. Department of Agriculture 2015; U.S. Energy Information Administration 2015). Rapeseed oil is the main feedstock used for biodiesel production in Europe, with approximately 850,000 metric tonnes used in 2014 (Krautgartner, Lefebvre, et al. 2015). Palm oil consumed in Europe is imported, mainly from Indonesia, and its consumption for biodiesel production is estimated as 1,450 metric tonnes in 2014 (Krautgartner, Lefebvre, et al. 2015). Biodiesel production has expanded based on the abundant palm oil resource in Southeast of Asia. However, the use of soybean, palm, and rapeseed oils as bio-jet fuel feedstocks could lead to a large uncertainty in the amount of GHG emissions due to direct or indirect land use change (Bauen, Howes, et al. 2009). Palm oil use for biodiesel production is expected to be cut in the European Union and United States, according to EPA definition, as it is not suitable for addition to the renewable fuel program due to high GHG emissions (Bloomberg 2012; Krautgartner, Lefebvre, et al. 2015).
Recently, bio-jet fuels derived from plant oils such as camelina and jatropha, algae oils, and waste cooking oils have been tested in commercial (Table 4a) and military (Table 4b) flights. Camelina is a short-season crop cultivated in the temperate climate zone. Interest in camelina has recently been raised mainly due to the need for easy-to-grow oilseed crops for potential non-food agricultural systems. In a study by Shonnard et al., HRJ fuel derived from camelina through Honeywell Green Jet Fuel technology has been shown to not only meet stringent engine fuel and performance specifications but also reduce environmental emissions. (Shonnard, Williams, et al. 2010). From the estimation of future gains in yield per acre, hydroprocessing of camelina oil is capable of providing 800 MM gallons per year of high quality, climate friendly renewable fuels in the United States (Shonnard, Williams, et al. 2010).
Jatropha curcas has higher oil yield (gallon per acre) than many other oil-yielding crops. In humid regions or under irrigated conditions, the Jatropha plant can be grown year round (Kasim
27 This report is available at no cost from the National Renewable Energy Laboratory (NREL) at www.nrel.gov/publications.
and Harvey 2011). Jatropha is a promising raw material for biodiesel production because the seed oil content is potentially high, at 35%–55% of the seed dry weight (Kasim and Harvey 2011). Additionally, seed shells of Jatropha curcas have a high energy value (18–19 MJ kg–1) (Becker and Makkar 2008). The husk and seed shells can be converted to value-added co-products compared to algae and palm after oil extraction. Jatropha oil has been a subject of interest, particularly in the biodiesel production area, although there is minimal evidence to show that it will become an energy resource on a global scale (Achten, Verchot, et al. 2008; Lawrence and Adamson 2014).
Algal oil. Algal biofuel has attracted the interest of researchers and entrepreneurs for several reasons: (1) algae has high productivity per acre and year-round production; (2) algal cultivation requires less freshwater than terrestrial crops and can use a variety of water sources including fresh, brackish, saline, and wastewater; (3) algae can be cultivated on non-arable land; (4) algae have rapid growth potential and high oil content (20%–50% dry cell weight); (5) nutrients such as nitrogen and phosphorus for growth can be obtained from wastewater; (6) various valuable co-products, such as proteins and residual biomass left after oil extraction potentially can be used as feed or fertilizer; (7) hydrogen can be produced photobiologically from microalgae; and (8) the potential GHG reduction relative to other plant oils (Ghirardi 2000; Schenk, Thomas-Hall, et al. 2008; Pienkos and Darzins 2009; Brennan and Owende 2010; Fortier, Roberts, et al. 2014).
Three algae production technologies—photoautotrophic, heterotrophic, and mixotrophic—have been developed (Brennan and Owende 2010). Photoautotrophic production can occur in either open ponds or closed photobioreactor systems. Open pond systems have the advantages of cheaper algae production cost ($10.6/gal in 2011 U.S. dollars) and low energy input, but they have poor productivity and require large areas of land (Davis, Aden, et al. 2011). There are still inconsistencies in the production rates reported in literature, ranging from 10–69 g/m2/day for an open pond system (Brennan and Owende 2010). Closed photobioreactor systems have a higher algae production cost of $22.4/gal in 2011 U.S. dollars, high energy input, and relatively higher productivity of 1.25 kg/m3/day on a volume basis (Davis, Aden, et al. 2011). The algal biomass is harvested through bulk harvesting and concentrating. The harvesting process includes flocculation, filtration, flotation, and centrifugal sedimentation steps, which are crucial to the economic production of micro-algal biomass. The dehydration or drying step is commonly used after the harvesting process for thickening. Various drying technologies used for this purpose are sun drying, low-pressure shelf drying, spray drying , drum drying, fluidized bed drying, freeze drying, and Reactance Window technology drying (Brennan and Owende 2010). Freeze drying is expensive, but it makes oil extraction easier than other technologies (Grima, Medina, et al. 1994).
Pyrolysis oil. Pyrolysis, a process that heats biomass without oxygen either in a fast or slow process, produces pyrolysis gas, biochar, and pyrolysis oil (also called bio-oil). Bio-oil is a mixture of oxygenated organic species containing carbons ranging from C1 to C21+. Some examples of the carbon chain length of pyrolysis oil are shown in literature (Wright, Satrio, et al. 2010; Silva, Romeiro, et al. 2012). Although pyrolysis oil is very different from either vegetable oil or algal oil, it can be refined similarly into renewable gasoline, diesel, or jet fuels (Jones, Holladay, et al. 2009; Wright, Satrio, et al. 2010; Rogers and Brammer 2012; Jones, Meyer, et al. 2013). Based on UOP’s study, the aqueous phase of bio-oil can be up to 70 wt%, which leaves only 30% for oil upgrading (Marker 2005). In a literature survey, the production cost of bio-oil
28 This report is available at no cost from the National Renewable Energy Laboratory (NREL) at www.nrel.gov/publications.
was shown to range from $0.5/gal to $2.0/gal in 2011 dollars (Wright, Satrio, et al. 2010; Badger, Badger, et al. 2011). The sale of co-product biochar potentially reduces the production cost of bio-oil by up to 18% depending on the biochar market, with an assumed feedstock (wood chips) cost of $25/wet ton (or $50/dry ton) (Badger, Badger, et al. 2011).
When processing oils, the fatty acid profile is an important issue. For instance, a greater hydrogen supply is needed if more unsaturated fatty acids are present in the oil. Table 6 summarizes the fatty acid profiles for the oil feedstocks. Vegetable oils, waste cooking oil, and algal oil are in the diesel fuel range C16–C22. Oleic acid is a predominant proportion of vegetable oils. Oils from algae, especially, contain a significant amount of eicosapentaenoic acid. High-chain-length oils can be broken down to small molecules to produce jet fuels, but the overall yield will be reduced with increasing production of co-products. If starting from small molecules, the target jet product yield will be high with fewer co-products produced. There is a tradeoff between main product (jet fuel) and value-added co-product production ratios.
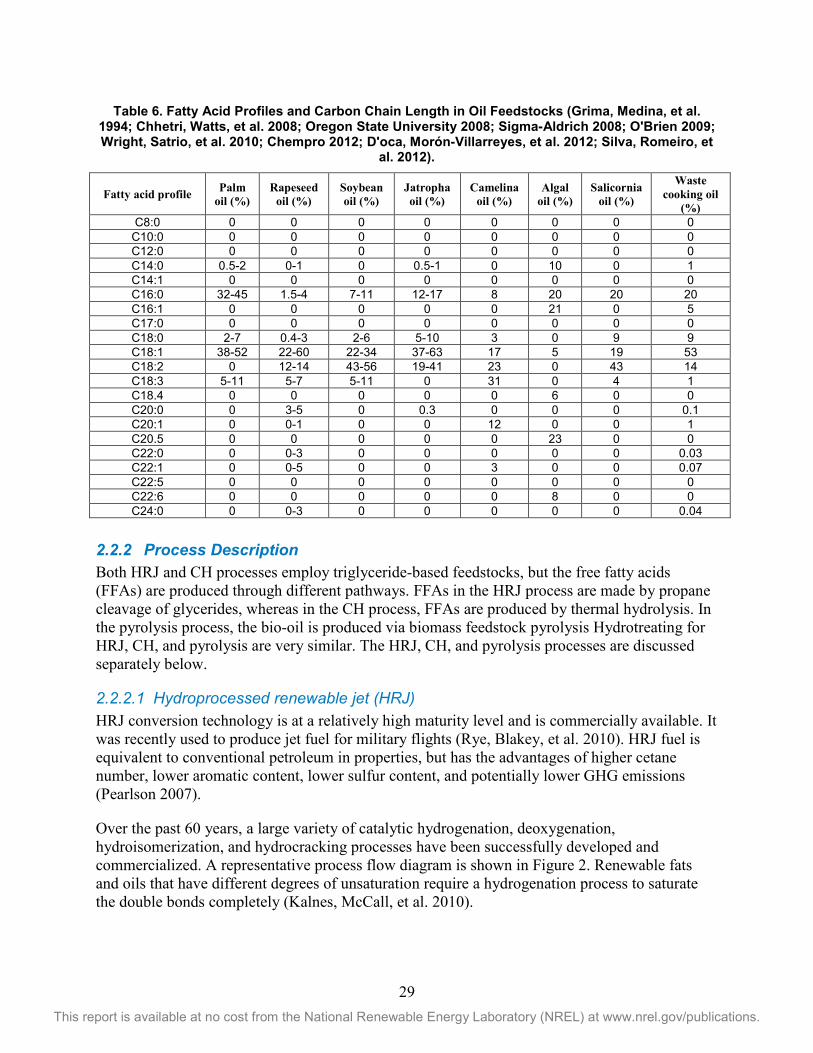
29 This report is available at no cost from the National Renewable Energy Laboratory (NREL) at www.nrel.gov/publications.
Table 6. Fatty Acid Profiles and Carbon Chain Length in Oil Feedstocks (Grima, Medina, et al. 1994; Chhetri, Watts, et al. 2008; Oregon State University 2008; Sigma-Aldrich 2008; O'Brien 2009; Wright, Satrio, et al. 2010; Chempro 2012; D'oca, Morón-Villarreyes, et al. 2012; Silva, Romeiro, et
al. 2012).
Fatty acid profile Palm oil (%)
Rapeseed oil (%)
Soybean oil (%)
Jatropha oil (%)
Camelina oil (%)
Algal oil (%)
Salicornia oil (%)
Waste cooking oil
(%) C8:0 0 0 0 0 0 0 0 0
C10:0 0 0 0 0 0 0 0 0 C12:0 0 0 0 0 0 0 0 0 C14:0 0.5-2 0-1 0 0.5-1 0 10 0 1 C14:1 0 0 0 0 0 0 0 0 C16:0 32-45 1.5-4 7-11 12-17 8 20 20 20 C16:1 0 0 0 0 0 21 0 5 C17:0 0 0 0 0 0 0 0 0 C18:0 2-7 0.4-3 2-6 5-10 3 0 9 9 C18:1 38-52 22-60 22-34 37-63 17 5 19 53 C18:2 0 12-14 43-56 19-41 23 0 43 14 C18:3 5-11 5-7 5-11 0 31 0 4 1 C18.4 0 0 0 0 0 6 0 0 C20:0 0 3-5 0 0.3 0 0 0 0.1 C20:1 0 0-1 0 0 12 0 0 1 C20.5 0 0 0 0 0 23 0 0 C22:0 0 0-3 0 0 0 0 0 0.03 C22:1 0 0-5 0 0 3 0 0 0.07 C22:5 0 0 0 0 0 0 0 0 C22:6 0 0 0 0 0 8 0 0 C24:0 0 0-3 0 0 0 0 0 0.04
2.2.2 Process Description Both HRJ and CH processes employ triglyceride-based feedstocks, but the free fatty acids (FFAs) are produced through different pathways. FFAs in the HRJ process are made by propane cleavage of glycerides, whereas in the CH process, FFAs are produced by thermal hydrolysis. In the pyrolysis process, the bio-oil is produced via biomass feedstock pyrolysis Hydrotreating for HRJ, CH, and pyrolysis are very similar. The HRJ, CH, and pyrolysis processes are discussed separately below.
2.2.2.1 Hydroprocessed renewable jet (HRJ) HRJ conversion technology is at a relatively high maturity level and is commercially available. It was recently used to produce jet fuel for military flights (Rye, Blakey, et al. 2010). HRJ fuel is equivalent to conventional petroleum in properties, but has the advantages of higher cetane number, lower aromatic content, lower sulfur content, and potentially lower GHG emissions (Pearlson 2007).
Over the past 60 years, a large variety of catalytic hydrogenation, deoxygenation, hydroisomerization, and hydrocracking processes have been successfully developed and commercialized. A representative process flow diagram is shown in Figure 2. Renewable fats and oils that have different degrees of unsaturation require a hydrogenation process to saturate the double bonds completely (Kalnes, McCall, et al. 2010).
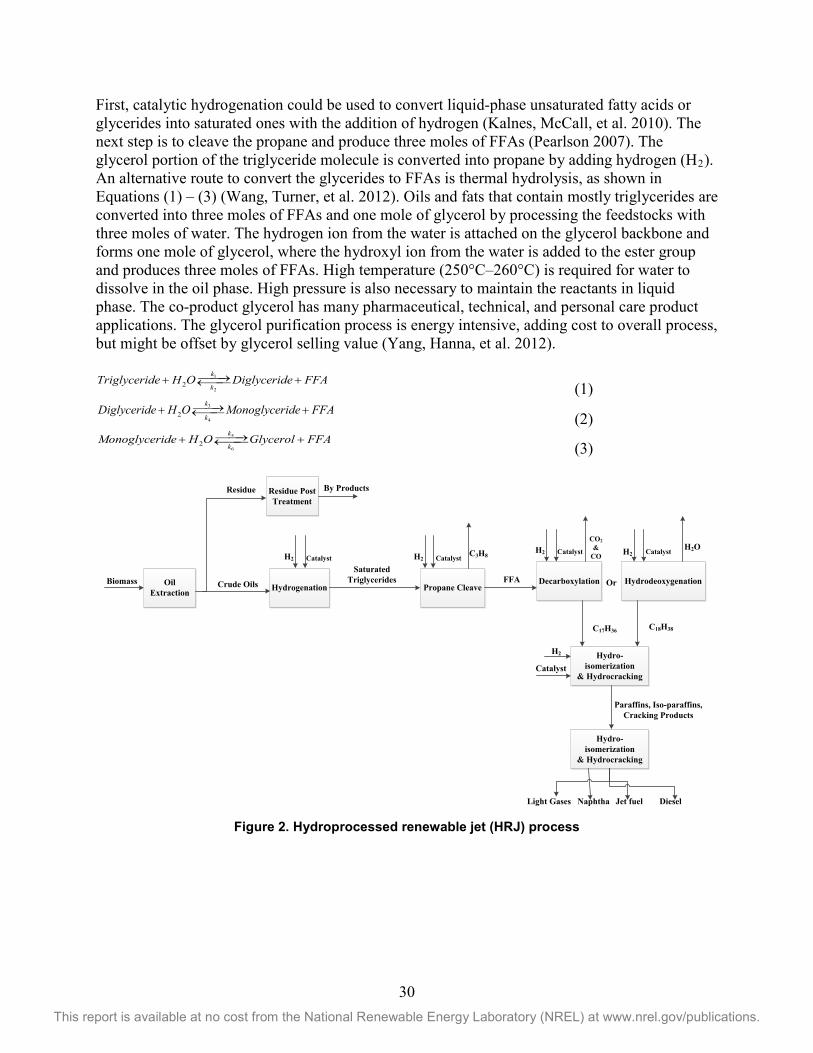
30 This report is available at no cost from the National Renewable Energy Laboratory (NREL) at www.nrel.gov/publications.
First, catalytic hydrogenation could be used to convert liquid-phase unsaturated fatty acids or glycerides into saturated ones with the addition of hydrogen (Kalnes, McCall, et al. 2010). The next step is to cleave the propane and produce three moles of FFAs (Pearlson 2007). The glycerol portion of the triglyceride molecule is converted into propane by adding hydrogen (H2). An alternative route to convert the glycerides to FFAs is thermal hydrolysis, as shown in Equations (1) – (3) (Wang, Turner, et al. 2012). Oils and fats that contain mostly triglycerides are converted into three moles of FFAs and one mole of glycerol by processing the feedstocks with three moles of water. The hydrogen ion from the water is attached on the glycerol backbone and forms one mole of glycerol, where the hydroxyl ion from the water is added to the ester group and produces three moles of FFAs. High temperature (250°C–260°C) is required for water to dissolve in the oil phase. High pressure is also necessary to maintain the reactants in liquid phase. The co-product glycerol has many pharmaceutical, technical, and personal care product applications. The glycerol purification process is energy intensive, adding cost to overall process, but might be offset by glycerol selling value (Yang, Hanna, et al. 2012).
(1)
(2)
(3)
Oil Extraction
BiomassHydrogenationCrude Oils
Residue Post Treatment
Residue By Products
Saturated Triglycerides
Propane CleaveFFA Decarboxylation Or Hydrodeoxygenation
H2 Catalyst H2 Catalyst
Hydro-isomerization
& Hydrocracking
CO2 &
COH2O
C17H36 C18H38
Paraffins, Iso-paraffins, Cracking Products
Hydro-isomerization
& Hydrocracking
Light Gases Naphtha Jet fuel Diesel
Catalyst
H2
H2 Catalyst H2 Catalyst C3H8
Figure 2. Hydroprocessed renewable jet (HRJ) process
1
22
k
kTriglyceride H O Diglyceride FFA→+ +←
3
42
k
kDiglyceride H O Monoglyceride FFA→+ +←
5
62
k
kMonoglyceride H O Glycerol FFA→+ +←
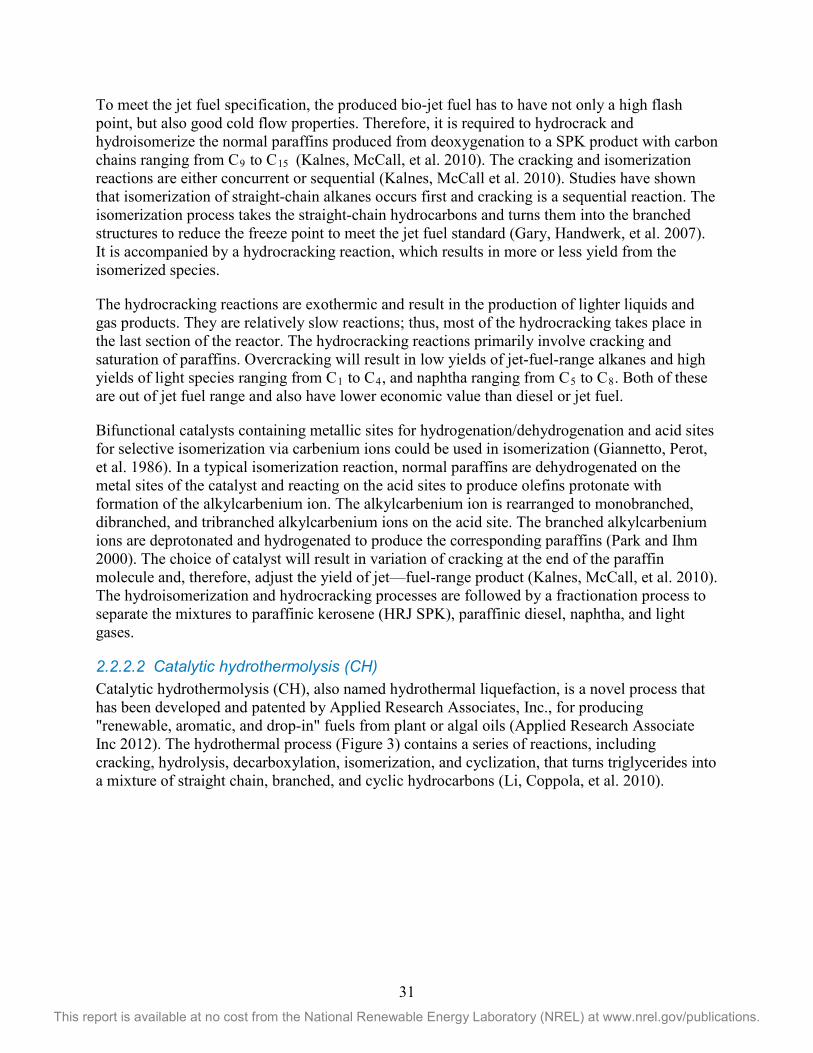
31 This report is available at no cost from the National Renewable Energy Laboratory (NREL) at www.nrel.gov/publications.
To meet the jet fuel specification, the produced bio-jet fuel has to have not only a high flash point, but also good cold flow properties. Therefore, it is required to hydrocrack and hydroisomerize the normal paraffins produced from deoxygenation to a SPK product with carbon chains ranging from C9 to C15 (Kalnes, McCall, et al. 2010). The cracking and isomerization reactions are either concurrent or sequential (Kalnes, McCall et al. 2010). Studies have shown that isomerization of straight-chain alkanes occurs first and cracking is a sequential reaction. The isomerization process takes the straight-chain hydrocarbons and turns them into the branched structures to reduce the freeze point to meet the jet fuel standard (Gary, Handwerk, et al. 2007). It is accompanied by a hydrocracking reaction, which results in more or less yield from the isomerized species.
The hydrocracking reactions are exothermic and result in the production of lighter liquids and gas products. They are relatively slow reactions; thus, most of the hydrocracking takes place in the last section of the reactor. The hydrocracking reactions primarily involve cracking and saturation of paraffins. Overcracking will result in low yields of jet-fuel-range alkanes and high yields of light species ranging from C1 to C4, and naphtha ranging from C5 to C8. Both of these are out of jet fuel range and also have lower economic value than diesel or jet fuel.
Bifunctional catalysts containing metallic sites for hydrogenation/dehydrogenation and acid sites for selective isomerization via carbenium ions could be used in isomerization (Giannetto, Perot, et al. 1986). In a typical isomerization reaction, normal paraffins are dehydrogenated on the metal sites of the catalyst and reacting on the acid sites to produce olefins protonate with formation of the alkylcarbenium ion. The alkylcarbenium ion is rearranged to monobranched, dibranched, and tribranched alkylcarbenium ions on the acid site. The branched alkylcarbenium ions are deprotonated and hydrogenated to produce the corresponding paraffins (Park and Ihm 2000). The choice of catalyst will result in variation of cracking at the end of the paraffin molecule and, therefore, adjust the yield of jet—fuel-range product (Kalnes, McCall, et al. 2010). The hydroisomerization and hydrocracking processes are followed by a fractionation process to separate the mixtures to paraffinic kerosene (HRJ SPK), paraffinic diesel, naphtha, and light gases.
2.2.2.2 Catalytic hydrothermolysis (CH) Catalytic hydrothermolysis (CH), also named hydrothermal liquefaction, is a novel process that has been developed and patented by Applied Research Associates, Inc., for producing "renewable, aromatic, and drop-in" fuels from plant or algal oils (Applied Research Associate Inc 2012). The hydrothermal process (Figure 3) contains a series of reactions, including cracking, hydrolysis, decarboxylation, isomerization, and cyclization, that turns triglycerides into a mixture of straight chain, branched, and cyclic hydrocarbons (Li, Coppola, et al. 2010).
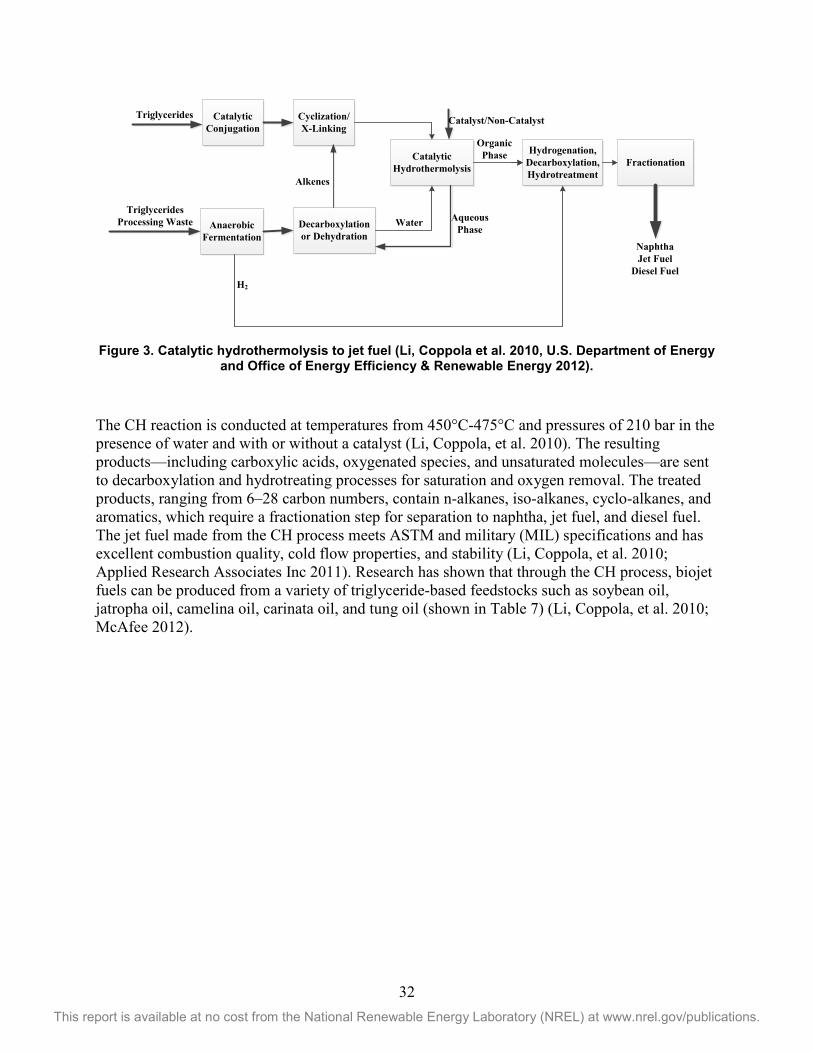
32 This report is available at no cost from the National Renewable Energy Laboratory (NREL) at www.nrel.gov/publications.
Triglycerides
Triglycerides Processing Waste
Catalytic Conjugation
Anaerobic Fermentation
Decarboxylation or Dehydration
Cyclization/X-Linking
Catalytic Hydrothermolysis
Hydrogenation, Decarboxylation, Hydrotreatment
Fractionation
H2
Alkenes
Catalyst/Non-Catalyst
Water
Organic Phase
Aqueous Phase
Naphtha Jet Fuel
Diesel Fuel
Figure 3. Catalytic hydrothermolysis to jet fuel (Li, Coppola et al. 2010, U.S. Department of Energy and Office of Energy Efficiency & Renewable Energy 2012).
The CH reaction is conducted at temperatures from 450°C-475°C and pressures of 210 bar in the presence of water and with or without a catalyst (Li, Coppola, et al. 2010). The resulting products—including carboxylic acids, oxygenated species, and unsaturated molecules—are sent to decarboxylation and hydrotreating processes for saturation and oxygen removal. The treated products, ranging from 6–28 carbon numbers, contain n-alkanes, iso-alkanes, cyclo-alkanes, and aromatics, which require a fractionation step for separation to naphtha, jet fuel, and diesel fuel. The jet fuel made from the CH process meets ASTM and military (MIL) specifications and has excellent combustion quality, cold flow properties, and stability (Li, Coppola, et al. 2010; Applied Research Associates Inc 2011). Research has shown that through the CH process, biojet fuels can be produced from a variety of triglyceride-based feedstocks such as soybean oil, jatropha oil, camelina oil, carinata oil, and tung oil (shown in Table 7) (Li, Coppola, et al. 2010; McAfee 2012).
33 This report is available at no cost from the National Renewable Energy Laboratory (NREL) at www.nrel.gov/publications.
Table 7. Biojet Fuels from the CH Process (Li, Coppola, et al. 2010; U.S. Department of Energy and Office of Energy Efficiency & Renewable Energy 2012)
JP-8 From
Soybean From
Jatropha From Tung From Camelina
From Carinata
MIL-DTL-83133H Spec Requirement
Aromatics 18.8 (vol%) 2.6 (wt%) 10.8 (wt%) 61.7 (wt%) 24.2 (vol%) 16.8 (vol%) ≤ 25.0 Paraffins (normal + iso) N/A 40.0 (vol%) 32.8 (wt%) 16.2 (wt%) N/A N/A N/A
Olefins 0.8 (vol%) N/A N/A N/A 1.3 (vol%) 1.8 (vol%) ≤ 5.0 (vol%) Cycloparaffins N/A 52.0 (vol%) 39.2 (wt%) 16.7 (wt%) N/A N/A N/A
Dicycloparaffins, vol% N/A 5.9 (vol%) N/A N/A N/A N/A N/A Heat of Combustion, MJ/kg 43.3 43.4 43.4 42.3 42.9 43.2 ≥ 42.8
Smoke Point, mm 22 > 30 28 N/A 22 26 ≥ 19 Freeze Point, C -51 < -47 -39 < -66 -54 -57 ≤ -47 Flash Point, C 51 > 38 45 39 48 46 ≥ 38
Distillation (D2887, D86) N/A pass 195-229 187-252 N/A N/A N/A Density, kg/L 0.804 0.793 0.804 0.839 0.818 0.802 0.775-0.840
Acid Number, mg of KOH/g 0.003 < 0.010 < 0.010 N/A 0.011 0.012 ≤ 0.015 Hydrogen, wt% 13.8 N/A 14 11.9 13.8 13.8 ≥ 13.4
Viscosity at -40C, cSt 9.9 N/A N/A N/A 7.4 6.5 ≤ 12.0 Cetane Index N/A N/A 43.9 34.2 N/A N/A N/A
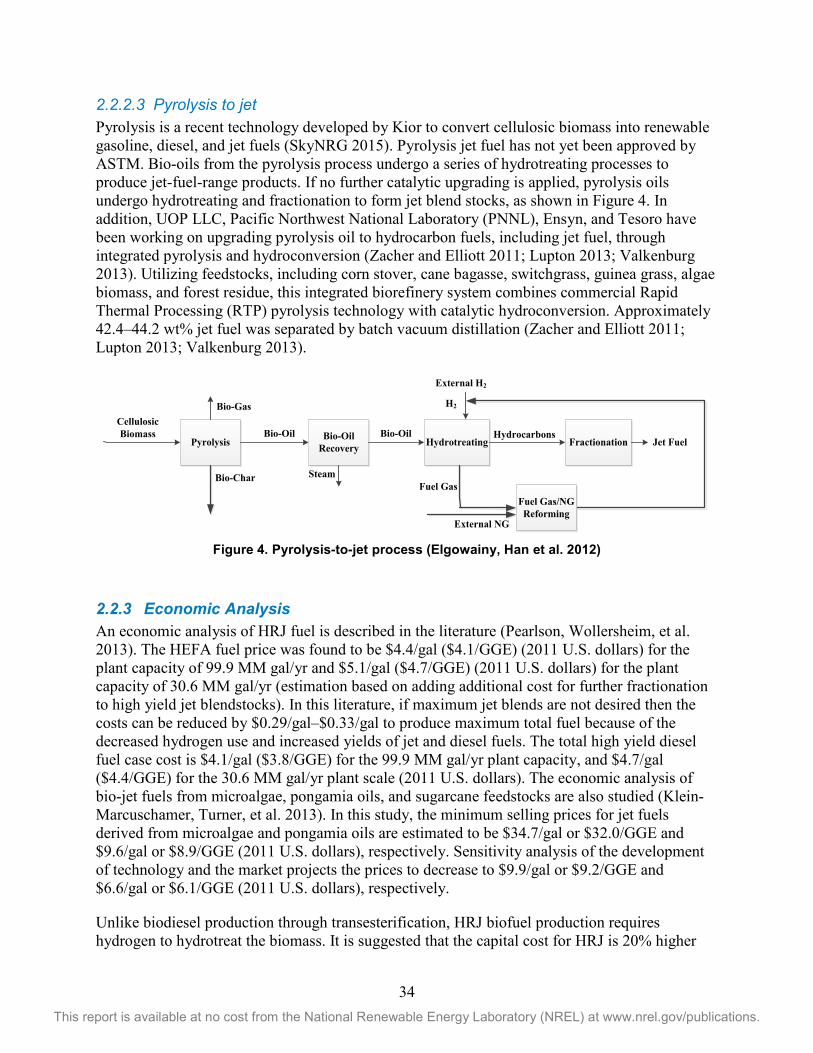
34 This report is available at no cost from the National Renewable Energy Laboratory (NREL) at www.nrel.gov/publications.
2.2.2.3 Pyrolysis to jet Pyrolysis is a recent technology developed by Kior to convert cellulosic biomass into renewable gasoline, diesel, and jet fuels (SkyNRG 2015). Pyrolysis jet fuel has not yet been approved by ASTM. Bio-oils from the pyrolysis process undergo a series of hydrotreating processes to produce jet-fuel-range products. If no further catalytic upgrading is applied, pyrolysis oils undergo hydrotreating and fractionation to form jet blend stocks, as shown in Figure 4. In addition, UOP LLC, Pacific Northwest National Laboratory (PNNL), Ensyn, and Tesoro have been working on upgrading pyrolysis oil to hydrocarbon fuels, including jet fuel, through integrated pyrolysis and hydroconversion (Zacher and Elliott 2011; Lupton 2013; Valkenburg 2013). Utilizing feedstocks, including corn stover, cane bagasse, switchgrass, guinea grass, algae biomass, and forest residue, this integrated biorefinery system combines commercial Rapid Thermal Processing (RTP) pyrolysis technology with catalytic hydroconversion. Approximately 42.4–44.2 wt% jet fuel was separated by batch vacuum distillation (Zacher and Elliott 2011; Lupton 2013; Valkenburg 2013).
Pyrolysis
Cellulosic Biomass Bio-Oil
Recovery Hydrotreating
H2
FractionationBio-Oil
Jet Fuel
SteamBio-Char
Bio-Gas
Fuel Gas
External NG
Fuel Gas/NG Reforming
Bio-Oil Hydrocarbons
External H2
Figure 4. Pyrolysis-to-jet process (Elgowainy, Han et al. 2012)
2.2.3 Economic Analysis An economic analysis of HRJ fuel is described in the literature (Pearlson, Wollersheim, et al. 2013). The HEFA fuel price was found to be $4.4/gal ($4.1/GGE) (2011 U.S. dollars) for the plant capacity of 99.9 MM gal/yr and $5.1/gal ($4.7/GGE) (2011 U.S. dollars) for the plant capacity of 30.6 MM gal/yr (estimation based on adding additional cost for further fractionation to high yield jet blendstocks). In this literature, if maximum jet blends are not desired then the costs can be reduced by $0.29/gal–$0.33/gal to produce maximum total fuel because of the decreased hydrogen use and increased yields of jet and diesel fuels. The total high yield diesel fuel case cost is $4.1/gal ($3.8/GGE) for the 99.9 MM gal/yr plant capacity, and $4.7/gal ($4.4/GGE) for the 30.6 MM gal/yr plant scale (2011 U.S. dollars). The economic analysis of bio-jet fuels from microalgae, pongamia oils, and sugarcane feedstocks are also studied (Klein-Marcuschamer, Turner, et al. 2013). In this study, the minimum selling prices for jet fuels derived from microalgae and pongamia oils are estimated to be $34.7/gal or $32.0/GGE and $9.6/gal or $8.9/GGE (2011 U.S. dollars), respectively. Sensitivity analysis of the development of technology and the market projects the prices to decrease to $9.9/gal or $9.2/GGE and $6.6/gal or $6.1/GGE (2011 U.S. dollars), respectively.
Unlike biodiesel production through transesterification, HRJ biofuel production requires hydrogen to hydrotreat the biomass. It is suggested that the capital cost for HRJ is 20% higher
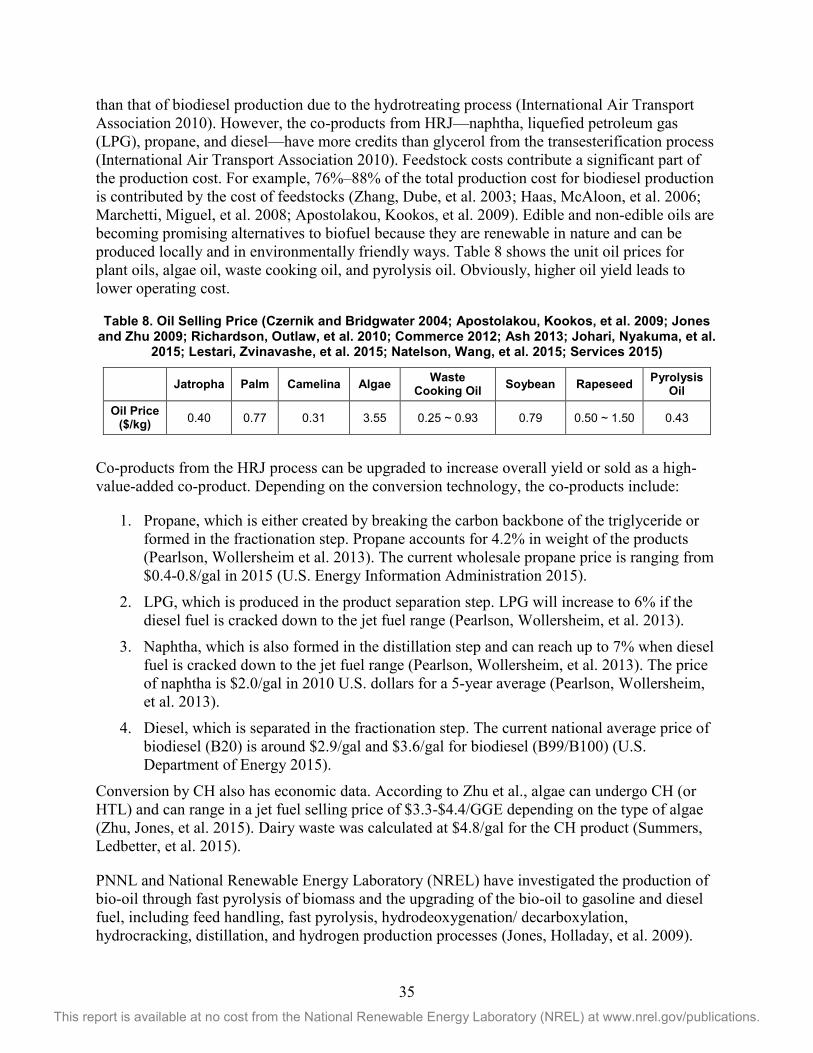
35 This report is available at no cost from the National Renewable Energy Laboratory (NREL) at www.nrel.gov/publications.
than that of biodiesel production due to the hydrotreating process (International Air Transport Association 2010). However, the co-products from HRJ—naphtha, liquefied petroleum gas (LPG), propane, and diesel—have more credits than glycerol from the transesterification process (International Air Transport Association 2010). Feedstock costs contribute a significant part of the production cost. For example, 76%–88% of the total production cost for biodiesel production is contributed by the cost of feedstocks (Zhang, Dube, et al. 2003; Haas, McAloon, et al. 2006; Marchetti, Miguel, et al. 2008; Apostolakou, Kookos, et al. 2009). Edible and non-edible oils are becoming promising alternatives to biofuel because they are renewable in nature and can be produced locally and in environmentally friendly ways. Table 8 shows the unit oil prices for plant oils, algae oil, waste cooking oil, and pyrolysis oil. Obviously, higher oil yield leads to lower operating cost.
Table 8. Oil Selling Price (Czernik and Bridgwater 2004; Apostolakou, Kookos, et al. 2009; Jones and Zhu 2009; Richardson, Outlaw, et al. 2010; Commerce 2012; Ash 2013; Johari, Nyakuma, et al.
2015; Lestari, Zvinavashe, et al. 2015; Natelson, Wang, et al. 2015; Services 2015)
Jatropha Palm Camelina Algae Waste Cooking Oil Soybean Rapeseed Pyrolysis
Oil Oil Price
($/kg) 0.40 0.77 0.31 3.55 0.25 ~ 0.93 0.79 0.50 ~ 1.50 0.43
Co-products from the HRJ process can be upgraded to increase overall yield or sold as a high-value-added co-product. Depending on the conversion technology, the co-products include:
1. Propane, which is either created by breaking the carbon backbone of the triglyceride or formed in the fractionation step. Propane accounts for 4.2% in weight of the products (Pearlson, Wollersheim et al. 2013). The current wholesale propane price is ranging from $0.4-0.8/gal in 2015 (U.S. Energy Information Administration 2015).
2. LPG, which is produced in the product separation step. LPG will increase to 6% if the diesel fuel is cracked down to the jet fuel range (Pearlson, Wollersheim, et al. 2013).
3. Naphtha, which is also formed in the distillation step and can reach up to 7% when diesel fuel is cracked down to the jet fuel range (Pearlson, Wollersheim, et al. 2013). The price of naphtha is $2.0/gal in 2010 U.S. dollars for a 5-year average (Pearlson, Wollersheim, et al. 2013).
4. Diesel, which is separated in the fractionation step. The current national average price of biodiesel (B20) is around $2.9/gal and $3.6/gal for biodiesel (B99/B100) (U.S. Department of Energy 2015).
Conversion by CH also has economic data. According to Zhu et al., algae can undergo CH (or HTL) and can range in a jet fuel selling price of $3.3-$4.4/GGE depending on the type of algae (Zhu, Jones, et al. 2015). Dairy waste was calculated at $4.8/gal for the CH product (Summers, Ledbetter, et al. 2015).
PNNL and National Renewable Energy Laboratory (NREL) have investigated the production of bio-oil through fast pyrolysis of biomass and the upgrading of the bio-oil to gasoline and diesel fuel, including feed handling, fast pyrolysis, hydrodeoxygenation/ decarboxylation, hydrocracking, distillation, and hydrogen production processes (Jones, Holladay, et al. 2009).
36 This report is available at no cost from the National Renewable Energy Laboratory (NREL) at www.nrel.gov/publications.
Based on 2000 dry metric tons per day of hybrid poplar wood chips ($62.8/dry metric ton), the minimum fuels (gasoline + diesel) selling price is $2.0/gal in 2007 U.S. dollars ($2.5/gal in 2011 U.S. dollars) (Jones, Holladay, et al. 2009). Similar study has been done in a 2010 NREL report (Wright, Satrio, et al. 2010). Based on corn stover feedstock ($80/dry metric ton), the product value was estimated to be $3.1/GGE in 2012 dollars ($3.0/GGE on 2011 U.S. dollars) with onsite hydrogen production and $2.1/GGE in 2012 dollars ($2.0/GGE on 2011 U.S. dollars) with hydrogen purchase (Wright, Satrio, et al. 2010).
Due to the variability of process designs, product and co-product balances, and the uncertainty of process performances, it is necessary to use a biorefinery analysis concept, such as TEA, to understand these conversion technologies. Research needs to be continued to determine the production costs for both the CH (hydrothermal liquefaction) and the hydrotreated depolymerized cellulosic jet (fast pyrolysis) processes to fully understand the trade-offs and near-term commercial readiness.
2.2.4 Life-Cycle Assessment Several research groups have quantified life cycle GHG emissions for jet fuel production from oils (Hileman, Ortiz, et al. 2009; Bailis and Baka 2010; Stratton, Wong, et al. 2010). The GHG emissions for soybean oil are about 31%–68% of those of conventional jet fuel (89 gCO2e/MJ WTW GHG emissions for conventional crude pathway), resulting from the soybean yield, N2O emissions from fertilizer, liming emissions, and H2 requirements in the hydrotreating process (Hileman, Ortiz, et al. 2009; Bailis and Baka 2010; Stratton, Wong, et al. 2010). Land use change (LUC) has impacts on the global carbon cycle and thus can be a factor in CO2 atmospheric concentration. Depending on the type of feedstocks, LUC impact can be positive or negative. The GHG emissions, therefore, vary when land-use change is considered. Low soybean yield from tropical rainforests results in 800% more emissions than conventional jet fuel (Hileman, Ortiz, et al. 2009). The emissions of the palm OTJ fuel process are calculated between 22.5–38.1 gCO2e/MJ, which is about 26%–44% of those of conventional jet fuel production processes, resulting from palm fresh-fruit-bunch yield per acre, farming energy, methane emissions from palm oil-mill effluent treatment, H2 requirements in the hydrotreating process, and hydroprocessing fuel yield (Hileman, Ortiz, et al. 2009; Bailis and Baka 2010; Stratton, Wong, et al. 2010). GHG emissions can increase to the range of 45%–800% of those of conventional jet fuel when accounting for different scenarios of land use change (Stratton, Wong, et al. 2010).
For rapeseed oil, the emissions are around 45%–87% of those of conventional jet fuels and increase to 87%– 147% when considering land use change (Hileman, Ortiz, et al. 2009; Bailis and Baka 2010; Stratton, Wong, et al. 2010). For jatropha oil, the emissions are 36%–52% of those from conventional jet fuel, and N2O emissions represent more than 20% of the total emissions (Hileman, Ortiz, et al. 2009; Bailis and Baka 2010; Stratton, Wong, et al. 2010). Zero emissions from land use change are assumed for jatropha feedstock, based on the use of marginal land (Stratton, Wong, et al. 2010). Other research shows the emissions from jatropha OTJ conversion were 40 gCO2e/MJ of fuel produced, approximately 55% of the conventional jet fuel, and land use change can modify GHG emissions from 18%–194% (Bailis and Baka 2010). For algae oil, the emissions from jet fuel production from algae oil exaction range from 16%–221% of those from conventional jet fuel; the wide GHG emission range of microalgae-based jet fuel is
37 This report is available at no cost from the National Renewable Energy Laboratory (NREL) at www.nrel.gov/publications.
attributed to the uncertainty of emissions from CO2 injection and dewatering and drying processes (Stratton, Wong, et al. 2010).
Another LCA was performed for a functional unit of 1 gigajoule (GJ) of biojet fuel produced through thermochemical conversion (hydrothermal liquefaction (HTL)) of microalgae cultivated in wastewater effluent (Fortier, Roberts, et al. 2014). It is found that the GHG emissions of algal biojet fuel can be reduced by 76% compared to conventional jet fuel, with feasible improvements in those sensitive parameters and siting HTL at a wastewater treatment plant (WWTP). For salicornia oil, the emissions range from 35%–76% of those from conventional jet fuel (Stratton, Wong, et al. 2010). The GHG emissions of liquid fuel production via fast pyrolysis of cellulosic biomass have been studied by researchers at Argonne National Laboratory (ANL) (Elgowainy, Han, et al. 2012). ANL analyzed life cycle GHG emissions with a variety of hydrogen sources. When hydrogen is generated from natural gas and bio-char is used to support the process energy, the GHG emissions are reduced by 45% relative to conventional fuels. When hydrogen is produced from reforming of pyrolysis oil and bio-char is applied as the fertilizer, the GHG emissions are reduced by 103% relative to conventional fuels (Elgowainy, Han, et al. 2012).
2.2.5 Commercialization Readiness The HRJ process, as the first approved biomass-derived jet fuel conversion technology, has had increased attention from commercial entities and federal agencies in recent years, as shown in Table 1. Starting in 2008, several companies and government agencies began conducting laboratory analysis of biojet fuels derived from oil, specifically HRJ fuel, with many test flights using fuel from biomass-derived sources (ExxonMobil Aviation 2005, ONGC and Quality Control Laboratory 2008, U.S. Department of Defense 2011, American Society for Testing and Materials 2013, U.K. Ministry of Defence 2013). As stated in previous section, Dynamic Fuels has been awarded a contract to supply the U.S. Navy with 100,000 gallons of hydro-treated renewable JP-5 and 350,000 gallons of hydrotreated renewable F-76 (Syntroleum Corporation 2011).
The biojet fuel produced by Neste Oil, based on NExBTL technology, was from a range of triglyceride-based oils such as vegetable oils, jatropha oil, camelina oil, and waste animal fats (Neste Oil 2011). This aviation fuel meets the ASTM quality standards for the aviation industry, with high energy content and good performance levels in very cold conditions. NExBTL renewable aviation fuel can reduce the aircraft’s environmental impact significantly, such as a smaller carbon footprint and lower NOx emissions (BiofuelsDigest 2015). Starting in July 2011, Lufthansa AG, a German airline, began scheduled commercial flights using Neste Oil’s NExBTL renewable aviation fuel. Lufthansa was the world’s first commercial airline to use biofuel in daily flights, and Neste Oil was the first company to provide aviation biofuel for regularly scheduled flights (Lufthansa Group 2010; European Biofuels Technology Platform 2012).
Honeywell's UOP, a leading licenser of the HRJ technology, has been turning different feedstocks into HRJ fuel through the UOP Renewable Jet Process (International Air Transport Association 2010). Starting from a variety of feedstocks, such as jatropha, algae, and camelina, Honeywell Green Jet Fuel meets or exceeds all critical specifications for flight (UOP LLC 2010). At a 50% blend it can be used as a drop-in replacement, requiring no changes to fleet technology or the fuel storage and delivery infrastructure(UOP LLC 2010) .UOP was selected as one of Boeing’s 2009 "suppliers of the year" and has been supporting Boeing’s biofuel flight test
38 This report is available at no cost from the National Renewable Energy Laboratory (NREL) at www.nrel.gov/publications.
program and research projects (Honeywell). UOP has produced up to 190,000 gallons of HRJ-5 fuel for the U.S. Navy and 400,000 gallons of HRJ-8 fuel for the U.S. Air Force from sustainable, non-food feedstocks including animal fats, algae, and camelina (U.S. Department of Defense 2011).
In October 2012, Aemetis Inc. signed a license agreement with Chevron Lummus Global for production of renewable jet and diesel fuels using the CH process (Biodiesel Magazine 2012). An existing Aemetis oil refinery in Great Falls, Montana, has been converted to a renewable jet fuel and diesel production facility with a capacity of 50 MM gallons per year (Aemetis 2012). The jet fuel produced by Aemetis was tested by the National Research Council (NRC) Canada, U.S. Air Force Research Laboratory (AFRL), Rolls-Royce/FAA Continuous Lower Energy, Emissions and Noise (CLEEN) program, and Pratt & Whitney/FAA CLEEN program (Federal Aviation Administration 2012; Rolls-Royce; Edwards 2008; Biomass Magazine 2013; Pratt & Whitney 2014). The flight test by NRC Canada took place in October 2012 using jet fuels derived from 100% carinata oil (U.S. Department of Energy and Office of Energy Efficiency & Renewable Energy 2012). This was the first time that an aircraft was fueled by unblended biojet fuel.
Renewable jet fuel companies are seeking sustainable production scenarios that not only minimize the impact on land use change and food and water resources, but also provide an energy alternative that is economically competitive with current conventional jet fuels.
2.3 Gas-to-Jet (GTJ) Fuel The GTJ pathway presented here describes the conversion processes that turn biogas, natural gas, or syngas into biojet fuel. The FT and gas fermentation processes are classified in this pathway and are reviewed here.
2.3.1 Feedstocks For the production of gas-derived fuels, the essential requirement for the feedstock is the carbon content (ASTM International 2013). It is additionally desired that hydrogen be contained in the feedstock to increase the efficiency of the process. The feedstocks for the GTJ process can be composed of any carbon materials. Currently, the most common feedstocks used to produce gas (then to jet fuel) are coal, natural gas, and biomass. Coal and natural gas are both of geologic origin and are not sustainable or renewable. The process using natural gas, often referred to as the gas-to-liquid (GTL) process, makes fuel products free of sulfur and aromatics (Rahmim 2003). There are currently five GTL plants operating globally, with capacities ranging from 2,700 barrels per day (bbl/d) to 140,000 bbl/d (U.S. Energy Information Administration 2014). Therefore, it is critical to provide a large volume of low-priced natural gas or syngas feedstocks for the FT-GTL process. Coal is an alternative feedstock to the FT process, referred to as coal-to-liquid (FT-CTL) technology, providing a range of important products that are produced by liquefying coal (Bowen, Irwin, et al. 2007). It is reported that in 2013 coal production in the United States reached 985 MM short tons (U.S. Energy Information Administration 2013).
Although biomass is renewable, different types of biomass have different carbon contents that can affect jet fuel yield. For example, woody biomass has a carbon content that varies from 46%–53% and agricultural residues have larger variation of carbon contents, that is from 38%–58% (Antal, Allen, et al. 2000). The biomass-to-liquid process (BTL process) is a
39 This report is available at no cost from the National Renewable Energy Laboratory (NREL) at www.nrel.gov/publications.
thermochemical route that produces synthetic fuels from biomass. The choice of feedstock and pretreatment steps are closely related to the economic results. A wide variety of woody biomass and agriculture waste feedstocks, which contain abundant carbon and hydrogen, can be used for this thermochemical routine (NNFCC 2009). Production of renewable fuels using the BTL process has received attention recently due to the capability of producing carbon-neutral and environmentally friendly clean fuels. Another renewable feedstock is biogas produced from anaerobic digestion of organic matter, such as animal manure, landfills and wastewater, or from co-digestion of mixing liquid and solid biomass (Hessami, Christensen, et al. 1996; Lastella, Testa, et al. 2002; Jingura and Matengaifa 2009). After purification by means of CO2 adsorption, the methane product can serve as the gas feedstock for the GTJ process (Lastella, Testa, et al. 2002).
2.3.2 Process Description 2.3.2.1 Fischer-Tropsch biomass to liquid (FT-BTL) process The FT process is capable of producing liquid hydrocarbon fuels from syngas. FT fuels are typically free of sulfur and contain very few aromatics compared to gasoline and diesel, which leads to lower emissions when used in jet engines (Bauen, Howes, et al. 2009). Some recent studies point out that the use of the FT technology to convert biomass to synthetic fuels may provide a promising carbon-neutral alternative to conventional diesel, kerosene, and gasoline (Dry 1996; Kreutz, Larson, et al. 2008; Hu 2012). The process reviewed here is the FT-BTL process.
In the BTL process (Figure 5), biomass feedstocks are first dried and milled to reduce moisture content and the particle sizes during pretreatment (You and Wang 2011). Multiple gasification technologies exist to convert the biomass to syngas. In a high- temperature (slagging) gasification process, the dried biomass is pressurized and converted into raw synthesis gas during gasification at temperatures around 1,300°C in the presence of high-purity oxygen and steam (You and Wang 2011). A combustor is included to provide heat to dry the biomass. The direct-quench syngas cooling system next to the gasifier removes ash and tars, and a water-gas-shift system after quench is applied to adjust the H2:CO ratio to 2.1:1 (You and Wang 2011).
There are two primary classes of gasifiers—partial oxidation or direct gasifiers, and indirect steam-blown gasifiers (Dutta, Talmadge, et al. 2011). Directly heated gasifiers use heat from the reaction between oxygen and organic compounds to provide the necessary energy to devolatilize biomass and to react with carbon-rich chars to break their complex molecules into gases. Directly heated gasifiers require high-purity oxygen provided by air separation units, which involves significant capital investment and subjected to utmost stringent safety standard. The capital intensity of these systems makes direct gasification processes more cost-prohibitive for smaller scale biomass conversion plants (Wyman, Bain, et al. 1993; Dutta, Talmadge, et al. 2011). At the other end, indirect steam gasifiers are heated via heat transfer from a hot solid or through a heat transfer surface. Co-product char and portions of the product gas can be combusted with air (external to the gasifier itself) to provide the energy for gasification. NREL has conducted an investigation on indirect gasification and tar reforming (Dutta, Talmadge, et al. 2011; Tan, Talmadge, et al. Mar. 2015). In this design, the endothermic gasification process is indirectly heated by the circulation of heated synthetic olivine sand and the biomass in the
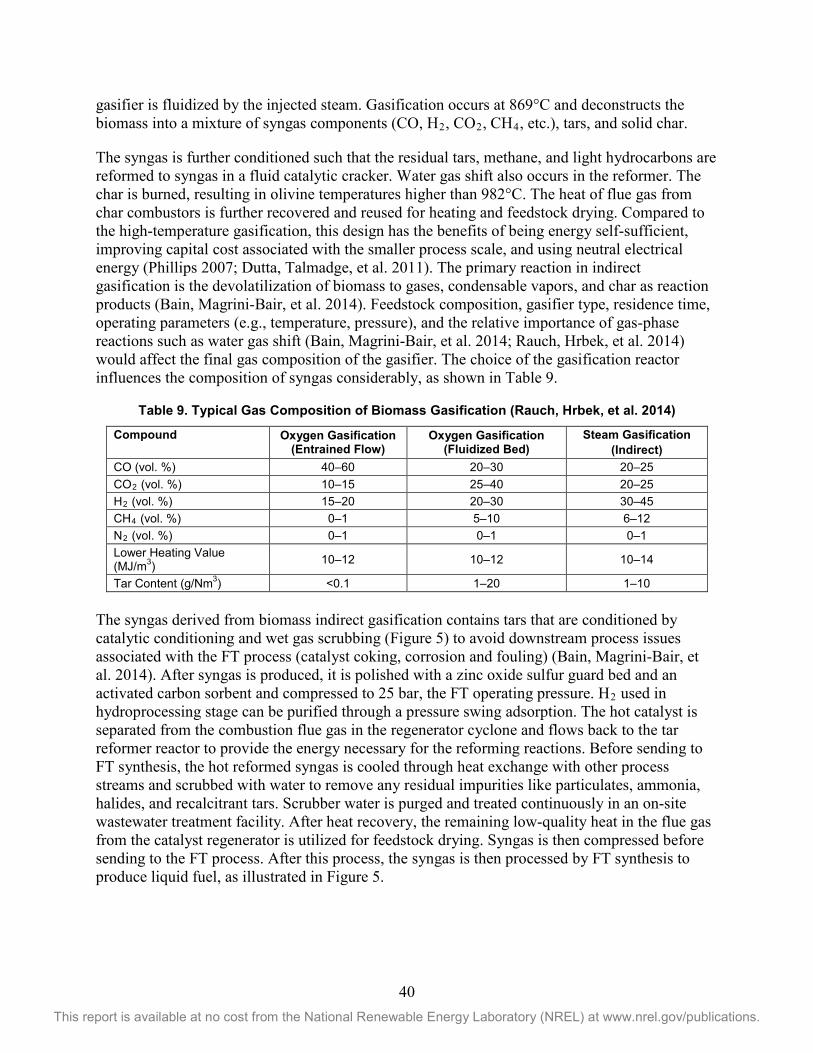
40 This report is available at no cost from the National Renewable Energy Laboratory (NREL) at www.nrel.gov/publications.
gasifier is fluidized by the injected steam. Gasification occurs at 869°C and deconstructs the biomass into a mixture of syngas components (CO, H2, CO2, CH4, etc.), tars, and solid char.
The syngas is further conditioned such that the residual tars, methane, and light hydrocarbons are reformed to syngas in a fluid catalytic cracker. Water gas shift also occurs in the reformer. The char is burned, resulting in olivine temperatures higher than 982°C. The heat of flue gas from char combustors is further recovered and reused for heating and feedstock drying. Compared to the high-temperature gasification, this design has the benefits of being energy self-sufficient, improving capital cost associated with the smaller process scale, and using neutral electrical energy (Phillips 2007; Dutta, Talmadge, et al. 2011). The primary reaction in indirect gasification is the devolatilization of biomass to gases, condensable vapors, and char as reaction products (Bain, Magrini-Bair, et al. 2014). Feedstock composition, gasifier type, residence time, operating parameters (e.g., temperature, pressure), and the relative importance of gas-phase reactions such as water gas shift (Bain, Magrini-Bair, et al. 2014; Rauch, Hrbek, et al. 2014) would affect the final gas composition of the gasifier. The choice of the gasification reactor influences the composition of syngas considerably, as shown in Table 9.
Table 9. Typical Gas Composition of Biomass Gasification (Rauch, Hrbek, et al. 2014)
Compound Oxygen Gasification (Entrained Flow)
Oxygen Gasification (Fluidized Bed)
Steam Gasification (Indirect)
CO (vol. %) 40–60 20–30 20–25 CO2 (vol. %) 10–15 25–40 20–25 H2 (vol. %) 15–20 20–30 30–45 CH4 (vol. %) 0–1 5–10 6–12 N2 (vol. %) 0–1 0–1 0–1 Lower Heating Value (MJ/m3) 10–12 10–12 10–14
Tar Content (g/Nm3) <0.1 1–20 1–10 The syngas derived from biomass indirect gasification contains tars that are conditioned by catalytic conditioning and wet gas scrubbing (Figure 5) to avoid downstream process issues associated with the FT process (catalyst coking, corrosion and fouling) (Bain, Magrini-Bair, et al. 2014). After syngas is produced, it is polished with a zinc oxide sulfur guard bed and an activated carbon sorbent and compressed to 25 bar, the FT operating pressure. H2 used in hydroprocessing stage can be purified through a pressure swing adsorption. The hot catalyst is separated from the combustion flue gas in the regenerator cyclone and flows back to the tar reformer reactor to provide the energy necessary for the reforming reactions. Before sending to FT synthesis, the hot reformed syngas is cooled through heat exchange with other process streams and scrubbed with water to remove any residual impurities like particulates, ammonia, halides, and recalcitrant tars. Scrubber water is purged and treated continuously in an on-site wastewater treatment facility. After heat recovery, the remaining low-quality heat in the flue gas from the catalyst regenerator is utilized for feedstock drying. Syngas is then compressed before sending to the FT process. After this process, the syngas is then processed by FT synthesis to produce liquid fuel, as illustrated in Figure 5.
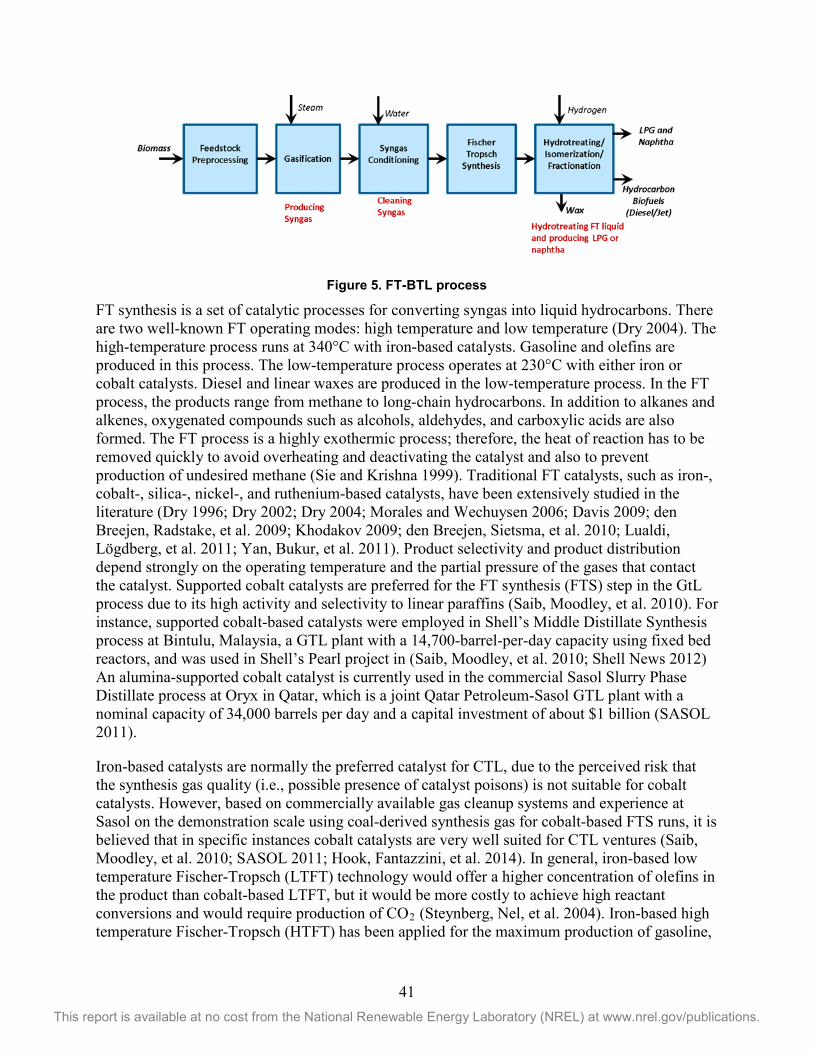
41 This report is available at no cost from the National Renewable Energy Laboratory (NREL) at www.nrel.gov/publications.
Figure 5. FT-BTL process
FT synthesis is a set of catalytic processes for converting syngas into liquid hydrocarbons. There are two well-known FT operating modes: high temperature and low temperature (Dry 2004). The high-temperature process runs at 340°C with iron-based catalysts. Gasoline and olefins are produced in this process. The low-temperature process operates at 230°C with either iron or cobalt catalysts. Diesel and linear waxes are produced in the low-temperature process. In the FT process, the products range from methane to long-chain hydrocarbons. In addition to alkanes and alkenes, oxygenated compounds such as alcohols, aldehydes, and carboxylic acids are also formed. The FT process is a highly exothermic process; therefore, the heat of reaction has to be removed quickly to avoid overheating and deactivating the catalyst and also to prevent production of undesired methane (Sie and Krishna 1999). Traditional FT catalysts, such as iron-, cobalt-, silica-, nickel-, and ruthenium-based catalysts, have been extensively studied in the literature (Dry 1996; Dry 2002; Dry 2004; Morales and Wechuysen 2006; Davis 2009; den Breejen, Radstake, et al. 2009; Khodakov 2009; den Breejen, Sietsma, et al. 2010; Lualdi, Lögdberg, et al. 2011; Yan, Bukur, et al. 2011). Product selectivity and product distribution depend strongly on the operating temperature and the partial pressure of the gases that contact the catalyst. Supported cobalt catalysts are preferred for the FT synthesis (FTS) step in the GtL process due to its high activity and selectivity to linear paraffins (Saib, Moodley, et al. 2010). For instance, supported cobalt-based catalysts were employed in Shell’s Middle Distillate Synthesis process at Bintulu, Malaysia, a GTL plant with a 14,700-barrel-per-day capacity using fixed bed reactors, and was used in Shell’s Pearl project in (Saib, Moodley, et al. 2010; Shell News 2012) An alumina-supported cobalt catalyst is currently used in the commercial Sasol Slurry Phase Distillate process at Oryx in Qatar, which is a joint Qatar Petroleum-Sasol GTL plant with a nominal capacity of 34,000 barrels per day and a capital investment of about $1 billion (SASOL 2011).
Iron-based catalysts are normally the preferred catalyst for CTL, due to the perceived risk that the synthesis gas quality (i.e., possible presence of catalyst poisons) is not suitable for cobalt catalysts. However, based on commercially available gas cleanup systems and experience at Sasol on the demonstration scale using coal-derived synthesis gas for cobalt-based FTS runs, it is believed that in specific instances cobalt catalysts are very well suited for CTL ventures (Saib, Moodley, et al. 2010; SASOL 2011; Hook, Fantazzini, et al. 2014). In general, iron-based low temperature Fischer-Tropsch (LTFT) technology would offer a higher concentration of olefins in the product than cobalt-based LTFT, but it would be more costly to achieve high reactant conversions and would require production of CO2 (Steynberg, Nel, et al. 2004). Iron-based high temperature Fischer-Tropsch (HTFT) has been applied for the maximum production of gasoline,
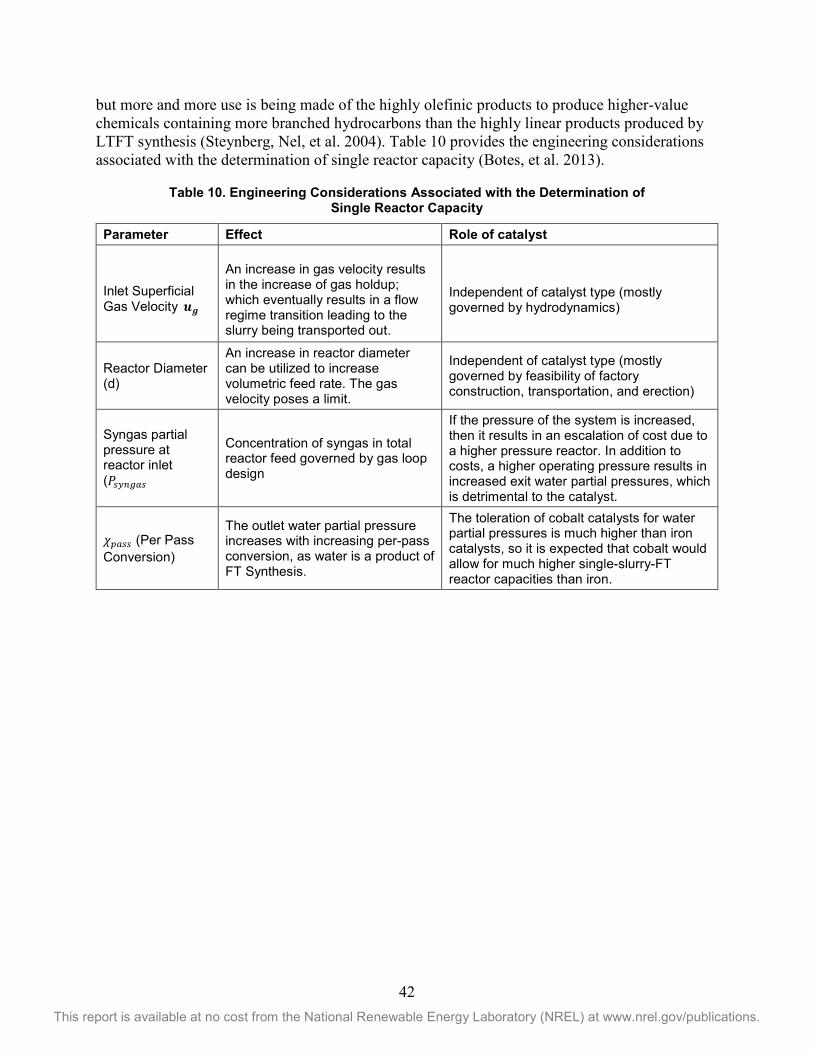
42 This report is available at no cost from the National Renewable Energy Laboratory (NREL) at www.nrel.gov/publications.
but more and more use is being made of the highly olefinic products to produce higher-value chemicals containing more branched hydrocarbons than the highly linear products produced by LTFT synthesis (Steynberg, Nel, et al. 2004). Table 10 provides the engineering considerations associated with the determination of single reactor capacity (Botes, et al. 2013).
Table 10. Engineering Considerations Associated with the Determination of Single Reactor Capacity
Parameter Effect Role of catalyst
Inlet Superficial Gas Velocity(𝒖𝒖𝒈𝒈)
An increase in gas velocity results in the increase of gas holdup; which eventually results in a flow regime transition leading to the slurry being transported out.
Independent of catalyst type (mostly governed by hydrodynamics)
Reactor Diameter (d)
An increase in reactor diameter can be utilized to increase volumetric feed rate. The gas velocity poses a limit.
Independent of catalyst type (mostly governed by feasibility of factory construction, transportation, and erection)
Syngas partial pressure at reactor inlet (𝑃𝑃𝑠𝑠𝑠𝑠𝑠𝑠𝑠𝑠𝑠𝑠𝑠𝑠)
Concentration of syngas in total reactor feed governed by gas loop design
If the pressure of the system is increased, then it results in an escalation of cost due to a higher pressure reactor. In addition to costs, a higher operating pressure results in increased exit water partial pressures, which is detrimental to the catalyst.
𝜒𝜒𝑝𝑝𝑠𝑠𝑠𝑠𝑠𝑠 (Per Pass Conversion)
The outlet water partial pressure increases with increasing per-pass conversion, as water is a product of FT Synthesis.
The toleration of cobalt catalysts for water partial pressures is much higher than iron catalysts, so it is expected that cobalt would allow for much higher single-slurry-FT reactor capacities than iron.
43 This report is available at no cost from the National Renewable Energy Laboratory (NREL) at www.nrel.gov/publications.
Sasol has reported the development of an internally cooled slurry reactor with ~2500 bbl/day capacity (5 m diameter and 22 mm height in 1993) (Krishna and Sie 2000) to 24,000 bbl/day as of 2013 (Botes, et al. 2013). Botes et al. (2013) (Botes, et al. 2013) have mentioned the engineering aspects associated with the design of a slurry bubble column reactor, which can be represented by the equation (4). Figure 6 shows various viable FT reactor configurations.
𝑆𝑆𝑆𝑆𝑆𝑆 = 𝑢𝑢𝑠𝑠 �
𝜋𝜋4𝑑𝑑2� �𝑃𝑃𝑠𝑠𝑠𝑠𝑠𝑠𝑠𝑠𝑠𝑠𝑠𝑠
𝑅𝑅𝑅𝑅� �𝜒𝜒𝑝𝑝𝑠𝑠𝑠𝑠𝑠𝑠� (4)
where SRC = Single Reactor Capacity 𝑢𝑢𝑠𝑠 = Inlet Superficial Gas Velocity d = Reactor Diameter 𝑃𝑃𝑠𝑠𝑠𝑠𝑠𝑠𝑠𝑠𝑠𝑠𝑠𝑠 = Syngas partial pressure at reactor inlet 𝜒𝜒𝑝𝑝𝑠𝑠𝑠𝑠𝑠𝑠 = Per Pass Conversion An important aspect of this process is the adjustment of the H2 to CO ratio, which is usually determined by the upstream gasification and reforming technologies employed (de Klerk 2011). As described by de Klerk (de Klerk 2013), the FT reaction involves catalytic CO polymerization and hydrogenation, where the chain growth and termination of the reaction products can be described by a carbon number distribution.
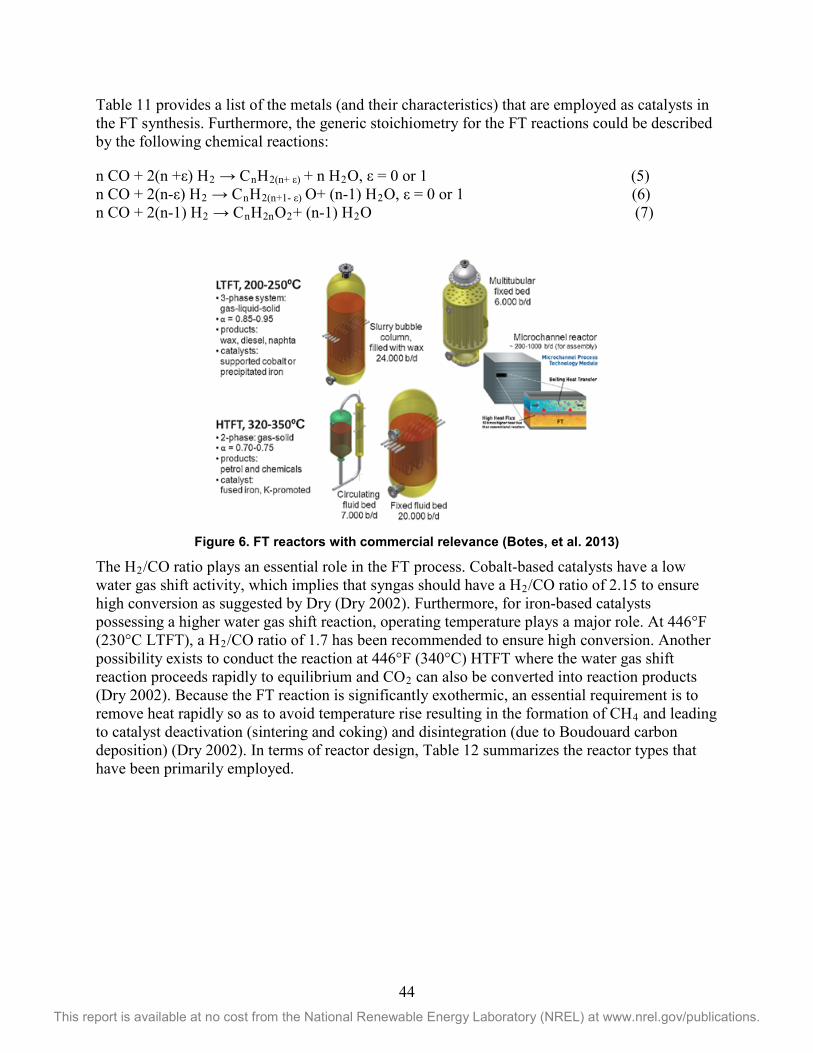
44 This report is available at no cost from the National Renewable Energy Laboratory (NREL) at www.nrel.gov/publications.
Table 11 provides a list of the metals (and their characteristics) that are employed as catalysts in the FT synthesis. Furthermore, the generic stoichiometry for the FT reactions could be described by the following chemical reactions:
n CO + 2(n +ε) H2 → CnH2(n+ ε) + n H2O, ε = 0 or 1 (5) n CO + 2(n-ε) H2 → CnH2(n+1- ε) O+ (n-1) H2O, ε = 0 or 1 (6) n CO + 2(n-1) H2 → CnH2nO2+ (n-1) H2O (7)
Figure 6. FT reactors with commercial relevance (Botes, et al. 2013)
The H2/CO ratio plays an essential role in the FT process. Cobalt-based catalysts have a low water gas shift activity, which implies that syngas should have a H2/CO ratio of 2.15 to ensure high conversion as suggested by Dry (Dry 2002). Furthermore, for iron-based catalysts possessing a higher water gas shift reaction, operating temperature plays a major role. At 446°F (230°C LTFT), a H2/CO ratio of 1.7 has been recommended to ensure high conversion. Another possibility exists to conduct the reaction at 446°F (340°C) HTFT where the water gas shift reaction proceeds rapidly to equilibrium and CO2 can also be converted into reaction products (Dry 2002). Because the FT reaction is significantly exothermic, an essential requirement is to remove heat rapidly so as to avoid temperature rise resulting in the formation of CH4 and leading to catalyst deactivation (sintering and coking) and disintegration (due to Boudouard carbon deposition) (Dry 2002). In terms of reactor design, Table 12 summarizes the reactor types that have been primarily employed.
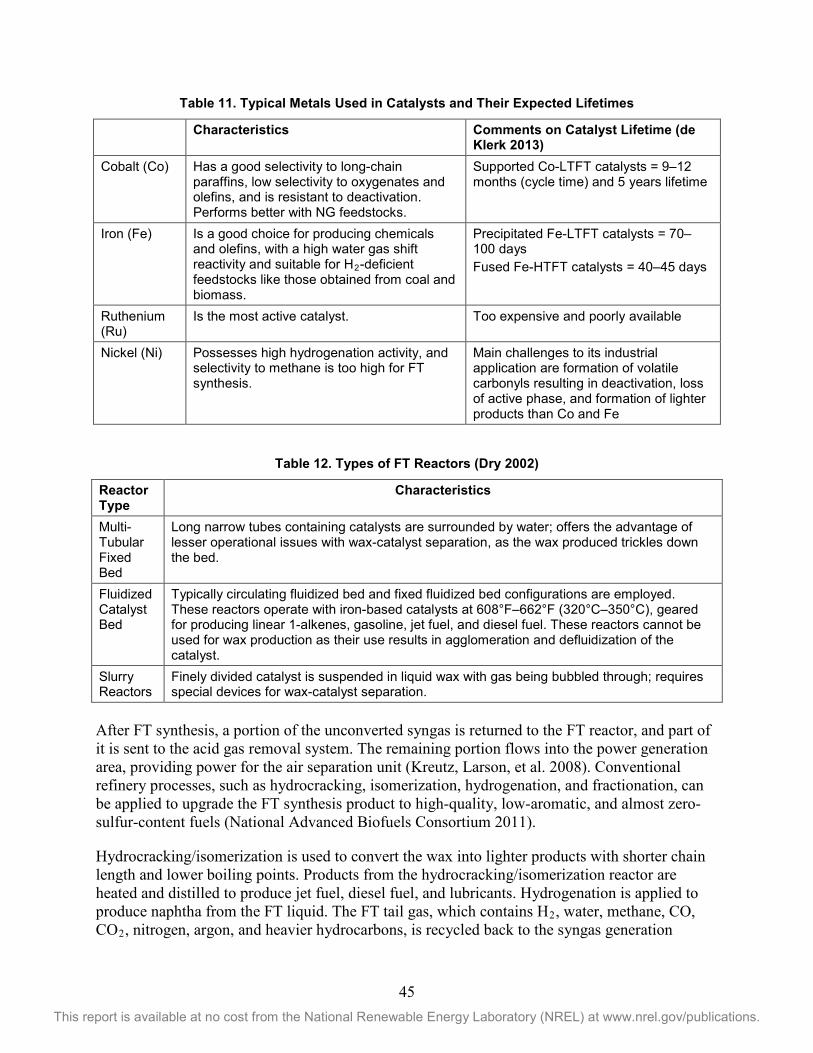
45 This report is available at no cost from the National Renewable Energy Laboratory (NREL) at www.nrel.gov/publications.
Table 11. Typical Metals Used in Catalysts and Their Expected Lifetimes
Characteristics Comments on Catalyst Lifetime (de Klerk 2013)
Cobalt (Co) Has a good selectivity to long-chain paraffins, low selectivity to oxygenates and olefins, and is resistant to deactivation. Performs better with NG feedstocks.
Supported Co-LTFT catalysts = 9–12 months (cycle time) and 5 years lifetime
Iron (Fe) Is a good choice for producing chemicals and olefins, with a high water gas shift reactivity and suitable for H2-deficient feedstocks like those obtained from coal and biomass.
Precipitated Fe-LTFT catalysts = 70–100 days Fused Fe-HTFT catalysts = 40–45 days
Ruthenium (Ru)
Is the most active catalyst. Too expensive and poorly available
Nickel (Ni) Possesses high hydrogenation activity, and selectivity to methane is too high for FT synthesis.
Main challenges to its industrial application are formation of volatile carbonyls resulting in deactivation, loss of active phase, and formation of lighter products than Co and Fe
Table 12. Types of FT Reactors (Dry 2002)
Reactor Type
Characteristics
Multi-Tubular Fixed Bed
Long narrow tubes containing catalysts are surrounded by water; offers the advantage of lesser operational issues with wax-catalyst separation, as the wax produced trickles down the bed.
Fluidized Catalyst Bed
Typically circulating fluidized bed and fixed fluidized bed configurations are employed. These reactors operate with iron-based catalysts at 608°F–662°F (320°C–350°C), geared for producing linear 1-alkenes, gasoline, jet fuel, and diesel fuel. These reactors cannot be used for wax production as their use results in agglomeration and defluidization of the catalyst.
Slurry Reactors
Finely divided catalyst is suspended in liquid wax with gas being bubbled through; requires special devices for wax-catalyst separation.
After FT synthesis, a portion of the unconverted syngas is returned to the FT reactor, and part of it is sent to the acid gas removal system. The remaining portion flows into the power generation area, providing power for the air separation unit (Kreutz, Larson, et al. 2008). Conventional refinery processes, such as hydrocracking, isomerization, hydrogenation, and fractionation, can be applied to upgrade the FT synthesis product to high-quality, low-aromatic, and almost zero-sulfur-content fuels (National Advanced Biofuels Consortium 2011).
Hydrocracking/isomerization is used to convert the wax into lighter products with shorter chain length and lower boiling points. Products from the hydrocracking/isomerization reactor are heated and distilled to produce jet fuel, diesel fuel, and lubricants. Hydrogenation is applied to produce naphtha from the FT liquid. The FT tail gas, which contains H2, water, methane, CO, CO2, nitrogen, argon, and heavier hydrocarbons, is recycled back to the syngas generation
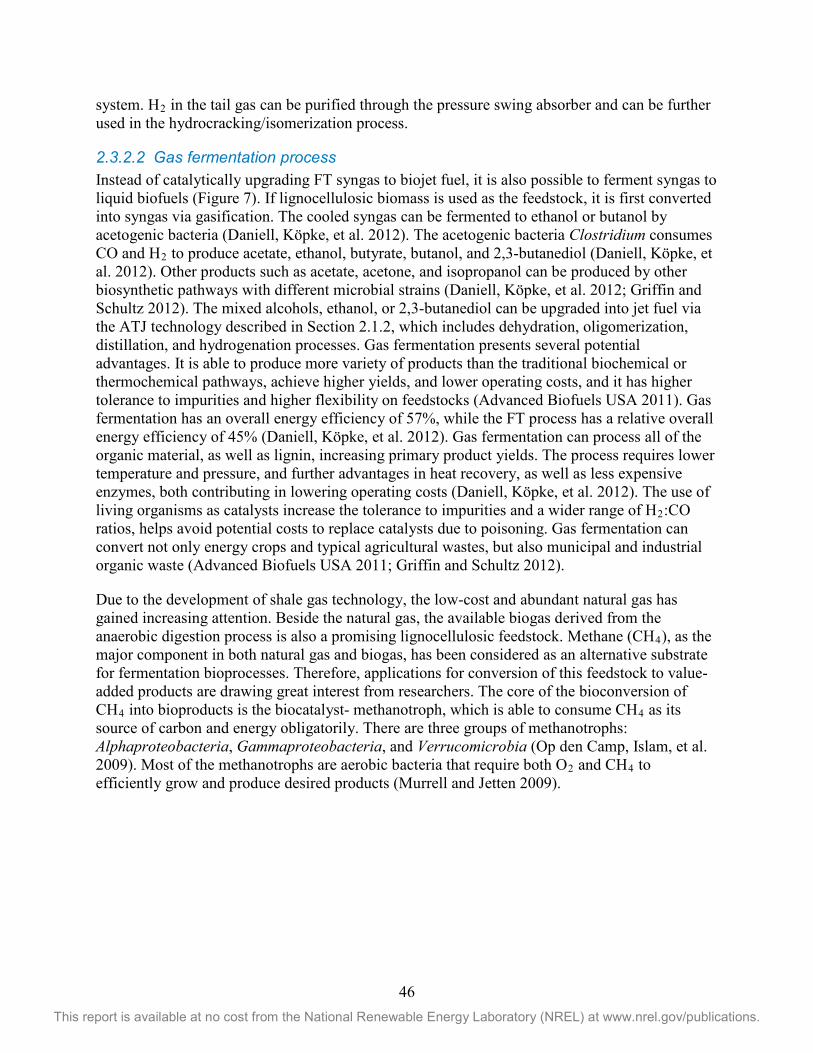
46 This report is available at no cost from the National Renewable Energy Laboratory (NREL) at www.nrel.gov/publications.
system. H2 in the tail gas can be purified through the pressure swing absorber and can be further used in the hydrocracking/isomerization process.
2.3.2.2 Gas fermentation process Instead of catalytically upgrading FT syngas to biojet fuel, it is also possible to ferment syngas to liquid biofuels (Figure 7). If lignocellulosic biomass is used as the feedstock, it is first converted into syngas via gasification. The cooled syngas can be fermented to ethanol or butanol by acetogenic bacteria (Daniell, Köpke, et al. 2012). The acetogenic bacteria Clostridium consumes CO and H2 to produce acetate, ethanol, butyrate, butanol, and 2,3-butanediol (Daniell, Köpke, et al. 2012). Other products such as acetate, acetone, and isopropanol can be produced by other biosynthetic pathways with different microbial strains (Daniell, Köpke, et al. 2012; Griffin and Schultz 2012). The mixed alcohols, ethanol, or 2,3-butanediol can be upgraded into jet fuel via the ATJ technology described in Section 2.1.2, which includes dehydration, oligomerization, distillation, and hydrogenation processes. Gas fermentation presents several potential advantages. It is able to produce more variety of products than the traditional biochemical or thermochemical pathways, achieve higher yields, and lower operating costs, and it has higher tolerance to impurities and higher flexibility on feedstocks (Advanced Biofuels USA 2011). Gas fermentation has an overall energy efficiency of 57%, while the FT process has a relative overall energy efficiency of 45% (Daniell, Köpke, et al. 2012). Gas fermentation can process all of the organic material, as well as lignin, increasing primary product yields. The process requires lower temperature and pressure, and further advantages in heat recovery, as well as less expensive enzymes, both contributing in lowering operating costs (Daniell, Köpke, et al. 2012). The use of living organisms as catalysts increase the tolerance to impurities and a wider range of H2:CO ratios, helps avoid potential costs to replace catalysts due to poisoning. Gas fermentation can convert not only energy crops and typical agricultural wastes, but also municipal and industrial organic waste (Advanced Biofuels USA 2011; Griffin and Schultz 2012).
Due to the development of shale gas technology, the low-cost and abundant natural gas has gained increasing attention. Beside the natural gas, the available biogas derived from the anaerobic digestion process is also a promising lignocellulosic feedstock. Methane (CH4), as the major component in both natural gas and biogas, has been considered as an alternative substrate for fermentation bioprocesses. Therefore, applications for conversion of this feedstock to value-added products are drawing great interest from researchers. The core of the bioconversion of CH4 into bioproducts is the biocatalyst- methanotroph, which is able to consume CH4 as its source of carbon and energy obligatorily. There are three groups of methanotrophs: Alphaproteobacteria, Gammaproteobacteria, and Verrucomicrobia (Op den Camp, Islam, et al. 2009). Most of the methanotrophs are aerobic bacteria that require both O2 and CH4 to efficiently grow and produce desired products (Murrell and Jetten 2009).
47 This report is available at no cost from the National Renewable Energy Laboratory (NREL) at www.nrel.gov/publications.
Woody BiomassGasification
CO and H2Gas Reception
Fermentation(Acetogenic
Bacteria)
Ethanol2,3-Butanediol
DehydrationDistillation
Jet Fuel
EthyleneOligomerization
α – Olefins(C4~C20)
Hydrogenation
C9-C16 Olefins
Lanza Tech Technology
Swedish Biofuels Technology
Figure 7. Gas fermentation to biojet fuel
The first concept of biological use of CH4 was for the production of single cell proteins (SCPs). The work was pursued by several companies including ICI, Hoechst, and Phillips Petroleum in the 1950s and 1960s. The SCPs from methanotrophic fermentation were mainly used as animal supplement for pigs, chickens, mink, fox, dog, and fish. A Denmark-based biotech company—UniBio A/S—had a brief run at commercial production of SCP using natural gas as a nutritional food protein feed for animals (UNIBIO 2011). The company Calysta Nutrition (Mountain View, California, USA) is developing an 80,000 ton/year plant targeting a sustainable, cost competitive, alternative fish meal via natural fermentation of methanotrophs (Calysta Nutrition 2015).
Another interesting field of the bioconversion of CH4 is the production of bio-based chemicals. The metabolites produced by methanotrophic bacteria are all potential products from CH4, with multiple industrial uses and high global demand. A synthetic biology company—Intrexon (California, USA)—filed a patent targeting the potential production of isobutanol, fatty alcohols, fatty acid esters, 2,3-butanediol, and farnesene by metabolically engineered methanotrophs (Coleman, Vidanes, et al. 2014). Mango Materials (California, USA) recently announced its new process of creating bioplastics using waste biogas instead of using the conventional petroleum-based methods (Whitworth 2014).
Recently, Calysta Energy, collaborating with NatureWorks, has successfully demonstrated a lab-scale production of lactic acid from natural gas (Calysta 2014). Bioenergy is another potential product from methanotrophs and has a tremendous demand. A green diesel production process from natural gas has been recently proposed and discussed, as shown in Figure 8 (Fei, Guarnieri, et al. 2014). In this report, microbial lipids accumulated by methanotrophs are catalytically upgraded to diesel blend stocks for biofuel to replace fossil-based diesel fuel. A preliminary cost analysis of this process, based solely on raw material costs and yields, projected a CH4-derived diesel cost range from $0.7–$10.8 per GGE (Fei, Guarnieri, et al. 2014).
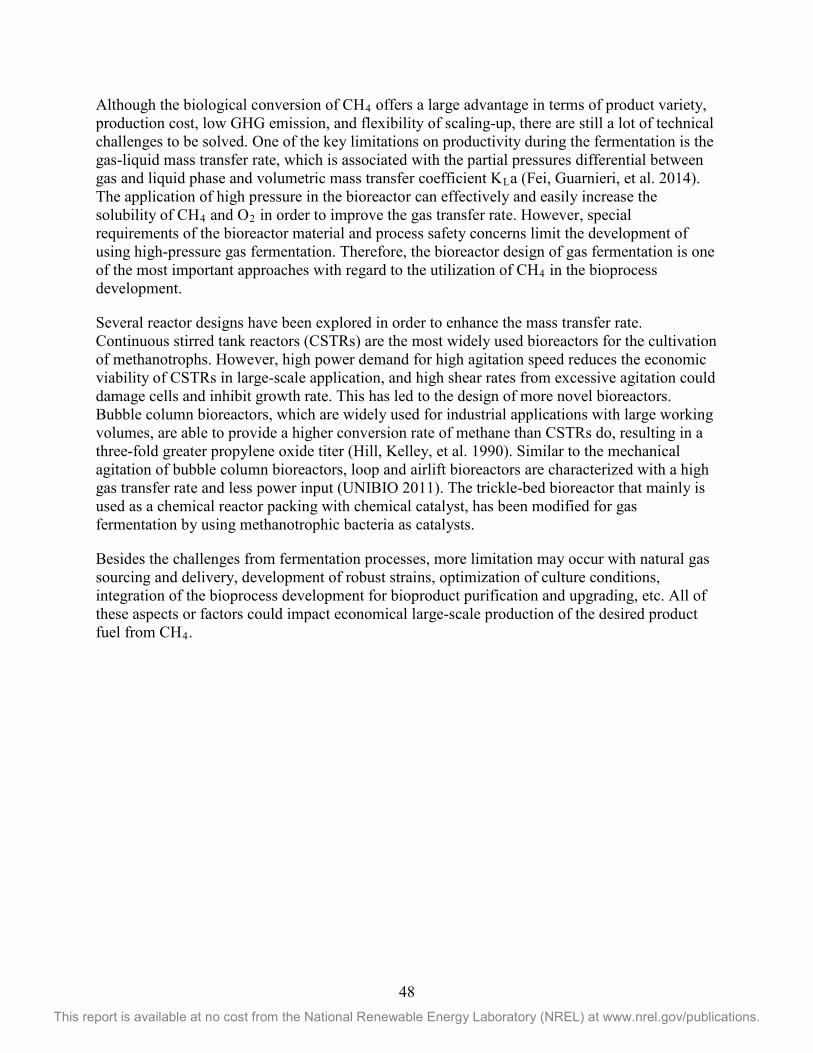
48 This report is available at no cost from the National Renewable Energy Laboratory (NREL) at www.nrel.gov/publications.
Although the biological conversion of CH4 offers a large advantage in terms of product variety, production cost, low GHG emission, and flexibility of scaling-up, there are still a lot of technical challenges to be solved. One of the key limitations on productivity during the fermentation is the gas-liquid mass transfer rate, which is associated with the partial pressures differential between gas and liquid phase and volumetric mass transfer coefficient KLa (Fei, Guarnieri, et al. 2014). The application of high pressure in the bioreactor can effectively and easily increase the solubility of CH4 and O2 in order to improve the gas transfer rate. However, special requirements of the bioreactor material and process safety concerns limit the development of using high-pressure gas fermentation. Therefore, the bioreactor design of gas fermentation is one of the most important approaches with regard to the utilization of CH4 in the bioprocess development.
Several reactor designs have been explored in order to enhance the mass transfer rate. Continuous stirred tank reactors (CSTRs) are the most widely used bioreactors for the cultivation of methanotrophs. However, high power demand for high agitation speed reduces the economic viability of CSTRs in large-scale application, and high shear rates from excessive agitation could damage cells and inhibit growth rate. This has led to the design of more novel bioreactors. Bubble column bioreactors, which are widely used for industrial applications with large working volumes, are able to provide a higher conversion rate of methane than CSTRs do, resulting in a three-fold greater propylene oxide titer (Hill, Kelley, et al. 1990). Similar to the mechanical agitation of bubble column bioreactors, loop and airlift bioreactors are characterized with a high gas transfer rate and less power input (UNIBIO 2011). The trickle-bed bioreactor that mainly is used as a chemical reactor packing with chemical catalyst, has been modified for gas fermentation by using methanotrophic bacteria as catalysts.
Besides the challenges from fermentation processes, more limitation may occur with natural gas sourcing and delivery, development of robust strains, optimization of culture conditions, integration of the bioprocess development for bioproduct purification and upgrading, etc. All of these aspects or factors could impact economical large-scale production of the desired product fuel from CH4.
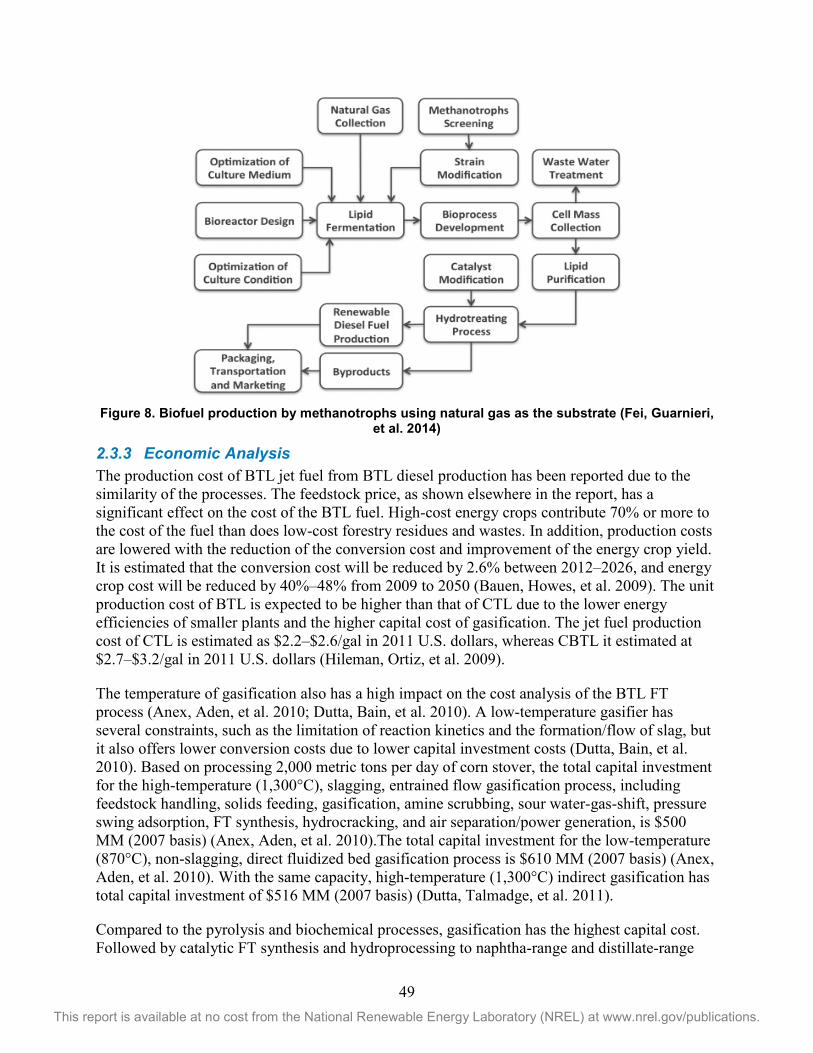
49 This report is available at no cost from the National Renewable Energy Laboratory (NREL) at www.nrel.gov/publications.
Figure 8. Biofuel production by methanotrophs using natural gas as the substrate (Fei, Guarnieri,
et al. 2014)
2.3.3 Economic Analysis The production cost of BTL jet fuel from BTL diesel production has been reported due to the similarity of the processes. The feedstock price, as shown elsewhere in the report, has a significant effect on the cost of the BTL fuel. High-cost energy crops contribute 70% or more to the cost of the fuel than does low-cost forestry residues and wastes. In addition, production costs are lowered with the reduction of the conversion cost and improvement of the energy crop yield. It is estimated that the conversion cost will be reduced by 2.6% between 2012–2026, and energy crop cost will be reduced by 40%–48% from 2009 to 2050 (Bauen, Howes, et al. 2009). The unit production cost of BTL is expected to be higher than that of CTL due to the lower energy efficiencies of smaller plants and the higher capital cost of gasification. The jet fuel production cost of CTL is estimated as $2.2–$2.6/gal in 2011 U.S. dollars, whereas CBTL it estimated at $2.7–$3.2/gal in 2011 U.S. dollars (Hileman, Ortiz, et al. 2009).
The temperature of gasification also has a high impact on the cost analysis of the BTL FT process (Anex, Aden, et al. 2010; Dutta, Bain, et al. 2010). A low-temperature gasifier has several constraints, such as the limitation of reaction kinetics and the formation/flow of slag, but it also offers lower conversion costs due to lower capital investment costs (Dutta, Bain, et al. 2010). Based on processing 2,000 metric tons per day of corn stover, the total capital investment for the high-temperature (1,300°C), slagging, entrained flow gasification process, including feedstock handling, solids feeding, gasification, amine scrubbing, sour water-gas-shift, pressure swing adsorption, FT synthesis, hydrocracking, and air separation/power generation, is $500 MM (2007 basis) (Anex, Aden, et al. 2010).The total capital investment for the low-temperature (870°C), non-slagging, direct fluidized bed gasification process is $610 MM (2007 basis) (Anex, Aden, et al. 2010). With the same capacity, high-temperature (1,300°C) indirect gasification has total capital investment of $516 MM (2007 basis) (Dutta, Talmadge, et al. 2011).
Compared to the pyrolysis and biochemical processes, gasification has the highest capital cost. Followed by catalytic FT synthesis and hydroprocessing to naphtha-range and distillate-range
50 This report is available at no cost from the National Renewable Energy Laboratory (NREL) at www.nrel.gov/publications.
liquid fractions, the product values for the high-temperature and low-temperature direct gasifiers are $4.5/GGE and $5.0/GGE in 2007 dollars ($5.6/GGE and $6.2/GGE in 2011 U.S. dollars), respectively (Anex, Aden, et al. 2010). Tijmensen et al., pointed out that the pretreatment, gasification with oxygen, and gas cleaning sections account for approximately 75% of total capital cost (Tijmensen, Faaij, et al. 2002). The production cost of FT liquids in this study ranged from $9.0/GJ to $16.0/GJ in 1999 dollars ($1.9/GGE to $3.1/GGE in 2011 U.S. dollars) (Tijmensen, Faaij, et al. 2002).
The economics of gas fermentation has also been examined in the literature. Daniell et al. considered wood gasification and then syngas fermentation to ethanol. The yield of ethanol from a pilot plant using yard and household waste is 100 gallons per dry ton biomass. The predicted minimum ethanol selling price is $1.5/gal (Daniell, Köpke, et al. 2012) for ethanol made from a softwood demonstration plant.
2.3.4 Life-Cycle Assessment In the syngas production and fuel synthesis processes, the GHG emissions considered are: (1) CO2 emissions from gasification, FT synthesis, fossil fuel combustion, and venting from natural gas production; (2) methane emissions from fugitive plant and pipeline emissions, incomplete combustion, and coal bed methane releases; and (3) N2O emissions from fuel combustion and the cultivation of biomass (Marano and Ciferno 2001). The FT-CTL and FT-GTL diesel have higher life-cycle GHG emissions than those from conventional petroleum-derived diesel (Marano 2001; Xie, Wang, et al. 2011). Similarly, the FT-CTL process has GHG emissions significantly higher than those of conventional jet fuel (Marano 2001). In contrast, GHG emissions from the FT-BTL process are 92%–95% less than those of conventional jet fuel because the feedstock for FT-BTL, either woody biomass or forestry residues, has a very low contribution to GHG emissions (Bauen, Howes, et al. 2009). This is also because 48% of the energy consumed for the conversion processes, either gasification or FT synthesis, comes from the biomass energy content (Bauen, Howes, et al. 2009). The life-cycle GHG emissions for the FT-BTL baseline from the use of corn stover, forest residue, and switchgrass are 9.0, 12.2, and -2.0 gCO2e/MJ, respectively (with a soil carbon-change credit, the CO2 sequestration arising from land-use change dominates the GHG emissions), which are about 10%, 14%, and -2% of those from conventional jet fuel, respectively (Stratton, Wong, et al. 2010). It is also suggested that identifying strategies and technologies, such as carbon sequestration, co-production of fuels and power, co-processing of coal and biomass, and improved vehicle technology, will help reduce GHG and other emissions from the FT process (Taylor, Baltrus, et al. 2011). When switchgrass is used as the feedstock for FT-BTL, the WTW GHG emissions range from 11.9 gCO2e/MJ to 26 gCO2e/MJ without soil carbon sequestration and from -1.7 gCO2 to -4.4 gCO2e/MJ with soil carbon sequestration, considering the low emission and high emission cases (Stratton, Wong, et al. 2010). HRJ fuel has higher GHG emissions than FT-BTL due to fertilizer and chemical use (Agusdinata, Zhao, et al. 2011). The inclusion of carbon capture and storage (CCS) in FT fuel production can affect climate impact in 6% to 150%, depending on the feedstock used (Holmgren and Hagberg 2009).
2.3.5 Commercialization Readiness Commercial-scale FT reactors were built and operated before and during World War II in a number of plants, mostly in Germany (Taylor, Baltrus, et al. 2011). Currently, many oil
51 This report is available at no cost from the National Renewable Energy Laboratory (NREL) at www.nrel.gov/publications.
companies such as Shell Oil, Chevron, ConocoPhillips, BP, ExxonMobil, and Sasol are conducting research and building pilot-scale or smaller plants (Shell 2013; Taylor, Baltrus, et al. 2011).
NETL has worked with several private organizations to build and operate a pilot plant in LaPorte, Texas, to develop a slurry-phase reactor for the FT technology (Taylor, Baltrus, et al. 2011). In 2010, the Solena Group signed a letter of intent with Rentech to initiate the first commercial-scale renewable jet fuel facility in Europe (Green Air 2010c). This biorefinery facility is intended to convert more than 500,000 metric tonnes of waste biomass feedstock into synthetic gas (BioSyngas) using Solena’s plasma gasification technology. The BioSynGas will then be treated by Rentech’s FT technology into 16 MM gallons of sustainable synthetic jet fuel. The plant started in 2012 and operational in 2014 (Green Air 2010c).
The syngas production technology in Syntroleum used nitrogen in air to remove heat from the autothermal reformer, and the Bio-Synfining process developed by Syntroleum employed a fixed-bed or fluidized-bed FT reactor with cobalt-based catalyst and used hydrocracking for upgrading (Syntroleum 2012). The first commercial plant for Bio-Synfining is Syntroleum’s Dynamic Fuels Plant, located in Geismar, Louisiana, a 50/50 joint venture created with Tyson Foods. Using fat and oil feedstocks from Tyson, coupled with Syntroleum’s Bio-Synfining technology, the Dynamic Fuels Plant is designed to produce 75,000,000 gallons per year of renewable synthetic fuels. The first commercial operation facility in the United States was started in November 2010. DOD and DOE have worked with Syntroleum to produce raw liquid FT fuels from natural gas. These FT fuels are further refined to jet and diesel fuels. These highly isomerized fuels have branched and straight-chain alkanes and a few alkenes, but no aromatics or oxygenates. The jet fuel from Syntroleum, mixed 50:50 with conventional petroleum-derived fuel, has recently been tested by the Air Force in a flight of a B-52 jet (Syntroleum 2012).
2.4 Sugar-to-Jet (STJ) Fuel There are two pathways to produce jet fuel from sugar intermediate feedstocks. First is via catalytic upgrading of sugars and sugar intermediates to hydrocarbons (Davis, Tao, et al. 2015; Virent 2015). Second is the biological conversion of sugars and sugar intermediates to hydrocarbons (Davis, Tao, et al. 2013; Davis, Tao, et al. 2015). One catalytic process, used by the company Virent, separates sugars from biomass (e.g., milled corn stover) through a series of chemical and biochemical processes and upgrades the sugars into hydrocarbon fuels through a process that uses aqueous phase reforming (APR) (Virent 2015). Research into the fermentation of hydrocarbon fuel and fuel intermediates are wide and varied. Several companies working on the commercialization of jet fuel from fermentation of biomass including LS9 (acquired by Renewable Energy Group in 2014 (Renewable Energy Group Inc. 2015)). LS9 fuel has been used in an Embraer E195 jet operated by Azul Brazilian Airline (Amyris Inc. 2012). Additionally, a partnership between Amyris and Total plans to commercialize a jet fuel that is blended with 10% bio-farnasane (Amyris Inc. 2014c).
2.4.1 Feedstocks The feedstocks for catalytic upgrading of sugars to hydrocarbons can be a wide variety of sugars and sugar-derived intermediates, including sucrose from sugar cane or sugar beets, corn sugar from corn starch, lignocellulosic sugars from hydrolysis of hemicellulose and cellulose, such as
52 This report is available at no cost from the National Renewable Energy Laboratory (NREL) at www.nrel.gov/publications.
polysaccharides, organic acids, furfural byproducts, and water-soluble oxygenated compounds such as diols, glycerol, and sugar alcohols (Blommel, Keenan, et al. 2008; Cortright 2009). Additionally, lignin can be used as a feedstock for catalytic conversion into fuels (Blommel 2011).
One catalytic process for upgrading sugars to fuels is the Virent’s BioForming process (Blommel, Keenan, et al. 2008). Although there are many feedstocks that can be used in this catalytic process, some feedstocks such as hydrolysates from lignocellulosic biomass can cause problems for the catalytic process without additional process steps (Biddy and Jones 2013; NABC 2013). For example, insoluble solids can create a high pressure drop across the fixed bed system, and proteins and inorganics can poison catalysts, accumulate in the system, and degrade construction materials (NABC 2013). If feedstocks are processed into hydrolysate they can undergo an additional conditioning step to improve efficiency and fuel quality seen in the Virent BioForming process (NABC 2013). The process implications are important to keep in mind when choosing a feedstock.
Additionally, there is a variety of feedstocks that can be used for biological conversion of sugars to fuels, including sugar cane and beets, corn grain, and pretreated lignocellulosic biomass (Staples, Malina, et al. 2014). Amyris uses its Biofen process, which uses yeast-based fermentation of traditional or lignocellulosic-derived sugar feedstocks, to develop the feasibility of converting crops such as sweet sorghum into hydrocarbons to produce renewable diesel and jet, industrial lubricants, and polymers (Department of Energy and Energy 2012). Derived sugar feedstocks can also be used for aerobic biological conversion to hydrocarbons and hydrocarbon intermediates (Davis, Tao, et al. 2013).
Similar to the sugar-to-jet fuel catalytic process, the biological process has additional considerations around the feedstock choice. If whole hydrolysate is used from lignocellulosic feedstocks, it can reduce aerobic biological conversion by reducing oxygen mixing in the bio-reactor (Davis, Tao, et al. 2013). In order to increase conversion, the hydrolysate is processed through conditioning and processing steps prior to conversion (Davis, Tao, et al. 2013).
2.4.2 Process Description Two main sugar-to-jet pathways are described here. The first is catalytic conversion of sugar to hydrocarbons. The second is biological conversion of sugars to hydrocarbons or hydrocarbon intermediates that are then upgraded to jet fuels.
2.4.2.1 Catalytic upgrading of sugars to hydrocarbons Virent’s BioForming platform is one example of a process that catalytically transforms plant sugars into high-energy hydrocarbon mixtures (Figure 9) (Blommel, Keenan, et al. 2008; National Advanced Biofuels Consortium 2011; Virent 2012; Davis, Tao, et al. 2015). In the process, biomass feedstock is first converted into solubilized sugars. This conversion process is typically done via biomass pretreatment and enzymatic hydrolysis of lignocellulosic biomass feedstocks to create C5 and C6 sugars (Davis, Tao, et al. 2015). Another method for converting biomass to sugars is via the Virdia (acquired by Sorte Enso [Lane 2014]) The CASE (Cold Acid Solvent Extraction) process uses pine wood as the feedstock (Lane 2012). The solubilized sugars then undergo a purification and concentration step where unconverted solids and impurities are removed to improve the efficiency of the sugar-to-jet step (NABC 2013). Unconverted solids,
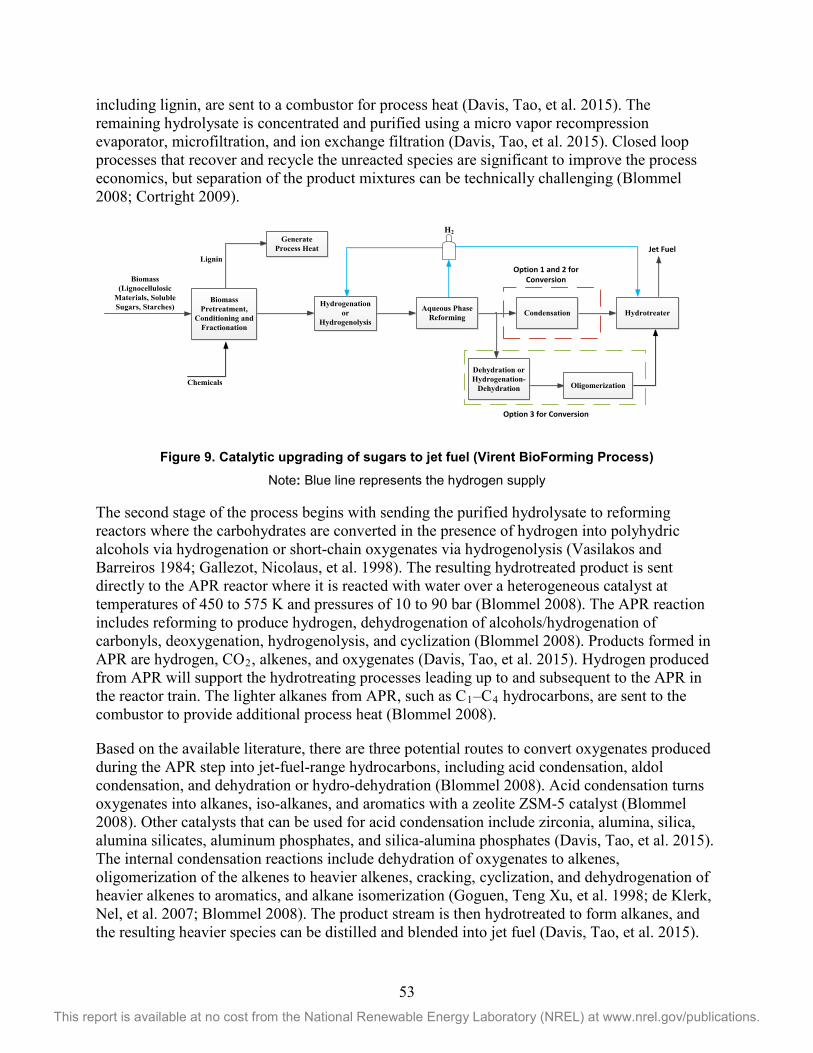
53 This report is available at no cost from the National Renewable Energy Laboratory (NREL) at www.nrel.gov/publications.
including lignin, are sent to a combustor for process heat (Davis, Tao, et al. 2015). The remaining hydrolysate is concentrated and purified using a micro vapor recompression evaporator, microfiltration, and ion exchange filtration (Davis, Tao, et al. 2015). Closed loop processes that recover and recycle the unreacted species are significant to improve the process economics, but separation of the product mixtures can be technically challenging (Blommel 2008; Cortright 2009).
Biomass(Lignocellulosic
Materials, Soluble Sugars, Starches)
Biomass Pretreatment,
Conditioning and Fractionation
Generate Process Heat
Aqueous Phase Reforming
Lignin
Hydrogenation or
Hydrogenolysis
H2
Condensation Hydrotreater
Dehydration orHydrogenation-
Dehydration Oligomerization
Option 1 and 2 for Conversion
Option 3 for Conversion
Jet Cuel
Chemicals
Figure 9. Catalytic upgrading of sugars to jet fuel (Virent BioForming Process)
Note: Blue line represents the hydrogen supply
The second stage of the process begins with sending the purified hydrolysate to reforming reactors where the carbohydrates are converted in the presence of hydrogen into polyhydric alcohols via hydrogenation or short-chain oxygenates via hydrogenolysis (Vasilakos and Barreiros 1984; Gallezot, Nicolaus, et al. 1998). The resulting hydrotreated product is sent directly to the APR reactor where it is reacted with water over a heterogeneous catalyst at temperatures of 450 to 575 K and pressures of 10 to 90 bar (Blommel 2008). The APR reaction includes reforming to produce hydrogen, dehydrogenation of alcohols/hydrogenation of carbonyls, deoxygenation, hydrogenolysis, and cyclization (Blommel 2008). Products formed in APR are hydrogen, CO2, alkenes, and oxygenates (Davis, Tao, et al. 2015). Hydrogen produced from APR will support the hydrotreating processes leading up to and subsequent to the APR in the reactor train. The lighter alkanes from APR, such as C1–C4 hydrocarbons, are sent to the combustor to provide additional process heat (Blommel 2008).
Based on the available literature, there are three potential routes to convert oxygenates produced during the APR step into jet-fuel-range hydrocarbons, including acid condensation, aldol condensation, and dehydration or hydro-dehydration (Blommel 2008). Acid condensation turns oxygenates into alkanes, iso-alkanes, and aromatics with a zeolite ZSM-5 catalyst (Blommel 2008). Other catalysts that can be used for acid condensation include zirconia, alumina, silica, alumina silicates, aluminum phosphates, and silica-alumina phosphates (Davis, Tao, et al. 2015). The internal condensation reactions include dehydration of oxygenates to alkenes, oligomerization of the alkenes to heavier alkenes, cracking, cyclization, and dehydrogenation of heavier alkenes to aromatics, and alkane isomerization (Goguen, Teng Xu, et al. 1998; de Klerk, Nel, et al. 2007; Blommel 2008). The product stream is then hydrotreated to form alkanes, and the resulting heavier species can be distilled and blended into jet fuel (Davis, Tao, et al. 2015).
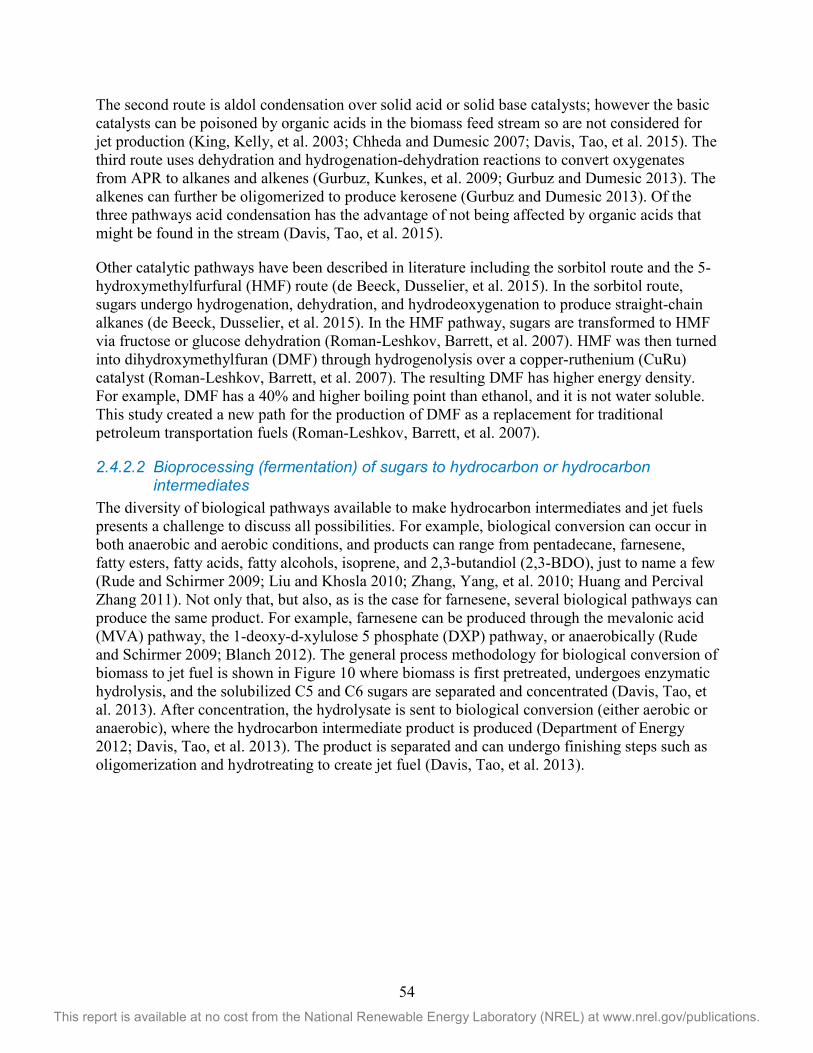
54 This report is available at no cost from the National Renewable Energy Laboratory (NREL) at www.nrel.gov/publications.
The second route is aldol condensation over solid acid or solid base catalysts; however the basic catalysts can be poisoned by organic acids in the biomass feed stream so are not considered for jet production (King, Kelly, et al. 2003; Chheda and Dumesic 2007; Davis, Tao, et al. 2015). The third route uses dehydration and hydrogenation-dehydration reactions to convert oxygenates from APR to alkanes and alkenes (Gurbuz, Kunkes, et al. 2009; Gurbuz and Dumesic 2013). The alkenes can further be oligomerized to produce kerosene (Gurbuz and Dumesic 2013). Of the three pathways acid condensation has the advantage of not being affected by organic acids that might be found in the stream (Davis, Tao, et al. 2015).
Other catalytic pathways have been described in literature including the sorbitol route and the 5-hydroxymethylfurfural (HMF) route (de Beeck, Dusselier, et al. 2015). In the sorbitol route, sugars undergo hydrogenation, dehydration, and hydrodeoxygenation to produce straight-chain alkanes (de Beeck, Dusselier, et al. 2015). In the HMF pathway, sugars are transformed to HMF via fructose or glucose dehydration (Roman-Leshkov, Barrett, et al. 2007). HMF was then turned into dihydroxymethylfuran (DMF) through hydrogenolysis over a copper-ruthenium (CuRu) catalyst (Roman-Leshkov, Barrett, et al. 2007). The resulting DMF has higher energy density. For example, DMF has a 40% and higher boiling point than ethanol, and it is not water soluble. This study created a new path for the production of DMF as a replacement for traditional petroleum transportation fuels (Roman-Leshkov, Barrett, et al. 2007).
2.4.2.2 Bioprocessing (fermentation) of sugars to hydrocarbon or hydrocarbon intermediates
The diversity of biological pathways available to make hydrocarbon intermediates and jet fuels presents a challenge to discuss all possibilities. For example, biological conversion can occur in both anaerobic and aerobic conditions, and products can range from pentadecane, farnesene, fatty esters, fatty acids, fatty alcohols, isoprene, and 2,3-butandiol (2,3-BDO), just to name a few (Rude and Schirmer 2009; Liu and Khosla 2010; Zhang, Yang, et al. 2010; Huang and Percival Zhang 2011). Not only that, but also, as is the case for farnesene, several biological pathways can produce the same product. For example, farnesene can be produced through the mevalonic acid (MVA) pathway, the 1-deoxy-d-xylulose 5 phosphate (DXP) pathway, or anaerobically (Rude and Schirmer 2009; Blanch 2012). The general process methodology for biological conversion of biomass to jet fuel is shown in Figure 10 where biomass is first pretreated, undergoes enzymatic hydrolysis, and the solubilized C5 and C6 sugars are separated and concentrated (Davis, Tao, et al. 2013). After concentration, the hydrolysate is sent to biological conversion (either aerobic or anaerobic), where the hydrocarbon intermediate product is produced (Department of Energy 2012; Davis, Tao, et al. 2013). The product is separated and can undergo finishing steps such as oligomerization and hydrotreating to create jet fuel (Davis, Tao, et al. 2013).
55 This report is available at no cost from the National Renewable Energy Laboratory (NREL) at www.nrel.gov/publications.
Biomass(Lignocellulosic
Materials, Soluble Sugars, Starches)
Biomass Pretreatment,
Conditioning, and Fractionation
Generate Process Heat
Separation
Lignin
Bioconversion (i.e. Fermentation)
H2
Purification Hydroprocessing
Anaerobic Digestion
Jet Cuel
Anaerobic Biogas
Chemicals/NutrientsChemicals
Figure 10. Biological conversion of sugar-to-jet fuel
One direct sugar-to-hydrocarbon (DSHC) fermentation pathway is developed by Amyris (Amyris Inc. 2014c). In the Amyris process, sugars are aerobically fermented into a farnesene intermediate using the mevalonate pathway in yeast cells (Pray 2010; Klein-Marcuschamer, Turner, et al. 2013; National Advanced Biofuels Consortium 2013). The process has been reported to have a peak farnesene yield of 16.8 g farnesene/100 g sugar at a productivity of 16.9 g/L/d (Pray 2010). Additionally, the Amyris process has a carbon efficiency of 60%, with the remaining 40% for energy production (Karatzos, McMillan, et al. 2014). The yeast cells of the Amyris process are able to convert both C5 and C6 sugars, and have demonstrated a 300L-scale fermentation of corn stover hydrolysate (National Advanced Biofuels Consortium 2013). After aerobic fermentation, the cell broth is sent for solid-liquid separation using centrifugation (Gray, Sato, et al. 2014). The supernatant, which contains the farnesene, then undergoes de-emulsification and centrifugation to separate the oil and aqueous phases (Gray, Sato, et al. 2014). The farnesene recovery and purity after separation has been reported at 95% and 97%, respectively (Pray 2010; Gray, Sato, et al. 2014). After farnesene is recovered it undergoes hydrogenation to produce farnesane (Gray, Sato, et al. 2014). Recently, farnesane was approved as a jet blendstock and meets all ASTM standards for Jet A/A1 (Amyris Inc. 2014b). The jet fuel can contain up to 10% farnesane (Amyris Inc. 2014b). To make a 100% renewable jet from this process, the farnesane will need to be hydrocracked and hydroisomerized into a blend of fuel molecules (Klein-Marcuschamer, Turner, et al. 2013).
LS9 is another company that has made progress toward the commercialization of sugar-to jet-fuel through biological conversion (Mawhood, Gazis, et al. 2015). The LS9 process uses E. coli to produce fatty acids aerobically through the fatty acid biosynthesis pathway (Steen, Kang, et al. 2010). The fatty acid biosynthesis pathway can be used to produce fatty alcohols, fatty esters, and alkanes, in addition to fatty acids (Rude and Schirmer 2009). Fatty acids have an theoretical energetic efficiency of 89% and literature review shows the fatty acid yield ranging from 4-28 g/100 g sugar at a productivity of 0.05-0.11 g/L/h (Dellomonaco, Clomburg, et al. 2011; Yang, Xian, et al. 2012; Zhang, Ouellet, et al. 2012; Davis, Tao, et al. 2013; Xu, Gu, et al. 2013; San, Li, et al. 2014). In addition to fatty acids, LS9 has been working on directly converting sugar to alkanes, which can be used as fuels without the additional step of hydrogenation (Schirmer, Rude, et al. 2010). The fatty acid production design is described in detail in Davis et al. (Davis, Tao, et al. 2013). Similar to the farnesane production pathway, biomass undergoes pretreatment, enzymatic hydrolysis, concentration, and then biological conversion to fatty acids (Davis, Tao, et
56 This report is available at no cost from the National Renewable Energy Laboratory (NREL) at www.nrel.gov/publications.
al. 2013). The broth from the conversion step undergoes phase separation and the supernatant is subject to centrifugation (Davis, Tao, et al. 2013). The purified fatty acids are sent for hydrotreating and hydroisomerization to produce jet fuel (Davis, Tao, et al. 2013).
Other biologically produced chemicals have the potential to be jet fuel intermediates such as isoprene and 2,3-BDO; however, the production of these chemicals has yet to reach pilot plant scale. A literature review of isoprene production gives yield on sugar ranging from 7–20 g isoprene/100 g sugar, and a productivity of 0.16–2.45 g/L/h (Whited, Feher, et al. 2010; Yang, Xian, et al. 2012; Chotani, Kirshner, et al. 2013; McAuliffe, Muir, et al. 2013). Isoprene can be biologically produced using E. coli utilizing the MVA or MEP pathways at maximum mass yields on glucose of 25.2% and 30.2%, respectively (Whited, Feher et al. 2010). Isoprene can be produced either anaerobically (Chou and Maness 2014) or aerobically (Chotani, Kirshner, et al. 2013). At normal pressure, isoprene’s boiling temperature is 34oC, and so it is volatile in the fermentation broth and most present in the fermentation off-gas. Applying a vacuum pump not only can pull isoprene from the fermentation tank to separation, but also can increase product yield (Feher, Kan, et al. 2013).
However, isoprene is flammable in air (2 vol%–9 vol% flammability limit [Cheremisinoff 1999]); it is important to separate the isoprene from the oxygen before catalytically upgrading to jet fuel. There are several technologies applied to the isoprene purification from fermentation off-gas, including extractive distillation and membrane separation, often coupled with cryogenic separation to approach the desired high purity of isoprene. In a recent Dansico patent (Feher, Kan, et al. 2013), isoprene is separated from the fermentation off-gas by solvent extraction. The solvent is a mixture of isomerized C11-C16 alkanes and final isoprene purity is reported to be from 90% to 99% (Feher, Kan, et al. 2013). Isoprene oligomerizes to make dimers, trimers, or tetramers that are cyclic compounds ranging from C5-C30 (Misono, Uchida, et al. 1969; Morikawa, Sato, et al. 1977; Colvin 1990; Denis, Jean, et al. 1990; Doppelt, Baum, et al. 1996). It is also possible to use palladium dimerization of isoprene to make non-cyclic hydrocarbon products (Takahashi, Hata, et al. 1973; Neilan, Laine, et al. 1976). For example, Neilan, et al. (Neilan, Laine, et al. 1976) are able to get the highest non-cyclic tail-to-head dimers yield of 79% using a palladium catalyst in a tetrahydrofuran (THF) solvent at 20oC and 1 atm, and 98% of products are dimers. The isoprene dimers and trimers can then undergo hydrogenation and hydroisomerization.
In the literature, 2,3-BDO has a demonstrated yield of 47-50 g 2,3-BDO/ 100 g sugar and a productivity of 0.59–5.40 g/L/h (Zeng, Biebl, et al. 1991; Cheng, Liu, et al. 2010; Zhang, Yang, et al. 2010). After 2,3-BDO production, it must be separated from the fermentation broth. There are several options for separating 2,3-BDO from fermentation broth, including distillation, aqueous two-phase reforming, in situ recovery, integrated solvent extraction and pervaporation, steam stripping, reaction with formaldehyde, and vacuum membrane filtration (Ji, Huang, et al. 2011). These separation techniques are reviewed by Xiu et al., with challenges for commercializing fermentative production of 2,3-BDO, including performance verifications, energy demand, and yield optimization (Xiu and Zeng 2008). For the purpose of upgrading 2,3-BDO to drop-in hydrocarbons fuels, like jet blendstocks, reactions using dehydration and deoxydehydration are more favorable because 2,3-BDO can be completely deoxygenated in a single step, making either 1,3-butadiene or a mixture of butenes (Wienfield 1949; Makshina, Dusselier, et al. 2014). Both 1,3-butadiene and butene can be catalytically oligomerized into
57 This report is available at no cost from the National Renewable Energy Laboratory (NREL) at www.nrel.gov/publications.
fuel-range hydrocarbons (Harkal, Jackstell, et al. 2005). Although it uses gasses instead of sugars as a feedstock, the metabolic production of 2,3-BDO and 1,4-BDO (Lane 2015) is being worked on by INVISTA and LanzaTech. Companies that produce butanediol from sugars may follow INVISTA and LanzaTech to commercialization.
Although other intermediate products from sugar fermentation are possible, because of the small scale operations, more advanced separations needed, or larger number of process steps required to get to jet fuel, they are not discussed in this review. These intermediates include, but are not limited to, direct alkanes, aromatics, cycloparaffins, and organic acids (Department of Energy, Energy Efficiency & Renewable Energy, et al. 2012).
2.4.3 Economic Analysis The process economics of the catalytic conversion of lignocellulosic biomass-derived sugars to hydrocarbons via APR produces a minimum fuel selling price of $4.1/GGE (2011$) for a 2,000 metric ton/day plant (Davis, Tao, et al. 2015). The minimum selling price of jet fuel from this process would be higher, as not all hydrocarbons produced are usable as jet fuel. Additionally, if hydrogen is produced within the process during reforming, the minimum fuel selling price could increase to $5.5/GGE (2011$) (Davis, Tao, et al. 2015). In a sensitivity analysis, carbon efficiency, total capital investment, and enzymatic hydrolysis to glucose were found to be the largest cost drivers (Davis, Tao, et al. 2015). Other comparative analysis shows that the production of fuel from biomass-derived levulinic acid costs had a MFSP of approximately $4.3/GGE and $7.8/GGE in 2007 U.S. dollars ($5.3/GGE and $9.7/GGE in 2011 U.S. dollars), under different values for oligomer production scenarios (Braden, Henao, et al. 2011).
Additionally, researchers from Iowa State University and the University of Wisconsin-Madison conducted a TEA of DMF and HMF production (Kazi, Patel, et al. 2011). Based on the process capacity of 300 metric ton/day of fructose and an operating period of 20 years, the resulting minimum selling prices for HMF and DMF were estimated to be $5.0/gal in 2007 U.S. dollars ($6.2/gal or $7.1/GGE in 2011 U.S. dollars) and $7.6/gal in 2007 U.S. dollars ($9.5/gal or $11.8/GGE on 2011 U.S. dollars), respectively (Kazi, Patel, et al. 2011). The cost of the copper-ruthenium-carbon catalyst used in the DMF process may play an important role in the final production cost. This study provides a single point of sensitivity on the TEA associated with catalytic upgrading of a pure, expensive clean sugar to a single product at a small scale.
The biological conversion pathways of sugars to hydrocarbons also have associated economics. In one case the production of fuels from fermented fatty acids produces a minimum fuel selling price of $5.4/gal ($5.1/GGE in 2011 U.S. dollars) (Davis, Tao, et al. 2013). In a 2014 New York Times article, Amyris stated that they believed they could match jet fuel prices in 2–3 years (Yee 2014). However, in the TEA by Klein-Marcuschamer et al. for farnesene production and conversion to jet fuel, the minimum farnesene selling price is $2.2/kg ($6.8/gal in 2011 U.S. dollars) (Klein-Marcuschamer, Turner, et al. 2013). The jet fuel produced from this process has a minimum jet fuel selling price of $301/barrel oil equivalent ($7.2/GGE using 2011 U.S. dollars) (Klein-Marcuschamer, Turner, et al. 2013). If the technology continues to develop, the TEA projects the minimum selling price of jet could decrease to $168/barrel equivalent ($4.0/GGE in 2011 U.S. dollars) (Klein-Marcuschamer, Turner, et al. 2013). Jong et al. also performed a TEA on the direct sugar to hydrocarbons (DSHC) pathway with farnesene as the intermediate, and, depending on feedstock choice, determined a minimum jet fuel selling price of €104-140/GJ in
58 This report is available at no cost from the National Renewable Energy Laboratory (NREL) at www.nrel.gov/publications.
2013 euros ($17.3/GGE-$23.3/GGE in 2011 U.S. dollars) (de Jong, Hoefnagels, et al. 2015). In the article, Jong et al. compared their minimum jet selling price to that of Klein-Marcuschamer et al. by converting $301/barrel equivalent to €95/GJ (de Jong, Hoefnagels, et al. 2015). Conversely, our conversion of the Klein-Marcuschamer et al. minimum jet fuel selling price is $301/barrel equivalent to €59/GJ. Other intermediate formation products to jet fuel, such as 2,3-BDO and isoprene, are still in early stages of development and have not had TEA performed.
NREL, in support of the National Advanced Biofuel Consortium (NABC) efforts and in collaboration with Virent and Amyris, is also conducting process economics studies for a direct sugar-to-fuel process via catalysis and fermentation of lignocellulosic sugar process strategy (National Advanced Biofuels Consortium 2012). The target is to find the low-cost routes for biomass hydrolysate streams and low-cost mitigation strategies for fermentation inhibitors that are compatible with the current state of the art. Future work should consider the catalytic upgrading of biomass-derived sugars to a slate of fuel components, specifically jet fuel.
2.4.4 Life-Cycle Assessment LCA studies for the catalytic conversion of sugars to jet fuel are dependent on the source of hydrogen for the biorefinery. The LCA results mentioned are for a general fuel and not specific to jet fuel. When hydrogen is purchased from a natural gas steam-methane reforming unit the LCA is impacted with higher GHG emissions (49.2 g CO2-eq/MJ total hydrocarbon) and higher net fossil energy consumption (0.82 MJ/MJ total hydrocarbons) (Davis, Tao, et al. 2015). Comparatively, if hydrogen is produced from the biomass during reforming, the emissions and net fossil energy consumption are reduced to 15.3 g CO2-eq/MJ and 0.20 MJ/MJ, respectively (Davis, Tao, et, al. 2015). If hydrogen is produced from gasification then the emissions reach 7.5 g CO2-eq/MJ and the net energy ratio is 0.10 MJ/MJ (Davis, Tao, et al. 2015). Water usage is highest for the gasification hydrogen source at 11.4 gal water/GGE fuel. One area of consideration is the trade-offs and benefits for optimizing either economics or LCA results.
Biological conversions of sugars to fuels have also considered LCA implications. General hydrocarbon fuels produced from fatty acids derived from sugars have the potential to have GHG emissions of 0.5 g CO2-eq/MJ and net fossil energy consumption of 0.09 MJ/MJ if co-product electricity displaces fossil electricity (Davis, Tao, et al. 2013). Without the co-product displacement GHG emissions from fatty acid, derived fuels is 15.9 g CO2-eq/MJ and net fossil energy consumption is 0.27 MJ/MJ (Davis, Tao, et al. 2013). Water usage is 13.7 gal water/GGE fuel (Davis, Tao, et al. 2013).
In addition, a project financed by Boeing, Embraer, and the Inter-American Development Bank is set to determine the sustainability analysis of producing biojet fuel sourced from Brazilian sugarcane (AERO News Network 2011). The work evaluates the environmental and market conditions related to the direct sugar-to-hydrocarbon renewable jet fuels produced by Amyris (AERO News Network 2011). The Institute for International Trade Negotiations (ICONE) conducted a study of life-cycle GHG emissions of biojet fuel produced from sugarcane sugars based on the Amyris process parameters. The results showed that the life-cycle GHG emissions are around 15 gCO2e/MJ, an approximate 82% reduction compared with conventional Jet A/A-1 fuels (Nassar, Granco, et al. 2012). However, sugarcane could induce land use change, which was not considered in the study above. The GHG emissions associated with sugarcane production and transport, according to the study, are primarily dominated by farm input and the
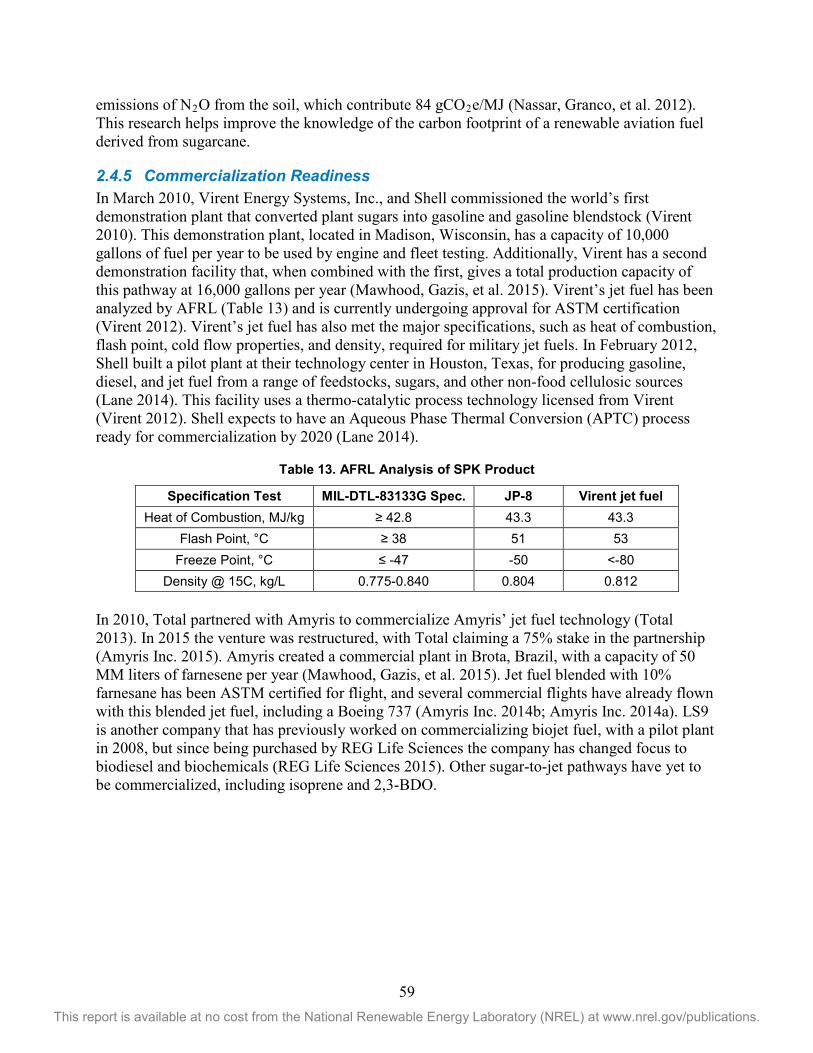
59 This report is available at no cost from the National Renewable Energy Laboratory (NREL) at www.nrel.gov/publications.
emissions of N2O from the soil, which contribute 84 gCO2e/MJ (Nassar, Granco, et al. 2012). This research helps improve the knowledge of the carbon footprint of a renewable aviation fuel derived from sugarcane.
2.4.5 Commercialization Readiness In March 2010, Virent Energy Systems, Inc., and Shell commissioned the world’s first demonstration plant that converted plant sugars into gasoline and gasoline blendstock (Virent 2010). This demonstration plant, located in Madison, Wisconsin, has a capacity of 10,000 gallons of fuel per year to be used by engine and fleet testing. Additionally, Virent has a second demonstration facility that, when combined with the first, gives a total production capacity of this pathway at 16,000 gallons per year (Mawhood, Gazis, et al. 2015). Virent’s jet fuel has been analyzed by AFRL (Table 13) and is currently undergoing approval for ASTM certification (Virent 2012). Virent’s jet fuel has also met the major specifications, such as heat of combustion, flash point, cold flow properties, and density, required for military jet fuels. In February 2012, Shell built a pilot plant at their technology center in Houston, Texas, for producing gasoline, diesel, and jet fuel from a range of feedstocks, sugars, and other non-food cellulosic sources (Lane 2014). This facility uses a thermo-catalytic process technology licensed from Virent (Virent 2012). Shell expects to have an Aqueous Phase Thermal Conversion (APTC) process ready for commercialization by 2020 (Lane 2014).
Table 13. AFRL Analysis of SPK Product
Specification Test MIL-DTL-83133G Spec. JP-8 Virent jet fuel Heat of Combustion, MJ/kg ≥ 42.8 43.3 43.3
Flash Point, °C ≥ 38 51 53 Freeze Point, °C ≤ -47 -50 <-80
Density @ 15C, kg/L 0.775-0.840 0.804 0.812 In 2010, Total partnered with Amyris to commercialize Amyris’ jet fuel technology (Total 2013). In 2015 the venture was restructured, with Total claiming a 75% stake in the partnership (Amyris Inc. 2015). Amyris created a commercial plant in Brota, Brazil, with a capacity of 50 MM liters of farnesene per year (Mawhood, Gazis, et al. 2015). Jet fuel blended with 10% farnesane has been ASTM certified for flight, and several commercial flights have already flown with this blended jet fuel, including a Boeing 737 (Amyris Inc. 2014b; Amyris Inc. 2014a). LS9 is another company that has previously worked on commercializing biojet fuel, with a pilot plant in 2008, but since being purchased by REG Life Sciences the company has changed focus to biodiesel and biochemicals (REG Life Sciences 2015). Other sugar-to-jet pathways have yet to be commercialized, including isoprene and 2,3-BDO.
60 This report is available at no cost from the National Renewable Energy Laboratory (NREL) at www.nrel.gov/publications.
3 Conclusion The issues of jet fuel cost, energy supply, energy security, and aviation emissions have driven the development of aircraft and engine technologies throughout the history of flight. Sustainable biomass-derived biojet fuel represents a major opportunity to ameliorate these issues. Many conversion technologies that turn biomass into jet fuels have been developed, and some of them are commercially viable. In this review, most of the current technologies have been classified into four major categories: ATJ, OTJ, GTJ, and STJ. Each category has been described and reviewed with regard to feedstocks, upgrading processes, production costs, environmental sustainability (life cycle GHG emissions and sustainability metrics such as consumptive water use at the biorefinery), and commercial readiness. Production yields, including intermediate and jet fuel yields, production costs, and GHG emissions for the conversion technologies reviewed in this work, are summarized in Table 14 for yields (details explained in Appendix A), Table 15 for production cost, and Figure 11 for GHG emission.
Feedstock is the most important parameter when considering the commercial feasibility of biojet fuel production. Agricultural and forest feedstocks as well as algal biomass are major feedstocks for producing alcohol fuels, and are able to provide large amounts of alcohols for converting into jet fuel. Plant oils, animal fats, waste cooking oils, algal oil, and pyrolysis oils are the predominant feedstocks for oil-related conversion processes such as HRJ, CH, and pyrolysis. Agricultural and forest residues can serve as major feedstocks for producing syngas or biogas. There is an abundance of sources of sugars (lignocellulosic or grain sugar) to ferment or synthesize to jet fuels via the STJ process. The sum of all the intermediates per dry ton of biomass from biomass feedstocks, mentioned above for each pathway, is demonstrated in Table 14 using energy basis, i.e., GGE per biomass dry ton (BDT), for consistency and comparison. Please note that although some yield data came from literature, most yields were calculated using projections.
Table 14 not only reports the yields of intermediates, but also summarizes the jet fuel yield after upgrading intermediates to finished products. The summaries are from data reported in the literature and several assumptions made for calculating intermediates to jet productions. Detailed analyses can be found in the Appendix A. For example, the jet fuel yields from palm seed are resulted from the calculation of the product yield from palm oil through deoxygenation and hydrotreating processes. The jet fuel yield from corn stover-derived isobutanol comes from the estimation of the product yield through dehydration, oligomerization, and hydrotreating processes. For consistency purposes, the units are normalized from a volumetric basis (gallon) to an energy basis (GGE) by dividing the lower heating value (LHV) of the products by the LHV of gasoline (detailed explanation in Appendix A). The yield values provide a general idea of the pathway/feedstock that most final products can be obtained from. For instance, OTJ pathways are having relatively higher yields of intermediates (GGE basis) per dry ton feedstock.
The HRJ process with palm seed, rapeseed, soybean, jatropha, Salicornia and camelina seeds as the feedstock has relatively high conversion from intermediate to final products (over 70%) due to the high carbon conversion. The CH process with jatropha seed as the feedstock has the lowest intermediate-to-jet conversion (10%) because most of the carbon distributes out of the jet fuel pool. These calculations are based on reported values from literature for intermediate yields from biomass, which are then upgraded to jet fuel based on theoretical limits. For example, the
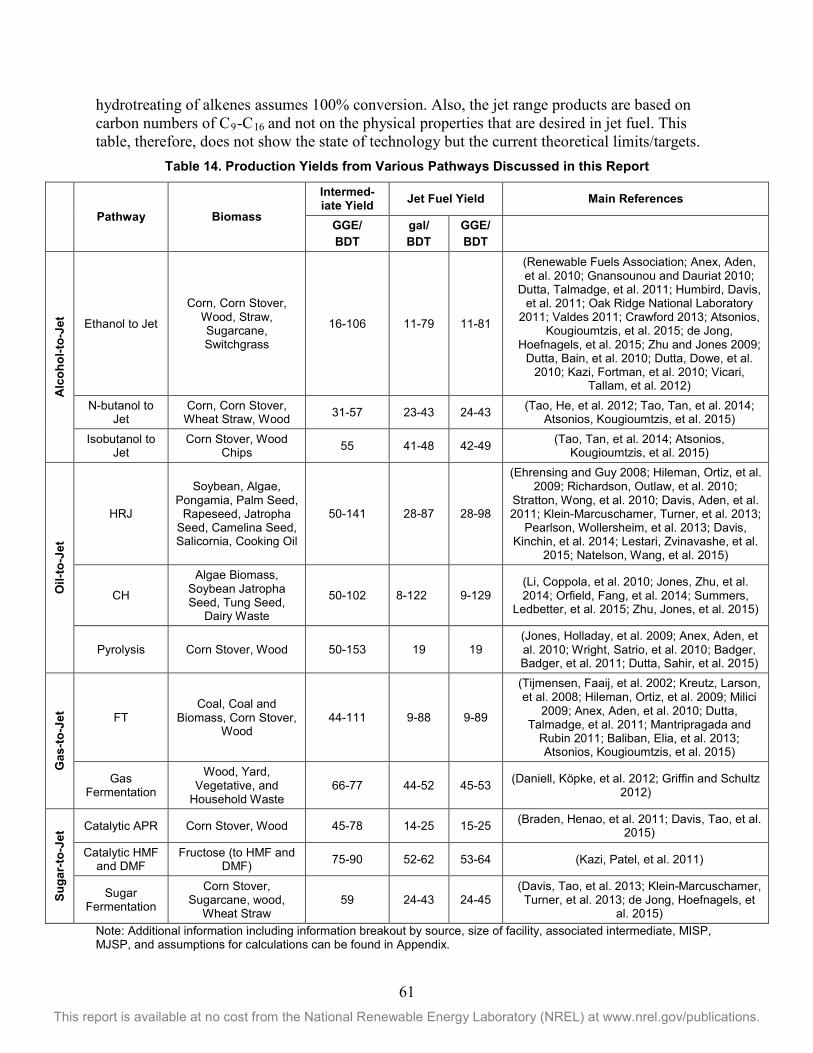
61 This report is available at no cost from the National Renewable Energy Laboratory (NREL) at www.nrel.gov/publications.
hydrotreating of alkenes assumes 100% conversion. Also, the jet range products are based on carbon numbers of C9-C16 and not on the physical properties that are desired in jet fuel. This table, therefore, does not show the state of technology but the current theoretical limits/targets.
Table 14. Production Yields from Various Pathways Discussed in this Report
Pathway Biomass
Intermed-iate Yield Jet Fuel Yield Main References
GGE/ BDT
gal/ BDT
GGE/ BDT
Alc
ohol
-to-J
et
Ethanol to Jet
Corn, Corn Stover, Wood, Straw, Sugarcane, Switchgrass
16-106 11-79 11-81
(Renewable Fuels Association; Anex, Aden, et al. 2010; Gnansounou and Dauriat 2010;
Dutta, Talmadge, et al. 2011; Humbird, Davis, et al. 2011; Oak Ridge National Laboratory
2011; Valdes 2011; Crawford 2013; Atsonios, Kougioumtzis, et al. 2015; de Jong,
Hoefnagels, et al. 2015; Zhu and Jones 2009; Dutta, Bain, et al. 2010; Dutta, Dowe, et al.
2010; Kazi, Fortman, et al. 2010; Vicari, Tallam, et al. 2012)
N-butanol to Jet
Corn, Corn Stover, Wheat Straw, Wood 31-57 23-43 24-43 (Tao, He, et al. 2012; Tao, Tan, et al. 2014;
Atsonios, Kougioumtzis, et al. 2015)
Isobutanol to Jet
Corn Stover, Wood Chips 55 41-48 42-49 (Tao, Tan, et al. 2014; Atsonios,
Kougioumtzis, et al. 2015)
Oil-
to-J
et
HRJ
Soybean, Algae, Pongamia, Palm Seed,
Rapeseed, Jatropha Seed, Camelina Seed, Salicornia, Cooking Oil
50-141 28-87 28-98
(Ehrensing and Guy 2008; Hileman, Ortiz, et al. 2009; Richardson, Outlaw, et al. 2010;
Stratton, Wong, et al. 2010; Davis, Aden, et al. 2011; Klein-Marcuschamer, Turner, et al. 2013;
Pearlson, Wollersheim, et al. 2013; Davis, Kinchin, et al. 2014; Lestari, Zvinavashe, et al.
2015; Natelson, Wang, et al. 2015)
CH
Algae Biomass, Soybean Jatropha Seed, Tung Seed,
Dairy Waste
50-102 8-122 9-129 (Li, Coppola, et al. 2010; Jones, Zhu, et al. 2014; Orfield, Fang, et al. 2014; Summers,
Ledbetter, et al. 2015; Zhu, Jones, et al. 2015)
Pyrolysis Corn Stover, Wood 50-153 19 19 (Jones, Holladay, et al. 2009; Anex, Aden, et al. 2010; Wright, Satrio, et al. 2010; Badger, Badger, et al. 2011; Dutta, Sahir, et al. 2015)
Gas
-to-J
et
FT Coal, Coal and
Biomass, Corn Stover, Wood
44-111 9-88 9-89
(Tijmensen, Faaij, et al. 2002; Kreutz, Larson, et al. 2008; Hileman, Ortiz, et al. 2009; Milici
2009; Anex, Aden, et al. 2010; Dutta, Talmadge, et al. 2011; Mantripragada and
Rubin 2011; Baliban, Elia, et al. 2013; Atsonios, Kougioumtzis, et al. 2015)
Gas Fermentation
Wood, Yard, Vegetative, and
Household Waste 66-77 44-52 45-53 (Daniell, Köpke, et al. 2012; Griffin and Schultz
2012)
Suga
r-to
-Jet
Catalytic APR Corn Stover, Wood 45-78 14-25 15-25 (Braden, Henao, et al. 2011; Davis, Tao, et al. 2015)
Catalytic HMF and DMF
Fructose (to HMF and DMF) 75-90 52-62 53-64 (Kazi, Patel, et al. 2011)
Sugar Fermentation
Corn Stover, Sugarcane, wood,
Wheat Straw 59 24-43 24-45
(Davis, Tao, et al. 2013; Klein-Marcuschamer, Turner, et al. 2013; de Jong, Hoefnagels, et
al. 2015) Note: Additional information including information breakout by source, size of facility, associated intermediate, MISP, MJSP, and assumptions for calculations can be found in Appendix.
62 This report is available at no cost from the National Renewable Energy Laboratory (NREL) at www.nrel.gov/publications.
The maturity of a conversion process impacts the process economics. FT-to-jet fuel (as an example of GTJ) was first proved by ASTM as a promising technology. Product selection, which leads to the yield of jet fuel, is strongly dependent upon the operating temperature, partial pressure of syngas, and the applied catalyst. The HRJ process is also an approved process, representing one of the OTJ technologies. The use of hydrogen and selection of a catalyst contribute to a significant part of the production costs. ATJ and STJ processes are at the R&D stage and may be the next processes approved. The jet fuel product yield, which depends on the catalyst or enzyme used, has attracted more and more interest and driven more research efforts.
The production cost for intermediates and final jet fuel from each pathway are summarized in Table 15. If the feedstock costs, financial assumptions, and analysis methodologies are not normalized, the cost numbers cannot be compared consistently. Both volumetric basis and energy basis units are presented in the table for consistency. All the cost numbers are adjusted to 2011 U.S. dollars. Both the feedstock cost and conversion technology contribute a significant portion of each production cost. The STJ pathway has higher intermediate cost due to the early stage of technology development, and the pyrolysis (one of the OTJ technologies) has a lower intermediate cost because the selling price of pyrolysis oil is reported to be very low in the literature. As seen in the table, HRJ fuel can be produced for $3.0–$34.6/gal (equivalent to $2.8-$32.0/GGE in 2011 U.S. dollars), which is reasonable low if using plant oil rather than using algae oil. The technology is expected to have further cost reduction once the technology can be further improved. STJ fuel through the DSHC process is evaluated to be $4.0–7.8/gal (equivalent to $4.3–$7.2/GGE in 2011 U.S. dollars) and this can be reduced when the technology and market are further developed. As seen in Table 15, the production costs from intermediates to final products increase slightly for HRJ process and increase significantly for DSHC process. The credits obtained from the co-products in the HRJ process reduce the cost of the upgrading processes from intermediates to jet fuel, and benefit the entire conversion process. The cost estimates for the other upgrading processes are not available and require future investigation.
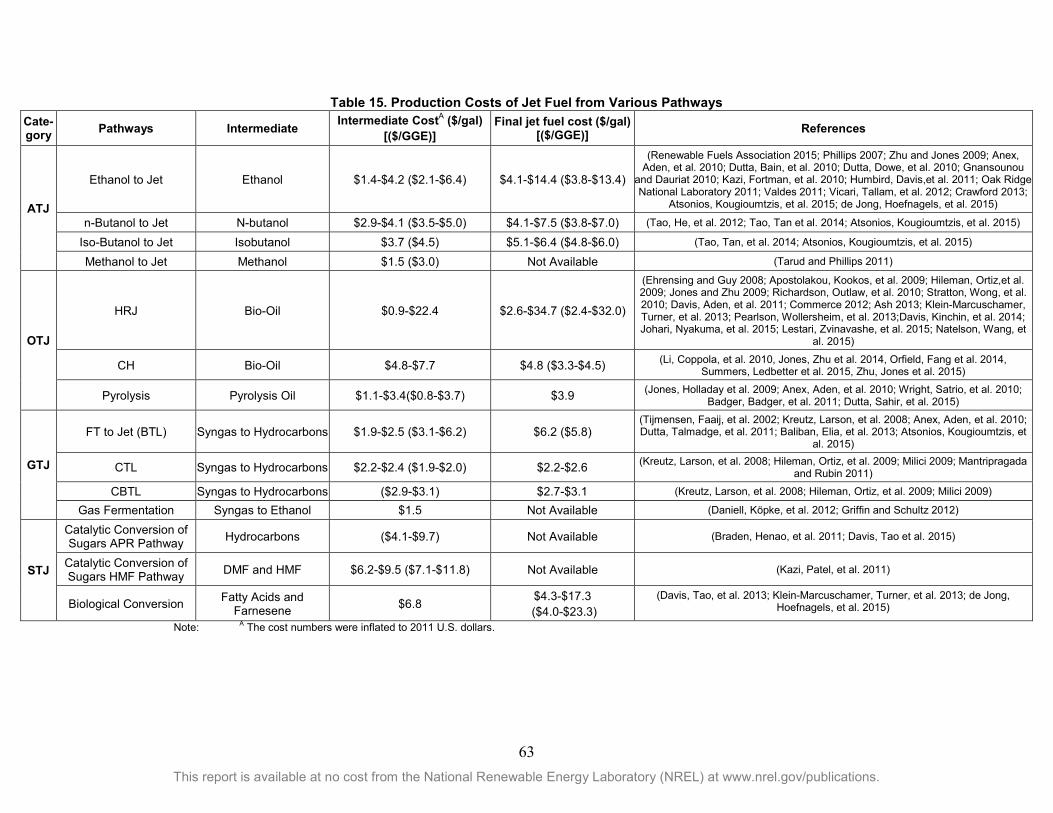
63 This report is available at no cost from the National Renewable Energy Laboratory (NREL) at www.nrel.gov/publications.
Table 15. Production Costs of Jet Fuel from Various Pathways Cate-gory Pathways Intermediate Intermediate CostA ($/gal)
[($/GGE)] Final jet fuel cost ($/gal)
[($/GGE)] References
ATJ
Ethanol to Jet Ethanol $1.4-$4.2 ($2.1-$6.4) $4.1-$14.4 ($3.8-$13.4)
(Renewable Fuels Association 2015; Phillips 2007; Zhu and Jones 2009; Anex, Aden, et al. 2010; Dutta, Bain, et al. 2010; Dutta, Dowe, et al. 2010; Gnansounou
and Dauriat 2010; Kazi, Fortman, et al. 2010; Humbird, Davis,et al. 2011; Oak Ridge National Laboratory 2011; Valdes 2011; Vicari, Tallam, et al. 2012; Crawford 2013;
Atsonios, Kougioumtzis, et al. 2015; de Jong, Hoefnagels, et al. 2015)
n-Butanol to Jet N-butanol $2.9-$4.1 ($3.5-$5.0) $4.1-$7.5 ($3.8-$7.0) (Tao, He, et al. 2012; Tao, Tan et al. 2014; Atsonios, Kougioumtzis, et al. 2015)
Iso-Butanol to Jet Isobutanol $3.7 ($4.5) $5.1-$6.4 ($4.8-$6.0) (Tao, Tan, et al. 2014; Atsonios, Kougioumtzis, et al. 2015)
Methanol to Jet Methanol $1.5 ($3.0) Not Available (Tarud and Phillips 2011)
OTJ
HRJ Bio-Oil $0.9-$22.4 $2.6-$34.7 ($2.4-$32.0)
(Ehrensing and Guy 2008; Apostolakou, Kookos, et al. 2009; Hileman, Ortiz,et al. 2009; Jones and Zhu 2009; Richardson, Outlaw, et al. 2010; Stratton, Wong, et al. 2010; Davis, Aden, et al. 2011; Commerce 2012; Ash 2013; Klein-Marcuschamer, Turner, et al. 2013; Pearlson, Wollersheim, et al. 2013;Davis, Kinchin, et al. 2014; Johari, Nyakuma, et al. 2015; Lestari, Zvinavashe, et al. 2015; Natelson, Wang, et
al. 2015)
CH Bio-Oil $4.8-$7.7 $4.8 ($3.3-$4.5) (Li, Coppola, et al. 2010, Jones, Zhu et al. 2014, Orfield, Fang et al. 2014, Summers, Ledbetter et al. 2015, Zhu, Jones et al. 2015)
Pyrolysis Pyrolysis Oil $1.1-$3.4($0.8-$3.7) $3.9 (Jones, Holladay et al. 2009; Anex, Aden, et al. 2010; Wright, Satrio, et al. 2010; Badger, Badger, et al. 2011; Dutta, Sahir, et al. 2015)
GTJ
FT to Jet (BTL) Syngas to Hydrocarbons $1.9-$2.5 ($3.1-$6.2) $6.2 ($5.8) (Tijmensen, Faaij, et al. 2002; Kreutz, Larson, et al. 2008; Anex, Aden, et al. 2010; Dutta, Talmadge, et al. 2011; Baliban, Elia, et al. 2013; Atsonios, Kougioumtzis, et
al. 2015)
CTL Syngas to Hydrocarbons $2.2-$2.4 ($1.9-$2.0) $2.2-$2.6 (Kreutz, Larson, et al. 2008; Hileman, Ortiz, et al. 2009; Milici 2009; Mantripragada and Rubin 2011)
CBTL Syngas to Hydrocarbons ($2.9-$3.1) $2.7-$3.1 (Kreutz, Larson, et al. 2008; Hileman, Ortiz, et al. 2009; Milici 2009)
Gas Fermentation Syngas to Ethanol $1.5 Not Available (Daniell, Köpke, et al. 2012; Griffin and Schultz 2012)
STJ
Catalytic Conversion of Sugars APR Pathway Hydrocarbons ($4.1-$9.7) Not Available (Braden, Henao, et al. 2011; Davis, Tao et al. 2015)
Catalytic Conversion of Sugars HMF Pathway DMF and HMF $6.2-$9.5 ($7.1-$11.8) Not Available (Kazi, Patel, et al. 2011)
Biological Conversion Fatty Acids and Farnesene $6.8 $4.3-$17.3
($4.0-$23.3) (Davis, Tao, et al. 2013; Klein-Marcuschamer, Turner, et al. 2013; de Jong,
Hoefnagels, et al. 2015)
Note: A The cost numbers were inflated to 2011 U.S. dollars.
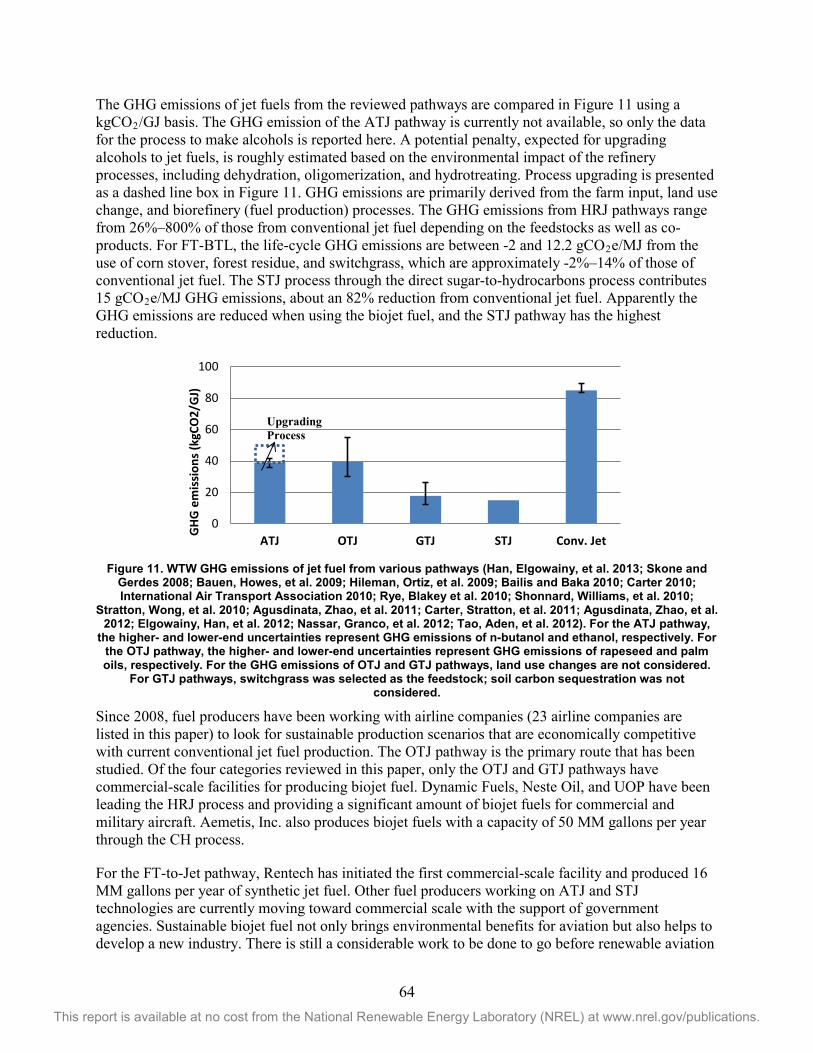
64 This report is available at no cost from the National Renewable Energy Laboratory (NREL) at www.nrel.gov/publications.
The GHG emissions of jet fuels from the reviewed pathways are compared in Figure 11 using a kgCO2/GJ basis. The GHG emission of the ATJ pathway is currently not available, so only the data for the process to make alcohols is reported here. A potential penalty, expected for upgrading alcohols to jet fuels, is roughly estimated based on the environmental impact of the refinery processes, including dehydration, oligomerization, and hydrotreating. Process upgrading is presented as a dashed line box in Figure 11. GHG emissions are primarily derived from the farm input, land use change, and biorefinery (fuel production) processes. The GHG emissions from HRJ pathways range from 26%–800% of those from conventional jet fuel depending on the feedstocks as well as co-products. For FT-BTL, the life-cycle GHG emissions are between -2 and 12.2 gCO2e/MJ from the use of corn stover, forest residue, and switchgrass, which are approximately -2%–14% of those of conventional jet fuel. The STJ process through the direct sugar-to-hydrocarbons process contributes 15 gCO2e/MJ GHG emissions, about an 82% reduction from conventional jet fuel. Apparently the GHG emissions are reduced when using the biojet fuel, and the STJ pathway has the highest reduction.
Figure 11. WTW GHG emissions of jet fuel from various pathways (Han, Elgowainy, et al. 2013; Skone and Gerdes 2008; Bauen, Howes, et al. 2009; Hileman, Ortiz, et al. 2009; Bailis and Baka 2010; Carter 2010; International Air Transport Association 2010; Rye, Blakey et al. 2010; Shonnard, Williams, et al. 2010;
Stratton, Wong, et al. 2010; Agusdinata, Zhao, et al. 2011; Carter, Stratton, et al. 2011; Agusdinata, Zhao, et al. 2012; Elgowainy, Han, et al. 2012; Nassar, Granco, et al. 2012; Tao, Aden, et al. 2012). For the ATJ pathway,
the higher- and lower-end uncertainties represent GHG emissions of n-butanol and ethanol, respectively. For the OTJ pathway, the higher- and lower-end uncertainties represent GHG emissions of rapeseed and palm oils, respectively. For the GHG emissions of OTJ and GTJ pathways, land use changes are not considered.
For GTJ pathways, switchgrass was selected as the feedstock; soil carbon sequestration was not considered.
Since 2008, fuel producers have been working with airline companies (23 airline companies are listed in this paper) to look for sustainable production scenarios that are economically competitive with current conventional jet fuel production. The OTJ pathway is the primary route that has been studied. Of the four categories reviewed in this paper, only the OTJ and GTJ pathways have commercial-scale facilities for producing biojet fuel. Dynamic Fuels, Neste Oil, and UOP have been leading the HRJ process and providing a significant amount of biojet fuels for commercial and military aircraft. Aemetis, Inc. also produces biojet fuels with a capacity of 50 MM gallons per year through the CH process.
For the FT-to-Jet pathway, Rentech has initiated the first commercial-scale facility and produced 16 MM gallons per year of synthetic jet fuel. Other fuel producers working on ATJ and STJ technologies are currently moving toward commercial scale with the support of government agencies. Sustainable biojet fuel not only brings environmental benefits for aviation but also helps to develop a new industry. There is still a considerable work to be done to go before renewable aviation
0
20
40
60
80
100
ATJ OTJ GTJ STJ Conv. Jet
GHG
em
issi
ons (
kgCO
2/G
J)
Upgrading Process

65 This report is available at no cost from the National Renewable Energy Laboratory (NREL) at www.nrel.gov/publications.
fuels become economically viable. Through the combination of the expertise of the aviation industry, government, biofuel companies, agriculture organizations, and academic systems, along with encouragement from regional banks, progress is being made toward an optimal process that utilizes the most effective feedstock sources, is amenable with current infrastructure, and produces renewable aviation fuels.
66 This report is available at no cost from the National Renewable Energy Laboratory (NREL) at www.nrel.gov/publications.
References Abhari R, T. L., Havlid P, Jannasch N (2011). Hydrocracking Process for Biological Feedstocks and
Hydrocarbons Produced Therefrom. United States, Syntroleum Corporation. B2: 1-13. Achten, W. M. J., L. Verchot, Y. J. Franken, E. Mathijs, V. P. Singh, R. Aerts and B. Muys (2008).
"Jatropha bio-diesel production and use." Biomass and Bioenergy 32(12): 1063-1084. Advanced Biofuels USA (2011). Syngas fermentation: The third pathway for cellulosic ethanol.
Frederick, MD, Advanced Biofuels USA. Aemetis (2012). The Aemetis Biorefinery: 100% Replacement, Renewable Jet and Diesel Fuels by
Conversion of Existing Biofuels Refinery Facilities. AERO News Network. (2011). "Analysis Of Amyris Jet Fuel Sustainability Funded By Aerospace
Companies." Retrieved March 6, 2013, from http://www.aero-news.net/index.cfm?do=main.textpost&id=5e919f97-bc2c-4ef8-b7bb-c1ff71d34f22.
Agusdinata, D. B., F. Zhao and D. A. DeLaurentis (2012). "Sustainability of Biojet Fuels: A Multiactor Life Cycle Assessment Approach " Potentials, IEEE 31(1): 27-33.
Agusdinata, D. B., F. Zhao, K. Ileleji and D. DeLaurentis (2011). "Life Cycle Assessment of Potential Biojet Fuel Production in the United States." Environmental Science & Technology 45(21): 9133-9143.
Air Transportation Action Group (2009). Beginner’s Guide to Aviation Biofuels. Air Transportation Action Group (2011). Beginner’s Guide to Aviation Biofuels. Second edition. Air Transportation Action Group (2012). Powering The Future of Flight, Air Transport Action Group. Airlines for America. (2013). "Airline Energy Q&A." Retrieved January 10, 2013,
from http://www.airlines.org/Pages/Home.aspx. Allen, C., E. Toulson, T. Edwards and T. Lee (2012). "Application of a novel charge preparation
approach to testing the autoignition characteristics of JP-8 and camelina hydroprocessed renewable jet fuel in a rapid compression machine." Combustion and Flame 159(9): 2780-2788.
Allen, C., D. Valco, E. Toulson, T. Edwards and T. Lee (2013). "Ignition behavior and surrogate modeling of JP-8 and of camelia and tallow hydrotreaeted renewable jet fuels at low temperaturews." Combustion and Flame 160: 232-239.
American Society for Testing and Materials. (2013). "ASTM 1655-08a: Standard Specification for Aviation Turbine Fuels." Retrieved April 4, 2013, from http://www.astm.org/Standards/D1655.htm.
American Society for Testing and Materials. (2013). "ASTM D7566 - 12a Standard Specification for Aviation Turbine Fuel Containing Synthesized Hydrocarbons." Retrieved May 9, 2013, from http://www1.astm.org/Standards/D7566.htm#tfn00014.
Amyris Inc. (2012). "Azul Brazilian Airlines Makes Successful Demonstration Flight with Amyris Renewable Jet Fuel Produced from Sugarcane." Retrieved March 4, 2013, from https://amyris.com/photo-release-azul-brazilian-airlines-makes-successful-demonstration-flight-with-amyris-renewable-jet-fuel-produced-from-sugarcane/.
Amyris Inc. (2014a). First Intenational Commercial Flight Completed with Newly Approve Amyris-Total Aviation Biofuel.
Amyris Inc. (2014b). Total and Amyris Renewable Jet Fuel Ready for Use in Commercial Aviation. Amyris Inc. (2014c). Total, Amyris to market renewable jet fuel from commercial flights, Biomass
Magazine. Amyris Inc. (2015). Amyris Announces Total's Decision to Procees with Jet Fuels Joint Venture and
Plans to Restructure and Convert $175 Million of Outstanding Convertible Debt for Common Stock. P. DeNardo.
Anbarasan, P., Z. C. Baer, S. Sreekumar, E. Gross, J. B. Binder, H. W. Blanch, D. S. Clark and F. D. Toste (2012). "Integration of chemical catalysis with extractive fermentation to produce fuels." Nature 491(7423): 235-239.
67 This report is available at no cost from the National Renewable Energy Laboratory (NREL) at www.nrel.gov/publications.
Anex, R. P., A. Aden, F. K. Kazi, J. Fortman, R. M. Swanson, M. M. Wright, J. A. Satrio, R. C. Brown, D. E. Daugaard, A. Platon, G. Kothandaraman, D. D. Hsu and A. Dutta (2010). "Techno-economic comparison of biomass-to-transportation fuels via pyrolysis, gasification, and biochemical pathways." Fuel 89, Supplement 1(0): S29-S35.
Antal, M. J., S. G. Allen, X. Dai, B. Shimizu, M. S. Tam and M. Grønli (2000). "Attainment of the Theoretical Yield of Carbon from Biomass." Ind. Eng. Chem. Res. 39: 4024-4031.
Apostolakou, A. A., I. K. Kookos, C. Marazioti and K. C. Angelopoulos (2009). "Techno-economic analysis of a biodiesel production process from vegetable oils." Fuel Processing Technology 90(7-8): 1023-1031.
Applied Research Associates Inc. (2011). "Benefits of producing Next Generation Renewable Drop-in Fuels using our Biofuel Isoconversion Process." Retrieved March 7, 2013, from https://www.ara.com/products/biofuels-isoconversion.
Applied Research Associates Inc. (2012). "A novel process to convert oils from plants and algae into fuel." Retrieved March 7, 2013, from http://www.readifuels.com/ARA-CH-technology.html.
ArcelorMittal (2015). ArcelorMittal, LanzaTech, and Primetals Technologies announce partnership to construct breakthrough €87 million biofuel production facility.
Argonne National Laboratory (2011). GREET, The Greenhouse Gases, Regulated Emissions, and Energy Use In Transportation Model.
Armstrong, P. A., B. Bhatt, E. C. Heydorn and B. A. Toseland (1993). "Isobutanol Dehydration: A key step in producing MTBEE from Syngas," Air Products and Chemicals, Inc.
Ash, M. (2013). Oil Crops Outlook, Soybean Meal and Oil Prices Moderate Ahead of Declining Production, U. S. Department of Agriculture.
ASTM International. (2013). "ASTM D975 12a Standard Specification for Diesel Fuel Oils." Retrieved May 8, 2013, from http://www.astm.org/Standards/D975.htm.
Atlantic, V. (2008). Virgin Atlantic Becomes World's First Airline to Fly a Plane on Biofuel. Atsonios, K., M.-A. Kougioumtzis, K. D. Panopoulos and E. Kakaras (2015). "Alternative
thermochemical routes for aviation biofuels via alcohols synthesis: Process modeling, techno-economic assessment and comparison." Applied Energy 138: 346-366.
Atsumi, S., T. Hanai and J. C. Liao (2008). "Non-fermentative pathways for synthesis of branched-chain higher alcohols as biofuels." Nature 451(7174): 86-90.
Badger, P., S. Badger, M. Puettmann, P. Steele and J. Cooper (2011). "Techno-Economic Analysis: Preliminary Assessment oOf Pyrolysis Oil Production Costs aAnd Material Energy Balance Associated wWith aA Transportable Fast Pyrolysis System." BioResouces 6(1): 34-47.
Baez, A., K. M. Cho and J. C. Liao (2011). "High-flux isobutanol production using engineered Escherichia coli: a bioreactor study with in situ product removal." Applied Microbiology and Biotechnology 90(5): 1681-1690.
Bailis, R. E. and J. E. Baka (2010). "Greenhouse Gas Emissions and Land Use Change from Jatropha Curcas-Based Jet Fuel in Brazil." Environmental Science & Technology 44(22): 8684-8691.
Bain, R. L., K. A. Magrini-Bair, J. Hensley, W. S. Jablonski, K. M. Smith, K. R. Gaston and M. M. Yung (2014). "Pilot Scale Production of Mixed Alcohols from wood." Ind. Eng. Chem. Res. 53: 2204-2218.
Baliban, R. C., J. A. Elia, C. A. Floudas, B. Gurau, M. B. Weingarten and S. D. Klotz (2013). "Hardwood Biomass to Gasoline, Diesel, and Jet Fuel: 1. Process Synthesis and Global Optimization of a Thermochemical Refinery." Energy & Fuels.
Baliban, R. C., J. A. Elia, C. A. Floudas, X. Xiao, Z. Zhang, J. Li, H. Cao, J. Ma, Y. Qiao and X. Hu (2013). "Thermochemical Conversion of Duckweed Biomass to Gasoline, Diesel, and Jet Fuel: Process Synthesis and Global Optimization." Industrial & Engineering Chemistry Research.
Bastian, S., X. Liu, J. T. Meyerowitz, C. D. Snow, M. M. Y. Chen and F. H. Arnold (2011). "Engineered ketol-acid reductoisomerase and alcohol dehydrogenase enable anaerobic 2-methylpropan-1-ol production at theoretical yield in Escherichia coli." Metabolic Engineering 13(3): 345-352.
Bauen, A., J. Howes, L. Bertuccioli and C. Chudziak (2009). Review of the potential for biofuels in aviation, E4tech.
68 This report is available at no cost from the National Renewable Energy Laboratory (NREL) at www.nrel.gov/publications.
Bauldreay, J. M. (2012). Technologies of fuel conversion. AIREG Workshop. Berlin, Germany. Becker, K. and H. Makkar (2008). "Jatropha curcas: a potential source for tomorrow's oil and biodiesel."
Lipid Technology 20(5): 104-107. Bender, M. (1999). "Economic feasibility review for community-scale farmer cooperatives for biodiesel."
Bioresource Technology 70(1): 81-87. Bernardo, A., R. Howard-Hildige, A. O'Connell, R. Nichol, J. Ryan, B. Rice, E. Roche and J. J. Leahy
(2003). "Camelina oil as a fuel for diesel transport engines." Industrial Crops and Products 17(3): 191-197.
Biddy, M. and S. Jones (2013). Catalytic Upgrading of Sugars to Hydrocarbons Technology Pathway. National Renewable Energy Laboratory and Pacific Northwest National Laboratory.
Biodiesel Magazine. (2012). "Aemetis expands biojet license agreement with Chevron LG." Retrieved March 7, 2013, from http://www.biodieselmagazine.com/articles/8752/aemetis-expands-biojet-license-agreement-with-chevron-lg.
BiofuelsDigest. (2015). "Neste Oil: Biofuels Digest’s 2015 5-Minute Guide." from http://www.biofuelsdigest.com/bdigest/2015/01/29/neste-oil-biofuels-digests-2015-5-minute-guide/.
Biomass Magazine. (2013). "NRC releases biojet test flight data." from http://biomassmagazine.com/articles/8494/nrc-releases-biojet-test-flight-data.
Blakeley, K. (2012). DOD Alternative Fuels: Policy, Initiatives and Legislative Activity, Congressional Research Service.
Blanch, H. W. (2012). "Bioprocessing for biofuels." Current Opinion in Biotechnology 23(3): 390-395. Blommel, P. (2011). Catalytic Conversion of Carbonhydrates to Hydrocarbons. DOE Biomass Research
and Development Technical Advisory Committee Meeting. Blommel, P. G., G. R. Keenan, R. T. Rozmiarek and R. D. Cortright (2008). "Catalytic conversion of
sugar into conventional gasoline, diesel, jet fuel, and other hydrocarbons." International sugar journal 110(1319).
Blommel, R. D. C. (2008). Production of Conventional Liquid Fuels from Sugars. Blommer, P. G. and R. D. Cortright (2008). Production of Conventional Liquid Fuels from Sugars, Virent
Energy Systems, Inc. Bloomberg. (2012). "EPA Rejects Palm-Oil Based Biodiesel for Renewable Fuels Program." Retrieved
December 14, 2012, from http://www.bloomberg.com/news/2012-01-27/epa-rejects-palm-oil-based-biodiesel-for-renewable-fuels-program.html.
Bond, J. Q., D. M. Alonso, D. Wang, R. M. West and J. A. Dumesic (2010). "Integrated Catalytic Conversion of γ-Valerolactone to Liquid Alkenes for Transportation Fuels." Science 327(5969): 1110-1114.
Borrion, A. L., M. C. McManus and G. P. Hammond (2012). "Environmental life cycle assessment of lignocellulosic conversion to ethanol: A review." Renewable and Sustainable Energy Reviews 16(7): 4638-4650.
Botes, F. G. N., J.W. , de Loosdrecht, J.V. (2013). "A comparison of cobalt and iron based slurry phase Fischer–Tropsch synthesis." Catalysis Today 215: 112-120.
Bowen, B. H., M. W. Irwin and D. Canchi (2007). Coal-To-Liquids (CTL) & Fischer-Tropsch Processing (FT), Indiana Center for Coal Technology Research.
BP. (2012). "Jet A1 MSDS." Retrieved Mar. 1st, 2013, from http://www.bp.com/sectiongenericarticle.do?categoryId=16003555&contentId=7020878.
Braden, D. J., C. A. Henao, J. Heltzel, C. C. Maravelias and J. A. Dumesic (2011). "Production of liquid hydrocarbon fuels by catalytic conversion of biomass-derived levulinic acid." Green Chemistry 13(7): 1755-1765.
Brennan, L. and P. Owende (2010). "Biofuels from microalgae—A review of technologies for production, processing, and extractions of biofuels and co-products." Renewable and Sustainable Energy Reviews 14(2): 557-577.
69 This report is available at no cost from the National Renewable Energy Laboratory (NREL) at www.nrel.gov/publications.
Byogy Renewables (2011). Alcohol To Jet (ATJ) Emerging Through ASTM. ICAO Aviation And Sustainable Alternative Fuels Workshop, Montreal Canada.
Caldecott, B. and S. Tooze (2009). Green skies thinking: promoting the development and commercialisation of sustainable bio-jet fuels.
Calysta, I. (2014). "Calysta demonstrates lab-scale production of lactic acid from methane." Calysta Nutrition. (2015). "US life science firm announces plans to launch FeedKind™ Protein –
Sustainable Fishmeal Alternative." Cardona, C. A. and O. J. Sanchez (2007). "Fuel ethanol production: Process design trends and integration
opportunities." Bioresource Technology 98(12): 2415-2457. Carter, N. A. (2010). Environmental and Economic Assessment of Microalgae-derived Jet Fuel. Master's
thesis, Massachusetts Institute of Technology. Carter, N. A., R. W. Stratton, M. K. Bredehoeft and J. I. Hileman (2011). Energy and Environmental
Viability of Select Alternative Jet Fuel Pathways. 47th AIAA/ASME/SAE/ASEE Joint Propulsion Conference & Exhibit, San Diego, California.
Chempro. (2012). "Fatty acid composition of oils and fats." Retrieved December 15, 2012, from http://www.chempro.in/fattyacid.htm.
Cheng, K.-K., Q. Liu, J.-A. Zhang, J.-P. Li, J.-M. Xu and G.-H. Wang (2010). "Improved 2,3-butanediol production from corncob acid hydrolysate by fed-batch fermentation using Klebsiella oxytoca." Process Biochemistry 45(4): 613-616.
Cheremisinoff, N. P. (1999). Handbook of Industrial Toxicology and Hazardous Materials, Taylor & Francis.
Chheda, J. N. and J. A. Dumesic (2007). "An overview of dehydration, aldol-condensation and hydrogenation processes for production of liquid alkanes from biomass-derived carbohydrates." Catalysis Today 123(1–4): 59-70.
Chhetri, A. B., K. C. Watts and M. R. Islam (2008). "Waste Cooking Oil as an Alternate Feedstock for Biodiesel Production." Energies 1(1): 3-18.
Chotani, G. K., B. Kirshner, J. Latone and J. P. Pucci (2013). Production of isoprene under reduced oxygen inlet levels, Danisco US Inc.
Chou, C. H. and P. Maness (2014). Transform C. thermocellum with codon-optimized ispS genes from Kudzu and hybrid aspen driven by the strong gapDH promoter and obtain two C. thermocellum transformants.
Cobalt. (2012). "Cobalt And The Naval Air Warfare Center Team Up To Produce A Renewable Jet Fuel From Bio N-Butanol." from http://www.prnewswire.com/news-releases/cobalt-and-the-naval-air-warfare-center-team-up-to-produce-a-renewable-jet-fuel-from-bio-n-butanol-143461676.html.
Coleman, W. J., G. M. Vidanes, G. Cottarel, S. Muley, R. Kamimura, A. F. Javan, J. Sun and E. S. Groban (2014). Biological Conversion of Multi-Carbon Compounds from Methane, Google Patents.
Colvin, H. A. (1990). Process for the Thermal Dimerization of Isoprene, The Goodyear Tire and Rubber Company.
Commerce, F. (2012). "Refining cooking oil into biofuel becomes a growing industry." Retrieved May 9, 2013, from http://finance-commerce.com/2012/04/refining-cooking-oil-into-biofuel-becomes-a-growing-industry/.
Cortright, R. (2009). Catalytic Conversion of Sugars to Conventional Liquid Fuels. AIChE Annual Meeting. Nashville, TN, Virent Energy Systems Inc.
Crawford, J. (2013). Techno-economic analysis of hydrocarbon biofuels from poplar biomass, University of Washington.
Czernik, S. and A. V. Bridgwater (2004). "Overview of applications of biomass fast pyrolysis oil." Energy & Fuels 18(2): 590-598.
D'oca, M. G. M., J. A. Morón-Villarreyes, J. S. Lemões and C. S. B. Costa (2012). "Fatty acids composition in seeds of the South American glasswort Sarcocornia ambigua." Anais da Academia Brasileira de Ciências 84: 865-870.
70 This report is available at no cost from the National Renewable Energy Laboratory (NREL) at www.nrel.gov/publications.
Daniell, J., M. Köpke and S. Simpson (2012). "Commercial Biomass Syngas Fermentation." Energies 5(12): 5372-5417.
Davis, B. H. (2009). "Fischer–Tropsch Synthesis: Reaction mechanisms for iron catalysts." Catalysis Today 141(1–2): 25-33.
Davis, R., A. Aden and P. T. Pienkos (2011). "Techno-economic analysis of autotrophic microalgae for fuel production." Applied Energy 88(10): 3524-3531.
Davis, R., C. Kinchin, J. Markham, E. Tan, L. Laurens, D. Sexton, D. Knorr, P. Schoen and J. Lukas (2014). Process Design and Economics for the Conversion of Algal Biomass to Biofuels: Algal Biomass Fractionation to Lipid- and Carbohydrate-Derived Fuel Products. National Renewable Energy Laboratory, Golden, CO, USA.
Davis, R., L. Tao, C. Scarlata, E. C. D. Tan, J. Ross, J. Lukas and D. Sexton (2015). Process Design and Economics for the Conversion of Lignocellulosic Biomass to Hydrocarbons: Dilute-Acid and Enzymatic Deconstruction of Biomass to Sugars and Catalytic Conversion of Sugars to Hydrocarbons, National Renewable Energy Laboratory, Golden, CO, USA.
Davis, R., L. Tao, E. C. D. Tan, M. J. Biddy, G. T. Beckham, C. Scarlata, J. Jacobson, K. Cafferty, J. Ross, J. Lukas, D. Knorr and P. Schoen (2013). Process Design and Economics for the Conversion of Lignocellulosic Biomass to Hydrocarbons: Dilute-Acid and Enzymatic Deconstruction of Biomass to Sugars and Biological Conversion of Sugars to Hydrocarbons. National Renewable Energy Laboratory, Golden, CO, USA.
de Beeck, B. O., M. Dusselier, J. Geboers, J. Holsbeek, E. Morré, S. Oswald, L. Giebeler and B. F. Sels (2015). "Direct catalytic conversion of cellulose to liquid straight-chain alkanes." Energy & Environmental Science.
de Jong, S., R. Hoefnagels, A. Faaij, R. Slade, R. Mawhood and M. Junginger (2015). "The feasibility of short-term production strategies for renewable jet fuels – a comprehensive techno-economic comparison." Biofuels, Bioproducts and Biorefining 9(6): 778-800.
de Klerk, A. (2010). Fischer-Tropsch Jet Fuel Process U.S. de Klerk, A. (2011). "Fischer-Tropsch fuels refinery design." Energy & Environmental Science 4(4):
1177-1205. de Klerk, A. (2013). Fischer-Tropsch Process. Kirk-Othmer Encyclopedia of Chemical Technology. de Klerk, A., R. J. J. Nel and R. Schwarzer (2007). "Oxygenate Conversion over Solid Phosphoric Acid."
Industrial & Engineering Chemistry Research 46(8): 2377-2382. Dellomonaco, C., J. M. Clomburg, E. N. Miller and R. Gonzalez (2011). "Engineered reversal of the
[bgr]-oxidation cycle for the synthesis of fuels and chemicals." Nature 476(7360): 355-359. den Breejen, J. P., P. B. Radstake, G. L. Bezemer, J. H. Bitter, V. Frøseth, A. Holmen and K. P. d. Jong
(2009). "On the Origin of the Cobalt Particle Size Effects in Fischer−Tropsch Catalysis." Journal of the American Chemical Society 131(20): 7197-7203.
den Breejen, J. P., J. R. A. Sietsma, H. Friedrich, J. H. Bitter and K. P. de Jong (2010). "Design of supported cobalt catalysts with maximum activity for the Fischer–Tropsch synthesis." Journal of Catalysis 270(1): 146-152.
Denis, P., A. Jean, J. F. Croizy, A. Mortreux and F. Petit (1990). "Regiocontrolled and stereocontrolled carbon-carbon bond formation via linear dimerization of conjugated dienes catalyzed by nickel-aminophosphinite complexes." Journal of the American Chemical Society 112(3): 1292-1294.
Department of Energy (2011). Conversion Technologies for Advanced Biofuels-Carbohydrates Upgrading, Department of Energy, Office of the Biomass Program in the Office of Energy Efficiency and Renewable Energy, Conversion Technologies for Advanced Biofuels Workshop.
Department of Energy (2012). Catalytic Conversion of Sugars to Conventional Liquid Fuels. Department of Energy, Energy Efficiency & Renewable Energy, Biomass Technologies Office.
Department of Energy. (2015). "Federal Laws and Incentives" from http://www.afdc.energy.gov/laws/fed_summary.
71 This report is available at no cost from the National Renewable Energy Laboratory (NREL) at www.nrel.gov/publications.
Department of Energy and Energy Efficiency & Renewable Energy (2012). Amyris Integrated Biorefinery demonstrating the conversion of sweet sorgum biomass to hydrocarbon fuel and chemicals.
Department of Energy, Energy Efficiency & Renewable Energy, and Biomass Technologies Office (2012). Catalytic Conversion of Sugars to Conventional Liquid Fuels. Department of Energy.
Department of Energy, Energy Efficiency & Renewable Energy and A. F. D. Center. (2013). "Fuel Properties Comparison." Retrieved December 11, 2013, from http://www.afdc.energy.gov/fuels/fuel_properties.php.
Doppelt, P., T. H. Baum and L. Ricard (1996). "Synthesis and Characterization of a Bis(μ-β-diketonato)bis((1,2,5,6-η)-1,5-dimethyl-1,5- cyclooctadiene)disilver Complex. An Intermediate in the Synthesis of an Isomerically Pure (β-Diketonato)((1,2,5,6-η)-1,5-dimethyl-1,5-cyclooctadiene)copper(I) Complex." Inorganic Chemistry 35(5): 1286-1291.
Dry, M. E. (1996). "Practical and theoretical aspects of the catalytic Fischer-Tropsch process." Applied Catalysis A: General 138(2): 319-344.
Dry, M. E. (2002). "High Quality Diesel via the Fischer–Tropsch Process-A Review." Journal of Chemical Technology & Biotechnology 77(1): 43-50.
Dry, M.E. (2004). "Present and future applications of the Fischer–Tropsch process." Applied Catalysis A: General 276: 1-3.
Dutta, A., R. L. Bain and M. J. Biddy (2010). "Techno-economics of the production of mixed alcohols from lignocellulosic biomass via high-temperature gasification." Environmental Progress & Sustainable Energy 29(2): 163-174.
Dutta, A., N. Dowe, K. N. Ibsen, D. J. Schell and A. Aden (2010). "An economic comparison of different fermentation configurations to convert corn stover to ethanol using Z. mobilis and Saccharomyces." Biotechnology Progress 26(1): 64-72.
Dutta, A., A. Sahir, E. Tan, D. Humbird, L. Snowden-Swan, P. Meyer, J. Ross, D. Sexton, R. Yap and J. Lukas (2015). Process design and economics for the conversion of lignocellulosic biomass to hydrocarbon fuels: thermochemical research pathways with in situ and ex situ upgrading of fast pyrolysis vapors, National Renewable Energy Laboratory, Golden, CO, USA.
Dutta, A., M. Talmadge, J. Hensley, M. Worley, D. Dudgeon, D. Barton, P. Groenendijk, D. Ferrari, B. Stears, E. M. Searcy, C. T. Wright and J. R. Hess (2011). Process Design and Economics for Conversion of Lignocellulosic Biomass to Ethanol, Thermaochemical Pathway by Indirect Gasification and Mixed Alcohol Synthesis, National Renewable Energy Laboratory. Golden, CO, USA.
EcoSeed. (2012). "U.S. Air Force Completes Alcohol-to-Jet Fuel Test Flight." Retrieved March, 2013, from http://oilprice.com/Alternative-Energy/Biofuels/US-Air-Force-Completes-First-Test-Flight-Run-on-New-Alcohol-Based-Jet-Fuel.html.
Edwards, T. (2008) "Air Force Future Fuel Utilization." Ehrensing, D. T. and S. O. Guy (2008). "Oilseed Crops: Camelina." Oregon State University Extension
Service. EISA (2007). Energy Independence and Security Act of 2007, Public Law: 110-140. Elgowainy A., Han J., Wang M., Carter N., Stratton R, Hilemaan J., Malwitz A., and B. S (2012). Life-
Cycle Analysis of Alternative Aviation Fuels in Greet. In Book Life-Cycle Analysis of Alternative Aviation Fuels in Greet. Argonne National Laboratory, Argonne National Laboratory.
Elgowainy, A., J. Han, M. Wang, N. Carter, R. Stratton, J. Hilemaan, A. Malwitz and S. Balasubramanian (2012). Life-Cycle Analysis of Alternative Aviation Fuels in Greet, Argonne National Laboratory.
Elgowainy, A., J. Han, M. Wang, J. Hileman and N. Carter (2012). Development of Life-Cycle Analysis Module of Aviation Fuel/Aircraft Systems in GREET. GREET Training Workshop. Washington D.C.
EPA (2010). "Final RFS Rule 2010. Office of the Federal Register." EthanolToday (2007). Butanol An Energy Alternative. European Biofuels Technology Platform. (2012). "Biofuels for Air Transport" Retrieved March 13, 2013,
from http://biofuelstp.eu/aviation-biofuels.html.
72 This report is available at no cost from the National Renewable Energy Laboratory (NREL) at www.nrel.gov/publications.
European Commission. (2011). "White Paper on Transport - Roadmap to a single European transport
area—Towards a competitive and resource efficient transport system." from http://ec.europa.eu/transport/themes/strategies/doc/2011_white_paper/white-paper-illustrated-brochure_en.pdf.
European Commission (2015). Report from the Commission to the European Parliament, the Council, the European Economic and Social Committee and the Committee of the Regions. Brussels.
ExxonMobil. (2012). "Methanol to Gasoline (MTG): Production of Clean Gasoline from Coal." Retrieved June 27, 2013, from http://www.zeogas.com/files/84109525.pdf.
ExxonMobil Aviation (2005). World Jet Fuel Specifications. Ezeji, T., N. Qureshi and H. P. Blaschek (2007). "Production of acetone-butanol-ethanol (ABE) in a
continuous flow bioreactor using degermed corn and Clostridium beijerinckii." Process Biochemistry 42(1): 34-39.
Federal Aviation Administration (2012) "Continuous Lower Energy, Emissions, and Noise (CLEEN) Program."
Feher, F. J., J. K. Kan, J. C. McAuliffe, T. F. McCall, S. Rodewald, T. A. Sabo, T. H. Wong, C. D. Ploetz and L. J. Pickert (2013). Purification of isoprene from renewable resources, Danisco US Inc. and The Goodyear Tire and Rubber Company.
Fei, Q., M. Guarnieri, L. Tao, L. Laurens, N. Dowe and P. Pienkos (2014). "Advances in microalgae engineering and synthetic biology applications for biofuel production." Biotechnology Advances 32(3): 596-614.
Fernald, H. B., W. Gall, R. G. Hay and A. N. Kresge (1972). Process for converting ethylene to normal alpha olefins. U.S., Gulf Research and Development Company.
Forestière, A., H. Olivier-Bourbigou and L. Saussine (2009). "Oligomerization of monoolefins by homogeneous catalysts." Oil & Gas Science and Technology-Revue de l'IFP 64(6): 649-667.
Fortier, M.-O. P., G. W. Roberts, S. M. Stagg-Williams and B. S. M. Sturm (2014). "Life cycle assessment of bio-jet fuel from hydrothermal liquefaction of microalgae." Applied Energy 122: 73-82.
Frank, E. D., J. Han, I. Palou-Rivera, A. Elgowainy and M. Q. Wang (2011). User Manual for Algae Life-Cycle Analysis with GREET: Version 0.0, Argonne National LAboratory.
Gallezot, P., N. Nicolaus, G. Flèche, P. Fuertes and A. Perrard (1998). "Glucose Hydrogenation on Ruthenium Catalysts in a Trickle-Bed Reactor." Journal of Catalysis 180(1): 51-55.
Gary, J. H., G. E. Handwerk and M. J. Kaiser (2007). Petroleum Refining, Technology and Economics. Boca Raton, FL, CRC Press.
Gevo. (2011). "Gevo Awarded $5 Million to Develop Cellulosic Jet Fuel Grant will focus on developing sustainable, cost-effective biojet fuel from woody biomass " Retrieved 01/11/2013, from http://ir.gevo.com/phoenix.zhtml?c=238618&p=irol-newsArticle&ID=1611058.
Gevo. (2012). "Gevo Flies High with USAF Alcohol-to-Jet Test Flight." Retrieved Aug. 16, 2013, from http://ir.gevo.com/phoenix.zhtml?c=238618&p=irol-newsArticle_pf&id=1711592.
Gevo (2012). USAF A10 Test Flight Powered by Gevo’s Alcohol-to-Jet Fuel Validates Military Application.
Gevo (2013). Gevo Supplies U.S. Army with Fuel for the Black Haw Helicopter - The World's First Isobutanol Bio-jet Fuel Permons in Multiple Aircraft Platforms.
Gevo (2015). Alaska Aitlines to be Gevo's Commercial Launch Partner for Renewable Alcohol-Based Jet Fuel.
Gevo (2015). Gevo Inc. plans continues production of new biofuel at Luverne, Minn., plant. Gevo. (2016). "Gevo’s Alcohol to Jet Fuel Meets Approved ASTM Standard."
from http://ir.gevo.com/phoenix.zhtml?c=238618&p=RssLanding&cat=news&id=2151133. Ghirardi, M. L., L. Z., James W. Lee, Timothy Flynn, Michael Seibert, Elias Greenbaum, Anastasios
Melis (2000). "Microalgae: a green source of renewable H2." Trends in Biotechnology 18(12): 506-511.
73 This report is available at no cost from the National Renewable Energy Laboratory (NREL) at www.nrel.gov/publications.
Giannetto, G. E., G. R. Perot and M. R. Guisnet (1986). "Hydroisomerization and hydrocracking of n-alkanes. 1. Ideal hydroisomerization PtHY catalysts." Industrial & Engineering Chemistry Product Research and Development 25(3): 481-490.
Gnansounou, E. and A. Dauriat (2010). "Techno-economic analysis of lignocellulosic ethanol: A review." Bioresource Technology 101(13): 4980-4991.
Goguen, P.W., Teng Xu, Dewey H. Barich, Timothy W. Skloss, Weiguo Song, Zhike Wang, John B. Nicholas and J. F. Haw (1998). "Pulse-Quench Catalytic Reactor Studies Reveal a Carbon-Pool Mechanism in Methanol-to-Gasoline Chemistry on Zeolite HZSM-5." J. Am. Chem. Soc. 120(11): 2650-2651.
Gray, D., S. Sato, F. Garcia, R. Eppler and J. Cherry (2014). Amyris, Inc. Integrated Biorefinery Project Summary Final Report - Public Version.
Green Air (2009b). Japan Airlines demonstration flight concludes current series of alternative biofuel feedstocks testing.
Green Air (2010a). TAM Airlines conducts first-ever Airbus biofuel flight using Brazilian-sourced jatropha-based kerosene blend.
Green Air (2010b). EADS undertakes first aircraft flight powered by algae-derived biofuel and signs Brazilian production venture.
Green Air. (2010c). "Solena and Rentech to partner on synthetic fuel technology for Europe's proposed first sustainable jet fuel facility." Retrieved September 5, 2013, from http://www.greenaironline.com/news.php?viewStory=979.
Green Air (2011a). First-ever transatlantic aviation biofuel flight sets up week of alternative aviation fuel events at Paris Air Show.
Green Air (2011c). China joins the sustainable jet biofuel flight club as Air China and Boeing conduct two-hour demonstration.
Green Air (2011d). Virgin Atlantic partners with LanzaTech on 'breakthrough technology' to convert waste gases to jet biofuels.
Green Air (2012a). Etihad becomes first Middle East carrier to use sustainable biofuel as it takes delivery of new Boeing aircraft.
Green Air (2012b). Canadian researchers to carry out first-ever civil aircraft test flight to use 100 per cent jet biofuel.
Green Air (2013). Colombia's first commercial biofuel flight uses camelina-based renewable jet fuel blend from Honeywell.
Green Air (2014). US Farm to Fly initiative to develop national aviation biofuel industry receives boost from Energy Department.
Griffin, D. W. and M. A. Schultz (2012). "Fuel and chemical products from biomass syngas: A comparison of gas fermentation to thermochemical conversion routes." Environmental Progress & Sustainable Energy 31(2): 219-224.
Grima, E. M., A. R. Medina, A. G. Gimenez, J. A. S. Perez, F. G. Camacho and J. L. G. Sanchez (1994). "Comparison between Extraction of Lipids and Fatty-Acids from Microalgal Biomass." Journal of the American Oil Chemists Society 71(9): 955-959.
Gruber, P. R., M. W. Peters, J. M. Griffith, Y. A. Obaidi, L. E. Manzer, J. D. Taylor and D. E. Henton (2012). Renewable Compositions. U.S.
Gurbuz, E. I. and J. A. Dumesic (2013). Catalytic Strategies and Chemistries Involved in the Conversion of Sugars to Liquid Transportation Fuels. Catalysis for the Conversion of Biomass and Its Derivatives. M. Behrens and A. K. Datye. Berlin, Germany, Max Planck Research Library for the History and Development of Knowledge Proceedings 2.
Gurbuz, E. I., E. L. Kunkes and J. A. Dumesic (2009). "Dual-bed catalyst system for C–C coupling of biomass-derived oxygenated hydrocarbons to fuel-grade compounds." Green Chem. 12: 223-227.
Haas, M. J., A. J. McAloon, W. C. Yee and T. A. Foglia (2006). "A process model to estimate biodiesel production costs." Bioresource Technology 97(4): 671-678.
74 This report is available at no cost from the National Renewable Energy Laboratory (NREL) at www.nrel.gov/publications.
Han, J., A. Elgowainy, H. Cai and M. Q. Wang (2013) "Life-cycle analysis of bio-based aviation fuels." Bioresource Technology 150: 447-456.
Harkal, S., R. Jackstell, F. Nierlich, D. Ortmann and M. Beller (2005). "Development of a Highly Selective and Efficient Catalyst for 1,3-Butadiene Dimerization." Organic Letters 7(4): 541-544.
Hartmann, R. M., N. N. Garzón, E. M. Hartmann, A. A. M. Oliveira and E. Bazzo (2013). "Vegetable Oils of Soybean, Sunflower and Tung as Alternative Fuels for Compression Ignition Engines." International Journal of Thermodynamics 16: 87-96.
Harvey, B. G. and R. L. Quintana (2010). "Synthesis of renewable jet and diesel fuels from 2-ethyl-1-hexene." Energy & Environmental Science 3(3): 352-357.
Harvey, B. G. and M. E. Wright (2011). Selective Isomerization and Oligomerization of Olefin Feedstocks for the Production of Turbine and Diesel Fuels.
Hessami, M.-A., S. Christensen and R. Gani (1996). "Anaerobic digestion of household organic waste to produce biogas." Renewable Energy 9(1–4): 954-957.
Hileman, J. I. (2009). Carbon Neutral Aviation Growth through Alternative Fuels. Group on International Aviation and Climate Change (Giacc) Fourth Meeting. Montréal, Canada.
Hileman, J. I., D. S. Ortiz, J. T. Bartis, H. M. Wong, P. E. Donohoo, M. A. Weiss and I. A. Waitz (2009). Near-Term Feasibility of Alternative Jet Fuels, RAND Corporation.
Hill, A., R. Kelley, V. Srivastava, C. Akin, T. Hayes and J. Frank (1990). Bench-scale co-oxidative production of propylene oxide by methanotrophs, Institute of Gas Technology, Chicago, IL (United States).
Holmgren, K. and L. Hagberg (2009). LIfe cycle assessment of climate impact of Fischer-Tropsch diesel based on peat and biomass, Swedish Environmental Research Institute.
Honeywell. "Honeywell UOP Named Among Boeing's 2009 Suppliers Of The Year." Retrieved Nov. 12, 2012, from http://www51.honeywell.com/honeywell/news-events/press-releases-details/05.11.10UOPBoeingSupplierof2009.html.
Honeywell (2010). Honeywell Green Jet Fuel™ Powers Royal Netherlands Air Force Helicopter. Honeywell (2011). Honeywell Green Jet Fuel™ Powers U.S. Air Force Thunderbirds Demonstration Honeywell (2012). Honeywell Green Jet Fuel™ Powers Gulfstream Flights To NBAA. Hook, M., D. Fantazzini, A. Angelantoni and S. Snowden (2014). "Hydrocarbon liquefaction: viability as
a peak oil mitigation strategy." Philosophical Transactions of the Royal Society a-Mathematical Physical and Engineering Sciences 372(2006).
Hu, J.F. Y., Y. Lu (2012). "Application of Fischer–Tropsch Synthesis in Biomass to Liquid Conversion." Catalysts 2: 303-326.
Huang, W.-D. and Y. H. Percival Zhang (2011). "Analysis of biofuels production from sugar based on three criteria: Thermodynamics, bioenergetics, and product separation." Energy & Environmental Science 4(3): 784.
Hui, X., K. Kumar, C.-J. Sung, T. Edwards and D. Gardner (2012). "Experimental studies on the combustion characteristics of alternative jet fuels." Fuel 98(0): 176-182.
Humbird, D., R. Davis, L. Tao, C. kinchin, D. Hsu, A. Aden, P. SWchoen, J. Lukas, B. Olthof, M. Worley, D. Sexton and D. Dudgeon (2011). Process Design and Economics for Biochemical Conversion of Lignocellulosic Biomass to Ethanol: Dilute-Acid Pretreatment and Enzymatic Hydrolysis of Corn Stover, National Renewable Energy Laboratory, Golden, CO, USA.
IATA (2015). IATA Sustainable Aviation Fuel Roadmap. IEA (2012). The Potential Role of Biofuels in Commercial Air Transport - BioJetFuel. I. B. T. 40. International Air Transport Association (2010). IATA 2010 Report on Alternative Fuels, International Air
Transport Association. International Air Transport Association. (2013). "Fact Sheet: Alternative Fuels" Retrieved January 8,
2014, from https://www.iata.org/pressroom/facts_figures/fact_sheets/Documents/fact-sheet-alternative-fuels.pdf.
International Civil Aviation Organization. (2012). "Climate Change: Alternative Fuels." Retrieved December 18, 2012, from http://www.icao.int/environmental-protection/Pages/alternative-fuels.aspx.
75 This report is available at no cost from the National Renewable Energy Laboratory (NREL) at www.nrel.gov/publications.
Ipatieff, V. N. and B. B. Corson (1936). "Gasoline from Ethylene by Catalytic Polymerization." Industrial & Engineering Chemistry 28(7): 860-863.
Ipatieff, V. N., B. B. Corson and G. Egloff (1935). "Polymerization, a New Source of Gasoline." Industrial & Engineering Chemistry 27(9): 1077-1081.
Ji, X.-J., H. Huang and P.-K. Ouyang (2011). "Microbial 2,3-butanediol production: A state-of-the-art review." Biotechnology Advances 29(3): 351-364.
Jingura, R. M. and R. Matengaifa (2009). "Optimization of biogas production by anaerobic digestion for sustainable energy development in Zimbabwe." Renewable and Sustainable Energy Reviews 13(5): 1116-1120.
Johari, A., B. B. Nyakuma, S. H. Mohd Nor, R. Mat, H. Hashim, A. Ahmad, Z. Yamani Zakaria and T. A. Tuan Abdullah (2015). "The challenges and prospects of palm oil based biodiesel in Malaysia." Energy 81(0): 255-261.
Jones, S., P. Meyer, L. Snowden-Swan, A. Padmaperuma, E. Tan, A. Dutta, J. Jacobson and K. Cafferty (2013). Process design and economics for the conversion of lignocellulosic biomass to hydrocarbon fuels: fast pyrolysis and hydrotreating bio-oil pathway, Pacific Northwest National Laboratory. Richland, WA, USA.
Jones, S. B., J. E. Holladay, C. Valkenburg, D. J. Stevens, C. W. Walton, C. Kinchin, D. C. Elliott and S. Czernik (2009). Production of Gasoline and Diesel from Biomass via Fast Pyrolysis, Hydrotreating and Hydrocracking: A Design Case, Pacific Northwest National Laboratory. Richland, WA, USA.
Jones, S. B. and Y. Zhu (2009). Preliminary Economics for the Production of Pyrolysis Oil from Lignin in a Cellulosic Ethanol Biorefinery, Pacific Northwest National Laboratory. Richland, WA, USA.
Jones, S. B., Y. Zhu, D. B. Anderson, R. T. Hallen, D. C. Elliott, A. J. Schmidt, K. O. Albrecht, T. R. Hart, M. G. Butcher and C. Drennan (2014). Process Design and Economics for the Conversion of Algal Biomass to Hydrocarbons: Whole Algae Hydrothermal Liquefaction and Upgrading, Pacific Northwest National Laboratory, Richland, WA, USA.
Kahandawala, M. S. P., M. J. DeWitt, E. Corporan and S. S. Sidhu (2008). "Ignition and Emission Characteristics of Surrogate and Practical Jet Fuels." Energy & Fuels 22(6): 3673-3679.
Kalnes, T. N., M. M. McCall and D. R. Shonnard (2010). Renewable Diesel and Jet-Fuel Production from Fats and Oils. Thermochemical Conversion of Biomass to Liquid Fuels and Chemicals. M. Crocker, Royal Society of Chemistry.
Karatzos, S., J. D. McMillan and J. N. Saddler (2014). The Potential and Challenges of Drop-in Biofuels. Kasim, F. H. and A. P. Harvey (2011). "Influence of various parameters on reactive extraction of Jatropha
curcas L. for biodiesel production." Chemical Engineering Journal 171(3): 1373-1378. Kazi, F. K., J. Fortman, R. Anex, G. Kothandaraman, D. Hsu, A. Aden and A. Dutta (2010). Techno-
Economic Analysis of Biochemical Scenarios for Production of Cellulosic Ethanol, National Renewable Energy Laboratory, Golden, CO, USA.
Kazi, F. K., A. D. Patel, J. C. Serrano-Ruiz, J. A. Dumesic and R. P. Anex (2011). "Techno-economic analysis of dimethylfuran (DMF) and hydroxymethylfurfural (HMF) production from pure fructose in catalytic processes." Chemical Engineering Journal 169(1–3): 329-338.
Kessler, R. A. (2010). U.S. Air Force A-10 aircraft biofuel flight test a success. R. News. Khodakov, A. Y. (2009). "Fischer-Tropsch synthesis: Relations between structure of cobalt catalysts and
their catalytic performance." Catalysis Today 144(3–4): 251-257. King, F., G. J. Kelly and E. H. Stitt (2003). "98 Improved base catalysts for industrial condensation
reactions." Studies in Surface Science and Catalysis 145: 443-446. Klein-Marcuschamer, D., C. Turner, M. Allen, P. Gray, R. G. Dietzgen, P. M. Gresshoff, B. Hankamer,
K. Heimann, P. T. Scott, E. Stephens, R. Speight and L. K. Nielsen (2013). "Technoeconomic analysis of renewable aviation fuel from microalgae, Pongamia pinnata, and sugarcane." Biofuels, Bioproducts and Biorefining 7(4): 416-428.
Knovel. (2012). "Engineers transform sugars into jet fuel." Retrieved March 4, 2013, from http://why.knovel.com/all-engineering-news/1388-engineers-transform-sugars-into-jet-fuel.html.
76 This report is available at no cost from the National Renewable Energy Laboratory (NREL) at www.nrel.gov/publications.
Krautgartner, R., L. Lefebvre, L. E. Rehder, M. Boshnakova, M. Dobrescu, B. Flach, J. Wilson, O. Bettini, M. Guerrero, K. Bendz and K. Stange (2015). Oilseeds and Products Annual. Decreasing Production of Oilseeds, Except for Soybeans. Viena, USDA Foreign Agricultural Service.
Kreutz, T. G., E. D. Larson, G. Liu and R. H. Williams (2008). Fischer-Tropsch Fuels from Coal and Biomass. 25th Annual International Pittsburgh Coal Conference, Pittsburgh, Pennsylvania.
Krishna, R. and S. T. Sie (2000). "Design and scale-up of the Fischer–Tropsch bubble column slurry reactor." Fuel Processing Technology 64: 73-105.
Kumar, K. and C.-J. Sung (2010). "A comparative experimental study of the autoignition characteristics of alternative and conventional jet fuel/oxidizer mixtures." Fuel 89(10): 2853-2863.
Kumar, K. and C.-J. Sung (2010). "Flame Propagation and Extinction Characteristics of Neat Surrogate Fuel Components." Energy & Fuels 24(7): 3840-3849.
Kumar, M. and K. Gayen (2011). "Developments in biobutanol production: New insights." Applied Energy 88(6): 1999-2012.
Lane, J. (2012) "Virdia, Virent pioneer new super-performing, parit-cost renewable jet fuel pathway." Biofuels Digest.
Lane, J. (2014) "Shell: expects to be producing advanced biofuels at scale, in U.S., by end of decade." Biofuels Digest.
Lane, J. (2014) "Stora Enso acquires Virdia in (up to) $62M deal." Biofuels Digest. Lane, J. (2014a). U.S. Navy, DOE, USDA award $210M for 3 biorefineries and mil-spec fuels, Biofuels
Digest. Lane, J. (2015) "LanzaTech, INVISTA find direct pathway to bio-based butadiene." BiofuelsDigest. LanzaTech. (2011). "LanzaTech Gets U.S. $3 Million Contract From FAA For Alcohol To Jet Project"
from http://www.lanzatech.com/lanzatech-gets-us3-million-contract-from-faa-for-alcohol-to-jet-project/.
LanzaTech (2013). Virgin Atlantic and LanzaTech Named 2013 Observer Ethical Winners. Lastella, G., C. Testa, G. Cornacchia, M. Notornicola, F. Voltasio and V. K. Sharma (2002). "Anaerobic
digestion of semi-solid organic waste: biogas production and its purification." Energy Conversion and Management 43(1): 63-75.
Lawrence, M. and K.-A. Adamson (2014). Advanced Drop-In Biofuels for Commercial Aviation, Marine Shipping, and Military Applications: Global Market Analysis and Forecasts. Boulder, CO USA, Navigant Consulting, Inc.
Lenz, T. G. and A. R. Morelra (1980). "Economic Evaluation of the Acetone-Butanol Fermentation." Industrial & Engineering Chemistry Product Research and Development 19(4): 478-483.
Lestari, D., E. Zvinavashe and J. P. M. Sanders (2015). "Economic valuation of potential products from Jatropha seed in five selected countries: Zimbabwe, Tanzania, Mali, Indonesia, and The Netherlands." Biomass and Bioenergy 74(0): 84-91.
Leuphana (2011). Bio Aviation Fuel Feedstock Supply-Challengs, Strategies and Recent Developments. ICAO Aviation and Sustainable Alternative Fuels Workshop. Montreal.
Li, L., E. Coppola, J. Rine, J. L. Miller and D. Walker (2010). "Catalytic Hydrothermal Conversion of Triglycerides to Non-ester Biofuels." Energy & Fuels 24(2): 1305-1315.
Liu, T. and C. Khosla (2010). "Genetic Engineering of Escherichia coli for Biofuel Production." Annual Review of Genetics 44(1): 53-69.
Lloyd, T. A. and C. E. Wyman (2005). "Combined sugar yields for dilute sulfuric acid pretreatment of corn stover followed by enzymatic hydrolysis of the remaining solids." Bioresource Technology 96(18): 1967-1977.
Lualdi, M., S. Lögdberg, F. Regali, M. Boutonnet and S. Järås (2011). "Investigation of Mixtures of a Co-Based Catalyst and a Cu-Based Catalyst for the Fischer–Tropsch Synthesis with Bio-Syngas: The Importance of Indigenous Water." Topics in Catalysis 54(13-15): 977-985.
Lufthansa Group. (2010). "World premiere: Lufthansa first airline to use biofuel on commercial flights" from http://www.lufthansagroup.com/en/press/news-releases/singleview/archive/2010/november/29/article/1828.html.
77 This report is available at no cost from the National Renewable Energy Laboratory (NREL) at www.nrel.gov/publications.
Lupton, S. (2013). Pilot-Scale Biorefinery: Sustainable Transport Fuels from Biomass and Algal Residue via Integrated Pyrolysis and Catalytic Hydroconversion. 2013 Project Peer Review, U.S. Department of Energy, Bioenergy Technology Office. Alexandria, VA.
Makshina, E. V., M. Dusselier, W. Janssens, J. Degreve, P. A. Jacobs and B. F. Sels (2014). "Review of old chemistry and new catalytic advances in the on-purpose synthesis of butadiene." Chemical Society Reviews.
Mantripragada, H. C. and E. S. Rubin (2011). "Techno-economic evaluation of coal-to-liquids (CTL) plants with carbon capture and sequestration." Energy Policy 39(5): 2808-2816.
Marano, J. J. and J. P. Ciferno (2001). Life-Cycle Greenhouse-Gas Emissions Inventory For Fischer-Tropsch Fuels, National Energy Technology Laboratory, Golden, CO, USA.
Marano, J. P. C. (2001). Life-Cycle Greenhouse-Gas Emissions Inventory For Fischer-Tropsch Fuels. National Energy Technology Laboratory, Energy and Environmental Solutions, LLC.
Marchetti, J. M., V. U. Miguel and A. F. Errazu (2008). "Techno-economic study of different alternatives for biodiesel production." Fuel Processing Technology 89(8): 740-748.
Marker, T. L. (2005). Opportunities for Biorenewables in Oil Refineries, UOP LLC. Mawhood, R., E. Gazis, R. Hoefnagels, S. D. Jong and R. Slade (2015). Technological and commercial
maturity of aviation biofuelsL emerging options to produce jet from lignocellulosic biomass. 14th International Conference on Sustainable Engineering Technologies, Nottinghan, UK.
McAfee, E. A. (2012). The Aemetis Biorefinery: 100% Replacement, Renewable Jet and Diesel Fuels by Conversion of Existing Biofuels Refinery Facilities. Advanced Biofuels Marketing Conference. San Francisco.
McAuliffe, J. C., R. E. Muir, A. T. Nielsen, C. M. Peres, D. V. Vaviline and D. H. Wells (2013). Enhanced production of isoprene using host cells having decreased ispa activity, Google Danisco US Inc.
Mehta, P. S. and K. Anand (2009). "Estimation of a Lower Heating Value of Vegetable Oil and Biodiesel Fuel." Energy & Fuels 23(8): 3893-3898.
Midwest Aviation Sustainable Biofuels Initiative (2013). Fueling a Sustainable Future for Aviation. Milici, R. (2009). "Coal-to-Liquids: Potential Impact on U.S. Coal Reserves." Natural Resources
Research 18(2): 85-94. Misono, A., Y. Uchida, K.-i. Furuhata and S. Yoshida (1969). "Oligomerization of Isoprene by Hafnium
Catalysts." Bulletin of the Chemical Society of Japan 42(5): 1383-&. Morales, F. and B. M. Wechuysen (2006). "Promotion Effects in Co-based Fischer–Tropsch Catalysis."
Catalysis 19: 1-40. Moreira, M., A. C. Gurgel and J. E. A. Seabra (2014). "Life Cycle Greenhouse Gas Emissions of Sugar
Cane Renewable Jet Fuel." Environmental Science & Technology 48(24): 14756-14763. Morikawa, H., T. Sato and I. Okada (1977). Process for producing isoprene trimers. United States,
Mitsubishi Petrochemical Company Limited. 4020118. Mu, D., T. Seager, P. S. Rao and F. Zhao (2010). "Comparative Life Cycle Assessment of Lignocellulosic
Ethanol Production: Biochemical Versus Thermochemical Conversion." Environmental Management 46(4): 565-578.
Murrell, J. C. and M. S. Jetten (2009). "The microbial methane cycle." Environmental Microbiology Reports 1(5): 279-284.
NABC (2013). Hydrolysate Conditioning in the Catalysis of Lignocellulosi. NABC Highlight. N. A. B. Consortium. Golden, CO.
NASA (2011). Chicken Fat Fuel Emissions Look Cleaner, Greener. Nassar, A., G. Granco, J. Seabra, L. Harfuch, M. Moreira and P. Moura (2012). Sustainability of
sugarcane-derived renewable jet fuel: life cycle GHG emissions and benchmark of major sustainability standards, ICONE.
Natelson, R. H., W.-C. Wang, W. L. Roberts and K. D. Zering (2015). "Technoeconomic analysis of jet fuel production from hydrolysis, decarboxylation, and reforming of camelina oil." Biomass and Bioenergy 75: 23-34.
78 This report is available at no cost from the National Renewable Energy Laboratory (NREL) at www.nrel.gov/publications.
National Advanced Biofuels Consortium. (2011). "Catalysis of Lignocellulosic Sugars Process Strategy." Retrieved March 5, 2013, from http://www.nabcprojects.org/catalytic_sugar.html.
National Advanced Biofuels Consortium. (2012). "Fermentation of Lignocellulosic Sugars Process Strategy." Retrieved March 6, 2013, from http://www.nabcprojects.org/fermentation_lignocellulosic_sugar.html.
National Advanced Biofuels Consortium (2013). Amyris sucessfully makes renewable diesel from hydrolysate. NABC News Release.
Navy, U. S. (2011). Prowler Flies Energy Intercept Mission. Neilan, J. P., R. M. Laine, N. Cortese and R. F. Heck (1976). "Monoterpene syntheses via a palladium
catalyzed isoprene dimerization." The Journal of Organic Chemistry 41(21): 3455-3460. Neste Oil. (2011). "NExBTL aviation fuel." Retrieved Nov. 12, 2012,
from http://www.nesteoil.com/default.asp?path=1,41,11991,12243,17555. Newsmax. (2011). "Boeing, Embraer Back Sugar Jet-Fuel Study." Retrieved March 4, 2013,
from http://www.newsmax.com/SciTech/Boeing-EmbraerBackSugarJet-FuelStudy/2011/07/27/id/405040.
NNFCC. (2009). "Review of Technologies for Gasification of Biomass and Wastes," from http://www.ecolateral.org/gasificationnnfc090609.pdf.
Northwest Advanced Renewables Alliance (2015). "A New Vista for Green Fuels, Chemicals, and Environmentally Preferred Products-3RD Cumulative Report." 3rd Cumulative Report.
O'Brien, R. D. (2009). Fats and Oils: Formulating and Processing for Applications. Boca Raton, FL, CRC Press.
Oak Ridge National Laboratory (2011). U.S. Billion-Ton Update: Biomass Supply for a Bioenergy and Bioproducts Industry, U.S. Department of Energy, Energy Efficiency and Renewable Energy, Office of the Biomass Program.
ONGC and Quality Control Laboratory (2008). Specification for Aviation Turbine Fuel (Jet A1) Def Stan 91-91 issue 6 Amendment 1 (UK).
Op den Camp, H. J., T. Islam, M. B. Stott, H. R. Harhangi, A. Hynes, S. Schouten, M. S. Jetten, N. K. Birkeland, A. Pol and P. F. Dunfield (2009). "Environmental, genomic and taxonomic perspectives on methanotrophic Verrucomicrobia." Environmental Microbiology Reports 1(5): 293-306.
Oregon State University (2008). Camelina. Oregon State University. Orfield, N. D., A. J. Fang, P. J. Valdez, M. C. Nelson, P. E. Savage, X. N. Lin and G. A. Keoleian (2014).
"Life Cycle Design of an Algal Biorefinery Featuring Hydrothermal Liquefaction: Effect of Reaction Conditions and an Alternative Pathway Including Microbial Regrowth." ACS Sustainable Chemistry & Engineering 2(4): 867-874.
Park, K. C. and S. K. Ihm (2000). "Comparison of Pt/zeolite catalysts for n-hexadecane hydroisomerization." Applied Catalysis a-General 203(2): 201-209.
Pearlson, M., C. Wollersheim and J. Hileman (2013). "A techno-economic review of hydroprocessed renewable esters and fatty acids for jet fuel production." Biofuels, Bioproducts and Biorefining 7(1): 89-96.
Pearlson, M. N. (2007). A Techno-Economic and Environmental Assessment of Hydroprocesseed Renewable Distillate Fuels. Master of Science, Massachusetts Institute of Technology
Pereira, L. G., M. F. Chagas, M. O. S. Dias, O. Cavalett and A. Bonomi (2015). "Life cycle assessment of butanol production in sugarcane biorefineries in Brazil." Journal of Cleaner Production 96: 557-568.
Pereira, L. G., M. O. S. Dias, A. P. Mariano, R. Maciel Filho and A. Bonomi (2015). "Economic and environmental assessment of n-butanol production in an integrated first and second generation sugarcane biorefinery: Fermentative versus catalytic routes." Applied Energy 160: 120-131.
Peters, M. and J. D. Taylor (2013). U.S. 8373012 B2 Renewable Jet Fuel Blendstock from Isobutanol. G. Inc. USA. U.S. 8373012 B2.
Peters, M. W. and J. D. Taylor (2011). Renewable Jet Fuel Blendstock From Isobutanol. U.S.
79 This report is available at no cost from the National Renewable Energy Laboratory (NREL) at www.nrel.gov/publications.
Phillips, S. D. (2007). "Technoeconomic Analysis of a Lignocellulosic Biomass Indirect Gasification Process To Make Ethanol via Mixed Alcohols Synthesis." Industrial & Engineering Chemistry Research 46(26): 8887-8897.
Phillips, S. D., J. K. Tarud, M. J. Biddy and A. Dutta (2011). Gasoline from Wood via Integrated Gasification, Synthesis, and Methanol-to-Gasoline Technologies. National Renewable Energy Laboratory, Golden, CO, USA.
Pienkos, P. T. and A. Darzins (2009). "The promise and challenges of microalgal-derived biofuels." Biofuels Bioproducts & Biorefining-Biofpr 3(4): 431-440.
Pratt & Whitney (2014) "P&W FAA CLEEN Update." Pray, T. (2010). Biomass R&D Technical Advisory Committee: Drop-in Fuels Panel. Quintero, S. A. A., M. Ricklick and J. Kapat (2012). Synthetic Jet Fuels and their Impact in Aircraft
Performance and Elastomer Materials. 48th AIAA/ASME/SAE/ASEE Join Propulsion Conference & Exhibit, Atlanta, Georgia.
Rahmes, T. F., J. D. Kinder, T. M. Henry, G. Crenfeldt, G. F. Leduc, G. P. Zombanakis, Y. Abe, D. M. Lambert, C. Lewis, J. A. Juenger, M. G. Andac, K. R. Reilly, J. R. Holmgren, M. J. McCall and A. G. Bozzano (2009). Sustainable Bio-derived Synthetic Paraffinic Kerosene (Bio-SPK) Jet Fuel Flight and Engine Tests Program Results. 9th AIAA Aviation TEchnology, Integration and Operations Conference, Hilton Head, SC.
Rahmim, I. (2003). Gas-to-Liquid Technologies: Recent Advances, Economics, Prospects. 26th IAEE Annual International Conference. Prague.
Rakopoulos, D. C., C. D. Rakopoulos, D. T. Hountalas, E. C. Kakaras, E. G. Giakoumis and R. G. Papagiannakis (2010). "Investigation of the performance and emissions of bus engine operating on butanol/diesel fuel blends." Fuel 89(10): 2781-2790.
Rauch, R., J. Hrbek and H. Hofbauer (2014). "Biomass gasification for synthesis gas production and applications of the syngas." Wiley Interdisciplinary Reviews: Energy and Environment 3(4): 343-362.
REG Life Sciences. (2015). "About Us." Retrieved December 2, 2015, from http://www.reglifesciences.com/about-us/vision.
Renewable Energy Group Inc. (2015). "REG History." Retrieved Oct. 13, 2015, from http://www.regsyntheticfuels.com/about-reg/history.
Renewable Fuels Association. "E85 Prices." Retrieved December 4, 2015, from http://e85prices.com/. Renewable Fuels Association. (2015). "World Fuel Ethanol Production." Retrieved Oct. 9, 2015,
from http://www.ethanolrfa.org/resources/industry/statistics/. Research and Innovative Technology Administration and Bureau of Transportation Statustics. (2013).
"Airline Fuel Cost and Consumption." Retrieved April 2, 2013, from http://www.transtats.bts.gov/fuel.asp.
Richardson, J. W., J. L. Outlaw and M. Allison (2010). "The Economics of Microalgae Oil." The Journal of Agrobiotechnology Management and Economics 13(2): 119-130.
Ringer, M., V. Putsche and J. Scahill (2006). Large-Scale Pyrolysis Oil Production: A Technology November 2006 Assessment and Economic Analysis, National Renewable Energy Laboratory.
Rogers, J. G. and J. G. Brammer (2012). "Estimation of the production cost of fast pyrolysis bio-oil." Biomass & Bioenergy 36: 208-217.
Rolls-Royce "Alternative fuels." Roman-Leshkov, Y., C. J. Barrett, Z. Y. Liu and J. A. Dumesic (2007). "Production of dimethylfuran for
liquid fuels from biomass-derived carbohydrates." Nature 447(7147): 982-985. Rosillo-Calle, F., D. Thrän, M. Seiffert and S. Teelucksingh (2012). The Potential Role of Biofuels in
Commercial Air Transport-Biojet Fuel., IEA Bioenergy. Rude, M. A. and A. Schirmer (2009). "New microbial fuels: a biotech perspective." Current Opinion in
Microbiology 12(3): 274-281. Rutz, D. and R. Janssen (2007). Biofuel Technology Handbook. Munchen, Germany, WIP Renewable
Energies.
80 This report is available at no cost from the National Renewable Energy Laboratory (NREL) at www.nrel.gov/publications.
Rye, L., S. Blakey and C. W. Wilson (2010). "Sustainability of supply or the planet: a review of potential drop-in alternative aviation fuels." Energy & Environmental Science 3(1): 17-27.
SAFN (2011). Sustainable Aviation Fuels Northwest: Powering the Next Generation of Flight. Saib, A. M., D. J. Moodley, I. M. Ciobîcă, M. M. Hauman, B. H. Sigwebela, C. J. Weststrate, J. W.
Niemantsverdriet and J. van de Loosdrecht (2010). "Fundamental understanding of deactivation and regeneration of cobalt Fischer–Tropsch synthesis catalysts." Catalysis Today 154(3–4): 271-282.
San, K.-Y., M. Li and X. Zhang (2014). Bacteria and method for synthesizing fatty acids, William Marsh Rice University,.
SASOL. (2011). "GTL Technology Advancements." from http://www.sasol.com/sites/default/files/presentations/downloads/GTL_Technology_Advancements_WPC_SGodorr_Sasol_1323236922976.pdf.
Schenk, P., S. Thomas-Hall, E. Stephens, U. Marx, J. Mussgnug, C. Posten, O. Kruse and B. Hankamer (2008). "Second Generation Biofuels: High-Efficiency Microalgae for Biodiesel Production." BioEnergy Research 1(1): 20-43.
Schirmer, A., M. A. Rude, X. Li, E. Popova and S. B. del Cardayre (2010). "Microbial Biosynthesis of Alkanes." Science 329(5991): 559-562.
Services, U.-F. A. (2015). Oilseeds: World Markets and Trade USDA. Shell. (2013). "About Shell MDS." Retrieved June 18, 2013, from http://www.shell.com.my/products-
services/solutions-for-businesses/smds/about-smds.html. Shell News. (2012). "Pearl GTL - an overview." from http://www.shell.com/global/aboutshell/major-
projects-2/pearl/overview.html. Shonnard, D. R., L. Williams and T. N. Kalnes (2010). "Camelina-derived jet fuel and diesel: Sustainable
advanced biofuels." Environmental Progress & Sustainable Energy 29(3): 382-392. Sie, S. T. and R. Krishna (1999). "Fundamentals and selection of advanced Fischer–Tropsch reactors."
Applied Catalysis A: General 186(1–2): 55-70. Sigma-Aldrich (2008). Fatty Acid/FAME Application Guide. Sigma-Aldrich. Silva, R. V. S., G. A. Romeiro, M. C. C. Veloso, M. K. K. Figueiredo, P. A. Pinto, A. F. Ferreira, M. L.
A. Gonçalves, A. M. Teixeira and R. N. Damasceno (2012). "Fractions composition study of the pyrolysis oil obtained from sewage sludge treatment plant." Bioresource Technology 103(1): 459-465.
Skone, T. J. and K. Gerdes (2008). Development of Baseline Data and Analysis fo Life Cycle Greenhouse Gas Emissions of Petroleum-Based Fuels, National Energy Technology Laboratory,.
SkyNRG. (2015). "SkyNRG-Technology Section." from http://skynrg.com/technology-section/. SRI Consulting (2008). U.S. Producer Price Indexes – Chemicals and Allied Products/Industrial Inorganic
Chemicals Index. Chemical Economics Handbook. Stache, H. W., Ed. (1995). Anionic surfactants: organic chemistry. Surfactant Science Series. New York,
Marcel Dekker. Staples, M. D., R. Malina, H. Olcay, M. N. Pearlson, J. I. Hileman, A. Boies and S. R. H. Barrett (2014).
"Lifecycle greenhouse gas footprint and minimum selling price of renewable diesel and jet fuel from fermentation and advanced fermentation production technologies." Energy & Environmental Science 7(5): 1545-1554.
Steen, E. J., Y. Kang, G. Bokinsky, Z. Hu, A. Schirmer, A. McClure, S. B. del Cardayre and J. D. Keasling (2010). "Microbial production of fatty-acid-derived fuels and chemicals from plant biomass." Nature 463(7280): 559-562.
Steynberg, A. P., W. U. Nel and M. A. Desmet (2004). "Large scale production of high value hydrocarbons using Fischer-Tropsch technology." Natural Gas Conversion Vii 147: 37-42.
Stone, R. and J. Medvedeff (2012). Emerging Company Research, Cowen and Company. Stratton, R. W., H. M. Wong and J. I. Hileman (2010). Life Cycle Greenhouse Gas Emissions from
Alternative Jet Fuels, PARTNER (Partnership for Air Transportation Noise and Emissions Reduction).
81 This report is available at no cost from the National Renewable Energy Laboratory (NREL) at www.nrel.gov/publications.
Stuve, E. M. (2002) "Energy - What are the Technical, Economic, and Political Implications of Meeting our Basic Energy Needs?" http://faculty.washington.edu/stuve/fuelcelled/fresh_sem_0602.pdf .
Summers, H. M., R. N. Ledbetter, A. T. McCurdy, M. R. Morgan, L. C. Seefeldt, U. Jena, S. Kent Hoekman and J. C. Quinn (2015). "Techno-economic feasibility and life cycle assessment of dairy effluent to renewable diesel via hydrothermal liquefaction." Bioresource Technology 196: 431-440.
Synfuels International Inc. (2013). "Synfuels EEEJet Technology." Retrieved March 15, 2013, from http://www.synfuels.com/EEEJet.html.
Syntroleum. (2012). "Bio-Synfining - Dynamic Fuels Plant." Retrieved December 12, 2012, from http://www.b2i.cc/Document/2029/111043.pdf.
Syntroleum Corporation (2011). "Dynamic Fuels and Solazyme Partner to Supply Renewable Fuel to U.S. Navy." Retrieved Nov. 12, 2012, from http://investors.terravia.com/releasedetail.cfm?releaseid=630047.
Tait, B. (2006). Sasol's Activities on Synthetic Fuels. 2nd International BtL Congress. Berlin, Germany. Takahashi, K., G. Hata and A. Miyake (1973). "Dimerization of Isoprene by Palladium-Diphosphine
Complex Catalyst." Bulletin of the Chemical Society of Japan 46: 600-602. Tan, E., M. Talmadge, A. Dutta, J. Hensley, J. Schaidle, M. Biddy, D. Humbird, L. J. Snowden-Swan, J.
Ross, D. Sexton, R. Yap and J. Lukas (Mar. 2015). Process Design and Economics for the Conversion of Lignocellulosic Biomass to Hydrocarbons via Indirect Liquefaction. National Renewable Energy Laboratory, Golden, CO, USA.
Tao, L., A. Aden, E. C. D. Tan, M. Zhang, X. He, R. McCormick and B. T. Zigler (2012). "Techno-economic Analysis and Life-cycle Assessment of Cellulosic Iso-Butanol and Comparison with Cellulosic Ethanol and n-Butanol."
Tao, L., X. He, E. C. D. Tan, M. Zhang and A. Aden (2012). "Techno-economic Analysis of n-Butanol from Corn Grain and Corn Stover."
Tao, L., E. C. D. Tan, R. McCormick, M. Zhang, A. Aden, X. He and B. T. Zigler (2014). "Techno-economic analysis and life-cycle assessment of cellulosic isobutanol and comparison with cellulosic ethanol and n-butanol." Biofuels, Bioproducts and Biorefining 8(1): 30-48.
Tarud, J. and S. Phillips (2011). Technoeconomic Comparison of Biofuels: Ethanol, Methanol, and Gasoline from Gasification of Woody Residues. 2011 ACS National Meeting and Exposition. Denver, Colorado.
Taylor, C. E., J. P. Baltrus and D. Driscoll (2011). Fischer-Tropsch Fuels, National Energy Technology Laboratory, Golden, CO, USA.
Taylor, J. D., M. M. Jenni and M. W. Peters (2010). "Dehydration of Fermented Isobutanol for the Production of Renewable Chemicals and Fuels." Topics in Catalysis 53(15-18): 1224-1230.
Tegler, J. (2011). Seahawk Flies on Camelina-based Alternative Fuel, Defense Media Network. Terrabon. (2011). "Terrabon Inc. Applauds White House Investment of $510 Million for the
Development of Advanced Drop-In Biofuels," from http://www.businesswire.com/news/home/20110818005859/en/Terrabon-Applauds-White-House-Investment-510-Million.
Tijmensen, M. J. A., A. P. C. Faaij, C. N. Hamelinck and M. R. M. van Hardeveld (2002). "Exploration of the possibilities for production of Fischer Tropsch liquids and power via biomass gasification." Biomass and Bioenergy 23(2): 129-152.
Timmer, J. (2012). "Combined bacterial/metal catalysis turns sugars to jet fuel." Retrieved Mar. 4, 2013, from http://arstechnica.com/science/2012/11/combined-bacterialmetal-catalysis-turns-sugars-to-jet-fuel/.
Total. (2013). "Total and Amyris, Partners in Biotechnology." Retrieved December 2, 2015, from http://www.total.com/en/energies-expertise/renewable-energies/biomass/projects-and-achievements/total-and-amyris-partners-biotechnology.
Total and Amyris (2012). Breaking the Barriers with Breakthrough Jet Fuel Solutions. Berlin Airshow. Berlin.
82 This report is available at no cost from the National Renewable Energy Laboratory (NREL) at www.nrel.gov/publications.
Trinh, C. T., J. Li, H. W. Blanch and D. S. Clark (2011). "Redesigning Escherichia coli Metabolism for Anaerobic Production of Isobutanol." Applied and Environmental Microbiology, 77(14): 4894-4904.
U.S. Congress (2007). Energy Independence and Security Act. HR 6. 110th Congress, first session (Jan. 4, 2007).
U.S. Department of Agriculture. (2015). "Oil Crops Yearbook." Retrieved April 14, 2015, 2015, from http://usda.mannlib.cornell.edu/MannUsda/viewDocumentInfo.do?documentID=1290.
U.S. Department of Defense (2011). Detail Specification: Turbine Fuel, Aviation, Kerosene Type, JP-8 (NATO F-34), NATO F-35, and JP-8+100 (NATO F-37).
U.S. Department of Defense (2011). Opportunities For DOD Use Of Alternative And Renewable Fuels, U.S. Department of Defense.
U.S. Department of Energy (2014). Farm to Fly 2.0: Energy Department Joins Initiative to Bring Biofuels to the Skies.
U.S. Department of Energy (2015). Alternative Fuel Price Report, U.S. Department of Energy. U.S. Department of Energy and Office of Energy Efficiency & Renewable Energy (2012). Amyris
Integrated Biorefinery demonstrating the conversion of sweet sorgum biomass to hydrocarbon fuel and chemicals. U.S. Department of Energy.
U.S. Energy Information Administration (2013). U.S. Coal Reserves: Historical detailed coal production data (1983-2013) U.S. Energy Information Administration.
U.S. Department of Energy. U.S. Energy Information Administration. (2013). "What Fuels Are Made from Crude Oil?" Retrieved
December 13, 2013, from http://www.eia.gov/energyexplained/index.cfm?page=oil_refining. U.S. Energy Information Administration (2014). "Gas-to-liquids plants face challenges in the U.S.
market." U.S. Energy Information Administration. (2015). "Monthly Biodiesel Production Report " Retrieved
April 14, 2015, 2015, from http://www.eia.gov/biofuels/biodiesel/production/. U.S. Energy Information Administration (2015). U.S. Wholesale Propane/Resale Price. U.K. Ministry of Defence. (2013). "Defence Standard 91-91, Turbine Fuel, Aviation Kerosine Type, Jet
A-1." Retrieved March 20, 2013, from http://www.dstan.mod.uk/data/91/091/00000600.pdf. UNIBIO. (2011). "UniProtein." UOP LLC. (2010). "Green Jet Fuel." Retrieved Nov. 12, 2012, from http://www.uop.com/processing-
solutions/biofuels/green-jet-fuel/. USDA-NAVY-DOE (2011). Memorandum of Understanding between the U.S. Department of
Agriculture, the U.S. Navy, and the U.S. Department of Energy. USDA (2012). Agriculture and Aviation: Partners in Prosperity. USDA News Release. (2013). "Agriculture, Navy Secretaries Promote U.S. Military Energy
Independence with 'Farm-to-Fleet". Program blends homegrown biofuels with conventional fuels, propelling ships, jets and jobs." from http://www.usda.gov/wps/portal/usda/usdahome?contentid=2013/12/0237.xml.
Valdes, C. (2011). Barzil's Ethanol Industry: Looking Forward. A report from the Economic Research Service, United States Department of Agriculture.
Valkenburg, C. (2013). Upgrading of Biomass Fast Pyrolysis Oil (Bio–oil). 2013 Project Peer Review, U.S. Department of Energy, Bioenergy Technology Office. Alexandria, VA.
van Os, N. M. (1997). Nonionic Surfactants: Organic Chemistry, Taylor & Francis. Vasilakos, N. P. and M. T. Barreiros (1984). "Homogeneous catalytic hydrogenolysis of biomass."
Industrial & Engineering Chemistry Process Design and Development 23(4): 755-763. Vicari, K., S. Tallam, T. Shatova, K. Joo, C. Scarlata, D. Humbird, E. Wolfrum and G. Beckham (2012).
"Uncertainty in techno-economic estimates of cellulosic ethanol production due to experimental measurement uncertainty." Biotechnology for Biofuels 5(1): 23.
Viljoen, C. L. and M. Ajam (2012). Fully Synthetic Jet Fuel. U. S., SASOL Technology.
83 This report is available at no cost from the National Renewable Energy Laboratory (NREL) at www.nrel.gov/publications.
Virent. (2010). "Virent and Shell Start World’s First Biogasoline Production Plant." Retrieved March 6, 2013, from http://www.virent.com/news/virent-and-shell-start-world%E2%80%99s-first-biogasoline-production-plant/.
Virent (2012). Exceptional Jet Fuel Produced From High-Quality Cellulosic Sugars. Virent. (2012). "Shell Using Technology Licensed From Virent." Retrieved March 6, 2013,
from http://www.virent.com/news/shell-using-technology-licensed-from-virent/. Virent. (2015). "Bioforming." Retrieved Oct. 13, 2015,
from http://www.virent.com/technology/bioforming/. Voegele, E. (2012). "Terrabon files for bankruptcy," Biomass Magazine. Wang, H. and M. A. Oehlschlaeger (2012). "Autoignition studies of conventional and Fischer–Tropsch jet
fuels." Fuel 98(0): 249-258. Wang, W.-C., T. L. Turner, W. L. Roberts and L. F. Stikeleather (2012). "Direct injection of superheated
steam for continuous hydrolysis reaction." Chemical Engineering and Processing: Process Intensification 59(0): 52-59.
Weissermel, K. and H. J. Arpe (2008). Industrial Organic Chemistry. New York, NY, John Wiley & Sons.
Westbrook, C. K., C. V. Naik, O. Herbinet, W. J. Pitz, M. Mehl, S. M. Sarathy and H. J. Curran (2011). "Detailed chemical kinetic reaction mechanisms for soy and rapeseed biodiesel fuels." Combustion and Flame, 158(4): 742-755.
Whited, G. M., F. J. Feher, D. A. Benko, M. A. Cervin, G. K. Chotani, J. C. McAuliffe, R. J. LaDuca, E. A. Ben-Shoshan and K. J. Sanford (2010). "Technology update: Development of a gas-phase bioprocess for isoprene-monomer production using metabolic pathway engineering." Industrial Biotechnology 6(3): 152-163.
Whitman, T., S. Yanni and J. Whalen (2011). "Life cycle assessment of corn stover production for cellulosic ethanol in Quebec." Canadian Journal of Soil Science 91(6): 997-1012.
Whitworth, J. (2014). "Mango Materials moves on methane gas for bioplastics." Wienfield, M. E. (1949). "The Catalytic Dehydration of 2,3-Butanediol to Butandiene." Australian
Journal of Scientific Research 3: 290. Wire, B. (2006). Syntroleum's Ultra-Clean Jet Fuel to be Tested in Landmark B-52 Flight Demo Won, S. H., S. Dooley, F. L. Dryer and Y. Ju (2011). "Kinetic effects of aromatic molecular structures on
diffusion flame extinction." Proceedings of the Combustion Institute 33(1): 1163-1170. World, J. (2013). "Jatropha Biodiesel Making." World, R. E. (2010). Camelina Biofuel Powers U.S. Navy F/A-18 Test Flight. Wright, M. (2012). U.S. Patent 20120238788, Process for the Dehydration of Aqueous Bio-Derived
Terminal Alcohols oo Terminal Alkenes. U.S. Wright, M. E., B. G. Harvey and R. L. Quintana (2008). "Highly efficient zirconium-catalyzed batch
conversion of 1-butene: A new route to jet fuels." Energy & Fuels 22(5): 3299-3302. Wright, M. E., B. G. Harvey and R. L. Quintana (2008). Highly efficient zirconium-catalyzed batch
conversion of 1-butene: A new route to jet fuels. Energy & Fuels. 22: 3299-3302. Wright, M. M., J. A. Satrio, R. C. Brown, D. E. Daugaard and D. D. Hsu (2010). Techno-Economic
Analysis of Biomass Fast Pyrolysis to Transportation Fuels, National Renewable Energy Laboratory, Golden, CO, USA.
Wyman, C. (1996). Handbook on Bioethanol: Production and Utilization. Washington, D.C., Taylor and Francis.
Wyman, C. E., R. L. Bain, N. D. Hinman and D. J. Stevens (1993). Chapter 21. Ethanol and Methanol from Cellulosic Materials. Renewable Energy: Sources for Fuels and Electricity. T. B. Johansson, et al., ed. Washington, D.C., Island Press.
Xie, X., M. Wang and J. Han (2011). "Assessment of Fuel-Cycle Energy Use and Greenhouse Gas Emissions for Fischer−Tropsch Diesel from Coal and Cellulosic Biomass." Environmental Science & Technology 45(7): 3047-3053.
84 This report is available at no cost from the National Renewable Energy Laboratory (NREL) at www.nrel.gov/publications.
Xiu, Z.-L. and A.-P. Zeng (2008). "Present state and perspective of downstream processing of biologically produced 1,3-propanediol and 2,3-butanediol." Applied Microbiology and Biotechnology 78(6): 917-926.
Xu, P., Q. Gu, W. Wang, L. Wong, A. G. W. Bower, C. H. Collins and M. A. G. Koffas (2013). "Modular optimization of multi-gene pathways for fatty acids production in E. coli." Nat Commun 4: 1409.
Yan, Z., D. B. Bukur and D. W. Goodman (2011). "Silica-supported rhodium-cobalt catalysts for Fischer–Tropsch synthesis." Catalysis Today 160(1): 39-43.
Yang, F., M. A. Hanna and R. Sun (2012). "Value-added uses for crude glycerol--a byproduct of biodiesel production." Biotechnology for Biofuels 5(13): 1-10.
Yang, J., M. Xian, S. Su, G. Zhao, Q. Nie, X. Jiang, Y. Zheng and W. Liu (2012). "Enhancing Production of Bio-Isoprene Using Hybrid MVA Pathway and Isoprene Synthase in E. coli." PLoS ONE 7(4): e33509.
Yanowitz, J., E. Christensen and R. L. McCormick (2011). Utilization of Renewable Oxygenates as Gasoline Blending Components
Yee, A. (2014). Airlines Fliy the Skies on a Sugar High. The New York Times. New York , NY. You, F. and B. Wang (2011). "Life Cycle Optimization of Biomass-to-Liquid Supply Chains with
Distributed–Centralized Processing Networks." Industrial & Engineering Chemistry Research 50(17): 10102-10127.
Yusuf, N., S. K. Kamarudin and Z. Yaakub (2011). "Overview on the current trends in biodiesel production." Energy Conversion and Management 52(7): 2741-2751.
Zacher, A. and D. Elliott (2011). Bio-Oil Upgrading and Stabilization. Kansas State University Bioenergy Symposium. Manhattan, KS.
Zeng, A. P., H. Biebl and W. D. Deckwer (1991). "Production of 2,3-butanediol in a membrane bioreactor with cell recycle." Applied Microbiology and Biotechnology 34(4): 463-468.
Zhan, N., Y. Hu, H. Li, D. Yu, Y. Han, and H. Huang (2010). "Lanthanum–phosphorous modified HZSM-5 catalysts in dehydration of ethanol to ethylene: A comparative analysis." Catalysis Communications 11(7): 633-637.
Zhang, F., M. Ouellet, T. S. Batth, P. D. Adams, C. J. Petzold, A. Mukhopadhyay and J. D. Keasling (2012). "Enhancing fatty acid production by the expression of the regulatory transcription factor FadR." Metabolic Engineering 14(6): 653-660.
Zhang, L., Y. Yang, J. a. Sun, Y. Shen, D. Wei, J. Zhu and J. Chu (2010). "Microbial production of 2,3-butanediol by a mutagenized strain of Serratia marcescens H30." Bioresource Technology 101(6): 1961-1967.
Zhang, Y., M. A. Dube, D. D. McLean and M. Kates (2003). "Biodiesel production from waste cooking oil: 2. Economic assessment and sensitivity analysis." Bioresource Technology 90(3): 229-240.
Zheng, Y. N., L. Z. Li, M. Xian, Y. J. Ma, J. M. Yang, X. Xu and D. Z. He (2009). "Problems with the microbial production of butanol." Journal of Industrial Microbiology & Biotechnology 36(9): 1127-1138.
Zhu, Y. and S. B. Jones (2009). Techno-economic Analysis for the Thermochemical Conversion of Lignocellulosic Biomass to Ethanol via Acetic Acid Synthesis, Pacific Northwest National Laboratory. Richland, WA, USA.
Zhu, Y., S. B. Jones, D. B. Anderson, R. T. Hallen, A. J. Schmidt, K. O. Albrecht and D. C. Elliott. (2015). Techno-Economic Analysis of Whole Algae Hydrothermal Liquefaction (HTL) and Upgrading System. Pacific Northwest National Laboratory. Richland, WA, USA.

85 This report is available at no cost from the National Renewable Energy Laboratory (NREL) at www.nrel.gov/publications.
Appendix A Detailed Literature Review for Table 14 and Table 15 Tables A1-A12 provides a literature review of the different pathways to jet fuel. Yields, plant scales, and the Minimum Jet Selling Price (MJSP) are given. Footnotes at the end of each table provide more information on the conversions and assumptions.
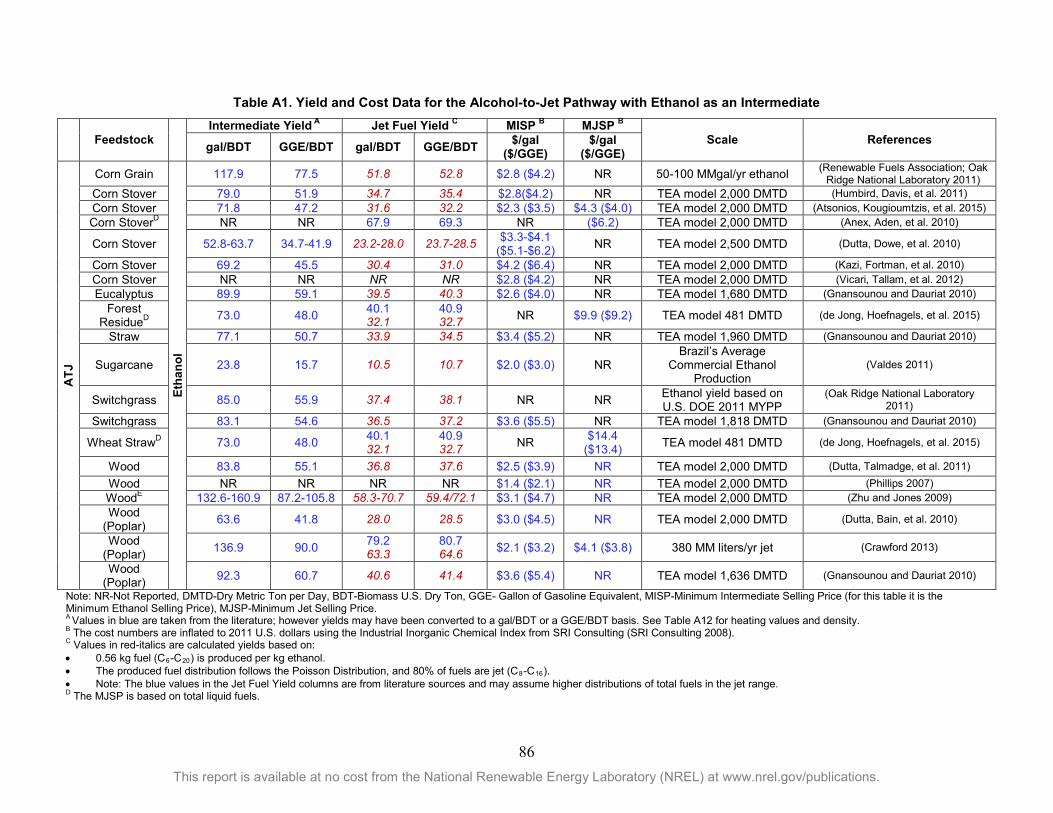
86 This report is available at no cost from the National Renewable Energy Laboratory (NREL) at www.nrel.gov/publications.
Table A1. Yield and Cost Data for the Alcohol-to-Jet Pathway with Ethanol as an Intermediate
Feedstock
Intermediate Yield A Jet Fuel Yield C MISP B MJSP B
Scale References gal/BDT GGE/BDT gal/BDT GGE/BDT $/gal ($/GGE)
$/gal ($/GGE)
ATJ
Corn Grain Et
hano
l 117.9 77.5 51.8 52.8 $2.8 ($4.2) NR 50-100 MMgal/yr ethanol (Renewable Fuels Association; Oak
Ridge National Laboratory 2011) Corn Stover 79.0 51.9 34.7 35.4 $2.8($4.2) NR TEA model 2,000 DMTD (Humbird, Davis, et al. 2011) Corn Stover 71.8 47.2 31.6 32.2 $2.3 ($3.5) $4.3 ($4.0) TEA model 2,000 DMTD (Atsonios, Kougioumtzis, et al. 2015) Corn StoverD NR NR 67.9 69.3 NR ($6.2) TEA model 2,000 DMTD (Anex, Aden, et al. 2010)
Corn Stover 52.8-63.7 34.7-41.9 23.2-28.0 23.7-28.5 $3.3-$4.1 ($5.1-$6.2) NR TEA model 2,500 DMTD (Dutta, Dowe, et al. 2010)
Corn Stover 69.2 45.5 30.4 31.0 $4.2 ($6.4) NR TEA model 2,000 DMTD (Kazi, Fortman, et al. 2010) Corn Stover NR NR NR NR $2.8 ($4.2) NR TEA model 2,000 DMTD (Vicari, Tallam, et al. 2012) Eucalyptus 89.9 59.1 39.5 40.3 $2.6 ($4.0) NR TEA model 1,680 DMTD (Gnansounou and Dauriat 2010)
Forest ResidueD 73.0 48.0 40.1
32.1 40.9 32.7 NR $9.9 ($9.2) TEA model 481 DMTD (de Jong, Hoefnagels, et al. 2015)
Straw 77.1 50.7 33.9 34.5 $3.4 ($5.2) NR TEA model 1,960 DMTD (Gnansounou and Dauriat 2010)
Sugarcane 23.8 15.7 10.5 10.7 $2.0 ($3.0) NR Brazil’s Average
Commercial Ethanol Production
(Valdes 2011)
Switchgrass 85.0 55.9 37.4 38.1 NR NR Ethanol yield based on U.S. DOE 2011 MYPP
(Oak Ridge National Laboratory 2011)
Switchgrass 83.1 54.6 36.5 37.2 $3.6 ($5.5) NR TEA model 1,818 DMTD (Gnansounou and Dauriat 2010)
Wheat StrawD 73.0 48.0 40.1 32.1
40.9 32.7 NR $14.4
($13.4) TEA model 481 DMTD (de Jong, Hoefnagels, et al. 2015)
Wood 83.8 55.1 36.8 37.6 $2.5 ($3.9) NR TEA model 2,000 DMTD (Dutta, Talmadge, et al. 2011) Wood NR NR NR NR $1.4 ($2.1) NR TEA model 2,000 DMTD (Phillips 2007) WoodE 132.6-160.9 87.2-105.8 58.3-70.7 59.4/72.1 $3.1 ($4.7) NR TEA model 2,000 DMTD (Zhu and Jones 2009) Wood
(Poplar) 63.6 41.8 28.0 28.5 $3.0 ($4.5) NR TEA model 2,000 DMTD (Dutta, Bain, et al. 2010)
Wood (Poplar) 136.9 90.0 79.2
63.3 80.7 64.6 $2.1 ($3.2) $4.1 ($3.8) 380 MM liters/yr jet (Crawford 2013)
Wood (Poplar) 92.3 60.7 40.6 41.4 $3.6 ($5.4) NR TEA model 1,636 DMTD (Gnansounou and Dauriat 2010)
Note: NR-Not Reported, DMTD-Dry Metric Ton per Day, BDT-Biomass U.S. Dry Ton, GGE- Gallon of Gasoline Equivalent, MISP-Minimum Intermediate Selling Price (for this table it is the Minimum Ethanol Selling Price), MJSP-Minimum Jet Selling Price. A Values in blue are taken from the literature; however yields may have been converted to a gal/BDT or a GGE/BDT basis. See Table A12 for heating values and density. B The cost numbers are inflated to 2011 U.S. dollars using the Industrial Inorganic Chemical Index from SRI Consulting (SRI Consulting 2008). C Values in red-italics are calculated yields based on: • 0.56 kg fuel (C6-C20) is produced per kg ethanol. • The produced fuel distribution follows the Poisson Distribution, and 80% of fuels are jet (C8-C16). • Note: The blue values in the Jet Fuel Yield columns are from literature sources and may assume higher distributions of total fuels in the jet range. D The MJSP is based on total liquid fuels.
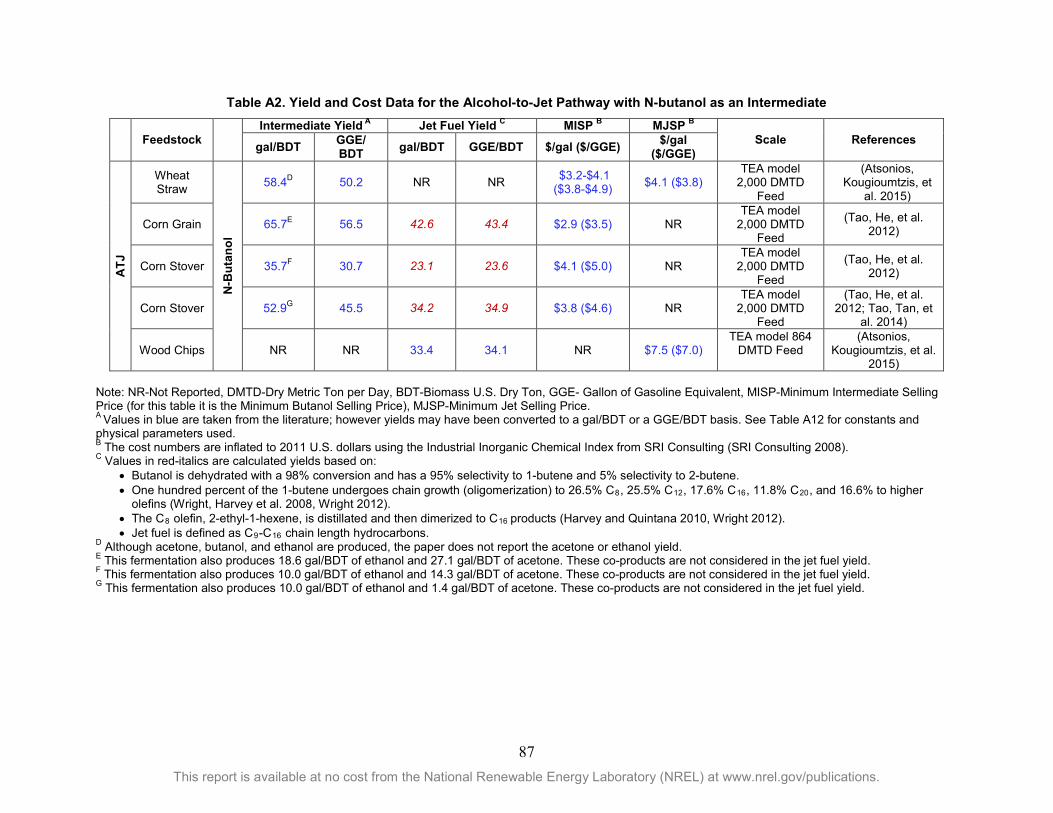
87 This report is available at no cost from the National Renewable Energy Laboratory (NREL) at www.nrel.gov/publications.
Table A2. Yield and Cost Data for the Alcohol-to-Jet Pathway with N-butanol as an Intermediate
Feedstock
Intermediate Yield A Jet Fuel Yield C MISP B MJSP B
Scale References gal/BDT GGE/ BDT gal/BDT GGE/BDT $/gal ($/GGE) $/gal
($/GGE)
ATJ
Wheat Straw
N-B
utan
ol
58.4D 50.2 NR NR $3.2-$4.1 ($3.8-$4.9) $4.1 ($3.8)
TEA model 2,000 DMTD
Feed
(Atsonios, Kougioumtzis, et
al. 2015)
Corn Grain 65.7E 56.5 42.6 43.4 $2.9 ($3.5) NR TEA model
2,000 DMTD Feed
(Tao, He, et al. 2012)
Corn Stover 35.7F 30.7 23.1 23.6 $4.1 ($5.0) NR TEA model
2,000 DMTD Feed
(Tao, He, et al. 2012)
Corn Stover 52.9G 45.5 34.2 34.9 $3.8 ($4.6) NR TEA model
2,000 DMTD Feed
(Tao, He, et al. 2012; Tao, Tan, et
al. 2014)
Wood Chips NR NR 33.4 34.1 NR $7.5 ($7.0) TEA model 864
DMTD Feed (Atsonios,
Kougioumtzis, et al. 2015)
Note: NR-Not Reported, DMTD-Dry Metric Ton per Day, BDT-Biomass U.S. Dry Ton, GGE- Gallon of Gasoline Equivalent, MISP-Minimum Intermediate Selling Price (for this table it is the Minimum Butanol Selling Price), MJSP-Minimum Jet Selling Price. A Values in blue are taken from the literature; however yields may have been converted to a gal/BDT or a GGE/BDT basis. See Table A12 for constants and physical parameters used. B The cost numbers are inflated to 2011 U.S. dollars using the Industrial Inorganic Chemical Index from SRI Consulting (SRI Consulting 2008). C Values in red-italics are calculated yields based on:
• Butanol is dehydrated with a 98% conversion and has a 95% selectivity to 1-butene and 5% selectivity to 2-butene. • One hundred percent of the 1-butene undergoes chain growth (oligomerization) to 26.5% C8, 25.5% C12, 17.6% C16, 11.8% C20, and 16.6% to higher
olefins (Wright, Harvey et al. 2008, Wright 2012). • The C8 olefin, 2-ethyl-1-hexene, is distillated and then dimerized to C16 products (Harvey and Quintana 2010, Wright 2012). • Jet fuel is defined as C9-C16 chain length hydrocarbons.
D Although acetone, butanol, and ethanol are produced, the paper does not report the acetone or ethanol yield. E This fermentation also produces 18.6 gal/BDT of ethanol and 27.1 gal/BDT of acetone. These co-products are not considered in the jet fuel yield. F This fermentation also produces 10.0 gal/BDT of ethanol and 14.3 gal/BDT of acetone. These co-products are not considered in the jet fuel yield. G This fermentation also produces 10.0 gal/BDT of ethanol and 1.4 gal/BDT of acetone. These co-products are not considered in the jet fuel yield.
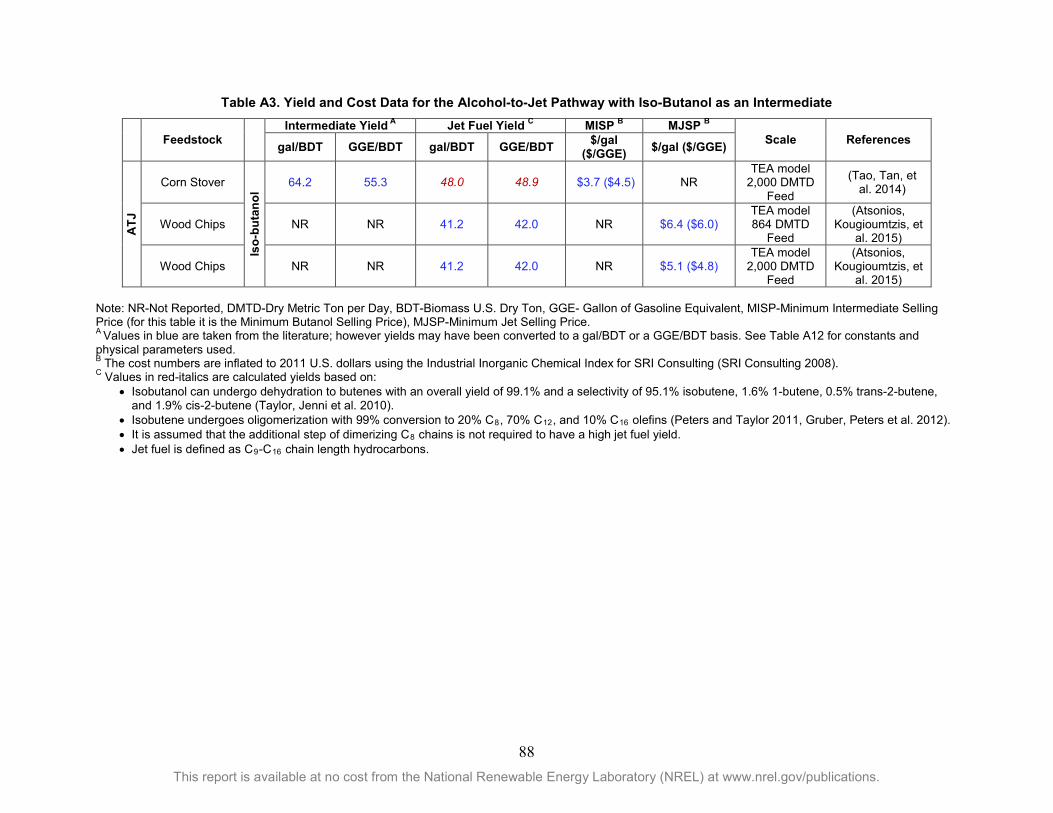
88 This report is available at no cost from the National Renewable Energy Laboratory (NREL) at www.nrel.gov/publications.
Table A3. Yield and Cost Data for the Alcohol-to-Jet Pathway with Iso-Butanol as an Intermediate
Feedstock
Intermediate Yield A Jet Fuel Yield C MISP B MJSP B
Scale References gal/BDT GGE/BDT gal/BDT GGE/BDT $/gal ($/GGE) $/gal ($/GGE)
ATJ
Corn Stover
Iso-
buta
nol
64.2 55.3 48.0 48.9 $3.7 ($4.5) NR TEA model
2,000 DMTD Feed
(Tao, Tan, et al. 2014)
Wood Chips NR NR 41.2 42.0 NR $6.4 ($6.0) TEA model 864 DMTD
Feed
(Atsonios, Kougioumtzis, et
al. 2015)
Wood Chips NR NR 41.2 42.0 NR $5.1 ($4.8) TEA model
2,000 DMTD Feed
(Atsonios, Kougioumtzis, et
al. 2015) Note: NR-Not Reported, DMTD-Dry Metric Ton per Day, BDT-Biomass U.S. Dry Ton, GGE- Gallon of Gasoline Equivalent, MISP-Minimum Intermediate Selling Price (for this table it is the Minimum Butanol Selling Price), MJSP-Minimum Jet Selling Price. A Values in blue are taken from the literature; however yields may have been converted to a gal/BDT or a GGE/BDT basis. See Table A12 for constants and physical parameters used. B The cost numbers are inflated to 2011 U.S. dollars using the Industrial Inorganic Chemical Index for SRI Consulting (SRI Consulting 2008). C Values in red-italics are calculated yields based on:
• Isobutanol can undergo dehydration to butenes with an overall yield of 99.1% and a selectivity of 95.1% isobutene, 1.6% 1-butene, 0.5% trans-2-butene, and 1.9% cis-2-butene (Taylor, Jenni et al. 2010).
• Isobutene undergoes oligomerization with 99% conversion to 20% C8, 70% C12, and 10% C16 olefins (Peters and Taylor 2011, Gruber, Peters et al. 2012). • It is assumed that the additional step of dimerizing C8 chains is not required to have a high jet fuel yield. • Jet fuel is defined as C9-C16 chain length hydrocarbons.
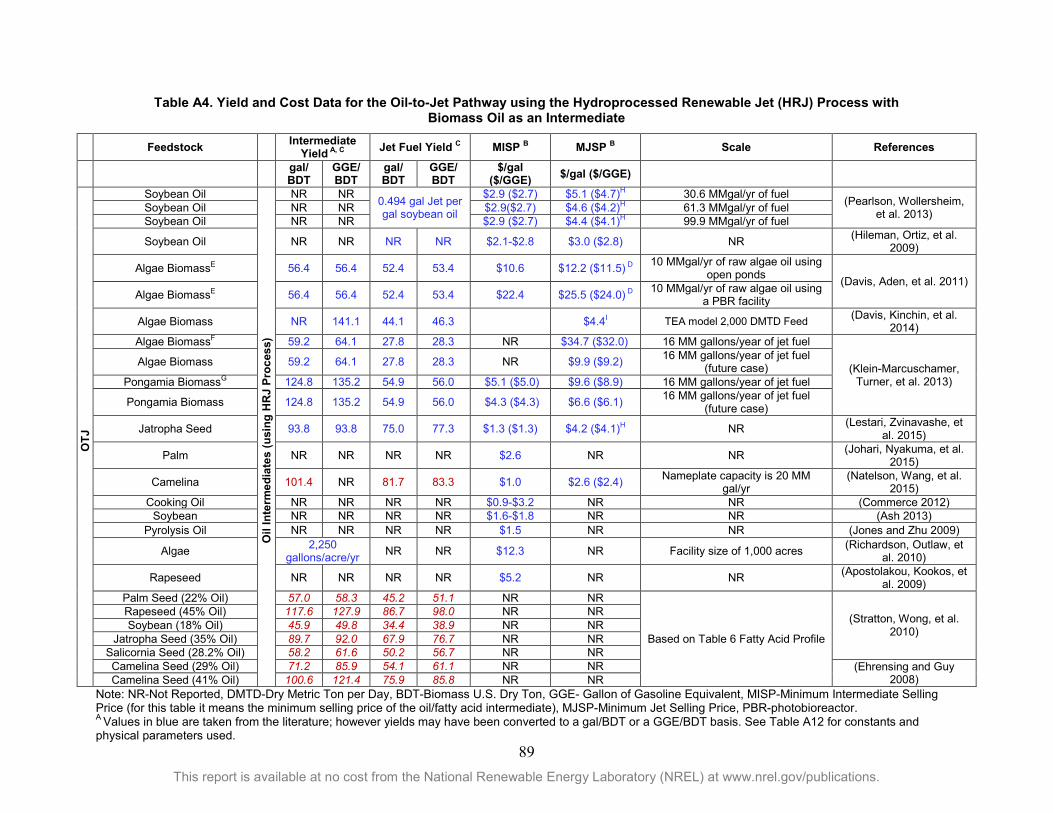
89 This report is available at no cost from the National Renewable Energy Laboratory (NREL) at www.nrel.gov/publications.
Table A4. Yield and Cost Data for the Oil-to-Jet Pathway using the Hydroprocessed Renewable Jet (HRJ) Process with Biomass Oil as an Intermediate
Feedstock
Intermediate Yield A, C Jet Fuel Yield C MISP B MJSP B Scale References
gal/ BDT
GGE/BDT
gal/ BDT
GGE/ BDT
$/gal ($/GGE) $/gal ($/GGE)
OTJ
Soybean Oil
Oil
Inte
rmed
iate
s (u
sing
HR
J Pr
oces
s)
NR NR 0.494 gal Jet per gal soybean oil
$2.9 ($2.7) $5.1 ($4.7)H 30.6 MMgal/yr of fuel (Pearlson, Wollersheim, et al. 2013) Soybean Oil NR NR $2.9($2.7) $4.6 ($4.2)H 61.3 MMgal/yr of fuel
Soybean Oil NR NR $2.9 ($2.7) $4.4 ($4.1)H 99.9 MMgal/yr of fuel
Soybean Oil NR NR NR NR $2.1-$2.8 $3.0 ($2.8) NR (Hileman, Ortiz, et al. 2009)
Algae BiomassE 56.4 56.4 52.4 53.4 $10.6 $12.2 ($11.5) D 10 MMgal/yr of raw algae oil using open ponds (Davis, Aden, et al. 2011)
Algae BiomassE 56.4 56.4 52.4 53.4 $22.4 $25.5 ($24.0) D 10 MMgal/yr of raw algae oil using a PBR facility
Algae Biomass NR 141.1 44.1 46.3 $4.4I TEA model 2,000 DMTD Feed (Davis, Kinchin, et al. 2014)
Algae BiomassF 59.2 64.1 27.8 28.3 NR $34.7 ($32.0) 16 MM gallons/year of jet fuel
(Klein-Marcuschamer, Turner, et al. 2013)
Algae Biomass 59.2 64.1 27.8 28.3 NR $9.9 ($9.2) 16 MM gallons/year of jet fuel (future case)
Pongamia BiomassG 124.8 135.2 54.9 56.0 $5.1 ($5.0) $9.6 ($8.9) 16 MM gallons/year of jet fuel
Pongamia Biomass 124.8 135.2 54.9 56.0 $4.3 ($4.3) $6.6 ($6.1) 16 MM gallons/year of jet fuel (future case)
Jatropha Seed 93.8 93.8 75.0 77.3 $1.3 ($1.3) $4.2 ($4.1)H NR (Lestari, Zvinavashe, et al. 2015)
Palm NR NR NR NR $2.6 NR NR (Johari, Nyakuma, et al. 2015)
Camelina 101.4 NR 81.7 83.3 $1.0 $2.6 ($2.4) Nameplate capacity is 20 MM gal/yr
(Natelson, Wang, et al. 2015)
Cooking Oil NR NR NR NR $0.9-$3.2 NR NR (Commerce 2012) Soybean NR NR NR NR $1.6-$1.8 NR NR (Ash 2013)
Pyrolysis Oil NR NR NR NR $1.5 NR NR (Jones and Zhu 2009)
Algae 2,250 gallons/acre/yr NR NR $12.3 NR Facility size of 1,000 acres (Richardson, Outlaw, et
al. 2010)
Rapeseed NR NR NR NR $5.2 NR NR (Apostolakou, Kookos, et al. 2009)
Palm Seed (22% Oil) 57.0 58.3 45.2 51.1 NR NR
Based on Table 6 Fatty Acid Profile
(Stratton, Wong, et al. 2010)
Rapeseed (45% Oil) 117.6 127.9 86.7 98.0 NR NR Soybean (18% Oil) 45.9 49.8 34.4 38.9 NR NR
Jatropha Seed (35% Oil) 89.7 92.0 67.9 76.7 NR NR Salicornia Seed (28.2% Oil) 58.2 61.6 50.2 56.7 NR NR Camelina Seed (29% Oil) 71.2 85.9 54.1 61.1 NR NR (Ehrensing and Guy
2008) Camelina Seed (41% Oil) 100.6 121.4 75.9 85.8 NR NR Note: NR-Not Reported, DMTD-Dry Metric Ton per Day, BDT-Biomass U.S. Dry Ton, GGE- Gallon of Gasoline Equivalent, MISP-Minimum Intermediate Selling Price (for this table it means the minimum selling price of the oil/fatty acid intermediate), MJSP-Minimum Jet Selling Price, PBR-photobioreactor. A Values in blue are taken from the literature; however yields may have been converted to a gal/BDT or a GGE/BDT basis. See Table A12 for constants and physical parameters used.
90 This report is available at no cost from the National Renewable Energy Laboratory (NREL) at www.nrel.gov/publications.
B The cost numbers are inflated to 2011 U.S. dollars using the Industrial Inorganic Chemical Index from SRI Consulting (SRI Consulting 2008). C Values in red-italics are calculated yields based on:
• Using the oil content of the biomass the oil yield is determined by assuming 95% after crushing, solvent extraction, and degumming. • The triglycerides are converted to the fatty acids and the fatty acid profiles for the biomass (Table 6) are used to determine fuel distribution. • Fatty acids with chain length greater than C17 are isomerized and hydrocracked to 1 wt% LPG (C3-C5), 19.1 wt% naphtha/gasoline (C6-C8), 68.4 wt% jet
(C9-C15), and 11.5 wt% diesel (C16) (Abhari R 2011); Jet is defined as C9-C16 fuel; Glycerol is not part of the final fuel yield. D Although this source assumes diesel as the end product, this table shows it as jet because jet and diesel can have hydrocarbons with overlapping carbon chain lengths. E Yield calculated from 10 MM gal/year oil produced from a 4,820 acre facility with 25 g/m2/day dry algae production running for 330 day/year. F Yield calculated from 0.47 kg of jet fuel/kg algae oil and 20wt% oil in dry algae biomass (Klein-Marcuschamer, Turner, et al. 2013). G Yield calculated from 41.98 metric tons/hr seeds for 11 months of a year and production of 12.0 metric tons/hr oil. Total jet produced is 16.1 MM gallons jet/year (Klein-Marcuschamer, Turner et al. 2013). H MJSP includes the diesel blend and jet blend (Pearlson, Wollersheim, et al. 2013). I MJSP is for all fuels including renewable diesel blend and ethanol on a gasoline-equivalent basis.
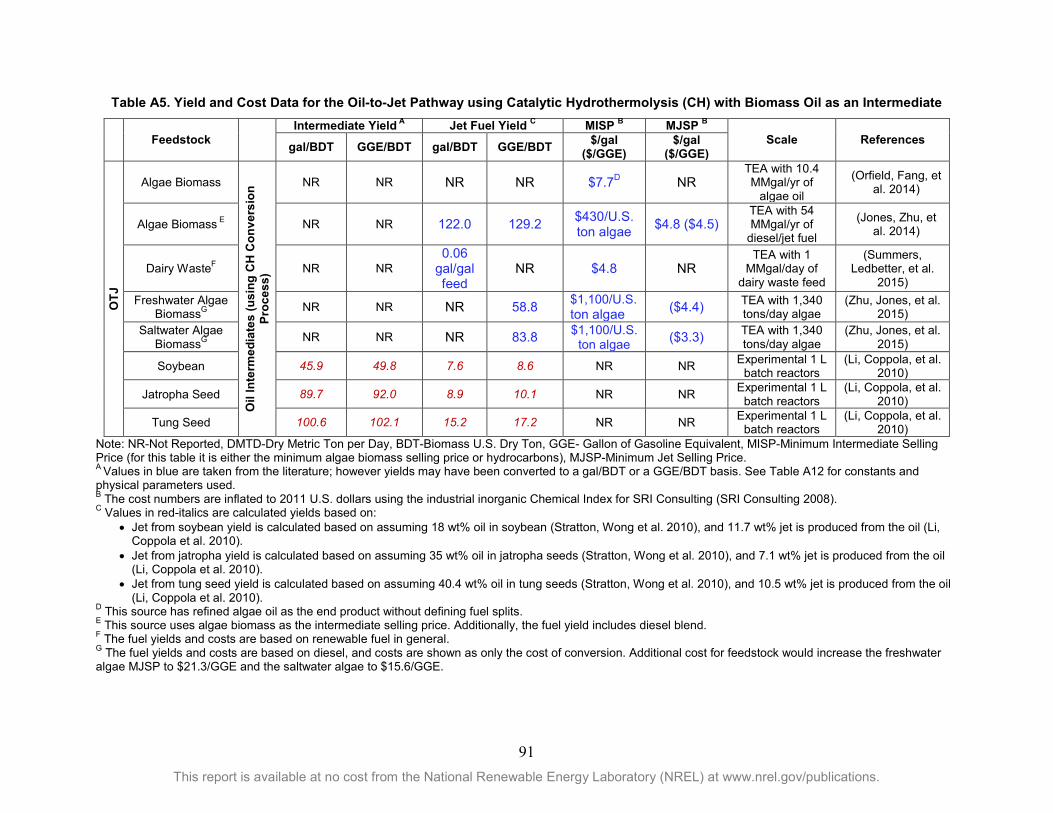
91 This report is available at no cost from the National Renewable Energy Laboratory (NREL) at www.nrel.gov/publications.
Table A5. Yield and Cost Data for the Oil-to-Jet Pathway using Catalytic Hydrothermolysis (CH) with Biomass Oil as an Intermediate Feedstock
Intermediate Yield A Jet Fuel Yield C MISP B MJSP B
Scale References gal/BDT GGE/BDT gal/BDT GGE/BDT $/gal ($/GGE)
$/gal ($/GGE)
OTJ
Algae Biomass
Oil
Inte
rmed
iate
s (u
sing
CH
Con
vers
ion
Proc
ess)
NR NR NR NR $7.7D NR TEA with 10.4 MMgal/yr of
algae oil
(Orfield, Fang, et al. 2014)
Algae Biomass E NR NR 122.0 129.2 $430/U.S. ton algae $4.8 ($4.5)
TEA with 54 MMgal/yr of
diesel/jet fuel
(Jones, Zhu, et al. 2014)
Dairy WasteF NR NR 0.06
gal/gal feed
NR $4.8 NR TEA with 1
MMgal/day of dairy waste feed
(Summers, Ledbetter, et al.
2015) Freshwater Algae
BiomassG NR NR NR 58.8 $1,100/U.S. ton algae ($4.4) TEA with 1,340
tons/day algae (Zhu, Jones, et al.
2015) Saltwater Algae
BiomassG NR NR NR 83.8 $1,100/U.S. ton algae ($3.3) TEA with 1,340
tons/day algae (Zhu, Jones, et al.
2015)
Soybean 45.9 49.8 7.6 8.6 NR NR Experimental 1 L batch reactors
(Li, Coppola, et al. 2010)
Jatropha Seed 89.7 92.0 8.9 10.1 NR NR Experimental 1 L batch reactors
(Li, Coppola, et al. 2010)
Tung Seed 100.6 102.1 15.2 17.2 NR NR Experimental 1 L batch reactors
(Li, Coppola, et al. 2010)
Note: NR-Not Reported, DMTD-Dry Metric Ton per Day, BDT-Biomass U.S. Dry Ton, GGE- Gallon of Gasoline Equivalent, MISP-Minimum Intermediate Selling Price (for this table it is either the minimum algae biomass selling price or hydrocarbons), MJSP-Minimum Jet Selling Price. A Values in blue are taken from the literature; however yields may have been converted to a gal/BDT or a GGE/BDT basis. See Table A12 for constants and physical parameters used. B The cost numbers are inflated to 2011 U.S. dollars using the industrial inorganic Chemical Index for SRI Consulting (SRI Consulting 2008). C Values in red-italics are calculated yields based on:
• Jet from soybean yield is calculated based on assuming 18 wt% oil in soybean (Stratton, Wong et al. 2010), and 11.7 wt% jet is produced from the oil (Li, Coppola et al. 2010).
• Jet from jatropha yield is calculated based on assuming 35 wt% oil in jatropha seeds (Stratton, Wong et al. 2010), and 7.1 wt% jet is produced from the oil (Li, Coppola et al. 2010).
• Jet from tung seed yield is calculated based on assuming 40.4 wt% oil in tung seeds (Stratton, Wong et al. 2010), and 10.5 wt% jet is produced from the oil (Li, Coppola et al. 2010).
D This source has refined algae oil as the end product without defining fuel splits. E This source uses algae biomass as the intermediate selling price. Additionally, the fuel yield includes diesel blend. F The fuel yields and costs are based on renewable fuel in general. G The fuel yields and costs are based on diesel, and costs are shown as only the cost of conversion. Additional cost for feedstock would increase the freshwater algae MJSP to $21.3/GGE and the saltwater algae to $15.6/GGE.
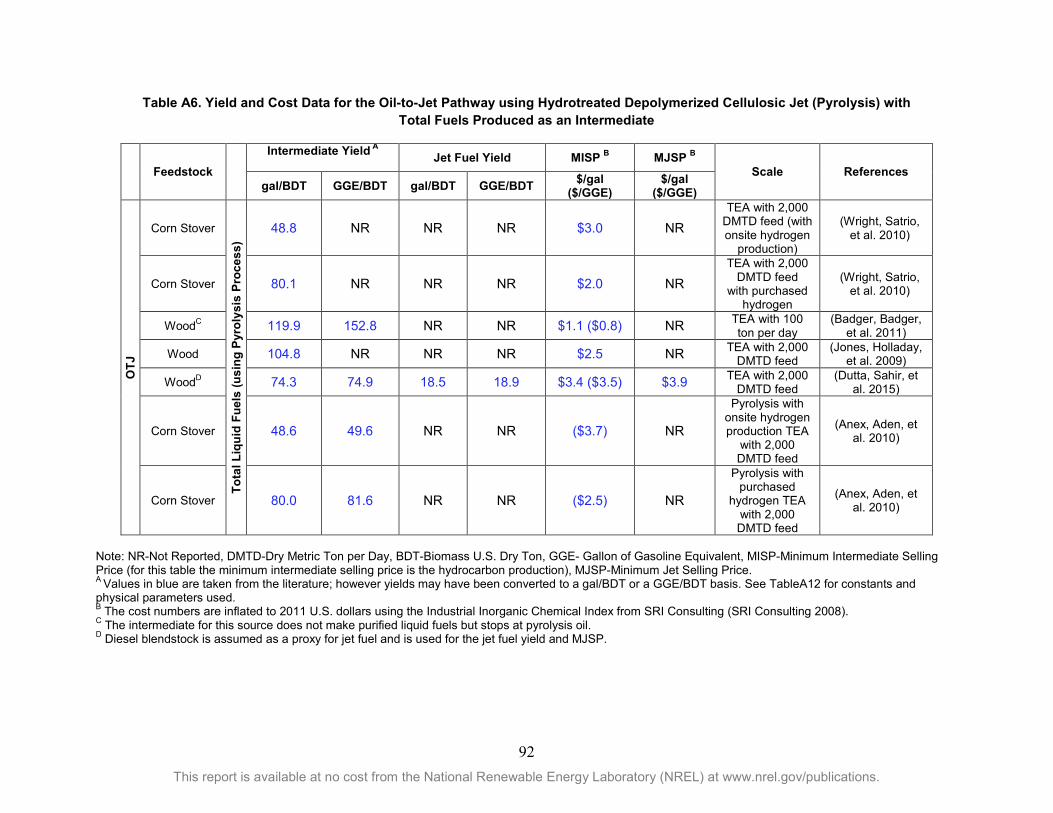
92 This report is available at no cost from the National Renewable Energy Laboratory (NREL) at www.nrel.gov/publications.
Table A6. Yield and Cost Data for the Oil-to-Jet Pathway using Hydrotreated Depolymerized Cellulosic Jet (Pyrolysis) with Total Fuels Produced as an Intermediate
Feedstock
Intermediate Yield A
Jet Fuel Yield MISP B MJSP B
Scale References gal/BDT GGE/BDT gal/BDT GGE/BDT $/gal
($/GGE) $/gal
($/GGE)
OTJ
Corn Stover To
tal L
iqui
d Fu
els
(usi
ng P
yrol
ysis
Pro
cess
) 48.8 NR NR NR $3.0 NR
TEA with 2,000 DMTD feed (with onsite hydrogen
production)
(Wright, Satrio, et al. 2010)
Corn Stover 80.1 NR NR NR $2.0 NR TEA with 2,000
DMTD feed with purchased
hydrogen
(Wright, Satrio, et al. 2010)
WoodC 119.9 152.8 NR NR $1.1 ($0.8) NR TEA with 100 ton per day
(Badger, Badger, et al. 2011)
Wood 104.8 NR NR NR $2.5 NR TEA with 2,000 DMTD feed
(Jones, Holladay, et al. 2009)
WoodD 74.3 74.9 18.5 18.9 $3.4 ($3.5) $3.9 TEA with 2,000 DMTD feed
(Dutta, Sahir, et al. 2015)
Corn Stover 48.6 49.6 NR NR ($3.7) NR
Pyrolysis with onsite hydrogen production TEA
with 2,000 DMTD feed
(Anex, Aden, et al. 2010)
Corn Stover 80.0 81.6 NR NR ($2.5) NR
Pyrolysis with purchased
hydrogen TEA with 2,000 DMTD feed
(Anex, Aden, et al. 2010)
Note: NR-Not Reported, DMTD-Dry Metric Ton per Day, BDT-Biomass U.S. Dry Ton, GGE- Gallon of Gasoline Equivalent, MISP-Minimum Intermediate Selling Price (for this table the minimum intermediate selling price is the hydrocarbon production), MJSP-Minimum Jet Selling Price. A Values in blue are taken from the literature; however yields may have been converted to a gal/BDT or a GGE/BDT basis. See TableA12 for constants and physical parameters used. B The cost numbers are inflated to 2011 U.S. dollars using the Industrial Inorganic Chemical Index from SRI Consulting (SRI Consulting 2008). C The intermediate for this source does not make purified liquid fuels but stops at pyrolysis oil. D Diesel blendstock is assumed as a proxy for jet fuel and is used for the jet fuel yield and MJSP.
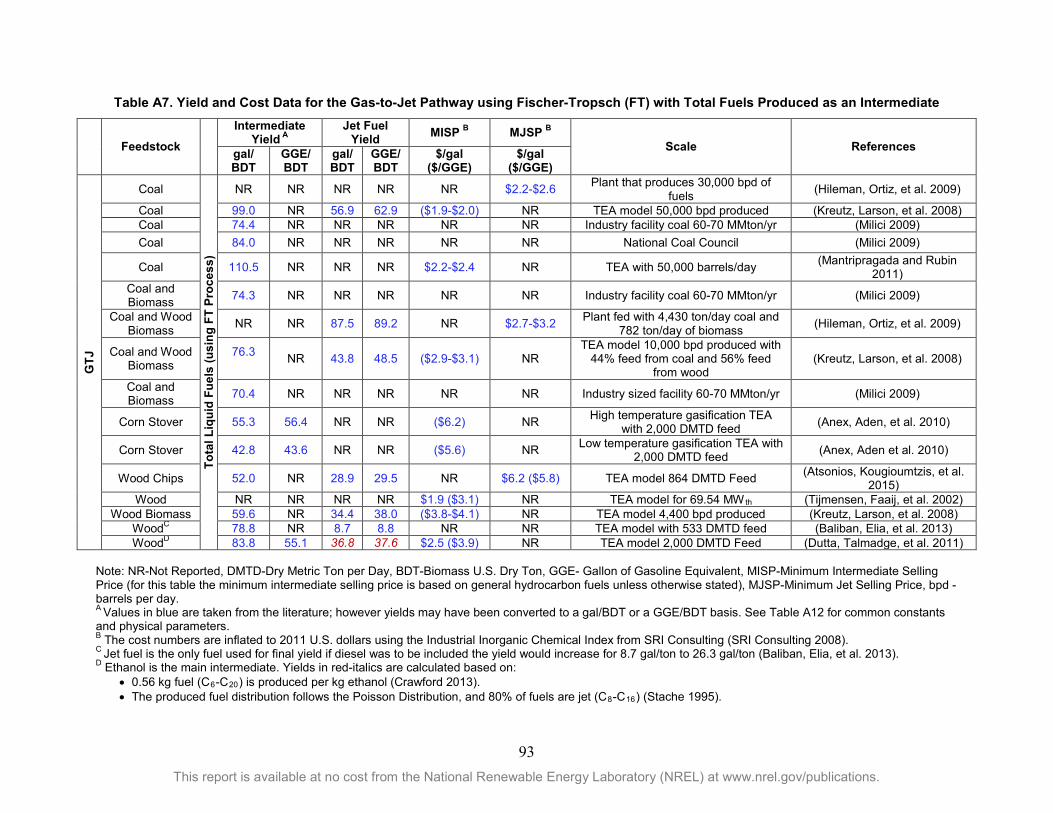
93 This report is available at no cost from the National Renewable Energy Laboratory (NREL) at www.nrel.gov/publications.
Table A7. Yield and Cost Data for the Gas-to-Jet Pathway using Fischer-Tropsch (FT) with Total Fuels Produced as an Intermediate Feedstock
Intermediate Yield A
Jet Fuel Yield MISP B MJSP B
Scale References gal/ BDT
GGE/ BDT
gal/BDT
GGE/BDT
$/gal ($/GGE)
$/gal ($/GGE)
GTJ
Coal To
tal L
iqui
d Fu
els
(usi
ng F
T Pr
oces
s)
NR NR NR NR NR $2.2-$2.6 Plant that produces 30,000 bpd of fuels (Hileman, Ortiz, et al. 2009)
Coal 99.0 NR 56.9 62.9 ($1.9-$2.0) NR TEA model 50,000 bpd produced (Kreutz, Larson, et al. 2008) Coal 74.4 NR NR NR NR NR Industry facility coal 60-70 MMton/yr (Milici 2009) Coal 84.0 NR NR NR NR NR National Coal Council (Milici 2009)
Coal 110.5 NR NR NR $2.2-$2.4 NR TEA with 50,000 barrels/day (Mantripragada and Rubin 2011)
Coal and Biomass 74.3 NR NR NR NR NR Industry facility coal 60-70 MMton/yr (Milici 2009)
Coal and Wood Biomass NR NR 87.5 89.2 NR $2.7-$3.2 Plant fed with 4,430 ton/day coal and
782 ton/day of biomass (Hileman, Ortiz, et al. 2009)
Coal and Wood Biomass
76.3 NR 43.8 48.5 ($2.9-$3.1) NR
TEA model 10,000 bpd produced with 44% feed from coal and 56% feed
from wood (Kreutz, Larson, et al. 2008)
Coal and Biomass 70.4 NR NR NR NR NR Industry sized facility 60-70 MMton/yr (Milici 2009)
Corn Stover 55.3 56.4 NR NR ($6.2) NR High temperature gasification TEA with 2,000 DMTD feed (Anex, Aden, et al. 2010)
Corn Stover 42.8 43.6 NR NR ($5.6) NR Low temperature gasification TEA with 2,000 DMTD feed (Anex, Aden et al. 2010)
Wood Chips 52.0 NR 28.9 29.5 NR $6.2 ($5.8) TEA model 864 DMTD Feed (Atsonios, Kougioumtzis, et al. 2015)
Wood NR NR NR NR $1.9 ($3.1) NR TEA model for 69.54 MWth (Tijmensen, Faaij, et al. 2002) Wood Biomass 59.6 NR 34.4 38.0 ($3.8-$4.1) NR TEA model 4,400 bpd produced (Kreutz, Larson, et al. 2008)
WoodC 78.8 NR 8.7 8.8 NR NR TEA model with 533 DMTD feed (Baliban, Elia, et al. 2013) WoodD 83.8 55.1 36.8 37.6 $2.5 ($3.9) NR TEA model 2,000 DMTD Feed (Dutta, Talmadge, et al. 2011)
Note: NR-Not Reported, DMTD-Dry Metric Ton per Day, BDT-Biomass U.S. Dry Ton, GGE- Gallon of Gasoline Equivalent, MISP-Minimum Intermediate Selling Price (for this table the minimum intermediate selling price is based on general hydrocarbon fuels unless otherwise stated), MJSP-Minimum Jet Selling Price, bpd - barrels per day. A Values in blue are taken from the literature; however yields may have been converted to a gal/BDT or a GGE/BDT basis. See Table A12 for common constants and physical parameters. B The cost numbers are inflated to 2011 U.S. dollars using the Industrial Inorganic Chemical Index from SRI Consulting (SRI Consulting 2008). C Jet fuel is the only fuel used for final yield if diesel was to be included the yield would increase for 8.7 gal/ton to 26.3 gal/ton (Baliban, Elia, et al. 2013). D Ethanol is the main intermediate. Yields in red-italics are calculated based on:
• 0.56 kg fuel (C6-C20) is produced per kg ethanol (Crawford 2013). • The produced fuel distribution follows the Poisson Distribution, and 80% of fuels are jet (C8-C16) (Stache 1995).
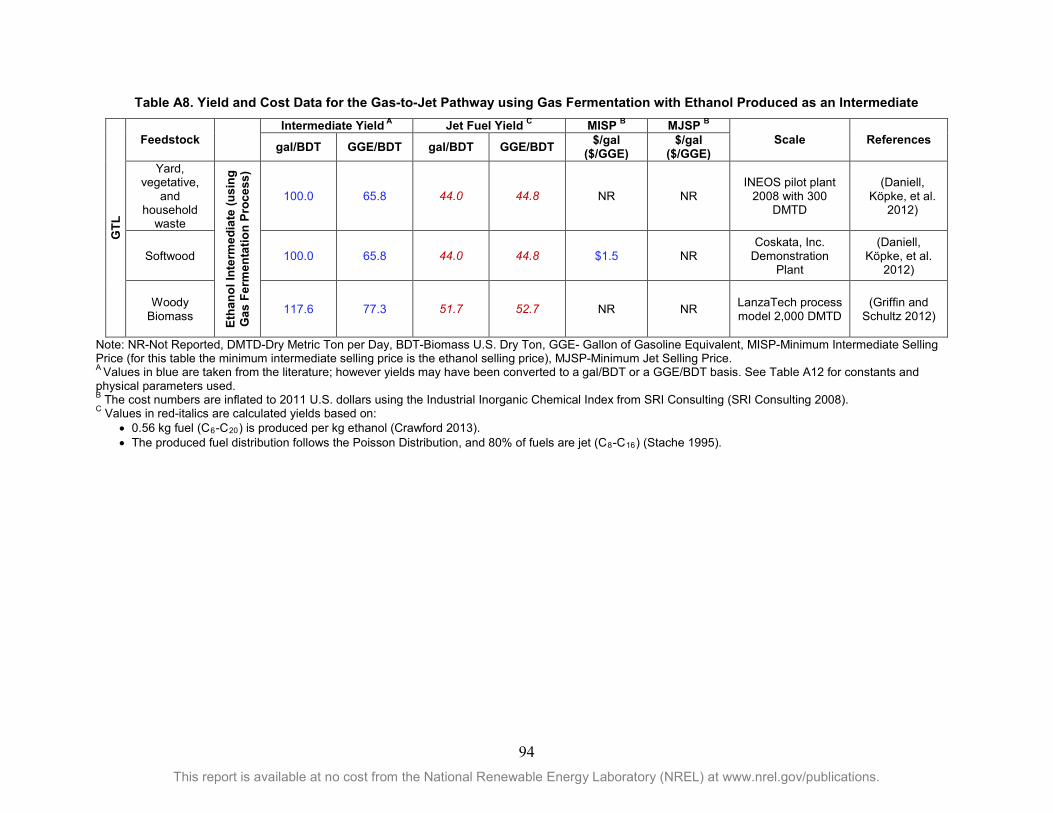
94 This report is available at no cost from the National Renewable Energy Laboratory (NREL) at www.nrel.gov/publications.
Table A8. Yield and Cost Data for the Gas-to-Jet Pathway using Gas Fermentation with Ethanol Produced as an Intermediate G
TL
Feedstock
Intermediate Yield A Jet Fuel Yield C MISP B MJSP B
Scale References gal/BDT GGE/BDT gal/BDT GGE/BDT $/gal ($/GGE)
$/gal ($/GGE)
Yard, vegetative,
and household
waste Et
hano
l Int
erm
edia
te (u
sing
G
as F
erm
enta
tion
Proc
ess)
100.0 65.8 44.0 44.8 NR NR INEOS pilot plant
2008 with 300 DMTD
(Daniell, Köpke, et al.
2012)
Softwood 100.0 65.8 44.0 44.8 $1.5 NR Coskata, Inc.
Demonstration Plant
(Daniell, Köpke, et al.
2012)
Woody Biomass 117.6 77.3 51.7 52.7 NR NR LanzaTech process
model 2,000 DMTD (Griffin and
Schultz 2012)
Note: NR-Not Reported, DMTD-Dry Metric Ton per Day, BDT-Biomass U.S. Dry Ton, GGE- Gallon of Gasoline Equivalent, MISP-Minimum Intermediate Selling Price (for this table the minimum intermediate selling price is the ethanol selling price), MJSP-Minimum Jet Selling Price. A Values in blue are taken from the literature; however yields may have been converted to a gal/BDT or a GGE/BDT basis. See Table A12 for constants and physical parameters used. B The cost numbers are inflated to 2011 U.S. dollars using the Industrial Inorganic Chemical Index from SRI Consulting (SRI Consulting 2008). C Values in red-italics are calculated yields based on:
• 0.56 kg fuel (C6-C20) is produced per kg ethanol (Crawford 2013). • The produced fuel distribution follows the Poisson Distribution, and 80% of fuels are jet (C8-C16) (Stache 1995).
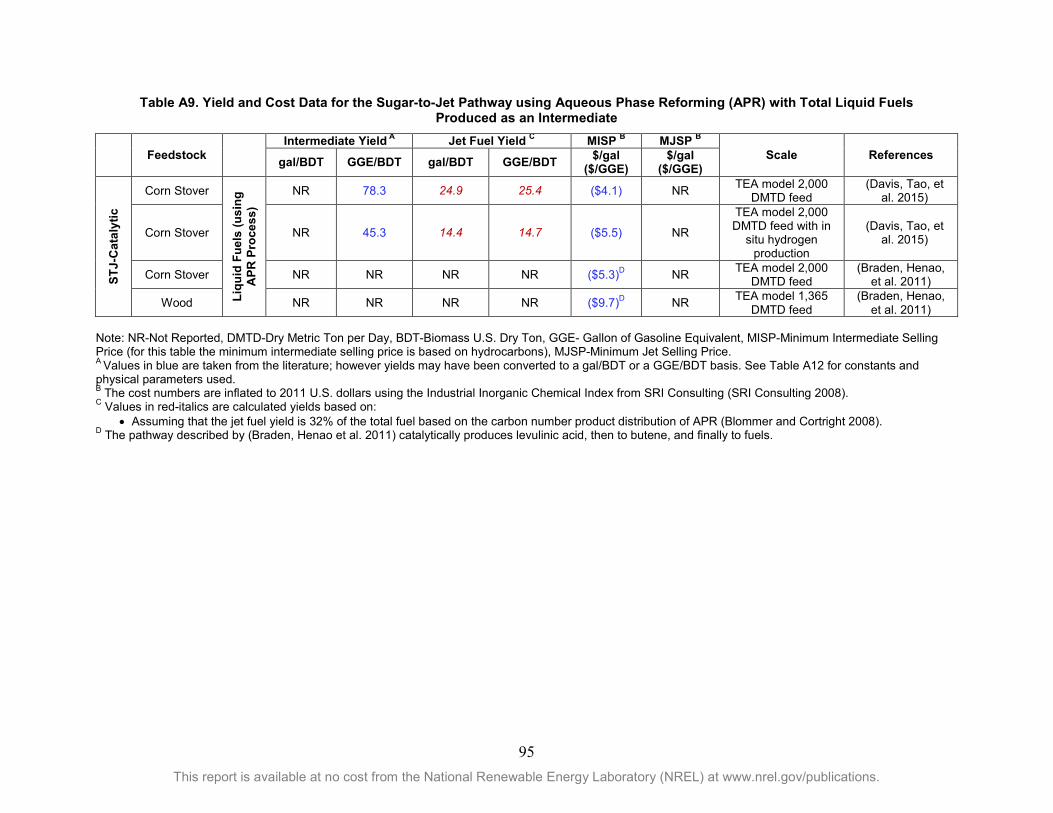
95 This report is available at no cost from the National Renewable Energy Laboratory (NREL) at www.nrel.gov/publications.
Table A9. Yield and Cost Data for the Sugar-to-Jet Pathway using Aqueous Phase Reforming (APR) with Total Liquid Fuels Produced as an Intermediate
Feedstock
Intermediate Yield A Jet Fuel Yield C MISP B MJSP B
Scale References gal/BDT GGE/BDT gal/BDT GGE/BDT $/gal ($/GGE)
$/gal ($/GGE)
STJ-
Cat
alyt
ic
Corn Stover
Liqu
id F
uels
(usi
ng
APR
Pro
cess
)
NR 78.3 24.9 25.4 ($4.1) NR TEA model 2,000 DMTD feed
(Davis, Tao, et al. 2015)
Corn Stover NR 45.3 14.4 14.7 ($5.5) NR
TEA model 2,000 DMTD feed with in
situ hydrogen production
(Davis, Tao, et al. 2015)
Corn Stover NR NR NR NR ($5.3)D NR TEA model 2,000 DMTD feed
(Braden, Henao, et al. 2011)
Wood NR NR NR NR ($9.7)D NR TEA model 1,365 DMTD feed
(Braden, Henao, et al. 2011)
Note: NR-Not Reported, DMTD-Dry Metric Ton per Day, BDT-Biomass U.S. Dry Ton, GGE- Gallon of Gasoline Equivalent, MISP-Minimum Intermediate Selling Price (for this table the minimum intermediate selling price is based on hydrocarbons), MJSP-Minimum Jet Selling Price. A Values in blue are taken from the literature; however yields may have been converted to a gal/BDT or a GGE/BDT basis. See Table A12 for constants and physical parameters used. B The cost numbers are inflated to 2011 U.S. dollars using the Industrial Inorganic Chemical Index from SRI Consulting (SRI Consulting 2008). C Values in red-italics are calculated yields based on:
• Assuming that the jet fuel yield is 32% of the total fuel based on the carbon number product distribution of APR (Blommer and Cortright 2008). D The pathway described by (Braden, Henao et al. 2011) catalytically produces levulinic acid, then to butene, and finally to fuels.
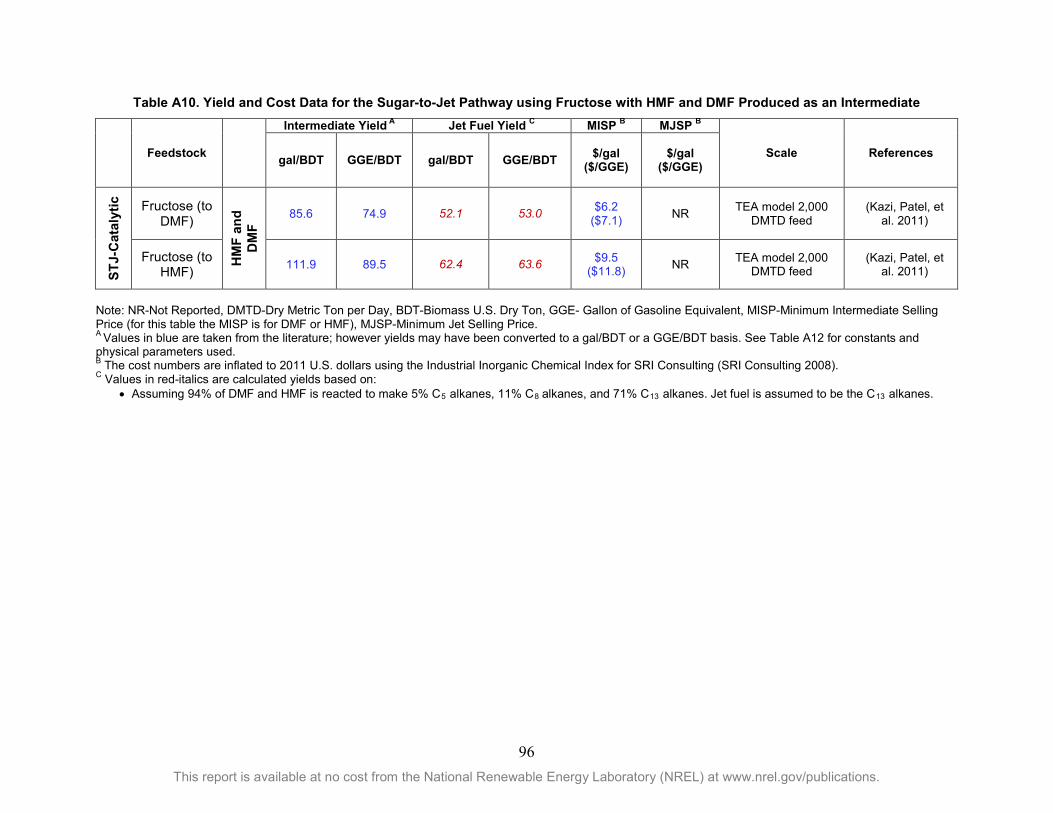
96 This report is available at no cost from the National Renewable Energy Laboratory (NREL) at www.nrel.gov/publications.
Table A10. Yield and Cost Data for the Sugar-to-Jet Pathway using Fructose with HMF and DMF Produced as an Intermediate Feedstock
Intermediate Yield A Jet Fuel Yield C MISP B MJSP B
Scale References gal/BDT GGE/BDT gal/BDT GGE/BDT $/gal ($/GGE)
$/gal ($/GGE)
STJ-
Cat
alyt
ic
Fructose (to DMF)
HM
F an
d D
MF
85.6 74.9 52.1 53.0 $6.2 ($7.1) NR TEA model 2,000
DMTD feed (Kazi, Patel, et
al. 2011)
Fructose (to HMF) 111.9 89.5 62.4 63.6 $9.5
($11.8) NR TEA model 2,000 DMTD feed
(Kazi, Patel, et al. 2011)
Note: NR-Not Reported, DMTD-Dry Metric Ton per Day, BDT-Biomass U.S. Dry Ton, GGE- Gallon of Gasoline Equivalent, MISP-Minimum Intermediate Selling Price (for this table the MISP is for DMF or HMF), MJSP-Minimum Jet Selling Price. A Values in blue are taken from the literature; however yields may have been converted to a gal/BDT or a GGE/BDT basis. See Table A12 for constants and physical parameters used. B The cost numbers are inflated to 2011 U.S. dollars using the Industrial Inorganic Chemical Index for SRI Consulting (SRI Consulting 2008). C Values in red-italics are calculated yields based on:
• Assuming 94% of DMF and HMF is reacted to make 5% C5 alkanes, 11% C8 alkanes, and 71% C13 alkanes. Jet fuel is assumed to be the C13 alkanes.
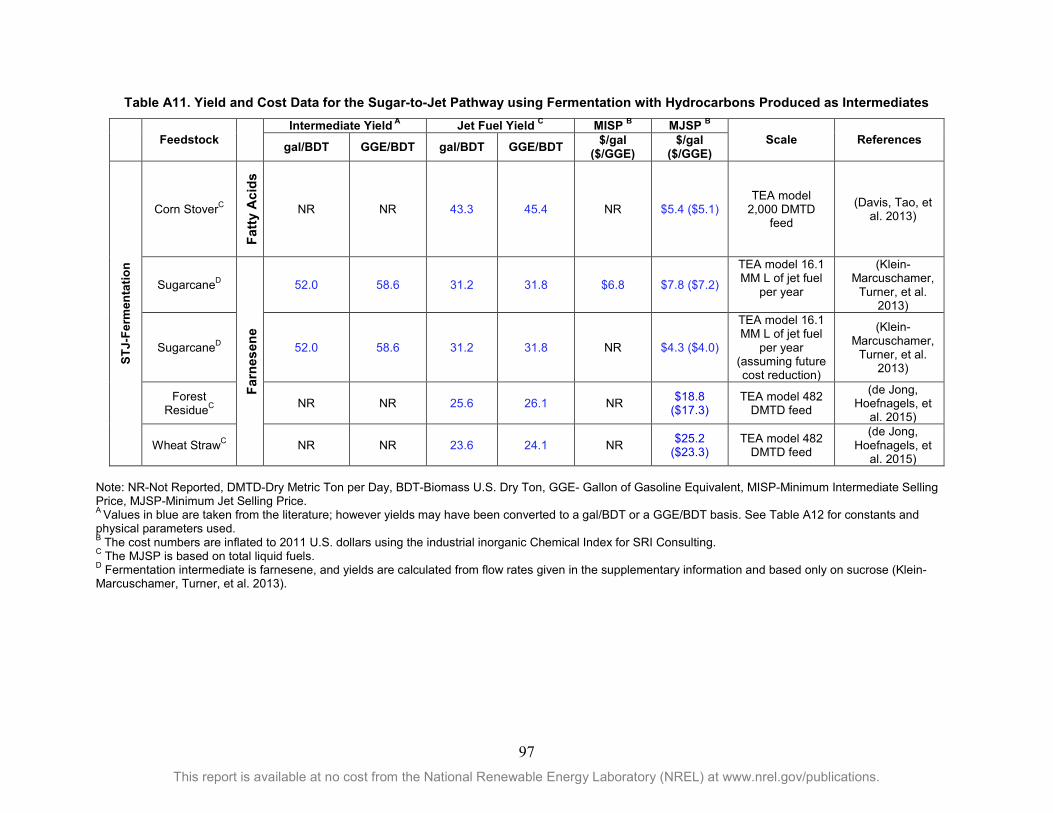
97 This report is available at no cost from the National Renewable Energy Laboratory (NREL) at www.nrel.gov/publications.
Table A11. Yield and Cost Data for the Sugar-to-Jet Pathway using Fermentation with Hydrocarbons Produced as Intermediates
Feedstock Intermediate Yield A Jet Fuel Yield C MISP B MJSP B
Scale References gal/BDT GGE/BDT gal/BDT GGE/BDT $/gal ($/GGE)
$/gal ($/GGE)
STJ-
Ferm
enta
tion
Corn StoverC
Fatty
Aci
ds
NR NR 43.3 45.4 NR $5.4 ($5.1) TEA model
2,000 DMTD feed
(Davis, Tao, et al. 2013)
SugarcaneD
Farn
esen
e
52.0 58.6 31.2 31.8 $6.8 $7.8 ($7.2)
TEA model 16.1 MM L of jet fuel
per year
(Klein-Marcuschamer,
Turner, et al. 2013)
SugarcaneD 52.0 58.6 31.2 31.8 NR $4.3 ($4.0)
TEA model 16.1 MM L of jet fuel
per year (assuming future cost reduction)
(Klein-Marcuschamer,
Turner, et al. 2013)
Forest ResidueC NR NR 25.6 26.1 NR $18.8
($17.3) TEA model 482
DMTD feed
(de Jong, Hoefnagels, et
al. 2015)
Wheat StrawC NR NR 23.6 24.1 NR $25.2 ($23.3)
TEA model 482 DMTD feed
(de Jong, Hoefnagels, et
al. 2015)
Note: NR-Not Reported, DMTD-Dry Metric Ton per Day, BDT-Biomass U.S. Dry Ton, GGE- Gallon of Gasoline Equivalent, MISP-Minimum Intermediate Selling Price, MJSP-Minimum Jet Selling Price. A Values in blue are taken from the literature; however yields may have been converted to a gal/BDT or a GGE/BDT basis. See Table A12 for constants and physical parameters used. B The cost numbers are inflated to 2011 U.S. dollars using the industrial inorganic Chemical Index for SRI Consulting. C The MJSP is based on total liquid fuels. D Fermentation intermediate is farnesene, and yields are calculated from flow rates given in the supplementary information and based only on sucrose (Klein-Marcuschamer, Turner, et al. 2013).
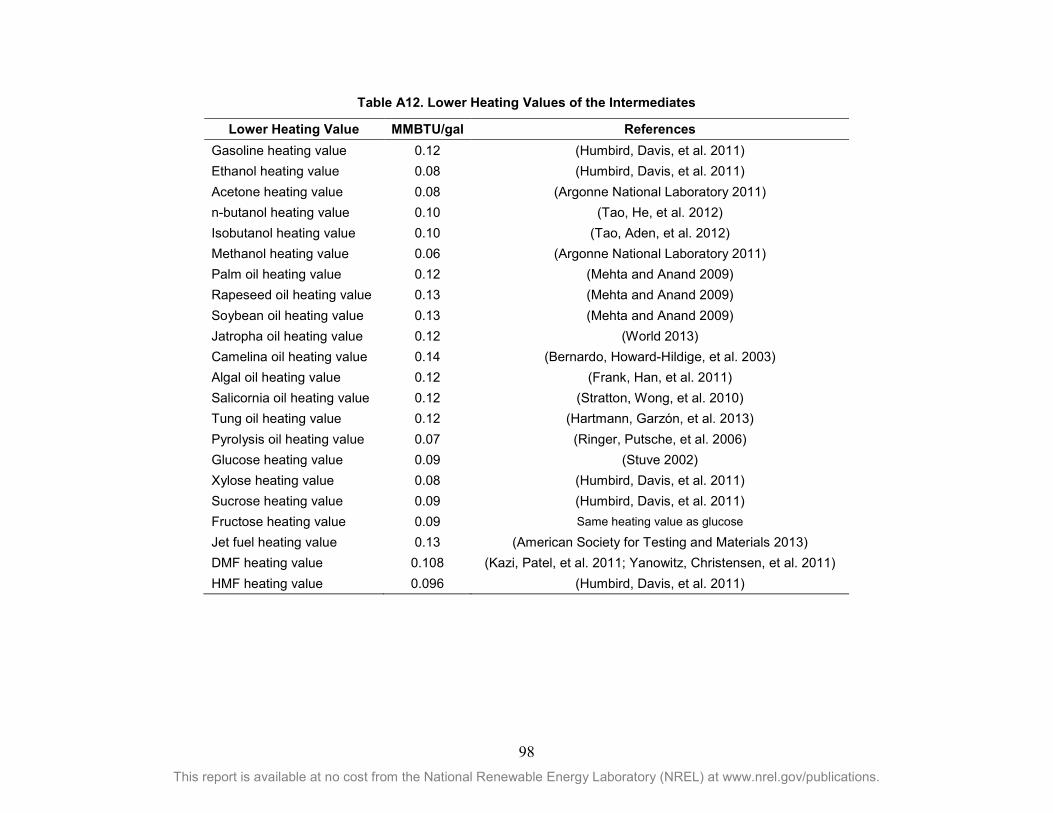
98 This report is available at no cost from the National Renewable Energy Laboratory (NREL) at www.nrel.gov/publications.
Table A12. Lower Heating Values of the Intermediates
Lower Heating Value MMBTU/gal References Gasoline heating value 0.12 (Humbird, Davis, et al. 2011) Ethanol heating value 0.08 (Humbird, Davis, et al. 2011) Acetone heating value 0.08 (Argonne National Laboratory 2011) n-butanol heating value 0.10 (Tao, He, et al. 2012) Isobutanol heating value 0.10 (Tao, Aden, et al. 2012) Methanol heating value 0.06 (Argonne National Laboratory 2011) Palm oil heating value 0.12 (Mehta and Anand 2009) Rapeseed oil heating value 0.13 (Mehta and Anand 2009) Soybean oil heating value 0.13 (Mehta and Anand 2009) Jatropha oil heating value 0.12 (World 2013) Camelina oil heating value 0.14 (Bernardo, Howard-Hildige, et al. 2003) Algal oil heating value 0.12 (Frank, Han, et al. 2011) Salicornia oil heating value 0.12 (Stratton, Wong, et al. 2010) Tung oil heating value 0.12 (Hartmann, Garzón, et al. 2013) Pyrolysis oil heating value 0.07 (Ringer, Putsche, et al. 2006) Glucose heating value 0.09 (Stuve 2002) Xylose heating value 0.08 (Humbird, Davis, et al. 2011) Sucrose heating value 0.09 (Humbird, Davis, et al. 2011) Fructose heating value 0.09 Same heating value as glucose Jet fuel heating value 0.13 (American Society for Testing and Materials 2013) DMF heating value 0.108 (Kazi, Patel, et al. 2011; Yanowitz, Christensen, et al. 2011) HMF heating value 0.096 (Humbird, Davis, et al. 2011)