Embed Size (px)
Citation preview
REVIEW OF ALTERNATIVE SCHOOLS: Research Analysis 2016-17
Research & Information Services Toronto District School Board
November 2017 Report No. 17/18-10
TITLE: Review of Alternative Schools: Research Analysis 2016-17 AUTHOR: Robert S. Brown
With the assistance from: Cosmin Marmureanu, Researcher George Tam, Research & Information Analyst, Toronto District School Board Ashkan Safari, Researcher
Copyright © Toronto District School Board (November 2017)
Cite as: Brown, S. R. (2017). Review of alternative schools: Research analysis 2016-17. (Research Report No. 17/18-10).Toronto, Ontario, Canada: Toronto District School Board
Reproduction of this document for use in the schools of the Toronto District School Board is encouraged.
For any other purpose, permission must be requested and obtained in writing from:
Research & Information Services Toronto District School Board 1 Civic Centre Court, Lower Level Etobicoke, ON M9C 2B3
Fax: 416-394-4946
Every reasonable precaution has been taken to trace the owners of copyrighted material and to make due acknowledgement. Any omission will gladly be rectified in future printings.
R10(AlternativeSchools\2017-18\AlternativeSchoolsReview\Report\Review of Alternative Schools Research of Analysis 2016-17)rb.1485
Table of Contents
Introduction ............................................................................................................................................ 3
Part I: Overview of the Alternative School System 2016-17...................................................................... 5
Location of Schools within the Learning Opportunity Index.................................................................. 5
Demographic Overview 2016-17.......................................................................................................... 5
School and Student Neighbourhood by Forward Sortation Area and Grade ......................................... 9
Student Residence by Forward Sortation Area ................................................................................... 10
Year-to-year Mobility: Alternative School Students and the TDSB ...................................................... 11
Part II: Alternative Schools in the JK to Post-secondary Cohort Study (2002-03 to 2016-17)................... 12
Part III: Consultation Sessions................................................................................................................ 14
Introduction ...................................................................................................................................... 14
Methodology..................................................................................................................................... 14
A: Results: Overall Challenges to Alternative Schools ......................................................................... 15
B: Results: Challenges to Increasing the Number of Alternative Schools............................................. 18
C: Results: Challenges to Increasing the Number of Pathways............................................................ 19
Part IV: Examination of Academic Literature ........................................................................................ 20
A. Access to Schools/the Admission Process................................................................................... 21
B. Literature on Small Schools ........................................................................................................ 21
C. TDSB Structured Pathways Report (Parekh, 2013) ...................................................................... 22
Part V: Suggested Areas for Discussion/Recommendations and Next Steps........................................... 23
A. Professional Development for TDSB Staff ................................................................................... 23
B. Composition of Alternative and Mainstream Schools ................................................................. 23
C. Progression................................................................................................................................ 24
D. Grade 9 Entry into Alternative Schools ....................................................................................... 24
E. Alternative School Demographics............................................................................................... 24
F. Locations of Alternative Schools................................................................................................. 25
G. Potential for Improvement......................................................................................................... 25
Next Steps............................................................................................................................................. 25
References ........................................................................................................................................ 26
REVIEW OF ALTERNATIVE SCHOOLS: RESEARCH ANALYSIS 2016-17 1

2 REVIEW OF ALTERNATIVE SCHOOLS: RESEARCH ANALYSIS 2016 17
-
Introduction
There are 39 alternative schools in the Toronto District School Board (TDSB): 20 secondary schools, 18 elementary schools, and one elementary/secondary school.
According to the TDSB w eb site, “Alternative schools offer students and parents something different from mainstream schooling. Each alternative school, whether elementary or secondary is unique, with a distinct identity and approach to curriculum delivery. They usually feature a small student population, a commitment to innovative and experimental programs, and volunteer commitment from parents/guardians and other community members.” (see http://www.tdsb.on.ca/Community/How-to-Get-Involved/Community-Advisory-Committees/Alternative-Schools-Advisory-Committee).
Alternative schools predated t he amalgamation of the TDSB approximately twenty years ago. For example, most of the current Scarborough alternative schools started as individual schools within the Centre for Alternative Studies. That being said, around two thirds of current alternative schools are located w ithin the area of the former Toronto legacy board. School locations can be seen in the following map (see Figure 1).
This report briefly e xamines the 2016-17 alternative school system in the TDSB, from existing information available from Research and Information Services, and with an examination of consultation sessions held in Spring 2017.
The report has five sections: I) Overview of the Alternative School System 2016-17; II) Alternative Schools in the JK to Post-secondary Cohort Study (2002-03 to 2016-17); III) Consultation Sessions; IV) Examination of Academic Literature, and V) Suggested Areas for Discussion/Recommendations and Next Steps.
REVIEW OF ALTERNATIVE SCHOOLS: RESEARCH ANALYSIS 2016-17 3
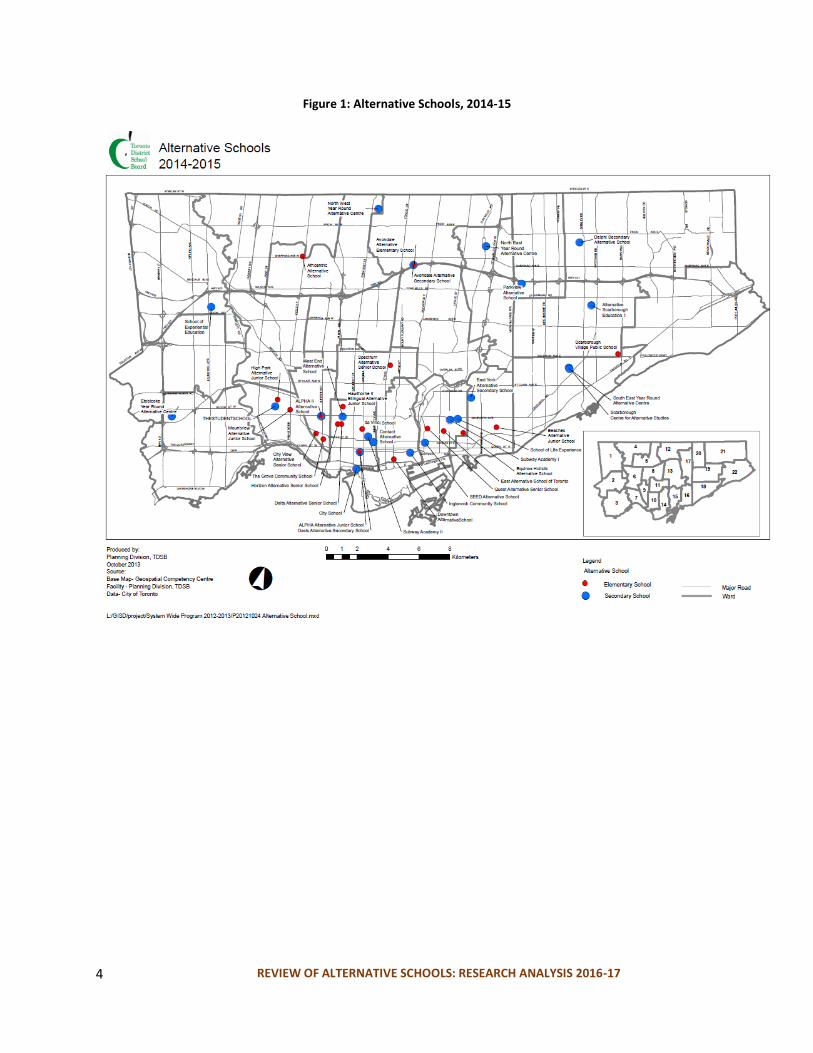
Figure 1: Alternative Schools, 2014-15
REVIEW OF ALTERNATIVE SCHOOLS: RESEARCH ANALYSIS 2016-17 4
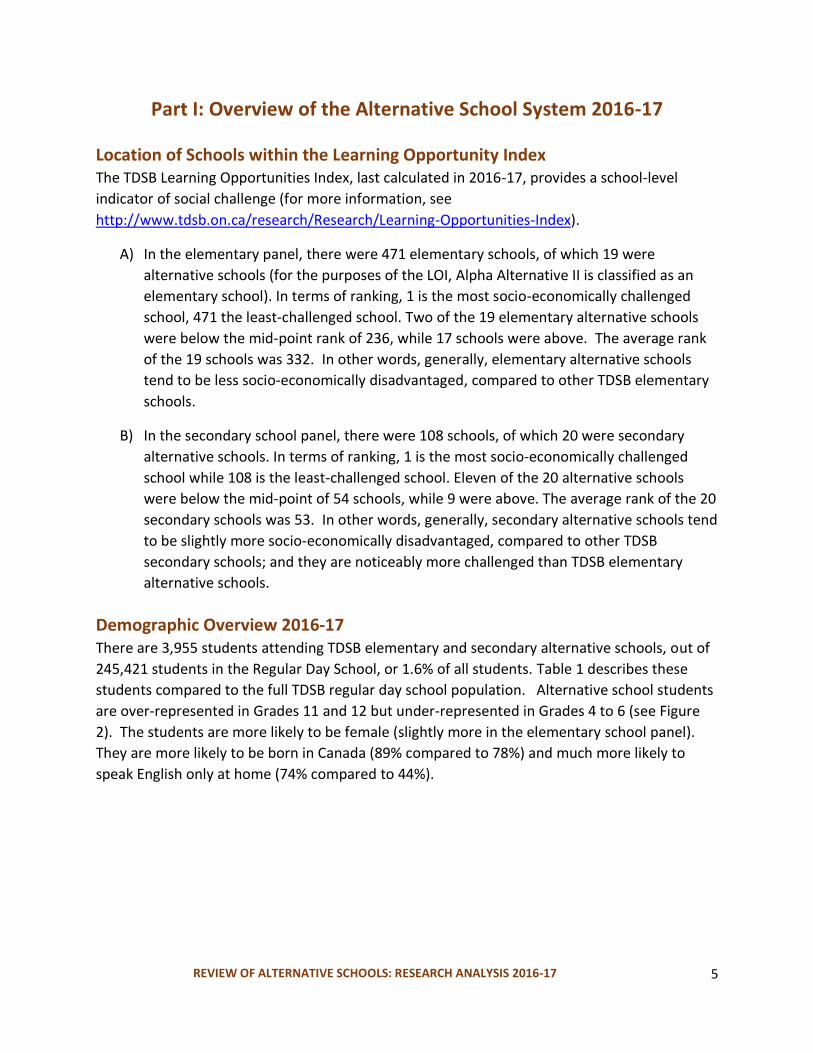
Part I: Overview of the Alternative School System 2016-17
Location of Schools within the Learning Opportunity Index The TDSB L earning Opportunities Index, last calculated in 2016-17, provides a school-level
indicator of social challenge (for more information, see
http://www.tdsb.on.ca/research/Research/Learning-Opportunities-Index).
A) In the elementary panel, there were 471 elementary schools, of which 19 were
alternative schools (for the purposes of the LOI, Alpha Alternative II is classified as an
elementary school). In terms of ranking, 1 is the most socio-economically challenged
school, 471 the least-challenged sc hool. Two of the 19 elementary alternative schools
were below the mid-point rank of 236, while 17 schools were above. The average rank
of the 19 schools was 332. In other words, generally, elementary alternative schools
tend to be less socio-economically disadvantaged, compared to other TDSB elementary
schools.
B) In the secondary school panel, there were 108 schools, of which 20 were secondary
alternative schools. In terms of ranking, 1 is the most socio-economically challenged
school while 108 is the least-challenged school. Eleven of the 20 alternative schools
were below the mid-point of 54 schools, while 9 were above. The average rank of the 20
secondary schools was 53. In other words, generally, secondary alternative schools tend
to be slightly more socio-economically disadvantaged, compared to other TDSB
secondary schools; and they are noticeably mo re challenged than TDSB e lementary
alternative schools.
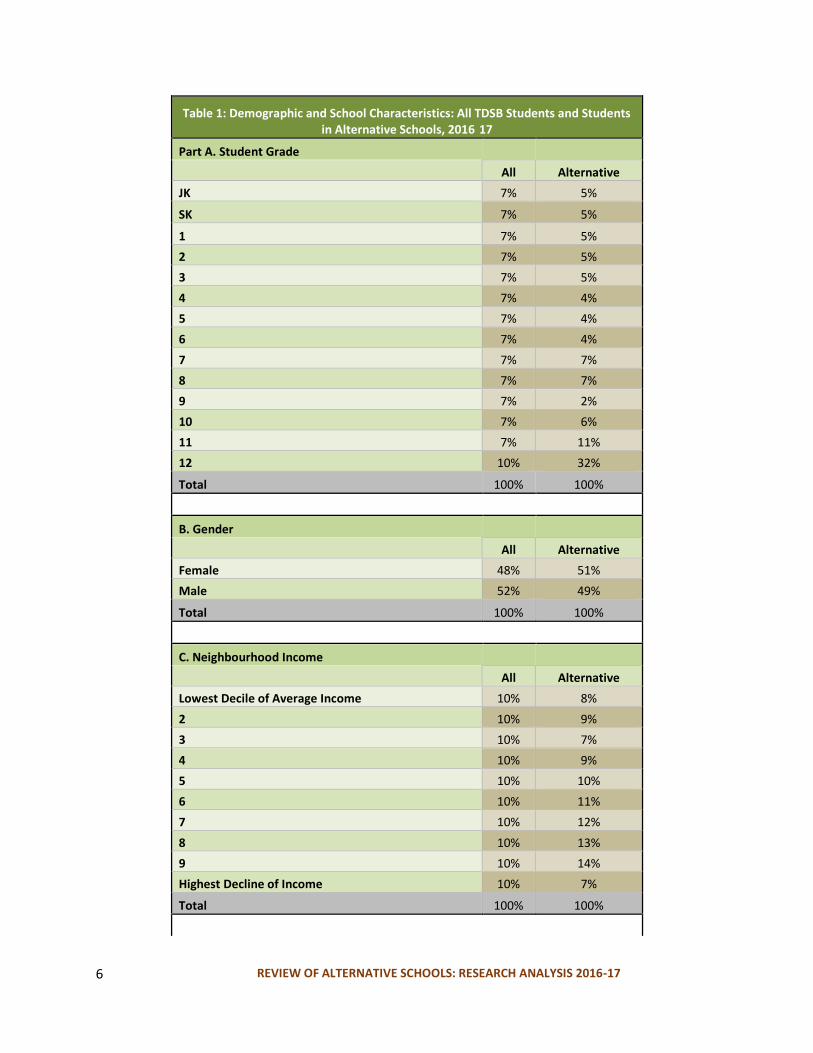
Demographic Overview 2016-17 There are 3,955 students attending TDSB elementary and secondary alternative schools, out of
245,421 students in the Regular Day School, or 1.6% of all students. Table 1 describes these
students compared to the full TDSB regular day school population. Alternative school students
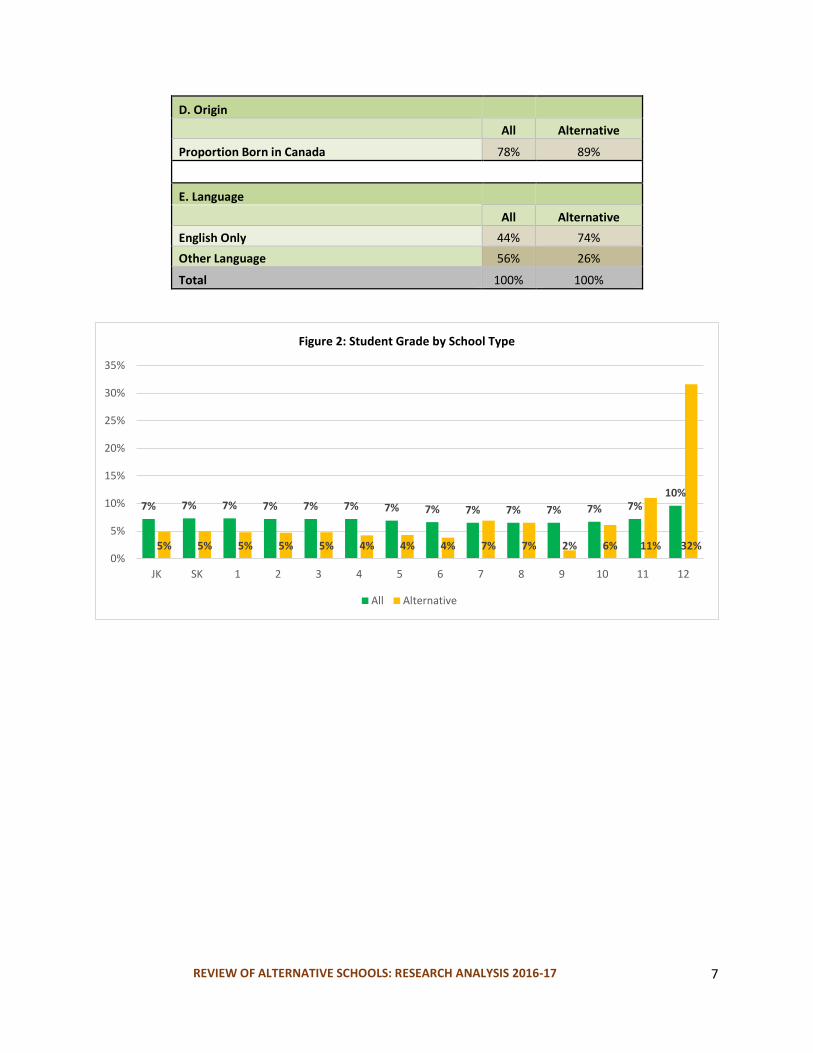
are over-represented in Grades 11 and 12 but under-represented in Grades 4 to 6 (see Figure
2). The students are more likely to be female (slightly more in the elementary school panel).
They are more likely to be born in Canada (89% compared to 78%) and much more likely to
speak English only at home (74% compared to 44%).
REVIEW OF ALTERNATIVE SCHOOLS: RESEARCH ANALYSIS 2016-17 5
REVIEW OF ALTERNATIVE SCHOOLS: RESEARCH ANALYSIS 2016-17 6
Table 1: Demographic and School Characteristics: All TDSB Students and Students in Alternative Schools, 2016 -17
Part A. Student Grade
All Alternative
JK 7% 5%
SK 7% 5%
1 7% 5%
2 7% 5%
3 7% 5%
4 7% 4%
5 7% 4%
6 7% 4%
7 7% 7%
8 7% 7%
9 7% 2%
10 7% 6%
11 7% 11%
12 10% 32%
Total 100% 100%
B. Ge nder
All Alternative
Female 48% 51%
Male 52% 49%
Total 100% 100%
C. Neighbourhood Income
All Alternative
Lowest Decile of Average Income 10% 8%
2 10% 9%
3 10% 7%
4 10% 9%
5 10% 10%
6 10% 11%
7 10% 12%
8 10% 13%
9 10% 14%
Highest Decline of Income 10% 7%
Total 100% 100%
REVIEW OF ALTERNATIVE SCHOOLS: RESEARCH ANALYSIS 2016-17 7
D. Origin
All Alternative
Proportion Born in Canada 78% 89%
E. Language
All Alternative
English Only 44% 74%
Other Language 56% 26%
Total 100% 100%
7% 7% 7% 7% 7% 7% 7% 7% 7% 7% 7% 7% 7% 10%
5% 5% 5% 5% 5% 4% 4% 4% 7% 7% 2% 6% 11% 32% 0%
5%
10%
15%
20%
25%
30%
35%
JK SK 1 2 3 4 5 6 7 8 9 10 11 12
Figure 2: Student Grade by School Type
All Alternative
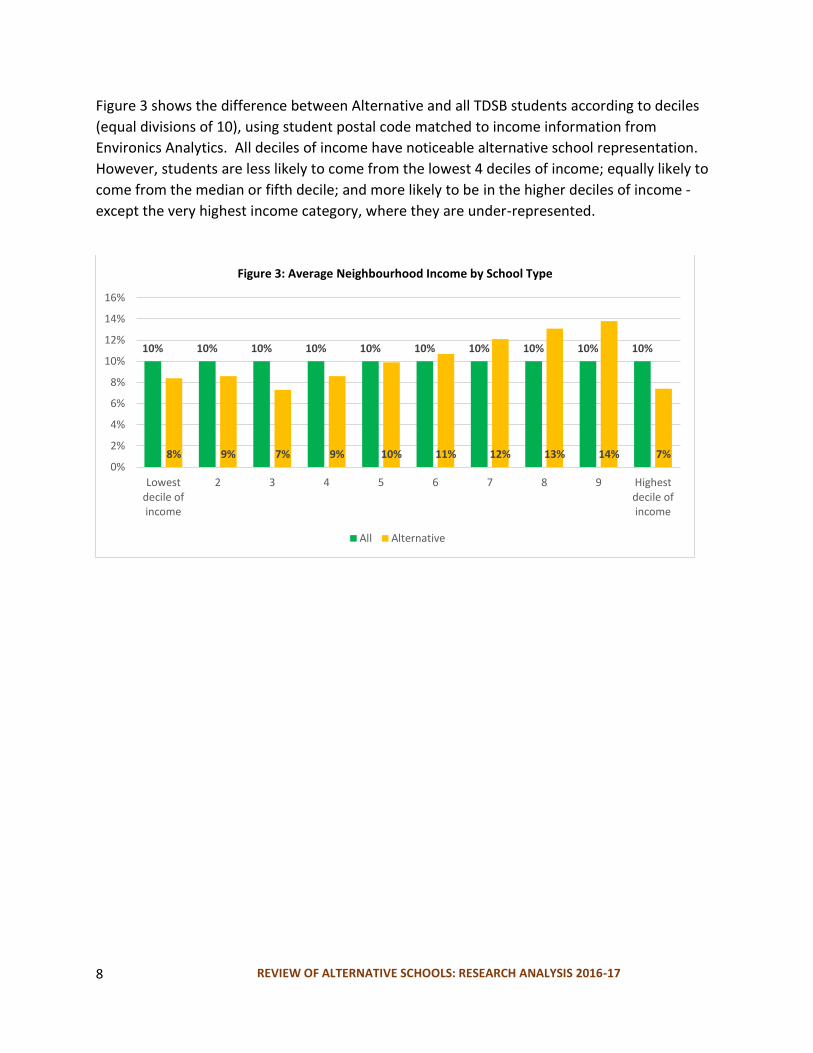
Figure 3 shows the difference between Alternative and all TDSB st udents according to deciles
(equal divisions of 10), using student postal code matched to income information from
Environics Analytics. All deciles of income have noticeable alternative school representation.
However, students are less likely t o come from the lowest 4 deciles of income; equally likely t o
come from the median or fifth decile; and more likely to be in the higher deciles of income -
except the very highest income category, where they are under-represented.
10% 10% 10% 10% 10% 10% 10% 10% 10% 10%
8% 9% 7% 9% 10% 11% 12% 13% 14% 7% 0%
2%
4%
6%
8%
10%
12%
14%
16%
Lowest decile of income
2 3 4 5 6 7 8 9 Highest decile of income
Figure 3: Average Neighbourhood Income by School Type
All Alternative
REVIEW OF ALTERNATIVE SCHOOLS: RESEARCH ANALYSIS 2016-17 8
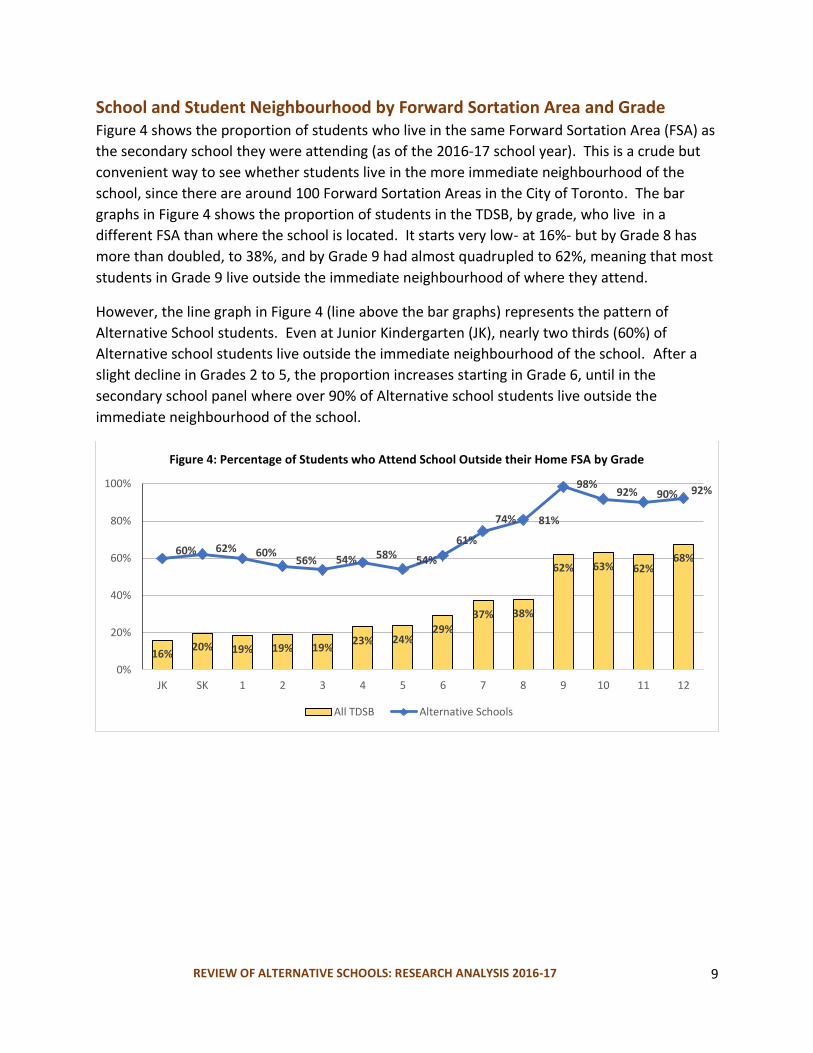
School and Student Neighbourhood by Forward Sortation Area and Grade Figure 4 shows the proportion of students who live in the same Forward Sortation Area (FSA) as
the secondary school they were attending (as of the 2016-17 school year). This is a crude but
convenient way to see whether students live in the more immediate neighbourhood of the
school, since there are around 100 Forward Sortation Areas in the City of Toronto. The bar
graphs in Figure 4 shows the proportion of students in the TDSB, by grade, who live in a
different FSA than where the school is located. It starts very low- at 16%- but by Grade 8 has
more than doubled, to 38%, and by Grade 9 had almost quadrupled to 62%, meaning that most
students in Grade 9 live outside the immediate neighbourhood of where they attend.
However, the line graph in Figure 4 (line above the bar graphs) represents the pattern of
Alternative School students. Even at Junior Kindergarten (JK), nearly two thirds (60%) of
Alternative school students live outside the immediate neighbourhood of the school. After a
slight decline in Grades 2 to 5, the proportion increases starting in Grade 6, until in the
secondary school panel where over 90% of Alternative school students live outside the
immediate neighbourhood of the school.
16% 20% 19% 19% 19%
23% 24% 29%
37% 38%
62% 63% 62% 68%
60% 62% 60% 56% 54% 58% 54%
61%
74% 81%
98% 92% 90% 92%
0%
20%
40%
60%
80%
100%
JK SK 1 2 3 4 5 6 7 8 9 10 11 12
Figure 4: Percentage of Students who Attend School Outside their Home FSA by Grade
All TDSB Alternative Schools
REVIEW OF ALTERNATIVE SCHOOLS: RESEARCH ANALYSIS 2016-17 9
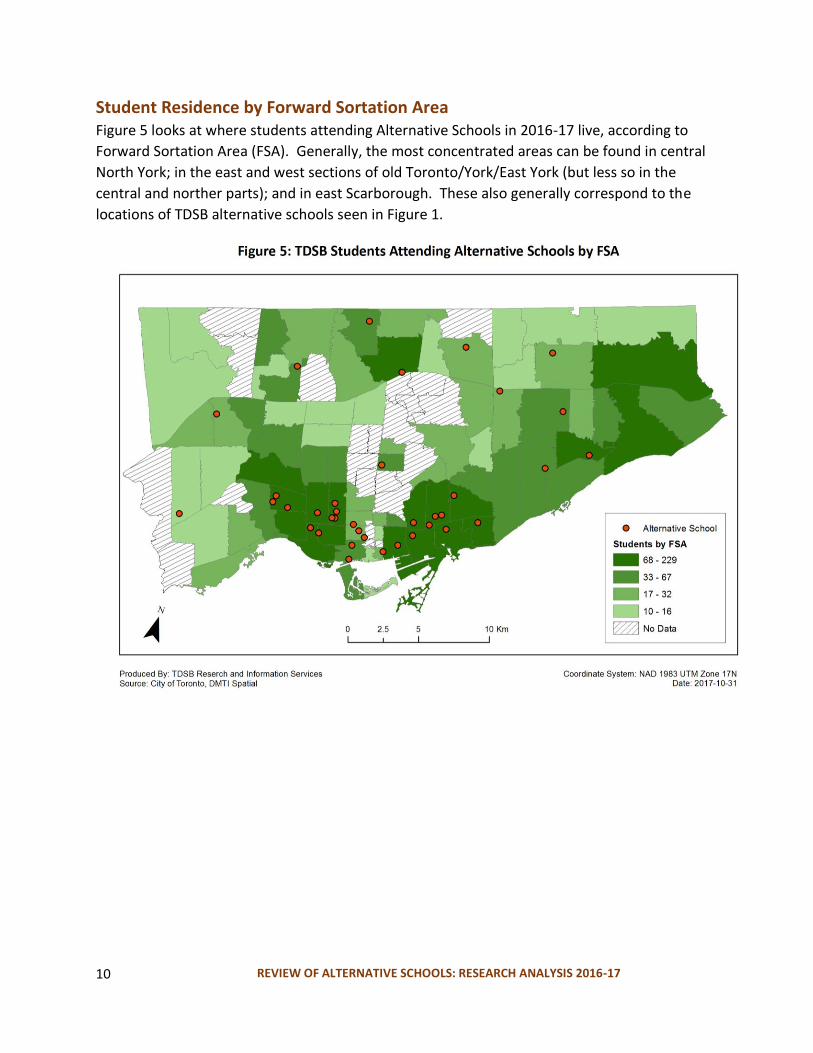
Student Residence by Forward Sortation Area Figure 5 looks at where students attending Alternative Schools in 2016-17 live, according to
Forward Sortation Area (FSA). Generally, the most concentrated areas can be found in central
North York; in the east and west sections of old Toronto/York/East York (but less so in the
central and norther parts); and in east Scarborough. These also generally correspond to the
locations of TDSB alternative schools seen in Figure 1.
REVIEW OF ALTERNATIVE SCHOOLS: RESEARCH ANALYSIS 2016-17 10
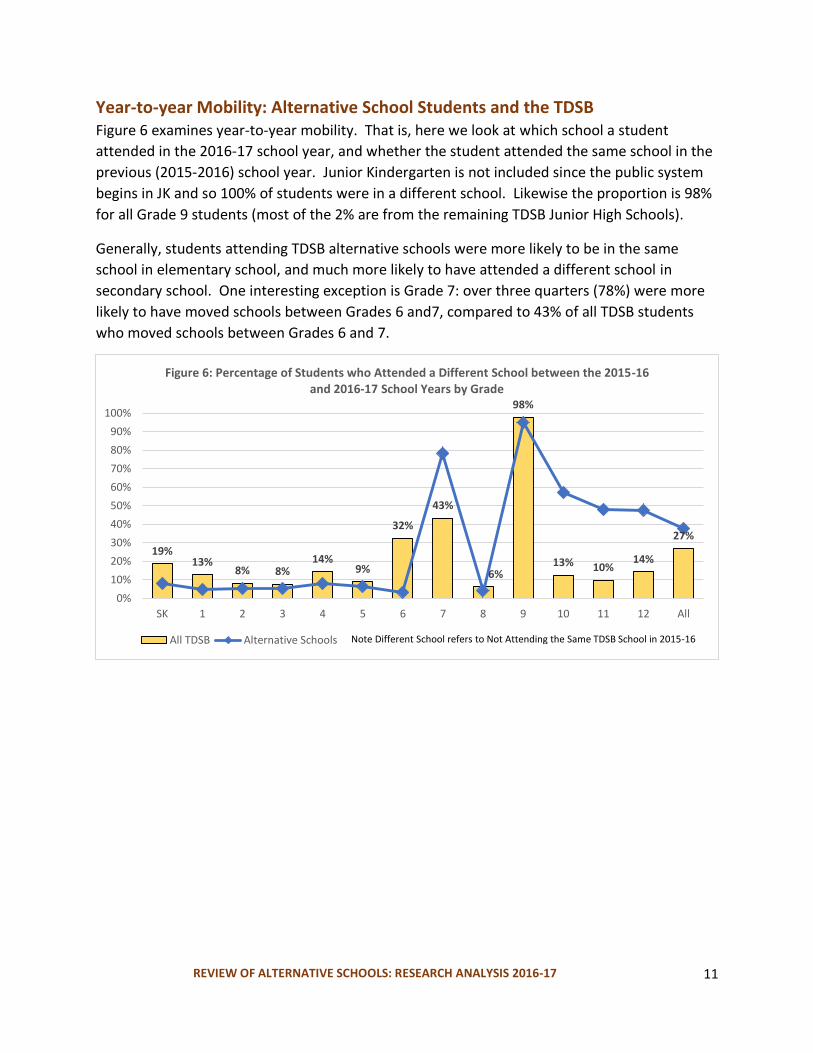
Year-to-year Mobility: Alternative School Students and the TDSB Figure 6 examines year-to-year mobility. That is, here we look at which school a student
attended in the 2016-17 school year, and whether the student attended the same school in the
previous (2015-2016) school year. Junior Kindergarten is not included since the public system
begins in JK and so 100% of students were in a different school. Likewise the proportion is 98%
for all Grade 9 students (most of the 2% are from the remaining TDSB Junior High Schools).
Generally, students attending TDSB alternative schools were more likely to be in the same
school in elementary school, and much more likely to have attended a different school in
secondary school. One interesting exception is Grade 7: over three quarters (78%) were more
likely to have moved schools between Grades 6 and7, compared to 43% of all TDSB students
who moved schools between Grades 6 and 7.
19% 13%
8% 8% 14%
9%
32%
43%
6%
98%
13% 10% 14%
27%
0%
10%
20%
30%
40%
50%
60%
70%
80%
90%
100%
SK 1 2 3 4 5 6 7 8 9 10 11 12 All
Figure 6: Percentage of Students who Attended a Different School between the 2015-16 and 2016-17 School Years by Grade
All TDSB Alternative Schools Note Different School refers to Not Attending the Same TDSB School in 2015-16
REVIEW OF ALTERNATIVE SCHOOLS: RESEARCH ANALYSIS 2016-17 11
Part II: Alternative Schools in the JK to Po st-secondary Cohort Study (2002-03 to 2016-17)
We have been following the first full Trillium TDSB cohort from when they started in JK in the 2002-03 school year, adding students as they have entered the TDSB over time. Excluding those who transferred to other boards, there were 15,184 students who were in Grade 9 in the TDSB over the 2012-13 school year, and who had completed four years of high school as of Fall 2016. Of those students, 264 or 2% attended TDSB elementary alternative schools, while 518 or 3% attended TDSB secondary alternative schools.
The characteristics of these two groups appear to have been quite different. For example, of the students who attended elementary alternative schools, 87% took Academic courses in Grade 9, compared to 51% of students who attended secondary alternative schools. Likewise, students attending elementary schools were much more likely to come from two-parent families and have parents who attended university; slightly under three quarters self-identified as White (for more details, see Table 2).
By the end of Year 4 of high school (Fall 2016), 77% of students attending elementary alternative schools had graduated f rom high school, and two thirds (68%) had applied t o post-secondary over the 2016 post-secondary application cycle. In comparison, of students who had attended secondary alternative schools, only 16 % had graduated, with 58% still present in the TDSB o ver the 2016-17 school year and hence had not had the opportunity to apply t o post-secondary.
This may in part be because most of the students attending alternative secondary schools transferred from another school, and mobile students generally take longer to complete their secondary school careers. We will need to wait until the end of the 2017 post-secondary application cycle to get a more complete picture of the post-secondary pathways of secondary school students attending alternative schools.
REVIEW OF ALTERNATIVE SCHOOLS: RESEARCH ANALYSIS 2016-17 12
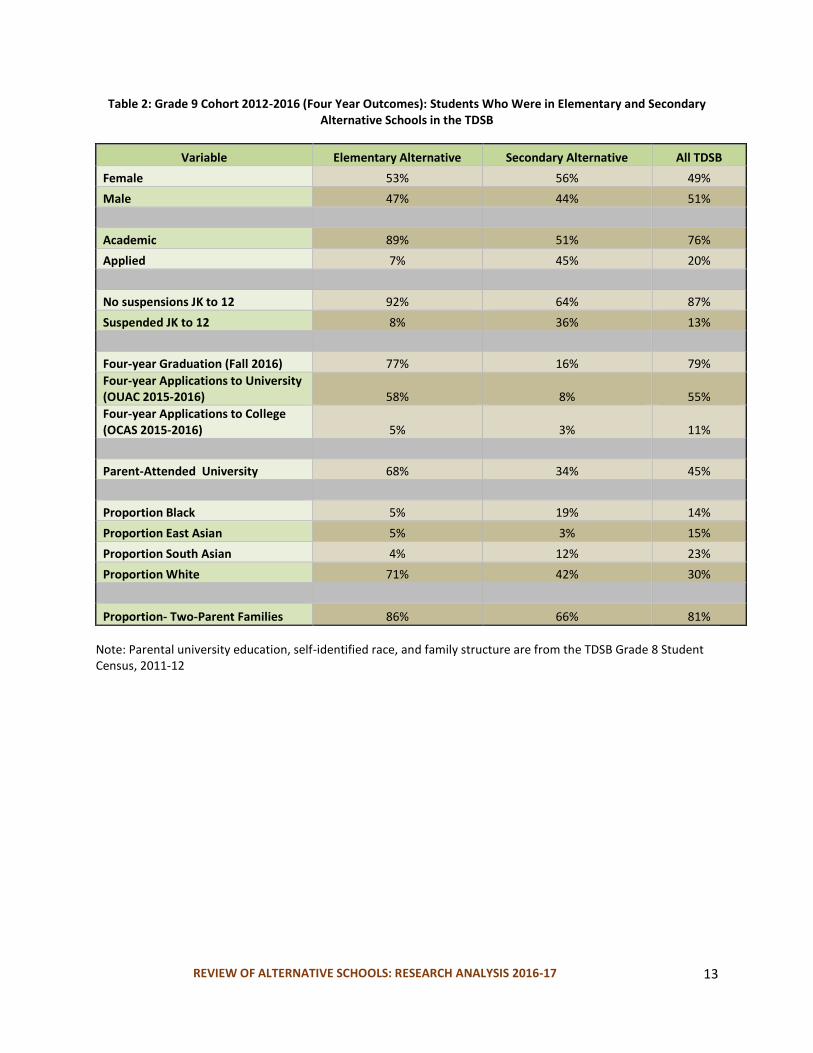
Table 2: Grade 9 Cohort 2012-2016 (Four Year Outcomes): Students Who Were in Elementary and Secondary Alternative Schools in the TDSB
Variable Elementary Alternative Secondary Alternative All TDSB
Female 53% 56% 49%
Male 47% 44% 51%
Academic 89% 51% 76%
Applied 7% 45% 20%
No suspensions JK to 12 92% 64% 87%
Suspended JK to 12 8% 36% 13%
Four-year Graduation (Fall 2016) 77% 16% 79%
Four-year Applications to University (OUAC 2015-2016) 58% 8% 55%
Four-year Applications to College (OCAS 2015-2016) 5% 3% 11%
Parent-Attended University 68% 34% 45%
Proportion Black 5% 19% 14%
Proportion East Asian 5% 3% 15%
Proportion South Asian 4% 12% 23%
Proportion White 71% 42% 30%
Proportion- Two-Parent Families 86% 66% 81%
Note: Parental university education, self-identified race, and family structure are from the TDSB Grade 8 Student Census, 2011-12
REVIEW OF ALTERNATIVE SCHOOLS: RESEARCH ANALYSIS 2016-17 13
Part III: Consultation Sessions
Introduction Four consultation sessions were held at three sites in February/March 2017 (Eastern Commerce
site, 5050 Yonge, Western Technical/CI). The sessions were attended by members of the
general public, parents of students attending alternative schools, and TDSB teachers, among
others. The sessions started with a presentation of a short analysis on Alternative Schools by
Research and Information Services, and a short overview of the current Alternative School
system.
Following the presentation, discussion centred on four questions. Three examined
challenges/benefits of:
• alternative schools (elementary/secondary)
• increasing the number of alternative schools
• increasing the number of pathways
The fourth question asked for suggestions for professional development to staff that would be
beneficial to students. This will be examined in Section V.
Methodology Notes were taken from the four consultation sessions; and letters/emails sent following the
consultation session were added. The final version of the information was taken at the end of
the first week of July 2017. A content analysis was undertaken using the NVivo 11 qualitative
software. A great deal of thematic overlap was found in the three questions, and therefore the
analysis examined results of all three at once.
REVIEW OF ALTERNATIVE SCHOOLS: RESEARCH ANALYSIS 2016-17 14
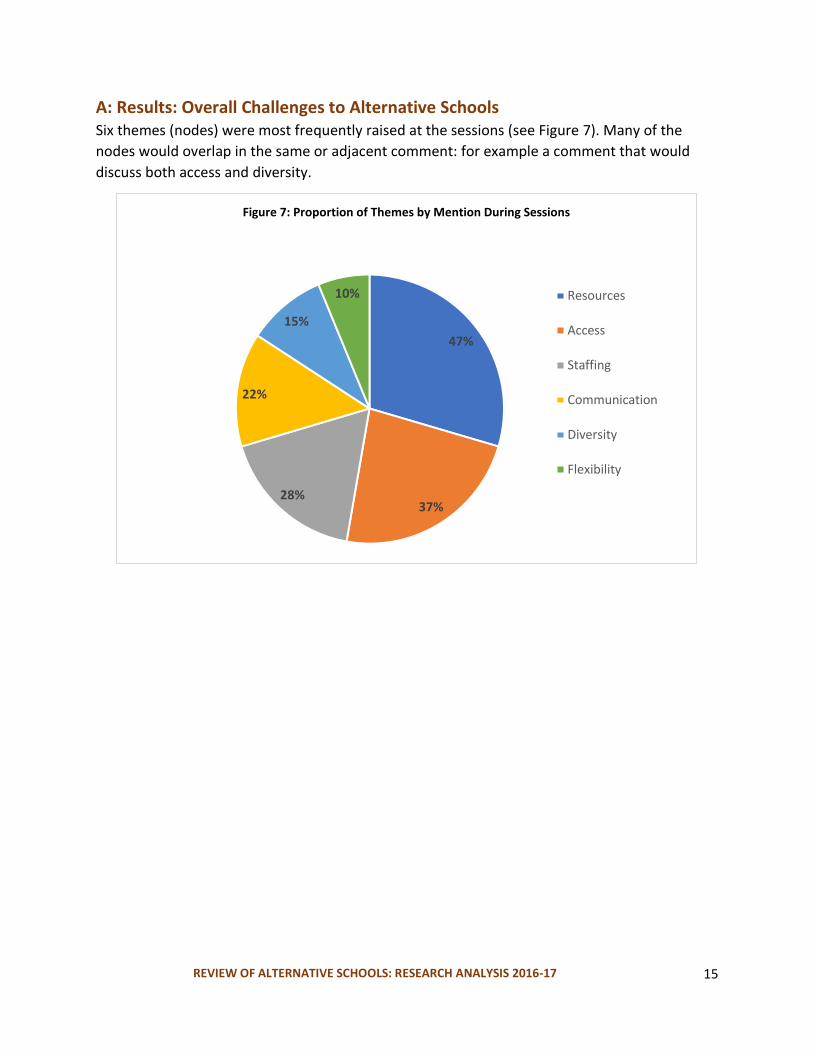
A: Results: Overall Challenges to Alternative Schools Six themes (nodes) were most frequently raised at the sessions (see Figure 7). Many of the
nodes would overlap in the same or adjacent comment: for example a comment that would
discuss both access and diversity.
47%
37% 28%
22%
15%
10%
Figure 7: Proportion of Themes by Mention During Sessions
Resources
Access
Staffing
Communication
Diversity
Flexibility
REVIEW OF ALTERNATIVE SCHOOLS: RESEARCH ANALYSIS 2016-17 15
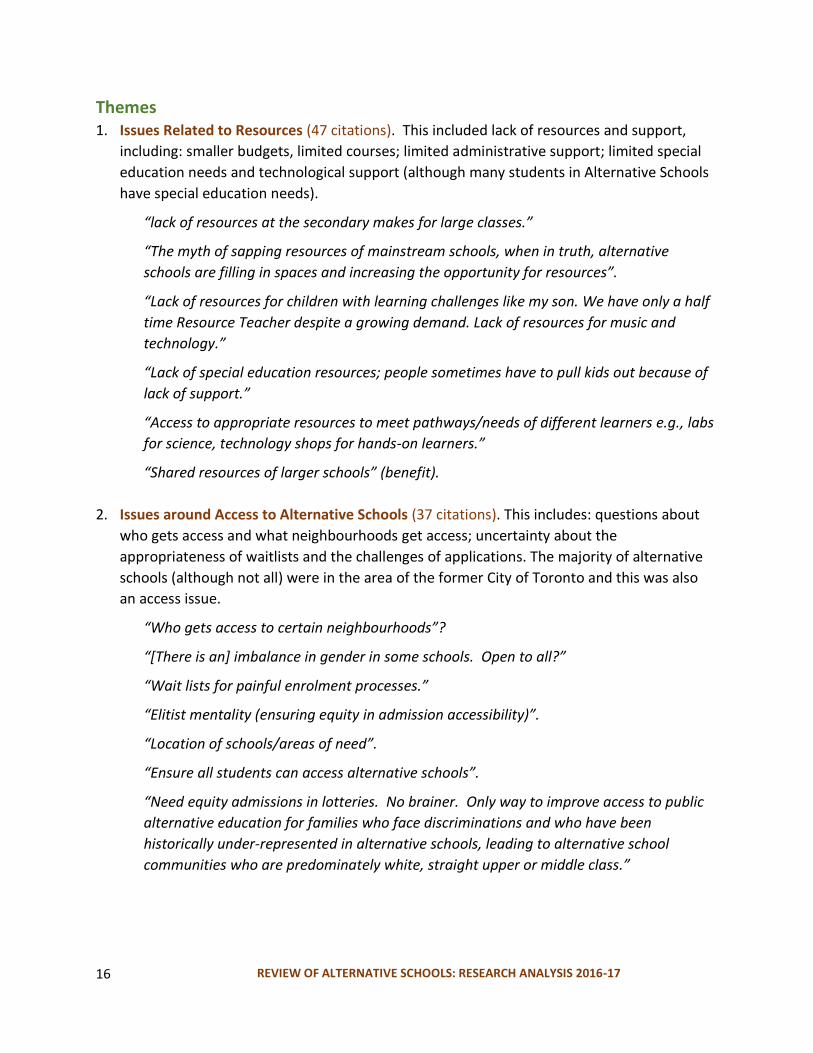
Themes 1. Issues Related to Resources (47 citations). This included la ck of resources and support,
including: smaller budgets, limited c ourses; limited a dministrative support; limited sp ecial
education needs and technological support (although many students in Alternative Schools
have special education needs).
“lack of resources at the secondary makes for large classes.”
“The myth of sapping resources of mainstream schools, when in truth, alternative
schools are filling in spaces and increasing the opportunity for resources”.
“Lack of resources for children with learning challenges like my son. We have only a half
time Resource Teacher despite a growing demand. Lack o f resources for music and
technology.”
“Lack of special education resources- people sometimes have to pull kids out because of
lack of support.”
“Access to a ppropriate resources to m eet pathways/needs of different learners e.g., labs
for science, technology shops for hands-on learners.”
“Shared resources of larger schools” (benefit).
2. Issues around A ccess to Alternative Schools (37 citations). This includes: questions about
who gets access and what neighbourhoods get access; uncertainty about the
appropriateness of waitlists and the challenges of applications. T he majority of alternative
schools (although not all) w ere in the area of the former City of Toronto and this was also
an access issue.
“Who g ets access to certain neighbourhoods”?
“[There is an\ imbalance in gender in some schools. Open to all?”
“Wait lists for painful enrolment processes.”
“Elitist mentality (ensuring equity in admission accessibility)”.
“Location of schools/areas of need”.
“Ensure all students can access alternative schools”.
“Need equity admissions in lotteries. No b rainer. Only way to imp rove access to p ublic alternative education for families who f ace discriminations and who h ave been
historically under-represented in alternative schools, leading to a lternative school
communities who a re predominately white, straight upper or middle class.”
REVIEW OF ALTERNATIVE SCHOOLS: RESEARCH ANALYSIS 2016-17 16
3. Issues Around Staffing (28 citations). There was a range of comments including the
challenge of ‘buy in’ of new staff to the schools, and finding teachers who are committed to
alternative schools; Human Resource (HR) issues such as bumping and staffing
turnover/stability.
"Alternative schools staffing - teachers can be placed at a location and not have the
background in teaching at alternative schools. Some of these teachers that are placed
around not following with the vision of the school.
"There needs to be recognition that alternative schools need to be staffed differently."
"Difference between long-time staff vs principals (admin) t hat come and go."
"Staffing of alternative schools requiring teachers to have AQ in Alternative schools."
"Getting new staff members to b uy-in to a lternative school focus (especially if sent
there)."
"Lack of special education department."
"Staffing frequent turnover is concerning."
4. Communications around Alternative Schools (22 citations). This included the difficulty of
communicating the school philosophy with parents, staff, and students; need for more
information on wait lists, sizes, and abilities of schools to grow; better promotion with the
public; better communication and outreach to diverse communities; easier access to
information on making applications to alternative schools.
“Getting information out to t he community as a whole - not just people who se ek
options out.”
“Why doesn’t every parent get info in school packages about alternatives rather than
only feeder school info.”
“List of alternative schools should also include information on wait list, sizes and ability
of schools to g row.”
“Challenge finding out about alternative schools. Lack of promotion. Only word of
mouth.”
“Guidance Counsellors do n ot have the correct information or perception of these
schools.”
“Not enough communication about the different alternative schools in the mainstream
school.”
REVIEW OF ALTERNATIVE SCHOOLS: RESEARCH ANALYSIS 2016-17 17
5. Diversity and Alternative Schools (15 citations). Here, participants pointed out that “many
of our alternative schools do not reflect the racial and cultural diversity [of Toronto],
becoming small bubbles that do not reflect the city”.
“I am uncertain if alternative education offers any real advantage to T oronto’s education
system. I am c oncerned it enhances the natural inequities inherent in our society.”
“Lack of diversity. Barriers to a pplying for lower income, 2nd language families ...Families of colour pulling their k ids out because they are not comfortable.”
“There is a lack of diversity at many alt schools, particularly in the elementary division.”
“No E SL/Special Ed.”
“Parents are at higher socioeconomic, very homogeneous group.”
6. The Flexibility of Alternative Schools (10 citations). Participants recognized that the
flexibility of programming and teaching in an alternative school setting as a great advantage
for many students, both in the elementary and secondary school panel.
“Flexibility. More cooperative and understanding teachers ([who] understand that
students are having a rough time in life and need compromise.)”
[Student benefited from\ “a climate in which there was flexibility in the curriculum”.
“Alternative schools tend to p roduce self-directed, confident learners since they are likely
to h ave greater than usual flexibility in responding to a variety of specific needs and
learning styles”.
Based o n the analysis, Research and Information Services worked with the Professional Library
in examining representative academic articles looking at alternative schools (see Part IV).
B: Results: Challenges to Increasing the Number of Alternative Schools While there were a range of responses, four themes (nodes) w ere raised.
1. Staffing-resources (15 citations). There was a recognition that new alternative schools
could impact enrolment at regular schools. There was also a challenge with available
choices by grades.
“School facilities/locations may impose a cap that limits potential enrollment figures.”
“Recently several new alt elementary schools have opened their d oors, but almost no
new 7/8.”
“Move them to p laces where they don't negatively impact space resources of the regular
schools.”
REVIEW OF ALTERNATIVE SCHOOLS: RESEARCH ANALYSIS 2016-17 18
“The larger the number of small schools with defined program offerings/philosophies,
the greater the drain on community/neighbourhood collegiates.”
2. Space-Physical Challenges (8 citations).
“Geography - where is the demand? Where should they be placed b ased on equity?
Does that match up?”
“Space: buildings, rooms, yards. These are being found, often b y co-sharing a site with
another institution.”
“Distance from home.”
“Where to place schools- high needs area- NE/NW areas of the city.”
3. Vision (7 citations). Sustaining vision of each alternative school has its own challenges.
“Staffing - finding teachers who are committed to alternative.”
“Sustaining Vision.”
“Purpose of the schools have to be explored.”
“There would be a need for more teachers and admin who understand the model.”
4. Need for Clearer Website/More Promotion (3 citations). Suggestions o f clearer
communication.
“Website - more info re: Criteria for admissions, school philosophy, vision/mission.”
C: Results: Challenges to Increasing the Number of Pathways Here there were four key themes.
1. Continuity (or Lack of Continuity) o f Grades (20 citations). Participants pointed out the lack
of clear and consistent pathways, from JK to 12.
“No logical correlation between Primary/Junior to Elementary to Secondary.”
“Many go to specialty schools - then go to Alternatives.”
“Issues are different for P/J/I/S.”
“Need to have feeder school system.”
“It’s important - parents and students struggle when not able to c ontinue in alternative school model (move to G r 7 as well move to Gr 9).”
“Philosophies of elementary and secondary alternative school schools don’t necessarily match.”
REVIEW OF ALTERNATIVE SCHOOLS: RESEARCH ANALYSIS 2016-17 19
“Kids who have gone through alternative elementary may be forced (because they did
not get into middle or SS) to go to a large regular SS - culture shock, problems adjusting.”
2. Grade 9 and 10 Program of Study (10 citations). The challenge of having the right Grade 9 and 10 courses (often due to small numbers of students) was outlined in several ways.
“Grade 9 – a challenge since the number of compulsory courses that need to be offered
and with limited staff.”
“Meeting different levels e.g. applied/academic (college/university).”
“Not able to meet all secondary programs (open, applied, academic, college, university,
locally developed mixed.”
3. Equity (6 citations). The issues of socio-economic and demographic diversity, outlined
earlier, were raised here as well.
“Diversity issues mentioned above so that a wider population is coming and contributing
to Alt ernative schools. It seems that there needs to b e more middle alternative schools
in our area as the waiting lists are long.”
“Alternative schools do not reflect diversity of community.”
4. Staffing was raised as a possible challenge to pathways with 5 citations.
“Limited staff and resources means limited offerings.”
“Staffing is an issue especially hiring.”
Part IV: Examination of Academic Literature
The first direction of examining academic lit erature looked at the relationship of alternative
schools to student achievement. However, it became clear that this was a mismatch with TDSB
Alternative Schools. Specifically, in the US, alternative schools are generally f or very high risk
students; students who have been suspended o r dropped o ut; or students with special
education needs. For example Schwab et al. (2016), quoting the US Department of Education,
describes the goal of American alternative schools as education students “whose needs have
not been met in t raditional schools”. More specifically, the “typical” population is comprised of
a disproportionate number of students who are living in poverty, have a disability, experience
language barriers, have poor grades or poor attendance, and frequently en gage in disruptive
behaviors (Schwab et al., 2016, p. 194).
Instead, the literature search was modified to examine two specific t hemes: access to schools;
and issues connected t o small schools.
REVIEW OF ALTERNATIVE SCHOOLS: RESEARCH ANALYSIS 2016-17 20
A. Access to Schools/the Admission Process A scan of the literature has shown that little study has been put into the school admissions
process (alternative or otherwise) within Canada. In terms of the United States, they have 13
different types of schools with various methods of admission (Flavin, 2016). Charter schools
(requiring an application) and magnet schools (specializing in a certain area) would be most
similar to alternative schools in the TDSB. Most of the literature refers to admissions processes
for underachieving students to alternative schools. These processes include applying by choice
(for educational purposes), mandatory assignment (for disciplinary purposes), and referrals (for
therapeutic purposes). The following articles focus on the first admissions process where the
students and their parents are choosing to apply by choice for educational programming.
According to the literature, lotteries are the most prevalent form of admissions process other
than standardized testing. In terms of equality, a randomized lottery ensures that there is no
bias and every student has an equal chance of being selected. Many schools do variations of the
randomized lottery, such as where children of staff or existing sibling enrolment will take
precedent. Most studies found that a majority of students who do get admitted are White, but
applications by White students are significantly higher than students of other racial
backgrounds. Taking this into account, Hispanic and Black students were still grossly
underrepresented in the enrolment at charter and magnet schools, with the exception of those
schools that had desegregation or equity policies (Cullen et al, 2002; Kohn, 2012).
Carpenter and Clayton (2016) examined a common enrolment system, which has a centralized
process for school admissions. The centralized process allowed for parents to be more informed
of the enrolment process and provided more information about available schools in one
location. As with other selection processes, Black and Hispanic students had lower
participation rates, compared to White students.
B. Literature on Small S chools Examination of the “small school” literature came across a wide range of articles and directions.
There were two key themes: that small size led ( or did not lead) t o higher achievement; and
that smaller schools often h ad more positive relationships of students between themselves and
with staff.
Relationship to Achievement: Leithwood and Jantzi (2009) were most strongly supportive of
the positive relationship to achievement. Looking at 57 post-2000 studies on the relationship
to school size and student/organizational outcomes, they concluded that the weight of
evidence “clearly favors smaller schools”. Students who struggled at school or who were from
more challenged social and economic backgrounds were the major beneficiaries of smaller
schools. Darling-Hammond et al. (2006-07) is more circumspect about this relationship, noting
that the evidence is “more mixed” and that influences on achievement appear to be connected
with other elements of school design. Ravitz, 2010 also found that school design, as well as size
REVIEW OF ALTERNATIVE SCHOOLS: RESEARCH ANALYSIS 2016-17 21
was important: teachers in ‘reform’ model schools reported the greatest number of cultural
and institutional reforms, followed by teachers in other small schools.
Part of the difficulty in making sense of this discussion has to do with a wide variety of
definitions o f “small”. For example, Leithwood and Jantzi (2009) c aution that school sizes of
heterogeneous student populations sh ould be limited t o 600 or fewer, while the size of more
homogeneous populations c ould be at around 1,000 students. That describes the vast majority
of TDSB re gular schools; while most TDSB a lternative schools have a population of below 200,
and perhaps should be more accurately d escribed as “very small” rather than “small” schools.
More P ositive Attitudes: Darling-Hammond et al. (2006-07) claim that more recent
organizational studies “have illustrated t hat, to the extent size matters, it is because it can
create conditions conducive to other relationships and opportunities more directly re levant to
student attachment and learning” (p. 192). They advised that there is ‘no magic number’ that
describes a perfectly sized sc hool. Instead, there are conditions o f learning that are more likely
to be present in small schools, including:
• mechanisms that personalize student-teacher relationships, so students are better known and supported;
• a shared mission with emphasis on academic success, “that creates cohesiveness in the norms that this behaviour and in the context of the curriculum across grades and classes.” (Darling-Hammond et al., 2006-07, p. 193; see Dehuff 2013 for an example of this in a small K to 12 school).
These appear to be conditions t hat are at the heart of the philosophy of alternative schools in the TDSB.
C. TDSB Structured Pathways Report (Parekh, 2013) "Structured Pathways" (Parekh, 2013) has been widely circulated due to its discussion of streaming and special education, but it also had a section looking at alternative secondary schools and other school structures. There were two key findings of the report relevant here:
• Secondary school students attending alternative schools were much more likely to be at-risk: they were twice as likely to be taking non-Academic courses in Grades 9 and 10, had much lower graduation rates, and much lower post-secondary access, compared to other TDSB students. This finding is similar to the outcomes of the most recent cohort study outlined in Part II of this report.
• At the same time, students attending TDSB alternative schools had a sense of belonging that was much higher than other school structures - indeed 72% of students in alternative schools had a sense of belonging, a rate approximately the same as students attending Arts programs (see Parekh, 2013).
REVIEW OF ALTERNATIVE SCHOOLS: RESEARCH ANALYSIS 2016-17 22
This sense of belonging seems to be at the core of personalizing the relationship of the student to the school emphasized by Darling-Hammond et al. (2006-07). A logical next step would be to examine student-school relationships of alternative schools in more detail; also to see if this finding is also seen in elementary schools. This will be done in Research Evaluation, examining information from the 2016-17 TDSB Student Census when it becomes available.
Part V: Suggested Areas for Discussion/Recommendations and Next
Steps
A. Professional Development for TDSB Staff Participants in the Spring consultation were supportive of professional support for TDSB students, parents, and staff focusing on alternative schools. The Alternative Schools Review Committee might wish to examine these topics, with the intent of strengthening existing professional development existing in Alternative schools. These include (in no particular order):
• issues around Mental Health;
• Special Education - students with IEPs (issues and support)
• meetings for alternative school staff to meet teachers/staff of other alternative schools
• discussions of the vision/philosophy of the individual alternative school (including supply teachers)
• raw information about alternative schools (demographics, post-secondary pathways, etc.)
• helping parents understand options available
• platforms are needed for advocates of alternative schools to discuss advantages with those who may not be familiar.
B. Composition of Alternative and Mainstream Schools Analysis of the population of the elementary and secondary alternative schools has found that the two are almost entirely different in their composition: the elementary schools tend to have students who are from more socially advantaged backgrounds, while the secondary schools have students who are somewhat more socio-economically challenged, and much more at-risk. (There were some exceptions to this amongst both the elementary and secondary school panel).
Given that the elementary and secondary alternative school populations are so different (and there is great variation even within panels), the Alternative Schools Advisory Committee should be cautious in undertaking any ‘one size fits all’ changes.
REVIEW OF ALTERNATIVE SCHOOLS: RESEARCH ANALYSIS 2016-17 23
C. Progression Discussion in the consultation sessions looked at the possibility of a more integrated elementary and secondary alternative school system. This would be challenging in the current TDSB alternative school system. There is almost no continuity in terms of students progressing through alternative schools. Generally, most students in elementary alternative schools change schools between Grade 6 and Grade 7. For most of the students in secondary alternative schools, the alternative school is the second or third school attended. At the present time, the TDSB alternative school system is an experience of relatively sh ort duration for most students - often 1-3 years, out of the total public sc hool timeframe of 14-15 years.
That being said, the Committee might wish to explore options to see if it is possible for students to progress through the alternative school system for longer lengths of time. A physical campus of multiple alternative schools was one suggestion; other options could also be explored.
D. Grade 9 Entry into Alternative Schools The challenge of ‘program of study’/pathways in secondary alternative schools was raised during the consultation sessions. The Ontario system of having Grade 9-10 classes in either Academic, Applied, or Locally-developed, is a hurdle to providing open access to all students wishing to enter a secondary alternative school in their first year of secondary (Grade 9). There is something of a chicken-and-egg tautology at present. Without the availability of a wide range of Grade 9 Academic and Applied courses, it is difficult for all students to directly enter a secondary alternative school directly from elementary. Yet, a) the very small size of secondary alternative schools, coupled with b) the reality that most secondary alternative schools cater to students in their second to fourth secondary year, restricts the ability to offer such a range of Grade 9 courses.
Short of a change in the current Ontario program of study structure, or a change in the composition of secondary alternative schools, a way out of this contradiction is not easily apparent.
E. Alternative School Demographics Consultation group discussions raised the general socio-economic advantage of alternative school students compared to other students. (Although it was difficult to clearly differentiate from the transcripts, it is probable that participants were referring more to the elementary, rather than secondary, alternative schools). However, since most students attending elementary alternative schools already live outside the immediate neighbourhood of the school, it is not clear that the physical location of the alternative school is, in itself, the deciding factor in attending an alternative school. Changing the socio-economic makeup of elementary alternative schools would require changes outside of the location of the school.
REVIEW OF ALTERNATIVE SCHOOLS: RESEARCH ANALYSIS 2016-17 24
F. Locations of Alternative Schools There is however, the larger picture of where alternative schools are located. Generally the locations of alternative schools are closely related to practices of pre-amalgamation. The majority of alternative schools are located in the boundaries of the former Toronto Board, in East Scarborough, and northern North York (the Avondale schools). Once some of the issues previously mentioned are resolved, locating programs outside the current locations might be a useful step.
G. Potential for Improvement Available research shows that schools that emphasize student-teacher relationships/support, and a shared mission/vision, are conditions that allow school improvement. Likewise, earlier TDSB research (Parekh 2013) has shown that TDSB secondary alternative schools tend to have a high sense of ‘belonging’. That being said, these are conditions for school improvement; they are not in themselves the cause of improvement. The varied nature of the TDSB alternative school system makes a clear link to improved achievement difficult, but the evidence of the potential for improvement exists.
Next Steps
1. Most of the students in TDSB elementary and secondary alternative schools completed the
2016-17 TDSB Student Census (i.e., Grades 4 to 12). This provides an opportunity to
examine student attitudes and responses associated with belonging and student
engagement, which we can link to our current information on TDSB alternative schools.
2. Respondents repeatedly referred to the visions of individual alternative schools. It may be
useful to put the visions/mission statements of all elementary and secondary schools into a
matrix, to examine similarities, differences, and how the visions/missions may connect with
other information.
REVIEW OF ALTERNATIVE SCHOOLS: RESEARCH ANALYSIS 2016-17 25
References
Carpenter II, D. M. & Clayton, G. (2016). Does common enrollment work?. Educational Leadership, 74(3).
Cullen, J. B., Jacob, B. A., & Levitt, S. (2002). Does school choice attract students to urban public schools? Evidence from over 1,000 randomized lotteries. Ann Arbor, MI: University of Michigan.
Darling-Hammond, L., Ross, P., & Milliken, M. (2006/2007). High school size, organization, and content: What matters for student success? Brookings Papers on Education Policy, No. 9 (2006/2007), pp. 163-203.
Dehuff, P. (2013). Students' wellbeing and sense of belonging: A qualitative study of relationships and interactions in a small school district. Doctoral Dissertaion, Washington State University.
Flavin, B. (2016, July 4). The ultimate guide to 13 different types of schools across America [Web log]. Retrieved from http://www.rasmussen.edu/degrees/education /blog/types-of-schools/.
Kohn, A. (2012). Whom we admit, what we deny: The meaning of selective admissions. Independent School, 71(2). Leithwood, K., and Jantzi, D. (2009). A review of empirical evidence about school size effects: A policy perspective. Review of Educational Research, 79(1), pp. 464-490.
Parekh, G. (2013). Structured pathways: An exploration of programs of study, school-wide and in-school programs, as well as promotion and transference across secondary schools in the Toronto District School Board. (Research Report No. 13/14-03). Toronto, Ontario, Canada: Toronto District School Board.
Ravitz, J. (2010). Beyond changing culture in small high schools: Reform models and changing instruction with project-based learning. Peabody Journal of Education, (85), 290-312.
Schwab, J.R., Johnson, G.Z., Ansley, M.B., Houchins, E.D., & Varjas, K. (2016). A literature review of alternative school academic interventions for students with and without disabilities, preventing school failure. Alternative Education for Children and Youth, 60(3), 194-206, DOI: 10.1080/1045988X.2015.1067874.
REVIEW OF ALTERNATIVE SCHOOLS: RESEARCH ANALYSIS 2016-17 26

REVIEW OF ALTERNATIVE SCHOOLS: RESEARCH ANALYSIS 2016 17 27
-