Embed Size (px)
Citation preview
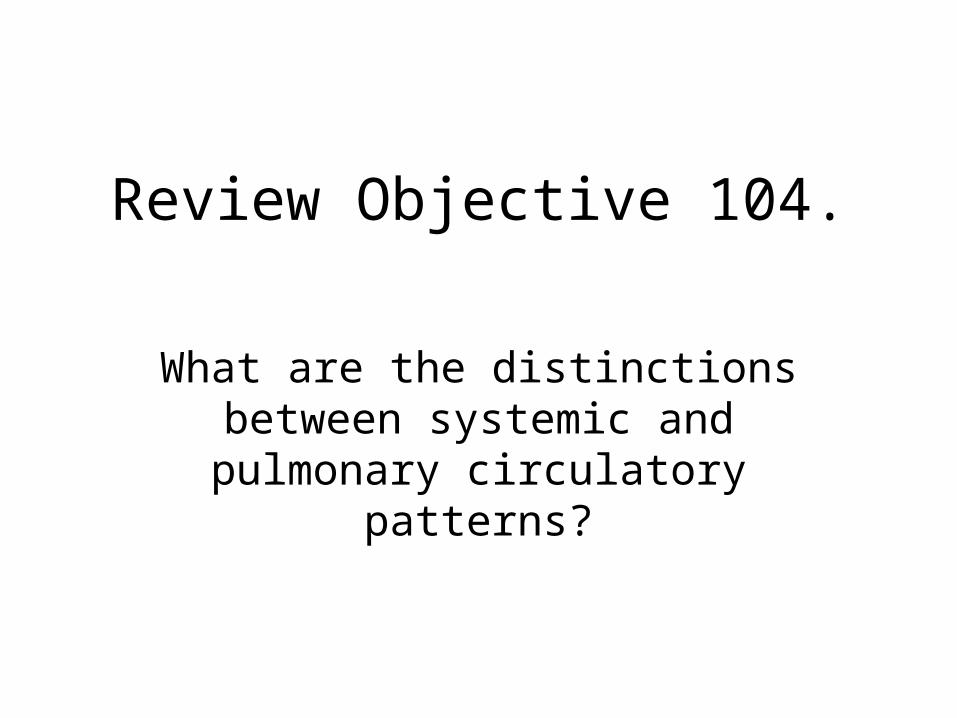
Review Objective 104.
What are the distinctions between systemic and pulmonary
circulatory patterns?
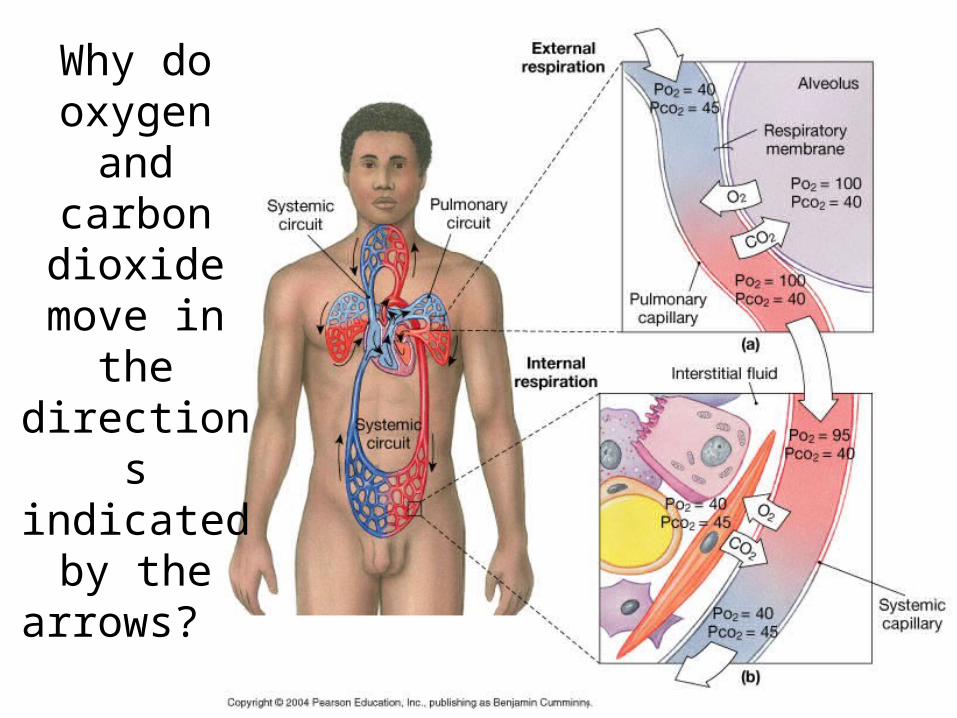
Why do oxygen and
carbon dioxide move
in the directions
indicated by the arrows?

The hemoglobin
molecule(Fig. 10.29)

It will help us understand the role of hemoglobin if we know how hemoglobin is studied in
the lab.


Oxygen-hemoglobin saturation curve.
Fig. 10.30a

Choose a Po2 value, go up to
the curve, then read across to
the value of the %
saturation.


How do we use this curve to understand hemoglobin’s ability to deliver oxygen from
the lungs to the tissues?
• We need to know the % saturation of hemoglobin in the lungs and in the tissues.
• We need to remember that an increase in % saturation means that hemoglobin has picked up O2. (Where did the O2 come from?)
• We need to remember that a decrease in % saturation means that hemoglobin has released O2. (Where did the O2 go?)

What Po2 values
are shown ?

Po2 values
• Pulmonary Arteries = 40 mm Hg
• Blood goes through pulmonary capillaries
• Pulmonary Veins =100 mm Hg
• Systemic Arteries = 95 mm Hg
• Blood goes through systemic capillaries
• Systemic Veins = 40 mm Hg


13b. How much of the hemoglobin lost its oxygen in going from systemic
arteries to systemic veins?
Location Po2 % saturation
Systemic arteries
95 mm Hg 97%
Systemic veins
40 mm Hg 75%
Difference 22%

This means that 22% of the hemoglobin loses its oxygen as it passes from the systemic arteries
to the systemic veins.
• Where does this oxygen go?


This means that oxygen is released to cells when the per cent saturation of hemoglobin
decreases.• What does it mean when there is an
increase in per cent saturation of hemoglobin?
• Where would you expect to see an increase in per cent saturation of hemoglobin?

There is something about this curve that
should bother you.

What is the functional
significance of the
distinctive shape of this
curve?

Now let’s consider other experiments that provide more information on
hemoglobin’s ability to transport oxygen.• Change the pH
• Change the pCO2
• Change the temperature• Use a different hemoglobin (let’s try from a fetus!)• Use a different respiratory pigment (let’s try
myoglobin, a monomeric respiratory pigment found in muscle fibers)

Increasing the pCO2 or [DPG] has the same effect as
decreasing the pH.
(see Figs. 10.32 & 10.35)

See Fig. 10.34

Where in the circulatory system would you expect these shifts to
occur?


Note the difference between the curves of
hemoglobin and myoglobin. See Fig. 10.31
for an explanation.


![[PPT]Chapter 12: The Circulatory System - Florida …med.fsu.edu/userFiles/file/Chapter 12 Circulatory System... · Web viewCirculation overview: Pulmonary circulation Systemic circulation](https://img.pdfslide.us/doc/110x75/5b5d0cb07f8b9a9c398d53ab/pptchapter-12-the-circulatory-system-florida-medfsueduuserfilesfilechapter.jpg)