Embed Size (px)
Citation preview
Prepared by consortium of TATA POWER DDL, MIT–COMILLAS UEA Lab & EcoSecure Holding and REG
Review Assessment of current electrification
programs prepared by REG / EDCL and
confirmation on institutional, technical and
financial aspects
TASK 2 Report. Design of the National
Electrification Plan in Rwanda

NESP Task-2 final report 2
Copyright @ 2015, Mininstry of Infrastructures, Rwanda Energy Group
This publication may be reproduced in whole or in part and in any form for educational, research and/or
nonprofit purposes without special permission from the copyright holder, provided acknowledgement of the
source is made. Rwanda Energy Group (REG) would appreciate receiving a copy of any publication or article
that uses this report as a source.
No use of this publication or any of its contents may be made for resale or for any other commercial purpose
whatsoever without prior permission in writing of the Rwanda Energy Group (REG).
This is a Government of Rwanda Publication.
For bibliographic and reference purposes, this publication should be referred to as: “REG (2019), The National
Electrification Plan: Report on definition of technologies (On-grid and off-grid) at village level”

NESP Task-2 final report 3
Table of Contents
Production and Editorial Teams .............................................................................................................................. 6
Abstract ................................................................................................................................................................... 7
1 Least-cost planning using the Reference Electrification Model ...................................................................... 8
1.1 Lessons learned from past electrification plans and strategies in Rwanda .............................................. 8
1.2 The Reference Electrification Model: A decision support tool for the development of the Rwandan
National Electrification Plan ............................................................................................................................... 9
1.2.1 Context ............................................................................................................................................. 9
1.2.2 Objectives and methodology: REM Techno-Economic Procedure for Least-Cost electrification
planning 9
1.2.3 Different types of input data........................................................................................................... 12
1.2.4 Sensitivity analysis (qualitative) .................................................................................................... 15
2 Setting the main design features for the NEP ................................................................................................ 18
2.1 Input data, inferences and main assumptions......................................................................................... 18
2.1.1 Location and characterization of expected demand ....................................................................... 18
2.1.2 Existing infrastructure .................................................................................................................... 22
2.1.3 Off-grid generation techno-economical catalogue ......................................................................... 24
2.1.4 Topographical restrictions .............................................................................................................. 25
2.2 REM algorithmic configuration ............................................................................................................. 26
2.3 Selection of Reference Case Scenario for the NEP ............................................................................... 27
3 Techno-economic least-cost plan for Universal Access in 2024 ................................................................... 28

NESP Task-2 final report 4
3.1 Techno-economic optimum for the Reference Case Scenario: Global results for Rwanda ................... 28
3.1.1 Rwanda National Electrification Plan system map ........................................................................ 30
3.1.2 Costs breakdown of individual grid extension and microgrids. ..................................................... 34
3.1.3 Solar Kits and Stand-Alone Systems in the Reference Case Scenario........................................... 36
3.1.4 Rwanda National Electrification Plan: villages map ...................................................................... 37
ANNEX 1: Detailed analysis of past electrification plans and strategies in Rwanda ........................................... 40
Castalia Master Plan Study (2009) .................................................................................................................... 41
Context .......................................................................................................................................................... 41
Objectives ...................................................................................................................................................... 42
Assumptions .................................................................................................................................................. 42
Inputs ............................................................................................................................................................. 44
Methodology.................................................................................................................................................. 45
Selection of Least-cost Electrification Option (for each sublocation)........................................................... 47
Report Conclusions and Recommendations .................................................................................................. 49
Sofreco Master Plan Study (2013) .................................................................................................................... 52
Context .......................................................................................................................................................... 52
Objectives ...................................................................................................................................................... 53
Assumptions .................................................................................................................................................. 53
Inputs ............................................................................................................................................................. 54
Methodology.................................................................................................................................................. 54

NESP Task-2 final report 5
Report Conclusions and Recommendations .................................................................................................. 60
Sofreco vs. Castalia ........................................................................................................................................... 62
Master Plan Comparison ............................................................................................................................... 62
Evolution of the Rwandan Energy Sector Strategy ........................................................................................... 66
ANNEX 2: RCS REM input catalogue tables ....................................................................................................... 69
Network catalogue ............................................................................................................................................. 69
Generation catalogue ......................................................................................................................................... 70

NESP Task-2 final report 6
Production and Editorial Teams
Rwanda Energy Group Staff
▪ Fredrick Kazungu: Director of Energy Planning in EDCL
▪ Eric Mihigo: Head of Investment and Projects Planning in EDCL
▪ Roselyne ISHIMWE: GIS Specialist and Focal person for the National Electrification Plan in EDCL
▪ Kobus van Zyl: Director of Planning in REG
TATA POWER DDL, MIT & IIT- COMILLAS UEA Lab and EcoSecure Holdings
1. Andres Gonzalez-Garcia
2. Cailinn Drouin
3. Pedro Ciller
4. Ignacio Pérez-Arriaga:
5. Robert Stoner

NESP Task-2 final report 7
Abstract
The government of Rwanda recognizes the vital role that electricity access plays in accelerating economic
development through improving health and standards of living. Energy and particularly access to electricity is
Government’s key priority. This is why significant investments have been made and progress registered led to
over 40.5% of households getting access to electricity by August 2017 and why the government has set the target
of Universal Electrification for the year 2024.
The aforementioned initiative to extend access to electricity involves a coordinated effort across all power sector
participants to connect new customers, focusing also on powering productive activities.
This document focuses on the definition of the “Grid Service Area”, incumbent to EUCL. According to the
institutional design established by REG – EDCL in the project, this Grid Service Area comprises (a) the customers
selected for a connection to the Rwandan Central Distribution Network and (b) the customers that will receive
their electricity supply through an isolated grid-compatible microgrid, as REG–EUCL will also take responsibility
for the investment, implementation and maintenance of the microgrid networks, as well as for the electricity retail
business with the customers base (bill collection, quality assurance and customer management), taking care of the
appropriate remuneration of the Independent Power Providers (IPPs) that will supply electricity to each microgrid.
The least-cost achievement of Universal Access in Rwanda will also require the supply of DC Solar Kits for low-
demand residential customers (below 50 Wp as defined by EDCL). It will also determine where a full-fledged
stand-alone AC solar system should be provided to larger customers who are too isolated from the network and
from other customers to techno-economically justify an individual connection to the central grid or an off-grid
microgrid.
This Task 2 Report will serve as a base for discussion of the institutional arrangements, grid and off-grid tariff
calculation, remuneration of IPPs, financial implementation and other regulatory and energy policy mechanisms
with all the involved stakeholders, that will be finally specified along with the detailed description for the
Implementation of the National Electrification Strategy NES (Task 3) and the detailed Preparation of the National
Electrification Plan NEP (Task 4).
Keywords: Universal Access to Electricity, least-cost planning, grid extension, off-grid electrification, grid-
compatible micro-grids, solar kits.
Authors:

NESP Task-2 final report 8
1 Least-cost planning using the Reference Electrification Model
1.1 Lessons learned from past electrification plans and strategies in Rwanda
In 1991 the first electrification master plan for Rwanda was drafted by Hydro Québec International with a
planning horizon reaching to 2010 (Fichtner and Republic of Rwanda EWSA, May 2011). The electrification
plans, policies, and programs which followed in the years leading up to present day Rwanda will be discussed in
further detail in ANNEX 1: Detailed analysis of past electrification plans and strategies in Rwanda of this report,
but as the references are many, a timeline has been provided to assist the reader in following the narrative. Items
referenced in this report are shown in blue text in Figure 1, with the two reports which constitute the main focus
of the discussion displayed in bold font. Any items shown in grey have been included for context only and do
not figure materially into the report.
Figure 1: Timeline of Electrification Plans, Policies, and Programs in Rwanda
For this project, the two master electrification plan reports identified, those written by the consultants Castalia
and Sofreco, respectively, have been reviewed along with their supporting documents for the purposes of
identifying the methodology followed by each in the creation of a national electrification plan for Rwanda. The
two methodologies will then be compared in order to identify common elements, unique attributes, strengths, and
weaknesses. These findings, as detailed in ANNEX 1, have been used to form the basis of a critique of the
capabilities of the Reference Electrification Model, so that recommendations may be formed concerning both the
future use and development of this techno-economic planning tool.

NESP Task-2 final report 9
1.2 The Reference Electrification Model: A decision support tool for the
development of the Rwandan National Electrification Plan
1.2.1 Context
The Reference Electrification Model (REM) developed jointly by the Massachusetts Institute of Technology
(MIT) and Universidad Pontifical Comillas Institute for Research in Technology (IIT) addresses the need for a
tool that supports decision making on which technology to use to electrify any given area (cell, village or group
of individual customers), through application of techno-economic modelling. It allows decision makers and
planners to apply policy objectives and given assumptions to the physical landscape and existing infrastructure,
using scientific data to calculate the most viable solutions.
The outputs provided by REM rely on a combination of ground data, calculated assumptions and strategic
decision-making, and as such, the tool should be used in close interaction with the lead agency and departments
for planning.
1.2.2 Objectives and methodology: REM Techno-Economic Procedure for Least-Cost electrification
planning
The REM consists of two major steps: (1) clustering using a bottom-up approach and (2) final decision on the
best electrification mode for each cluster.
Prior to step 1, in order to avoid multiple detailed evaluations of the optimal generation mix for each one of the
many cluster combinations that REM has to try, REM calculates optimal generation designs for representative
off-grid systems and stores the corresponding data in a look-up table.
In order to find these generation designs REM minimizes costs (both investment and operation cost plus a penalty
for the amount of demand that is not met) using an optimization strategy with a master/slave strategy. The master
part makes decisions about the design variables, using a direct pattern search approach, and the slave part performs
a simulation with a load following dispatch strategy for each representative microgrid (other dispatch strategies
have been included in other versions of REM).
If in the clustering or in the final designs algorithms REM needs information related to a generation design that
is not in the look-up table, it interpolates using the closest designs. The generation technologies that REM
presently considers are solar, batteries and diesel generation. The cost of the charge controllers and inverters is
also included (if needed).

NESP Task-2 final report 10
1.2.2.1 STEP 1. Clustering.
REM groups a large number of buildings into potential electrical sub-systems. This step is very important, because
it will condition the spatial distribution of off-grid and on-grid systems. Since the number of possibilities for this
is unmanageable in an exhaustive way, REM implements the following strategy:
a. A systematic bottom-up greedy algorithm, based in local decisions, to build clusters at two hierarchical
layers, as shown in Figure 1. The first layer is built with off-grid assumptions, and the second layer with
grid-extension assumptions.
b. Local decisions depend on the balance between savings (size-related economies of scale) and extra costs
(network investments to connect buildings).
c. Economies of scale may derive from administrative or business models, network components/designs and
generation components/designs. The results depend critically on accurate inputs or estimations of these
size-related factors.
d. Since the number of possible local decisions may be huge in real-life problems, some simplifications are
applied:
i. Connectivity options are limited to the sub-set of most promising grouping solutions identified
through graph theoretical results.
ii. Extra network costs are estimated by simplified representations of the networks.
iii. Generation costs are obtained interpolating in the look-up table calculated in the generation
sizing block of REM.
Figure 2: Example of structure of clusters (results from the clustering process)
For the Rwanda NEP, the minimum size of any Grid Extension cluster (GE) has been set by EDCL to the level
of an administrative village. Therefore, either the whole village is connected to the grid, or it will all be electrified
off-grid (with a combination of microgrids and stand-alone solar kits).
NESP Task-2 final report 11
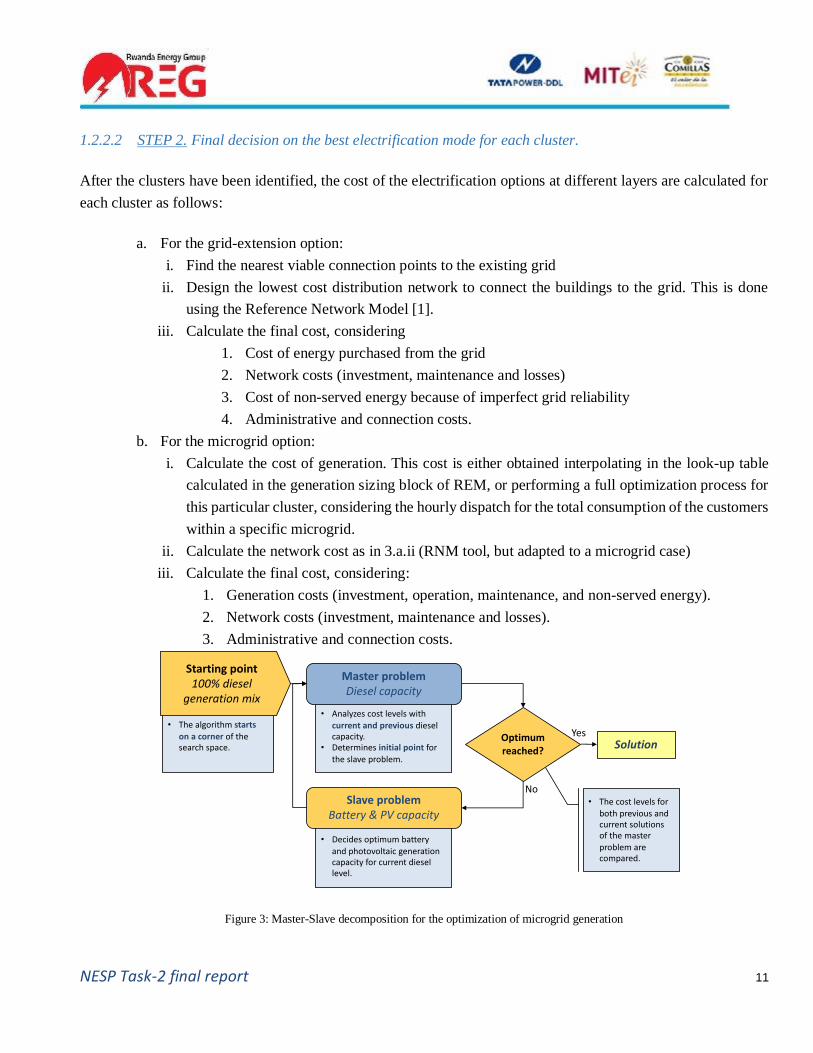
1.2.2.2 STEP 2. Final decision on the best electrification mode for each cluster.
After the clusters have been identified, the cost of the electrification options at different layers are calculated for
each cluster as follows:
a. For the grid-extension option:
i. Find the nearest viable connection points to the existing grid
ii. Design the lowest cost distribution network to connect the buildings to the grid. This is done
using the Reference Network Model [1].
iii. Calculate the final cost, considering
1. Cost of energy purchased from the grid
2. Network costs (investment, maintenance and losses)
3. Cost of non-served energy because of imperfect grid reliability
4. Administrative and connection costs.
b. For the microgrid option:
i. Calculate the cost of generation. This cost is either obtained interpolating in the look-up table
calculated in the generation sizing block of REM, or performing a full optimization process for
this particular cluster, considering the hourly dispatch for the total consumption of the customers
within a specific microgrid.
ii. Calculate the network cost as in 3.a.ii (RNM tool, but adapted to a microgrid case)
iii. Calculate the final cost, considering:
1. Generation costs (investment, operation, maintenance, and non-served energy).
2. Network costs (investment, maintenance and losses).
3. Administrative and connection costs.
Figure 3: Master-Slave decomposition for the optimization of microgrid generation
• The algorithm starts
on a corner of the search space.
• Decides optimum battery and photovoltaic generationcapacity for current diesel level.
Slave problemBattery & PV capacity
Optimum reached?
SolutionYes
No
• Analyzes cost levels with
current and previous dieselcapacity.
• Determines initial point for the slave problem.
Master problemDiesel capacity
Starting point100% diesel
generation mix
• The cost levels for
both previous and current solutions of the master
problem are compared.

NESP Task-2 final report 12
c. For the single-building option: If the peak load of the customer is less than 50Wp, then this cost
corresponds to that of the Solar Kit specified by EDCL for those consumers. If the consumption is
higher (isolated productive or community loads), proceed as in the microgrid case, except for the
network design and cost steps (no network present).
d. After the cost of the three electrification modes is calculated, the lowest-cost combination of clusters
and their electrification modes is picked. Figure 2 shows a case in which the optimum solution is
made of one grid-extension (groups “A” and “B” of customers), one microgrid (group “C”), and a
set of isolated systems (group “D”). There is also the possibility of biasing solutions to be of
particular types, by overriding the minimum-cost criteria to some extent.
Therefore it is important to notice that no heuristic rule is applied for the determination of the electrification mode
(grid or off-grid), either based on the distance to the grid or density of load, but instead a thorough calculation of
the actual implementation cost for each mode (grid extension, microgrid or solar kit/stand-alone system) is
performed before the final decision is taken, based on pure techno-economic and social criteria.
Figure 4: Example of minimum-cost electrification solution
1.2.3 Different types of input data
As said before, the outputs provided by REM rely on a combination of ground data, calculated assumptions
and strategic decision-making. The classification of inputs into these three groups is not always clear, so the
following is just a reasonable example.

NESP Task-2 final report 13
1. Ground data. Inputs that are considered fixed data (although they may represent future plans or states of the
system)
a. Location of buildings (and therefore also the population density). It is necessary to know the latitude
and longitude of all buildings in the study area, as well as the type of building if different types of
demand profiles are used.
b. Existing distribution feeders (MV), and therefore the distances from buildings to the existing grid.
The location of the existing distribution feeders and transformers must be obtained for the study area.
In the absence of this data, it is possible to estimate it with the RNM tool (greenfield mode), provided
that the already electrified customers are given.
c. Energy resources (solar power availability, diesel cost if available and allowed, micro-hydro sites).
The availability of different energy resources in a given area is necessary in order to determine the
suitability of different types of generation.
d. Topography data (altitude map and penalized areas). RNM and REM use these data to design networks
and incorporate restrictions in the clustering step.
2. Calculated assumptions. Inputs that are adjustable to different scenarios.
a. Grid energy cost. Cost of energy estimated at MV feeders.
b. Grid reliability. Reliability of the supply of electricity from the existing grid. This value can be
expressed either as a single overall percentage, or broken up into hourly-related percentages (off-peak
reliability, peak reliability and so on). Reliability is important to the concept of CNSE. It could also
be linked to grid-energy cost figures, in case of evaluating generation and grid reinforcements in future
scenarios.
c. Demand profiles (critical and non-critical, demand growth rate). Following the classification of
buildings, the demand for each building needs to be characterized. To design electrification solutions
for un-electrified buildings it is necessary to estimate how much electricity each building might
consume if it had access to electricity. Since the model will try to meet specified demand at the lowest
techno-economic cost, more detail about demand at each individual load point is likely to have an
influence on the results. Once the demand profile is constructed, it must be classified into one of two
tiers: 1) essential or critical load (e.g., lighting) or 2) non-critical load (e.g., television).
d. Network components (catalogue of lines and transformers). Power capacity and cost characteristics
are the most relevant parameters.
e. Microgrid generation components (catalogue of PV panels, batteries, diesel generators, and power
conversion equipment)
3. Strategic decision-making. Inputs that are related to social and business models.
a. Administrative costs. They account for the general management cost of the system and they may have
different values for different electrification modes, and economies of scale depending on the size of
NESP Task-2 final report 14
the systems. These costs are calculated differently for off-grid and grid extension systems. In REM,
the administrative cost of a system only depends on its number of consumers. The input parameters
that REM requires to calculate this cost are the administrative cost of a small, medium-size and large
microgrid as well as the number of consumers of a small and a medium-size microgrid (REM assumes
that the number of consumers of a large microgrid is equal to the total numbers of consumers of the
case study).
In an off-grid system the administrative cost is approximated with an analytic expression, which is
calculated with these input parameters. Specifically, the model uses an exponential function in order
to ensure that the per-consumer administrative costs is a decreasing function of the number of
consumers.
The administrative cost of a grid extension is calculated with a constant per-consumer cost (it does
not depend on size of the system) equal to the input parameter assigned to a large microgrid. This
ensures that the administrative cost of a grid extension is always lower than the administrative cost of
a microgrid.
b. Cost of Non-Served Energy (CNSE). REM is basically a cost-driven tool, so the lack of
quality/reliability of power supply must be translated to cost (it may also be imposed as a constraint
in the case of microgrids). CNSE is the cost, to consumers, of energy that is not served. This concept
is actually quite subjective, but is intended to represent the cost (i.e., the loss of utility) incurred by
consumers when there is no electricity at a time when they were planning to use it. REM requires two
values for CNSE, one for essential load and another for nonessential load. There could be multiple
ways of arriving at a value for CNSE, but one way of calculating CNSE value is to adopt -as a proxy-
the cost of an alternative energy solution (e.g., kerosene) that might be used when electricity is not
available.
When it comes to calculating the cost of non-served energy, REM applies different procedures with
off-grid systems and grid extension designs. In off-grid systems REM multiplies each amount of
demand (essential and nonessential) that is not met by the dispatch algorithm by the corresponding
penalty. On the other hand, with grid extension designs REM assumes that the non-served energy is
split homogenously between essential demand and nonessential demand before multiplying these
numbers by the corresponding penalties. For example, if the grid has a 90% reliability and the essential
and nonessential demands in an hour are 5 kWh and 1 kWh then REM assumes that there are 0.5 kWh
and 0.1 kWh of non-served essential and nonessential demand in that hour, respectively.
c. Minimum microgrid quality/reliability of power supply. In addition to CNSE, this constraint may also
imposed in the case of microgrids, in terms of percentage of energy served.
d. Discount rate, needed to translate upfront investments to annuities. It is related to the
business/investment models. Different values may be set for different electrification modes
NESP Task-2 final report 15
e. Grid connection criteria. Some practical criteria may be applied to bias grid connection of customers
that are not too far from the grid (and not far from other customers). This may be not consistent with
cost minimization, but related to social or political strategies.
1.2.4 Sensitivity analysis (qualitative)
The different inputs described in the previous section are analyzed here with respect to their influence on the
expected results. The proposed classification and terms is respected, but two intermediate results are also used in
the explanations, i.e., economies of scale and size.
• Economies of scale, as said before, are the basis for local clustering decisions. They are also critical in the
“detailed design” step. Since they may derive from different sources or inputs, they will be mentioned
explicitly along the explanations
• Size of clusters (or sub-systems), in terms of number of buildings connected to each other. It is an
intermediate result from clustering that may affect a lot the final solutions. Size is affected in different
ways by different inputs, and therefore it will be used in the cause-effect reasoning processes
Obviously, economies of scale are closely related to size by definition (savings due to size), but we will try to
identify the two effects individually when possible.
The expected results of REM are affected by the different input data elements in the following way:
1.2.4.1 Ground data.
a. Location of buildings (in terms of population density). Higher population density produces larger sizes
of systems. They will result in larger microgrids (if far from the grid) and more grid-extensions (if not
far from the grid). The influence of size in grid extensions is closely related to network catalogues
components (the right power capacity and the right economy of scale may lead to relevant savings).
b. Existing distribution feeders (in terms of distances to buildings). Part of the connection costs are
proportional to distance, so systems next to the grid will obviously tend to become grid extensions
(here the availability of small network components is critical).
c. Energy resources (solar power availability, diesel cost if available and allowed). High solar power
availability and low diesel prices favor microgrids.
d. Topography data (altitude map and penalized areas). Adverse terrain characteristics produce smaller
systems and even isolated solutions.
NESP Task-2 final report 16
1.2.4.2 Calculated assumptions.
a. Grid energy cost. Obviously, higher energy costs produce more microgrids and less grid-extensions
(small influence in isolated systems, except when they are special high-demand customers). The
effect of this parameter on the solution is smooth if buildings-to-grid distances are relevant. In case
of short distances, changes may be dramatic (connection cost thresholds depend mainly on
transformers, instead of lines).
b. Grid reliability. This parameter affects dramatically the presence of grid extensions if CNSE is
significant, since non-served energy is directly penalized by CNSE (critical and non-critical). In
contrast with microgrids, grid reliability is a user input that cannot be mitigated by extra investments.
c. Demand profiles (critical and non-critical, demand growth rate). Critical energy is important since its
CNSE value is usually high. More critical energy means higher cost in grid extensions (if reliability
is not 100%). In microgrids it may just impose more reliability to the solutions, but the cost is not that
much affected, since non-served energy costs are replaced by generation costs. The effect of demand
growth rate is similar to the effect of smaller components in the catalogues (network and generation).
Higher demands produce bigger sizes and better economies of scale in the system, and therefore they
favor bigger microgrids and more grid-extensions. The p.u. cost ($/kWh) usually decreases as demand
increases.
d. Network components (catalogues of lines and transformers). Smaller and less expensive components
tend to produce bigger microgrids and more grid-extensions, since they allow more connections with
the same savings.
e. Microgrid generation components. Smaller and less expensive components tend to produce bigger
microgrids and more grid-extensions, due to the bottom-up clustering strategy (initial decisions are
possible). Beyond that, what is relevant is the presence of economies of scale in generation
components. Diesel generators usually provide these economies of scale, both in investment costs
and in operational costs (efficiency). In the case of batteries and PV panels, in which big systems are
made of many small components, economies of scale should be modelled explicitly in realistic terms.
Economies of scale produce bigger microgrids, and indirectly they even may produce more grid-
extensions (since large systems are more likely to be connected to the grid). The specific micro-hydro
sites will be analyzed in Task 4 for the detailed implementation of the NEP in a second phase.
Whereas most hydro sites will be connected to the central grid, those who are far from the grid will
provide a lower cost alternative for microgrid clusters nearby, so a case by case analysis will be
developed for either alternative (grid or microgrid) for each microgrid site.

NESP Task-2 final report 17
1.2.4.3 Strategic decision-making.
a. Administrative costs. They may have different fixed values for different electrification modes (grid
extension or microgrids) or also include p.u. costs as a decreasing function of size, to reflect
economies of scale in the administration of larger systems, as for instance in fee collection tasks. The
influence of economies of scale is quite relevant; as it has been already stated, they favor big
microgrids and more grid-extensions in the final solution. As these costs are estimated, they are
reflected separately in the final solution.
b. Cost of Non-Served Energy (CNSE). CNSE should be set to a value bigger than the typical energy
cost in the system. CNSE is closely related to grid reliability in the case of grid-extensions, since non-
served energy is directly penalized by CNSE (critical and non-critical). In the case of microgrids, the
effect is not so dramatic, since non-served energy costs are replaced by generation costs. Also in
microgrids, the use of CNSE as a reliability driver may be replace (or coordinated) with the use of
minimum reliability constraints (next input described)
c. Minimum microgrid quality/reliability of power supply. This constraint may be imposed in the case
of microgrids, in terms of percentage of energy served. The effect is to guarantee a minimum
reliability level for every off-grid solution, despite the cost.
d. Discount rate, needed to translate upfront investments to annuities. The effect is obviously to change
the annual costs, imposing a shorter or longer recovery of the investment. Since different values may
be set for different electrification modes, it may bias the final solution one way or another (grid-
extensions, microgrids or isolated systems).
e. Grid connection criteria. They may bias grid connection of priority customers that are not too far from
the grid (and not far from other customers), so that the effect on the final solution is directly predictable
in qualitative terms. The quantitative effects are quite interesting, since they may be used to estimate
the actual cost of the particular criteria applied.

NESP Task-2 final report 18
2 Setting the main design features for the NEP
2.1 Input data, inferences and main assumptions
Most of the effort by the Consortium with EDCL in the first Phase of this study has been devoted to gathering the
existing data described in the previous section, considering the different sources available, any inference processes
that could be derived from them, and where information was not directly available the determination and
validation by the technical team at EDCL of the different assumptions proposed by the consortium.
2.1.1 Location and characterization of expected demand
The detailed design of network and generation infrastructure developed by REM for the National Electrification
Plan requires to determine, as exactly as possible, the location and characteristics of the different loads that will
be supplied either by the central network, microgrids or isolated systems.
2.1.1.1 Residential customers
The location of residential customers was determined considering (a) the existing database of customers
developed for the 2013 Sofreco Report, (b) the 2017 High Resolution Settlement Layer HRSL for Rwanda
(Columbia University Center for International Earth Science Information Network)1 and (c) the expected growth
in Urban and Rural Areas for 2024.
This information about location of buildings did not include whether these customers were electrified (connected
to the grid) or not. To determine the location of the customers actually supplied (or about to be) by LV network,
a 37.5m buffer around the existing and already planned LV lines was calculated, as specified by EDCL,
considering those customers inside the buffer as already electrified (as they were within reach of the existing
network using side drop lines). The customers located inside forbidden areas (high-risk wetlands and other areas
non suitable for residential settlements) are not considered for a permanent electrification with grid standard
extension or microgrids, as they are expected to move to villages according to the villalization program, but will
be provided with solar kits as a transitory pre-electrification solution.
EDCL provided statistical information, classifying, for each cell in the country, the households in two customer
types according to their demand. Type 1 households are expected by EDCL to demand initially only a very low
level of supply (below 10Wp in 2017 for two lights, a phone charger and may be a high-efficiency radio). Type
1 www.ciesin.columnia.edu/data/hrsl

NESP Task-2 final report 19
2 customers will demand less than 50Wp. Larger domestic customers, well above those two essential levels, are
a rare minority (below 5 customers per thousand).
Figure 5: Sample image of different data sources: Sofreco (green dots), HRSL (yellow squares), MV (red lines) and LV (green lines) and 37.5 m buffer (light yellow)
combined for the determination of location of non-electrified residential customers in Nyagatare district
Residential customers connected to minigrids are assumed to have an equivalent profile as those connected to the
central grid, with equivalent supply and technical standards. The hourly profile of consumption expected from
them has been extrapolated from average feeder data provided by EDCL and from the field study developed by
MIT-IIT Universal Energy Access Lab in 2015 for the village of Karambi, Mutete Sector, Gicumbi district2 for
the purpose of inferring the consumption profiles every hour of the day by lower and higher demand households.
In case these customers are assigned a Solar Kit, all Type 1 and 2 residential customers (below 50Wp in 2017)
are assigned by default a 10 Wp DC Solar Kit (2 lamps and a phone charger) as per EDCL characterization.
An average demand growth of 8.40% per year and customer has been sanctioned by EDCL according to historical
data of connected customers in Rwanda.
2 Santos, Javier, “Metodología de ayuda a la decisión para la electrificación rural apropiada en países en vías de desarrollo” Universidad Pontificia Comillas, 2015. Li, Vivian, “The Local Reference Electrification Model: comprehensive decision-making tool for the design of rural microgrids” Massachusetts Institute of Technology, 2016.
NESP Task-2 final report 20
A larger relocation of population is expected to happen in the long term, after 2024, as the villalization program
develops. Different hypotheses will be considered for the long term scenarios for 2030, agreed to be analyzed
during Phase 2 of the project, including also higher demand growth hypotheses.
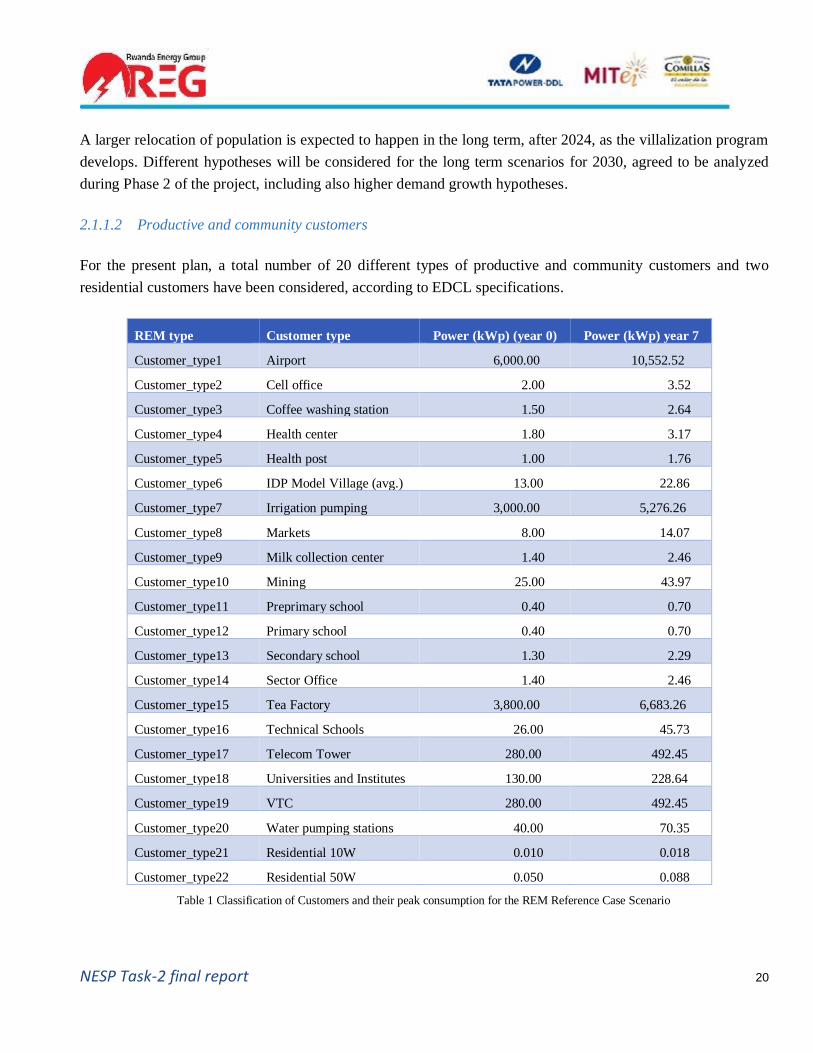
2.1.1.2 Productive and community customers
For the present plan, a total number of 20 different types of productive and community customers and two
residential customers have been considered, according to EDCL specifications.
REM type Customer type Power (kWp) (year 0) Power (kWp) year 7
Customer_type1 Airport 6,000.00 10,552.52
Customer_type2 Cell office 2.00 3.52
Customer_type3 Coffee washing station 1.50 2.64
Customer_type4 Health center 1.80 3.17
Customer_type5 Health post 1.00 1.76
Customer_type6 IDP Model Village (avg.) 13.00 22.86
Customer_type7 Irrigation pumping 3,000.00 5,276.26
Customer_type8 Markets 8.00 14.07
Customer_type9 Milk collection center 1.40 2.46
Customer_type10 Mining 25.00 43.97
Customer_type11 Preprimary school 0.40 0.70
Customer_type12 Primary school 0.40 0.70
Customer_type13 Secondary school 1.30 2.29
Customer_type14 Sector Office 1.40 2.46
Customer_type15 Tea Factory 3,800.00 6,683.26
Customer_type16 Technical Schools 26.00 45.73
Customer_type17 Telecom Tower 280.00 492.45
Customer_type18 Universities and Institutes 130.00 228.64
Customer_type19 VTC 280.00 492.45
Customer_type20 Water pumping stations 40.00 70.35
Customer_type21 Residential 10W 0.010 0.018
Customer_type22 Residential 50W 0.050 0.088
Table 1 Classification of Customers and their peak consumption for the REM Reference Case Scenario

NESP Task-2 final report 21
EDCL provided a GIS file including the location of productive and community customers, their present
electrification status (yes/no) and their expected peak and average yearly demand in 2019.
Figure 6 shows a sample of hourly profiles obtained from the field study in Karambi village, Gicumbi district,
which has been taken into account to estimate the shape of the hourly demand curve for each individual customer,
each one subject to the peak and average demand data provided by EDCL.
Figure 6: Sample demand profiles for domestic, community and productive loads in Karambi village (Santos J. 2015, Li, V. 2015)
All community and industrial customers are supplied in AC, disregarding whether they are connected to the
central grid, a microgrid or are supplied with an individual stand-alone system.
2.1.1.3 Quality of Service
As described in Section 1.2, REM considers both the reliability of the central network (for the grid connected
customers) as well as the performance of microgrids and isolated systems (for the off-grid customers).
Different scenarios can be calculated using REM, according to different reliability hypotheses. For the central
network we have analyzed scenarios ranging from a 100% reliable network (considering that the country will
improve from the present status through the necessary investments in central generation and transmission and
distribution reinforcements) down to 85% considering that the scenario in 2024 will be similar to the one today.
For the purpose of this report, in order to determine which villages should be on and off-grid, we are providing
the 100% reliable network scenario so the final status of a customer in the long term is determined by this ideal

NESP Task-2 final report 22
solution. Another high-demand scenario has been developed to determine the outer boundaries of grid extension
in case household demand rises above the essential levels described above, above Tier 3 for low income
households and aboveTier 4 for high income ones.
As for the microgrid generation, the expected system reliability is very high (above 97% in the scenario
described in this document) and even better than in many places serviced by the main network. REM determines
this reliability level according to the inferred cost of non-served energy for critical and non-critical loads (0.75
$/kWh and 0.30 $/kWh respectively), and a hard low-end reliability constraint (which in this case is set to at least
80%). The value of the critical cost of non-served energy (in $/kWh) was estimated considering the present
expenditure of firms in diesel backup systems that supply around 15% of their energy consumption in a year as
backup for blackouts. This cost per kWh is high because the customers are required to size their diesel generators
according to their peak demand power, even if the diesel only produces 15% of their total energy consumption in
a year. The non-critical cost of non-served energy was assigned a value in the order of the average cost of
generation of a small AC Solar Home System.
Finally, for very small residential customers below 50Wp, REM will consider the social cost of grid connection
or microgrids against the supply with a small 35$ DC Solar Kit, that will repaired and upgraded as needed in the
future. The overnight cost of purchase of these systems is very low, but they can only supply a fraction of the
customer demand for a limited amount of hours. Therefore, loss of utility of these systems, as compared to grid
and microgrid connections, is high. This value of non-served energy for DC systems is different to the one
considered for critical and non-critical connected demand, as described above, and has been estimated in the order
of the cost of other alternatives (in $/kWh) as kerosene lamps, candles or disposable battery lights (0.9 $/kWh).
Failure rates of equipment and technical characteristics (e.g. voltage drop at the connection point) are built into
the techno-economic catalogue, and therefore comply with the specifications established by EDCL.
2.1.2 Existing infrastructure
2.1.2.1 Existing distribution network (MV and LV)
REM computes millions of alternatives to find the optimal least-cost design for grid connection systems, as well
as for microgrids and stand-alone systems, comparing them and determining, for each household, the solution
that minimizes the social cost (including cost of non-served energy).
Regarding grid connection, each network extension system designed by REM must be connected to the existing
(or already projected) MV network layout. A detailed GIS layout of all existing and already planned MV and LV
lines has been taken into account to optimize the connection of newly designed grid extension to the existing
infrastructure.

NESP Task-2 final report 23
Upstream reinforcements are estimated by the cost of energy purchased from the grid for distribution, and are not
included in the scope of the present study, but could be the subject of a subsequent analysis.
The cost of the energy supplied by the main grid at bulk MV distribution level has been set to 0.12 $/kWh for the
Reference Case Scenario. This is indeed significantly lower than Rwanda’s 2017 energy cost; however, we note
that it is many times larger than the global level, and close to double that of the neighboring land locked country
of Uganda. Indeed, it will be necessary for Rwanda to move away (as it plans to do) from excessive diesel
generation and seek to achieve to be economically competitive energy costs by adopting a lower cost generation
mix. Sensitivities have been analyzed to assess the impact of higher energy costs, up to 0.20 $/kWh.
2.1.2.2 Least-cost network planning, catalogue and quality standards
EDCL established the MV and LV catalogue to be considered for new grid extensions and off-grid electrification
in this NEP for 2024 (please refer to ANNEX 2: RCS REM input catalogue tables for further details on catalogue
components and characteristics). Components selected for the Reference Case Scenario, either MV or LV lines
as well as transformers, had been specified bestowing the best practices and experience of EDCL according to the
following considerations:
• Given this target and that the coverage of the existing MV network is already high in every district of
Rwanda, new grid extensions and MV lines do not need to be spread over very large distances to reach
different customers.
• In this RCS only highly populated and priority industrial and community loads (the least-cost connections)
are expected to get coupled to the central grid.
• These priority loads and high density areas need, according to the experience of REG, the promotion of
high quality of service standards, already in place in the country. The purpose of this strategic approach
is to guarantee the necessary quality to foster economic growth.
Therefore the Reference Case Scenario for REM has been specified by EDCL to select the least-cost
electrification design, but according to initial high quality standards. Where the grid will not reach, customers
will be supplied either with grid-standard microgrids (that may eventually get connected to the grid in the future)
or, because of budget constraints, with only a transitory DC solar kit or stand-alone AC system, expressing EDCL
purpose of electrifying the whole the country with grid-equivalent service in the future.
Therefore, for this Reference Case Scenario, the use of low-cost distribution technologies (e.g. SWER lines or
two phase wires that could lower the cost of long distance distribution lines) has not been considered, but could
be analyzed in the future to connect the more distant clusters of customers, specially where there is local
generation installed already (e.g. microgrids or large AC stand-alone loads), that contributes to enhance the quality
of service for these remote customers.
NESP Task-2 final report 24
The use of lower rural electrification standards has also been discussed, but these standards have also been set to
high quality levels of service as per specification of EDCL (e.g. 4% maximum voltage drop at the end LV
customer). The useful life of the network has been set to 25 years and the financial discount rate is 8%.
2.1.3 Off-grid generation techno-economical catalogue
This concentrated effort for grid extension in high density of load areas results in a Base Case Scenario that shows
a large share of off-grid electrification in Rwanda (both microgrids and solar kits). This will result in an increase
in the market size for PV panels, batteries and other off-grid equipment. Therefore we expect that with higher
volumes of purchases, the prices will become similar to those of other international markets. Per system costs
such as infrastructure investment (e.g. small control buildings or fuel tanks) are also taken into account, as well
as installation and maintenance labor costs.
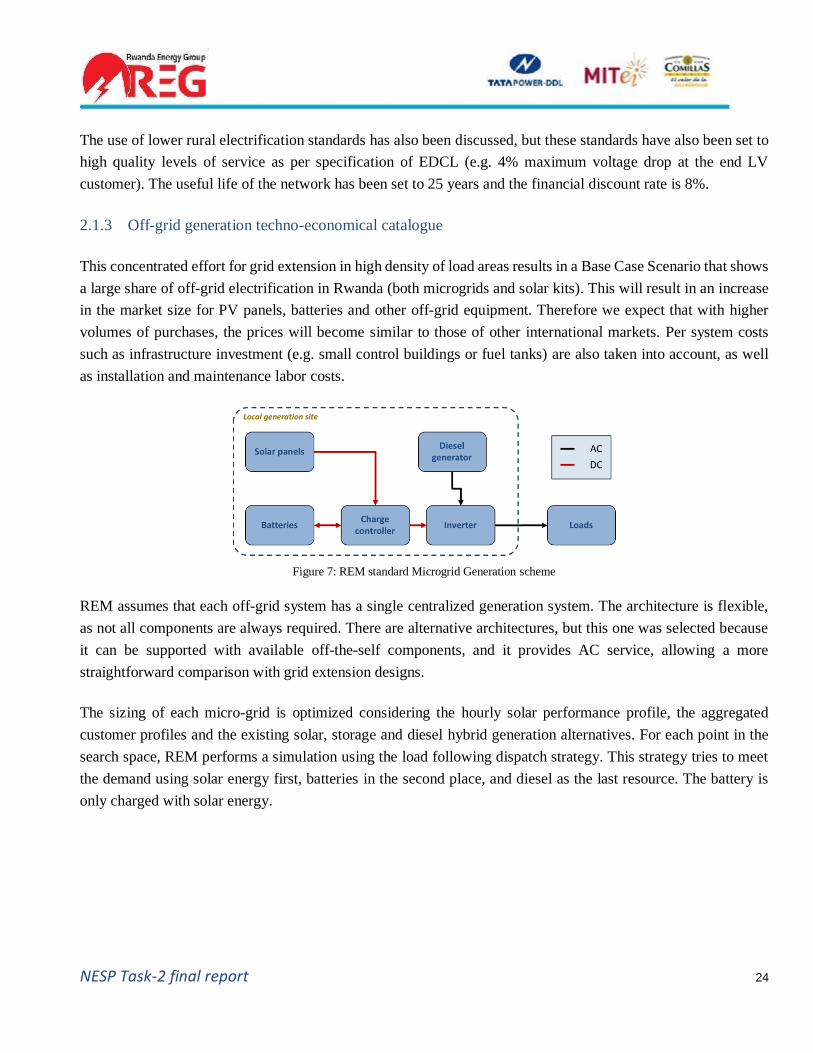
Figure 7: REM standard Microgrid Generation scheme
REM assumes that each off-grid system has a single centralized generation system. The architecture is flexible,
as not all components are always required. There are alternative architectures, but this one was selected because
it can be supported with available off-the-self components, and it provides AC service, allowing a more
straightforward comparison with grid extension designs.
The sizing of each micro-grid is optimized considering the hourly solar performance profile, the aggregated
customer profiles and the existing solar, storage and diesel hybrid generation alternatives. For each point in the
search space, REM performs a simulation using the load following dispatch strategy. This strategy tries to meet
the demand using solar energy first, batteries in the second place, and diesel as the last resource. The battery is
only charged with solar energy.

NESP Task-2 final report 25
Figure 8: REM optimization pathway for a 1kWp microgrid
There optimization of each generation design includes the examination of the different diesel / solar / storage
choices to minimize the annuity cost of generation (as shown in Figure 8). This design considers the aggregated
demand profile and also the cost of lack of reliability, taking into account that some designs will not be able to
meet all the expected demand at certain hours of the year.
2.1.4 Topographical restrictions
There are a number of features that are taken into account at different moments in our methodology. First for the
definition of our beneficiary population (outside any forbidden areas) and then to determine the cost of generation
(solar map of Rwanda) and network: slope of the terrain, areas of special difficulty (wet lands, rainforest areas)
or even forbidden.

NESP Task-2 final report 26
Figure 9: Example of Rwanda topographical features: Water bodies and wet lands, protected areas, national parks and altitude lines
2.2 REM algorithmic configuration
2.2.1.1 Free clustering vs. cell and village level grid-extension constraints
The decision-making algorithms of the REM model have been adapted to meet the requirements specified by
EDCL for Rwanda.
A first comparison was developed to analyze the impact of making decisions for grid connection at a whole cell
level (every customer within the cell boundary would be either grid connected or off-grid), and comparing those
with the results at village level (smaller boundaries) or with the general REM free clustering algorithm (that only
considers optimal groups of customers according to their layout and their demand, not restricted by administrative
boundaries).
Though algorithms restricted by cell or village boundaries were slightly less optimal (within a -2% margin), EDCL
considers that not discriminating anyone within an on-grid village (that could be left off-grid in the free clustering
configuration) is essential for the success of the implementation electrification plan, counterweighing the loss of
optimality according to the preferences of the final customers.
2.2.1.2 Village level REM Exhaustive vs. Non-Exhaustive algorithms
Another issue to be considered is how to consider productive loads inside villages which are better off-grid as a
whole. Even if the village is off-grid, the connection of high-demand productive loads (e.g. Telecom towers) to
the grid can result in a lower electrification cost, and can also benefit other nearby customers with a grid
connection (though not the whole village in these cases). REM allows to evaluate individually the connection to
the grid of any load (or group of loads) inside an off-grid clusters (called the Exhaustive Algorithm configuration
in REM). EDCL determined that connection of customers around productive loads, excluding others within the
same village, could be considered as inequitable by those other citizens not so near the productive facility.
For this reason, the NEP plan has been configured to not consider the choice of individual grid connections inside
off-grid village (Non-Exhaustive algorithm) to determine the choice of electrification modes for each village. But
in the implementation phase, any load can always be connected to the grid if it is considered a priority, even if
the cost of connection is higher than the cost of the stand-alone solution.

NESP Task-2 final report 27
2.3 Selection of Reference Case Scenario for the NEP
After the different previous analyses were discussed in detail with EDCL, the following Reference Case Scenario
(RCS) for the initial proposal of Grid and Off-Grid areas for the National Electrification Strategy is:
• Algorithm: Grid extension decision taken at administrative village level, non-exhaustive.
• Cost of energy from the central grid: 0.12 $/kWh
• Reliability of the central grid: 100%
• National catalogue and network standards: equal for grid extension and grid-compatible microgrids.
• International catalogue for off-grid generation.
• Smallest microgrid size: 50 customers or 3 kWp.
• Discount rate 8%
• Administrative charges per grid-connected customer: 9 $/year
• Administrative charges per microgrid customers
o Medium size microgrid (100 customers): 16 $/year
o Large size microgrid: Asymptote at 9$/year
• Per customer costs (as per EDCL specifications)
o Grid extension and microgrids connection cost: 65 $/customer (meter and connections)
o Solar kits: 35 $/solar kit (retail price specified by EDCL of a basic SE4all Tier 1 system)
• Average cost of diesel: 1.2 $/l
• Average cost of labor: 1.6 $/hour
• Already electrified customers (2017): 721 512
• Non-electrified customers (2017): 1 612 432
• Number of cells: 2 148
• Number of villages: 14 816
• Forbidden areas: Excluded from the National Electrification Plan

NESP Task-2 final report 28
3 Techno-economic least-cost plan for Universal Access in 2024
3.1 Techno-economic optimum for the Reference Case Scenario: Global results
for Rwanda
The least-cost balance for this Reference Case Scenario (RCS) is defined by the cost of service of grid extension
vs. the alternative cost of microgrids and, where appropriate, solar kits or stand-alone systems. As detailed in
Section 1.2, REM calculates the Cost of Service for any given alternative (evaluated as an annuity in USD/year)
considering:
• Grid Extension:
o Cost of energy purchased from the grid, in our case at a cost of 0.12$/kWh, and supplied to the
customers, according to their demand, including network losses,
o Cost of network investment, operation, preventive and corrective maintenance, according to the
catalogue and standards defined by EDCL for Rwanda NEP.
o Other supply costs: Connection, protections and meters, administrative, billing, fee collection
overhead costs incurred by the distribution company (EUCL).
o Social cost of non-served energy. In this RCS this cost will be zero, as the scenario considers as a
hypothesis that the reliability of supply in 2024 will be 100%.
• Microgrids:
o Cost of distributed generation: According to the hourly demand profile of the customers connected
to the microgrid, the associated network losses and the solar profile, considering hourly variations,
and to the generation catalogue established for the RCS. See Figure 10: for a sample of this
scenario for the district of Nyagatare.
o Cost of microgrid network, including also investment, operation, preventive and corrective
maintenance.
o Other supply costs, also incurred by the incumbent microgrid company (in this scenario, according
to REG specifications, also EUCL).
o Social cost of non-served energy, according to the specific reliability of the microgrid every hour
of the year, considering the different costs of Non Served Energy for Critical and Non Critical
loads / hours.
• Solar Kits and Stand Alone Systems
o Cost of distributed generation, according to the choice of supply:
▪ DC Solar Kits for isolated residential loads under 50 Wp
NESP Task-2 final report 29
▪ AC Stand-Alone Solar Systems for other eventually isolated high-consumption
community and productive customers.
o Administrative costs:
▪ Solar Kits: No other administrative costs are included in this case, as every guarantee or
commercial insurance is considered as included in the retail price.
▪ AC Stand-Alone Solar Systems. Due to the higher cost and maintenance of these larger
systems, a pay per service fee is considered, equivalent to that of very small microgrids.
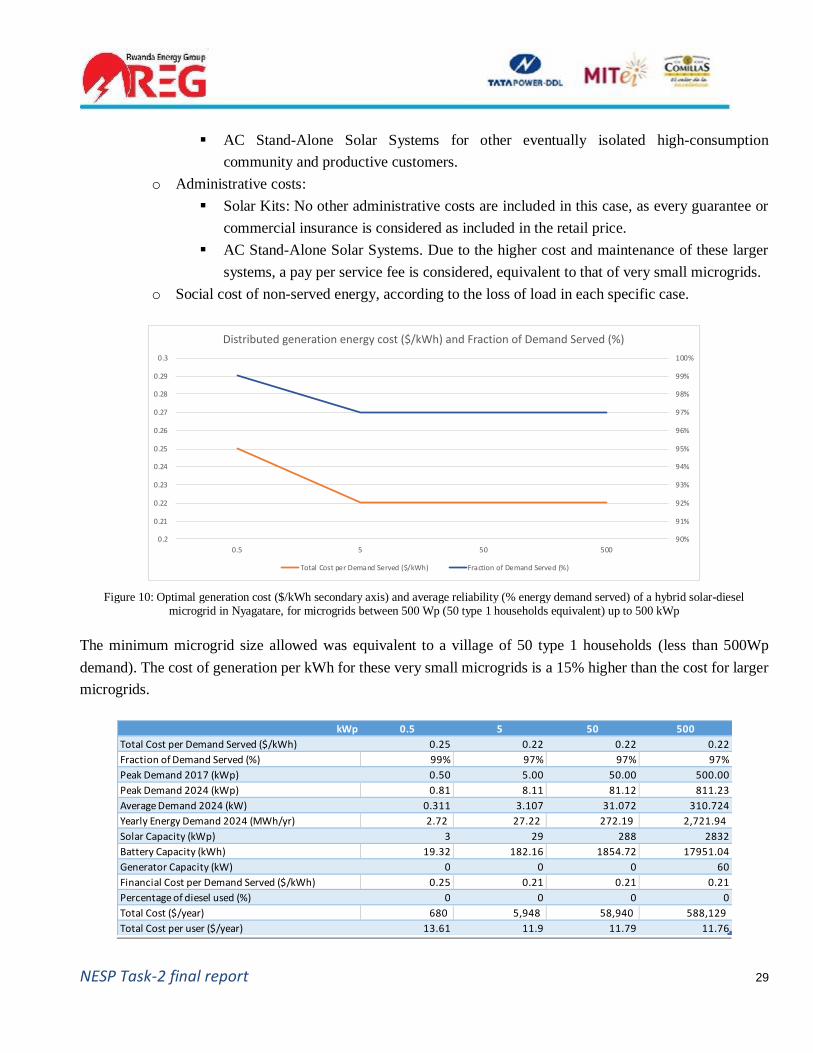
o Social cost of non-served energy, according to the loss of load in each specific case.
Figure 10: Optimal generation cost ($/kWh secondary axis) and average reliability (% energy demand served) of a hybrid solar-diesel microgrid in Nyagatare, for microgrids between 500 Wp (50 type 1 households equivalent) up to 500 kWp
The minimum microgrid size allowed was equivalent to a village of 50 type 1 households (less than 500Wp
demand). The cost of generation per kWh for these very small microgrids is a 15% higher than the cost for larger
microgrids.
90%
91%
92%
93%
94%
95%
96%
97%
98%
99%
100%
0.2
0.21
0.22
0.23
0.24
0.25
0.26
0.27
0.28
0.29
0.3
0.5 5 50 500
Distributed generation energy cost ($/kWh) and Fraction of Demand Served (%)
Total Cost per Demand Served ($/kWh) Fraction of Demand Served (%)
kWp 0.5 5 50 500
Total Cost per Demand Served ($/kWh) 0.25 0.22 0.22 0.22
Fraction of Demand Served (%) 99% 97% 97% 97%
Peak Demand 2017 (kWp) 0.50 5.00 50.00 500.00
Peak Demand 2024 (kWp) 0.81 8.11 81.12 811.23
Average Demand 2024 (kW) 0.311 3.107 31.072 310.724
Yearly Energy Demand 2024 (MWh/yr) 2.72 27.22 272.19 2,721.94
Solar Capacity (kWp) 3 29 288 2832
Battery Capacity (kWh) 19.32 182.16 1854.72 17951.04
Generator Capacity (kW) 0 0 0 60
Financial Cost per Demand Served ($/kWh) 0.25 0.21 0.21 0.21
Percentage of diesel used (%) 0 0 0 0
Total Cost ($/year) 680 5,948 58,940 588,129
Total Cost per user ($/year) 13.61 11.9 11.79 11.76

NESP Task-2 final report 30
Table 2 Optimal reference designs for solar microgrids generation in Nyagatare, for systems between 500 Wp (smaller microgrid size allowed 50 type 1 households) up to 500 kWp
The generation for each actual microgrid designed by REM will be sized according to the actual users connected
to that microgrid clusters, considering their customer types and the demand expected in 2024. PV panels, batteries
and, where applicable, diesel generation is optimized to establish the reference cost that can be used to evaluate
tender proposals for IPPs in microgrids, as will be furtherly detailed in Task 3 and Task 4 reports.
Diesel penetration in the optimal designs, considering the average cost of fuel is 1.2$/l, is insignificant and only
appears as small backup power in systems over 500 kWp. This cost is much higher in isolated rural areas and
highly volatile, therefore the conclusion is that diesel, if allowed, will be reserved for backup and mainly in very
large systems.
3.1.1 Rwanda National Electrification Plan system map
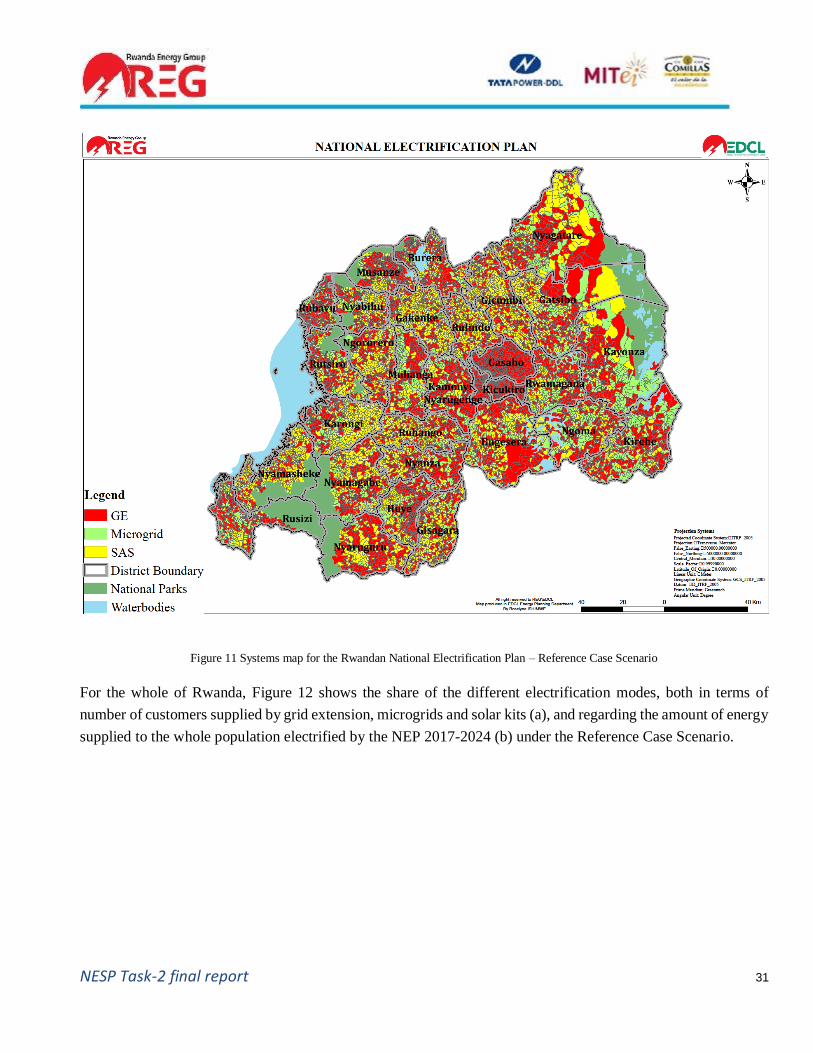
Figure 11 below shows the map of systems designed by REM for the Reference Case Scenario. Blue and red lines
correspond to medium voltage (MV) and low voltage (LV) connections to the central grid. Green LV lines define
connect customers to off-grid microgrid generations and, eventually, orange lines would represent MV networks
for very large minigrids (not present in this scenario). Purple points represent stand-alone solar kits and SHS.
NESP Task-2 final report 31
Figure 11 Systems map for the Rwandan National Electrification Plan – Reference Case Scenario
For the whole of Rwanda, Figure 12 shows the share of the different electrification modes, both in terms of
number of customers supplied by grid extension, microgrids and solar kits (a), and regarding the amount of energy
supplied to the whole population electrified by the NEP 2017-2024 (b) under the Reference Case Scenario.

NESP Task-2 final report 32
(a) Share of energy Suplied (b) Share of energy supplied .
Figure 12 Share of total customers and of energy supplied per electrification mode in the Reference Case Scenario 2024
The share of grid extension in 2024 will reach 52% of on-grid connections in 2024 of all Rwanda in the
National Electrification Plan, including 31% of already existing connections in April, The remaining 21% will be
both fill-in connections in already electrified villages and extension of the grid to new villages in 2024. Off-grid
connections will represent 48% of the universal electrification target, of which Grid Standard Microgrids
serving a whole village would represent 10%, and DC Solar Kits or AC Stand-Alone Systems would account for
38%, of which 7 % are villages where coexistence of solar kits and microgrids could be a choice to consider at
the implementation phase, 21% are in villages where only SAS is the recommended option, 10%% are off-grid
customers already electrified in as of April, 2019. Households in High risk zones are not included in this Plan as
they will rather be re-located to modern settlements as per the GoR policy.
Out of a total of nearly 3.9 million connections, including residential, community and productive customers, 2
million (62%) would be high-quality grid standard solutions (1.7 million connected to the central network and
326 thousand clustered in village microgrids), while almost 1.2 million would receive a DC solar kit, or a fully
fledge AC stand-alone-system for large isolated loads, as a transitory solution.
It is important to notice that the total amount of energy demanded by the 52% of grid connected customers’
accounts in fact for 93.8% of the total energy consumption of the electrified customers (see Figure 12 b and
Error! Reference source not found.). 8.2% Microgrids would supply 2.2% of the energy whereas 35.8% stand-
alone systems would represent 4% of the energy demand, as most of the productive and community loads, with a
higher weight in the energy mix, are connected by REM to the central grid or to microgrids.
The total energy consumption estimated for the Reference Case Scenario reaches 2.36 TWh/year in 2024. This
figure reflects on one side that the number of new customers connected through this NEP will be 2.2 times the
present number of grid connections, including many significant high-consumption industrial and productive
26%
19%
11%
8%
7%
5%
10%
14%
Breakdown of Customers 2024 Least-Cost RCS
Grid-StandardElectrified 2019
Grid-StandardFill-in 2024
Grid-Standard
Extension RCS
Grid-StandardMicrogrids RCS
Off-Grid(SAS or MG) RCS
Off-Grid(only SAS) RCS
Off-Grid(Existing 2019)
Off-Grid (HRZ)
NESP Task-2 final report 33
customers. The expected per customer demand growth per year in the RCS is 8.4%, a high figure that results in
the design of a robust network that can accommodate future growth and will not become a bottle neck for
economic activities in the country.
The cost of fill-in connections in already electrified villages has been estimated according to an average cost of
connection of 600 $/customer as per EDCL indications. A more indepth study, though is beyond the scope of this
NEP, could be developed but would require a very thorough analysis of the status of the present MV and LV
network components and their load. As for the new grid standard extension, the average investment cost is 732
$/customer and averages many different connection types and circumstances. Considering the load and distance
to the existing MV grid, some large systems show an average of 301$/customer, whereas others climb up to 5,901
$/customer, nearly twenty times more, in the Reference Case Scenario (depending not only on the distance of the
village to the grid, but also on the loads in the grid extension piece). Grid standard Microgrids have an average
overnight cost of 630 $/customer, which in this case includes network (67%) and generation (33%) investment
costs. In this case the cost per customer ranges from 449 $/customer to 3,684 $/customer for those microgrids
where large anchor loads increase the cost of generation (74% in this case) in relation to the network (26%).
Table 3 shows how the average investment cost of connection to the grid is split according to the relative weight
of the different customer types. The network cost per customer is calculated according to their peak load in 2024,
according to the NEP timeline, with an average cost of 364.15 $/kWp. Therefore, while large industrial
connections would cost several millions of dollars, residential connections, with a subsistence peak load in the
range of tens of watts will individually represent a very small amount of the total share of the grid cost.

NESP Task-2 final report 34
Table 3 Breakdown of average network cost per customer in the Reference Case Scenario
The energy consumption is higher for grid-connected customers (1,129 kWh/yr-customer) than the one of
microgrids customers (172 kWh/yr-customer). This is due to the fact that large industrial and productive
customers are mainly connected to the grid, therefore their energy demand is enormous (with peak consumptions
up to 6 MW) in comparison with the very small demand of the average residential customer (from 10 to 50 W).
The average total per unit cost of energy for the system is high (0.255 $/kWh), especially if we compare it with
the cost of purchasing energy from the upstream network (0.12 $/kWh). The level of consumption is small
compared to the capacity of the network components used in the catalogue, meaning than in average the cost of
new distribution, both grid and off-grid, multiplies in more than twice the cost of centralized energy from the grid
in the Rwandan System. The average cost for grid standard extension is 0.199 $/kWh, while for grid standard
microgrids it climbs up to 0.593 $/kWh. This is due not only to the higher cost of off-grid generation, in
comparison to the cost of energy from the grid, but also because of the better use of the grid made by high-
consuming grid connected customers.
3.1.2 Costs breakdown of individual grid extension and microgrids.
It is also important to realize that the cost of supply for grid standard extension customers is not homogeneous for
all the 931 individual grid extension projects summarized in Figure 13. The average size of 463 customers per
REM type Customer typePower (kWp)
(year 0)
Power (kWp)
year 7
Grid Standard Extension
Investment cost per
customer
Grid Standard
Extension
Investment cost per
kWp (year 7)Customer_type1 Airport 6,000.00 10,552.52 23,891,900 2,264.09
Customer_type2 Cell ofice 2.00 3.52 7,964 2,264.09
Customer_type3 Coffee washing station 1.50 2.64 5,973 2,264.09
Customer_type4 Health center 1.80 3.17 7,168 2,264.09
Customer_type5 Health post 1.00 1.76 3,982 2,264.09
Customer_type6 IDP Model Village (avg.) 13.00 22.86 51,766 2,264.09
Customer_type7 Irrigation pumping 3,000.00 5,276.26 11,945,950 2,264.09
Customer_type8 Markets 8.00 14.07 31,856 2,264.09
Customer_type9 Milk collection center 1.40 2.46 5,575 2,264.09
Customer_type10 Mining 25.00 43.97 99,550 2,264.09
Customer_type11 Preprimary school 0.40 0.70 1,593 2,264.09
Customer_type12 Primary school 0.40 0.70 1,593 2,264.09
Customer_type13 Secondary school 1.30 2.29 5,177 2,264.09
Customer_type14 Sector Office 1.40 2.46 5,575 2,264.09
Customer_type15 Tea Factory 3,800.00 6,683.26 15,131,536 2,264.09
Customer_type16 Technical Schools 26.00 45.73 103,532 2,264.09
Customer_type17 Telecom Tower 280.00 492.45 1,114,955 2,264.09
Customer_type18 Universities and Institutes 130.00 228.64 517,658 2,264.09
Customer_type19 VTC 280.00 492.45 1,114,955 2,264.09
Customer_type20 Water pumping stations 40.00 70.35 159,279 2,264.09
Customer_type21 Residential 10W 0.010 0.018 39.82 2,264.09
Customer_type22 Residential 50W 0.050 0.088 199.10 2,264.09

NESP Task-2 final report 35
grid extension section and 0.199 $/kWh do not reflect the diversity of situations shown in the Figure. Starting
with those sections in downtown areas or nearby very high-end industrial loads, the cost of service for those
customers will be around 0.13 cents actually. When the weight of these large energy consumers diminishes, the
cost of service rapidly starts to increase for the connection of disperse loads, even if they are cheaper than off-
grid alternatives (microgrids or solar kits / SHS) rapidly reaching over 0.40 $/kWh for still large size grid
extension sections, and then growing up to 0.80 $/kWh for large grid sections far from the existing MV grid and
with a very low energy consumption (shown in the figure as the generation cost, as compared to the annual
network cost).
Figure 13 Breakdown of selected individual grid standard extension costs annuities ($/yr) and per unit costs ($/kWh). Rwandan National Electrification Plan – Reference Case Scenario
A similar breakdown can be shown for the 2843 microgrids, which are much smaller in average size (152
customers per microgrid) as shown in Figure 14. Most of the microgrids are in the final trench over 0.50 $/kWh,
but very dense microgrids shown in the Figure, that include mid-size productive loads far from the grid can get
their costs down to 0.23 $/kWh, very competitive with the cost of the grid. Therefore it is individual balance
between the costs shown in Figures 24 and 25 the one that determines the frontier between the grid the microgrids,
a qualitatively different approach to the use of heuristics like the distance to the grid or the density of loads, which
do not resemble correctly the actual complexity of grid and off-grid system design calculated by REM.
0
0.1
0.2
0.3
0.4
0.5
0.6
0.7
0.8
0.9
0
50000
100000
150000
200000
250000
300000
350000
400000
450000
500000
Bu
gese
ra_e
xt_3
Ru
sizi
_ext
_122
Ru
hang
o_ex
t_43
Ru
sizi
_ext
_50
Gic
umb
i_ex
t_41
Ngo
ma_
ext_
77
Nya
bih
u_ex
t_10
0
Huy
e_e
xt_2
1
Huy
e_e
xt_2
5
Muh
anga
_ext
_17
Nya
gata
re_e
xt_1
42
Bu
rera
_ext
_2
Ru
sizi
_ext
_44
Kic
ukir
o_ex
t_91
Mus
anze
_ex
t_8
2
Ru
sizi
_ext
_26
Mus
anze
_ex
t_2
0
Kic
ukir
o_ex
t_41
Ru
sizi
_ext
_218
Nya
bih
u_ex
t_11
Gis
aga
ra_e
xt_
79
Ru
bavu
_ex
t_18
5
Kir
ehe
_ext
_20
8
Kar
on
gi_e
xt_8
2
Ru
tsir
o_
ext_
12
3
Mus
anze
_ex
t_8
4
Kay
on
za_
ext_
174
Kay
on
za_
ext_
205
Gas
abo_
ext_
73
Rw
am
aga
na_e
xt_1
88
Ngo
ma_
ext_
96
Rw
am
aga
na_e
xt_1
64
Nya
bih
u_ex
t_37
Huy
e_e
xt_7
0
Ru
tsir
o_
ext_
87
Ngo
ma_
ext_
116
Gis
aga
ra_e
xt_
30
Huy
e_e
xt_3
6
Ru
sizi
_ext
_127
Kar
on
gi_e
xt_1
18
Ngo
ma_
ext_
90
Gas
abo_
ext_
47
Nya
bih
u_ex
t_41
Nya
nza
_ext
_44
Ru
tsir
o_
ext_
10
5
Gat
sibo
_ex
t_1
04
Ngo
rore
ro_
ext_
32
Bu
rera
_ext
_86
Bu
gese
ra_e
xt_1
3
Nya
ma
gab
e_ex
t_82
Nya
bih
u_ex
t_39
Nya
ma
gab
e_ex
t_52
Mus
anze
_ex
t_9
8
Kam
on
yi_e
xt_9
3
Kar
on
gi_e
xt_1
19
Muh
anga
_ext
_39
Kic
ukir
o_ex
t_47
Muh
anga
_ext
_9
Ru
bavu
_ex
t_17
9 Annual Generation Cost ($/yr) Annual Network Cost ($/yr) Annual Connection Cost ($/yr) Cost Per kWh of Demand Served ($/kWh)

NESP Task-2 final report 36
Figure 14 Breakdown of selected individual microgrids costs. Rwandan National Electrification Plan – Reference Case Scenario
3.1.3 Solar Kits and Stand-Alone Systems in the Reference Case Scenario
Finally, REM also will include the design of those isolated loads that are being served (from a least cost
perspective) by an isolated system, instead of connected to the grid or a microgrid.
0
0.1
0.2
0.3
0.4
0.5
0.6
0.7
0.8
0.9
1
0
5000
10000
15000
20000
25000
30000
35000
40000
Gat
sibo
_ug
_73
Nya
bih
u_u
g_2
1
Gat
sibo
_ug
_93
Mus
anze
_ug
_6
7
Ru
bavu
_u
g_8
6R
uba
vu_
ug_
67
Nya
gata
re_u
g_1
Kir
ehe
_ug_
27
Bu
rera
_ug_
97R
wa
mag
ana
_ug_
20
Nya
ma
gab
e_u
g_1
2
Huy
e_u
g_34
Nya
gata
re_u
g_16
Kay
on
za_
ug_
73
Ru
bavu
_u
g_1
3
Ngo
ma_
ug_
5G
isa
gara
_ug_
40
Mus
anze
_ug
_6
1
Bu
rera
_ug_
58
Kir
ehe
_ug_
65
Ru
bavu
_u
g_2
0
Kam
on
yi_u
g_86
Ru
tsir
o_
ug_1
03
Kar
on
gi_u
g_20
Ru
tsir
o_
ug_3
9
Kar
on
gi_u
g_82
Nya
ma
gab
e_u
g_3
4
Gic
umb
i_ug
_20
Nya
ma
gab
e_u
g_6
Gak
enk
e_u
g_10
Kar
on
gi_u
g_11
1
Mus
anze
_ug
_4
4B
uge
sera
_ug_
82
Ngo
rore
ro_
ug_1
8
Ru
sizi
_ug_
85
Kir
ehe
_ug_
97
Ru
sizi
_ug_
144
Huy
e_u
g_25
Nya
bih
u_u
g_5
Ru
lind
o_u
g_30
Huy
e_u
g_62
Mus
anze
_ug
_5
8
Gat
sibo
_ug
_35
Kar
on
gi_u
g_76
Nya
ma
gab
e_u
g_5
1
Bu
gese
ra_u
g_28
Ngo
ma_
ug_
134
Ru
sizi
_ug_
67
Kar
on
gi_u
g_59
Nya
ma
shek
e_u
g_5
Gat
sibo
_ug
_111
Nya
bih
u_u
g_1
7
Bu
gese
ra_u
g_11
Nya
gata
re_u
g_11
Gic
umb
i_ug
_13
Ngo
ma_
ug_
30
Bu
gese
ra_u
g_27
Ru
lind
o_u
g_33
Rw
am
aga
na_u
g_39
Muh
anga
_ug_
26
Annual Generation Cost ($/yr) Annual Network Cost ($/yr) Annual Connection Cost ($/yr) Cost per unit of Demand Served ($/kWh)

NESP Task-2 final report 37
Table 4. Solar Kits and Stand-Alone Systems design and average cost breakdown for the Reference Case Scenario (Solar Kits Villages)
In the Reference Case Scenario we find that the majority of these loads are low-consumption residential customers
of Types 1 and 2 (consuming less than 10 W and 50 W) provided with a DC Solar Kit. In these cases the reliability
resembles the share of their grid connected demand that would be served by the selected Kit, not the reliability of
the Kit itself, which should provide the service according to those essential needs it is covering. There are also
other loads that at each district are in off-grid villages and do not get connected to nearby customers. This is the
case for more than 300 schools in the country, almost the same amount of cell Offices. The cost of supply of an
AC Stand-Alone System for those demands is very competitive (in between 0.21 $/kWh and 0.26 $/kWh), making
them a possible suitable solution for community and productive loads far from the grid and below the minimum
threshold established for a microgrid (i.e. 50 customers or at least 3 kWp demand). The proposed IDP model
village sites under development have been modelled as a single load for the purpose of REM, but naturally they
will be recieve microgrid supply as they are built.
3.1.4 Rwanda National Electrification Plan: villages map
The basic block for grid/off-grid electrification choice in Rwanda is the administrative village boundary. REM
calculates the least-cost option for the whole customers (productive, community or residential) inside the village,
so they will all get either connected to the central network or provided an off-grid solution.
Customer type PV Array Size
(kWp)
Battery Bank
Size (kWh)
Annual Demand
(kWh)
Fraction of
Demand Served
(p.u.)
Cost Per kWh
($/kWh)
NPV per Customer
($)
Pre-primary 2 14 2,178 0.93 0.26 5,572
Primary School 2 14 2,178 0.93 0.26 5,572
Secondary School 7 46 7,077 0.95 0.22 16,157
Sector Office 8 50 7,621 0.95 0.22 17,330
Technical Schools 145 925 141,541 0.96 0.21 304,880
Telecom Tower 1,584 9,853 1,524,289 0.96 0.21 3,317,780
VTC 1,584 9,853 1,524,289 0.96 0.21 3,317,780
Cell Office 11 71 10,888 0.95 0.22 24,368
Water pumping 223 1,422 217,756 0.96 0.21 468,608
Residential 10W 0 0 54 0.45 0.36 94
Residential 50W 0 0 272 0.09 0.36 94
Coffee Washing 8 53 8,166 0.95 0.22 18,503
Health Center 10 64 9,799 0.95 0.22 22,022
Health Post 6 36 5,444 0.95 0.23 12,638
IDP Model Village 73 463 70,771 0.96 0.21 152,848
Markets 45 285 43,551 0.96 0.21 94,422
Milk Collection 8 50 7,621 0.95 0.22 17,330
53 333 51,392 0.80 0.26 111,846

NESP Task-2 final report 38
Figure 15 Satellite projection of grid extension villages (blue), off-grid villages (green) and High-Risk Zones (red) for the Reference Case Scenario
Figure 15 shows the map of the grid connected and off-grid villages for the National Electrification Plan of
Rwanda. The National Electrification Plan has classified all the cells in the country according to the following
electrification modes:
• Grid Extension Villages. These include:
o Grid Standard Extension RCS Villages: Out of 14,816 villages in Rwanda, 2,476 shall be
connected to the grid in the Reference Case Scenario. They will require the development of new
infrastructure (MV transformers, MV and LV lines)..
o Grid Standard Fill-In Villages: 4,662 villages have already got a MV line and transformer
providing electricity service. From 2019 to 2024 the challenge for these villages is to connect any
facility or household not yet connected or built anew in the area.
NESP Task-2 final report 39
• Off-Grid Villages:
o Grid Standard Microgrid RCS Villages: Additionally, the basic block in off-grid villages to decide
whether microgrids or solar kits are the least-cost solution is the village boundary. 2,568 Villages
have been classified for microgrid electrification when the least cost option is to electrify the
customers in the village with a microgrid.
o DC Solar Kits or AC Stand-Alone Systems RCS Villages. All these 5,110 villages are selected
for electrification with isolated systems, either DC solar kits for small customers (low-income
households) or full-fledged systems which provide 24 hours service for larger customers (isolated
productive and community loads). In some of these villages, smaller clusters could still be suitable
for microgrid electrification, as shown in Error! Reference source not found., but the villages
where the whole population could be electrified with one or several Microgrid Systems have been
prioritized and in all the remaining off-grid villages, solar kits and stand-alone systems will be
promoted.
o NEP High Risk Zones: The households in these areas, regardless of the village they belong to,
will be electrified with Solar Kits as required by MININFRA, and they have not been considered
for grid standard electrification (either grid extension or microgrid). Some villages are completely
inside these high-rish zones shown in red in Figure 15 above, while others villages may have some
areas inside HRZ, whose customers have not been considered for the RCS and will be electrified
only with solar kits.
It is important to notice that this NEP for Rwanda does only focus on the new infrastructure that is required to
connect additional customers so that Universal Access can be achieved in 2024. Reinforcements and densification
of the existing MV and LV distribution network are not within the scope of this report. Consequently, the
classification of off-grid villages therefore only answers to a techno-economic optimization criteria where new
infrastructure is required. Some of the off-grid villages are nearby existing MV and LV lines, which could still
retain some extra capacity to accommodate new connections without additional MV lines or transformers. To
fully ascertain the possibility of connecting these undergrid NEP off-grid villages to the existing grid, an
additional individual field study will be required for each one of them, to accurately establish the existence and
the amount of idle capacity in these lines and transformers, and to determine the cost of connecting these new
customers to the already existing grid.
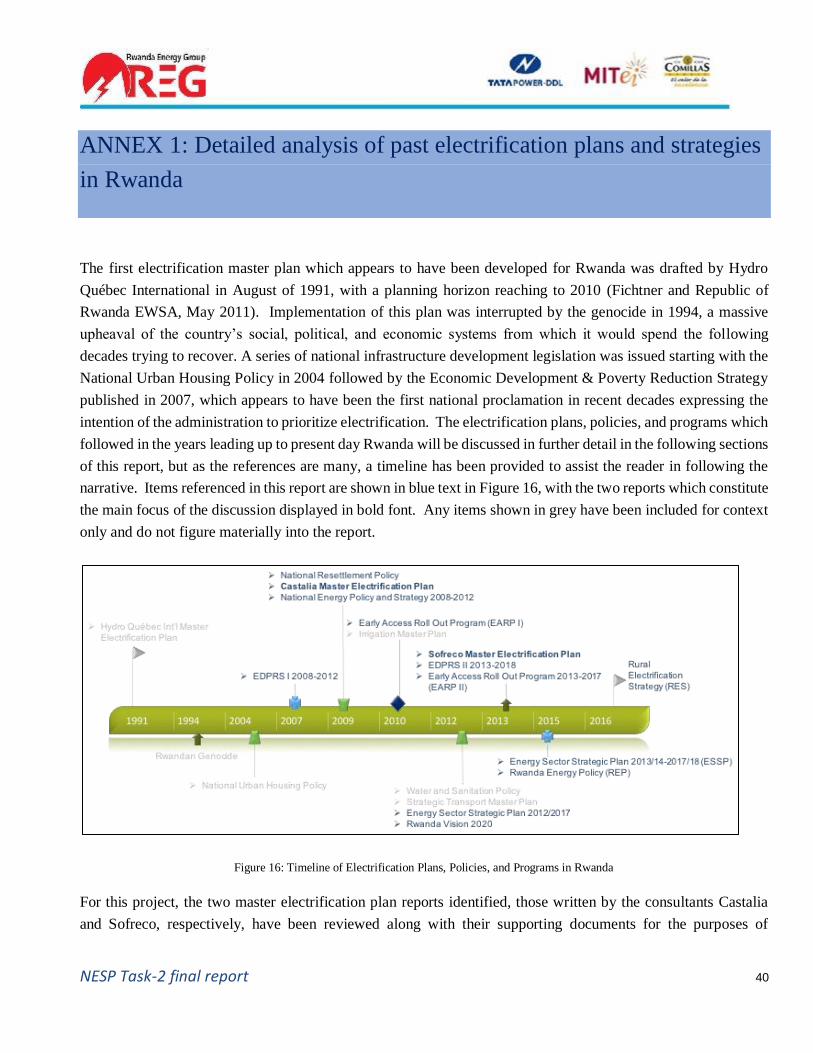
NESP Task-2 final report 40
ANNEX 1: Detailed analysis of past electrification plans and strategies
in Rwanda
The first electrification master plan which appears to have been developed for Rwanda was drafted by Hydro
Québec International in August of 1991, with a planning horizon reaching to 2010 (Fichtner and Republic of
Rwanda EWSA, May 2011). Implementation of this plan was interrupted by the genocide in 1994, a massive
upheaval of the country’s social, political, and economic systems from which it would spend the following
decades trying to recover. A series of national infrastructure development legislation was issued starting with the
National Urban Housing Policy in 2004 followed by the Economic Development & Poverty Reduction Strategy
published in 2007, which appears to have been the first national proclamation in recent decades expressing the
intention of the administration to prioritize electrification. The electrification plans, policies, and programs which
followed in the years leading up to present day Rwanda will be discussed in further detail in the following sections
of this report, but as the references are many, a timeline has been provided to assist the reader in following the
narrative. Items referenced in this report are shown in blue text in Figure 16, with the two reports which constitute
the main focus of the discussion displayed in bold font. Any items shown in grey have been included for context
only and do not figure materially into the report.
Figure 16: Timeline of Electrification Plans, Policies, and Programs in Rwanda
For this project, the two master electrification plan reports identified, those written by the consultants Castalia
and Sofreco, respectively, have been reviewed along with their supporting documents for the purposes of

NESP Task-2 final report 41
identifying the methodology followed by each in the creation of a national electrification plan for Rwanda. The
two methodologies will then be compared in order to identify common elements, unique attributes, strengths, and
weaknesses. These findings will then be used to form the basis of a critique of the capabilities of the Reference
Electrification Model, so that recommendations may be formed concerning both the future use and development
of this techno-economic planning tool.
Castalia Master Plan Study (2009)
The Castalia report is comprised of two documents: the Prospectus and the Technical Annex. Both were consulted
for the purposes of this review.
Context
The Castalia study was published in 2009, two years after the release of the Economic Development & Poverty
Reduction Plan (EDPRS I), which called for an increase in the total number of electricity connections from
100,000 in 2008 to 350,000 in 2012 (~16% of households (Castalia Strategic Advisors, March 2009)) and the
prioritization of establishing connections for social infrastructure (i.e. health facilities, schools, and
administrative offices) with the objective of electrifying 100% of both health facilities and administrative offices
and 50% of schools by 2012. A memorandum of understanding (MOU) had been signed the year before, in 2008,
between the Ministers of Finance and active development partners agreeing to facilitate an increased level of
coordination and cooperation among actors belonging to government institutions, utilities, development agencies,
and development partners in what was being called a sector-wide approach, or SWAP. The Castalia report
describes this as a “move away from implementing one-off energy projects towards a systematic and coherent
approach to planning, financing, and making new electricity connections”.
The Castalia report also makes reference to the government having recently enacted multiple pieces of legislation
geared toward reorganization of the energy sector and refinement of related development plans. Among these
laws were those calling for the creation of a new electricity utility ‘RECO’ and the establishment of a National
Energy Development Agency ‘NEDA’. The independent regulator RURA was also purportedly given additional
powers and responsibilities. In general, it indicated that the new legislation sought to transition away from
government-managed energy provision toward a system involving a greater degree of private-sector investment
and participation, specifically inviting private investment in generation. Exclusive control over the transmission
system was given to Electrogaz. The new energy policy, National Energy Policy and National Energy Strategy
2008-2012 (Republic of Rwanda Ministry of Infrastructure, January 2009), called for cost-reflective tariffs and
required RURA to consult MININFRA before setting tariffs in order to be clear about the level of subsidies which
could be expected from the government.
NESP Task-2 final report 42
Objectives
The Castalia Prospectus states that the intention of its planning exercise was to develop a five-year least-cost
technical plan satisfying the electrification goals set forth by the EDPRS, which it referred to as “set[ting] the
medium-term framework to 2012 for achieving the long-term aspirations embodied in Vision 2020”. The
reference being made in this instance is to the original version of Rwanda’s Vision 2020 which was published in
the year 2000 and which established the goal of reaching 35% countrywide electrification by 2020. In addition
to developing a plan that would demonstrate how the 35% electrification goals could be met from a technical
standpoint, Castalia was tasked with the complementary objective of providing a phased investment plan to instill
confidence in would-be investors, whom it calls out as its primary audience: “The Prospectus seeks to raise
US$250 million from development partners to fund access programme investments. The Prospectus aims to ease
the analytical burden on development partners by providing credible information on Rwanda’s electrification
plans and presenting all relevant information and analysis on the access programme in one document”.
Assumptions
There was no section in the report dedicated to the enumeration of all assumptions used by Castalia in the
development of its plan, but an effort was made to formulate a list of assumed values as they became apparent
over the course of reviewing the Prospectus and Technical Annex. This is not, therefore, to be taken as a
necessarily comprehensive list but, may be considered at least as a suggestion of the types of values assumed.
Assumptions appearing in the Technical Annex include those pertaining to the technology selection process (e.g.
discount rate, population growth rate, average number of people per household), those pertaining directly to the
off-grid technologies considered (e.g. costs of generator models of varying capacities, annual maintenance costs,
installation costs), and those employed in what the report refers to as the “operations and financing model”.
Assumptions appearing in the Prospectus:
• Technology costs: Investment lifetime was considered to be ten years for all energy sources; the costs
each technology configuration was expected to incur over a ten-year period were discounted into present
value terms assuming a discount rate of 10%.
• ECIV2 survey responses were used to estimate the percentage of households per district with different
demand levels. Minimum Consumption was assumed to be 20kWh per month (the equivalent of 2-3 energy
efficient light bulbs and a radio) and approximate average energy expenditures were considered as
follows:
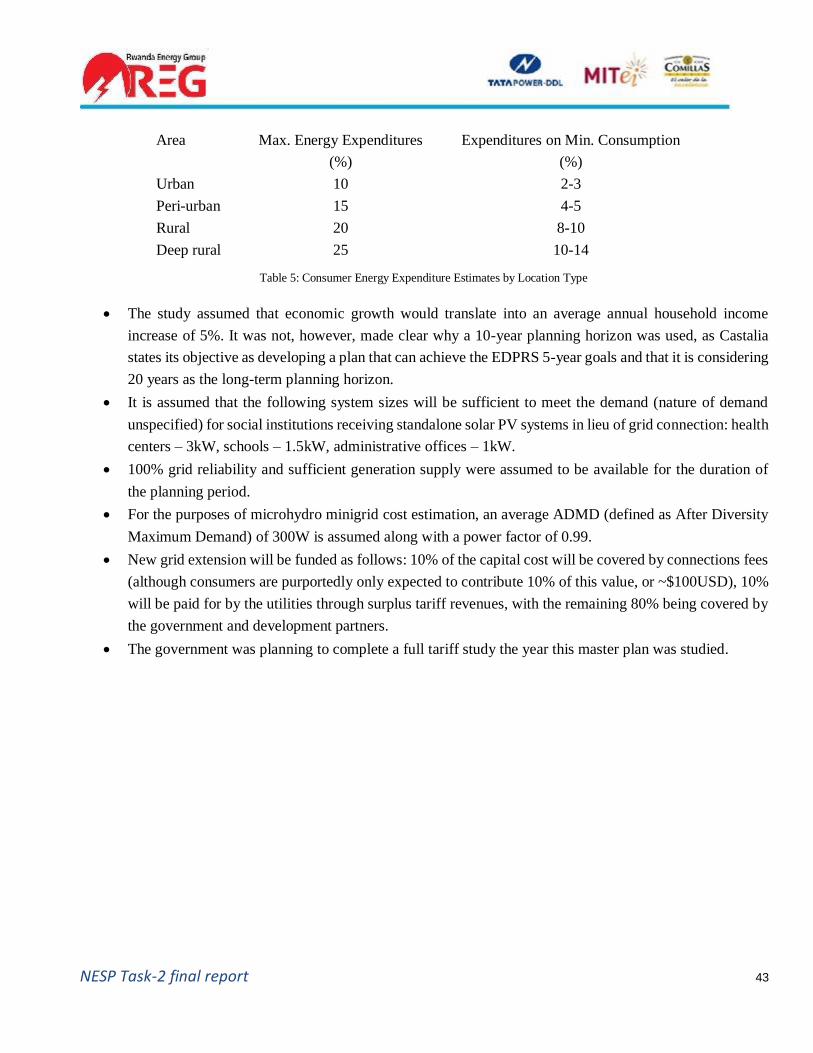
NESP Task-2 final report 43
Area Max. Energy Expenditures
(%)
Expenditures on Min. Consumption
(%)
Urban 10 2-3
Peri-urban 15 4-5
Rural 20 8-10
Deep rural 25 10-14
Table 5: Consumer Energy Expenditure Estimates by Location Type
• The study assumed that economic growth would translate into an average annual household income
increase of 5%. It was not, however, made clear why a 10-year planning horizon was used, as Castalia
states its objective as developing a plan that can achieve the EDPRS 5-year goals and that it is considering
20 years as the long-term planning horizon.
• It is assumed that the following system sizes will be sufficient to meet the demand (nature of demand
unspecified) for social institutions receiving standalone solar PV systems in lieu of grid connection: health
centers – 3kW, schools – 1.5kW, administrative offices – 1kW.
• 100% grid reliability and sufficient generation supply were assumed to be available for the duration of
the planning period.
• For the purposes of microhydro minigrid cost estimation, an average ADMD (defined as After Diversity
Maximum Demand) of 300W is assumed along with a power factor of 0.99.
• New grid extension will be funded as follows: 10% of the capital cost will be covered by connections fees
(although consumers are purportedly only expected to contribute 10% of this value, or ~$100USD), 10%
will be paid for by the utilities through surplus tariff revenues, with the remaining 80% being covered by
the government and development partners.
• The government was planning to complete a full tariff study the year this master plan was studied.

NESP Task-2 final report 44
Inputs
Table 6: Table of Inputs as Provided in the Castalia Prospectus
• Per-cell population density values were calculated from data collected by the Rwanda National Institute
of Statistics (NIS) during the 2008 National ID Project and entered as cell attributes in ArcGis.
• The geographical location of all prioritized social facilities, including health clinics, administrative
offices, and schools were obtained from NUR-CGIS (the Rwanda Centre for Geographic Information
Systems and Remote Sensing), and the MINEDUC and MINISANTE ministries, and were incorporated
into the GIS database.
• Existing and planned electrical network information was obtained from NUR-CGIS and MININFRA and
a subset of potential microhydro sites were taken from the "Hydropower Atlas", which was made available
through a study conducted by BTC in 2008. It should be noted that the microhydro sites selected from
the atlas for consideration in this study were only those having a potential installed capacity of 1 MW or
less.
• 'Typical' Conductor Sizes, as shown in Table 7, were provided by the utility for use in assessment of the
existing network, as the Prospectus indicates that "Distribution network information on line and cable
types for distribution feeders in Rwanda is currently very limited”.

NESP Task-2 final report 45
Table 7: Rwandan Standard Conductor Size Chart as Provided by RECO/Electrogaz for the Castalia Report
• The Prospectus indicates that network loading data was obtained from the National Dispatch Center, but
no further details as to the nature of this data, the form in which it was provided, or how exactly it was
used, were provided.
Methodology
Castalia states that the planning horizon used was 20 years, with a ‘directed focus’ on the first five years in order
to address the EDPRS electrification targets. The software used included Microsoft Office Excel and ArcGis
version 9.2. The figure below was provided in the Prospectus for the purpose of illustrating the steps followed in
the planning process. The titles from the planning blocks shown in this illustration will be used herein as the
framework for the description of the methodology employed.

NESP Task-2 final report 46
Figure 17: Planning Process Steps as Defied by Castalia
Demand Forecast (by sublocation)
Sublocations used for the purposes of this study were administrative divisions referred to as cells, defined by the
Rwanda National Institute of Statistics (NIS) to support its 2002 census data gathering activities. It is indicated
on pg. 23 of the Prospectus that "The technology selection model first conducts a simple load forecast for each
planning cell, using variables on population growth, affordability and load growth for new connections (using an
S-curve growth rate)”. Details regarding the load forecast calculation are not provided, but average estimated
annual per customer demand values are furnished in the Technical Annex and are shown in Table 8. A load
forecast, for which the source listed is "Electrogaz Reports and Government Estimates", was provided on pg. 4
of the Prospectus to accompany a brief discussion regarding utility-scale generation expansion planning, but there
was no indication that this load forecast information was used in the Castalia study itself.

NESP Task-2 final report 47
General
Category
Customer
Type 2009 2010 2011 2012 2013
Residential
and
Institutional
Existing 1224 1260 1296 1332 1368
Urban 993 1031 1074 1125 1155
Peri-urban 649 679 720 774 795
Rural 443 460 481 505 519
Deep Rural 354 368 385 404 415
Commercial Existing 80016 82016 84888 87432 87432
New
Connections 40008 41208 42444 43716 43716
Table 8: Estimated Average Consumer Demand per Customer *All values shown are in units of kWh.
Comparison of Cost of Technology Options (grid, diesel, hydro, PV)
The off-grid technology options considered include diesel generator set microgrid, microhydro generator
microgrid (where resources are conducive), and solar photovoltaic (PV) coupled with batteries for standalone
systems only. Microgrids consisting of technology combinations (e.g. microhydro or solar PV combined with
diesel backup) do not appear to have been considered. The selection of electricity provision technology was
performed on a per-cell basis, which means that all inhabitants of a given cell will receive power from the same
technology. The cost (both fixed and variable) of each off-grid energy provision option was considered and the
least cost option selected. This analysis was performed in a spreadsheet-based model that is referred to in the
Prospectus as the “Technology Selection Model”. Images of spreadsheet model results are provided in the
Technical Annex but the calculation details used to obtain those results and the actual spreadsheet were not made
available for review.
Selection of Least-cost Electrification Option (for each sublocation)
This analysis was also performed using the Technology Selection Model. Now that the least cost off-grid option
has been selected, it is compared with the cost of grid extension, and the least cost of these two options is assigned
as the electrification mode for the cell. The analysis is performed as follows: the cost of the selected off-grid
option is divided by the cost per kilometer of medium voltage (MV) line and the resulting length is considered to
be the maximum theoretical conductor length for which grid connection would be economical for the cell in
question. The value used as a proxy for the actual grid extension distance the cell would require is the distance
from the center of the cell to the edge of the nearest adjacent cell. If this distance is less than the max theoretical
NESP Task-2 final report 48
conductor distance, the cell is considered to be 'grid compatible', or best suited to grid connection. Otherwise, the
cell is slated for electrification with the least-cost off-grid source.
It should be noted that it is not disclosed the capacity of the MV conductor or what cost per kilometer value was
used in this procedure. Presumably the conductor size was not the same for every cell but was a function of the
projected demand of that cell, but this information was not included. In addition, if the cost of the off-grid option
used here is the same as that used for the off-grid technology selection, then it includes both fixed and variable
costs. This would imply that the cost per kilometer of the MV conductor would also need to include variable
costs, such as operations and maintenance costs. According to an entry on pg.23 of the Prospectus, a section of
the report other than that in which this process is initially presented, the procedure is described as follows: "The
model then compares the best decentralized electrification option with the capital and operating costs of a
"generalized grid" supply, initially disregarding the location of the existing electricity network”. This would seem
to imply that the cost per kilometer does in fact include some manner of operating costs, although this value too
remains unspecified.
Geospatial Prioritization for Grid-compatible Areas
Cells deemed 'grid compatible' are then weighted in order to determine the priority order for connection to the
grid. Weights are based on the following attributes of a cell: proximity to the existing medium-voltage network,
number of unelectrified households, inter-household distance (determined from population density values),
number of unelectrified social facilities, access to road networks, consumer ability to pay, existence of economic
development centers/markets, and presidential priorities for electrification. The methodology employed for
evaluating these inputs and using them to assign weighted values to cells is extremely vague and appears to be
based on a purely subjective visual assessment of the data as imported into and portrayed in ArcGis. The extent
of the information provided in the Prospectus regarding this weighting assessment process is as follows: "Each
attribute receives a weight according to its relative significance in determining the likely costs and benefits of
electrification. The total score for each sublocation is then used to rank the planning cells relative to each other.
Cells that receive the highest scores are prioritized for electrification in the access programme, according to a
realistic assessment of the number of new connections that can be achieved in each year”. It then goes on to say
that "This approach captures many of the elements that would form part of a project cost-benefit analysis – higher
population densities, proximity to the network and access to roads will all tend to lower the costs of the
programme. Prioritizing cells with more unelectrified households, social institutions, and economic activity will
tend to increase the economic benefits of the programme”.
Based on this cell prioritization, a least-cost annual grid extension approach was outlined for the next five years,
2009 through 2013, as was a final plan for the year 2020 claiming to achieve the Vision 2020 goal of 35% national
electrification. Results are discussed in the following section. It is indicated in the Prospectus that an additional
non-least-cost scenario was considered at the behest of the government which "provides grid coverage in ever

NESP Task-2 final report 49
sector by 2012". However, the corresponding plan illustration is for "100 Percent Grid Coverage of Administrative
Sectors" and the legend indicates that the connections shown are through planning year 2013. In either case, it is
not clear if 'providing grid coverage' to a 'sector' consists of electrifying all inhabitants, or extending MV line to
that cell and connecting only certain consumers. Due to lack of details, the methodology by which the plan for
this scenario was developed cannot be elaborated upon further for the purposes of this paper.
Geospatial Load Forecast and Review of Distribution Capacity
Although the Prospectus makes claim to development of a 'geospatial load forecast', neither the method by which
this load forecast is developed nor are the assumptions used in its development discussed. With regard to the
process of reviewing the distribution capacity, the Prospectus indicates only that the “typical conductor sizes have
been compared with network loading data received from the National Dispatch Centre”, but supporting
information was not provided.
Off-grid Electrification Planning for Non-Grid-Compatible Areas
Microhydro: As described in the Castalia inputs section, section 4.2 of the Prospectus reiterates that of the
potential hydro sites identified in the Hydropower Atlas, only those with a capacity equal to or less than 1MW
were considered as potential mini-grid microhydro sites and entered into the GIS input file. However, the
Prospectus then indicates in section 4.5 that only those sites having a potential capacity of less than 750kW were
considered. Based on the microhydro generator sizes listed in the Technical Annex, combinations of the following
generator sizes were considered in determination of system cost: 5, 25, 50,100, and 250kW. It is indicated that
sites with higher expected net present values, as well as those which are not expected to be capacity-constrained
within the following ten years, were prioritized. Based on this information, the top 25 sites were selected to factor
into the five-year development plan (without indication as to why the number 25 was used). Of these 25
microhydro sites, it was then determined which should be recommended for interconnection to the grid based on
whether or not the sum of the costs to develop and interconnect the site were less than the estimated long-term
marginal grid supply cost estimation of $0.12/kWh.
Solar PV: Social institutions which lay outside of cells selected for grid connection in the 5-year plan were
identified and included in the 5-year plan as recipients of solar PV units.
Report Conclusions and Recommendations
The results of the technology selection model are shown in Figure 18. Distribution lines shown represent the
existing network. A total of 95% of the cells were identified as being grid compatible, with microhydro mini-
grids representing the least-cost option for about 4.5% of the cells, and diesel mini-grids and standalone solar PV
being considered the least-cost option in fewer than 1% of the cells. It was further concluded in the report that
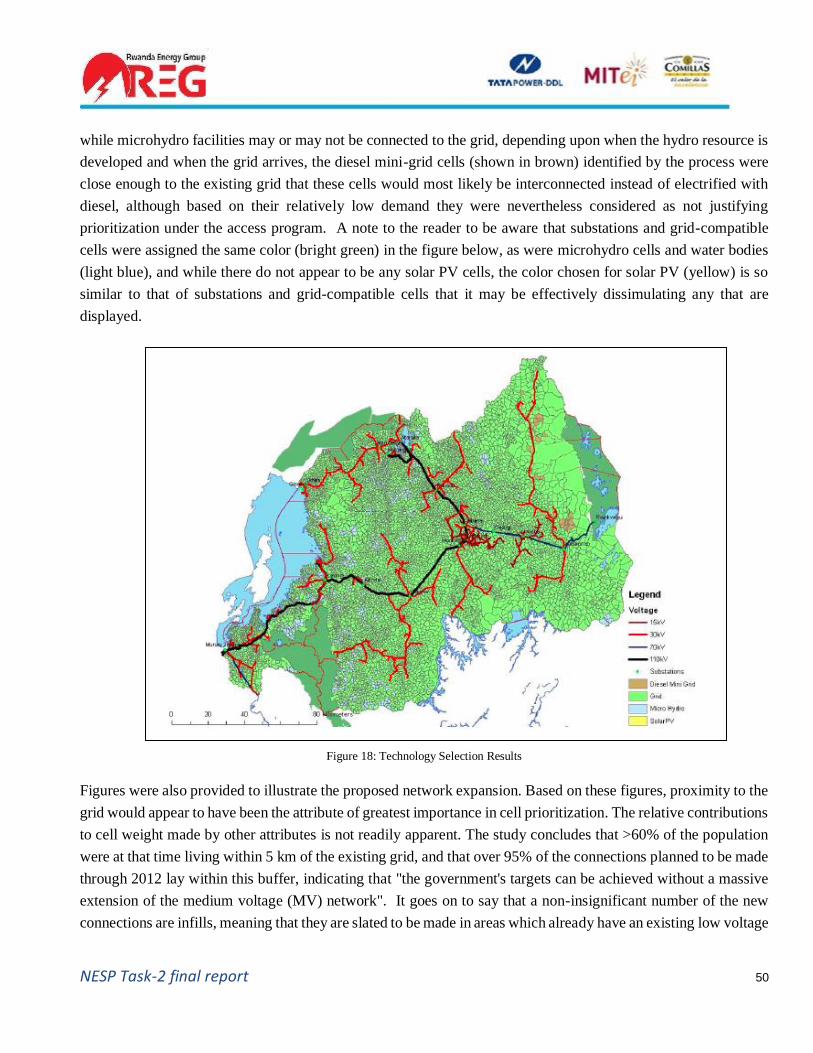
NESP Task-2 final report 50
while microhydro facilities may or may not be connected to the grid, depending upon when the hydro resource is
developed and when the grid arrives, the diesel mini-grid cells (shown in brown) identified by the process were
close enough to the existing grid that these cells would most likely be interconnected instead of electrified with
diesel, although based on their relatively low demand they were nevertheless considered as not justifying
prioritization under the access program. A note to the reader to be aware that substations and grid-compatible
cells were assigned the same color (bright green) in the figure below, as were microhydro cells and water bodies
(light blue), and while there do not appear to be any solar PV cells, the color chosen for solar PV (yellow) is so
similar to that of substations and grid-compatible cells that it may be effectively dissimulating any that are
displayed.
Figure 18: Technology Selection Results
Figures were also provided to illustrate the proposed network expansion. Based on these figures, proximity to the
grid would appear to have been the attribute of greatest importance in cell prioritization. The relative contributions
to cell weight made by other attributes is not readily apparent. The study concludes that >60% of the population
were at that time living within 5 km of the existing grid, and that over 95% of the connections planned to be made
through 2012 lay within this buffer, indicating that "the government's targets can be achieved without a massive
extension of the medium voltage (MV) network". It goes on to say that a non-insignificant number of the new
connections are infills, meaning that they are slated to be made in areas which already have an existing low voltage
NESP Task-2 final report 51
(LV) network and are concentrated in urban and peri-urban areas, which the report contends will also help to
minimize program costs.
A figure illustrating the existing network and the corresponding 5km buffer is available in Appendix I, along with
figures portraying the annual recommended grid connection scenarios for the ensuing 5 years, the plan for
achieving 100% Grid Coverage of Administrative Sectors, and a plan which achieves the Vision 2020 goal of
electrifying 35% of the population by the year 2020. An annual planning approach for progressing from the plan
in 2013 to that of 2020 was not provided.
Other results provided in the Prospectus and Technical Annex include:
• Medium and low voltage (MV/LV) annual investment totals, although no mention was made in the
Prospectus or Technical Annex as to how LV costs were estimated (no LV-level distribution designs
having been shown or discussed at any point in the report). The Technical Annex does provide annual
lump sum totals for the following items:
o MV Lines: Wires & Accessories, Poles, Transport, Labor
o MV/LV Transformers: Transformers & Accessories, Transport, Labor
o LV Lines: Wires & Accessories, Poles, Transport, Labor
o Service Connections: Service Cable & Meter, Transport, Labor
• The following conclusions were drawn with regard to network upgrades: 'An initial high-level assessment
of current loading indicates that adequate capacity will be generally available to support the new
connections during the initial years of the access program. However, detailed network modelling and load
flow analysis will be necessary in the implementation stage of the access program to identify potential
capacity constraints in specific areas”. It goes on to say that a cost estimate for network upgrades has
been provided with the report but that it is based only on expected demand growth.
• Sample results of the technology selection process are provided in the Technical Annex for 20 out of the
9300 cells evaluated. Included in these sample results are the technology types and sizes considered for
each cell, the corresponding total system costs that were calculated for each technology, the max MV
length, distance to the nearest cell, and least cost technology selected.
• The following are titles and subcomponent descriptions of additional results figures not discussed above
(all values listed are provided on an annual basis for the years 2009-2013, some through the year 2020):
o Capital Cost Components of Electricity Access Programme – per km costs for network extensions,
per connections costs for low voltage connections separated into infill, expansion, and CFLs(?),
network strengthening ($USD/MWh), off-grid technology connection costs for both solar PV and
microhydro ($/kW), solar hot water and technical assistance.
o Estimated System Operating Costs – Costs associated with current connections including generation,
transmission and distribution, and administrative costs; the same breakdown of costs but for new grid
connections; Off-grid connections; Operating contingencies.

NESP Task-2 final report 52
o Summary of Annual Capital Costs Associated with Sector Investment Plans (excluding generation
under PPAs) – Generation, HV Transmission, Distribution Rehabilitation, Access Program.
Sofreco Master Plan Study (2013)
The Sofreco study is comprised of eleven reports, one planning and one load flow report for each of the five
planning regions and a combined report summarizing the methodology used and findings at the national level.
Several supporting spreadsheet models were provided along with the report as well, in addition to a full suite of
GIS shapefiles. All documents were consulted for the purposes of this review.
Context
The Sofreco report was published in 2013, the same year that the second Rwandan Economic Development &
Poverty Reduction Strategy (EDPRS II 2013-2018) was published, the Early Access Roll Out Program was
updated (EARP II), and the year after the revised version of Rwanda Vision 2020 and the Energy Sector Strategic
Plan 2012/2017 were published. The Vision 2020 document indicates that the government had set a goal of
increasing the electrification rate to 1.5 million (or ~70% of the population) by 2017. EDPRS II called for 45%
of households to receive grid connection by 2017 through EARP, with the remainder of the population to be
connected through off-grid installations.
The Energy Sector Strategic Plan also indicated that the “government will support programs to ensure that 100%
of households get access to electricity through grid and off-grid solutions by 2017”. There is also a continuation
of the initiative discussed in the Castalia Prospectus to electrify social institutions which are not slated to receive
grid connection in the subsequent five years via solar PV, although goals have at this point been increased with
respect to the desired electrification rate of schools, from 50% to 100%. The goal for health facilities and
administrative offices remains at 100%. By this time, MININFRA has been appointed responsible for managing
the off-grid electrification efforts, while EWSA has been placed in charge of the grid component. According to
Figure 19: Rwanda Electrification Rate (grid access only) 2009-2016
Figure 19, the national electrification rate in Rwanda had grown to approximately 17%.

NESP Task-2 final report 53
Figure 19: Rwanda Electrification Rate (grid access only) 2009-2016 (Republic of Rwanda, Ministry of Infrastructure, 2016)
Objectives
The stated objectives of Sofreco are to A) develop a plan to support the Early Access Rollout Program to achieve
the goal set forth by the government to increase the national electrification rate to 70% by 2017, and B) provide
the government with an estimate of how many people would need to be relocated to the Imidugudu settlements
in order to achieve this goal. Sofreco describes its role as follows: "SOFRECO was appointed as a Planning
Consulting Firm with its mission's main objective to assist the newly formed Planning & Design Unit to meet the
electrification targets through the following: GIS, Electricity network design & planning, capacity building, and
training activities”.
Assumptions
• Consumer load values (see Table 9).
• Province-level load forecast assumptions (see Table 10).
• It was assumed that only 75% of potential consumers would connect during the planning period (although
scenarios where 100% connection was achieved were also considered), and that population growth would
remain at a steady 3% for the duration of the planning period.
• The cost for a fill-in connection occurring during the year 2012 was established by EWSA, independent
of this report, to be $600USD (where a fill-in connection is defined as any connection made to a portion
of the network in a year other than the year of its construction). The assumption was then made in this
report that the connection costs in subsequent years would be based on this value but reduced by $50 each

NESP Task-2 final report 54
year “as more and more infrastructure will be installed, and less low voltage has to be constructed each
year to cater for all the fill-in connections”.
• The phased capital investment schedule (see the results section) assumes a 5% escalation rate.
• The Sofreco study assumes 100% grid reliability and that sufficient generation supply will be available to
support the developed plans. It is stated in the report that the national target at that point in time was to
achieve a total of 1000MW of installed generation capacity by 2017.
Inputs
• Orthophotos which were several years old at the time, but which presumably covered the entire country,
were provided by EWSA.
• Consumer locations were derived from these orthophotos.
• Topographical data including roads, rivers, lakes, wetlands, and national parks was obtained from various
institutions.
• The locations of planned 11,782 Imidugudu settlements were provided by MINALOC.
• The 2012 EWSA connection forecast.
• Locations of social infrastructure – initial dataset provided by Rwanda government and EWSA but data
considered to be outdated so efforts were made by Sofreco to update this database.
• Existing electrical network – the initial dataset, presumably a vestige of the Castalia study, was found to
be incomplete and incorrect so efforts were made by Sofreco to update this database.
• Loading of existing substations and feeders and 'normal open points on the network' were provided by the
National Control Centre.
Methodology
The Sofreco combined report states initially that electrification via extension of LV and MV lines will be
"implemented based on the prioritization methodology described in the project Prospectus", which presumably
refers to the Sofreco Prospectus, as it then goes on to say that, “During the inception period, the revision of the
order of prioritized zones for undertaking the design and planning activities was discussed with the Director of
the Planning and Design Unit at EARP. Considering available information, on-going projects, recently completed
projects and the overall state of network development in each zone, it was agreed that the activities would be
carried out in the following revised order…”. The report goes on to describe the reorganization of the
electrification priorities by zone as follows (items taken directly from (Sofreco, 2013)):
1. South Zone: This zone has minimal activity in terms of new additional consumer connections. This has
to be taken up in first priority.
2. North Zone: Three big EPC contractors are being awarded contracts to undertake approximately 14,000
connections. The MV extension is expected to be 150 km. The project completion period is 18 months
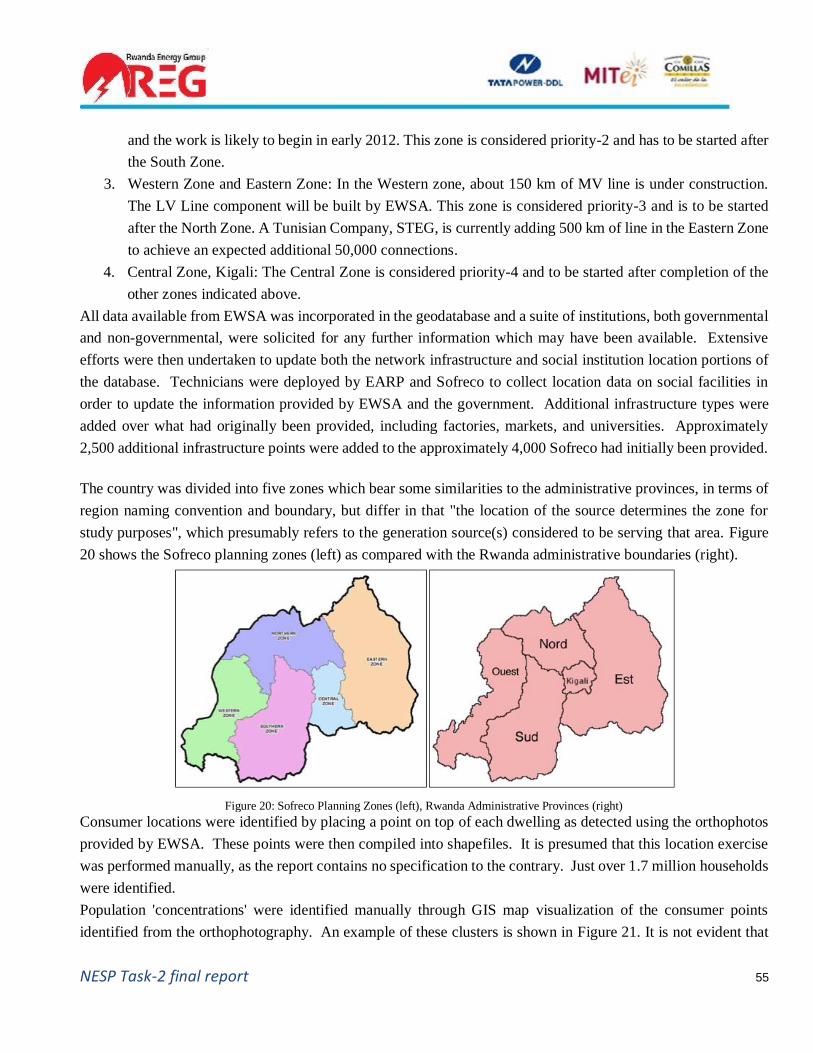
NESP Task-2 final report 55
and the work is likely to begin in early 2012. This zone is considered priority-2 and has to be started after
the South Zone.
3. Western Zone and Eastern Zone: In the Western zone, about 150 km of MV line is under construction.
The LV Line component will be built by EWSA. This zone is considered priority-3 and is to be started
after the North Zone. A Tunisian Company, STEG, is currently adding 500 km of line in the Eastern Zone
to achieve an expected additional 50,000 connections.
4. Central Zone, Kigali: The Central Zone is considered priority-4 and to be started after completion of the
other zones indicated above.
All data available from EWSA was incorporated in the geodatabase and a suite of institutions, both governmental
and non-governmental, were solicited for any further information which may have been available. Extensive
efforts were then undertaken to update both the network infrastructure and social institution location portions of
the database. Technicians were deployed by EARP and Sofreco to collect location data on social facilities in
order to update the information provided by EWSA and the government. Additional infrastructure types were
added over what had originally been provided, including factories, markets, and universities. Approximately
2,500 additional infrastructure points were added to the approximately 4,000 Sofreco had initially been provided.
The country was divided into five zones which bear some similarities to the administrative provinces, in terms of
region naming convention and boundary, but differ in that "the location of the source determines the zone for
study purposes", which presumably refers to the generation source(s) considered to be serving that area. Figure
20 shows the Sofreco planning zones (left) as compared with the Rwanda administrative boundaries (right).
Figure 20: Sofreco Planning Zones (left), Rwanda Administrative Provinces (right)
Consumer locations were identified by placing a point on top of each dwelling as detected using the orthophotos
provided by EWSA. These points were then compiled into shapefiles. It is presumed that this location exercise
was performed manually, as the report contains no specification to the contrary. Just over 1.7 million households
were identified.
Population 'concentrations' were identified manually through GIS map visualization of the consumer points
identified from the orthophotography. An example of these clusters is shown in Figure 21. It is not evident that

NESP Task-2 final report 56
any maximum customer-to-customer distance or other numerical grouping criteria was employed in this process.
These groupings are referred to in the report as planned MV/LV transformer zones and were made to encompass
not only consumer concentrations but also to include all Imidugudu settlements and as many social facilities as
possible. Zones were created covering a total of 482,854 existing potential consumers. That figure does not
account for expected population growth due to Imidugudu resettlement but the report indicates on pg. 24 that
expected growth due to resettlement was considered in the design phase for the purposes of determining network
component capacity needs. It is worth noting here that it is not entirely clear from the order of planning operations
described in the remainder of the report that this was the case.
Figure 21: Population Clusters or ‘Transformer Zones’ Identified by Sofreco
The number of customers lying within each transformer zone was then tallied and these values used to estimate
both initial and forecasted load values for each zone. Distribution networks were designed for each cluster, an
example of which can be seen in Figure 22 with LV conductors sized in order to accommodate expected long-
term load growth. Locations of transformers and the routing of MV and LV lines appear to have been identified
manually. LV lines were routed along roads with the working definition of electrification being that a potential
consumer was located "within service connection length from a low voltage line".

NESP Task-2 final report 57
Figure 22: Illustration of Network Design for two Transformer Zones
The report was not explicit about what planning horizon was considered ‘long term’, but entries in the spreadsheet
model would seem to suggest ten years (2013-2022). The report indicates that values estimated for initial demand,
demand growth, and saturation for each transformer zone were "derived from statistics and with the assistance of
EARP's planning department". These values can be seen in Table 9.
Load Category Rating(kVA)
% Growth from
2012-2017
% Growth
from 2017-
2022
Household growth 100 watts 300 Watts saturation after 6 years
Business Centre 10 3 2
Primary school 1 3 1
Secondary school 2 3 1
Health centers 10 4 2
Hospitals 20 2 1
Coffee wash station 2 1 1
Cell office 1 3 1
Sector office 2 3 1
District office 4 3 1
Factories 20 2 1
Market 8 4 2
Table 9: Consumer Load Assumptions (table taken from (Castalia Strategic Advisors, March 2009))
After the LV network was designed to accommodate the existing infrastructure and forecasted load for each
transformer zone, the MV network ties required in order to connect these transformer zones to the existing MV

NESP Task-2 final report 58
network were planned. It should be noted that care was taken to route lines with respect to topographical features,
avoiding traversing sensitive areas such as wetlands and crossing areas which may incur extra construction and
maintenance costs such large bodies of water. It was stated in the report that “all existing and future sources of
supply, such as existing and planned substations, planned hydro sites and potential hydro sites” were considered
in the planning of new MV conductor sections. “Thicker backbone lines were planned to these sources or potential
sources of supply. Also, proposed substation sites were used as future sources of supply and backbone lines were
planned from here. New feeders were also created to relieve the load off existing long feeders”. Load flow
studies were performed using a software called CYME to evaluate various buildout solutions during this line
routing process. The CYME model files were purportedly provided to the Rwandan working group but only the
regional load flow analysis results have been provided for MIT review.
The transformer zone designs were then grouped into what the report refers to as ‘lots’ for contract bidding
purposes. This process resulted in a total of 146 lots which were then prioritized for construction over a period
of five years, from 2013 -2017. Each lot was assigned a priority ranking based on the following attributes: the
social infrastructure it contained, its distance from the existing network, government targets for the district where
the lot was located, cost, and social demand, which was considered higher in areas with no pre-existing electrical
connections. An example of lot prioritization in the southern planning region can be seen in Figure 23.
Figure 23: An Example of Lot Prioritization in the Southern Planning Region
A connection forecast was then created for the purposes of determining how many consumers would need to be
successfully relocated and connected through the Imidugudu resettlement program in order for the government’s
goal of reaching a 70% electrification rate by 2017 to be reached. The forecast developed covered the years 2012
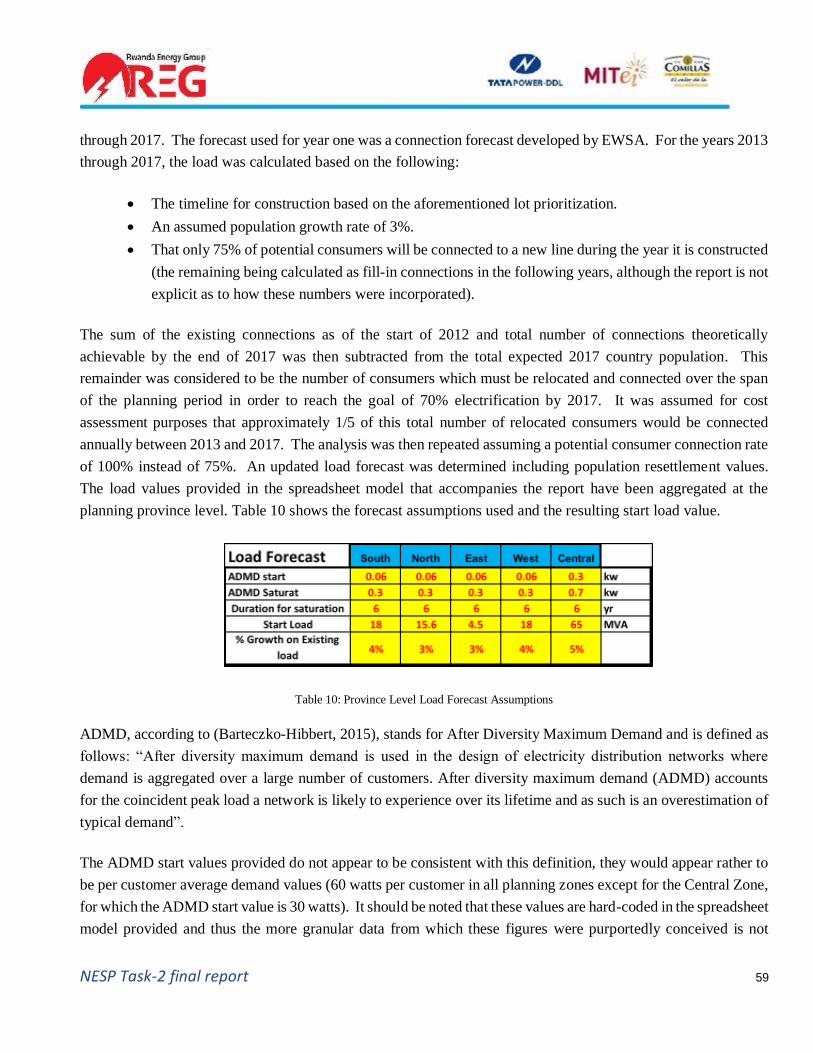
NESP Task-2 final report 59
through 2017. The forecast used for year one was a connection forecast developed by EWSA. For the years 2013
through 2017, the load was calculated based on the following:
• The timeline for construction based on the aforementioned lot prioritization.
• An assumed population growth rate of 3%.
• That only 75% of potential consumers will be connected to a new line during the year it is constructed
(the remaining being calculated as fill-in connections in the following years, although the report is not
explicit as to how these numbers were incorporated).
The sum of the existing connections as of the start of 2012 and total number of connections theoretically
achievable by the end of 2017 was then subtracted from the total expected 2017 country population. This
remainder was considered to be the number of consumers which must be relocated and connected over the span
of the planning period in order to reach the goal of 70% electrification by 2017. It was assumed for cost
assessment purposes that approximately 1/5 of this total number of relocated consumers would be connected
annually between 2013 and 2017. The analysis was then repeated assuming a potential consumer connection rate
of 100% instead of 75%. An updated load forecast was determined including population resettlement values.
The load values provided in the spreadsheet model that accompanies the report have been aggregated at the
planning province level. Table 10 shows the forecast assumptions used and the resulting start load value.
Table 10: Province Level Load Forecast Assumptions
ADMD, according to (Barteczko-Hibbert, 2015), stands for After Diversity Maximum Demand and is defined as
follows: “After diversity maximum demand is used in the design of electricity distribution networks where
demand is aggregated over a large number of customers. After diversity maximum demand (ADMD) accounts
for the coincident peak load a network is likely to experience over its lifetime and as such is an overestimation of
typical demand”.
The ADMD start values provided do not appear to be consistent with this definition, they would appear rather to
be per customer average demand values (60 watts per customer in all planning zones except for the Central Zone,
for which the ADMD start value is 30 watts). It should be noted that these values are hard-coded in the spreadsheet
model provided and thus the more granular data from which these figures were purportedly conceived is not

NESP Task-2 final report 60
available, making them difficult to reproduce or update. In addition, if the ADMD start and saturation values are
intended to represent consumer averages, then they would appear to be highly inconsistent with the table of
consumer load values used in the estimation of loads for each transformer zone (see Table 9) whose values range
from 100W to 20 kW. The long-term load forecast values, assuming relocation targets are met, are shown in
Figure 24.
Figure 24: Long-term Load Forecast Assuming Relocation Targets Met
Following the load forecast adjustment, a detailed bill of quantities was developed based on quantity and length
values calculated using the GIS software and a phased capital investment schedule was created. This was
accomplished by first tallying the capital investment required in each region for new construction based on the
lots identified and the year each was scheduled to be developed (it is not clear if this includes cost for suggested
upgrades for the existing network). Then the annual costs for fill-in connections, as based on the 2012 value
provided by EWSA (see the Sofreco Assumptions section for further details), were tallied. These two sets of
values were then added.
Report Conclusions and Recommendations
It was concluded in the Sofreco report that the network update designs it had formulated left "very few places
more than 2 or 3km away from a planned Medium Voltage line", the vast majority of Rwanda's population would
eventually be grid connected. The final network design was comprised of 5,083 transformers, 6,594km of MV
lines, and 10,058km of LV lines.
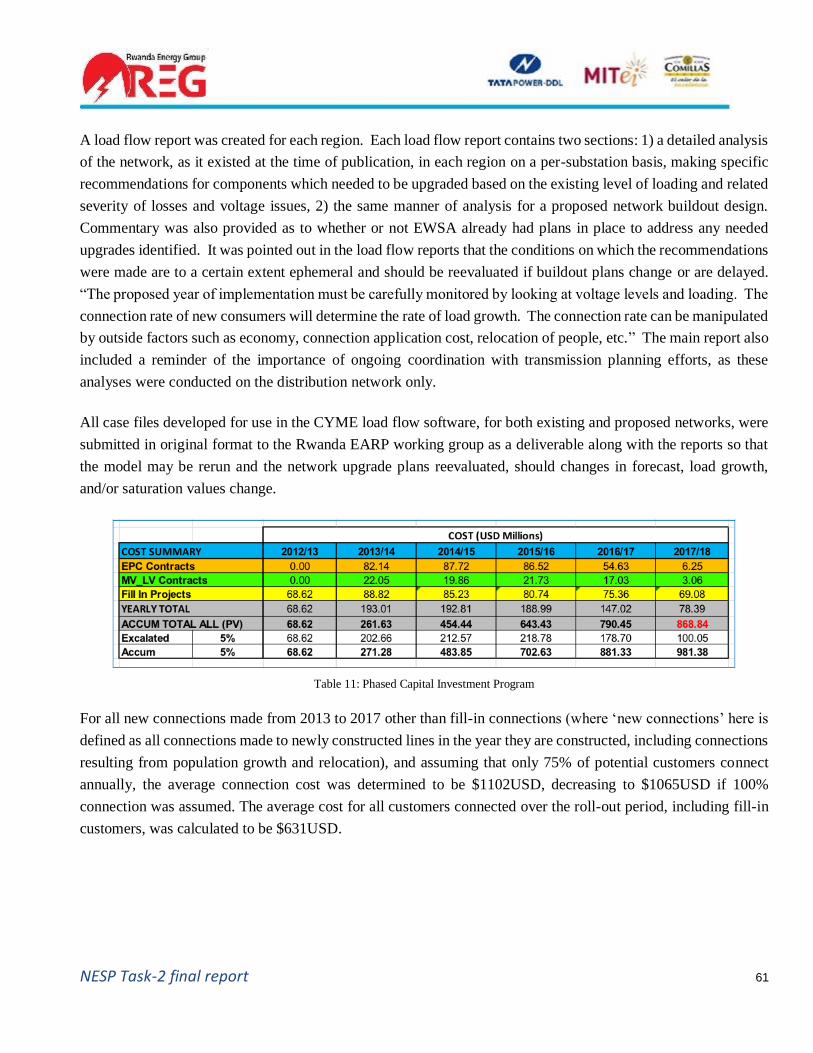
NESP Task-2 final report 61
A load flow report was created for each region. Each load flow report contains two sections: 1) a detailed analysis
of the network, as it existed at the time of publication, in each region on a per-substation basis, making specific
recommendations for components which needed to be upgraded based on the existing level of loading and related
severity of losses and voltage issues, 2) the same manner of analysis for a proposed network buildout design.
Commentary was also provided as to whether or not EWSA already had plans in place to address any needed
upgrades identified. It was pointed out in the load flow reports that the conditions on which the recommendations
were made are to a certain extent ephemeral and should be reevaluated if buildout plans change or are delayed.
“The proposed year of implementation must be carefully monitored by looking at voltage levels and loading. The
connection rate of new consumers will determine the rate of load growth. The connection rate can be manipulated
by outside factors such as economy, connection application cost, relocation of people, etc.” The main report also
included a reminder of the importance of ongoing coordination with transmission planning efforts, as these
analyses were conducted on the distribution network only.
All case files developed for use in the CYME load flow software, for both existing and proposed networks, were
submitted in original format to the Rwanda EARP working group as a deliverable along with the reports so that
the model may be rerun and the network upgrade plans reevaluated, should changes in forecast, load growth,
and/or saturation values change.
Table 11: Phased Capital Investment Program
For all new connections made from 2013 to 2017 other than fill-in connections (where ‘new connections’ here is
defined as all connections made to newly constructed lines in the year they are constructed, including connections
resulting from population growth and relocation), and assuming that only 75% of potential customers connect
annually, the average connection cost was determined to be $1102USD, decreasing to $1065USD if 100%
connection was assumed. The average cost for all customers connected over the roll-out period, including fill-in
customers, was calculated to be $631USD.

NESP Task-2 final report 62
Sofreco vs. Castalia
The purpose of this section is to use the information identified during review of the Castalia and Sofreco plans to
compare the objectives, approaches, assumptions and any other aspects of the two reports which may help to
inform the future use and or development of the Reference Electrification Model.
Master Plan Comparison
Objectives/Priorities/Major Assumptions
Priorities appear to have been reversed from one report to the next, from A) an attempt by the Castalia plan to
maximize the cost-benefit tradeoffs by prioritizing connection of those closest to population centers and the
existing network, and targeting regions where the ability to pay appeared to be the highest, to B) the prioritization
regime followed by the Sofreco study of making those areas which had seen the fewest connections in the
electrification process up to that point top priority and relegating fill-in connections in the Kigali region to the
back burner. Furthermore, the possible modes of electrification differed from one plan to the next. Castalia
claimed to be formulating a least-cost plan, where off-grid vs. grid extension technology costs were compared for
given demand level estimates. Sofreco, on the other hand, did not claim to be striving for a least-cost approach,
only a thorough one which aimed to meet the stated national electrification goals. By the time of the Sofreco
report, MININFRA had been put in charge of off-grid electrification and EWSA of grid extension. It is not clear
if the EARP Planning & Design group was affiliated only with/or under the direction of EWSA, but Sofreco was
only asked to look at grid extension. The only off-grid element mentioned in the Sofreco report was the
government goal of electrifying social facilities not slated for grid connection in the subsequent five years with
standalone solar PV, although the report makes no mention of this beyond the introduction section. The Sofreco
plan was also created after the Resettlement Act had gained momentum, so included this information in its plan
whereas it was not considered in the Castalia report.
Overall Structure and Organization of the Documents
One thing to note with regard to both reports is the lack of clarity regarding order of planning operations and the
manner in which assumptions were used. The planning methodology followed by Castalia was particularly
difficult to reconstruct for the purposes of reporting it in this paper. Elements of the planning process followed
were discussed out of chronological order with assumptions provided in some locations but not in others and
terminology that was often vague or descriptions which were seemingly conflicting. The Sofreco report was much
easier to follow as it was, for the most part, laid out in chronological order, but it still required a relative amount
of effort on the part of the reader to piece information together. For instance, it is unclear whether or not the load
forecast including the resettled consumers was the one used to inform the creation of the network design. The
way the report reads, the forecast including resettlement was determined after the network upgrades were

NESP Task-2 final report 63
designed. It is thus not evident upon which assumptions the transformer zone load forecasts, and thus ultimately
the network design, were based.
Quality of the Input Data
It was the conclusion of both reports that a more comprehensive and up-to-date geodatabase than what was
presented to them was ultimately required for the types of planning exercises they were attempting to carry out.
Sofreco put a great deal of work into gathering data for and updating GIS files of the existing network, and
commented in its report that it discovered during this process that the network files it was initially provided
(presumably those created during the Castalia planning process) were not only outdated but also incorrect. The
figure below was taken from the Sofreco report, and although no legend was included with the images, they
nevertheless give an indication of the amount of work required of Sofreco in order to update the database for use
in their planning process.
Figure 25: Sofreco Network Data as Received (left) and After Being Updated by Sofreco (right)
Methodologies
Several different areas of the methodologies employed by these two companies are worth commenting on, so the
discussion has been itemized by subtopic below.
• Distribution Line Routing and Topographical Features: The Castalia report does not appear to have
utilized any topographical information in the distribution line routing process, in fact the Prospectus makes
no mention of this process at all, although LV and MV component cost estimates are provided. Lack of
evidence that LV designs were actually created casts a certain level of doubt on the validity of these cost
estimates. Sofreco, on the other hand, created very detailed MV and LV designs and in the process, made
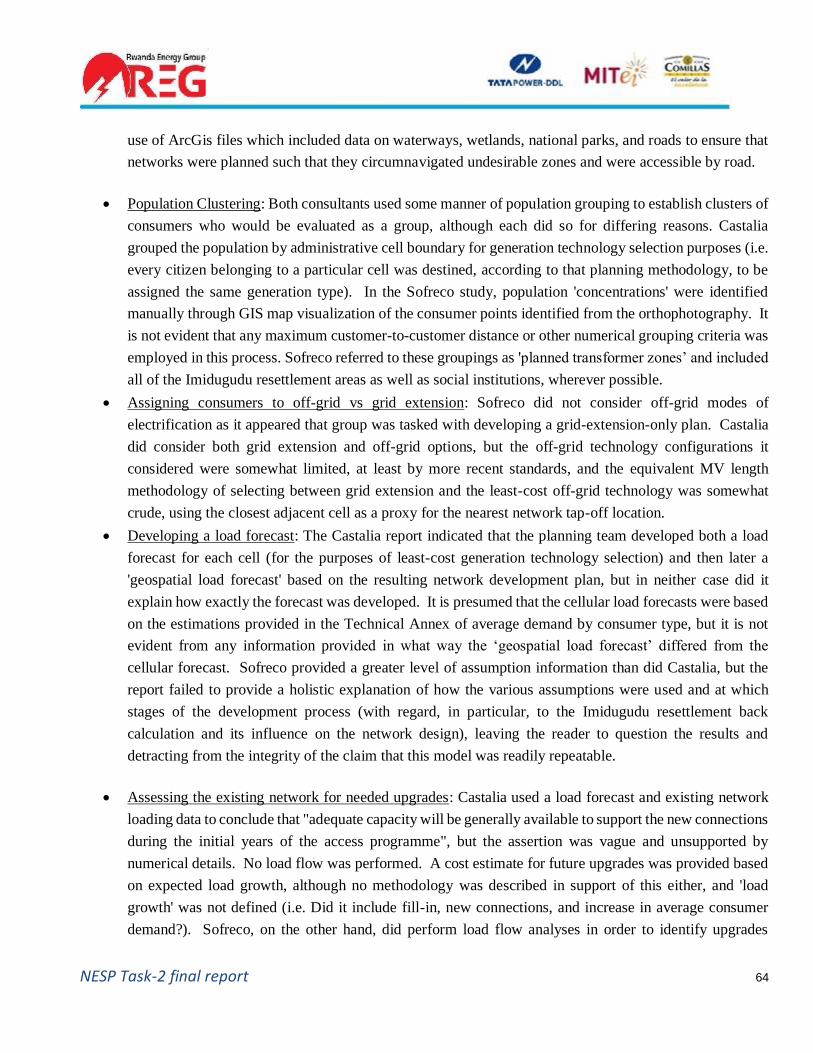
NESP Task-2 final report 64
use of ArcGis files which included data on waterways, wetlands, national parks, and roads to ensure that
networks were planned such that they circumnavigated undesirable zones and were accessible by road.
• Population Clustering: Both consultants used some manner of population grouping to establish clusters of
consumers who would be evaluated as a group, although each did so for differing reasons. Castalia
grouped the population by administrative cell boundary for generation technology selection purposes (i.e.
every citizen belonging to a particular cell was destined, according to that planning methodology, to be
assigned the same generation type). In the Sofreco study, population 'concentrations' were identified
manually through GIS map visualization of the consumer points identified from the orthophotography. It
is not evident that any maximum customer-to-customer distance or other numerical grouping criteria was
employed in this process. Sofreco referred to these groupings as 'planned transformer zones’ and included
all of the Imidugudu resettlement areas as well as social institutions, wherever possible.
• Assigning consumers to off-grid vs grid extension: Sofreco did not consider off-grid modes of
electrification as it appeared that group was tasked with developing a grid-extension-only plan. Castalia
did consider both grid extension and off-grid options, but the off-grid technology configurations it
considered were somewhat limited, at least by more recent standards, and the equivalent MV length
methodology of selecting between grid extension and the least-cost off-grid technology was somewhat
crude, using the closest adjacent cell as a proxy for the nearest network tap-off location.
• Developing a load forecast: The Castalia report indicated that the planning team developed both a load
forecast for each cell (for the purposes of least-cost generation technology selection) and then later a
'geospatial load forecast' based on the resulting network development plan, but in neither case did it
explain how exactly the forecast was developed. It is presumed that the cellular load forecasts were based
on the estimations provided in the Technical Annex of average demand by consumer type, but it is not
evident from any information provided in what way the ‘geospatial load forecast’ differed from the
cellular forecast. Sofreco provided a greater level of assumption information than did Castalia, but the
report failed to provide a holistic explanation of how the various assumptions were used and at which
stages of the development process (with regard, in particular, to the Imidugudu resettlement back
calculation and its influence on the network design), leaving the reader to question the results and
detracting from the integrity of the claim that this model was readily repeatable.
• Assessing the existing network for needed upgrades: Castalia used a load forecast and existing network
loading data to conclude that "adequate capacity will be generally available to support the new connections
during the initial years of the access programme", but the assertion was vague and unsupported by
numerical details. No load flow was performed. A cost estimate for future upgrades was provided based
on expected load growth, although no methodology was described in support of this either, and 'load
growth' was not defined (i.e. Did it include fill-in, new connections, and increase in average consumer
demand?). Sofreco, on the other hand, did perform load flow analyses in order to identify upgrades

NESP Task-2 final report 65
required by the existing network, and to evaluate possible electrical infrastructure buildout solutions.
Detailed load flow reports were provided for each planning region.
• Identification of Planning Stages: In the case of Sofreco, the Planning Director of the EARP design group
dictated the order of planning zone priority, with those regions having received the fewest connections to
that point taking top priority. From there, Sofreco created lots in each region, each including one or more
transformer zones, for bidding purposes and ranked them 1 through 5 (according to somewhat subjective
criteria), with these values corresponding to the year within the five-year planning period during which
they were to be constructed. In the Castalia report, priority for electrical connection via grid extension
was given to those consumers located within five kilometers of the existing network and which inhabited
districts considered as having the highest demand. Social institutions were also included, even if located
in areas not meeting these criteria. Once enough cells were selected to meet the 35% electrification target,
they were assigned to one of each of the five years of the planning timeframe, with those closest to the
existing network and closest to large population centers prioritized for the first years.
Study Replicability
It is not apparent that Castalia made the technology selection spreadsheet it used available to any particular
Rwandan planning group for later use, making the results of this study static and difficult to replicate. Sofreco
left both the spreadsheet model it used for demand and cost forecasting as well as the CYME software load flow
files to the EARP planning group for to update and reuse as necessary. However, it is important to note that off-
grid technologies were not considered in the Sofreco planning process so no tool was provided which can assist
in making decisions involving off-grid generation options.
Usefulness of Report Results
The intention of the Castalia report was to elicit funding by instilling confidence in donors with what was intended
to be a thorough analysis. But in an attempt to show that all possible costs had been considered, the report seems
to have succeeded in providing a great deal of unsupported, static values, many of which have little practical use
(for instance, Table 4.8 in the Technical Annex provides expected costs for each year from 2009 to 2013 for such
things as "Lowering Programme Cost" and creating "Joint sector performance reports"). And this seems to have
been done at the expense of providing procedural details for the planning process, which may have ultimately
been of much greater use to Rwandan planners. Sofreco’s study, on the other hand, left a substantial legacy of
planning details, which were seemingly of considerably greater use from a planner’s perspective, with specific
upgrade recommendations, designs based on load flow reports, and exact locations for placement of infrastructure.

NESP Task-2 final report 66
Evolution of the Rwandan Energy Sector Strategy
The Electrification goal as of the original Vision 2020 publication (ca. 2010) was 35% by 2020. The political
agenda to increase the national electrification rate went from a relatively modest goal of adding 250,000
connections over the course of five years (from 100,000 in 2008 to 350,000 in 2012), when the Castalia plan was
being drafted, to the more ambitious goal of achieving an electrification rate of either 70% (~1.5 million
connections) or even 100% by 2017, by the time the Sofreco report was published. EDPRS II, published in 2013,
stated that “approximately 48% of the total population will be within feasible range of the grid” and went on to
specify that EARP “will target around 45% of households with direct connections by 2017, while for the
remainder of the households off-grid solutions represent an attractive cost-effective option”. The Energy Sector
Strategic Plan 2013/14 – 2017/18, published in 2015, set as one of its ‘high-level target objectives’ to increase
household electricity access by 70%: 48% grid connection, 22% off-grid.
Then in 2016, the Rural Electrification Strategy (RES) was published by MININFRA, recognizing that the
consumption levels seen with the EARP connections which had been made by that point (totaling 226,000
households, representing an increase in the national electrification rate from just under 15% in 2012 to
approximately 24% by June 2016) were too low to ensure cost recovery for the utility. Almost half of those
connected under EARP were using less than 20 kWh per month when, according to the ESSP published in the
same year, cost recovery was only possible if each consumer used no less than approximately 130 kWh per month.
The report deduced from this that off-grid technologies needed to play a bigger role, pointing out that “Two
emerging technologies, standalone solar systems and mini-grids, have recently started to be delivered at large
scale across Africa, and there is significant scope for these technologies to be used in Rwanda to rapidly scale up
electricity access”. The document proposes a change in the working definition of energy access, suggesting that
instead of continuing to measure energy access as the percentage of grid-connected households, the levels of
access defined in the SE4All Multitier Framework should be incorporated into the national lexicon. These access
levels can be seen in Table 12 below.
Table 12: SE4All Consumption Tiers
It is suggested in the RES that the ESSP target of electrifying 48% of households through grid-connection by
2017/18 be revised to include any source (either on-grid or off-grid) which can provide access levels
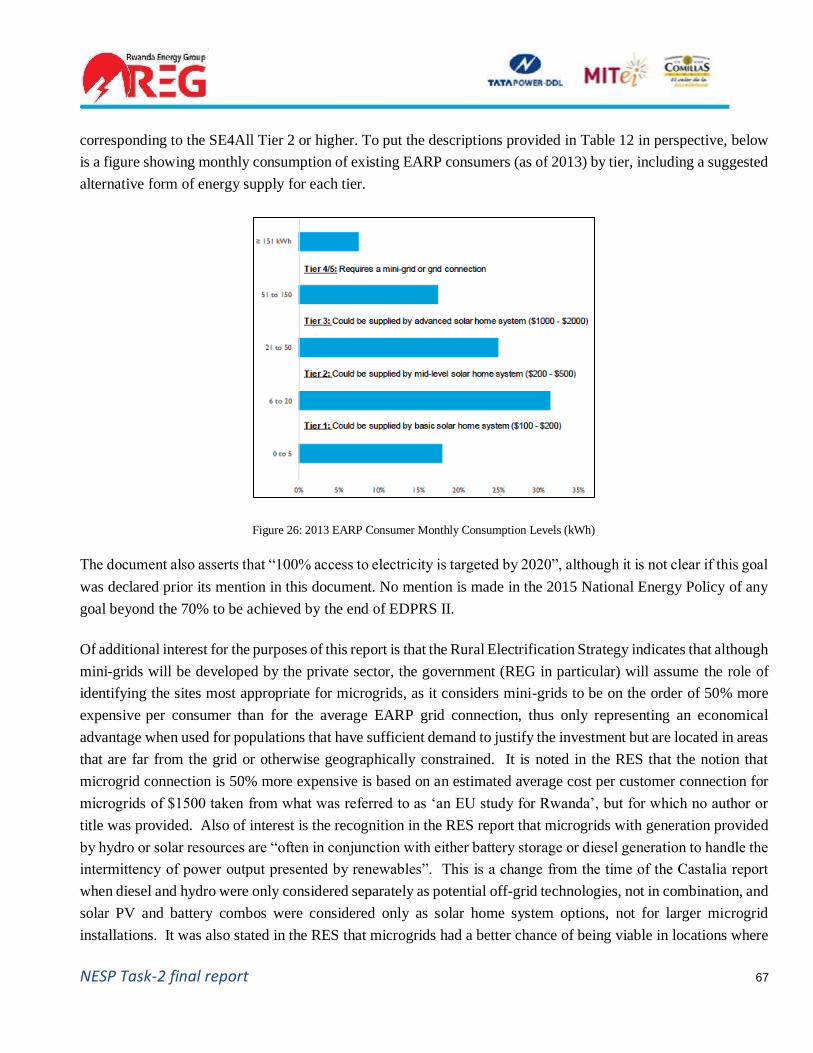
NESP Task-2 final report 67
corresponding to the SE4All Tier 2 or higher. To put the descriptions provided in Table 12 in perspective, below
is a figure showing monthly consumption of existing EARP consumers (as of 2013) by tier, including a suggested
alternative form of energy supply for each tier.
Figure 26: 2013 EARP Consumer Monthly Consumption Levels (kWh)
The document also asserts that “100% access to electricity is targeted by 2020”, although it is not clear if this goal
was declared prior its mention in this document. No mention is made in the 2015 National Energy Policy of any
goal beyond the 70% to be achieved by the end of EDPRS II.
Of additional interest for the purposes of this report is that the Rural Electrification Strategy indicates that although
mini-grids will be developed by the private sector, the government (REG in particular) will assume the role of
identifying the sites most appropriate for microgrids, as it considers mini-grids to be on the order of 50% more
expensive per consumer than for the average EARP grid connection, thus only representing an economical
advantage when used for populations that have sufficient demand to justify the investment but are located in areas
that are far from the grid or otherwise geographically constrained. It is noted in the RES that the notion that
microgrid connection is 50% more expensive is based on an estimated average cost per customer connection for
microgrids of $1500 taken from what was referred to as ‘an EU study for Rwanda’, but for which no author or
title was provided. Also of interest is the recognition in the RES report that microgrids with generation provided
by hydro or solar resources are “often in conjunction with either battery storage or diesel generation to handle the
intermittency of power output presented by renewables”. This is a change from the time of the Castalia report
when diesel and hydro were only considered separately as potential off-grid technologies, not in combination, and
solar PV and battery combos were considered only as solar home system options, not for larger microgrid
installations. It was also stated in the RES that microgrids had a better chance of being viable in locations where

NESP Task-2 final report 68
demand was “both high and spread across the day”, and thus selection of candidate locations by REG would
prioritize locations with anchor loads such as water pumping stations and cell phone towers.
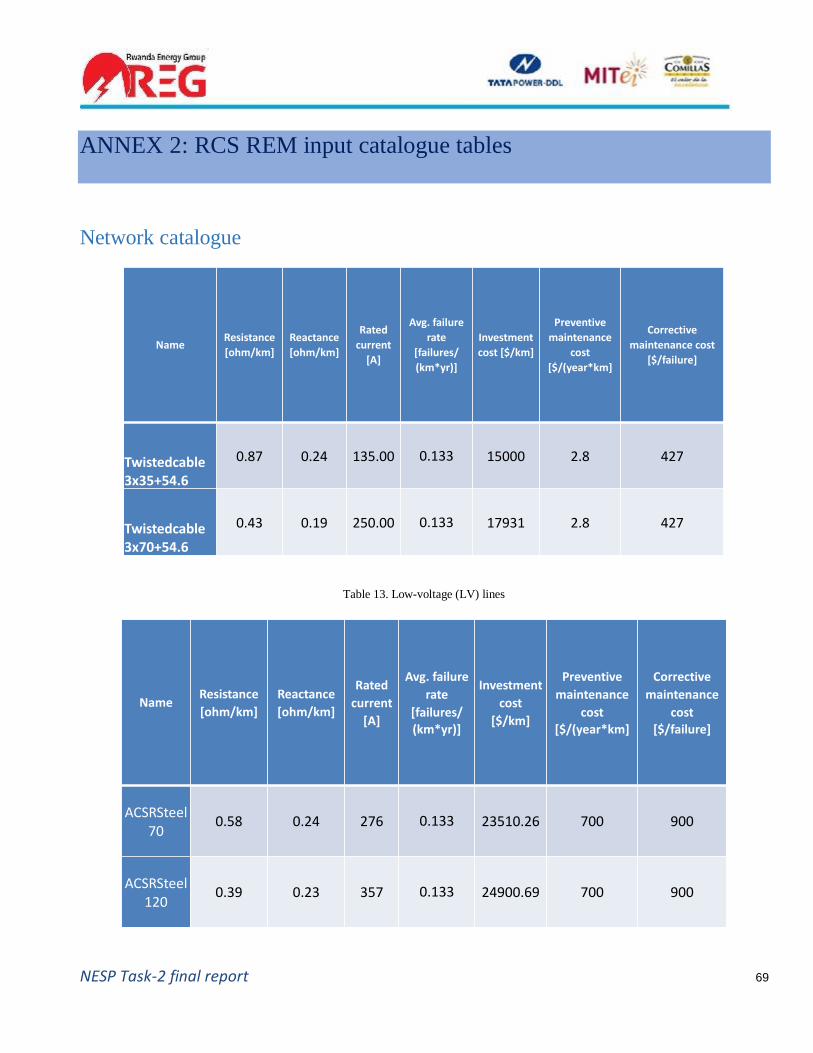
NESP Task-2 final report 69
ANNEX 2: RCS REM input catalogue tables
Network catalogue
Table 13. Low-voltage (LV) lines
NameResistance
[ohm/km]
Reactance
[ohm/km]
Rated
current
[A]
Avg. failure
rate
[failures/
(km*yr)]
Investment
cost [$/km]
Preventive
maintenance
cost
[$/(year*km]
Corrective
maintenance cost
[$/failure]
Twistedcable3x35+54.6
0.87 0.24 135.00 0.133 15000 2.8 427
Twistedcable3x70+54.6
0.43 0.19 250.00 0.133 17931 2.8 427
NameResistance
[ohm/km]
Reactance
[ohm/km]
Rated
current
[A]
Avg. failure
rate
[failures/
(km*yr)]
Investment
cost
[$/km]
Preventive
maintenance
cost
[$/(year*km]
Corrective
maintenance
cost
[$/failure]
ACSRSteel70
0.58 0.24 276 0.133 23510.26 700 900
ACSRSteel120
0.39 0.23 357 0.133 24900.69 700 900

NESP Task-2 final report 70
Table 14. Medium-voltage (MV) lines
Table 15. Medium-to-low voltage (MV/LV) transformers
Additional parameters :
• Cost of distribution energy RCS:0.12 $/kWh
• Discount rate: 8%
• Years of useful life for distribution network: 25 years
• Years of useful life for microgrids network: 25 years
• Maximum voltage drop at MV network: 4%
• Maximum voltage drop at end LV customer: 4%
Generation catalogue
Table 16. Solar (PV) panels
Name
Installed
power
capacity
[kVA]
MVVoltage
[kV]
No-load
lossess[kW]
Short-cirtuit
resistanceonthe
low-voltageside
[ohms]
Avg.Failure
rate
[failures/year]
Investment
cost[$]
Preventive
maintenance
cost[$/yr]
Corrective
maintenance
cost[$/failure]
CTI0_VUG 15 30 0.070 0.040 0.70 3600.0 80.20 25.80
CTI1_VUG 25 30 0.090 0.060 1.27 5653.9 80.20 25.80
CTI2_VUG 50 30 0.135 0.034 1.87 6876.5 80.20 25.80
CTI3_VUG 100 30 0.295 0.020 2.13 10442.3 80.20 25.80
CTI4_VUG 160 30 0.375 0.014 2.45 12012.2 80.20 25.80
CTI5_VUG 250 30 0.625 0.012 3.50 18555.0 80.20 25.80
CTI6_VUG 315 30 0.725 0.011 4.10 23222.0 80.20 25.80
CTI7_VUG 400 30 0.840 0.010 4.80 28455.0 80.20 25.80
Size [kW]Cost [$]
Lifetime [years]
Installation costs, as a fraction of panel cost
Annual O&M, as a fraction of panel cost
Annual O&M man-hours
Annual capacity
loss [p.u.]
0.02 20 25 0.1 0.01 5 0.007
0.25 125 25 0.1 0.01 5 0.007

NESP Task-2 final report 71
Table 17. Batteries
Diesel generators:
• Not required for the NEP of Rwanda
• Sensitivities run as backup (max 15% total energy)
• Features:
o 30 generator options (listed in the external “gencatalog” file) are included in the catalog
o They range in size from 5 – 2,250 kW at a cost of $3,200 – 450,000, respectively
o Assumptions used for each generator:
o Installation cost as a fraction of generator cost: 0.8
o Annual O&M as a fraction of generator cost: 0.05
o Annual O&M man-hours: 25
Charge controllers:
• Lifetime [years]: 15
• Efficiency [p.u.]: 0.95
• Installation costs as a fraction of charge controller cost: 0.1
• Annual O&M as a fraction of charge controller cost: 0.01
• Annual O&M man-hours: 2
Battery Name Cost [$]Energy [kWh]
Lifetime throughput
[kWh]SOC (min)
Capacity at end of life (fraction of nameplate
energy capacity)
Installation costs
as a
fraction of
battery cost
Annual O&M as
a fraction
of battery
cost
Annual O&M man-
hours
TROJ_T105 150 1.38 1656 0.5 0.8 0.1 0.01 5
VIS_CP12240D 60 0.2844 426 0.4 0.8 0.1 0.01 5

NESP Task-2 final report 72
Table 18. Charge controllers
Inverters:
• Lifetime [years]: 15
• Inverter efficiency [p.u.]: 0.95
• Rectifier efficiency [p.u.]: 0.9
• Installation costs as a fraction of charge controller cost: 0.1
• Annual O&M as a fraction of charge controller cost: 0.01
• Annual O&M man-hours: 2
Table 19. Inverters
Costs [$/kW] 927 740 600 543 364 319 260 220 190 190
Sizes [kW] 0.15 0.2 0.25 0.3 1 1.5 5 6 10 11.4

NESP Task-2 final report 73