Embed Size (px)
Citation preview
Hindawi Publishing CorporationArthritisVolume 2011, Article ID 475684, 19 pagesdoi:10.1155/2011/475684
Review Article
Quantitative Cartilage Imaging in Knee Osteoarthritis
Felix Eckstein1, 2 and Wolfgang Wirth1, 2
1 Institute of Anatomy and Musculoskeletal Research, Paracelsus Medical University, Strubergaβe 21, 5020 Salzburg, Austria2 Chondrometrics GmbH, 83404 Ainring, Germany
Correspondence should be addressed to Felix Eckstein, [email protected]
Received 19 August 2010; Accepted 25 October 2010
Academic Editor: Dirk Elewaut
Copyright © 2011 F. Eckstein and W. Wirth. This is an open access article distributed under the Creative Commons AttributionLicense, which permits unrestricted use, distribution, and reproduction in any medium, provided the original work is properlycited.
Quantitative measures of cartilage morphology (i.e., thickness) represent potentially powerful surrogate endpoints in osteoarthritis(OA). These can be used to identify risk factors of structural disease progression and can facilitate the clinical efficacy testingof structure modifying drugs in OA. This paper focuses on quantitative imaging of articular cartilage morphology in the knee,and will specifically deal with different cartilage morphology outcome variables and regions of interest, the relative performanceand relationship between cartilage morphology measures, reference values for MRI-based knee cartilage morphometry, imagingprotocols for measurement of cartilage morphology (including those used in the Osteoarthritis Initiative), sensitivity to changeobserved in knee OA, spatial patterns of cartilage loss as derived by subregional analysis, comparison of MRI changes withradiographic changes, risk factors of MRI-based cartilage loss in knee OA, the correlation of MRI-based cartilage loss with clinicaloutcomes, treatment response in knee OA, and future directions of the field.
1. Introduction
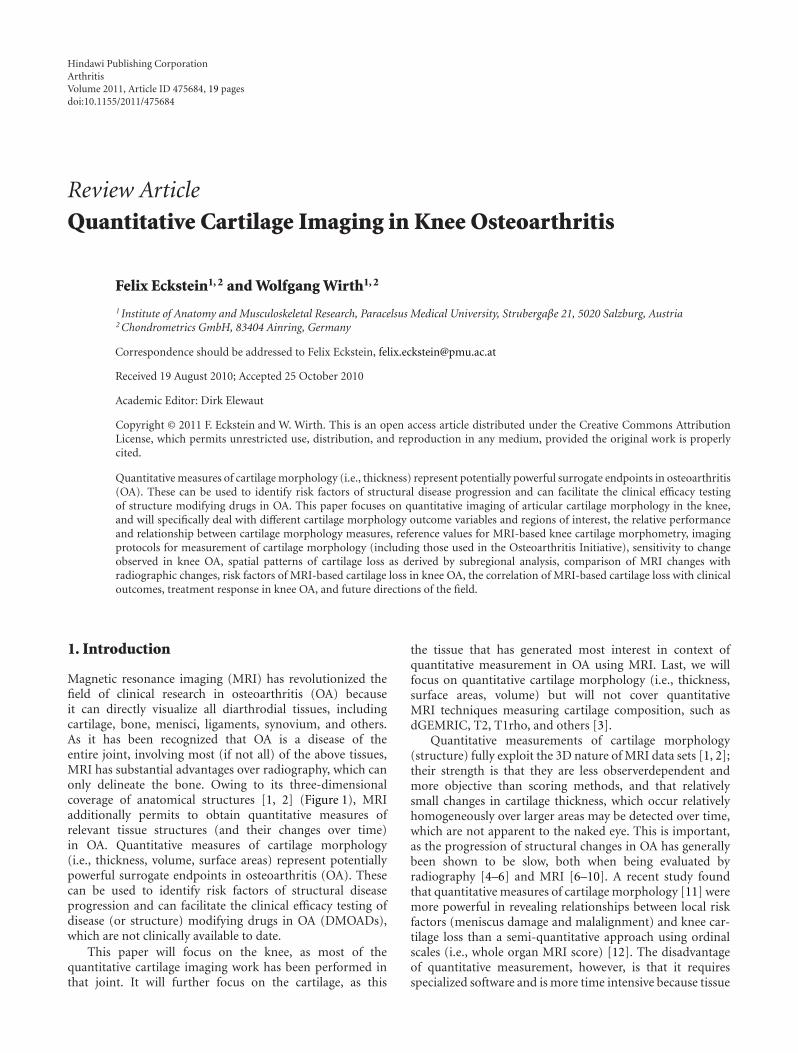
Magnetic resonance imaging (MRI) has revolutionized thefield of clinical research in osteoarthritis (OA) becauseit can directly visualize all diarthrodial tissues, includingcartilage, bone, menisci, ligaments, synovium, and others.As it has been recognized that OA is a disease of theentire joint, involving most (if not all) of the above tissues,MRI has substantial advantages over radiography, which canonly delineate the bone. Owing to its three-dimensionalcoverage of anatomical structures [1, 2] (Figure 1), MRIadditionally permits to obtain quantitative measures ofrelevant tissue structures (and their changes over time)in OA. Quantitative measures of cartilage morphology(i.e., thickness, volume, surface areas) represent potentiallypowerful surrogate endpoints in osteoarthritis (OA). Thesecan be used to identify risk factors of structural diseaseprogression and can facilitate the clinical efficacy testing ofdisease (or structure) modifying drugs in OA (DMOADs),which are not clinically available to date.
This paper will focus on the knee, as most of thequantitative cartilage imaging work has been performed inthat joint. It will further focus on the cartilage, as this
the tissue that has generated most interest in context ofquantitative measurement in OA using MRI. Last, we willfocus on quantitative cartilage morphology (i.e., thickness,surface areas, volume) but will not cover quantitativeMRI techniques measuring cartilage composition, such asdGEMRIC, T2, T1rho, and others [3].
Quantitative measurements of cartilage morphology(structure) fully exploit the 3D nature of MRI data sets [1, 2];their strength is that they are less observerdependent andmore objective than scoring methods, and that relativelysmall changes in cartilage thickness, which occur relativelyhomogeneously over larger areas may be detected over time,which are not apparent to the naked eye. This is important,as the progression of structural changes in OA has generallybeen shown to be slow, both when being evaluated byradiography [4–6] and MRI [6–10]. A recent study foundthat quantitative measures of cartilage morphology [11] weremore powerful in revealing relationships between local riskfactors (meniscus damage and malalignment) and knee car-tilage loss than a semi-quantitative approach using ordinalscales (i.e., whole organ MRI score) [12]. The disadvantageof quantitative measurement, however, is that it requiresspecialized software and is more time intensive because tissue

2 Arthritis
boundaries need to be tracked (i.e., segmented) throughoutlarge series of slices using trained technical personnel.Also, quantitative measurements are less sensitive to theoccurrences of small focal changes within larger structures(i.e., cartilage lesions), which may be readily picked upby an expert reader, particularly if the location within thelarger structure is variable from joint to joint. A recentstudy showed, for instance, that MRI-based semiquantitativescoring of cartilage status was able to differentiate betweenknees with and without early (i.e., Kellgren-Lawrence grade[KLG] 2) radiographic OA, whereas quantitative measuresof cartilage morphology displayed no or little differencebetween healthy and KLG2 knees [13]. It thus depends onthe context and on the specific research question, whetheror not quantitative cartilage assessment is better suited asan outcome measures for a particular study than semi-quantitative measures. Ideally, both approaches should beused in complimentary rather than competing fashion instudies assessing either the status or the progression of OA.
Focusing on quantitative imaging of cartilage morphol-ogy in the knee, this paper will sequentially address
(i) different cartilage morphology outcome variablesand regions of interest in the knee,
(ii) the relative performance and relationship betweencartilage morphology measures,
(iii) imaging protocols for measurement of cartilage mor-phology, including validation,
(iv) rates of change and sensitivity to change observed inknee OA.
(v) spatial patterns of cartilage loss in knee OA as derivedby subregional analysis,
(vi) comparison of MRI changes with radiographic chan-ges in knee OA,
(vii) risk factors of cartilage loss in the knee as identifiedby quantitative cartilage MR imaging,
(viii) the correlation of MRI-based cartilage loss with clin-ical outcomes, and treatment response in knee OA,
(xi) future directions of the field.
2. Cartilage Morphology Outcome Variablesand Regions of Interest in the Knee
A consensus-based nomenclature for the above-mentionedstructural (i.e., morphological metric labels) or composi-tional features as well as definitions for regions of interestin the knee (i.e., anatomical labels, see Table 1 and Figure 2)has been proposed by a group of experts [14]. Theabove nomenclature will be used throughout this paper,and important abbreviations for morphology metrics andanatomical regions of interests including recent extensions(i.e., statistical labels and subregional labels, i.e., [15]) aresummarized in Table 1. Cartilage morphology outcomes
(a)
(b)
Figure 1: 3D reconstruction of the knee cartilages after segmen-tation: (a) View from anteromedial with softtissues in grey (b)View from anterior-lateral, with the bone segmented and withthe cartilage thickness distribution in the patella displayed in falsecolors (red: thick cartilage; blue: thin cartilage). The cartilage of themedial tibia (MT) is depicted dark blue, that of the lateral tibia (LT)green), that of the medial weight-bearing femoral condyles (cMF)yellow, that of the lateral weight-bearing femoral condyles (cLF)red, that of the patella (P) magenta, and that of the femoral trochlea(TrF) turquoise. Segmentation was performed based on a 3D-DESSknee imaging data set from the Osteoarthritis Initiative (OAI),a public-private partnership funded by the National Institutesof Health and conducted by the OAI Study Investigators. Foranatomical (region of interest) labels, also see Figure 2 and Table 1.
commonly include the size of the total area of subchondralbone (tAB), the area of the cartilage surface (AC), thedenuded (dAB) and cartilage covered (cAB) area of subchon-dral bone, the cartilage thickness over the tAB (ThCtAB)or over the cAB (ThCcAB), the cartilage volume (VC),the cartilage volume normalized to the tAB (VCtAB), thecartilage signal intensity [16–18], and others (Table 1).
To obtain the above quantitative morphological mea-sures of cartilage, the relevant cartilage plates of a joint needto be segmented by a trained user with the choice of severalinput devices [19], with or without assistance from (semi-automated) segmentation software [20–28]. Because therelative performance of different segmentation algorithmshas been discussed in previous reviews [9], this point will

Arthritis 3
Table 1: Morphological (metrics), statistical, and anatomical (region of interest) labels commonly used in cartilage morphology publicationson the knee.
Abbreviation Explanation Unit
Morphological (metrics) label
VC volume of the cartilage (mm3/mL)
tAB total area of subchondral bone (cm2)
AC area of cartilage surface (cm2)
cAB area of tAB covered by AC (cm2)
dAB% percent of tAB denuded (not covered by AC) (%)
VCtAB volume of the cartilage divided by tAB (mm)
ThCtAB thickness of the cartilage over the entire tAB (mm)
ThCcAB thickness of cartilage over cAB (mm)
dAB% percent of tAB denuded (not covered by AC) (%)
VCtAB volume of the cartilage divided by tAB (mm)
ThCtAB thickness of the cartilage over the entire tAB (mm)
ThCcAB thickness of cartilage over cAB (mm)
Statistical labels
Me mean (i.e., thickness)
Max maximum (i.e., thickness)
Mavmaximal averaged, for example, mean of the top1% values
Min minimum (i.e., thickness)
Mivminimum averaged, for example, mean of thelowest 1% values
SD standard deviation (i.e., thickness)
CV% coefficient of variation (i.e., thickness)
c(Me, Mav)thickness measured from cartilage surface (AC) tobone interface (tAB)
b(Me, Mav)thickness measured from bone interface (tAB) tocartilage surface (AC)
a(Me, Mav) average of the two above (b, c)
Anatomical (region of interest) labels
Total cartilage plates
P Patella
MT Medial tibia
LT Lateral tibia
F Femur
TrF Femoral trochlea
MF Medial femoral condyle
cMF weight-bearing portion of MF
pMF posterior portion of MF
LF Lateral femoral condyle
cLF weight-bearing portion of LF
pLF posterior portion of LF
MFTC aggregate values for MT and cMF (MT + cMF)
LFTC aggregate values for LT and cLF (LT + cLF)
Subregions (to be combined with above total plate labels, i.e., cMT or ccMF)
c central
e external
i internal
a anterior
p posterior
For anatomical (region of interest) labels, also see Figures 1 and 2.
4 Arthritis
not be covered in depth in this chapter. Using the above tools,an operator needs to accurately trace both the bone-cartilageinterface (i.e., the subchondral bone surface; tAB), and thesurface of the cartilage, respectively (AC). The tracing of thetAB should include dABs, but not (peripheral) osteophytesurfaces. As there are various sources of artifacts on MRI, andbecause signal intensity and contrast may vary substantiallybetween baseline and followup acquisitions, there exists acurrent consensus that expert quality control is importantfor accurate analyses; the time required for segmentation ofthe cartilages or for the correction of computer-generatedsegmentation may take several hours per knee joint. Afterall slices of interest have been segmented, image analysissoftware can be used to compute the three-dimensionalmorphological features listed in Table 1.
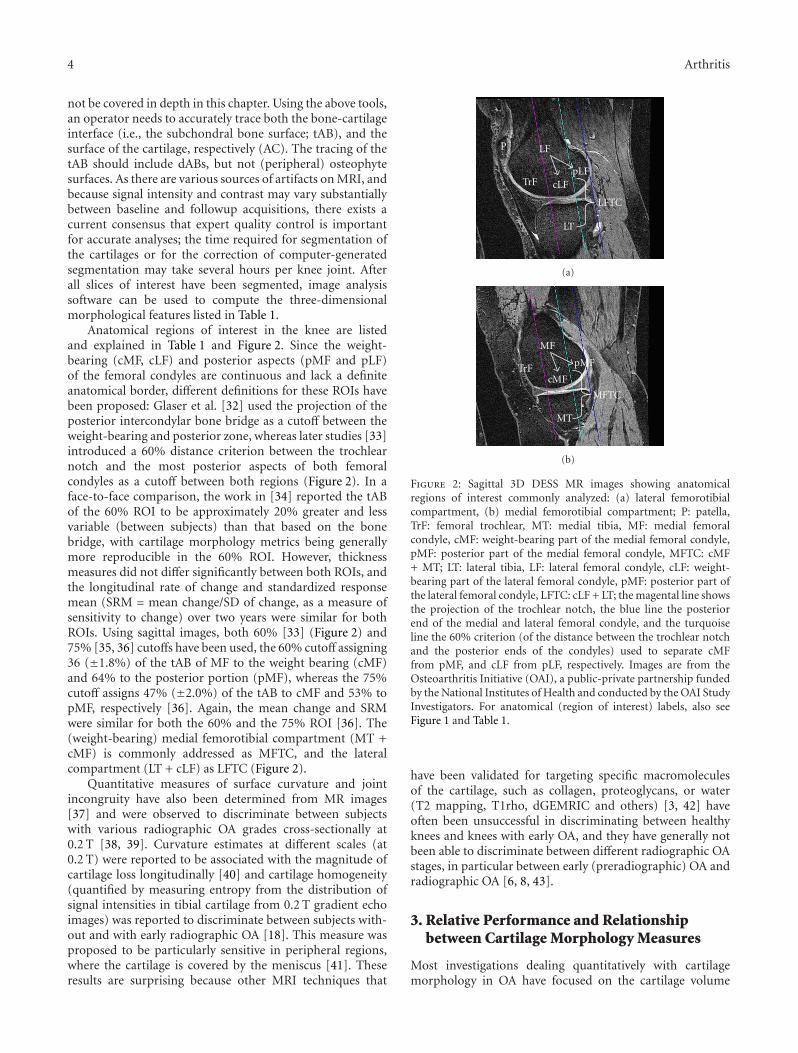
Anatomical regions of interest in the knee are listedand explained in Table 1 and Figure 2. Since the weight-bearing (cMF, cLF) and posterior aspects (pMF and pLF)of the femoral condyles are continuous and lack a definiteanatomical border, different definitions for these ROIs havebeen proposed: Glaser et al. [32] used the projection of theposterior intercondylar bone bridge as a cutoff between theweight-bearing and posterior zone, whereas later studies [33]introduced a 60% distance criterion between the trochlearnotch and the most posterior aspects of both femoralcondyles as a cutoff between both regions (Figure 2). In aface-to-face comparison, the work in [34] reported the tABof the 60% ROI to be approximately 20% greater and lessvariable (between subjects) than that based on the bonebridge, with cartilage morphology metrics being generallymore reproducible in the 60% ROI. However, thicknessmeasures did not differ significantly between both ROIs, andthe longitudinal rate of change and standardized responsemean (SRM = mean change/SD of change, as a measure ofsensitivity to change) over two years were similar for bothROIs. Using sagittal images, both 60% [33] (Figure 2) and75% [35, 36] cutoffs have been used, the 60% cutoff assigning36 (±1.8%) of the tAB of MF to the weight bearing (cMF)and 64% to the posterior portion (pMF), whereas the 75%cutoff assigns 47% (±2.0%) of the tAB to cMF and 53% topMF, respectively [36]. Again, the mean change and SRMwere similar for both the 60% and the 75% ROI [36]. The(weight-bearing) medial femorotibial compartment (MT +cMF) is commonly addressed as MFTC, and the lateralcompartment (LT + cLF) as LFTC (Figure 2).
Quantitative measures of surface curvature and jointincongruity have also been determined from MR images[37] and were observed to discriminate between subjectswith various radiographic OA grades cross-sectionally at0.2 T [38, 39]. Curvature estimates at different scales (at0.2 T) were reported to be associated with the magnitude ofcartilage loss longitudinally [40] and cartilage homogeneity(quantified by measuring entropy from the distribution ofsignal intensities in tibial cartilage from 0.2 T gradient echoimages) was reported to discriminate between subjects with-out and with early radiographic OA [18]. This measure wasproposed to be particularly sensitive in peripheral regions,where the cartilage is covered by the meniscus [41]. Theseresults are surprising because other MRI techniques that
P
TrF cLFpLF
LT
LF
LFTC
(a)
TrFcMF
pMF
MT
MF
MFTC
(b)
Figure 2: Sagittal 3D DESS MR images showing anatomicalregions of interest commonly analyzed: (a) lateral femorotibialcompartment, (b) medial femorotibial compartment; P: patella,TrF: femoral trochlear, MT: medial tibia, MF: medial femoralcondyle, cMF: weight-bearing part of the medial femoral condyle,pMF: posterior part of the medial femoral condyle, MFTC: cMF+ MT; LT: lateral tibia, LF: lateral femoral condyle, cLF: weight-bearing part of the lateral femoral condyle, pMF: posterior part ofthe lateral femoral condyle, LFTC: cLF + LT; the magental line showsthe projection of the trochlear notch, the blue line the posteriorend of the medial and lateral femoral condyle, and the turquoiseline the 60% criterion (of the distance between the trochlear notchand the posterior ends of the condyles) used to separate cMFfrom pMF, and cLF from pLF, respectively. Images are from theOsteoarthritis Initiative (OAI), a public-private partnership fundedby the National Institutes of Health and conducted by the OAI StudyInvestigators. For anatomical (region of interest) labels, also seeFigure 1 and Table 1.
have been validated for targeting specific macromoleculesof the cartilage, such as collagen, proteoglycans, or water(T2 mapping, T1rho, dGEMRIC and others) [3, 42] haveoften been unsuccessful in discriminating between healthyknees and knees with early OA, and they have generally notbeen able to discriminate between different radiographic OAstages, in particular between early (preradiographic) OA andradiographic OA [6, 8, 43].
3. Relative Performance and Relationshipbetween Cartilage Morphology Measures
Most investigations dealing quantitatively with cartilagemorphology in OA have focused on the cartilage volume

Arthritis 5
ccLF−0.1%(−0.02)
icLF−0.3%(−0.07)
ecLF+0.3%(+0.11) ccMF
−3.5%(−0.39)
ecMF−2.7%(−0.33)
icMF−1.6%(−0.34)
(a)
MFTC−1.8%(−0.47)
LFTC−0.5%(−0.18)
cLF0.0%
(−0.00)
LT−0.8%(−0.35)
cMF−2.6%(−0.42)
MT−1.2%(−0.44)
(b)
pMT−0.7%(−0.12)
aMT−0.9%(−0.25)
cMT−1.7%(−0.44)
eMT−2.2%(−0.38)
iMT−0.5%(−0.19)
pLT−1.1%(−0.23)
aLT−0.2%(−0.07)
cLT−1.2%(−0.31)
eLT−0.5%(−0.14)
iLT−1.1%(−0.32)
(c)
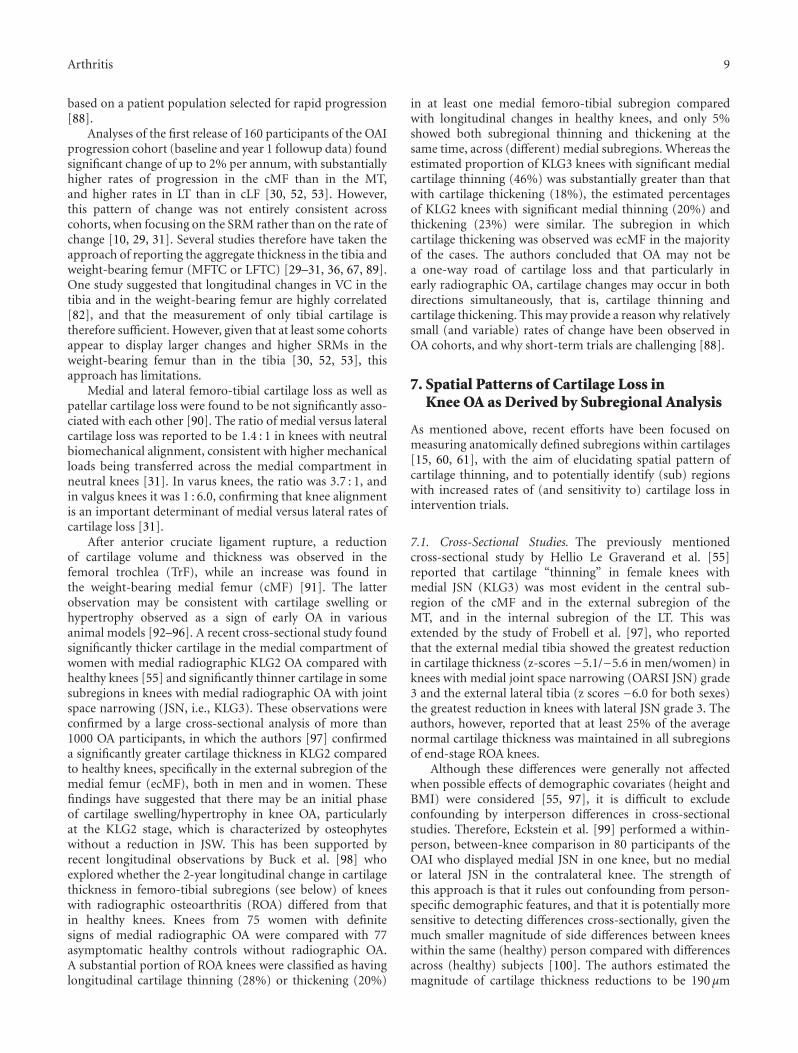
Figure 3: Display of the rates of change (%/annum) and standardized response mean (SRM) in femorotibial cartilage compartments, platesand subregions. (a) View of the weight-bearing part of the medial (cMF) and lateral femoral condyle (cLF) from inferior. (b) View of theweight-bearing part of the cMF and cLF and of the medial (MT) and lateral tibia (LT) from posterior. (c) View of the MT and LT fromsuperior. For an explanation of the subregion abbreviations, please see Table 1. The data represent mean values from 3 studies: (i) the KLG3participants of the A 9001140 study (n = 28) [29], (ii) the high risk (BMI > 30; KLG ≥ 2) subcohort from a first release of OAI participants(n = 54) [30], (iii) knees with neutral alignment from the MAK study (n = 74) [31].
(VC), but this outcome measure has a number of pitfalls.The ability to discriminate between OA and healthy subjectsis limited, because cartilage volume is largely determined bybone size, which increases the intersubject variability andthus limits the ability to discriminate between subjects withand without cartilage loss [44]. This has led to misinterpre-tations in the literature, where it has been suggested thata high VC may be protective of OA, because men showhigher VCs than women, and women are more susceptibleto knee OA than men. However, men have mainly largerjoint surfaces than women (and hence also larger VC) [45]even after adjustment for body height and weight [46]; VCshould therefore not be directly compared between sexes.In longitudinal studies, the subchondral bone area has beenshown to increase with aging, both in healthy reference
subjects and in OA patients [47–49]. Such effects may maska reduction in cartilage thickness in OA when measuringVC, because of the simultaneous expansion of the bone andcartilage layer. Therefore, alternative outcomes have beenused, such as the VC normalized to the subchondral bonearea (VCtAB), or the cartilage thickness over the entiresubchondral bone area (ThCtAB) [44, 50].
In a recent study, Hudelmaier et al. [34] examined therelationship of the above parameters and their test-retest pre-cision (at 3 T) in a set of 33 subjects, both without and withsigns of radiographic osteoarthritis (reproducibility study).Further, they compared these parameters at baseline and at2-year followup in 28 subjects with advanced radiographicosteoarthritis (sensitivity study). They found that the AC waslarger than the tAB in all cartilage plates. In MT and LT,

6 Arthritis
the cartilage volume divided by the total bone area (VCtAB)was similar to the mean cartilage thickness over the totalbone area (ThCtAB.aMe), whereas in cMF and cLF theVCtAB was somewhat greater than the ThCtAB.aMe. Dif-ferent implementations of measuring the cartilage thickness(e.g., minimal distance from bone to cartilage, or minimaldistance from cartilage to bone, or the average of both)produced very similar values in all cartilage plates. Themaximal thickness over the total bone area (ThCtAB.Max)was found to be almost twice as high as the mean thickness(ThCtAB.Me) in the femorotibial plates. Reproducibilityerrors for cartilage volume divided by the tAB (VCtAB) weresimilar to those for the cartilage thickness over the totalbone area (ThCtAB) and tended to be smaller than thosefor cartilage volume (VC). The reproducibility errors werealso similar for different implementations of the thicknessmeasurements (see above). The maximal thickness overthe total bone area (ThCtAB.Max) and the average of thetop 1% greatest thickness values (ThCtAB.Mav) displayedlarger reproducibility errors than the averaged mean cartilagethickness over the total bone area (ThCtAB.Me) in allcartilage plates, but reproducibility errors for ThCtAB.Mavtended to be smaller than those for ThCtAB.Max. In terms ofthe rate of (and sensitivity to) change, the cartilage volumedivided by the total bone area (VCtAB), and the meancartilage thickness over the total bone area (ThCtAB.aMe)exhibited higher rates of change and greater SRMs (greatersensitivity to change) than cartilage volume (VC) in MT, butthe difference was only marginal in cMF. The rates of changeand SRMs for cartilage thickness over the covered bone area(ThCcAB) tended to be less than for cartilage thickness overthe total bone area (ThCtAB) and for cartilage volume (VC),independent of the specific implementation, but tended tobe greater than those for cartilage surface area (AC) andthe cartilage covered bone area (cAB). ThCtAB.Max andThCtAB.Mav showed low rates of change and SRMs, inparticular in cMF. Table 2 lists the percent change, the SRM,the significance level, and the precision error (test-retest)in MT and cMF (60% ROI) for different morphologicalvariables from this study [34]. In summary, the normalizedcartilage volume (VCtAB) and the mean cartilage thicknessover the entire subchondral bone area (ThCtAB.Me) tendedto be more reproducible and more sensitive to change (SRMup to −0.62) than cartilage volume (SRM up to −0.44),cartilage thickness over the cartilaginous area (ThCcAB;SRM up to −0.48) or maximal cartilage thickness (SRM upto −0.35) [34].
Other publications also reported that the sensitivityto change for ThCtAB or VCtAB was greater than forVC [30, 31], whereas others found comparable SRMs forthese variables [51, 52]. A recent paper [31] reported that,when cartilage loss was rapid (due to high mechanicalchallenge in mal-aligned knees), “horizontal” cartilage loss(i.e., an increase in denuded area = dAB) made a strongercontribution to the total cartilage loss (= reduction inThCtAB), whereas when cartilage loss was relatively slowin neutrally aligned knees, the “vertical” cartilage loss(reduction ThCcAB) made a stronger contribution. Thisfinding will need to be confirmed in other cohorts and
pathos-phyiological conditions. Wirth et al. [53] recentlyexplored the rate and sensitivity to change of the minimalcartilage thickness (ThCtAB.Min) and applied the measure-ment to central subregions of MT, LT, cMF, and cLF, respec-tively. In 156 participants of the Osteoarthritis Initiative(OAI), they found the one-year rate of the ThCtAB.Minchanges to be greater than those of ThCtAB.Me, but alsoreported a greater standard deviation, so that ThCtAB.Minwas found to be less sensitive to change than ThCtAB.Me.
A recent paper [54] investigated the mathematical rela-tionship between the above morphologic measurementsand explored whether a subset of the above variables fullyreflects differences observed in cartilage in cross-sectionaland longitudinal studies. The benefits of this reductionin variables are an increased statistical power due to lessmultiple comparison issues, an improved understanding ofrelationships between the morphologic measures of kneecartilage, and a greater efficiency in reporting the resultsin the literature. Buck et al. [54] used cross-sectional [55]and longitudinal (baseline to 2 year followup) 3T MR imagedata [29] from 152 women (77 healthy and 75 with kneeOA). They found that the total area of the subchondral bone(tAB), cartilage thickness (ThCtAB.tAB), and the percentageof denuded area of the subchondral bone (%dAB) explainedmore than 90% of the cross-sectional and longitudinalvariation in the full set of cartilage morphology measures,both in healthy and in osteoarthritic knees. The authorstherefore recommended these three variables as an efficientsubset for describing structural status and change in kneecartilage [54].
4. Reference Values for MRI-Based KneeCartilage Morphometry
Several groups have reported reference values of cartilagemorphology in healthy volunteers [44, 56, 57], includingtemplates/atlases for comparison of cartilage thickness distri-bution patterns between healthy reference subjects and OApatients [50, 58] and reference values for the radiographicjoint space width (JSW) [59]. Beattie et al. [59] foundthat measures of JSW did not significantly decrease withincreasing decade, but remained fairly constant throughoutthe lifespan in either sex; the same was observed for cartilagemorphometry measures. The authors suggested that theremay therefore be no need to differentiate a T- or Z-scorein OA diagnosis because cartilage thickness and JSW remainconstant throughout life in the absence of OA.
Recently, several authors have proposed the measure-ment of certain anatomically defined subregions withincartilage plates to determine the spatial pattern of cartilageloss [15, 60, 61] (Table 1). A recent analysis of a largepopulation-based cohort reported sex-specific normal valuesand potential maximal Z-scores for specific subregions ofthe femorotibial cartilage [62]. The authors studied 686Framingham participants (309 men, 377 women, age 62 ±8 years) without radiographic femorotibial OA (“normals”)and a subset of 376 Framingham participants (156 men,220 women) who additionally had no MRI features of
Arthritis 7
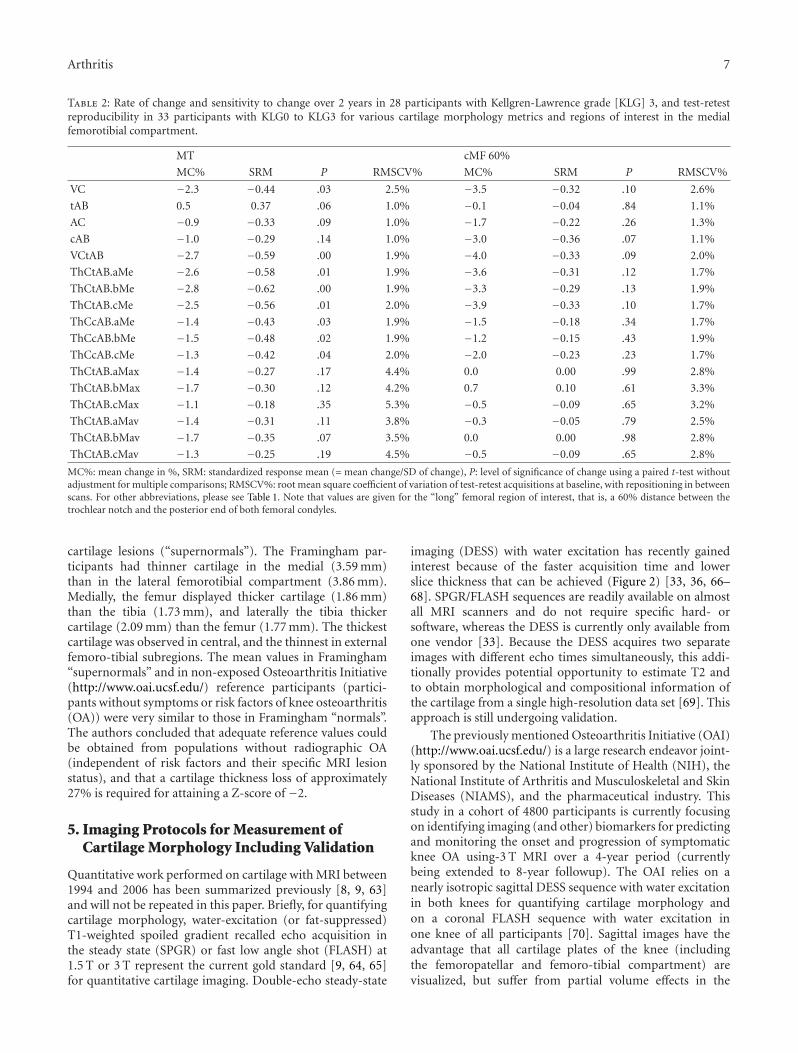
Table 2: Rate of change and sensitivity to change over 2 years in 28 participants with Kellgren-Lawrence grade [KLG] 3, and test-retestreproducibility in 33 participants with KLG0 to KLG3 for various cartilage morphology metrics and regions of interest in the medialfemorotibial compartment.
MT cMF 60%
MC% SRM P RMSCV% MC% SRM P RMSCV%
VC −2.3 −0.44 .03 2.5% −3.5 −0.32 .10 2.6%
tAB 0.5 0.37 .06 1.0% −0.1 −0.04 .84 1.1%
AC −0.9 −0.33 .09 1.0% −1.7 −0.22 .26 1.3%
cAB −1.0 −0.29 .14 1.0% −3.0 −0.36 .07 1.1%
VCtAB −2.7 −0.59 .00 1.9% −4.0 −0.33 .09 2.0%
ThCtAB.aMe −2.6 −0.58 .01 1.9% −3.6 −0.31 .12 1.7%
ThCtAB.bMe −2.8 −0.62 .00 1.9% −3.3 −0.29 .13 1.9%
ThCtAB.cMe −2.5 −0.56 .01 2.0% −3.9 −0.33 .10 1.7%
ThCcAB.aMe −1.4 −0.43 .03 1.9% −1.5 −0.18 .34 1.7%
ThCcAB.bMe −1.5 −0.48 .02 1.9% −1.2 −0.15 .43 1.9%
ThCcAB.cMe −1.3 −0.42 .04 2.0% −2.0 −0.23 .23 1.7%
ThCtAB.aMax −1.4 −0.27 .17 4.4% 0.0 0.00 .99 2.8%
ThCtAB.bMax −1.7 −0.30 .12 4.2% 0.7 0.10 .61 3.3%
ThCtAB.cMax −1.1 −0.18 .35 5.3% −0.5 −0.09 .65 3.2%
ThCtAB.aMav −1.4 −0.31 .11 3.8% −0.3 −0.05 .79 2.5%
ThCtAB.bMav −1.7 −0.35 .07 3.5% 0.0 0.00 .98 2.8%
ThCtAB.cMav −1.3 −0.25 .19 4.5% −0.5 −0.09 .65 2.8%
MC%: mean change in %, SRM: standardized response mean (= mean change/SD of change), P: level of significance of change using a paired t-test withoutadjustment for multiple comparisons; RMSCV%: root mean square coefficient of variation of test-retest acquisitions at baseline, with repositioning in betweenscans. For other abbreviations, please see Table 1. Note that values are given for the “long” femoral region of interest, that is, a 60% distance between thetrochlear notch and the posterior end of both femoral condyles.
cartilage lesions (“supernormals”). The Framingham par-ticipants had thinner cartilage in the medial (3.59 mm)than in the lateral femorotibial compartment (3.86 mm).Medially, the femur displayed thicker cartilage (1.86 mm)than the tibia (1.73 mm), and laterally the tibia thickercartilage (2.09 mm) than the femur (1.77 mm). The thickestcartilage was observed in central, and the thinnest in externalfemoro-tibial subregions. The mean values in Framingham“supernormals” and in non-exposed Osteoarthritis Initiative(http://www.oai.ucsf.edu/) reference participants (partici-pants without symptoms or risk factors of knee osteoarthritis(OA)) were very similar to those in Framingham “normals”.The authors concluded that adequate reference values couldbe obtained from populations without radiographic OA(independent of risk factors and their specific MRI lesionstatus), and that a cartilage thickness loss of approximately27% is required for attaining a Z-score of −2.
5. Imaging Protocols for Measurement ofCartilage Morphology Including Validation
Quantitative work performed on cartilage with MRI between1994 and 2006 has been summarized previously [8, 9, 63]and will not be repeated in this paper. Briefly, for quantifyingcartilage morphology, water-excitation (or fat-suppressed)T1-weighted spoiled gradient recalled echo acquisition inthe steady state (SPGR) or fast low angle shot (FLASH) at1.5 T or 3 T represent the current gold standard [9, 64, 65]for quantitative cartilage imaging. Double-echo steady-state
imaging (DESS) with water excitation has recently gainedinterest because of the faster acquisition time and lowerslice thickness that can be achieved (Figure 2) [33, 36, 66–68]. SPGR/FLASH sequences are readily available on almostall MRI scanners and do not require specific hard- orsoftware, whereas the DESS is currently only available fromone vendor [33]. Because the DESS acquires two separateimages with different echo times simultaneously, this addi-tionally provides potential opportunity to estimate T2 andto obtain morphological and compositional information ofthe cartilage from a single high-resolution data set [69]. Thisapproach is still undergoing validation.
The previously mentioned Osteoarthritis Initiative (OAI)(http://www.oai.ucsf.edu/) is a large research endeavor joint-ly sponsored by the National Institute of Health (NIH), theNational Institute of Arthritis and Musculoskeletal and SkinDiseases (NIAMS), and the pharmaceutical industry. Thisstudy in a cohort of 4800 participants is currently focusingon identifying imaging (and other) biomarkers for predictingand monitoring the onset and progression of symptomaticknee OA using-3 T MRI over a 4-year period (currentlybeing extended to 8-year followup). The OAI relies on anearly isotropic sagittal DESS sequence with water excitationin both knees for quantifying cartilage morphology andon a coronal FLASH sequence with water excitation inone knee of all participants [70]. Sagittal images have theadvantage that all cartilage plates of the knee (includingthe femoropatellar and femoro-tibial compartment) arevisualized, but suffer from partial volume effects in the

8 Arthritis
internal and external femoro-tibial subregions (Figure 3).Coronal images, in contrast, can delineate the femoro-tibialjoint and axial images visualize the patella with little partialvolume effects, but there is currently no consensus, whichof the above is the preferred orientation. A direct face-to-face comparison of 2 year changes measured in coronal andsagittal (SPGR) images revealed similar rates and patterns ofcartilage loss in the femoro-tibial joint [71].
The technical accuracy (validity) and test-retest precision(reproducibility) of quantitative cartilage measurements at1.5 T have been summarized in previous reviews [8, 9].Analyses based on 1.0 T images acquired with a dedicatedextremity scanner were found to be consistent with 1.5 Timaging, albeit less precise (reproducible) [72]. The use ofperipheral MRI scanners at lower field strengths potentiallypermits more widespread distribution of this technology,especially when access to high-field MRI is limited. Quantita-tive cartilage measurement at 0.2 T have also been proposed[18, 27, 28, 38–40] but have not been validated versusexternal standards or measurement at higher field strength.However, they were shown to display substantially largerprecision errors than measurements performed at higherfield strength. 3 T cartilage imaging has been cross-calibratedwith 1.5 T and lower precision errors than for 1.5 T imagingwere reported when acquiring thinner (coronal) slices of1.0 mm on a 3 T system [73]. Morphometric analysis fromDESS images, as acquired at 3 T in the OAI, was found tobe consistent with that from FLASH images and to displaysimilar test-retest precision errors as FLASH in the femoro-tibial joint, both using unpaired [33] and paired readingapproaches [67, 68]. In terms of sensitivity to change, Wirthet al. [36] performed a face-to-face comparison betweenFLASH and DESS over one year longitudinally in 80 knees.The study confirmed a high agreement between cartilagethickness measures as determined from FLASH and DESScross-sectionally [33] and a similar sensitivity to changeof coronal FLASH and sagittal DESS. Further, the studyrevealed a moderate correlation of the longitudinal one-year changes, indicating that it may be adequate to poolanalyses obtained with FLASH and DESS in larger statisticalanalyses [36]. Also, the authors found that analysis of every2nd slice (i.e., obtaining information every 1.4 mm) of thesagittal DESS displayed similar SRMs as compared withsegmentation of every 0.7 mm slice, both when either usingodd or even slice numbers [36]. Due to the near-isotropicresolution of the sagittal DESS, multiplanar reconstruction(MPR) in the coronal and axial planes is feasible [33, 67, 68].The rates of (and sensitivity to) change of coronal MPR DESSwas similar to that of coronal FLASH and sagittal DESS butdid not provide an advantage over the direct analysis of thesagittal DESS [36].
Generally, results from different vendors for cartilagemorphometry were shown to be comparable at 1.5 T [74]and at 3 T [75], although one study reported slight offsetsbetween different scanners and protocols from the samevendor [76]. At 3 T, precision errors of cartilage morphom-etry were observed to be similar for different vendors andscanners in a multicenter trial, and measurements wererelatively stable over a 3-month observation period [48].
The stability of geometric measurements over longer periodson phantoms was found to be satisfactory and comparablebetween several scanners of the same manufacturer over a 3-year period in the OAI [77].
Use of different coils has been evaluated at 3 T. Althoughthe test-retest precision was similar between a phased arrayand quadrature coil, certain offsets in cartilage morphologyoutcomes were observed [67]; these prohibit changes of thecoil between baseline and followup measurements. Cartilagemorphometry on images acquired 2 hours after intravenousGd-DTPA injection (for the purpose of simultaneous dGEM-RIC imaging) was reported to be highly correlated (r =0.85−0.95) with that on images obtained before the injectionof the contrast agent at baseline [78]. However, a 2-yearlongitudinal analysis in OA participants reported that thesensitivity to change of post-Gd-DTPA cartilage imaging wassubstantially less than that from images acquired prior tointravenous Gd-DTPA injection [79].
6. Rates of Change and Sensitivity toChange Observed in Knee OA
Numerous reports on longitudinal changes of cartilagemorphology in subjects with different grades of knee OAhave been published [8, 9, 29–31, 36, 52, 53, 61, 80–87].These studies have revealed variable results with regard tothe rates of cartilage loss and SRM [6, 8, 9] Two studiesreported almost no loss in cartilage volume over a 1-year [87]and 3-year period [80], respectively, whereas other studiesreported up to 7% annual cartilage loss in the femoro-tibial joint [82]. Reasons for this may include variabilityin imaging and image analysis technology, differences inrisk factor profiles between cohorts, differences in studyduration, experience and blinding of the readers, and others.A recent study [88] tested the hypothesis that “Proof ofConcept” studies with shorter durations may be achievablewith 3 T MRI, by selecting populations at high risk of rapidmedial femoro-tibial progression and using advanced imageanalysis techniques. Female participants with knee pain, abody mass index ≥25, and radiographic evidence of medialOA and varus mal-alignment were monitored over 3 and 6months, respectively, and anatomically corresponding ROIswere identified on each image by using a three-dimensionalstatistical shape model of the bone surface. The primaryoutcome was the change in cartilage thickness in the aspectof cMF that is exposed within the meniscus window duringarticulation, excluding the peripheral aspects of the femoralsurface. Despite these efforts, no change in ThCtAB wasdetected at P < .05 at 3 or 6 months followup; the meanchange at 3 months from a log-scale ANOVA model was−2.1% [95% confidence interval (CI) (−4.4%, +0.2%)] andthe change over 6 months was 0.0% [95% CI (−2.7%,+2.8%)]. Changes in the lateral tibia were significant at 6month followup (−1.5%), but only without correction formultiple comparisons. The authors concluded that the smallinconsistent compartment changes and the relatively highvariability in cartilage thickness changes seen in the studyprovided no confidence for a 3- or 6-month study, not even
Arthritis 9
based on a patient population selected for rapid progression[88].
Analyses of the first release of 160 participants of the OAIprogression cohort (baseline and year 1 followup data) foundsignificant change of up to 2% per annum, with substantiallyhigher rates of progression in the cMF than in the MT,and higher rates in LT than in cLF [30, 52, 53]. However,this pattern of change was not entirely consistent acrosscohorts, when focusing on the SRM rather than on the rate ofchange [10, 29, 31]. Several studies therefore have taken theapproach of reporting the aggregate thickness in the tibia andweight-bearing femur (MFTC or LFTC) [29–31, 36, 67, 89].One study suggested that longitudinal changes in VC in thetibia and in the weight-bearing femur are highly correlated[82], and that the measurement of only tibial cartilage istherefore sufficient. However, given that at least some cohortsappear to display larger changes and higher SRMs in theweight-bearing femur than in the tibia [30, 52, 53], thisapproach has limitations.
Medial and lateral femoro-tibial cartilage loss as well aspatellar cartilage loss were found to be not significantly asso-ciated with each other [90]. The ratio of medial versus lateralcartilage loss was reported to be 1.4 : 1 in knees with neutralbiomechanical alignment, consistent with higher mechanicalloads being transferred across the medial compartment inneutral knees [31]. In varus knees, the ratio was 3.7 : 1, andin valgus knees it was 1 : 6.0, confirming that knee alignmentis an important determinant of medial versus lateral rates ofcartilage loss [31].
After anterior cruciate ligament rupture, a reductionof cartilage volume and thickness was observed in thefemoral trochlea (TrF), while an increase was found inthe weight-bearing medial femur (cMF) [91]. The latterobservation may be consistent with cartilage swelling orhypertrophy observed as a sign of early OA in variousanimal models [92–96]. A recent cross-sectional study foundsignificantly thicker cartilage in the medial compartment ofwomen with medial radiographic KLG2 OA compared withhealthy knees [55] and significantly thinner cartilage in somesubregions in knees with medial radiographic OA with jointspace narrowing (JSN, i.e., KLG3). These observations wereconfirmed by a large cross-sectional analysis of more than1000 OA participants, in which the authors [97] confirmeda significantly greater cartilage thickness in KLG2 comparedto healthy knees, specifically in the external subregion of themedial femur (ecMF), both in men and in women. Thesefindings have suggested that there may be an initial phaseof cartilage swelling/hypertrophy in knee OA, particularlyat the KLG2 stage, which is characterized by osteophyteswithout a reduction in JSW. This has been supported byrecent longitudinal observations by Buck et al. [98] whoexplored whether the 2-year longitudinal change in cartilagethickness in femoro-tibial subregions (see below) of kneeswith radiographic osteoarthritis (ROA) differed from thatin healthy knees. Knees from 75 women with definitesigns of medial radiographic OA were compared with 77asymptomatic healthy controls without radiographic OA.A substantial portion of ROA knees were classified as havinglongitudinal cartilage thinning (28%) or thickening (20%)
in at least one medial femoro-tibial subregion comparedwith longitudinal changes in healthy knees, and only 5%showed both subregional thinning and thickening at thesame time, across (different) medial subregions. Whereas theestimated proportion of KLG3 knees with significant medialcartilage thinning (46%) was substantially greater than thatwith cartilage thickening (18%), the estimated percentagesof KLG2 knees with significant medial thinning (20%) andthickening (23%) were similar. The subregion in whichcartilage thickening was observed was ecMF in the majorityof the cases. The authors concluded that OA may not bea one-way road of cartilage loss and that particularly inearly radiographic OA, cartilage changes may occur in bothdirections simultaneously, that is, cartilage thinning andcartilage thickening. This may provide a reason why relativelysmall (and variable) rates of change have been observed inOA cohorts, and why short-term trials are challenging [88].
7. Spatial Patterns of Cartilage Loss inKnee OA as Derived by Subregional Analysis
As mentioned above, recent efforts have been focused onmeasuring anatomically defined subregions within cartilages[15, 60, 61], with the aim of elucidating spatial pattern ofcartilage thinning, and to potentially identify (sub) regionswith increased rates of (and sensitivity to) cartilage loss inintervention trials.
7.1. Cross-Sectional Studies. The previously mentionedcross-sectional study by Hellio Le Graverand et al. [55]reported that cartilage “thinning” in female knees withmedial JSN (KLG3) was most evident in the central sub-region of the cMF and in the external subregion of theMT, and in the internal subregion of the LT. This wasextended by the study of Frobell et al. [97], who reportedthat the external medial tibia showed the greatest reductionin cartilage thickness (z-scores−5.1/−5.6 in men/women) inknees with medial joint space narrowing (OARSI JSN) grade3 and the external lateral tibia (z scores −6.0 for both sexes)the greatest reduction in knees with lateral JSN grade 3. Theauthors, however, reported that at least 25% of the averagenormal cartilage thickness was maintained in all subregionsof end-stage ROA knees.
Although these differences were generally not affectedwhen possible effects of demographic covariates (height andBMI) were considered [55, 97], it is difficult to excludeconfounding by interperson differences in cross-sectionalstudies. Therefore, Eckstein et al. [99] performed a within-person, between-knee comparison in 80 participants of theOAI who displayed medial JSN in one knee, but no medialor lateral JSN in the contralateral knee. The strength ofthis approach is that it rules out confounding from person-specific demographic features, and that it is potentially moresensitive to detecting differences cross-sectionally, given themuch smaller magnitude of side differences between kneeswithin the same (healthy) person compared with differencesacross (healthy) subjects [100]. The authors estimated themagnitude of cartilage thickness reductions to be 190 μm

10 Arthritis
(5.2%) in the medial femoro-tibial compartment (MFTC)with JSN OARSI grade 1, 630 μm (18%) with OARSI grade2, and 1560 μm (44%) with OARSI grade 3 [101, 102]. Sidedifferences were greater in cMF than in MT, and greater inMT than in pMT [99]. Within MT the greatest differenceswere observed in the external and central subregions, andwithin MF the greatest differences were observed in thecentral subregion of the weight-bearing portion of MF. Whenevaluating A-P subregions in the MF [103], the greatestdifferences between mJSN and contra-lateral no-mJSN kneeswere observed in regions located between 30◦ and 75◦ at theMF.
7.2. Longitudinal Studies. Pelletier et al. [61] reported thatthe rate of change in cartilage morphology in the centralaspects of the femoro-tibial joint exceeded that in totalcartilage plates, but found that the SRM was not improvedbecause of the higher variability of subregional changes [51].Wirth et al. [53] found the sensitivity to change (SRM) in thecentral MT to be slightly greater than for the total MT in asubsample of OA Initiative participants, but this finding wasnot confirmed in the cMF.
Figure 3 summarizes the rates of change (%/annum) andthe sensitivity to change (SRM) for different subregions fromthree published studies.
(a) A 2-year multicenter study at 3T (Pfizer A 9001140).Because healthy reference participants and partici-pants with KLG 2 did not show significant changesin cartilage morphology [29], results from KLG 3participants were used (n = 28).
(b) The 2nd cohort included is a first release of baselineand year 1 followup data from the OAI progressionsubcohort [53]. Results of a subcohort with a highrisk of progression (BMI > 30; KLG ≥ 2) wereincluded (n = 54).
(c) The 3rd cohort included was from the MAK study[11, 31]. Data from a subcohort of participants withneutral knee alignment were included in the analysis(n = 74).
The central and external part of cMF, and the externaland central aspect of MT displayed the relatively greatestchange across subregions in the MFTC (Figure 3). Withthe exception of the external medial femur, these regionsconsistently displayed greater changes than the total cartilageplate across the studies. In the LFTC, the central, internal,and posterior LT displayed the relatively greatest changes,and no relevant average changes (across studies) wereobserved in the cLF (Figure 3). Rates of change in the centraland internal LT were consistently greater than those for thetotal cartilage plates. Please note that the patterns for thesensitivity to change (SRM; Figure 3) are similar to thoseof the rates of change, but not identical. Consistent withother observations in the literature [51], we found that thesensitivity to change in the subregions was not consistentlyhigher than in the total plates across the above three studies.However, analysis of the central aspects (subregions) of
the medial and lateral femoro-tibial compartments revealedconsistently greater SRMs than the analysis of the entireMFTC and LFTC, respectively.
Wirth et al. [103] recently presented a method whichextended the previously developed method of subregionsin the weight-bearing femoro-tibial joint [15] to anterior-posteriorly spaced subregions across the entire femoralcondyle. This method was applied to participants fromthe OAI and confirmed that cartilage thinning in theanterior (weight-bearing) region of the MF was greaterthan that in the posterior aspect of the MF. The authorsreported the greatest longitudinal changes (and SRM) tobe located at 30 to 60◦ (from the trochlear notch [0◦] tothe posterior/superior end of the MF (150◦), with a slightvariation between knees with different OARSI JSN grades.
7.3. Ordered Value Approach (Subregion Ranking). Buck etal. [104] analyzed patterns of subregional cartilage change[15] in individual knees and found highly variable patternsof change. To compare the rate of change between twogroups (i.e., ROA knees with healthy knees, or DMOADtreated knees with control knees) he therefore recommendedthe use of ordered values (OVs) or ranking system, inwhich the subregional changes (in MFTC) were assignedto ranked orders in each knee, that is, the subregionwith greatest magnitude of cartilage thinning to OV1, theone with the second greatest magnitude to OV2, and theone with the smallest magnitude of cartilage thinning (orwith the greatest magnitude of cartilage thickening) to thehighest rank order. When averaging longitudinal changesin cartilage thickness (ThCtAB) across these OVs (whichvary in location across subjects), the authors found that theminimal P value (Wilcoxon) for the differences in 2-yearchange in medial cartilage thickness in a relatively smallnumber of knees with radiographic OA and JSN (KLG3)versus healthy knees (KLG0) was P = .001, with OV1 toOV4 displaying significant differences between both groups.When averaging changes across compartments, plates, orsubregions (i.e., the conventional approach), in contrast,only one medial subregion displayed significant differences(in the rate of change) between KLG 3 and KLG0 knees(P = .037). Cartilage thickening was significantly greater inknees with radiographic OA (definite osteophytes) withoutJSN (KLG2) versus KLG0 knees in one medial subregionusing the conventional approach (P = .02), but in two OVsusing the ordered values approach (minimal P = .007).The authors concluded that the ordered values approach wasmore sensitive in detecting cartilage thinning in KLG3 versusKLG0, and cartilage thickening in KLG2 versus KLG0 knees,respectively. The authors also suggested that this methodwas particularly useful in the context of comparing a cohorttreated with a disease-modifying OA drug versus one treatedwith a placebo, or in detecting risk factors of OA progression.
Wirth et al. [105] recently extended this approach toinclude eight medial and eight lateral (n = 16) subregions.They reported significantly greater cartilage loss in KLG3than in KLG2 knees, the ordered value approach again dis-playing considerably smaller P values than the conventional

Arthritis 11
approach. This opens new possibilities of including partici-pants with medial and lateral OA (or with varus and valgusmal-alignment) into a study, without the need of definingcartilage thickness changes in a certain compartment, plateor subregion as the primary endpoint. The relevant questionwould then NOT be whether a certain risk factor is associatedwith or whether a drug can modify cartilage thicknesschanges in a given location (region), BUT whether the riskfactor is associated with or whether the drug can modifythe change in cartilage thickness wherever it occurs in anindividual knee.
8. Comparison of MRI Changes withRadiographic Changes in Knee OA
Several studies found only weak correlations between MRI-detected cartilage loss and OA progression in radiography[83, 87, 106]. However, a recent publication reported astronger correlation when the longitudinal reduction in JSWin radiographs was compared with cartilage loss in thecentral aspect of the MFTC [61]. Whereas some studiesfound a higher rate and sensitivity to change of MRI-based measurements of cartilage morphology compared withradiography [83, 85, 107], a recent analysis reported asomewhat greater SRM (−0.62) for fluoroscopy-based LyonSchuss radiography versus ThCtAB of the MT measured withMRI (−0.59) [29]. However, the authors found the SRM forfixed flexion radiography, a commonly used nonfluoroscopicprotocol that also is used in the OAI [108–112], to besubstantially less (SRM = −0.20) in the same study [29].The authors argued that the relatively high SRM of theminimal JSW measured by Lyon Schuss may be due tothe fluoroscopic guidance providing optimal alignment ofthe anterior and posterior tibial rim, and to radiographybeing performed under weight-bearing conditions wherethe cartilage tissue is compressed, while MRI is performedin a supine non weight-bearing position. Also, it mustbe kept in mind that radiographic assessment of JSWdepends also on meniscus extrusion, and not only oncartilage thickness [113–115] and that meniscus pathology,in particularly subluxation, can therefore cause changes inJSW over time in the absence of cartilage loss. Duryea etal. recently compared the responsiveness (=sensitivity tochange) of radiography with that of MRI in the first releaseof the OAI cohort (150 subjects) over 12 months [116].The radiographic JSW measurements relied on automatedsoftware to delineate the femoral and tibial margins [117,118]. Measures included the medial compartment minimumJSW and JSW at fixed locations that were compared topreviously published cartilage morphology measures [52].The SRM value for radiographic JSW measured at theoptimal fixed location was −0.32 compared to −0.39 for themost responsive MRI measure. For a subsample of KLG2 orKLG3 knees, the most responsive SRM values were −0.34and −0.42, respectively. The authors concluded that new(fixed distance) measures of JSW changes were superior toconventional minimal JSN measures and provide a similarsensitivity to change as MRI.
9. Risk Factors of Cartilage Loss inKnee OA as Identified by QuantitativeCartilage Imaging with MRI
Great interest is directed at identifying risk factors (predic-tors) of subsequent cartilage loss, both to understand thepathophysiology of the disease and to be able to identifyso-called fast progressors for inclusion in pharmacologicalintervention studies that attempt to show protection fromstructural change over relatively short periods (e.g., [88]).This paragraph will focus on studies that have reportedcorrelations between risk factors of progression and quan-titative measures of cartilage morphology, but not thosethat have relied on semi-quantitative scoring of MRI orquantitative measurement of JSW. The list of (potential) riskfactors for cartilage loss is not complete, but encompassesimportant examples examined both from cross-sectional andlongitudinal studies. Risk factors associated with higher ratesof progression were the following.
Advanced Radiographic OA and Low Cartilage Thickness atBaseline. Opposite to earlier assumptions and a synthesis ofevidence from radiographic studies [119], recent evidencesuggests that advanced radiographic OA (JSN) is a strong(if not the strongest) predictor of fast progression (i.e.,cartilage loss). There has been evidence that knees withhigher KL grades and increased JSN [29, 30, 53, 61] displaygreater rates of (and sensitivity to) change than those withlower KL grades and without baseline JSN. An analysisof specific radiographic features in a sample from theOAI found that osteophyte status (at baseline) was notassociated with medial cartilage loss over 12 months but thatknees with medial joint space narrowing showed a trendtowards higher rates of change than those without, andthat knees with medial femoral subchondral bone sclerosisdisplayed significantly greater rates of progression than thosewithout [120]. The same study also found that low baselinecartilage thickness was a strong predictor of longitudinalloss in cartilage thickness [120], whereas an earlier studyhad reported that higher baseline cartilage volume [81] wasstrongly associated with increased cartilage loss. A within-person, between-knee comparison in painful knees selectedfrom the OAI [35] recently reported that the cartilage losswas greater in knee with radiographic JSN than in contra-lateral knees without JSN in the same subjects, and thatthe side differences were greater with higher grades of JSN.Progression was particularly fast in the small subgroup withOARSI JSN grade 3 knees [35].
Meniscus Extrusion and Tears/Damage [61, 84, 85]. Meniscustears were found to be associated with greater tibial plateaubone area, but not with reduced tibial cartilage volume ina two year longitudinal study [121]. However, Sharma etal. [11] reported a significant relationship of cartilage losswith meniscus tears, albeit not with meniscus extrusion. Arecent analysis found site-specific relationships between localmeniscus tears and subregional cartilage loss, suggesting thata tear in the anterior horn, central part, or posterior horn of
12 Arthritis
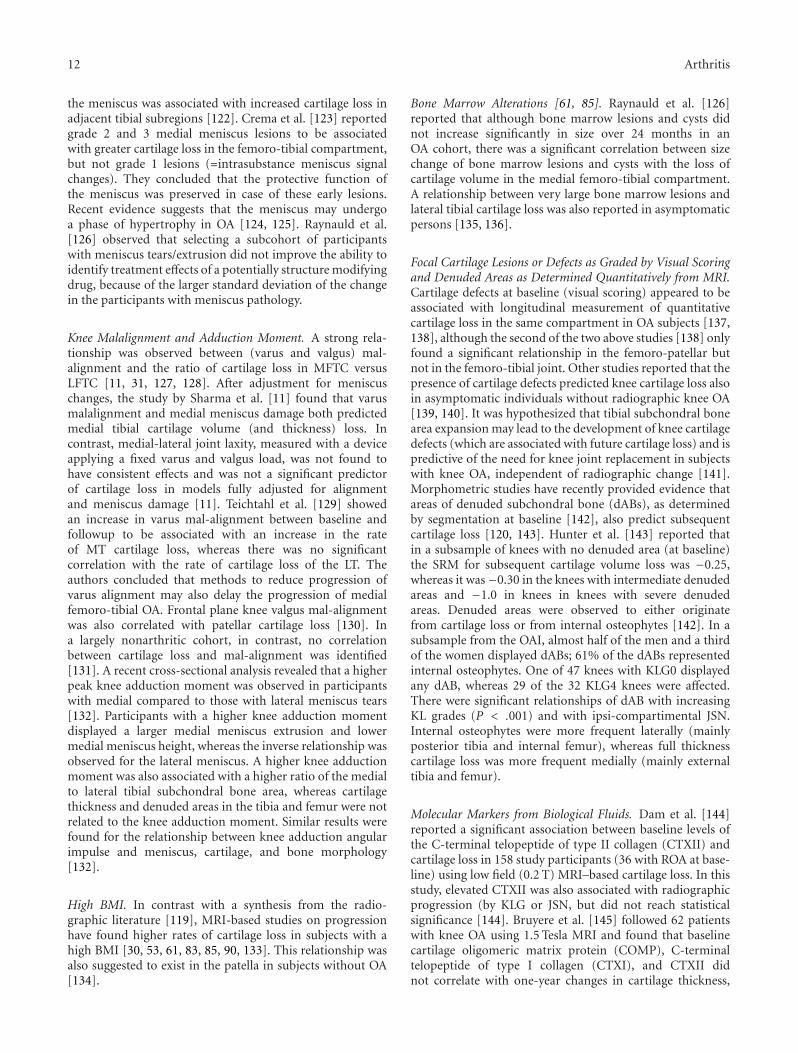
the meniscus was associated with increased cartilage loss inadjacent tibial subregions [122]. Crema et al. [123] reportedgrade 2 and 3 medial meniscus lesions to be associatedwith greater cartilage loss in the femoro-tibial compartment,but not grade 1 lesions (=intrasubstance meniscus signalchanges). They concluded that the protective function ofthe meniscus was preserved in case of these early lesions.Recent evidence suggests that the meniscus may undergoa phase of hypertrophy in OA [124, 125]. Raynauld et al.[126] observed that selecting a subcohort of participantswith meniscus tears/extrusion did not improve the ability toidentify treatment effects of a potentially structure modifyingdrug, because of the larger standard deviation of the changein the participants with meniscus pathology.
Knee Malalignment and Adduction Moment. A strong rela-tionship was observed between (varus and valgus) mal-alignment and the ratio of cartilage loss in MFTC versusLFTC [11, 31, 127, 128]. After adjustment for meniscuschanges, the study by Sharma et al. [11] found that varusmalalignment and medial meniscus damage both predictedmedial tibial cartilage volume (and thickness) loss. Incontrast, medial-lateral joint laxity, measured with a deviceapplying a fixed varus and valgus load, was not found tohave consistent effects and was not a significant predictorof cartilage loss in models fully adjusted for alignmentand meniscus damage [11]. Teichtahl et al. [129] showedan increase in varus mal-alignment between baseline andfollowup to be associated with an increase in the rateof MT cartilage loss, whereas there was no significantcorrelation with the rate of cartilage loss of the LT. Theauthors concluded that methods to reduce progression ofvarus alignment may also delay the progression of medialfemoro-tibial OA. Frontal plane knee valgus mal-alignmentwas also correlated with patellar cartilage loss [130]. Ina largely nonarthritic cohort, in contrast, no correlationbetween cartilage loss and mal-alignment was identified[131]. A recent cross-sectional analysis revealed that a higherpeak knee adduction moment was observed in participantswith medial compared to those with lateral meniscus tears[132]. Participants with a higher knee adduction momentdisplayed a larger medial meniscus extrusion and lowermedial meniscus height, whereas the inverse relationship wasobserved for the lateral meniscus. A higher knee adductionmoment was also associated with a higher ratio of the medialto lateral tibial subchondral bone area, whereas cartilagethickness and denuded areas in the tibia and femur were notrelated to the knee adduction moment. Similar results werefound for the relationship between knee adduction angularimpulse and meniscus, cartilage, and bone morphology[132].
High BMI. In contrast with a synthesis from the radio-graphic literature [119], MRI-based studies on progressionhave found higher rates of cartilage loss in subjects with ahigh BMI [30, 53, 61, 83, 85, 90, 133]. This relationship wasalso suggested to exist in the patella in subjects without OA[134].
Bone Marrow Alterations [61, 85]. Raynauld et al. [126]reported that although bone marrow lesions and cysts didnot increase significantly in size over 24 months in anOA cohort, there was a significant correlation between sizechange of bone marrow lesions and cysts with the loss ofcartilage volume in the medial femoro-tibial compartment.A relationship between very large bone marrow lesions andlateral tibial cartilage loss was also reported in asymptomaticpersons [135, 136].
Focal Cartilage Lesions or Defects as Graded by Visual Scoringand Denuded Areas as Determined Quantitatively from MRI.Cartilage defects at baseline (visual scoring) appeared to beassociated with longitudinal measurement of quantitativecartilage loss in the same compartment in OA subjects [137,138], although the second of the two above studies [138] onlyfound a significant relationship in the femoro-patellar butnot in the femoro-tibial joint. Other studies reported that thepresence of cartilage defects predicted knee cartilage loss alsoin asymptomatic individuals without radiographic knee OA[139, 140]. It was hypothesized that tibial subchondral bonearea expansion may lead to the development of knee cartilagedefects (which are associated with future cartilage loss) and ispredictive of the need for knee joint replacement in subjectswith knee OA, independent of radiographic change [141].Morphometric studies have recently provided evidence thatareas of denuded subchondral bone (dABs), as determinedby segmentation at baseline [142], also predict subsequentcartilage loss [120, 143]. Hunter et al. [143] reported thatin a subsample of knees with no denuded area (at baseline)the SRM for subsequent cartilage volume loss was −0.25,whereas it was−0.30 in the knees with intermediate denudedareas and −1.0 in knees in knees with severe denudedareas. Denuded areas were observed to either originatefrom cartilage loss or from internal osteophytes [142]. In asubsample from the OAI, almost half of the men and a thirdof the women displayed dABs; 61% of the dABs representedinternal osteophytes. One of 47 knees with KLG0 displayedany dAB, whereas 29 of the 32 KLG4 knees were affected.There were significant relationships of dAB with increasingKL grades (P < .001) and with ipsi-compartimental JSN.Internal osteophytes were more frequent laterally (mainlyposterior tibia and internal femur), whereas full thicknesscartilage loss was more frequent medially (mainly externaltibia and femur).
Molecular Markers from Biological Fluids. Dam et al. [144]reported a significant association between baseline levels ofthe C-terminal telopeptide of type II collagen (CTXII) andcartilage loss in 158 study participants (36 with ROA at base-line) using low field (0.2 T) MRI–based cartilage loss. In thisstudy, elevated CTXII was also associated with radiographicprogression (by KLG or JSN, but did not reach statisticalsignificance [144]. Bruyere et al. [145] followed 62 patientswith knee OA using 1.5 Tesla MRI and found that baselinecartilage oligomeric matrix protein (COMP), C-terminaltelopeptide of type I collagen (CTXI), and CTXII didnot correlate with one-year changes in cartilage thickness,
Arthritis 13
but longitudinal increase in CTXII over three months did(P = .04). Pelletier et al. [146] reported higher baselinevalues of interleukin 6, C-reactive protein, and COMP tobe predictive of greater cartilage loss with MRI, whereasEckstein et al. reported a relatively large set (n = 16) of differ-ent molecular markers of bone formation, bone resorption,cartilage synthesis, cartilage degradation, and inflammationtake at baseline to be substantially less predictive of cartilageloss than simple radiographic measures, such as reducedJSW, or low baseline cartilage thickness [147].
Other Risk Factors. Some evidence has been provided thatsmoking may be associated with increased cartilage loss[140, 148, 149] in line with previous radiographic studies,but other factors such as age, sex, pain, function, physicalactivity levels, synovitis (effusion), sex hormone levels, andserum or urine biomarkers were not consistently found tobe associated with cartilage thinning measured quantitativelywith MRI and studies (including those with radiography)have produced partially contradictory results [119].
10. The Correlation of MRI-Based CartilageLoss with Clinical Outcomes and TreatmentResponse in Knee OA
Estimates of tibial cartilage loss over two years were suggestedto be correlated with those over 4.5 years, albeit the authorsdid not report the consistency of the longitudinal changesin the second versus the first observation period [86]. Moreimportantly, however, the rate of change in VC over 2years was significantly associated with total knee arthroplasty(TKA) at year 4 [150]. For every 1% increase in the rate ofcartilage loss there was a 20% increased risk of undergoingTKA and participants in the highest tertile of tibial cartilageloss had a 7.1 higher odds of TKA than those in the lowesttertile. In contrast, radiographic scores of OA did not predictTKA in the same study. A more recent study concludedfrom the same sample that when subchondral bone cystswere present, cartilage loss and risk of knee replacementwere higher than if only bone marrow lesions were present,suggesting that cysts identify those that may benefit mostfrom the prevention of structural disease progression [151].These are important findings as they link longitudinalchanges in cartilage morphology as a potential surrogatemeasure of disease progression, to a clinical outcome (i.e.,how a patient feels or functions, or how long the knee“survives” [TKA]).
Raynauld et al. [107] recently reported that licofelone(a drug that inhibits both cyclooxygenase and lipoxygenase)significantly reduced cartilage loss over time when aver-aged over both femoro-tibial compartment, and that MRIwas superior to radiographs in demonstrating a structuremodifying effect in this multicentre trial. Interestingly, theeffects were significant only in the lateral, but not in themedial compartment, although the participants had beenselected for medial femoro-tibial radiographic OA, and themedial compartment had thus been defined as the primaryendpoint. To date, no structure or disease-modifying drug
(SMOAD or DMOAD) has yet been approved by regulatoryagencies, neither based on radiographic nor on MRI-basedevidence of structure modification in knee cartilage.
11. Future Directions of the Field
In the Osteoarthritis Initiative, baseline, 12-, 24-, and 36-month followup clinical, radiographic, and MRI data havebeen made publicly available for approximately 4800 partic-ipants of the OAI cohort (http://www.niams.nih.gov/ne/oi/),and central readings of fixed flexion radiographs (OARSIatlas scores [101, 102]), quantitative measurements of radio-graphic joint space width (JSW) as well as quantitative car-tilage morphology outcomes from MRI are available for var-ious subsets that have been read/analyzed by expert readingfacilities. These and the results of other large epidemiologicalstudies will provide ample opportunity for collaborativeresearch and should allow the research community to makerapid progress in understanding the risk factors involvedin quantitative cartilage loss in OA. Most importantly, itwill allow one to determine which imaging biomarkers canbest predict clinical outcomes, such as real or virtual TKA[152]. This will be an important step in validating novelcartilage imaging biomarkers and approaches as surrogatemeasures of disease progression, particularly in therapeuticintervention trials. Once the clinical importance of theseimaging biomarkers are established, further improvementsin imaging hardware, coils, sequences, and image analysisalgorithms may foster a more automated analysis of cartilagemorphology, composition, and other articular tissues thancurrently possible. This will be of particular importance oncestructure- or disease-modifying drugs become available, asthis may require monitoring the treatment response in largesets of OA patients. Currently, quantitative MRI of articularcartilage represents a powerful research tool in experimental,epidemiological, and pharmacological intervention studies.Once structure- or disease-modifying drugs (SMOADs orDMOADs) will become available, quantitative MRI of thecartilage may also play a more important role in clinicaldecision making and practice.
Disclosures
F. Eckstein is co-owner and CEO of Chondrometrics GmbH,a company that licenses software to academic researchers andprovides image analysis service for academic researchers andthe pharmaceutical industry. F. Eckstein provides consultingservices to Merck Serono Inc. and Novartis Inc. and hasreceived research funding from Pfizer, Eli Lilly, MerckSerono,Glaxo Smith Kline, Centocor Research, Wyeth, and Novartis.W. Wirth has a part time appointment with ChondrometricsGmbH.
References
[1] C.-C. Gluer, R. Barkmann, H. K. Hahn et al., “Parametricbiomedical imaging—what defines the quality of quantitativeradiological approaches?” RoFo Fortschritte auf dem Gebiet

14 Arthritis
der Rontgenstrahlen und der Bildgebenden Verfahren, vol. 178,no. 12, pp. 1187–1201, 2006.
[2] P. Augat and F. Eckstein, “Quantitative imaging of muscu-loskeletal tissue,” Annual Review of Biomedical Engineering,vol. 10, pp. 369–390, 2008.
[3] D. Burstein, M. Gray, T. Mosher, and B. Dardzinski, “Mea-sures of molecular composition and structure in osteoarthri-tis,” Radiologic Clinics of North America, vol. 47, no. 4, pp.675–686, 2009.
[4] M.-P. H. Le Graverand, S. Mazzuca, M. Lassere et al., “Assess-ment of the radioanatomic positioning of the osteoarthriticknee in serial radiographs: comparison of three acquisitiontechniques,” Osteoarthritis and Cartilage, vol. 14, no. 1, pp.37–43, 2006.
[5] G. A. Cline, J. M. Meyer, R. Stevens, C. Buckland-Wright,C. Peterfy, and J. F. Beary, “Comparison of fixed flexion,fluoroscopic semi-flexed and MTP radiographic methods forobtaining the minimum medial joint space width of theknee in longitudinal osteoarthritis trials,” Osteoarthritis andCartilage, vol. 14, no. 1, pp. 32–36, 2006.
[6] A. Guermazi, D. Burstein, P. Conaghan et al., “Imaging inosteoarthritis,” Rheumatic Disease Clinics of North America,vol. 34, no. 3, pp. 645–687, 2008.
[7] D. J. Hunter, P. G. Conaghan, C. G. Peterfy et al.,“Responsiveness, effect size, and smallest detectable differ-ence of Magnetic Resonance Imaging in knee osteoarthritis,”Osteoarthritis and Cartilage, vol. 14, no. 1, pp. 112–115, 2006.
[8] F. Eckstein, D. Burstein, and T. M. Link, “Quantitative MRIof cartilage and bone: degenerative changes in osteoarthritis,”NMR in Biomedicine, vol. 19, no. 7, pp. 822–854, 2006.
[9] F. Eckstein, F. Cicuttini, J.-P. Raynauld, J. C. Waterton,and C. Peterfy, “Magnetic resonance imaging (MRI) ofarticular cartilage in knee osteoarthritis (OA): morphologicalassessment,” Osteoarthritis and Cartilage, vol. 14, no. 1, pp.46–75, 2006.
[10] F. Eckstein, A. Guermazi, and F. W. Roemer, “QuantitativeMR imaging of cartilage and trabecular bone in osteoarthri-tis,” Radiologic Clinics of North America, vol. 47, no. 4, pp.655–673, 2009.
[11] L. Sharma, F. Eckstein, J. Song et al., “Relationship of menis-cal damage, meniscal extrusion, malalignment, and jointlaxity to subsequent cartilage loss in osteoarthritic knees,”Arthritis and Rheumatism, vol. 58, no. 6, pp. 1716–1726,2008.
[12] C. G. Peterfy, A. Guermazi, S. Zaim et al., “Whole-organmagnetic resonance imaging score (WORMS) of the knee inosteoarthritis,” Osteoarthritis and Cartilage, vol. 12, no. 3, pp.177–190, 2004.
[13] S. Reichenbach, M. Yang, F. Eckstein et al., “Does cartilagevolume or thickness distinguish knees with and without mildradiographic osteoarthritis? The Framingham Study,” Annalsof the Rheumatic Diseases, vol. 69, no. 1, pp. 143–149, 2010.
[14] F. Eckstein, G. Ateshian, R. Burgkart et al., “Proposal for anomenclature for Magnetic Resonance Imaging based mea-sures of articular cartilage in osteoarthritis,” Osteoarthritisand Cartilage, vol. 14, no. 10, pp. 974–983, 2006.
[15] W. Wirth and F. Eckstein, “A technique for regional analysisof femorotibial cartilage thickness based on quantitativemagnetic resonance imaging,” IEEE Transactions on MedicalImaging, vol. 27, no. 6, Article ID 4359064, pp. 737–744,2008.
[16] J. Hohe, S. Faber, T. Stammberger, M. Reiser, K.-H.Englmeier, and F. Eckstein, “A technique for 3D in vivoquantification of proton density and magnetization transfer
coefficients of knee joint cartilage,” Osteoarthritis and Carti-lage, vol. 8, no. 6, pp. 426–433, 2000.
[17] J. Hohe, S. Faber, R. Muehlbauer, M. Reiser, K.-H. Englmeier,and F. Eckstein, “Three-dimensional analysis and visualiza-tion of regional MR signal intensity distribution of articularcartilage,” Medical Engineering and Physics, vol. 24, no. 3, pp.219–227, 2002.
[18] A. A. Qazi, J. Folkesson, P. C. Pettersen, M. A. Karsdal, C.Christiansen, and E. B. Dam, “Separation of healthy andearly osteoarthritis by automatic quantification of cartilagehomogeneity,” Osteoarthritis and Cartilage, vol. 15, no. 10,pp. 1199–1206, 2007.
[19] E. J. McWalter, W. Wirth, M. Siebert et al., “Use ofnovel interactive input devices for segmentation of articularcartilage from magnetic resonance images,” Osteoarthritisand Cartilage, vol. 13, no. 1, pp. 48–53, 2005.
[20] S. Solloway, C. E. Hutchinson, J. C. Waterton, and C.J. Taylor, “The use of active shape models for makingthickness measurements of articular cartilage from MRimages,” Magnetic Resonance in Medicine, vol. 37, no. 6, pp.943–952, 1997.
[21] T. Stammberger, F. Eckstein, M. Michaelis, K.-H. Englmeier,and M. Reiser, “Interobserver reproducibility of quantitativecartilage measurements: comparison of B-spline snakes andmanual segmentation,” Magnetic Resonance Imaging, vol. 17,no. 7, pp. 1033–1042, 1999.
[22] Z. A. Cohen, D. M. McCarthy, S. D. Kwak et al., “Knee carti-lage topography, thickness, and contact areas from MRI: in-vitro calibration and in-vivo measurements,” Osteoarthritisand Cartilage, vol. 7, no. 1, pp. 95–109, 1999.
[23] J. A. Lynch, S. Zaim, J. Zhao, A. Stork, C. G. Peterfy, andH. K. Genant, “Cartilage segmentation of 3D MRI scans ofthe osteoarthritic knee combining user knowledge and activecontours,” in Medical Imaging 2000: Image Processing, vol.3979 of Proceedings of SPIE, pp. 925–935, February 2000.
[24] P. M. M. Cashman, R. I. Kitney, M. A. Gariba, and M. E.Carter, “Automated techniques for visualization and map-ping of articular cartilage in MR images of the osteoarthriticknee: a base technique for the assessment of microdamageand submicro damage,” IEEE Transactions on Nanobioscience,vol. 1, no. 1, pp. 42–51, 2002.
[25] C. Kauffmann, P. Gravel, B. Godbout et al., “Computer-aidedmethod for quantification of cartilage thickness and volumechanges using MRI: validation study using a syntheticmodel,” IEEE Transactions on Biomedical Engineering, vol. 50,no. 8, pp. 978–988, 2003.
[26] S. D. Pathak, L. Ng, B. Wyman et al., “Quantitative imageanalysis: software systems in drug development trials,” DrugDiscovery Today, vol. 8, no. 10, pp. 451–458, 2003.
[27] J. Folkesson, E. Dam, O. F. Olsen, P. Pettersen, and C. Chris-tiansen, “Automatic segmentation of the articular cartilagein knee MRI using a hierarchical multi-class classificationscheme,” in Proceedings of the 8th International Conference onMedical Image Computing and Computer-Assisted Interven-tion (MICCAI ’05), vol. 3749 of Lecture Notes in ComputerScience, pp. 327–334, Palm Springs, Calif, USA, October2005.
[28] J. Folkesson, E. B. Dam, O. F. Olsen, P. C. Pettersen, and C.Christiansen, “Segmenting articular cartilage automaticallyusing a voxel classification approach,” IEEE Transactions onMedical Imaging, vol. 26, no. 1, pp. 106–115, 2007.
[29] M.-P. Hellio Le Graverand, R. J. Buck, B. T. Wyman et al.,“Change in regional cartilage morphology and joint spacewidth in osteoarthritis participants versus healthy controls:
Arthritis 15
a multicentre study using 3.0 Tesla MRI and Lyon-Schussradiography,” Annals of the Rheumatic Diseases, vol. 69, no. 1,pp. 155–162, 2010.
[30] F. Eckstein, S. Maschek, W. Wirth et al., “One year change ofknee cartilage morphology in the first release of participantsfrom the Osteoarthritis Initiative progression subcohort:association with sex, body mass index, symptoms andradiographic osteoarthritis status,” Annals of the RheumaticDiseases, vol. 68, no. 5, pp. 674–679, 2009.
[31] F. Eckstein, W. Wirth, M. Hudelmaier et al., “Patterns offemorotibial cartilage loss in knees with neutral, varus, andvalgus alignment,” Arthritis Care and Research, vol. 59, no.11, pp. 1563–1570, 2008.
[32] C. Glaser, R. Burgkart, A. Kutschera, K.-H. Englmeier, M.Reiser, and F. Eckstein, “Femoro-tibial cartilage metrics fromcoronal MR image data: technique, test-retest reproducibil-ity, and findings in osteoarthritis,” Magnetic Resonance inMedicine, vol. 50, no. 6, pp. 1229–1236, 2003.
[33] F. Eckstein, M. Hudelmaier, W. Wirth et al., “Double echosteady state magnetic resonance imaging of knee articularcartilage at 3 Tesla: a pilot study for the OsteoarthritisInitiative,” Annals of the Rheumatic Diseases, vol. 65, no. 4,pp. 433–441, 2006.
[34] M. Hudelmaier, W. Wirth, B. Wehr et al., “Femorotibialcartilage morphology: reproducibility of different metricsand femoral regions, and sensitivity to change in disease,”Cells Tissues Organs, vol. 192, no. 5, pp. 340–350, 2010.
[35] F. Eckstein, O. Benichou, W. Wirth et al., “Magnetic reso-nance imaging-based cartilage loss in painful contralateralknees with and without radiographic joint space narrowing:data from the osteoarthritis initiative,” Arthritis Care andResearch, vol. 61, no. 9, pp. 1218–1225, 2009.
[36] W. Wirth, M. Nevitt, M.-P. Hellio Le Graverand et al., “Sen-sitivity to change of cartilage morphometry using coronalFLASH, sagittal DESS, and coronal MPR DESS protocols—comparative data from the osteoarthritis initiative (OAI),”Osteoarthritis and Cartilage, vol. 18, no. 4, pp. 547–554, 2010.
[37] J. Hohe, G. Ateshian, M. Reiser, K.-H. Englmeier, and F.Eckstein, “Surface size, curvature analysis, and assessmentof knee joint incongruity with MRI in vivo,” MagneticResonance in Medicine, vol. 47, no. 3, pp. 554–561, 2002.
[38] E. B. Dam, J. Folkesson, P. C. Pettersen, and C. Christiansen,“Automatic morphometric cartilage quantification in themedial tibial plateau from MRI for osteoarthritis grading,”Osteoarthritis and Cartilage, vol. 15, no. 7, pp. 808–818, 2007.
[39] J. Folkesson, E. B. Dam, O. F. Olsen, and C. Christiansen,“Accuracy evaluation of automatic quantification of thearticular cartilage surface curvature from MRI,” AcademicRadiology, vol. 14, no. 10, pp. 1221–1228, 2007.
[40] J. Folkesson, E. B. Dam, O. F. Olsen, M. A. Karsdal, P.C. Pettersen, and C. Christiansen, “Automatic quantifica-tion of local and global articular cartilage surface curva-ture: biomarkers for osteoarthritis?” Magnetic Resonance inMedicine, vol. 59, no. 6, pp. 1340–1346, 2008.
[41] A. A. Qazi, E. B. Dam, M. Nielsen, M. A. Karsdal, P. C.Pettersen, and C. Christiansen, “Osteoarthritic cartilage ismore homogeneous than healthy cartilage: identification ofa superior region of interest colocalized with a major riskfactor for osteoarthritis,” Academic Radiology, vol. 14, no. 10,pp. 1209–1220, 2007.
[42] T. J. Mosher and B. J. Dardzinski, “Cartilage MRI T2 relax-ation time mapping: overview and applications,” Seminars inMusculoskeletal Radiology, vol. 8, no. 4, pp. 355–368, 2004.
[43] F. Eckstein, T. Mosher, and D. Hunter, “Imaging of kneeosteoarthritis: data beyond the beauty,” Current Opinion inRheumatology, vol. 19, no. 5, pp. 435–443, 2007.
[44] R. Burgkart, C. Glaser, S. Hinterwimmer et al., “Feasibilityof T and Z scores from magnetic resonance imaging data forquantification of cartilage loss in osteoarthritis,” Arthritis andRheumatism, vol. 48, no. 10, pp. 2829–2835, 2003.
[45] S. C. Faber, F. Eckstein, S. Lukasz et al., “Gender differencesin knee joint cartilage thickness, volume and articular surfaceareas: assessment with quantitative three-dimensional MRimaging,” Skeletal Radiology, vol. 30, no. 3, pp. 144–150,2001.
[46] I. G. Otterness and F. Eckstein, “Women have thinner carti-lage and smaller joint surfaces than men after adjustment forbody height and weight,” Osteoarthritis and Cartilage, vol. 15,no. 6, pp. 666–672, 2007.
[47] Y. Wang, C. Ding, A. E. Wluka et al., “Factors affectingprogression of knee cartilage defects in normal subjects over2 years,” Rheumatology, vol. 45, no. 1, pp. 79–84, 2006.
[48] F. Eckstein, R. J. Buck, D. Burstein et al., “Precision of 3.0Tesla quantitative magnetic resonance imaging of cartilagemorphology in a multicentre clinical trial,” Annals of theRheumatic Diseases, vol. 67, no. 12, pp. 1683–1688, 2008.
[49] F. Eckstein, M. Hudelmaier, S. Cahue, M. Marshall, and L.Sharma, “Medial-to-lateral ratio of tibiofemoral subchondralbone area is adapted to alignment and mechanical load,”Calcified Tissue International, vol. 84, no. 3, pp. 186–194,2009.
[50] Z. A. Cohen, V. C. Mow, J. H. Henry, W. N. Levine, andG. A. Ateshian, “Templates of the cartilage layers of thepatellofemoral joint and their use in the assessment ofosteoarthritic cartilage damage,” Osteoarthritis and Cartilage,vol. 11, no. 8, pp. 569–579, 2003.
[51] J.-P. Raynauld, J. Martel-Pelletier, F. Abram et al., “Analysisof the precision and sensitivity to change of differentapproaches to assess cartilage loss by quantitative MRI in alongitudinal multicentre clinical trial in patients with kneeosteoarthritis,” Arthritis Research and Therapy, vol. 10, no. 6,article no. R129, 2008.
[52] D. J. Hunter, J. Niu, Y. Zhang et al., “Change in cartilagemorphometry: a sample of the progression cohort of theOsteoarthritis Initiative,” Annals of the Rheumatic Diseases,vol. 68, no. 3, pp. 349–356, 2009.
[53] W. Wirth, M.-P. Hellio Le Graverand, B. T. Wyman etal., “Regional analysis of femorotibial cartilage loss in asubsample from the Osteoarthritis Initiative progressionsubcohort,” Osteoarthritis and Cartilage, vol. 17, no. 3, pp.291–297, 2009.
[54] R. J. Buck, B. T. Wyman, M.-P. H. L. Graverand, W.Wirth, and F. Eckstein, “An efficient subset of morphologicalmeasures for articular cartilage in the healthy and diseasedhuman knee,” Magnetic Resonance in Medicine, vol. 63, no. 3,pp. 680–690, 2010.
[55] M.-P. Hellio Le Graverand, R. J. Buck, B. T. Wymanet al., “Subregional femorotibial cartilage morphology inwomen—comparison between healthy controls and partici-pants with different grades of radiographic knee osteoarthri-tis,” Osteoarthritis and Cartilage, vol. 17, no. 9, pp. 1177–1185, 2009.
[56] M. Hudelmaier, C. Glaser, J. Hohe et al., “Age-related changesin the morphology and deformational behavior of knee jointcartilage,” Arthritis and Rheumatism, vol. 44, no. 11, pp.2556–2561, 2001.

16 Arthritis
[57] F. Eckstein, M. Reiser, K.-H. Englmeier, and R. Putz, “In vivomorphometry and functional analysis of human articularcartilage with quantitative magnetic resonance imaging—from image to data, from data to theory,” Anatomy andEmbryology, vol. 203, no. 3, pp. 147–173, 2001.
[58] H. Z. Tameem, L. E. Selva, and U. S. Sinha, “Morphologicalatlases of knee cartilage: Shape indices to analyze cartilagedegradation in osteoarthritic and non-osteoarthritic pop-ulation,” in Proceedings of the 29th Annual InternationalConference of IEEE Engineering in Medicine and BiologySociety (EMBC ’07), pp. 1310–1313, August 2007.
[59] K. A. Beattie, J. Duryea, M. Pui et al., “Minimum joint spacewidth and tibial cartilage morphology in the knees of healthyindividuals: a cross-sectional study,” BMC MusculoskeletalDisorders, vol. 9, article no. 119, 2008.
[60] S. Koo, G. E. Gold, and T. P. Andriacchi, “Considerations inmeasuring cartilage thickness using MRI: factors influencingreproducibility and accuracy,” Osteoarthritis and Cartilage,vol. 13, no. 9, pp. 782–789, 2005.
[61] J.-P. Pelletier, J.-P. Raynauld, M.-J. Berthiaume et al., “Riskfactors associated with the loss of cartilage volume onweight-bearing areas in knee osteoarthritis patients assessedby quantitative magnetic resonance imaging: a longitudinalstudy,” Arthritis Research and Therapy, vol. 9, no. 4, articleno. R74, 2007.
[62] F. Eckstein, M. Yang, A. Guermazi et al., “Referencevalues and Z-scores for subregional femorotibial cartilagethickness—results from a large population-based sample(Framingham) and comparison with the non-exposedOsteoarthritis Initiative reference cohort,” Osteoarthritis andCartilage, vol. 18, no. 10, pp. 1275–1283, 2010.
[63] F. Eckstein, M. Hudelmaier, and R. Putz, “The effects ofexercise on human articular cartilage,” Journal of Anatomy,vol. 208, no. 4, pp. 491–512, 2006.
[64] G. E. Gold, D. Burstein, B. Dardzinski, P. Lang, F. Boada,and T. Mosher, “MRI of articular cartilage in OA: novelpulse sequences and compositional/functional markers,”Osteoarthritis and Cartilage, vol. 14, no. 1, pp. 76–86, 2006.
[65] C. G. Peterfy, G. Gold, F. Eckstein, F. Cicuttini, B. Dardzinski,and R. Stevens, “MRI protocols for whole-organ assessmentof the knee in osteoarthritis,” Osteoarthritis and Cartilage,vol. 14, no. 1, pp. 95–111, 2006.
[66] P. A. Hardy, M. P. Recht, D. Piraino, and D. Thomasson,“Optimization of a Dual Echo in the Steady State (DESS)free-precession sequence for imaging cartilage,” Journal ofMagnetic Resonance Imaging, vol. 6, no. 2, pp. 329–335, 1996.
[67] F. Eckstein, M. Kunz, M. Hudelmaier et al., “Impact ofcoil design on the contrast-to-noise ratio, precision, andconsistency of quantitative cartilage morphometry at 3 Tesla:a pilot study for the osteoarthritis initiative,” MagneticResonance in Medicine, vol. 57, no. 2, pp. 448–454, 2007.
[68] F. Eckstein, M. Kunz, M. Schutzer et al., “Two year lon-gitudinal change and test-retest-precision of knee cartilagemorphology in a pilot study for the osteoarthritis initiative,”Osteoarthritis and Cartilage, vol. 15, no. 11, pp. 1326–1332,2007.
[69] G. H. Welsch, T. C. Mamisch, T. Hughes, S. Domayer,S. Marlovits, and S. Trattnig, “Advanced morphologicaland biochemical magnetic resonance imaging of cartilagerepair procedures in the knee joint at 3 tesla,” Seminars inMusculoskeletal Radiology, vol. 12, no. 3, pp. 196–211, 2008.
[70] C. G. Peterfy, E. Schneider, and M. Nevitt, “The osteoarthritisinitiative: report on the design rationale for the magnetic
resonance imaging protocol for the knee,” Osteoarthritis andCartilage, vol. 16, no. 12, pp. 1433–1441, 2008.
[71] S. Maschek, W. Wirth, B. Wyman et al., “Differences inquantitative MR imaging of cartilage morphology betweensagittal versus coronal acquisitions of the femorotibial joint,”Osteoarthritis and Cartilage, vol. 17, supplement 1, p. S 216,2009, abstract.
[72] D. Inglis, M. Pui, G. Ioannidis et al., “Accuracy and test-retest precision of quantitative cartilage morphology ona 1.0 T peripheral magnetic resonance imaging system,”Osteoarthritis and Cartilage, vol. 15, no. 1, pp. 110–115, 2007.
[73] F. Eckstein, H. C. Charles, R. J. Buck et al., “Accuracy andprecision of quantitative assessment of cartilage morphologyby magnetic resonance imaging at 3.0T,” Arthritis andRheumatism, vol. 52, no. 10, pp. 3132–3136, 2005.
[74] S. R. Morgan, J. C. Waterton, R. A. Maciewicz et al.,“Magnetic resonance imaging measurement of knee cartilagevolume in a multicentre study,” Rheumatology, vol. 43, no. 1,pp. 19–21, 2004.
[75] P. R. Kornaat, S. Koo, T. P. Andriacchi, J. L. Bloem, and G. E.Gold, “Comparison of quantitative cartilage measurementsacquired on two 3.0T MRI systems from different manufac-turers,” Journal of Magnetic Resonance Imaging, vol. 23, no. 5,pp. 770–773, 2006.
[76] M. Hudelmaier, W. Horger, C. Pfau et al., “Cross-calibrationof magnetic resonance sequences and scanners for quan-tifying articular cartilage morphology,” Osteoarthritis andCartilage, vol. 11, supplement A, p. S72, 2003, abstract.
[77] E. Schneider, M. NessAiver, D. White et al., “The osteoarthri-tis initiative (OAI) magnetic resonance imaging qualityassurance methods and results,” Osteoarthritis and Cartilage,vol. 16, no. 9, pp. 994–1004, 2008.
[78] F. Eckstein, R. J. Buck, B. T. Wyman et al., “Quantitativeimaging of cartilage morphology at 3.0 Tesla in the presenceof gadopentate dimeglumine (Gd-DTPA),” Magnetic Reso-nance in Medicine, vol. 58, no. 2, pp. 402–406, 2007.
[79] F. Eckstein, B. T. Wyman, R. J. Buck et al., “Longitudinalquantitative MR imaging of cartilage morphology in thepresence of gadopentetate dimeglumine (gd-dtpa),” MagneticResonance in Medicine, vol. 61, no. 4, pp. 975–980, 2009.
[80] S. J. Gandy, P. A. Dieppe, M. C. Keen, R. A. Maciewicz, I.Watt, and J. C. Waterton, “No loss of cartilage volume overthree years in patients with knee osteoarthritis as assessed bymagnetic resonance imaging,” Osteoarthritis and Cartilage,vol. 10, no. 12, pp. 929–937, 2002.
[81] A. E. Wluka, S. Stuckey, J. Snaddon, and F. M. Cicuttini,“The determinants of change in tibial cartilage volume inosteoarthritic knees,” Arthritis and Rheumatism, vol. 46, no.8, pp. 2065–2072, 2002.
[82] F. M. Cicuttini, A. E. Wluka, Y. Wang, and S. L. Stuckey,“Longitudinal study of changes in tibial and femoral cartilagein knee osteoarthritis,” Arthritis and Rheumatism, vol. 50, no.1, pp. 94–97, 2004.
[83] J.-P. Raynauld, J. Martel-Pelletier, M.-J. Berthiaume et al.,“Quantitative magnetic resonance imaging evaluation ofknee osteoarthritis progression over two years and cor-relation with clinical symptoms and radiologic changes,”Arthritis and Rheumatism, vol. 50, no. 2, pp. 476–487, 2004.
[84] M.-J. Berthiaume, J.-P. Raynauld, J. Martel-Pelletier et al.,“Meniscal tear and extrusion are strongly associated withprogression of symptomatic knee osteoarthritis as assessedby quantitative magnetic resonance imaging,” Annals of theRheumatic Diseases, vol. 64, no. 4, pp. 556–563, 2005.

Arthritis 17
[85] J.-P. Raynauld, J. Martel-Pelletier, M. -J. Berthiaume et al.,“Long term evaluation of disease progression through thequantitative magnetic resonance imaging of symptomaticknee osteoarthritis patients: correlation with clinical symp-toms and radiographic changes,” Arthritis Research andTherapy, vol. 8, no. 1, article R21, 2005.
[86] A. E. Wluka, A. Forbes, Y. Wang, F. Hanna, G. Jones, andF. M. Cicuttini, “Knee cartilage loss in symptomatic kneeosteoarthritis over 4.5 years,” Arthritis Research and Therapy,vol. 8, no. 4, article no. R90, 2006.
[87] O. Bruyere, H. Genant, M. Kothari et al., “Longitudinalstudy of magnetic resonance imaging and standard X-raysto assess disease progression in osteoarthritis,” Osteoarthritisand Cartilage, vol. 15, no. 1, pp. 98–103, 2007.
[88] D. J. Hunter, M. A. Bowes, C. B. Eaton et al., “Can cartilageloss be detected in knee osteoarthritis (OA) patients with 3–6 months’ observation using advanced image analysis of 3TMRI?” Osteoarthritis and Cartilage, vol. 18, no. 5, pp. 677–683, 2010.
[89] J.-P. Raynauld, C. Kauffmann, G. Beaudoin et al., “Reliabilityof a quantification imaging system using magnetic resonanceimages to measure cartilage thickness and volume in humannormal and osteoarthritic knees,” Osteoarthritis and Carti-lage, vol. 11, no. 5, pp. 351–360, 2003.
[90] F. Cicuttini, A. Wluka, Y. Wang, and S. Stuckey, “Thedeterminants of change in patella cartilage volume in oste-oarthritic knees,” Journal of Rheumatology, vol. 29, no. 12, pp.2615–2619, 2002.
[91] R. B. Frobell, M.-P. Le Graverand, R. Buck et al., “The acutelyACL injured knee assessed by MRI: changes in joint fluid,bone marrow lesions, and cartilage during the first year,”Osteoarthritis and Cartilage, vol. 17, no. 2, pp. 161–167, 2009.
[92] P. J. Watson, T. A. Carpenter, L. D. Hall, and J. A. Tyler,“Cartilage swelling and loss in a spontaneous model ofosteoarthritis visualized by magnetic resonance imaging,”Osteoarthritis and Cartilage, vol. 4, no. 3, pp. 197–207, 1996.
[93] E. Calvo, I. Palacios, E. Delgado et al., “High-resolution MRIdetects cartilage swelling at the early stages of experimentalosteoarthritis,” Osteoarthritis and Cartilage, vol. 9, no. 5, pp.463–472, 2001.
[94] E. Calvo, I. Palacios, E. Delgado et al., “Histopathological cor-relation of cartilage swelling detected by magnetic resonanceimaging in early experimental osteoarthritis,” Osteoarthritisand Cartilage, vol. 12, no. 11, pp. 878–886, 2004.
[95] E. Vignon, M. Arlot, and D. Hartmann, “Hypertrophic repairof articular cartilage in experimental osteoarthrosis,” Annalsof the Rheumatic Diseases, vol. 42, no. 1, pp. 82–88, 1983.
[96] M. E. Adams and K. D. Brandt, “Hypertrophic repair ofcanine articular cartilage in osteoarthritis after anteriorcruciate ligament transection,” Journal of Rheumatology, vol.18, no. 3, pp. 428–435, 1991.
[97] R. B. Frobell, M. C. Nevitt, M. Hudelmaier et al., “Femorotib-ial subchondral bone area and regional cartilage thickness—across-sectional description in healthy reference cases and var-ious radiographic stages of osteoarthritis in 1003 knees fromthe Osteoarthritis Initiative,” Arthritis Care Res (Hoboken),vol. 62, no. 11, pp. 1612–1623, 2010.
[98] R. J. Buck, B. T. Wyman, M.-P. Hellio Le Graverand, M.Hudelmaier, W. Wirth, and F. Eckstein, “Osteoarthritis maynot be a one-way-road of cartilage loss—comparison ofspatial patterns of cartilage change between osteoarthriticand healthy knees,” Osteoarthritis and Cartilage, vol. 18, no.3, pp. 329–335, 2010.
[99] F. Eckstein, W. Wirth, D. J. Hunter et al., “Magnitude andregional distribution of cartilage loss associated with gradesof joint space narrowing in radiographic osteoarthritis—datafrom the Osteoarthritis Initiative (OAI),” Osteoarthritis andCartilage, vol. 18, no. 6, pp. 760–768, 2010.
[100] F. Eckstein, S. Muller, S. C. Faber, K.-H. Englmeier, M.Reiser, and R. Putz, “Side differences of knee joint cartilagevolume, thickness, and surface area, and correlation withlower limb dominance—an MRI-based study,” Osteoarthritisand Cartilage, vol. 10, no. 12, pp. 914–921, 2002.
[101] R. D. Altman and G. E. Gold, “Atlas of individual radio-graphic features in osteoarthritis, revised,” Osteoarthritis andCartilage, vol. 15, no. 1, pp. 1–56, 2007.
[102] R. D. Altman, M. Hochberg, W. A. Murphy Jr., F. Wolfe, andM. Lequesne, “Atlas of individual radiographic features inosteoarthritis,” Osteoarthritis and Cartilage, vol. 3, pp. 3–70,1995.
[103] W. Wirth, O. Benichou, C. K. Kwoh et al., “Spatial patterns ofcartilage loss in the medial femoral condyle in osteoarthriticknees: data from the osteoarthritis initiative,” MagneticResonance in Medicine, vol. 63, no. 3, pp. 574–581, 2010.
[104] R. J. Buck, B. T. Wyman, M.-P.H. Le Graverand, M.Hudelmaier, W. Wirth, and F. Eckstein, “Does the use ofordered values of subregional change in cartilage thicknessimprove the detection of disease progression in longitudinalstudies of osteoarthritis?” Arthritis Care and Research, vol. 61,no. 7, pp. 917–924, 2009.
[105] W. Wirth, R. Buck, M. P. Hellio Le Graverand-Gastineau etal., “Ordered values of cartilge loss in knee subregions moreefficiently differentiate progression at different radiographicstages of OA: data from the OA Initiative,” Osteoarthritis andCartilage, vol. 17, supplement 1, p. S203, 2009, abstract.
[106] F. Cicuttini, J. Hankin, G. Jones, and A. Wluka, “Comparisonof conventional standing knee radiographs and magneticresonance imaging in assessing progression of tibiofemoraljoint osteoarthritis,” Osteoarthritis and Cartilage, vol. 13, no.8, pp. 722–727, 2005.
[107] J.-P. Raynauld, J. Martel-Pelletier, P. Bias et al., “Pro-tective effects of licofelone, a 5-lipoxygenase and cyclo-oxygenase inhibitor, versus naproxen on cartilage loss in kneeosteoarthritis: a first multicentre clinical trial using quantita-tive MRI,” Annals of the Rheumatic Diseases, vol. 68, no. 6, pp.938–947, 2009.
[108] C. Peterfy, J. Li, S. Zaim et al., “Comparison of fixed-flexionpositioning with fluoroscopic semi-flexed positioning forquantifying radiographic joint-space width in the knee: test-retest reproducibility,” Skeletal Radiology, vol. 32, no. 3, pp.128–132, 2003.
[109] S. Botha-Scheepers, M. Kloppenburg, H. M. Kroon et al.,“Fixed-flexion knee radiography: the sensitivity to detectknee joint space narrowing in osteoarthritis,” Osteoarthritisand Cartilage, vol. 15, no. 3, pp. 350–353, 2007.
[110] H. C. Charles, V. B. Kraus, M. Ainslie, and M.-P. HellioLe Graverand-Gastineau, “Optimization of the fixed-flexionknee radiograph,” Osteoarthritis and Cartilage, vol. 15, no. 11,pp. 1221–1224, 2007.
[111] M. C. Nevitt, C. Peterfy, A. Guermazi et al., “Longitudi-nal performance evaluation and validation of fixed-flexionradiography of the knee for detection of joint space loss,”Arthritis and Rheumatism, vol. 56, no. 5, pp. 1512–1520,2007.
[112] M.-P. Hellio Le Graverand, E. P. Vignon, K. D. Brandt et al.,“Head-to-head comparison of the Lyon Schuss and fixed
18 Arthritis
flexion radiographic techniques. Long-term reproducibilityin normal knees and sensitivity to change in osteoarthriticknees,” Annals of the Rheumatic Diseases, vol. 67, no. 11, pp.1562–1566, 2008.
[113] J. G. Adams, T. McAlindon, M. Dimasi, J. Carey, and S.Eustace, “Contribution of meniscal extrusion and cartilageloss to joint space narrowing in osteoarthritis,” ClinicalRadiology, vol. 54, no. 8, pp. 502–506, 1999.
[114] D. R. Gale, C. E. Chaisson, S. M. S. Totterman, R. K. Schwartz,M. E. Gale, and D. Felson, “Meniscal subluxation: associationwith osteoarthritis and joint space narrowing,” Osteoarthritisand Cartilage, vol. 7, no. 6, pp. 526–532, 1999.
[115] D. J. Hunter, Y. Q. Zhang, X. Tu et al., “Change in jointspace width: hyaline articular cartilage loss or alteration inmeniscus?” Arthritis and Rheumatism, vol. 54, no. 8, pp.2488–2495, 2006.
[116] J. Duryea, G. Neumann, J. Niu et al., “Comparison ofradiographic joint space width with magnetic resonanceimaging cartilage morphometry: analysis of longitudinaldata from the Osteoarthritis Initiative,” Arthritis Care andResearch, vol. 62, no. 7, pp. 932–937, 2010.
[117] J. Duryea, J. Li, C. G. Peterfy, C. Gordon, and H. K. Genant,“Trainable rule-based algorithm for the measurement ofjoint space width in digital radiographic images of the knee,”Medical Physics, vol. 27, no. 3, pp. 580–591, 2000.
[118] G. Neumann, D. Hunter, M. Nevitt et al., “Location specificradiographic joint space width for osteoarthritis progres-sion,” Osteoarthritis and Cartilage, vol. 17, no. 6, pp. 761–765,2009.
[119] J. N. Belo, M. Y. Berger, M. Reijman, B. W. Koes, and S.M. A. Bierma-Zeinstra, “Prognostic factors of progressionof osteoarthritis of the knee: a systematic review of observa-tional studies,” Arthritis Care and Research, vol. 57, no. 1, pp.13–26, 2007.
[120] F. Eckstein, W. Wirth, M. I. Hudelmaier et al., “Relationshipof compartment-specific structural knee status at baselinewith change in cartilage morphology: a prospective obser-vational study using data from the osteoarthritis initiative,”Arthritis Research and Therapy, vol. 11, no. 3, article no. R90,2009.
[121] M. L. Davies-Tuck, J. Martel-Pelletier, A. E. Wluka et al.,“Meniscal tear and increased tibial plateau bone area inhealthy post-menopausal women,” Osteoarthritis and Carti-lage, vol. 16, no. 2, pp. 268–271, 2008.
[122] A. Chang, K. Moisio, J. S. Chmiel et al., “Subregional effectsof meniscal tears on cartilage loss over 2 years in kneeosteoarthritis,” Annals of the Rheumatic Diseases, 2010.
[123] M. D. Crema, A. Guermazi, L. Li et al., “The association ofprevalent medial meniscal pathology with cartilage loss inthe medial tibiofemoral compartment over a 2-year period,”Osteoarthritis and Cartilage, vol. 18, no. 3, pp. 336–343, 2010.
[124] K. A. Jung, S. C. Lee, S. H. Hwang et al., “High frequency ofmeniscal hypertrophy in persons with advanced varus kneeosteoarthritis,” Rheumatology International, vol. 30, no. 10,pp. 1325–1333, 2010.
[125] W. Wirth, R. B. Frobell, R. B. Souza et al., “A three-dimensional quantitative method to measure meniscusshape, position, and signal intensity using MR images: apilot study and preliminary results in knee osteoarthritis,”Magnetic Resonance in Medicine, vol. 63, no. 5, pp. 1162–1171, 2010.
[126] J.-P. Raynauld, J. Martel-Pelletier, M.-J. Berthiaume et al.,“Correlation between bone lesion changes and cartilage
volume loss in patients with osteoarthritis of the knee asassessed by quantitative magnetic resonance imaging over a24-month period,” Annals of the Rheumatic Diseases, vol. 67,no. 5, pp. 683–688, 2008.
[127] F. Cicuttini, A. Wluka, J. Hankin, and Y. Wang, “Lon-gitudinal study of the relationship between knee angleand tibiofemoral cartilage volume in subjects with kneeosteoarthritis,” Rheumatology, vol. 43, no. 3, pp. 321–324,2004.
[128] R. Von Eisenhart-Rothe, H. Graichen, M. Hudelmaier, T.Vogl, L. Sharma, and F. Eckstein, “Femorotibial and patellarcartilage loss in patients prior to total knee arthroplasty,heterogeneity, and correlation with alignment of the knee,”Annals of the Rheumatic Diseases, vol. 65, no. 1, pp. 69–73,2006.
[129] A. J. Teichtahl, M. L. Davies-Tuck, A. E. Wluka, G. Jones,and F. M. Cicuttini, “Change in knee angle influences the rateof medial tibial cartilage volume loss in knee osteoarthritis,”Osteoarthritis and Cartilage, vol. 17, no. 1, pp. 8–11, 2009.
[130] A. J. Teichtahl, A. E. Wluka, and F. M. Cicuttini, “Frontalplane knee alignment is associated with a longitudinalreduction in patella cartilage volume in people with kneeosteoarthritis,” Osteoarthritis and Cartilage, vol. 16, no. 7, pp.851–854, 2008.
[131] G. Zhai, C. Ding, F. Cicuttini, and G. Jones, “A longitudinalstudy of the association between knee alignment and changein cartilage volume and chondral defects in a largely non-osteoarthritic population,” Journal of Rheumatology, vol. 34,no. 1, pp. 181–186, 2007.
[132] B. Vanwanseele, F. Eckstein, R. M. Smith et al., “Therelationship between knee adduction moment and cartilageand meniscus morphology in women with osteoarthritis,”Osteoarthritis and Cartilage, vol. 18, no. 7, pp. 894–901, 2010.
[133] F. M. Cicuttini, A. Wluka, M. Bailey et al., “Factors affectingknee cartilage volume in healthy men,” Rheumatology, vol.42, no. 2, pp. 258–262, 2003.
[134] A. J. Teichtahl, A. E. Wluka, Y. Wang et al., “Obesity and adi-posity are associated with the rate of patella cartilage volumeloss over 2 years in adults without knee osteoarthritis,” Annalsof the Rheumatic Diseases, vol. 68, no. 6, pp. 909–913, 2009.
[135] A. E. Wluka, F. Hanna, M. Davies-Tuck et al., “Bone marrowlesions predict increase in knee cartilage defects and loss ofcartilage volume in middle-aged women without knee painover 2 years,” Annals of the Rheumatic Diseases, vol. 68, no. 6,pp. 850–855, 2009.
[136] A. E. Wluka, Y. Wang, M. Davies-Tuck, D. R. English, G.G. Giles, and F. M. Cicuttini, “Bone marrow lesions predictprogression of cartilage defects and loss of cartilage volumein healthy middle-aged adults without knee pain over 2 yrs,”Rheumatology, vol. 47, no. 9, pp. 1392–1396, 2008.
[137] C. Ding, F. Cicuttini, F. Scott, C. Boon, and G. Jones,“Association of prevalent and incident knee cartilage defectswith loss of tibial and patellar cartilage: a longitudinal study,”Arthritis and Rheumatism, vol. 52, no. 12, pp. 3918–3927,2005.
[138] A. E. Wluka, C. Ding, G. Jones, and F. M. Cicuttini, “The clin-ical correlates of articular cartilage defects in symptomaticknee osteoarthritis: a prospective study,” Rheumatology, vol.44, no. 10, pp. 1311–1316, 2005.
[139] F. Cicuttini, C. Ding, A. Wluka, S. Davis, P. R. Ebeling, andG. Jones, “Association of cartilage defects with loss of kneecartilage in healthy, middle-age adults: a prospective study,”Arthritis and Rheumatism, vol. 52, no. 7, pp. 2033–2039,2005.
Arthritis 19
[140] C. Ding, J. Martel-Pelletier, J.-P. Pelletier et al., “Two-year prospective longitudinal study exploring the factorsassociated with change in femoral cartilage volume in acohort largely without knee radiographic osteoarthritis,”Osteoarthritis and Cartilage, vol. 16, no. 4, pp. 443–449, 2008.
[141] C. Ding, F. Cicuttini, and G. Jones, “Tibial subchondralbone size and knee cartilage defects: relevance to kneeosteoarthritis,” Osteoarthritis and Cartilage, vol. 15, no. 5, pp.479–486, 2007.
[142] R. B. Frobell, W. Wirth, M. Nevitt et al., “Presence, location,type and size of denuded areas of subchondral bone in theknee as a function of radiographic stage of OA—data fromthe OA initiative,” Osteoarthritis and Cartilage, vol. 18, no. 5,pp. 668–676, 2010.
[143] D. J. Hunter, L. Li, Y. Q. Zhang et al., “Region of interest anal-ysis: by selecting regions with denuded areas can we detectgreater amounts of change?” Osteoarthritis and Cartilage, vol.18, no. 2, pp. 175–183, 2010.
[144] E. B. Dam, I. Byrjalsen, M. A. Karsdal, P. Qvist, and C.Christiansen, “Increased urinary excretion of C-telopeptidesof type II collagen (CTX-II) predicts cartilage loss over 21months by MRI,” Osteoarthritis and Cartilage, vol. 17, no. 3,pp. 384–389, 2009.
[145] O. Bruyere, J. Collette, M. Kothari et al., “Osteoarthritis,magnetic resonance imaging, and biochemical markers: aone year prospective study,” Annals of the Rheumatic Diseases,vol. 65, no. 8, pp. 1050–1054, 2006.
[146] J. P. Pelletier, J. P. Raynauld, J. Caron et al., “Decrease inserum level of matrix metalloproteinases is predictive of thedisease-modifying effect of osteoarthritis drugs assessed byquantitative MRI in patients with knee osteoarthritis,” Annalsof the Rheumatic Diseases, vol. 69, no. 12, pp. 2095–2101,2010.
[147] F. Eckstein, M. P. Hellio-Le Graverand, C. Charles etal., “Which baseline factors predict cartilge thinning andthickening in OA knees—results from the A9001140 study,”Osteoarthritis and Cartilage, vol. 17, supplement 1, p. S215,2009, Abstract No 407.
[148] C. Ding, F. Cicuttini, L. Blizzard, and G. Jones, “Smokinginteracts with family history with regard to change in kneecartilage volume and cartilage defect development,” Arthritisand Rheumatism, vol. 56, no. 5, pp. 1521–1528, 2007.
[149] M. L. Davies-Tuck, A. E. Wluka, A. Forbes et al., “Smokingis associated with increased cartilage loss and persistenceof bone marrow lesions over 2 years in community-basedindividuals,” Rheumatology, vol. 48, no. 10, pp. 1227–1231,2009.
[150] F. M. Cicuttini, G. Jones, A. Forbes, and A. E. Wluka, “Rateof cartilage loss at two years predicts subsequent total kneearthroplasty: a prospective study,” Annals of the RheumaticDiseases, vol. 63, no. 9, pp. 1124–1127, 2004.
[151] S. K. Tanamas, A. E. Wluka, J. -P. Pelletier et al., “Theassociation between subchondral bone cysts and tibial car-tilage volume and risk of joint replacement in people withknee osteoarthritis: a longitudinal study,” Arthritis Research& Therapy, vol. 12, article R58, 2010.
[152] G. A. Hawker, L. Stewart, M. R. French et al., “Understandingthe pain experience in hip and knee osteoarthritis—anOARSI/OMERACT initiative,” Osteoarthritis and Cartilage,vol. 16, no. 4, pp. 415–422, 2008.

Submit your manuscripts athttp://www.hindawi.com
Stem CellsInternational
Hindawi Publishing Corporationhttp://www.hindawi.com Volume 2014
Hindawi Publishing Corporationhttp://www.hindawi.com Volume 2014
MEDIATORSINFLAMMATION
of
Hindawi Publishing Corporationhttp://www.hindawi.com Volume 2014
Behavioural Neurology
EndocrinologyInternational Journal of
Hindawi Publishing Corporationhttp://www.hindawi.com Volume 2014
Hindawi Publishing Corporationhttp://www.hindawi.com Volume 2014
Disease Markers
Hindawi Publishing Corporationhttp://www.hindawi.com Volume 2014
BioMed Research International
OncologyJournal of
Hindawi Publishing Corporationhttp://www.hindawi.com Volume 2014
Hindawi Publishing Corporationhttp://www.hindawi.com Volume 2014
Oxidative Medicine and Cellular Longevity
Hindawi Publishing Corporationhttp://www.hindawi.com Volume 2014
PPAR Research
The Scientific World JournalHindawi Publishing Corporation http://www.hindawi.com Volume 2014
Immunology ResearchHindawi Publishing Corporationhttp://www.hindawi.com Volume 2014
Journal of
ObesityJournal of
Hindawi Publishing Corporationhttp://www.hindawi.com Volume 2014
Hindawi Publishing Corporationhttp://www.hindawi.com Volume 2014
Computational and Mathematical Methods in Medicine
OphthalmologyJournal of
Hindawi Publishing Corporationhttp://www.hindawi.com Volume 2014
Diabetes ResearchJournal of
Hindawi Publishing Corporationhttp://www.hindawi.com Volume 2014
Hindawi Publishing Corporationhttp://www.hindawi.com Volume 2014
Research and TreatmentAIDS
Hindawi Publishing Corporationhttp://www.hindawi.com Volume 2014
Gastroenterology Research and Practice
Hindawi Publishing Corporationhttp://www.hindawi.com Volume 2014
Parkinson’s Disease
Evidence-Based Complementary and Alternative Medicine
Volume 2014Hindawi Publishing Corporationhttp://www.hindawi.com